Project Report Of Ratio Analysis
78
1 1 Summer Training Project Report (Working capital and Ratio Analysis Of HNG Ltd.) A PROJECT REPORT ON WORKING CAPITAL & RATIO ANALYSIS UNDERTAKEN AT HINDUSTAN NATIONAL GLASS & INDUSTRIES LTD. VIRBHADRA, RISHIKESH (UTTARAKHAND) SUBMITTED BY RAHUL KUNDLIYA REG.NO: 11001882 OF LOVELY PROFESSIONAL UNIVERSITY JALANDHAR NEW DELHI GT ROAD, PHAGWARA PUNJAB
-
Upload
shreyagomez -
Category
Documents
-
view
607 -
download
35
description
Ratio Analysis Project file of companies
Transcript of Project Report Of Ratio Analysis

1
1 Summer Training Project Report (Working capital and Ratio Analysis Of HNG Ltd.)
A PROJECT REPORT
ON
WORKING CAPITAL & RATIO ANALYSIS
UNDERTAKEN AT
HINDUSTAN NATIONAL GLASS & INDUSTRIES LTD.
VIRBHADRA, RISHIKESH (UTTARAKHAND)
SUBMITTED BY
RAHUL KUNDLIYA
REG.NO: 11001882
OF
LOVELY PROFESSIONAL UNIVERSITY JALANDHAR
NEW DELHI GT ROAD, PHAGWARA PUNJAB

2
2 Summer Training Project Report (Working capital and Ratio Analysis Of HNG Ltd.)
CONTENTS
CERTIFICATE ………………………………………………………………………….6
DECLARATION………………………………………………………………………..7
ACKNOWLEDGEMENT……………………………………………………………….8
COMPANY PROFILE………………………………………………………………….9
HISTORY OF THE COMPANY………………………………………………………..10
DIVERSIFIED PRODUCTIVE CAPABILITIES……………………………………..10
FUTURE PLANS………………………………………………………………………..10
FUTURE SUCCESS…………………………………………………………………….11
HNGIL GROUP PROFILE……………………………………………………………...11-13
VISION………………………………………………………………………………….14
COMPANY POLICY…………………………………………………………………...17-20
EXPORT & IMPORT
PURCHASE POLICY
SALES PLOICY
WELFARE ACTIVITIES
SAFTEEY MEASURES
SWOT ANALYSIS OF THE COMPANY……………………………………………...21-22
BOARD OF DIRECTORS………………………………………………………………23-24
IMPORTANT DEPARTMENTS & DESIGNATIONS…………………………………25-26
EXECUTIVE SUMMARY………………………………………………………………27
MANUFACTURING PROCESS OF GLASS…………………………………………...27-31
GLASS CONTAINER FACTORIE
BATCH HOUSE
HOT END
FURNACE
FORMING PROCESS
FORMING MACHINES
INTERNAL TREATMENT

3
3 Summer Training Project Report (Working capital and Ratio Analysis Of HNG Ltd.)
ANNEALING
COLD END
INSPECTIO EQUIPMENT
SECONDRY PROCESSING……………………………………………………………31-32
PACAKAGING
COATINGS
ANCILLARY PROCESSES- COMPRESSORS
INTRODUCTION (FINACIAL MANAGEMENT)…………………………………….33-39
PROBLEM STATEMENT……………………………………………………………….40
NEED OF THE STUDY………………………………………………………………….40
OBJECTIVE OF THE STUDY…………………………………………………………..40
RESEARCH DESIGN & DATA COLLECTION……………………………………….41
METHODOLOGY…………………………………………………………………….....42
LITERATURE REVIEW………………………………………………………………..43-44
RATIO ANALYSIS……………………………………………………………………..45-59
MEANING
STEPS IN RATIO ANALYSIS
BASIS OR STANDARDS OF COMPARISON
NATURE OF RATIO ANALYSIS
GUIDELINES OR PRECAUTIONS FOR USE OF RATIOS
IMPORTANCE OF RATIO ANALYSIS
LIMITATIONS OF RATIO ANALYSIS
CLASSIFICATIONS OF RATIOS
DATA ANALYSIS AND INTERPRETATION OF RATIOS……………………….....60-66
DATA ANALYSIS OF BALANCE SHEET…………………………………………….67-68
OBSERVATIONS AND FINDINGS……………………………………………………69
LIMITATIONS OF THE STUDY………………………………………………………...70
SUGGESTIONS…………………………………………………………………………...70

4
4 Summer Training Project Report (Working capital and Ratio Analysis Of HNG Ltd.)
CONCLUSION…………………………………………………………………………… 71
REFERENCES…………………………………………………………………………….72
ANNEXTURE……………………………………………………………………………..74-78
BALANCESHEET OF THE COMPANY
PROFIT AND LOSS A/C
5
5 Summer Training Project Report (Working capital and Ratio Analysis Of HNG Ltd.)

6
6 Summer Training Project Report (Working capital and Ratio Analysis Of HNG Ltd.)
CERTIFICATE
This is to certify that Mr. Rahul Kundliya of Lovely Institute of
Management, Phagwara has successfully completed the project work
titled “WORKING CAPITAL AND RATIO ANALYSIS OF HNG Ltd.” in
partial fulfillment of requirement for the award of POST
GRADUATION DEGREE IN BUSINESS MANAGEMENT prescribed by the Lovely
Professional University. This project is the record of authentic
work carried out during the academic year (2010 – 2012).

7
7 Summer Training Project Report (Working capital and Ratio Analysis Of HNG Ltd.)
DECLARATION
I Mr. Rahul Kundliya hereby declare that this project is the
Record of authentic work carried out by me during the academic
Year 2010– 2012 and has not been submitted to any other University or Institute towards the award of any degree.
Signature of the student
(Rahul Kundliya)

8
8 Summer Training Project Report (Working capital and Ratio Analysis Of HNG Ltd.)
ACKNOWLEDGEMENT
At the very outset, I would like to give my heartiest thanks, to
the Management & Staff of Hindustan National Glass & Industries
Ltd. Virbhadra, Rishikesh for giving me their Co-operation,
support and guidance in my project.
I am Greatly Indebted to Mr. M.S Chaudhary (Vice President), Mr.
Shammi Thasu (Head of Finance and Accounts), Mr. Shiv Singh
Kandari (Deputy Manager), Mr. S.K. Upadhya (Personnel Manager),
and Mr. B.D. Joshi (Officer Training & Placement Incharge) for
guiding me and helping me out to complete this Dissertation. I
would also like to thank to my esteemed Faculty Miss Jatinder Kaur
(Training Co-ordinator) and Miss. Nidhi Bhardwaj (Finance) Course
Co-ordinator respectively their constant support continued and
Invaluable guidance at each step of this summer internship
project. I would also like to thank my parents for what I am
today.

9
9 Summer Training Project Report (Working capital and Ratio Analysis Of HNG Ltd.)
COMPANY PROFILE -
The unit was originally incorporated by the name of M/S J/G glass limited in the
year 1972 with a Furnace capacity of 60 MT a an ancillary to IDPL
VIRBHADRA. Due to technical and other reasons the unit could not perform
well and landed into financial crunch and as such was taken over by the THAPAR
GROUP as subsidiary unit, however in the year 1994 the company was
incorporated as a joint venture with ACI INTERNATIONAL a USA based MNC.
It was named as OWENS BILTLTD. Later on in the year 1998, the share holding
of THAPAR GROUP was taken over by OI INC an AMETICAN MND and it has
OWENS BROCKWAY (I) LTD. on 7th
January 2002, Hindustan national Glass &
Industries along with its associate company Ceramic Decorators LTD. Has taken
over the management and ownership of the company and the name of the
company was changed to ACE GLASS CONTAINERS LIMITED. With the
approval of Humble High Court the unit stands merged with patent company M/S
HINDUSTAN NATIONAL GLASS & INDUSTRIES LIMITED, and is
known accordingly.
HINDUSTAN NATIONAL GLASS & INDUSTRIES LIMITED is a
manufacturer of all varieties of glass bottles/vials. Manufacturing facilities are
strategically located at Rishra near Calcutta since (1952) and Bahadurgarh near
Delhi since (1964), Rishikesh, Pondicherry and Nasik With state - of - art -
induction furnace for manufacturing of castings in its own foundary. HNGIL has
incorporated its technology from the best suppliers in Europe and USA. HNIL
Group operates 10 furnaces and 42 production lines with fully automatic IS
(Individual Section) machines up to 12 Sections operating on Double and Triple
Gob.
All the plants have thorough electronic inspection system right from the batch
mixing till the final packing. Quality control and R&D Sections are well equipped
with sophisticated instruments enabling production of international quality
10
10 Summer Training Project Report (Working capital and Ratio Analysis Of HNG Ltd.)
glassware. Well equipped workshops to manufacture moulds for bottles of all
designs & shapes, backed up by own Power Generating Plants.
The farsighted and dynamic approach of Mr. CK SOMANY, the highly focused
management strategies and the leadership qualities of his sons Mr. SANJAY
SOMANY and Mr. MUKUL SOMANY have turned every challenge into a
winning formula.
HISTORY
It was in 1952 that visionary entrepreneur Chandra Kumar Somany laid the
foundations for the HNG Group, with the inauguration of Eastern India’s fully
Automatic glass container manufacturing plant at Rishra, near Kolkata. Today, a
family dynasty has been created that leads the way in the local market, catering to
the needs of a diverse range of industries, of liquor and pharmaceuticals to soft
drinks and cosmetics. The farsighted and dynamic approach of MR. So many,
coupled with highly focused management strategies and leadership qualities of his
sons Sanjay and Mukul have turned HNG into a recognized international player.
Hindustan National Glass & Industries Limited (HNGIL) in a rare breed in the
international glass container community of the 21st century, an extremely
successful family-owned and run business, market leader and owner of four
significant manufacturing plants. With the total melting capacity of 23000
tones\day, the company is constantly in search of improvements. In total, 38
highly productive lines are operated, from which pack efficiencies of better than
90% are now standard. Introduction of the latest automation practices has also led
to reduce labour costs, workforce having dropped by two-thirds in the
Performance Appraisal System 15 year to approximately 4000.
11
11 Summer Training Project Report (Working capital and Ratio Analysis Of HNG Ltd.)
Diversified Productive Capabilities
Alongside the original Rishra factory near kolkata since 1964 HNG has operated a
plant at Bahadurgarh, close to New Delhi .Flint, amber and green colors are
produced on 13 lines at Rishra, while the larger Bahadurgarh Facility melts flints
amber and cosmetic-grade compositions, operating a total of 15 lines.
Associate company Ace Glass Containers Ltd has manufacturing capacity at
Rishikesh (flint and green, six lines) and Pondicherry (flint, four lines). Formerly
a 100% subsidiary of USA- based Owens- Illinois Inc; Ace was acquired in 2002,
when 0-1 took the unexpected decision to exit the Indian market. Prior to the
HNG takeover, production at a third factory in Pune had ceased.
With the recent acquisition of the glass container unit of Larsen & turbo, situated
at Nasik in Western India, HNG has now established its presence in all the four
zones of India. The Nasik plant has a melting capacity of 300 tons per day,
operating a total of four lines (flint).
FUTURE PLANS
HNG’s endeavor to cater for the entire Indian market has been successful but the
quest for further expansion has not ended as plans for a new facility between
Mumbai and Baroda are expected to be progressed within the for next two years.
When operational, this plant will be larger than any of HNG’s existing facilities,
although precise details are still under wraps.
The origin of this collaborative approach stem from CK Somany’s plans to
develop the business in the 1950’s, Alongside HNG’s expansion of glass
manufacturing expertise is a commitment to maximize the capabilities and
efficiencies if its support service .Apart from owning and quarries, the company
operates a state –of-the-art induction furnace to make castings in its own foundry
located at Bahadurgarh this operation complements a well - equipped mould
production shop and the latest CAD/CAM facility to design articles in a variety of
shapes .
12
12 Summer Training Project Report (Working capital and Ratio Analysis Of HNG Ltd.)
Also situated at Bahadurgarh is subsidiary company glass Equipment (India) led.
GEIL was created in 1974 and specializes in the manufacture of glass forming
equipment. Currently operating at full capacity to keep pace with HNG’s own
requirements as well as satisfying orders from other glassmakers, GEIL produces
complete IS machines as well as conversions, electronic timing systems, feeders;
conveyors ware transfers, stackers, motor- driven presses and spare parts
FUTURE SUCCESS
IN recent years, the HNG group has emerged as India’s leading glass container
manufacturer, expanding and modernizing its production expertise to keep pace
with growth in the local market. Demand is expected to grow by a further 8% in
the next 12 months and while smaller players become increasingly regionalized
and unable to compete on an effective level, there can be little doubt that HNG-led
by Somany family- can look forward to continuing success in the future.
HNGIL GROUP PROFILE
HNGIL, the largest and most prolific producer of glass containers, operating at
present 10 furnaces at giver location (Rishra, Bhahadurgarh, Pondicherry, Nasik,
& Rishikesh) and production lines, In addition HNG has acquired a glass
container manufacturing unit of M/S Haryana sheet Glass Limited at Neemrana,
Rajastan. A fully integrated group having its own foundary for casting, well
equipped workshop for moulds and spare parts captive power plants and quarries
for sand with fleet for finished goods movement has given competitive advantage
to its customers.
A MARKET LEADER
In the 5ml – 3200 ml segment, HNG Group is the undisputed market leader
catering to 70% of the Domestic Market in the pharmaceutical, beverage,
processed food, cosmetic and liquor sectors covering industry majors like coca-
13
13 Summer Training Project Report (Working capital and Ratio Analysis Of HNG Ltd.)
cola Dabur, Glaxo Smith Kline Beecham, Nestle, Pepsi, Reckitt Benckiser (India)
Ltd., Smith Kline Beecham UB Group etc. Exports to south east, Middle East,
Africa and First world countries on Europe & North America
ON SUPER FAST GROWTH TRACK
Its spirit to ascend newer parameters remains as insatiable as ever. The days ahead
are gleaming with promise. With modernizations, up gradation and foresight to
meet the emerging and more distinctive demands of the customers, the group is all
set for unprecedented achievements. With projected planned investment of
Rs 3000 million in the next three years, touching life in more ways than one tune
the harmony of nature
MILESTONES
It order to keep with changing technology and demands, the group has acquired
the glass division of L & T at Nasik in October 2005, having one furnace of 320
TPD melting capacity. HNGIL has also entered into a scheme of amalgamation
with ACE GLASS CONTAINERS (ACE) which scheme has been sanctioned by
the Honorable High Courts of Kolkata and Delhi. Post amalgamation HNGIL’ un-
audited turnover as on 31.03.2008 stands at a figure more than Rs. 1100 crore.
RISHIKESH PLANT
2 furnaces; combined melting capacity of 340 MT per day.
Furnace ii used for manufacturing of green glass.
6 lines of glass making IS machines.
Off – site printing facility with 3 decorating lines

14
14 Summer Training Project Report (Working capital and Ratio Analysis Of HNG Ltd.)
VISION
“To strive to be a major International producer of
quality Containers glass by consistently following
And adopting the most modern Methods and
techniques in an environment Friendly manner
with active involvement of its Employees to meet
the needs of its Customers and stakeholders so
as to achieve Sustainable development and long
term growth.”
15
15 Summer Training Project Report (Working capital and Ratio Analysis Of HNG Ltd.)
RAW MATERIAL USED FOR FORMATION OF GLASS & ITS
SOURCES
Raw Materials required in the organization are ore obtained from various mines
and other places or areas:
Silica sand (mineral) - Former material (main agent) >SiO2 from
Allahabad, Ghaziabad, Faridabad and Jaipur;
Soda ash (chemical) – Flux Material to lower down melting >Al2 O2,
Fe2, O3 from Jaipur and other places also;
Limestone + dolomite (mineral): Both are used as stabilizers (stability)>
CaO + MgO from jaipur & Dehradun;
Feldspar- used for durability>Na, K2O from Jaipur;
Fine chemicals- De Colorizes> Selenium from special markets; and
Broken glass from local market.

16
16 Summer Training Project Report (Working capital and Ratio Analysis Of HNG Ltd.)
MAIN CUSTOMERS OR CLIENTS OF THE COMPANY
The clientele includes leading companies like:
Pepsi Company
Coca-Cola company
Cadbury Company
Nestle India Ltd.
Raun Pollack
Dabur India Ltd.
Lakme Lever
Glaxo Welcome
Pfizer
Reckitt & Coleman
Shaw-Wallace
Mith Kline Beecham
UB Group
Hamdard Wakf Laboratories
Mount Shivalik Ltd.
Albert David Ltd
Mc- Dowell Group
Kedia Group
Bayer Group and
Other leading companies.
17
17 Summer Training Project Report (Working capital and Ratio Analysis Of HNG Ltd.)
EXPORT IMPORT POLICY
HNG Industries Limited exports their glass product to South East, Middle East,
Africa and First World Countries in Europe & North America.
It follows the EXIM Policy which has some Principal objects.
To accelerate the country’s transition to a globally vibrant economy with a
view to derives maximum benefit from expanding global market
opportunities.
To stimulated sustained economic growth by providing access to essential
raw materials, components, consumable and capital goods required for
augmented production.
To enhance the technological strength and efficiency of Indian industry
and services, thereby improving their competitive strength while
generating new employment opportunities and encourage the attainment of
internationally accepted standard of quality.
To provide consumer with good quality product at reasonable price.
18
18 Summer Training Project Report (Working capital and Ratio Analysis Of HNG Ltd.)
PURCHASE POLICY -
The purchase policy of the HNG Industries Limited includes the following:
Company maintains the goodwill of approval vendors.
Purchase preference is given to those who have adopted internationally
known quality management system.
There are continuous checks on inventory levels so as to avoid the situation
of over stocks.
Purchases are done keeping the quality aspect in view.
The company aims at producing the higher quality of glass to satisfy his
customers. This is achieved by:
Adoption and implement of quality utilization of requirement of ISO:
Continuous up gradation of technology for optimum utilization of resources and
manufacturing products in cost effective manner, Imbibing the culture of
continuous quality improvement through motivation and plant training of all
employees.
Specimen of various standardizes forms being used in this company for carrying
out the various functions of purchase department as describe is enclosed at the
end.
19
19 Summer Training Project Report (Working capital and Ratio Analysis Of HNG Ltd.)
SALES POLICY -
The sales policy of HNG Industries Limited includes the following:
Company maintains the goodwill of all the customers.
Sales preference is given to those who have adopted internationally known
quality management system.
There is continuous check on inventory levels so as to avoid the situation
of overstocks.
Sales are done keeping the quality aspects in view.
WELFARE ACTIVITIES
HNG Industries limited provides various welfare facilities for the employees
which are enumerated as follows:
Provide uniform and shoes to the employees according to their department
as per the term of general agreement.
Provide canteen and mess facility.
Provide medical coverage to the employees.
20
20 Summer Training Project Report (Working capital and Ratio Analysis Of HNG Ltd.)
Club facility.
Providing ambulance and first aid facility.
Time to time various awards and rewards given to employees.
SAFETY MEASURES
HNG Industries Limited lays utmost care towards health and safety of all
personnel. Central safety committee at the apex level and the department safety
committee at the shop floor are formed to review and monitor the safety activity.
Training on safety, fire fighting is given to all level of employees at the regular
intervals. The company is generally providing Personal Productive Equipments
like helmets, ear plugs, safety shoes, googles etc. to their employees.
21
21 Summer Training Project Report (Working capital and Ratio Analysis Of HNG Ltd.)
SWOT ANALYSIS OF THE COMPANY
Every organization has some strength and weakness, opportunities and threats:
HNG Industries Limited have some strength, weakness, opportunities and threats.
These are as follows:
STRENGTHS –
The company is strong and well established company.
The company is customer oriented company.
It exists from 30 years.
Company produces good quality of glass bottles.
It has dynamic and forward looking management.
Up gradation & modernization of existing machine resulted in higher speed
& efficiencies.
Company has attained ISO- 9001 certificate for quality.
Goodwill in the eyes of the public.
WEAKNESS –
At present the factory business strategies are not driven by Core
competency.
Absence of long term planning.
Absence of raw material near the factory place
Locus of control is absent.
Less space and less number of godowns.
Financial weakness (Lack of working capital).
Overstaffing
Lack of good marketing strategies.

22
22 Summer Training Project Report (Working capital and Ratio Analysis Of HNG Ltd.)
OPPORTUNITIES –
Suitable glass factory norms of government.
Increase in demand in existing line of business.
Only one of its kinds in the new state called Uttaranchal.
THREATS –
Emergence of new competitive pressure example L & T.
Due to the introduction of plastic and disposable cold drinks and beer
bottles, glass product demand somewhat decreases.
Companies based on single product (Bottles) only.
Import of finished product to India due to less government regulations.
23
23 Summer Training Project Report (Working capital and Ratio Analysis Of HNG Ltd.)
BOARD OF DIRECTORS
1. Chairman : Mr. C.K Somany
Mr. C.K Somany is acknowledged expert in a glass technology and is
providing policy guidelines for the Management and administration for the
company. He holds an F.B.I.MC (London) Degree and a degree in glass
Plant Instrumentation from Honeywell brown, Minneapolis, U.S.A.
2. Managing Director: Mr. Sanjay Somany
Mr. Sanjay Somany is a commerce graduate and he has obtained a Diploma
in Diesel Engineering and vast knowledge of the glass manufacturing
Technology. At the Present he is the Managing director of the company.
3. Joint Managing Director : Mr. Mukul Somany
Mr. Mukul Somany is commerce Graduate. He is a noted Industrialist in the
glass manufacturing Industry.

24
24 Summer Training Project Report (Working capital and Ratio Analysis Of HNG Ltd.)
OTHER MEMBERS
Senior President Mr. J.P Kasera
Senior President Mr. R.R Soni
President Mr. R.L Khandelia
President Mr. C.K Jain
Vice President Mr. S. Chaudhary
Vice President (Marketing) Mr. S. Bhende
Vice President (Marketing) Mr. V. Sharan
Vice President (Glass & Ceramics) Mr. A.C Jain
Vice President (Material) Mr. N.K Kabra
Vice President (Exports) Mr. Devdutta Hoare

25
25 Summer Training Project Report (Working capital and Ratio Analysis Of HNG Ltd.)
IMPORTANT DEPARTMENT & DESIGNATIONS
1. Stores :
Commercial Senior Manager Mr. Rajeev Gaur
Executive Stores Mr. Ramesh Sharma
Office Store Mr. Umesh Gupta
2. Production :
DGM Production Mr. D.K Nawani
Managing Production Mr. Ratan Singh
Machine Manager Production Mr. Vikas Jain
Assistant Manager Mr. R.P Dimri
Executive Mr. B.N Purohit
Officer Mr. H.S. Rawat &
Mr. Balswaroop

26
26 Summer Training Project Report (Working capital and Ratio Analysis Of HNG Ltd.)
3. Finance / Accounts :
General Manger Mr. Shammi Thusi
Deputy Manager Mr. Shiv Singh Kandari
Assistant Manger Mr. A.K Saxena
Officers Mr. Rakesh Joshi &
Mr. Alam Singh Negi
Clerical Assistant Mr. Ramesh Bisht
Mr. Vinay Saklani
Mr. Manoj Semwal
Mr. Anil Negi
4. Personal Department :
Personal Manger Mr. S.K Upadhya
Officer (Training & Placement Incharge) Mr. I.S. Bisht
Mr. B.D Joshi
Safety Officer
(Sanitation & Gardening Incharge) Mr. Rajeev Sharma
27
27 Summer Training Project Report (Working capital and Ratio Analysis Of HNG Ltd.)
Executive Summary
Cash is the lifeline of a company. Understanding a company’s cash flow health is
essential to making Investment decision. A Good way to judge a company cash
flow prospects is to look at its working capital management. Working capital is
also known as operating capital, it represents the day by day operating liquidity
available to business.
The goal of Working capital management is to ensure that a firm is able to
continue its operations and that it has sufficient ability to satisfy both maturing
short-term debt and upcoming expenses.
Manufacturing Process of glass
Glass is common in everyday life, from glass windows to glass containers. The
Manufacturing of glass for every day process may be complex process. The
process of mass production of glass is given below.
Glass Container Factories
Modern glass container factory are broadly divided into three parts – Batch house,
the hot end and the cold end. The batch houses are concerned with the raw
material. In hot end are the furnaces, machines that produce containers (forming)
and annealing ovens. In cold end there are inspection and packaging equipments.
28
28 Summer Training Project Report (Working capital and Ratio Analysis Of HNG Ltd.)
Batch House
The Batch house holds the raw material for glass, primarily sand, soda ash,
feldspar (as we as other), these materials are received (Typically by trucks or rail
Transport) and evaluated into storage silos. From the silos they are weighted out
into a batch of several tones using common glass batch calculation procedures.
The batch is mixed and sent to silos over the furnaces.
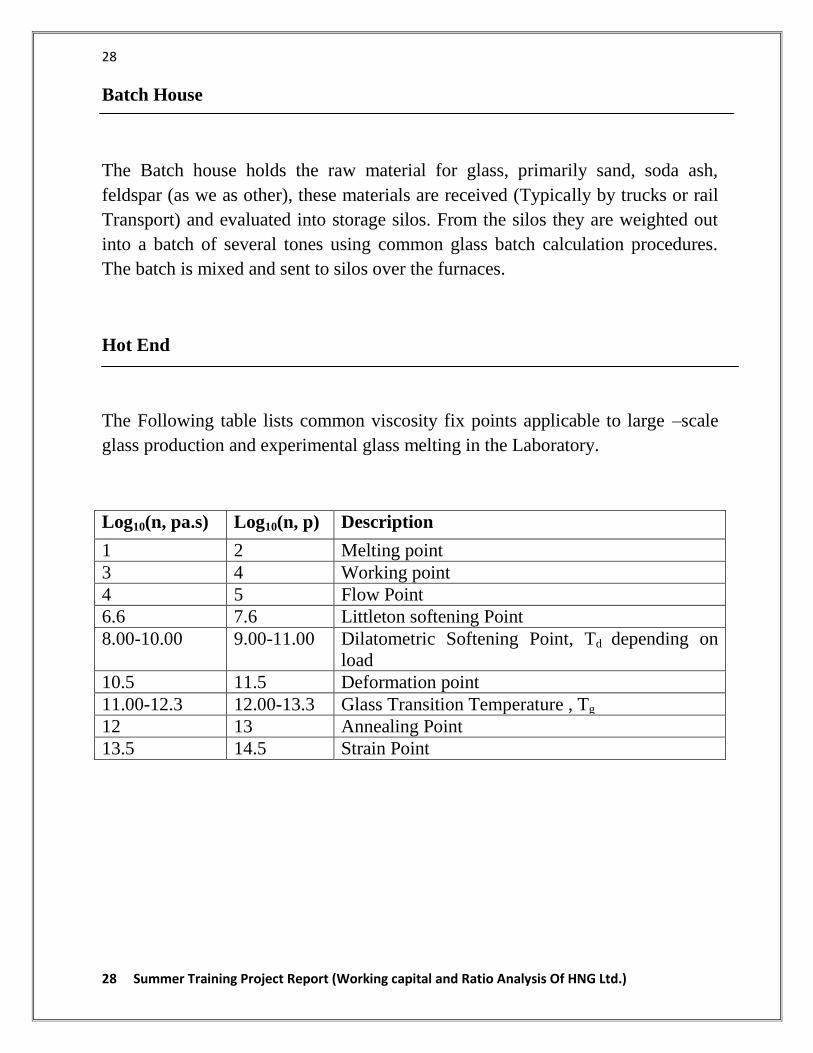
Hot End
The Following table lists common viscosity fix points applicable to large –scale
glass production and experimental glass melting in the Laboratory.
Log10(n, pa.s) Log10(n, p) Description
1 2 Melting point
3 4 Working point
4 5 Flow Point
6.6 7.6 Littleton softening Point
8.00-10.00 9.00-11.00 Dilatometric Softening Point, Td depending on
load
10.5 11.5 Deformation point
11.00-12.3 12.00-13.3 Glass Transition Temperature , Tg
12 13 Annealing Point
13.5 14.5 Strain Point
29
29 Summer Training Project Report (Working capital and Ratio Analysis Of HNG Ltd.)
Furnace
The hot end of a glassworks is where the molten glass is formed into containers,
begning when the batch is fed at a slow controlled rate into the furnace. The
furnaces are natural gas or fuel oil fired and operates at a temperature up to 1650c.
The temperature is limited by the quality of the furnace superstructure material
and by the glass composition. Glass Furnaces typically operates and energy
recovery scheme known as regeneration. The hot exhaust gas flow back over one
of two piles of loosely packed bricks, called regenerators. These bricks schemes
known as regeneration. These bricks become hot and every 20-30 minutes the
flow of the combustion system is changed over so that the combustion air, which
is mixed with the gas, is drawn through the heated bricks and combustion exhaust
flows through the other pile of bricks.
The batch melts inside the furnace which is maintained as a pool of molten glass,
perhaps 1200mm deep by 50 to 150m2. The molten glass flow from a sub ducted
channel known as the furnace throat into the refiner and fore hearth channels,
these channels cool the glass very precisely so that the glass forming machine is of
a uniform and exact temperature.
Forming Process
There are currently two primary methods of making a glass container the blow
and the blow method and the press and blow method. In all cases a stream of
molten glass at its plastic temperature (10500c-1200
0c) is cut by a shearing blade
to form a cylinder of glass called a gob. Both of the processes start with this job
falling by gravity and guided by through and chute into the bank moulds. In the
blow and blow process, the glass first is bow from blow into the blank moulds to
create a parison and pre container. The parison is the flipped over into a final
mould, where a final blow the glass out into the mould to make the final container
shape. In the case of press and blow, the parison is formed by a metal plunger
which pushes the glass out into the blank mould. The process then continues as
before, with the parison being transferred to the mould and the glass being blow
out into the mould.

30
30 Summer Training Project Report (Working capital and Ratio Analysis Of HNG Ltd.)
Forming Machines
The forming machines hold and move the container. Generally powered by
compressed air, the mechanisms are timed to coordinate the movement of all these
parts so that containers are made.
The most widely used forming machines arrangement in the individual section
machines invented in 1903 by Michael J Owens in Illinois. This machine has a
bank of 5-16 identical sections each of which contains one complete set of
Mechanisms to make containers. The sections are in a row and the gobs feed into
each section via a moving chute, called the gob distributor. Section makes either
one, two, three or four containers simultaneously. In the cases of multiple gobs,
the shears cut the gobs simultaneously, and they fall into the blank moulds in
parallel.
Internal Treatment
After the forming process, some containers- Particularly those intended for
alcoholic spirits – undergo a treatment to improve the chemical resistance of the
Inside, called internal treatment or dealkalization. This is usually accomplished
through the injection of suffer or fluorine containing gas mixture into bottles at
high temperatures. The gas is typically delivered to the container either in the air
used in the forming process or through a nozzle directing a stream of the gas into
the mouth of the bottle after forming. The treatment renders the container more
resistant to alkali extraction which can cause increased in product PH and in some
cases container degradation.

31
31 Summer Training Project Report (Working capital and Ratio Analysis Of HNG Ltd.)
Annealing
As a glass cools it shrinks and solidified. Uneven cooling causes weak glass due
to stress. Even cooling is achieved by annealing. An annealing oven (Known in
the industry as a Lehr) Heats the container to about 5800C then cools it, depending
on the glass thickness, over a 20-60 minute period.
Cold End
The role of the cold end is to inspect the container for defects, package the
container for shipment and label the containers.
Inspection Equipment
Glass container are 100% inspected, every container is inspected. Automatic
machines inspect for a variety of faults. Typical faults include small cracks in the
glass called checks, foreign inclusions called stones, bubbles in the glass called
blisters and excessively thin walls. In addition to rejecting faulty containers,
inspection equipment gathers statistical information and relays it to the forming
machine operators in the hot end. Computer systems collect faults information to
the mould that produced the container. This is done by reading the mould number
on the container by the mould that made it. Operators carry out a range of checks
manually on samples of containers, usually visuals and dimensional checks.
Secondary Processing
Sometimes containers factories will offer service such as labeling, labeling,
technologies are available. Unique to glass is the Applied Ceramic Labeling
process (ACL). This is screen – Printing of the decoration into the container with
vitreous enamel paint, which is then backed on. Bottles have various added
services such as Etching (Absolute Raspberry/Ruby Red) and applied Ceramic
Labeling (Absolute Blue/Pears/Red/Black).
32
32 Summer Training Project Report (Working capital and Ratio Analysis Of HNG Ltd.)
Packaging
Glass containers are packaged in various ways; popular in Europe are bulk pallets
with between 1000 and 4000 containers each. This is out by automatic machines
(palletizes) which arrange and stack containers separated by layer sheets. Others
possibilities include boxes and even hand sewn sacks. Once packed the new
―stock units‖ are labeled and warehoused.
Coatings
Glass containers typically receive two surface coatings, one at the hot end, just
before annealing and at the cold end just after annealing. At the hot end a very
thin layer of tin oxide is applied either using a safe organic compound or inorganic
stannic chloride. Tin based system are not the only once used, although the most
popular. Titanium tetrachloride or organo-titanates can also be used. In all the
cases the coating renders the surface of the glass more adhesive to the cold end
coating. At the cold end the layer of typically, polythene wax is applied via a
water based emulsion. This makes the glass more adhesive to the cold end
coating. This makes the glass slippery, protecting it from scratching and stopping
and stopping containers from sticking together when they are moved on a
conveyor. The resultant invisible combined coatings give a virtually uncatchable
surface to the glass. Due to reduction of in- service surface damage the coating
often is described as strengtheners, however a more correct definition might be
strength retaining coatings.
Ancillary Processes – Compressors
Forming Machines are largely powered by compressed air and typical glass work
will have several large compressors (totaling 30k-60Kcfm) to provide the needed
compressed air. Furnaces, Compressors and forming machines generate quantities
of waste heat which generally is cooled water. Hot glass which is not used in the
forming machine is diverted glass (called cullet) is generally cooled by water,
some time even processed and crushed in a water bath arrangements. Often
cooling requirements are shared.
33
33 Summer Training Project Report (Working capital and Ratio Analysis Of HNG Ltd.)
Introduction (Financial Management)
Financial Management is the specific area of finance dealing with the financial
decision corporations make, and the tools and analysis used to make the decisions.
The discipline as a whole may be divided between long-term and short-term
decisions and techniques. Both share the same goal of enhancing firm value by
ensuring that return on capital exceeds cost of capital, without taking excessive
financial risks.
Capital investment decisions comprise the long-term choices about which
projects receive investment, whether to finance that investment with equity or
debt, and when or whether to pay dividends to shareholders.
Short-term corporate finance decisions are called working capital management
and deal with balance of current assets and current liabilities by managing cash,
inventories, and short-term borrowings and lending (e.g., the credit terms
extended to customers). Corporate finance is closely related to managerial finance,
which is slightly broader in scope, describing the financial techniques available to
all forms of business enterprise, corporate or not.
Role of Financial Managers:
The role of a financial manager can be discussed under the following heads:
1. Nature of work
2. Working conditions
3. Employment
4. Training, Other qualifications and Advancement
5. Job outlook
6. Earnings
7. Related occupations
Let us discuss each of these in a detailed manner.

34
34 Summer Training Project Report (Working capital and Ratio Analysis Of HNG Ltd.)
1. Nature of work
Almost every firm, government agency and organization has one or more financial
managers who oversee the preparation of financial reports, direct investment
activities, and implement cash management strategies. As computers are
increasingly used to record and organize data, many financial managers are
spending more time developing strategies and implementing the long-term goals
of their organization.
The duties of financial managers vary with their specific titles, which include
controller, treasurer or finance officer, credit manager, cash manager, and risk and
insurance manager. Controllers direct the preparation of financial reports that
summarize and forecast the organization’s financial position, such as income
statements, balance sheets, and analyses of future earnings or expenses.
Regulatory authorities also in charge of preparing special reports require
controllers. Often, controllers oversee the accounting, audit, and budget
departments. Treasurers and finance officers direct the organization’s financial
goals, objectives, and budgets. They oversee the investment of funds and manage
associated risks, supervise cash management activities, execute capital-raising
strategies to support a firm’s expansion, and deal with mergers and acquisitions.
Credit managers oversee the firm’s issuance of credit. They establish credit-rating
criteria, determine credit ceilings, and monitor the collections of past-due
accounts. Managers specializing in international finance develop financial and
accounting systems for the banking transactions of multinational organizations.
Cash managers monitor and control the flow of cash receipts and disbursements
to meet the business and investment needs of the firm. For example, cash flow
projections are needed to determine whether loans must be obtained to meet cash
requirements or whether surplus cash should be invested in interest-bearing
instruments. Risk and insurance managers oversee programs to minimize risks
and losses that might arise from financial transactions and business operations
undertaken by the institution. They also manage the organization’s insurance
budget. Financial institutions, such as commercial banks, savings and loan
associations, credit unions, and mortgage and finance companies, employ
additional financial managers who oversee various functions, such as lending,
trusts, mortgages, and investments, or programs, including sales, operations, or
electronic financial services. These managers may be required to solicit business,
authorize loans, and direct the investment of funds, always adhering to State laws
and regulations.

35
35 Summer Training Project Report (Working capital and Ratio Analysis Of HNG Ltd.)
Branch managers of financial institutions administer and manage all of the
functions of a branch office, which may include hiring personnel, approving loans
and lines of credit, establishing a rapport with the community to attract business,
and assisting customers with account problems. Financial managers who work for
financial institutions must keep abreast of the rapidly growing array of financial
services and products.
In addition to the general duties described above, all financial managers perform
tasks unique to their organization or industry. For example, government financial
managers must be experts on the government appropriations and budgeting
processes, whereas healthcare financial managers must be knowledgeable about
issues surrounding healthcare financing. Moreover, financial managers must be
aware of special tax laws and regulations that affect their industry. Financial
managers play an increasingly important role in mergers and consolidations and in
global expansion and related financing. These areas require extensive, specialized
knowledge on the part of the financial manager to reduce risks and maximize
profit. Financial managers increasingly are hired on a temporary basis to advise
senior managers on these and other matters. In fact, some small firms contract out
all accounting and financial functions to companies that provide these services.
The role of the financial manager, particularly in business, is changing in response
to technological advances that have significantly reduced the amount of time it
takes to produce financial reports. Financial managers now perform more data
analysis and use it to offer senior managers ideas on how to maximize profits.
They often work on teams, acting as business advisors to top management.
Financial managers need to keep abreast of the latest computer technology in
order to increase the efficiency of their firm’s financial operations.
2. Working conditions
Financial managers work in comfortable offices, often close to top managers and
to departments that develop the financial data these managers need. They typically
have direct access to state-of-the-art computer systems and information services.
Financial managers commonly work long hours, often up to 50 or 60 per week.
They generally are required to attend meetings of financial and economic
associations and may travel to visit subsidiary firms or to meet customers.
36
36 Summer Training Project Report (Working capital and Ratio Analysis Of HNG Ltd.)
3. Employment
While the vast majority is employed in private industry, nearly 1 in 10 works for
the different branches of government. In addition, although they can be found in
every industry, approximately 1 out of 4 are employed by insurance and finance
establishments, such as banks, savings institutions, finance companies, credit
unions, and securities dealers.
4. Training, Other qualifications and Advancement
A bachelor’s degree in finance, accounting, economics, or business administration
is the minimum academic preparation for financial managers. However, many
employers now seek graduates with a master’s degree, preferably in business
administration, economics, finance, or risk management. These academic
programs develop analytical skills and provide knowledge of the latest financial
analysis methods and technology.
Experience may be more important than formal education for some financial
manager positions—notably, branch managers in banks. Banks typically fill
branch manager positions by promoting experienced loan officers and other
professionals who excel at their jobs. Other financial managers may enter the
profession through formal management training programs offered by the
company. Continuing education is vital for financial managers, who must cope
with the growing complexity of global trade, changes in State laws and
regulations, and the proliferation of new and complex financial instruments.
Firms often provide opportunities for workers to broaden their knowledge and
skills by encouraging employees to take graduate courses at colleges and
universities or attend conferences related to their specialty. Financial
management, banking, and credit union associations, often in cooperation with
colleges and universities, sponsor numerous national and local training programs.
Persons enrolled prepare extensively at home and then attend sessions on subjects
such as accounting management, budget management, corporate cash
management, financial analysis, international banking, and information systems.
Many firms pay all or part of the costs for employees who successfully complete
courses. Although experience, ability, and leadership are emphasized for
promotion, this type of special study may accelerate advancement.

37
37 Summer Training Project Report (Working capital and Ratio Analysis Of HNG Ltd.)
In some cases, financial managers also may broaden their skills and exhibit their
competency by attaining professional certification. There are many different
associations that offer professional certification programs. For example, the
Association for Investment Management and Research confers the Chartered
Financial Analyst designation on investment professionals who have a bachelor’s
degree, pass three sequential
Examinations, and meet work experience requirements. The Association for
Financial Professionals (AFP) confers the Certified Cash Manager credential to
those who pass a computer-based exam and have a minimum of 2 years of
relevant experience. The Institute of Management Accountants offers a Certified
in Financial Management designation to members with a BA and at least 2 years
of work experience who pass the institute’s four-part examination and fulfill
continuing education requirements. Also, financial managers who specialize in
accounting may earn the Certified Public Accountant (CPA) or Certified
Management Accountant (CMA) designations.
Candidates for financial management positions need a broad range of skills.
Interpersonal skills are important because these jobs involve managing people and
working as part of a team to solve problems. Financial managers must have
excellent communication skills to explain complex financial data. Because
financial managers work extensively with various departments in their firm, a
broad overview of the business is essential.
Financial managers should be creative thinkers and problem solvers, applying
their analytical skills to business. They must be comfortable with the latest
computer technology. As financial operations increasingly are affected by the
global economy, financial managers must have knowledge of international
finance. Proficiency in a foreign language also may be important. Because
financial management is critical for efficient business operations, well-trained,
experienced financial managers who display a strong grasp of the operations of
various departments within their organization are prime candidates for promotion
to top management positions. Some financial managers transfer to closely related
positions in other industries. Those with extensive experience and access to
sufficient capital may start their own consulting firms.
38
38 Summer Training Project Report (Working capital and Ratio Analysis Of HNG Ltd.)
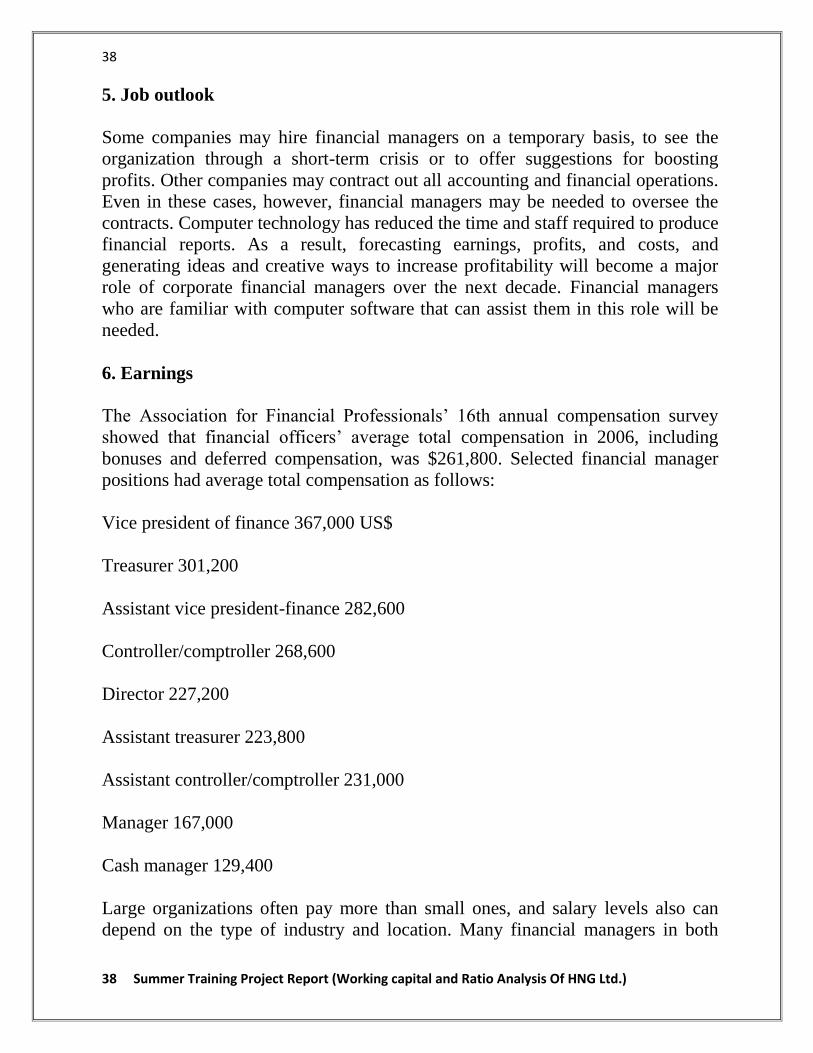
5. Job outlook
Some companies may hire financial managers on a temporary basis, to see the
organization through a short-term crisis or to offer suggestions for boosting
profits. Other companies may contract out all accounting and financial operations.
Even in these cases, however, financial managers may be needed to oversee the
contracts. Computer technology has reduced the time and staff required to produce
financial reports. As a result, forecasting earnings, profits, and costs, and
generating ideas and creative ways to increase profitability will become a major
role of corporate financial managers over the next decade. Financial managers
who are familiar with computer software that can assist them in this role will be
needed.
6. Earnings
The Association for Financial Professionals’ 16th annual compensation survey
showed that financial officers’ average total compensation in 2006, including
bonuses and deferred compensation, was $261,800. Selected financial manager
positions had average total compensation as follows:
Vice president of finance 367,000 US$
Treasurer 301,200
Assistant vice president-finance 282,600
Controller/comptroller 268,600
Director 227,200
Assistant treasurer 223,800
Assistant controller/comptroller 231,000
Manager 167,000
Cash manager 129,400
Large organizations often pay more than small ones, and salary levels also can
depend on the type of industry and location. Many financial managers in both

39
39 Summer Training Project Report (Working capital and Ratio Analysis Of HNG Ltd.)
public and private industry receive additional compensation in the form of
bonuses, which also vary substantially by size of firm. Deferred compensation in
the form of stock options is becoming more common, especially for senior level
executives.
7. Related occupations
Financial managers combine formal education with experience in one or more
areas of finance, such as asset management, lending, credit operations, securities
investment, or insurance risk and loss control. Workers in other occupations
requiring similar training and skills include accountants and auditors; budget
analysts; financial analysts and personal financial advisors; insurance
underwriters; loan counselors and officers; securities, commodities, and financial
services sales agents; and real estate brokers and sales agents.
40
40 Summer Training Project Report (Working capital and Ratio Analysis Of HNG Ltd.)
PROBLEM STATEMENT
How to measure the financial position of the company with the help of ratio analysis?
NEED FOR THE STUDY
1. The study has great significance and provides benefits to various parties whom
directly or indirectly interact with the company.
2. It is beneficial to management of the company by providing crystal clear picture
regarding important aspects like liquidity, leverage, activity and profitability.
3. The study is also beneficial to employees and offers motivation by showing
how actively they are contributing for company’s growth.
4. The investors who are interested in investing in the company’s shares will also
get benefited by going through the study and can easily take a decision whether to
invest or not to invest in the company’s shares.
OBJECTIVES OF STUDY
The major objectives of the resent study are to know about financial strengths and
weakness of HNG Ltd through FINANCIAL RATIO ANALYSIS.
The main objectives of resent study aimed as:
1. To study the present financial system at HNG Ltd
2. To know the financial condition of the company.
3. Interpret the financial statement so that the strength and weakness of a firm
Historical performance and current financial condition can be determined.
4. To analyze the liquidity position of the company.

41
41 Summer Training Project Report (Working capital and Ratio Analysis Of HNG Ltd.)
5. Throw light on a long term solvency of a firm.
6. To offer appropriate suggestions for the better performance of the
organization
RESEARCH DESIGN
A research design is the specification of method and procedure for accruing the
information needed. It is overall operational pattern of frame work of project that
stipulates what information is to be collected for source by that procedures
Descriptive Research design is appropriate for this study.
Descriptive study is used to study the situation. This study helps to describe the
situation. A detail descriptive about present and past situation can be found out by
the descriptive study. In this involves the analysis of the situation using the
secondary data.
DATA COLLECTION
This research study is based on secondary data, means data that are already
available i.e. the data which have been already collected and analyzed by someone
else.
Secondary data are used for the study of Ratio analysis of this company. To
collect the data I have refer – Company annual report, annual magazine, last 5
year balance sheet, and cash flow statements.
42
42 Summer Training Project Report (Working capital and Ratio Analysis Of HNG Ltd.)
METHODOLOGY
The information is collected through secondary sources during the project. That
information was utilized for calculating performance evaluation and based on that,
interpretations were made.
Sources of secondary data:
1. Most of the calculations are made on the financial statements of the company
provided statements.
2. Referring standard texts and referred books collected some of the information
regarding theoretical aspects.
3. Method- to assess the performance of the company method of observation of
the work in finance department in followed.
FINANCIAL ANALYSIS
Financial analysis is the process of identifying the financial strengths and
weaknesses of the firm and establishing relationship between the items of the
balance sheet and profit & loss account. Financial ratio analysis is the calculation
and comparison of ratios, which are derived from the information in a company’s
financial statements. The level and historical trends of these ratios can be used to
make inferences about a company’s financial condition, its operations and
attractiveness as an investment. The information in the statements is used by
Trade creditors, to identify the firm’s ability to meet their claims i.e.
liquidity position of the company.
Investors, to know about the present and future profitability of the company
and its financial structure.
Management, in every aspect of the financial analysis. It is the
responsibility of the management to maintain sound financial condition in
the company.

43
43 Summer Training Project Report (Working capital and Ratio Analysis Of HNG Ltd.)
LITERATURE REVIEW -
Many researchers have studied financial ratios as a part of working capital
Management; however, very few of them have discussed the working capital
Policies in specific. Some earlier work by Gupta and Heffner (1972) examined
the differences in financial ratio averages between industries. The Conclusion of
both the studies was that differences do exist in mean profitability, Activity,
leverage and liquidity ratios amongst industry groups. Pinches et al. (1973) used
factor analysis to develop seven classifications of ratios, and found that the
classifications were stable over the 1951-1969 time periods. In a regional study,
Pandey and Parera (1997) provided an empirical evidence of working capital
management policies and practices of the private sector manufacturing companies
in Sri Lanka. The information and data for the study were gathered through
questionnaires and interviews with chief financial officers of a sample of
manufacturing companies listed on the Colombo Stock Exchange. They found that
most companies in Sri Lanka have informal working capital policy and company
size has an influence on the overall working capital policy (formal or informal)
and approach (conservative, moderate or aggressive). Moreover, company
profitability has an influence on the methods of working capital planning and
control.
Chu et al. (1991) analyzed the hospital sectors to observe the differences of
financial ratios groups between hospital sectors and industrial firms sectors. Their
study concluded that financial ratios groups were significantly different from
those of industrial firms’ ratios as well these ratios were relatively stable over the
five years period. A significance relationship for about half of industries studied
indicated that results might vary from industry to industry. Another aspect of
working capital management has been analyzed by Lamberson (1995) who
studied how small firms respond to changes in economic activities by changing
their working capital positions and level of current assets and liabilities. Current
ratio, current assets to total assets ratio and inventory to total assets ratio were
used as measure of working capital while index of annual average coincident
economic indicator was used as a measure of economic activity. Contrary to the
expectations, the study found that there is very small relationship between charges
44
44 Summer Training Project Report (Working capital and Ratio Analysis Of HNG Ltd.)
in economic conditions and changes in working capital. However, Weinraub and
Visscher (1998) have discussed the issue of aggressive and conservative working
capital management policies by using quarterly data for a period of 1984 to 1993
of US firms. Their study looked at ten diverse industry groups to examine the
relative relationship between their aggressive/conservative working capital
policies. The authors have concluded that the industries had distinctive and
significantly different working capital management policies. Moreover, the
relative nature of the working capital management policies exhibited remarkable
stability over the ten-year study period. The study also showed a high and
significant negative correlation between industry asset and liability policies and
found that when relatively aggressive working capital asset policies are followed
they are balanced by relatively conservative working capital financial policies.
Sathyamoorthi (2002) focused on good corporate governance and in turn effective
management of business assets. He observed that more emphasis is given to
investment in fixed assets both in management area and research. However,
effective management working capital has been receiving little attention and
yielding more significant results. He analyzed selected Co-operatives in Botswana
for a period of 1993-1997 and concluded that an aggressive approach has been
followed by these firms during all the four years of study. Filbeck and Krueger
(2005) highlighted the importance of efficient working capital management by
analyzing the working capital management policies of 32 non-financial industries
in USA. According to their findings significant differences exist between
industries in working capital practices over time.
45
45 Summer Training Project Report (Working capital and Ratio Analysis Of HNG Ltd.)
RATIO ANALYSIS -
The term ―Ratio‖ refers to the numerical and quantitative relationship between
two items or variables. This relationship can be exposed as
Percentages
Fractions
Proportion of numbers
Ratio analysis is defined as the systematic use of the ratio to interpret the financial
statements. So that the strengths and weaknesses of a firm, as well as its historical
performance and current financial condition can be determined Ratio reflects a
quantitative relationship helps to form a quantitative judgment.
STEPS IN RATIO ANALYSIS
The first task of the financial analysis is to select the information relevant to
the decision under consideration from the statements and calculates
appropriate ratios.
To compare the calculated ratios with the ratios of the same firm relating to
the past or with the industry ratios. It facilitates in assessing success or
failure of the firm.
Third step is to interpretation, drawing of inferences and report writing
conclusions are drawn after comparison in the shape of report or
recommended courses of action.
BASIS OR STANDARDS OF COMPARISON
Ratios are relative figures reflecting the relation between variables. They enable
analyst to draw conclusions regarding financial operations. They use of ratios as a
tool of financial analysis involves the comparison with related facts. This is the
basis of ratio analysis. The basis of ratio analysis is of four types.
Past ratios, calculated from past financial statements of the firm.
Competitor’s ratio, of the sum most progressive and successful competitor
firm at the same point of time.
46
46 Summer Training Project Report (Working capital and Ratio Analysis Of HNG Ltd.)
Industry ratio, the industry ratios to which the firm belongs to Projected
ratios, ratios of the future developed from the projected or pro forma
financial statements
NATURE OF RATIO ANALYSIS
Ratio analysis is a technique of analysis and interpretation of financial statements.
It is the process of establishing and interpreting various ratios for helping in
making certain decisions. It is only a means of understanding of financial
strengths and weaknesses of a firm. There are a number of ratios which can be
calculated from the information given in the financial statements, but the analyst
has to select the appropriate data and calculate only a few appropriate ratios. The
following are the four steps involved in the ratio analysis.
Selection of relevant data from the financial statements depending upon the
objective of the analysis.
Calculation of appropriate ratios from the above data.
Comparison of the calculated ratios with the ratios of the same firm in the
past, or the ratios developed from projected financial statements or the
ratios of some other firms or the comparison with ratios of the industry to
which the firm belongs.
INTERPRETATION OF THE RATIOS
The interpretation of ratios is an important factor. The inherent limitations of ratio
analysis should be kept in mind while interpreting them. The impact of factors
such as price level changes, change in accounting policies, window dressing etc.,
should also be kept in mind when attempting to interpret ratios. The interpretation
of ratios can be made in the following ways.
Single absolute ratio
Group of ratios
Historical comparison
Projected ratios
Inter-firm comparison

47
47 Summer Training Project Report (Working capital and Ratio Analysis Of HNG Ltd.)
GUIDELINES OR PRECAUTIONS FOR USE OF RATIOS
The calculation of ratios may not be a difficult task but their use is not easy.
Following guidelines or factors may be kept in mind while interpreting various
ratios is
Accuracy of financial statements
Objective or purpose of analysis
Selection of ratios
Use of standards
Caliber of the analysis
IMPORTANCE OF RATIO ANALYSIS
Aid to measure general efficiency
Aid to measure financial solvency
Aid in forecasting and planning
Facilitate decision making
Aid in corrective action
Aid in intra-firm comparison
Act as a good communication
Evaluation of efficiency
Effective tool
LIMITATIONS OF RATIO ANALYSIS
Differences in definitions
Limitations of accounting records
Lack of proper standards
No allowances for price level changes
Changes in accounting procedures
Quantitative factors are ignored
Limited use of single ratio
Background is over looked
Limited use
Personal bias
48
48 Summer Training Project Report (Working capital and Ratio Analysis Of HNG Ltd.)
CLASSIFICATIONS OF RATIOS
The use of ratio analysis is not confined to financial manager only. There are
different parties interested in the ratio analysis for knowing the financial position
of a firm for different purposes. Various accounting ratios can be classified as
follows:
1. Traditional Classification
2. Functional Classification
3. Significance ratios
1. Traditional Classification
It includes the following.
Balance sheet (or) position statement ratio: They deal with the
relationship between two balance sheet items, e.g. the ratio of current assets
to current liabilities etc., both the items must, however, pertain to the same
balance sheet.
Profit & loss account (or) revenue statement ratios: These ratios deal
with the relationship between two profit & loss account items, e.g. the ratio
of gross profit to sales etc.,
Composite (or) inter statement ratios: These ratios exhibit the relation
between a profit & loss account or income statement item and a balance
sheet items, e.g. stock turnover ratio, or the ratio of total assets to sales.
2. Functional Classification
These include liquidity ratios, long term solvency and leverage ratios, activity
ratios and profitability ratios.
3. Significance ratios
Some ratios are important than others and the firm may classify them as primary
and secondary ratios. The primary ratio is one, which is of the prime importance
to a concern. The other ratios that support the primary ratio are called secondary
ratios.
49
49 Summer Training Project Report (Working capital and Ratio Analysis Of HNG Ltd.)
IN THE VIEW OF FUNCTIONAL CLASSIFICATION THE RATIOS
ANALYSES ARE:
Liquidity ratio
Leverage ratio
Activity ratio
Profitability ratio
1. LIQUIDITY RATIOS
Liquidity refers to the ability of a concern to meet its current obligations as &
when there becomes due. The short term obligations of a firm can be met only
when there are sufficient liquid assets. The short term obligations are met by
realizing amounts from current, floating (or) circulating assets The current assets
should either be calculated liquid (or) near liquidity. They should be convertible
into cash for paying obligations of short term nature. The sufficiency (or)
insufficiency of current assets should be assessed by comparing them with short-
term current liabilities. If current assets can pay off current liabilities, then
liquidity position will be satisfactory.
To measure the liquidity of a firm the following ratios can be calculated
Current ratio
Quick (or) Acid-test (or) Liquid ratio
Absolute liquid ratio (or) Cash position ratio
(a) CURRENT RATIO:
Current ratio may be defined as the relationship between current assets and current
liabilities. This ratio also known as Working capital ratio is a measure of general
liquidity and is most widely used to make the analysis of a short-term financial
position (or) liquidity of a firm.
Current Ratio =
Current Assets
Current Liabilities
50
50 Summer Training Project Report (Working capital and Ratio Analysis Of HNG Ltd.)
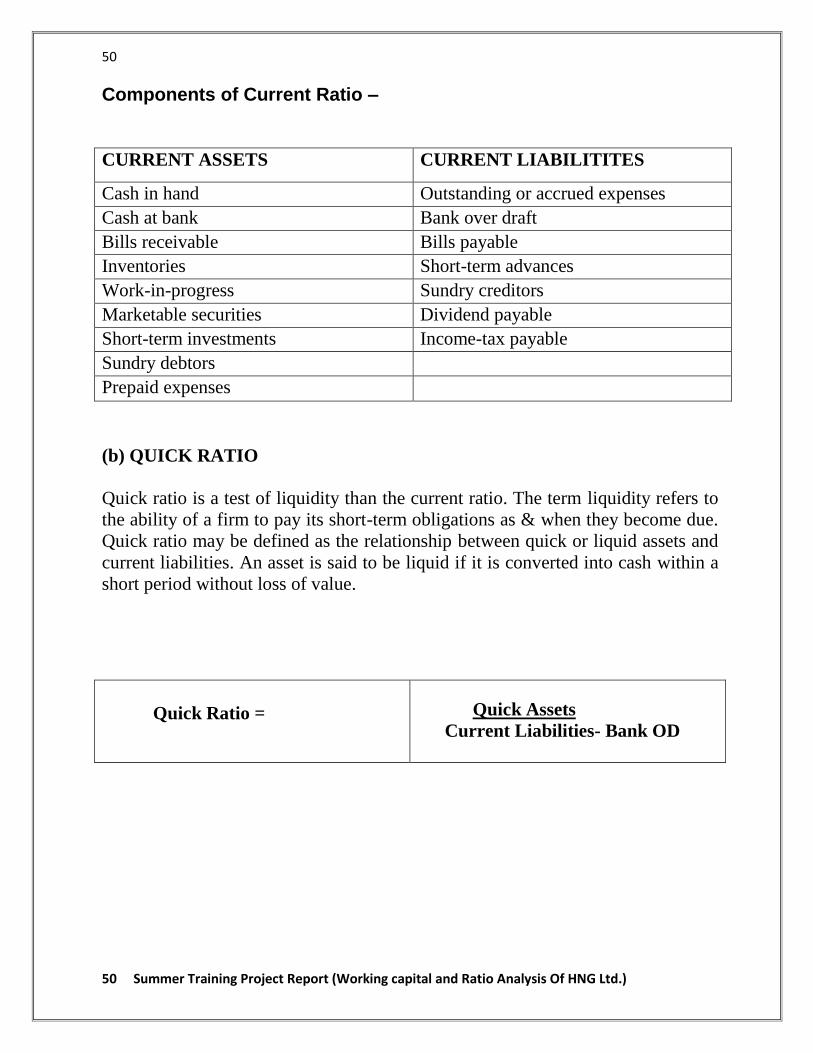
Components of Current Ratio –
CURRENT ASSETS CURRENT LIABILITITES
Cash in hand Outstanding or accrued expenses
Cash at bank Bank over draft
Bills receivable Bills payable
Inventories Short-term advances
Work-in-progress Sundry creditors
Marketable securities Dividend payable
Short-term investments Income-tax payable
Sundry debtors
Prepaid expenses
(b) QUICK RATIO
Quick ratio is a test of liquidity than the current ratio. The term liquidity refers to
the ability of a firm to pay its short-term obligations as & when they become due.
Quick ratio may be defined as the relationship between quick or liquid assets and
current liabilities. An asset is said to be liquid if it is converted into cash within a
short period without loss of value.
Quick Ratio =
Quick Assets
Current Liabilities- Bank OD
51
51 Summer Training Project Report (Working capital and Ratio Analysis Of HNG Ltd.)
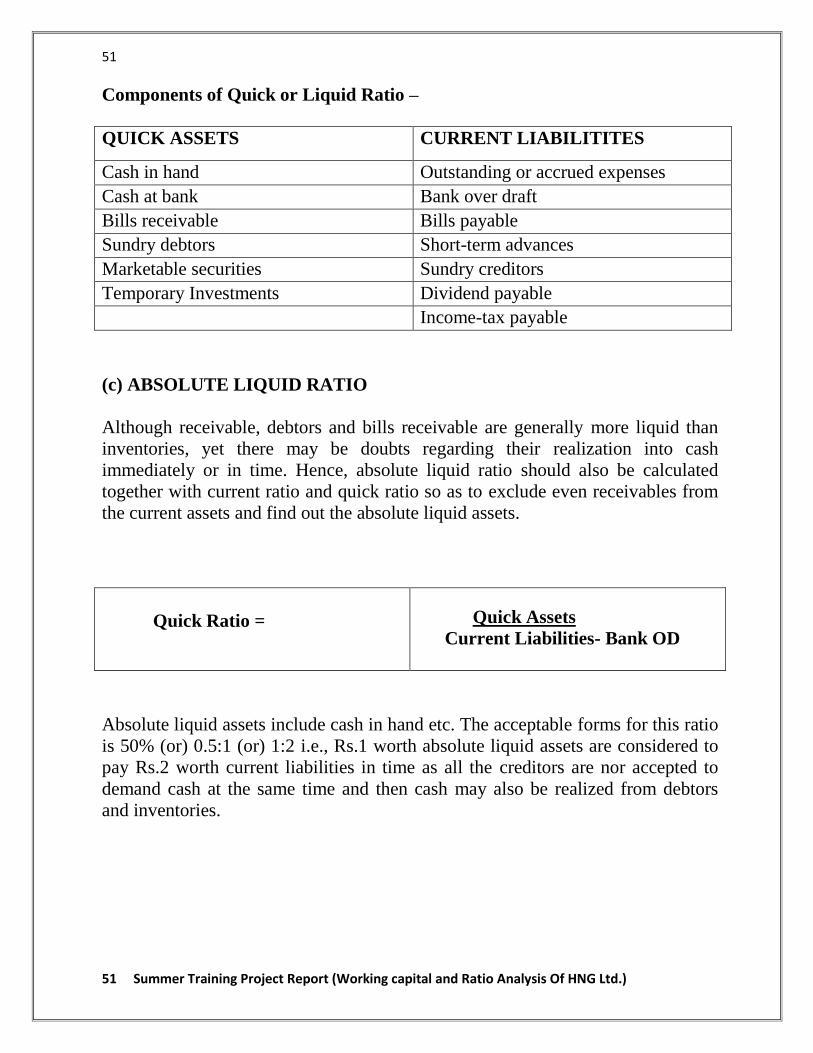
Components of Quick or Liquid Ratio –
QUICK ASSETS CURRENT LIABILITITES
Cash in hand Outstanding or accrued expenses
Cash at bank Bank over draft
Bills receivable Bills payable
Sundry debtors Short-term advances
Marketable securities Sundry creditors
Temporary Investments Dividend payable
Income-tax payable
(c) ABSOLUTE LIQUID RATIO
Although receivable, debtors and bills receivable are generally more liquid than
inventories, yet there may be doubts regarding their realization into cash
immediately or in time. Hence, absolute liquid ratio should also be calculated
together with current ratio and quick ratio so as to exclude even receivables from
the current assets and find out the absolute liquid assets.
Quick Ratio =
Quick Assets
Current Liabilities- Bank OD
Absolute liquid assets include cash in hand etc. The acceptable forms for this ratio
is 50% (or) 0.5:1 (or) 1:2 i.e., Rs.1 worth absolute liquid assets are considered to
pay Rs.2 worth current liabilities in time as all the creditors are nor accepted to
demand cash at the same time and then cash may also be realized from debtors
and inventories.

52
52 Summer Training Project Report (Working capital and Ratio Analysis Of HNG Ltd.)
Components of Absolute Liquid Ratio –
ABSOLUTE LIQUID ASSETS CURRENT LIABILITITES
Cash in hand Outstanding or accrued expenses
Cash at bank Bank over draft
Interest on Fixed Deposit Bills payable
Short-term advances
Sundry creditors
Dividend payable
Income-tax payable
2. LEVERAGE RATIOS
The leverage or solvency ratio refers to the ability of a concern to meet its long
term obligations. Accordingly, long term solvency ratios indicate firm’s ability to
meet the fixed interest and costs and repayment schedules associated with its long
term borrowings.
The following ratio serves the purpose of determining the solvency of the concern.
(a) PROPRIETORY RATIO
A variant to the debt-equity ratio is the proprietary ratio which is also known as
equity ratio. This ratio establishes relationship between share holder’s funds to
total assets of the firm.
Proprietory ratio=
Shareholders fund
Total Assets

53
53 Summer Training Project Report (Working capital and Ratio Analysis Of HNG Ltd.)
Components of Proprietory Ratio –
SHARE HOLDERS FUND TOTAL ASSETS
Share Capital Fixed Assets
Reserves & Surplus Current Assets - Cash in hand & at bank
Bills receivable
Inventories
Marketable securities
Short-term investments
Sundry debtors
Prepaid Expenses
3. ACTIVITY RATIOS
Funds are invested in various assets in business to make sales and earn profits.
The efficiency with which assets are managed directly affect the volume of sales.
Activity ratios measure the efficiency (or) effectiveness with which a firm
manages its resources (or) assets. These ratios are also called ―Turn over ratios‖
because they indicate the speed with which assets are converted or turned over
into sales.
Working capital turnover ratio
Fixed assets turnover ratio
Capital turnover ratio
Current assets to fixed assets ratio
(a) WORKING CAPITAL TURNOVER RATIO
Working capital of a concern is directly related to sales.
Working capital = Current assets - Current liabilities
54
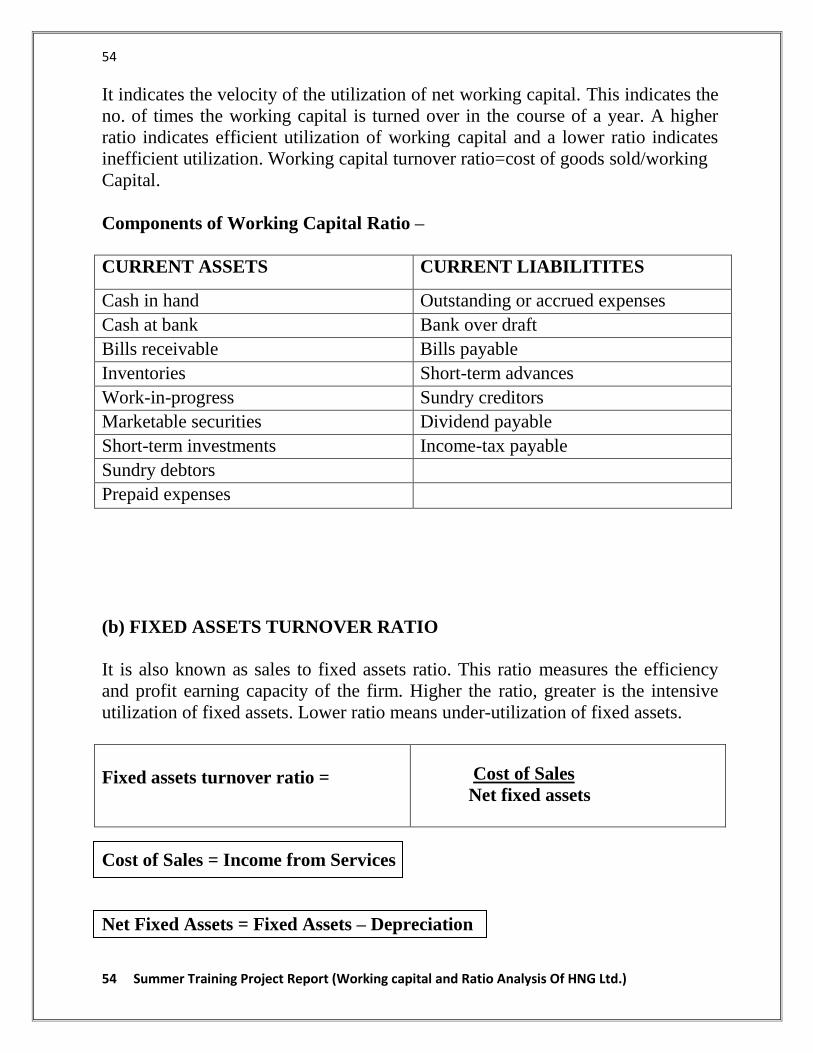
54 Summer Training Project Report (Working capital and Ratio Analysis Of HNG Ltd.)
It indicates the velocity of the utilization of net working capital. This indicates the
no. of times the working capital is turned over in the course of a year. A higher
ratio indicates efficient utilization of working capital and a lower ratio indicates
inefficient utilization. Working capital turnover ratio=cost of goods sold/working
Capital.
Components of Working Capital Ratio –
CURRENT ASSETS CURRENT LIABILITITES
Cash in hand Outstanding or accrued expenses
Cash at bank Bank over draft
Bills receivable Bills payable
Inventories Short-term advances
Work-in-progress Sundry creditors
Marketable securities Dividend payable
Short-term investments Income-tax payable
Sundry debtors
Prepaid expenses
(b) FIXED ASSETS TURNOVER RATIO
It is also known as sales to fixed assets ratio. This ratio measures the efficiency
and profit earning capacity of the firm. Higher the ratio, greater is the intensive
utilization of fixed assets. Lower ratio means under-utilization of fixed assets.
Fixed assets turnover ratio =
Cost of Sales
Net fixed assets
Cost of Sales = Income from Services
Net Fixed Assets = Fixed Assets – Depreciation
55
55 Summer Training Project Report (Working capital and Ratio Analysis Of HNG Ltd.)
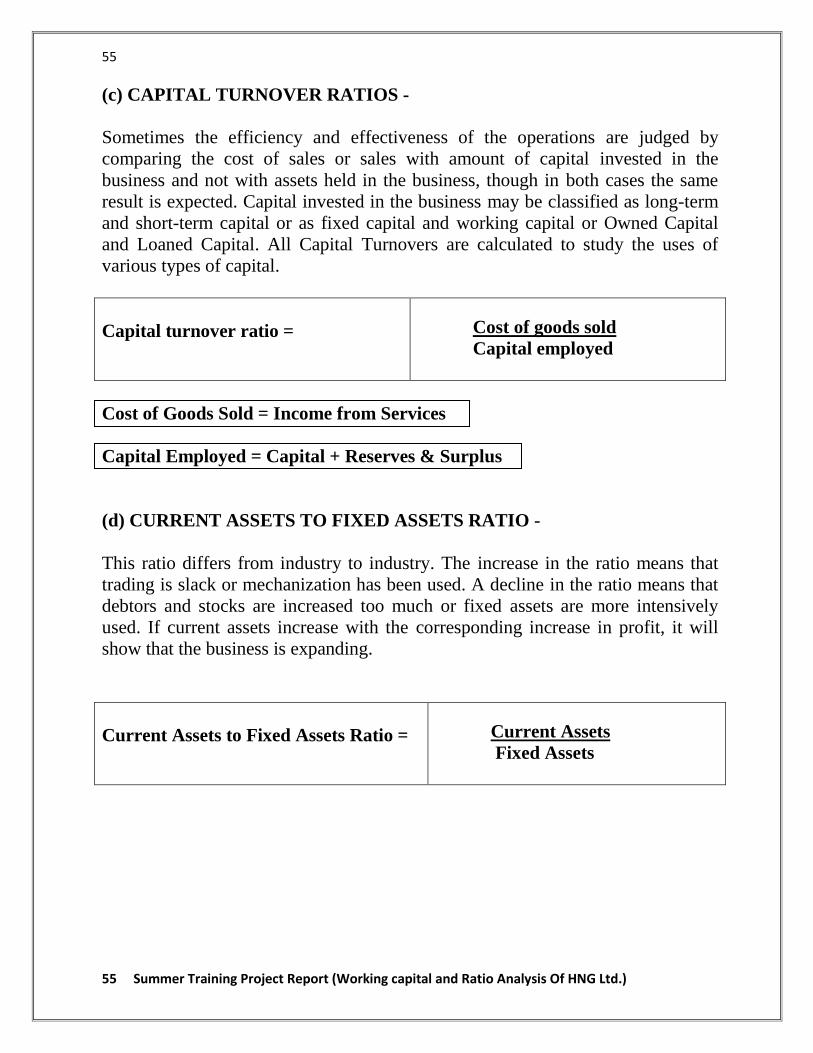
(c) CAPITAL TURNOVER RATIOS -
Sometimes the efficiency and effectiveness of the operations are judged by
comparing the cost of sales or sales with amount of capital invested in the
business and not with assets held in the business, though in both cases the same
result is expected. Capital invested in the business may be classified as long-term
and short-term capital or as fixed capital and working capital or Owned Capital
and Loaned Capital. All Capital Turnovers are calculated to study the uses of
various types of capital.
Capital turnover ratio =
Cost of goods sold
Capital employed
Cost of Goods Sold = Income from Services
Capital Employed = Capital + Reserves & Surplus
(d) CURRENT ASSETS TO FIXED ASSETS RATIO -
This ratio differs from industry to industry. The increase in the ratio means that
trading is slack or mechanization has been used. A decline in the ratio means that
debtors and stocks are increased too much or fixed assets are more intensively
used. If current assets increase with the corresponding increase in profit, it will
show that the business is expanding.
Current Assets to Fixed Assets Ratio =
Current Assets
Fixed Assets
56
56 Summer Training Project Report (Working capital and Ratio Analysis Of HNG Ltd.)
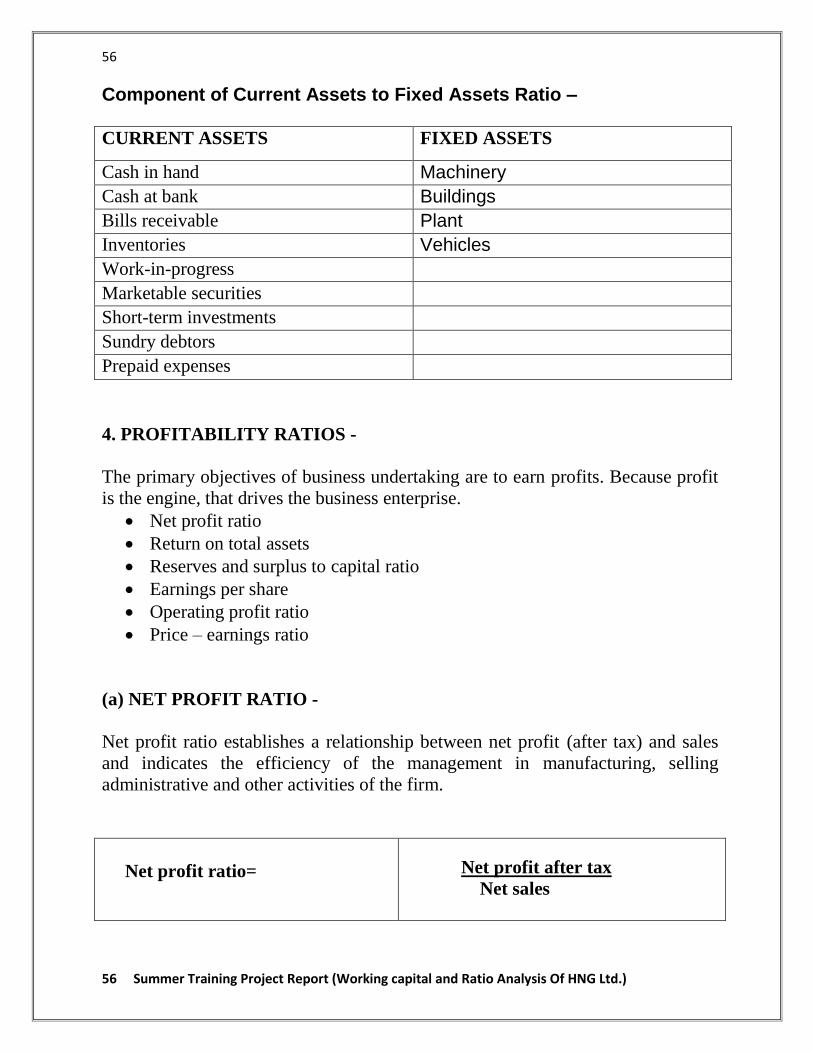
Component of Current Assets to Fixed Assets Ratio –
CURRENT ASSETS FIXED ASSETS
Cash in hand Machinery
Cash at bank Buildings
Bills receivable Plant
Inventories Vehicles
Work-in-progress
Marketable securities
Short-term investments
Sundry debtors
Prepaid expenses
4. PROFITABILITY RATIOS -
The primary objectives of business undertaking are to earn profits. Because profit
is the engine, that drives the business enterprise.
Net profit ratio
Return on total assets
Reserves and surplus to capital ratio
Earnings per share
Operating profit ratio
Price – earnings ratio
(a) NET PROFIT RATIO -
Net profit ratio establishes a relationship between net profit (after tax) and sales
and indicates the efficiency of the management in manufacturing, selling
administrative and other activities of the firm.
Net profit ratio=
Net profit after tax
Net sales
57
57 Summer Training Project Report (Working capital and Ratio Analysis Of HNG Ltd.)
Net Profit after Tax = Net Profit (–) Depreciation (–) Interest (–) Income Tax
Net Sales = Income from Services
It also indicates the firm’s capacity to face adverse economic conditions such as
price competitors, low demand etc. Obviously higher the ratio, the better is the
profitability.
(b) RETURN ON TOTAL ASSETS -
Profitability can be measured in terms of relationship between net profit and
assets. This ratio is also known as profit-to-assets ratio. It measures the
profitability of investments. The overall profitability can be known.
Return on assets =
Net profit
Total assets
Net Profit = Earnings before Interest and Tax Total Assets = Fixed Assets + Current Assets
(c) RESERVES AND SURPLUS TO CAPITAL RATIO -
It reveals the policy pursued by the company with regard to growth shares. A very
high ratio indicates a conservative dividend policy and increased ploughing back
to profit. Higher the ratio better will be the position.
Reserves & surplus to capital =
Reserves& surplus
Capital

58
58 Summer Training Project Report (Working capital and Ratio Analysis Of HNG Ltd.)
(d) EARNINGS PER SHARE -
Earnings per share is a small verification of return of equity and is calculated by
dividing the net profits earned by the company and those profits after taxes and
preference dividend by total no. of equity shares.
Earnings per share =
Net profit after tax
Number of Equity shares
The Earnings per share is a good measure of profitability when compared with
EPS of similar other components (or) companies, it gives a view of the
comparative earnings of a firm.
(e) OPERATING PROFIT RATIO -
Operating ratio establishes the relationship between cost of goods sold and other
operating expenses on the one hand and the sales on the other.
Operating ratio =
Operating cost
Net sales
However 75 to 85% may be considered to be a good ratio in case of a
manufacturing under taking. Operating profit ratio is calculated by dividing
operating profit by sales.
Operating profit = Net sales - Operating cost
Operating Profit ratio =
Operating Profit
Sales

59
59 Summer Training Project Report (Working capital and Ratio Analysis Of HNG Ltd.)
(f) PRICE - EARNING RATIO
Price earnings ratio is the ratio between market price per equity share and earnings
per share. The ratio is calculated to make an estimate of appreciation in the value
of a share of a company and is widely used by investors to decide whether (or) not
to buy shares in a particular company. Generally, higher the price-earnings ratio,
the better it is. If the price earnings ratio falls, the management should look into
the causes that have resulted into the fall of the ratio.
Price – Earnings Ratio =
Market Price per Share
Earnings per Share
Market Price per Share =
Capital + Reserves & Surplus
Number of Equity Shares
Earnings per Share =
Earnings before Interest and Tax
Number of Equity Shares
(g) RETURN ON INVESTMENTS
Return on share holder’s investment, popularly known as Return on investments
(or) return on share holders or proprietor’s funds is the relationship between net
profit (after interest and tax) and the proprietor’s funds.
Return on shareholder’s
investment =
Net profit (after interest and tax)
Shareholder’s funds
The ratio is generally calculated as percentages by multiplying the above with
100.

60
60 Summer Training Project Report (Working capital and Ratio Analysis Of HNG Ltd.)
DATA ANALYSIS AND INTERPRETATION –
LIQUIDITY RATIO
1. CURRENT RATIO –
(Amount in Cr...)
For Year 2007 0.65 : 1
For Year 2008 0.84 : 1
For Year 2009 1.17 : 1
For Year 2010 0.95 : 1
For Year 2011 1.71 : 1
Interpretation:
The ideal level of current ratio is 2:1.we shown too much higher ratio it’s good for
the company. Higher the current ratio, the larger is the amount of rupees available
per rupees of current liabilities, the more is the firm’s ability to meet current
obligation and greater is safety of fund of short term creditors.
Company’s current ratio is not better than its ideal level. But i f we see the
current ratio of the company for last five years it has decreased from 2007 to
2010. The current ratio of company is near the ideal ratio. This depicts that
0
0.2
0.4
0.6
0.8
1
1.2
1.4
1.6
1.8
2007 2008 2009 2010 2011
Current Ratios
Current Ratios

61
61 Summer Training Project Report (Working capital and Ratio Analysis Of HNG Ltd.)
company’s liquidity position is much better in previous years. Its current assets are more than
its current liabilities in 2011.
2. QUICK RATIO
(Amount in Cr...)
For Year 2007 0.98 : 1
For Year 2008 1.35 : 1
For Year 2009 1.37 : 1
For Year 2010 1.31 : 1
For Year 2011 1.12 : 1
Interpretation:
Quick assets are those assets which can be converted into cash within a short
period of time, say to six months. So, here the sundry debtors which are with the
long period does not include in the quick assets.
A quick ratio is an Indication that the firm is liquid and the ability to meet its
current liabilities in time. The Ideal quick ration is 1:1, Company Quick ratio is
more than the ideal ratio. So, The Quick ratio is increased because the sundry
debtors are increased due to the increase in the corporate tax and for that the
provision created is also increased. So, the ratio is also increased from 2008 and
the ration is more than ideal ration from 2008 to 2011. This shows Company has
strong liquidity position.
0
0.2
0.4
0.6
0.8
1
1.2
1.4
1.6
2007 2008 2009 2010 2011
Quick Ratio
Quick Ratio

62
62 Summer Training Project Report (Working capital and Ratio Analysis Of HNG Ltd.)
3. DEBT EQUITY RATIO
(Amount in Cr...)
For Year 2007 1.27
For Year 2008 0.55
For Year 2009 0.61
For Year 2010 0.60
For Year 2011 0.55
Interpretation:
The ratio suggests the claims of creditors and owners over the assets of the
company. Suppose the ratio comes to be 1:2 or 0.5:1, it says that for every Rs 1
financed by debts, there is Rs 2 being brought in by the equity shareholders. The
debt-to-equity ratio shows the best pictures (growth) of a company's leverage. The
higher the figure, the higher is the leverage the company enjoys. The calculate
figure is 0.55 in 2011 which means that the company has been constructive in the
growth of their financial control in Previous Years but as compare with 2010 the
company DER is 0.60 which is lesser than previous year so the company focus on
this ratio to improve its market position but overall the company leverage is good.
This means that the company growing is in fluctuation every year. On the other
hand, at a lower D/E ratio, the lenders enjoy a better margin of safety. If the ratio
is higher, the lenders will have interference in the management as they have
higher stake in the business. By taking into consideration the debt equity ratio in
2009 to 2011 is more than the ideal Ratio, so the company leverage is good.
0
0.5
1
1.5
2007 2008 2009 2010 2011
Debt Equity Ratio
Debt Equity Ratio

63
63 Summer Training Project Report (Working capital and Ratio Analysis Of HNG Ltd.)
4. ABSOLUTE LIQUIDITY RATIO
(Amount in Cr...)
For Year 2007 0.011
For Year 2008 0.053
For Year 2009 0.082
For Year 2010 0.043
For Year 2011 0.018
Interpretation:
According to the rule of thumb the absolute liquid assets is 0.5/1. But when we
calculate the figure is less 0.011 in 2007, 0.082 in 2009 and 0.018 in 2011 that
means the company was not able to satisfy its primary cash requirement with cash
generation by operation. Because of in both years the company Liquidity ratio is
extremely lower in each year for that company has not sufficient Assets to meet
the requirement of its liabilities. According to the balance sheet the company has
less cash and its assets were increase but in other side its liability was also
increases due to the credit purchase and credit sales. So the company must focus
on its Debtor and its cash transaction and also minimize its liability. These ratio
shows that company carries a small amount of cash. But there is nothing to be
worried about the lack of cash because company has reserve, borrowing power &
long term investment. In India, firms have credit limits sanctioned from banks and
can easily draw cash.
0
0.02
0.04
0.06
0.08
0.1
2007 2008 2009 2010 2011
Absolute Liquidity Ratio
Absolute Liquidity Ratio
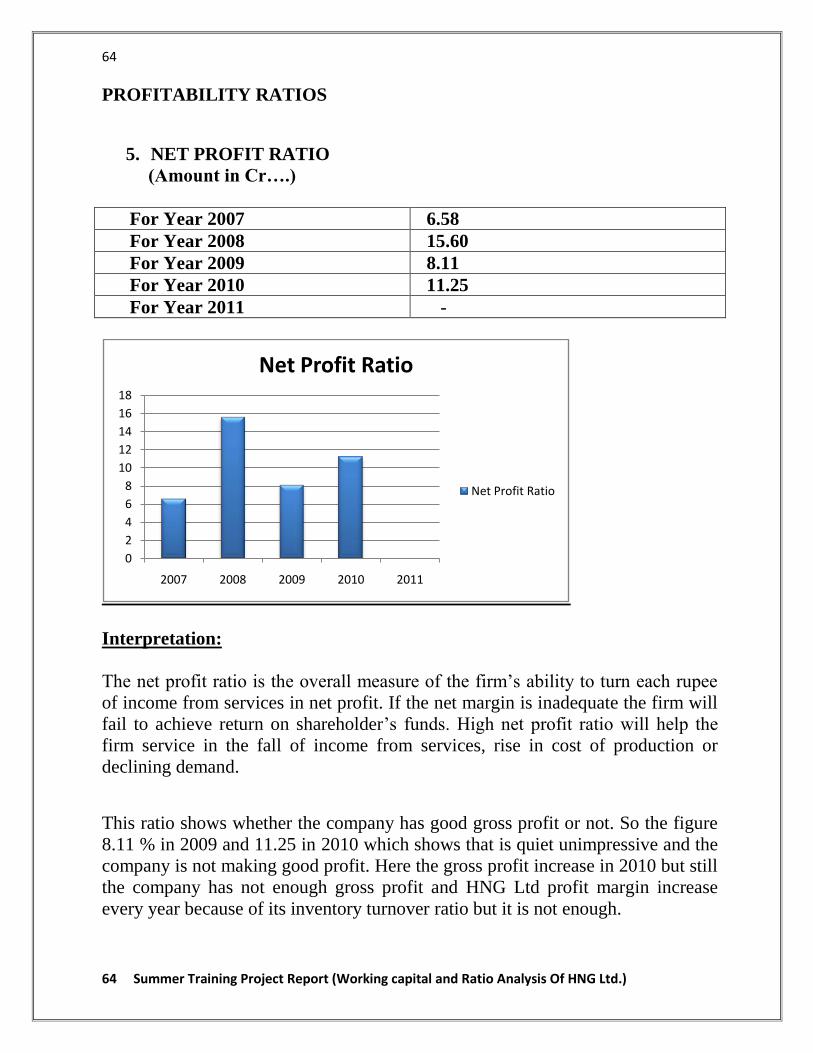
64
64 Summer Training Project Report (Working capital and Ratio Analysis Of HNG Ltd.)
PROFITABILITY RATIOS
5. NET PROFIT RATIO
(Amount in Cr….)
For Year 2007 6.58
For Year 2008 15.60
For Year 2009 8.11
For Year 2010 11.25
For Year 2011 -
Interpretation:
The net profit ratio is the overall measure of the firm’s ability to turn each rupee
of income from services in net profit. If the net margin is inadequate the firm will
fail to achieve return on shareholder’s funds. High net profit ratio will help the
firm service in the fall of income from services, rise in cost of production or
declining demand.
This ratio shows whether the company has good gross profit or not. So the figure
8.11 % in 2009 and 11.25 in 2010 which shows that is quiet unimpressive and the
company is not making good profit. Here the gross profit increase in 2010 but still
the company has not enough gross profit and HNG Ltd profit margin increase
every year because of its inventory turnover ratio but it is not enough.
0
2
4
6
8
10
12
14
16
18
2007 2008 2009 2010 2011
Net Profit Ratio
Net Profit Ratio
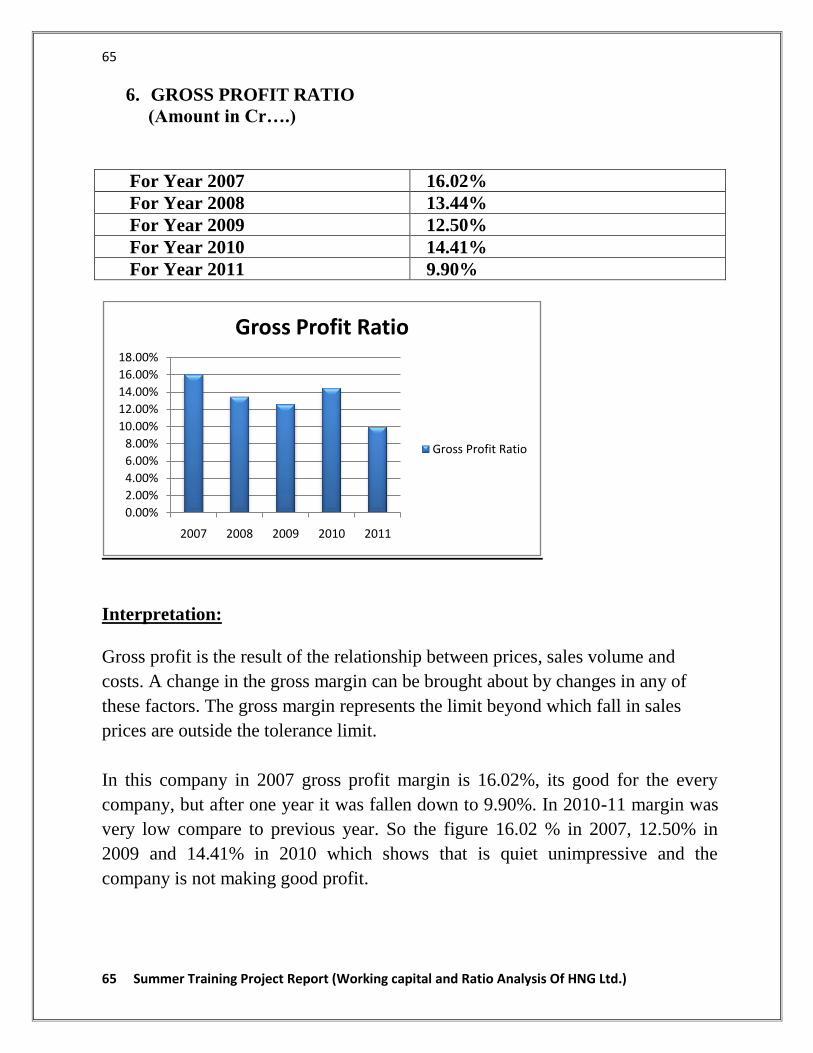
65
65 Summer Training Project Report (Working capital and Ratio Analysis Of HNG Ltd.)
6. GROSS PROFIT RATIO
(Amount in Cr….)
For Year 2007 16.02%
For Year 2008 13.44%
For Year 2009 12.50%
For Year 2010 14.41%
For Year 2011 9.90%
Interpretation:
Gross profit is the result of the relationship between prices, sales volume and
costs. A change in the gross margin can be brought about by changes in any of
these factors. The gross margin represents the limit beyond which fall in sales
prices are outside the tolerance limit.
In this company in 2007 gross profit margin is 16.02%, its good for the every
company, but after one year it was fallen down to 9.90%. In 2010-11 margin was
very low compare to previous year. So the figure 16.02 % in 2007, 12.50% in
2009 and 14.41% in 2010 which shows that is quiet unimpressive and the
company is not making good profit.
0.00%
2.00%
4.00%
6.00%
8.00%
10.00%
12.00%
14.00%
16.00%
18.00%
2007 2008 2009 2010 2011
Gross Profit Ratio
Gross Profit Ratio
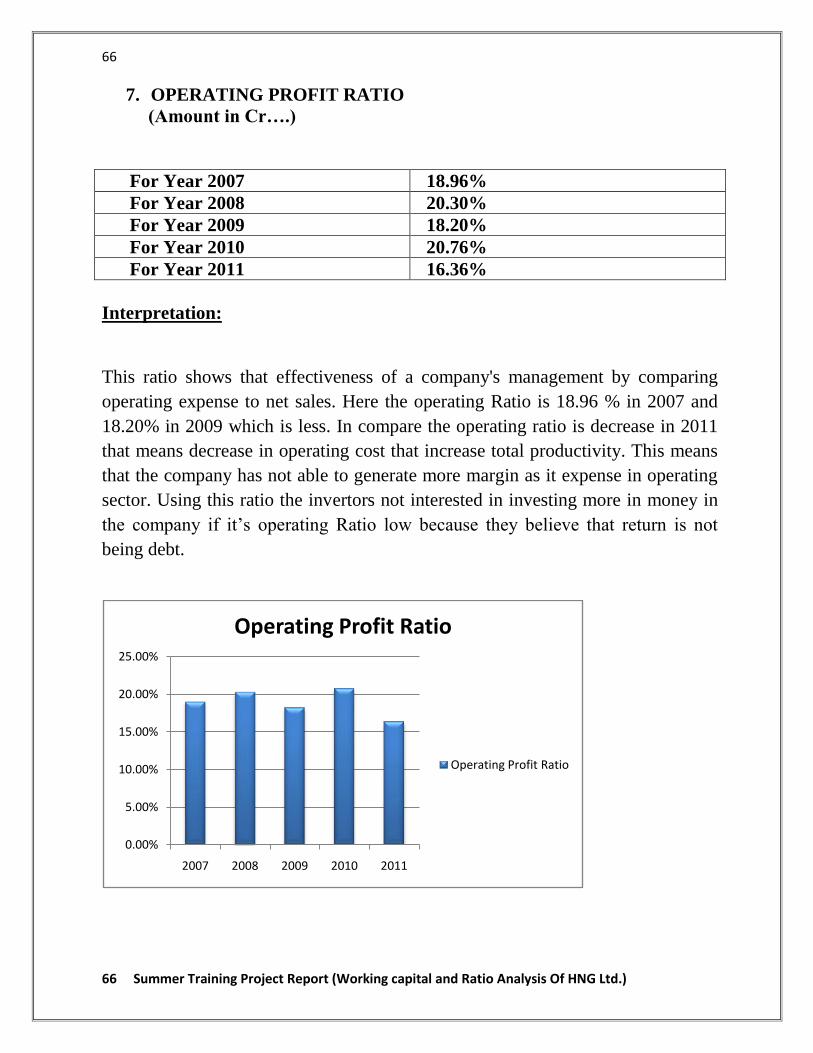
66
66 Summer Training Project Report (Working capital and Ratio Analysis Of HNG Ltd.)
7. OPERATING PROFIT RATIO
(Amount in Cr….)
For Year 2007 18.96%
For Year 2008 20.30%
For Year 2009 18.20%
For Year 2010 20.76%
For Year 2011 16.36%
Interpretation:
This ratio shows that effectiveness of a company's management by comparing
operating expense to net sales. Here the operating Ratio is 18.96 % in 2007 and
18.20% in 2009 which is less. In compare the operating ratio is decrease in 2011
that means decrease in operating cost that increase total productivity. This means
that the company has not able to generate more margin as it expense in operating
sector. Using this ratio the invertors not interested in investing more in money in
the company if it’s operating Ratio low because they believe that return is not
being debt.
0.00%
5.00%
10.00%
15.00%
20.00%
25.00%
2007 2008 2009 2010 2011
Operating Profit Ratio
Operating Profit Ratio

67
67 Summer Training Project Report (Working capital and Ratio Analysis Of HNG Ltd.)
DATA ANALYSIS OF BALANCE SHEET (HNG Ltd…) -
8. INVENTORIES -
(Amount in Cr...)
Year Current Assets Current Liabilities Ratio
For Year 2007 101.29
For Year 2008 93.33
For Year 2009 164.15
For Year 2010 215.78
For Year 2011 209.95
Interpretation:
Inventories are a major part of current assets. If any company wants to manage its
working capital efficiency, it has to manage its inventories efficiently. The Table
shows that inventory in 2007 is 101.29 Cr. in 2009 is 164.15 Cr. and in 2011 is
209.95 Cr. of their current assets. The company should try to reduce the inventory
upto 10% or 20% of current assets.
9. DEBTORS -
(Amount in Cr...)
For Year 2007 92.17
For Year 2008 89.77
For Year 2009 164.50
For Year 2010 227.19
For Year 2011 220.10
Interpretation:
Debtors constitute a substantial portion of total current assets. In India it constitute
one third of current assets. The above Table is depicting that there is increase in

68
68 Summer Training Project Report (Working capital and Ratio Analysis Of HNG Ltd.)
debtors. It represents an extension of credit to customers. The reason for
increasing credit is competition and company liberal credit policy.
10. CURRENT ASSETS -
(Amount in Cr...)
Absolute Cash Ratio
Year Absolute Liquid Assets Current Liabilities Ratio
For Year 2007 194.83
For Year 2008 183.74
For Year 2009 344.86
For Year 2010 454.15
For Year 2011 434.61
Interpretation:
This Table shows that there is increase in current assets in 2008 to 2010. This
increase is arising because there is approx. 50% increase in inventories. Increase
in current assets shows the liquidity soundness of company.
11. CURRENT LIABLITITES
(Amount in Cr….)
Net
For Year 2007 118.44
For Year 2008 118.83
For Year 2009 195.93
For Year 2010 258.53
For Year 2011 246.31
Ratio
Interpretation:
Current liabilities shows company short term debts pay to outsiders. In 2007 to
2010 the current liabilities of the company increased. But still increase in current
assets is more than its current liabilities.

69
69 Summer Training Project Report (Working capital and Ratio Analysis Of HNG Ltd.)
OBSERVATIONS AND FINDINGS -
As we know that ideal current ratio for any firm is 2:1. If we see the current
ratio of the company for last three years it has increased from 2008 to
2010... This depicts that company’s liquidity position is sound. Its current
assets are more than its current liabilities.
A quick ratio is an indication that the firm is liquid and has the ability to
meet its current liabilities in time. The ideal quick ratio is 1:1. Company’s
quick ratio is more than ideal ratio. This shows company has no liquidity
problem.
Inventory conversion period shows that how many days’ inventories take to
convert from raw material to finished goods. In the company inventory
conversion period is decreasing. This shows the efficiency of management
to convert the inventory into cash.
Current liabilities shows company short term debts pay to outsiders. In
2010 the current liabilities of the company increased. But still increase in
current assets is more than its current liabilities.
Working capital is required to finance day to day operations of a firm.
There should be an optimum level of working capital. It should not be too
less or not too excess. In the company there is increase in working capital.
The increase in working capital arises because the company has expanded
its business.
70
70 Summer Training Project Report (Working capital and Ratio Analysis Of HNG Ltd.)
LIMITATIONS OF THE STUDY
Non monetary aspects are not considered making the results unreliable.
Different accounting procedures may make results misleading.
In spite of precautions taken there are certain procedural and technical
limitations.
Accounting concepts and conventions cause serious limitation to financial
analysis.
Lack of sufficient time to exhaust the detail study of the above topic
became a hindering factor in my research.
SUGGESTIONS -
After interpretation and analysis, I am giving certain suggestions to the company
which I hope may be helpful for the company.
The company should utilize its stock more efficiently.
The company should pay attention towards the proper and efficient
utilization of working capital.
The company can reduce the time for purchase order. The buffer should be
maintained in case of emergency. Insurance should be covered especially
fire in case of transit journey also.
71
71 Summer Training Project Report (Working capital and Ratio Analysis Of HNG Ltd.)
CONCLUSION -
In the present study I have analyzed the working management of Hindustan
National Glass and Industries Ltd. I found that inventory is increasing which
shows that company has sufficient stocks to meet up out production of the
company. Inventory Turnover Ratio measures the velocity of conversion of stock
into sales. Usually, a high inventory turnover indicates efficient management of
inventory because more frequently the stocks are sold; the lesser amount of money
is required to finance the inventory.
The Inventory Turnover Ratio is decreasing which is not a good sign for the
company. The business firm has adequate internal control procedure
commensurate with the size of the firm and nature of its business for the purchase
of stores, machinery, equipment and other assets and with regards to sale of
goods. From the comparative study of inventory turnover it is clear that stock
velocity indicates inefficient management of inventory during the year 2009.
So the company’s performance outlook continues to be positive and optimistic.
The company remains confident of delivering of strong operating and financial
performance. Efficient stock velocity indicates efficient management of inventory
of the firm and no slow movement of the stock due to damaged goods.

72
72 Summer Training Project Report (Working capital and Ratio Analysis Of HNG Ltd.)
REFERENCES -
Gupta MC and RJ Huefner (1972), A Cluster Analysis Study of Financial Ratios
and Industry Characteristics. Journal of Accounting Research 10(1): 77-95.
Pinches GE, KA Mingo and JK Caruthers (1973), the Stability of Financial
Patterns in Industrial Organizations. Journal of Finance 28(2): 389-396.
Pandey IM and KLW Parera (1997), Determinants of Effective Working Capital
Management - A Discriminant Analysis Approach, IIMA Working Paper # 1349,
Research and Publication Department Indian Institute of Management Ahmedabad
India.
Lamberson M (1995), Changes in Working Capital of Small Firms in Relation to
Changes in Economic Activity. Mid-American Journal of Business 10(2): 45-50.
Weinraub HJ and S Visscher (1998), Industry Practice Relating To Aggressive
Conservative Working Capital Policies. Journal of Financial and Strategic
Decision 11(2): 11-18.
Sathamoorthi CR (2002), The Management of Working Capital in selected co-
operatives in Botswana. Finance India Dehli 16(3): 1015-1034.
Filbeck G and T Krueger (2005), Industry Related Differences in Working Capital
Management. Mid-American Journal of Business 20(2): 11-18.

73
73 Summer Training Project Report (Working capital and Ratio Analysis Of HNG Ltd.)
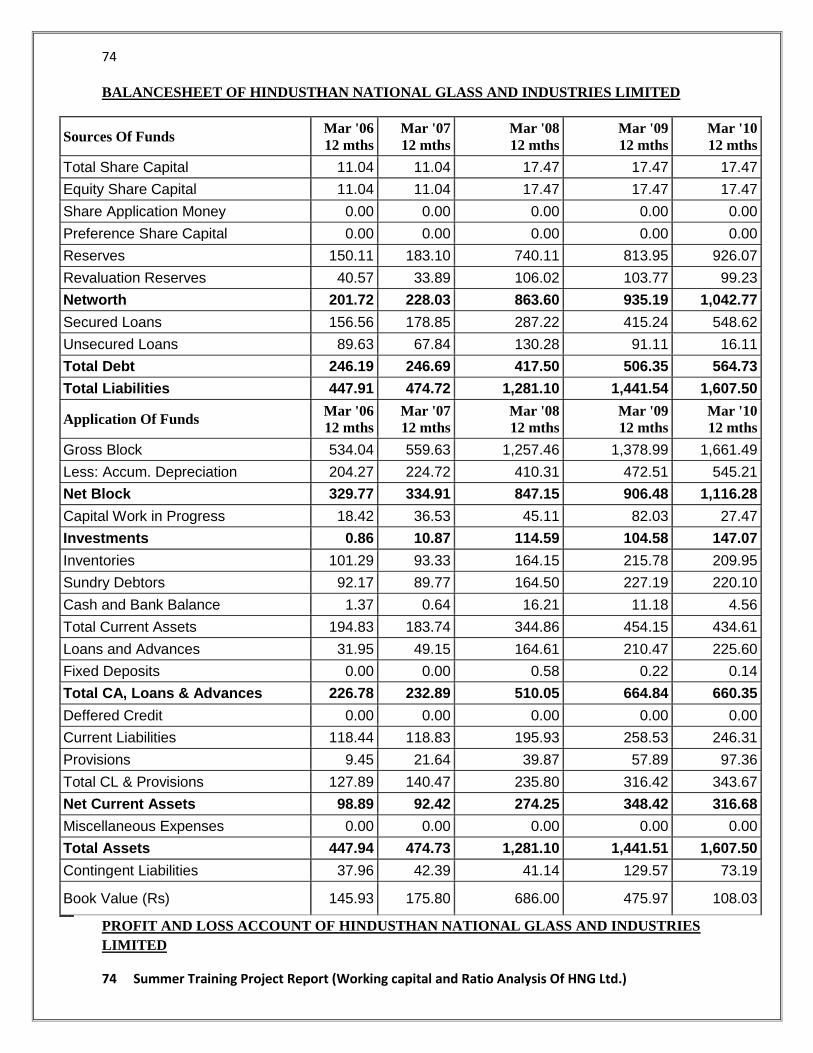
74
74 Summer Training Project Report (Working capital and Ratio Analysis Of HNG Ltd.)
BALANCESHEET OF HINDUSTHAN NATIONAL GLASS AND INDUSTRIES LIMITED
Sources Of Funds Mar '06
12 mths
Mar '07
12 mths
Mar '08
12 mths
Mar '09
12 mths
Mar '10
12 mths
Total Share Capital 11.04 11.04 17.47 17.47 17.47
Equity Share Capital 11.04 11.04 17.47 17.47 17.47
Share Application Money 0.00 0.00 0.00 0.00 0.00
Preference Share Capital 0.00 0.00 0.00 0.00 0.00
Reserves 150.11 183.10 740.11 813.95 926.07
Revaluation Reserves 40.57 33.89 106.02 103.77 99.23
Networth 201.72 228.03 863.60 935.19 1,042.77
Secured Loans 156.56 178.85 287.22 415.24 548.62
Unsecured Loans 89.63 67.84 130.28 91.11 16.11
Total Debt 246.19 246.69 417.50 506.35 564.73
Total Liabilities 447.91 474.72 1,281.10 1,441.54 1,607.50
Application Of Funds Mar '06
12 mths
Mar '07
12 mths
Mar '08
12 mths
Mar '09
12 mths
Mar '10
12 mths
Gross Block 534.04 559.63 1,257.46 1,378.99 1,661.49
Less: Accum. Depreciation 204.27 224.72 410.31 472.51 545.21
Net Block 329.77 334.91 847.15 906.48 1,116.28
Capital Work in Progress 18.42 36.53 45.11 82.03 27.47
Investments 0.86 10.87 114.59 104.58 147.07
Inventories 101.29 93.33 164.15 215.78 209.95
Sundry Debtors 92.17 89.77 164.50 227.19 220.10
Cash and Bank Balance 1.37 0.64 16.21 11.18 4.56
Total Current Assets 194.83 183.74 344.86 454.15 434.61
Loans and Advances 31.95 49.15 164.61 210.47 225.60
Fixed Deposits 0.00 0.00 0.58 0.22 0.14
Total CA, Loans & Advances 226.78 232.89 510.05 664.84 660.35
Deffered Credit 0.00 0.00 0.00 0.00 0.00
Current Liabilities 118.44 118.83 195.93 258.53 246.31
Provisions 9.45 21.64 39.87 57.89 97.36
Total CL & Provisions 127.89 140.47 235.80 316.42 343.67
Net Current Assets 98.89 92.42 274.25 348.42 316.68
Miscellaneous Expenses 0.00 0.00 0.00 0.00 0.00
Total Assets 447.94 474.73 1,281.10 1,441.51 1,607.50
Contingent Liabilities 37.96 42.39 41.14 129.57 73.19
Book Value (Rs) 145.93 175.80 686.00 475.97 108.03
PROFIT AND LOSS ACCOUNT OF HINDUSTHAN NATIONAL GLASS AND INDUSTRIES
LIMITED

75
75 Summer Training Project Report (Working capital and Ratio Analysis Of HNG Ltd.)
Mar '06
12 mths Mar '07
12 mths Mar '08
12 mths Mar '09
12 mths Mar '10
12 mths
Income
Sales Turnover 474.89 595.40 1,148.34 1,438.60 1,449.88
Excise Duty 65.45 79.81 126.76 125.76 92.59
Net Sales 409.44 515.59 1,021.58 1,312.84 1,357.29
Other Income 4.09 4.45 6.27 -8.20 30.92
Stock Adjustments 7.48 -3.22 -4.25 11.46 2.63
Total Income 421.01 516.82 1,023.60 1,316.10 1,390.84
Expenditure
Raw Materials 185.76 221.17 426.25 562.35 551.03
Power & Fuel Cost 111.56 135.10 271.88 368.41 375.59
Employee Cost 23.30 26.84 56.59 68.89 86.91
Other Manufacturing Expenses 6.65 6.76 11.05 9.28 9.23
Selling and Admin Expenses 12.19 15.88 20.80 23.85 25.81
Miscellaneous Expenses 8.36 8.86 23.34 52.55 29.58
Preoperative Exp Capitalised 0.00 0.00 0.00 0.00 0.00
Total Expenses 347.82 414.61 809.91 1,085.33 1,078.15
Mar '06
12 mths Mar '07
12 mths Mar '08
12 mths Mar '09
12 mths Mar '10
12 mths
Operating Profit 69.10 97.76 207.42 238.97 281.77
PBDIT 73.19 102.21 213.69 230.77 312.69
Interest 14.41 19.10 23.47 43.45 47.17
PBDT 58.78 83.11 190.22 187.32 265.52
Depreciation 29.50 33.12 70.13 74.75 86.12
Other Written Off 0.00 0.00 0.00 0.00 0.00
Profit Before Tax 29.28 49.99 120.09 112.57 179.40
Extra-ordinary items 2.90 1.40 13.96 5.23 3.62
PBT (Post Extra-ord Items) 32.18 51.39 134.05 117.80 183.02
Tax 8.24 17.15 -26.27 10.05 27.85
Reported Net Profit 23.95 34.24 160.34 107.75 155.20
Total Value Addition 162.06 193.43 383.64 522.98 527.11
Preference Dividend 0.00 0.00 0.00 0.00 0.00
Equity Dividend 0.77 1.10 6.99 8.73 13.10
Corporate Dividend Tax 0.11 0.15 1.19 1.48 2.04
Per share data (annualised)
Shares in issue (lakhs) 110.43 110.43 110.43 174.68 873.39
Earning Per Share (Rs) 21.69 31.01 145.19 61.68 17.77
Equity Dividend (%) 7.00 10.00 40.00 50.00 75.00

76
76 Summer Training Project Report (Working capital and Ratio Analysis Of HNG Ltd.)
Book Value (Rs) 145.93 175.80 686.00 475.97 108.03
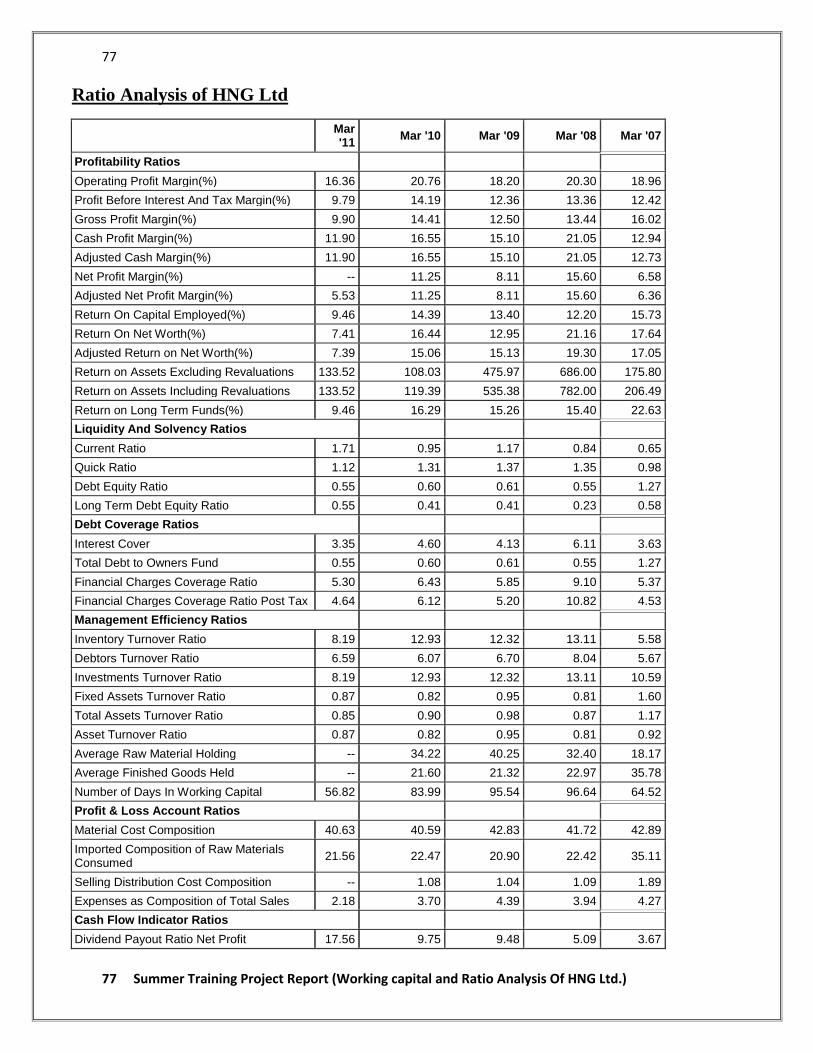
77
77 Summer Training Project Report (Working capital and Ratio Analysis Of HNG Ltd.)
Ratio Analysis of HNG Ltd
Mar '11
Mar '10 Mar '09 Mar '08 Mar '07
Profitability Ratios
Operating Profit Margin(%) 16.36 20.76 18.20 20.30 18.96
Profit Before Interest And Tax Margin(%) 9.79 14.19 12.36 13.36 12.42
Gross Profit Margin(%) 9.90 14.41 12.50 13.44 16.02
Cash Profit Margin(%) 11.90 16.55 15.10 21.05 12.94
Adjusted Cash Margin(%) 11.90 16.55 15.10 21.05 12.73
Net Profit Margin(%) -- 11.25 8.11 15.60 6.58
Adjusted Net Profit Margin(%) 5.53 11.25 8.11 15.60 6.36
Return On Capital Employed(%) 9.46 14.39 13.40 12.20 15.73
Return On Net Worth(%) 7.41 16.44 12.95 21.16 17.64
Adjusted Return on Net Worth(%) 7.39 15.06 15.13 19.30 17.05
Return on Assets Excluding Revaluations 133.52 108.03 475.97 686.00 175.80
Return on Assets Including Revaluations 133.52 119.39 535.38 782.00 206.49
Return on Long Term Funds(%) 9.46 16.29 15.26 15.40 22.63
Liquidity And Solvency Ratios
Current Ratio 1.71 0.95 1.17 0.84 0.65
Quick Ratio 1.12 1.31 1.37 1.35 0.98
Debt Equity Ratio 0.55 0.60 0.61 0.55 1.27
Long Term Debt Equity Ratio 0.55 0.41 0.41 0.23 0.58
Debt Coverage Ratios
Interest Cover 3.35 4.60 4.13 6.11 3.63
Total Debt to Owners Fund 0.55 0.60 0.61 0.55 1.27
Financial Charges Coverage Ratio 5.30 6.43 5.85 9.10 5.37
Financial Charges Coverage Ratio Post Tax 4.64 6.12 5.20 10.82 4.53
Management Efficiency Ratios
Inventory Turnover Ratio 8.19 12.93 12.32 13.11 5.58
Debtors Turnover Ratio 6.59 6.07 6.70 8.04 5.67
Investments Turnover Ratio 8.19 12.93 12.32 13.11 10.59
Fixed Assets Turnover Ratio 0.87 0.82 0.95 0.81 1.60
Total Assets Turnover Ratio 0.85 0.90 0.98 0.87 1.17
Asset Turnover Ratio 0.87 0.82 0.95 0.81 0.92
Average Raw Material Holding -- 34.22 40.25 32.40 18.17
Average Finished Goods Held -- 21.60 21.32 22.97 35.78
Number of Days In Working Capital 56.82 83.99 95.54 96.64 64.52
Profit & Loss Account Ratios
Material Cost Composition 40.63 40.59 42.83 41.72 42.89
Imported Composition of Raw Materials Consumed
21.56 22.47 20.90 22.42 35.11
Selling Distribution Cost Composition -- 1.08 1.04 1.09 1.89
Expenses as Composition of Total Sales 2.18 3.70 4.39 3.94 4.27
Cash Flow Indicator Ratios
Dividend Payout Ratio Net Profit 17.56 9.75 9.48 5.09 3.67
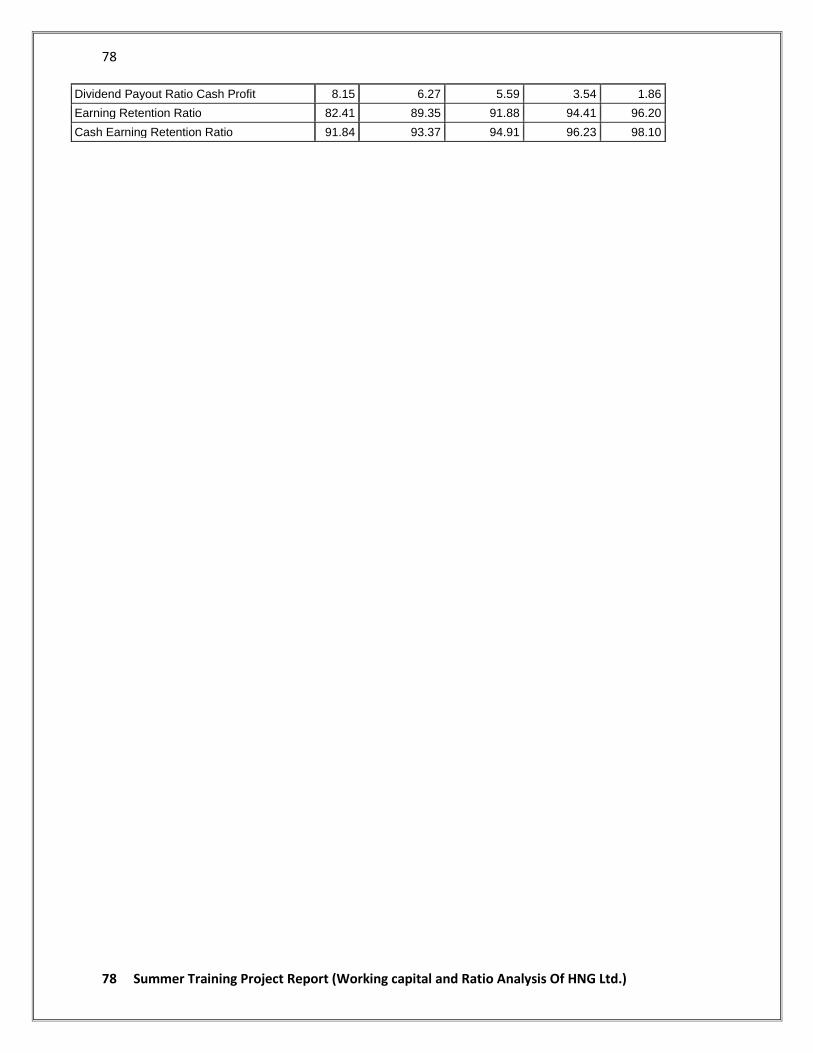
78
78 Summer Training Project Report (Working capital and Ratio Analysis Of HNG Ltd.)
Dividend Payout Ratio Cash Profit 8.15 6.27 5.59 3.54 1.86
Earning Retention Ratio 82.41 89.35 91.88 94.41 96.20
Cash Earning Retention Ratio 91.84 93.37 94.91 96.23 98.10


![21325300 Ratio Analysis Project Report[1]](https://static.fdocuments.in/doc/165x107/577d2a721a28ab4e1ea93506/21325300-ratio-analysis-project-report1.jpg)