Project Report - iconline.ipleiria.pt · desempenho de cada departamento para verificar se estão a...
84
Project Report Master in Computer Engineering – Mobile Computing Consulting Project in Kofax and Microsoft: Analytics/First Mile Capture Clunie, Clifton Leiria, September 9 of 2017
Transcript of Project Report - iconline.ipleiria.pt · desempenho de cada departamento para verificar se estão a...

Project Report
Master in Computer Engineering – Mobile Computing
Consulting Project in Kofax and Microsoft: Analytics/First Mile Capture
Clunie, Clifton
Leiria, September 9 of 2017

ii
Clifton Clunie, Msc Thesis, 2017
Project Report
Master in Computer Engineering – Mobile Computing
Consulting Project in Kofax and Microsoft: Analytics/First Mile Capture
Master Project developed under the supervision of Doctor Dulce Gonçalves Professor at School of
Technology and Management of the Polytechnic Institute of Leiria.
Clunie, Clifton
Leiria, September 9 of 2017

iii
Clifton Clunie, Msc Thesis, 2017
Acknowledgements
I would like to thanks to the program “Erasmus Cruz del Sur” for this opportunity of doing
a Master Degree in Polytechnic of Leiria, Portugal. Erasmus is a great experience that rich
our mind with new knowledge and culture, I’m very grateful for this experience that I gained
through this time.
I would like to thank my master coordinator Carlos Grilo for all the support that he gave me
on the course and in the decision of the second year related to the final project.
I would like to thank my family for all the support that they gave to me. It was not easy
because of the distance and the time difference. Thanks, my father Clifton Clunie for all the
inspiration and guidance to achieve this goal. To my mother, Gisela de Clunie for all the
support and effort so I can conclude my studies on time. To my big sister, Grace Clunie for
all the jokes and share stories to always remember that besides the distance it’s here the
support from home.
Thanks to Professor Dulce Gonçalves and João Assunção for collaborate with me in the part
of the final project, for my guidance and focus on the work and thesis.
And finally, but not least, thanks to my girlfriend Kateryna Shtefan, thank you for the support,
and for reminding me that any proposed goal can be achieved.

iv
Clifton Clunie, Msc Thesis, 2017

v
Clifton Clunie, Msc Thesis, 2017
Resumo
Um dos maiores desafios que existente nas empresas do nosso tempo consiste em ver o modo
como a empresa está em movimento, e ver como a empresa está evoluindo. As grandes
empresas tem muito empregados, departamentos e gestores que devem ver como é o
desempenho de cada departamento para verificar se estão a alcançar os seus objetivos. O
avanço da tecnologia permitiu ao utilizador ter um melhor acesso à informação. Os
utilizadores podem aceder à informação através de vários dispositivos, incluindo dispositivos
móveis.
As grandes empresas integram os seus sistemas com ferramentas de Business Intelligence
(BI). As ferramentas de BI ajudam as empresas a ter uma atualização dos dados a qualquer
momento. As ferramentas de BI permitem ao utilizador ter uma melhor visão geral das
informações, a todos os dados do processo comercial, definidos num painel dinâmico que
mostra detalhes em tabelas e gráficos sobre o negócio. Isso permite que o utilizador final
tenha uma melhor compreensão do negócio.
O resultado da automatização utilizando este tipo de ferramentas, permite ter mais tempo
para se concentrar nos principais trabalhos da empresa e com toda essa recolha de dados, o
diretor poderá ver a evolução da empresa.

vi
Clifton Clunie, Msc Thesis, 2017
Abstract
One of the biggest issues that exists on companies of our time is to see the way of how the
company is moving, how the company is evolving. Big companies have a lot of workers,
departments and chiefs officer that must see how it’s the performance of each department to
see if there are achieving their goals. The advance of technology has allowed the user to have
a better access to information. The users can access information from several devices
including mobile devices.
Big companies are integrating their system with Business Intelligence tools. BI tools help
the company to have an update data at any moment. Business Intelligence allows the user to
have a better overview of the information, all the data of the business process are defined on
a dynamic dashboard that shows table details and graphics about the business. This allows
the end user to have a better understanding of the business.
The result of this application tools has shown that automatized this kind of labor, allows to
have more time to focus on the main jobs of the company and with all this data collection the
chief officer would be able to see the evolution of the company.

vii
Clifton Clunie, Msc Thesis, 2017

viii
Clifton Clunie, Msc Thesis, 2017
List of figures
Figure 1 – Power Bi tools (Microsoft, Power BI, 2017) ..................................................... 13
Figure 2 – power BI data Source Connections .................................................................... 14
Figure 3 - Power Bi Creation of a Report Desktop App ..................................................... 15
Figure 4 - Power BI Dashboard ........................................................................................... 16
Figure 5 - Power BI Share Report Link ............................................................................... 17
Figure 6 - Power BI Embedded Link .................................................................................. 17
Figure 7 - Power BI DAX Function .................................................................................... 18
Figure 8 - power BI Relationship Warning message .......................................................... 20
Figure 9 - Power BI Relationship ........................................................................................ 20
Figure 10 - Table Copy ........................................................................................................ 21
Figure 11 – Power BI location ............................................................................................. 22
Figure 12 - Bing map .......................................................................................................... 23
Figure 13 - Cortana .............................................................................................................. 24
Figure 14 - Azure power BI App ......................................................................................... 24
Figure 15 - power BI Tokens ............................................................................................... 25
Figure 16 - Microsoft Power Bi app for Azure connection .................................................. 25
Figure 17 - Sharepoint app with power BI .......................................................................... 26
Figure 18 - Insiht Admin App ............................................................................................. 27
Figure 19 - Insight Studio App ............................................................................................ 28
Figure 20 - Insight Data Loader App................................................................................... 29
Figure 21 - Insight Theme and Formats App ...................................................................... 30
Figure 22 - Insight Data Source Connections ...................................................................... 30
Figure 23 - Insight creation of dashboard ............................................................................ 31
Figure 24 - Insight View Preview ....................................................................................... 32
Figure 25 -Query ................................................................................................................. 33
Figure 26 - SQL Test query ................................................................................................. 34
Figure 27 - test Query .......................................................................................................... 34
Figure 28 - Kofax Total Agility Database Model................................................................ 36
Figure 29 - power BI Process & Batch Information ............................................................ 37

ix
Clifton Clunie, Msc Thesis, 2017
Figure 30 - Power BI Document Information ..................................................................... 38
Figure 31 - Power BI Queue Information ............................................................................ 39
Figure 32 - Power BI Batch Details..................................................................................... 39
Figure 33 - Kofax Total Agility Overview Insight View .................................................... 40
Figure 34 - Pages information ............................................................................................. 41
Figure 35 - Batch Information ............................................................................................. 41
Figure 36 - Bacth Detail ...................................................................................................... 42
Figure 37 - Module Information .......................................................................................... 42
Figure 38 - IIS ..................................................................................................................... 43
Figure 39 - Kofax Insight InstallationFigure 38 - IIS ......................................................... 43
Figure 39 - Kofax Insight Installation ................................................................................. 44
Figure 40 - License .............................................................................................................. 44
Figure 41 - KTA Authentication ......................................................................................... 45
Figure 42 - User MappingFigure 41 - KTA Authentication ............................................... 45
Figure 42 - User Mapping ................................................................................................... 45
Figure 43 - Services ............................................................................................................. 46
Figure 44 - KTA Systems Tasks.......................................................................................... 46
Figure 45 - Insight Configuration ........................................................................................ 47
Figure 46 - Consolidated file ............................................................................................... 47
Figure 47 - Kafta Overview ................................................................................................. 48
Figure 48 - Document Rejected ........................................................................................... 48
Figure 49 - Operator time .................................................................................................... 49
Figure 50 - Operator & Activity Costs ................................................................................ 49
Figure 51 - Session time ...................................................................................................... 50
Figure 52 - Process Status and Priorities ............................................................................. 50
Figure 53 - Activities Resume ............................................................................................. 51
Figure 54 - Documents Classifcation ................................................................................. 51
Figure 55 - Process Resume ................................................................................................ 52
Figure 56 - Operator Resume .............................................................................................. 52
Figure 57 - Extraction Detail ............................................................................................... 53
Figure 58 - Extraction graphic Info ..................................................................................... 53

x
Clifton Clunie, Msc Thesis, 2017
Figure 59 - Process Execution ............................................................................................ 54
Figure 60 - Activities Details............................................................................................... 54
Figure 61 - Classification document report ......................................................................... 55
Figure 62 - User detail report .............................................................................................. 55
Figure 63 - SUPPLIERS INFORMATION ......................................................................... 56
Figure 64 - Process Execution ............................................................................................. 57
Figure 65 - Extraction Field................................................................................................. 58
Figure 66 - Invoice Details .................................................................................................. 58
Figure 67 - Net Amount Details .......................................................................................... 59
Figure 68 - Tax amount DetaiL ........................................................................................... 60
Figure 69 - Tax Rate Details ............................................................................................... 61
Figure 70 - Total Details ...................................................................................................... 62

xi
Clifton Clunie, Msc Thesis, 2017

xii
Clifton Clunie, Msc Thesis, 2017
List of tables
Table 1 – Host Company Clients ............................................................................................ 3
Table 2 - Host Company Solutions ........................................................................................ 5
Table 3 - Kofax Tool Details .................................................................................................. 6
Table 4 - Microsoft Tools ....................................................................................................... 7
Table 5 - Visioneer detail Tools ............................................................................................. 8
Table 6 - Host Activities ......................................................................................................... 9
Table 7 – BI Tool Comparison ............................................................................................. 11

xiii
Clifton Clunie, Msc Thesis, 2017

xiv
Clifton Clunie, Msc Thesis, 2017
Table of Contents
Acknowledgements ............................................................................................................... iii
Resumo ................................................................................................................................... v
Abstract .................................................................................................................................. vi
List of figures ...................................................................................................................... viii
List of tables ......................................................................................................................... xii
Table of Contents ................................................................................................................ xiv
List of acronyms ................................................................................................................. xvii
1. Introduction ..................................................................................................................... 1
1.1. Context ..................................................................................................................... 1
1.2. Motivation and Goals ............................................................................................... 1
1.3. Document Organization ........................................................................................... 2
2. Host Company Characterization ..................................................................................... 3
2.1. Latourrette Consulting Characterization .................................................................. 3
2.2. Clients ...................................................................................................................... 3
2.3. Latourrette Solutions ................................................................................................ 3
2.3.1. Kofax .................................................................................................................... 5
2.3.2. Microsoft .............................................................................................................. 6
2.3.3. Visioneer .............................................................................................................. 7
2.3.4. Kofax Training ..................................................................................................... 8
Kofax Course ...................................................................................................................... 8
Microsoft Course ................................................................................................................ 8
3. State of the Art .............................................................................................................. 10
Tool Comparison .............................................................................................................. 11
4. Business Intelligence Projects ....................................................................................... 12
4.1 Case Study One ......................................................................................................... 12
4.1.1. Power BI ............................................................................................................. 12
4.1.2. Kofax .................................................................................................................. 27
4.1.3. Other Information:.............................................................................................. 35
4.2. Case Study Two ..................................................................................................... 36
4.2.1. Kofax Total Agility Model ................................................................................. 36

xv
Clifton Clunie, Msc Thesis, 2017
4.2.2. Power BI ............................................................................................................. 37
4.2.3. Kofax .................................................................................................................. 40
5. Bancolombia Client ....................................................................................................... 43
6. Liberty Client ................................................................................................................ 56
7. Conclusion ..................................................................................................................... 64
8. Future Work .................................................................................................................. 65
9. Bibliography .................................................................................................................. 66

xvi
Clifton Clunie, Msc Thesis, 2017

xvii
Clifton Clunie, Msc Thesis, 2017
List of acronyms
BI Business Intelligence
BPM Business Process Management
DAX Data Analysis Expression
ETL Extraction, Transform and Load
IIS Internet Information Services
IT Information Technology
KAFC Kofax Analytics for Capture
KAFTA Kofax Analytics for Total Agility
KTA Kofax Total Agility
KOFAX Digital Information Tool
OLAP On-Line Analytical Processing

1
Clifton Clunie, Msc Thesis, 2017
1. Introduction
Every day that passes we see a breakthrough technology, in recent years’ technology has
evolved significantly. Nowadays the average user can perform various tasks from a mobile
device something that a few years ago, was hard to believe. These developments have also
evolved globally.
In the industrial sector, you can see a growth that has had thanks to the technology that is
used today. These advances have helped process automation, increasing the demands of the
general manager who wants to have a perspective on how the business is operating with a
tool or set of tools to facilitate manage your business in the best way.
1.1. Context
This document shows the Business Intelligence Case Studies that were developed in the
entity known as Latourrette Consulting. This document describes the implementation of
Kofax and Microsoft technologies.
In the Kofax area, it was done different cases studies and an implementation in a project with
an international client (Bancolombia) were carried out. In the Microsoft area, different cases
studies were done and a demo presentation was developed for a local customer (Liberty).
1.2. Motivation and Goals
The objective of the presented solutions is to fulfill the client needs handling analytical
reports to have a better overview of the system. Thus, the client can determine failures in the
processes and implement improvements to have a better control of the tasks that are assigned
to the system.
Solutions were implemented with the aim of helping to understand the data, helping to make
decision and managing the system.
When carrying out consultancy work the focus is customer satisfaction and to solve the
challenges presented by the client in the fastest, concise and efficient way so that the

2
Clifton Clunie, Msc Thesis, 2017
customer is comfortable with the service and able to tie the customer to future projects with
the company.
1.3. Document Organization
This document is structured in twelve chapters. Each chapter shows a description of a theme
developed on the internship.
The first chapter is the introduction of this document. The context, motivation & goals and
document organization are presented in this chapter.
The second chapter is about the host company. In this chapter is presented all the information
related to the host company and the tools that the host companies used. Also, shows the
company portfolio and the commercial relationships with the company.
The third chapter shows the project training that were done on the host company.
The fourth chapter is about the State of the Art in Business Intelligence.
The fifth chapter shows the case studies that were work in the host company. Also, shows
the tools that were used to create these case studies and what was the objective of each case.
The sixth chapter talks about the implementation that was done on the Bancolombia Client.
The seventh chapter shows the demo presentation that was done to Liberty Client.
The eight chapter shows the results and contributions done on the host company.
The ninth chapter is the conclusion of the project.
The tenth chapter is about the future work.

3
Clifton Clunie, Msc Thesis, 2017
2. Host Company Characterization
This chapter presents a characterization of the company host, where several cases of studies
and projects were applied and are going to be shown in this document.
A brief history of Latourrette Consulting will be presented, with the focus of its existence in
the business area.
2.1. Latourrette Consulting Characterization
Latourrette Consulting is a consulting company that is responsible for providing
technological solutions. This company started providing solutions in digital information area
and has gradually expanded to other areas such as document management with the Sharepoint
tool. And in Business Intelligence with the analytical tools of Kofax and Microsoft.
This company has two offices, the main office is in Porto, Portugal and the other office is in
Leiria, Portugal. The company has a total of approximately 30 persons (Latourrette, 2017).
2.2. Clients
These are some of the clients:
Clients Description
Bancolombia Project on business process development and analytical
reporting.
SONAE They have a document management project.
Liberty Seguros They have projects with the KTA platform and soon will
include a project with the development of analytical
reports.
Willis Tower Watson Project with KTA platform for BPM development.
TABLE 1 – HOST COMPANY CLIENTS
2.3. Latourrette Solutions
These are the business areas that host company offers a solution.

4
Clifton Clunie, Msc Thesis, 2017
Solutions:
Solutions Description
Enterprise Content
Management
Combines analytics, collaboration, governance and
processes with anywhere, anytime access to deliver
value to your customers, partners, and employees.
When used effectively, even complex content
becomes your greatest business asset (Latourrette,
2017).
Business Process Management If your organization is striving to establish
automated, consistent, repeatable, and defensible
operational processes, then this course is for you. The
Business Process Management (BPM) course
provide practical guidance to map, standardize,
automate, and manage operational processes with the
right strategies, tools, and technologies. You’ll learn
how to implement new ways of working while
maximizing ROI (Latourrette, 2017).
Electronic Records
Management
Many organizations rely on paper-based principles to
manage electronic records but this doesn’t work with
the growing volume, velocity, and variety of
information. The AIIM Electronic Records
Management (ERM) course provides you with a
thorough understanding of how to best automate the
way electronic records are identified, captured and
classified. The course covers the entire lifecycle of
records, ISO standard 15489, and related concepts
with special emphasis on email capture and retention
as well as new content types such as social media
(Latourrette, 2017).
Information Governance The volume, variety, and velocity of organizational
information is changing the game for governance and
compliance. Applying a paper paradigm of policies
and processes no longer works - and it certainly
doesn’t scale. Governance functions must now be
automated, and focus as much on defensible
disposition as on retention; as much on data
extraction as data archiving (Latourrette, 2017).
Managing Records &
Ediscovery in Sharepoint
70% of organizations currently use SharePoint – but
nearly 50% of them have reservations about its ability
to meet their compliance requirements. With the
introduction of SharePoint 2013 and Office 365,
Microsoft has made significant functionality
changes. To optimize their investment in the
platform, organizations must now determine the
impact that these changes will have on their
5
Clifton Clunie, Msc Thesis, 2017
compliance and eDiscovery strategy (Latourrette,
2017).
TABLE 2 - HOST COMPANY SOLUTIONS
These are some of the partners that the company has. The solution given by Latourrette are
based on tools of the partners.
2.3.1. Kofax
Kofax Capture automates and accelerates business processes by capturing all types of
documents and forms in paper and electronic format, transforming them into accurate and
processable information, and sending them to the main applications, processes and
workflows of your company. Whether your information is on paper or electronic files,
whether you are in a central office or scattered across offices and offices around the world,
Kofax Capture can help you manage it in its entirety.
Thanks to its unparalleled scalability, Kofax Capture is a powerful capture platform adapted
to the company that works at the production level. The solution captures information from
virtually any source: scanner, multifunction printer, print stream, email, fax, web service or
electronic folder. Automates capture-based processes within the organization or where
documents are received, regardless of location, source, language, or type.
Regardless of the hardware or business applications you choose now or in the future, you can
count on Kofax Capture to capture documents, and index and validate your most important
information consistently. (Inc & Kofax, 2017)
Tools offer by Kofax:
Tool Description
Total Agility This tool is the world’s first united smart
process application development and
deployment platform. Smart process
applications are a new category of software
designed to support business activities that
are people intensive, highly variable,
loosely structured and subject to frequent
change (Kofax, TotalAgility, 2014).
Total Capture Kofax Capture automates and accelerates
business processes by capturing all types of
documents and forms in paper and

6
Clifton Clunie, Msc Thesis, 2017
electronic format, transforming them into
accurate and processable information, and
sending them to the main applications,
processes, and workflows of your company.
Whether your information is on paper or
electronic files, whether you are located in a
central office or scattered across offices and
offices around the world, Kofax Capture can
help you manage it in its entirety (Kofax C.
, 2017).
Kofax Transformation Module This is an add-on to Kofax Capture that
streamlines the transformation of different
document types into structured electronic
information, ready for delivery into
business systems and processes (Kofax,
Kofax Transformation Module, s.f.).
Kofax Insight Analytics Kofax business intelligence and analytics
products take the value of information to a
higher level, by delivering advanced
functionality while making your work
faster, easier, and more cost effective. These
process-aware solutions eliminate the cost
and complexity of conventional business
intelligence and analytics products while
delivering advanced functionality for
maximized operational performance and
improved decision-making (Kofax A. ,
2017).
TABLE 3 - KOFAX TOOL DETAILS
2.3.2. Microsoft
Microsoft Corporation is an American multinational corporation, that develops,
manufactures, licenses, supports and sells computer software, consumer electronics and
personal computers and services. “The new SharePoint is all about getting things done
together.” (Microsoft, Microsoft, 2017).
Tools offer by Microsoft:
Tool Description
Sharepoint Is a business collaboration platform, made up
of products and software elements that
include, among an increasing selection of
components, collaboration functions, web

7
Clifton Clunie, Msc Thesis, 2017
browser based, process management
modules, search modules and a management
platform of documents (documentary
management) (Sharepoint, 2017).
Azure Microsoft Azure is a growing collection of
integrated cloud services that developers and
IT professionals use to build, deploy, and
manage applications through our global
network of datacenters. With Azure, you get
the freedom to build and deploy wherever you
want, using the tools, applications, and
frameworks of your choice (Azure, 2017).
Microsoft Sql Server It’s a system to manage relational database
developed by Microsoft.
The language use on Microsoft SQL Server is
Transact – SQL (TSQL), this is an
implementation of the ANSI that is used to
manipulated and recover data, create table
and define the relationship between them
(SQL, 2017).
.NET Framework Is a Microsoft framework that emphasizes the
transparency of networks, regardless of the
hardware platform and allows rapid
development of applications. Based on it, the
company tries to develop a horizontal strategy
that integrates all its products, from the
operating system to the market tools
(Wikipedia, Wikipedia, 2017).
TABLE 4 - MICROSOFT TOOLS
2.3.3. Visioneer
Visioneer is a world-class developer of intelligent imaging solutions that provide a faster and
easier way to capture documents and photographs and integrate them with popular Windows
and document imaging application. “Visioneer OneTouch Links Simplifying Scanner and
Software Interaction” (Visioneer, 2017).
Tools offer by Visioneer:
Tools Description
Vsioneer One Touch OneTouch is an easy-to-use utility that
connects the buttons on your Visioneer or
Xerox scanner with a powerful set of

8
Clifton Clunie, Msc Thesis, 2017
scanner settings so that with one touch, your
document is scanned automatically to email,
or Word, or your printer, or simply a file
folder. The resolution, color depth, file
format and paper size are all preset, but of
course you can change them at any time (Inc
V. , 2017).
Xerox Document Scanners This is the scanner that also supports the kofax
tool. This is the Xerox brand scanner tool
(Visioneer I. , s.f.).
TABLE 5 - VISIONEER DETAIL TOOLS
2.3.4. Kofax Training
The training was done in Kofax and Microsoft tools. There is a compulsory training that is a
Kofax Essential main course.
Kofax Course 1. Kofax Essential
This is the main course that must be done in Latourrette Consulting. The strength of the
company is on digitalizing of the information. The host company uses the Kofax Total
Agility platform, that is a business process management platform. It’s mandatory to know
how it works this platform (Essential, s.f.).
2. Insight Analytics
The Insight training was doing it with the documentation that exists of Kofax Insight. A
full installation of the Insight Analytics was done on an environment to know all the part
of installation/configuration and to know what are the requirements of the application
(Kofax A. , 2017).
Microsoft Course 1. Power BI:
The Power BI training was done with an online documentation. The course was based on
videos that show the potential of the tool. A full installation of the Power BI was done,
to know what are the steps and the installation requirements of the application (Linkedin,
2016).

9
Clifton Clunie, Msc Thesis, 2017
Activities done on the host company:
These are the activities that were done on the host company (Table 6).
This schedule was defined by the advisory. A study of the Kofax Essential, that is the main
tool used by the company was mandatory.
The Case Studies were created by the advisory with the focus to apply this knowledge and
expertise in real scenarios with clients.
October November Dezember January February March April May June July
Kofax
Essential
Formation
X
Kofax
Insight
Formation
X X
Power BI
Formation
X X
Case Study
One
X
Case Study
Two
X
Bancolombia
Client
X X X X X X
Liberty
Client
X X
Thesis
X X X X X
TABLE 6 - HOST ACTIVITIES

10
Clifton Clunie, Msc Thesis, 2017
3. State of the Art
This is a comparison of the main Business Intelligence (BI) tools that exist on the market and
the tools that the host company offers in BI area (BigData, 2016-2017).
Sisense Information
Is business intelligence application, it's a web application that allows the creation of a cube
with information (OLAP), reports and dashboard and has own functions at the level of
reports/dashboard that allows creating a greater detail of the data with certain application-
specific functions (Information, 2014).
Domo
Allows connection to web applications such as Facebook, twitter, trello, etc. Automatically
creates a series of dashboards that allow you to see the behavior of the tool that you want to
evaluate. This creates dashboards and reports with the concept of cards, a series of objects
that can be details or graphics (Data, 2017).
Tableau
It is a desktop application that allows the creation of reports and dashboards. Connect this to
different source formats. Change the data type of the source. The drag and drop so simple
allow a friendly way to create reports. It is designed to work naturally with the
user(Overview, 2016).

11
Clifton Clunie, Msc Thesis, 2017
Tool Comparison Business Intelligence Applications
Power
BI
Sap Business
Objects
Kofax
Insight
Sisense Domo Tableau
Desktop Application X X
X
Web Application X X X X X X
Multiple Data Sources X X X X X X
Recognize relationship
between tables
X X
X
Usability X X
X X X
Reports X X X X X
Dashboards X X X X X
Update database Model X X
X
Queries Validation
X X
Need permission to access to
the reports
X
X
X
Mobile devices View X X X X X X
TABLE 7 – BI TOOL COMPARISON
The aspects that chose to validate the different functionalities of the BI tools have, was based
on the need of the modern client. Clients are needing tools that can adapt to mobile devices,
create reports/dashboards, share this information with the business organization, and adapt
these business processes to business intelligence analytical reports and many other aspects
(Table 7).

12
Clifton Clunie, Msc Thesis, 2017
4. Business Intelligence Projects
This chapter will show the case studies developed for Business Intelligence development.
The development of this case study was to meet the following objectives:
1. Learn how to use the application
2. Connection in different Data Sources
3. Create Reports
4. Create Dashboard
5. Share reports/dashboards
6. Other functionalities
4.1 Case Study One
The purpose of this case of study is to learn how to manage and use the PowerBI and Insight
application, and see what can be done with these applications.
4.1.1. Power BI
1) Learn How to use the application:
Power BI has two applications: a desktop application, and a Web application. The web
application is more to access for the final reports/dashboards, also allows to develop
reports/dashboard. The desktop application gives more functionalities to the developer to
create their reports (Figure 1).

13
Clifton Clunie, Msc Thesis, 2017
FIGURE 1 – POWER BI TOOLS (MICROSOFT, POWER BI, 2017)
14
Clifton Clunie, Msc Thesis, 2017
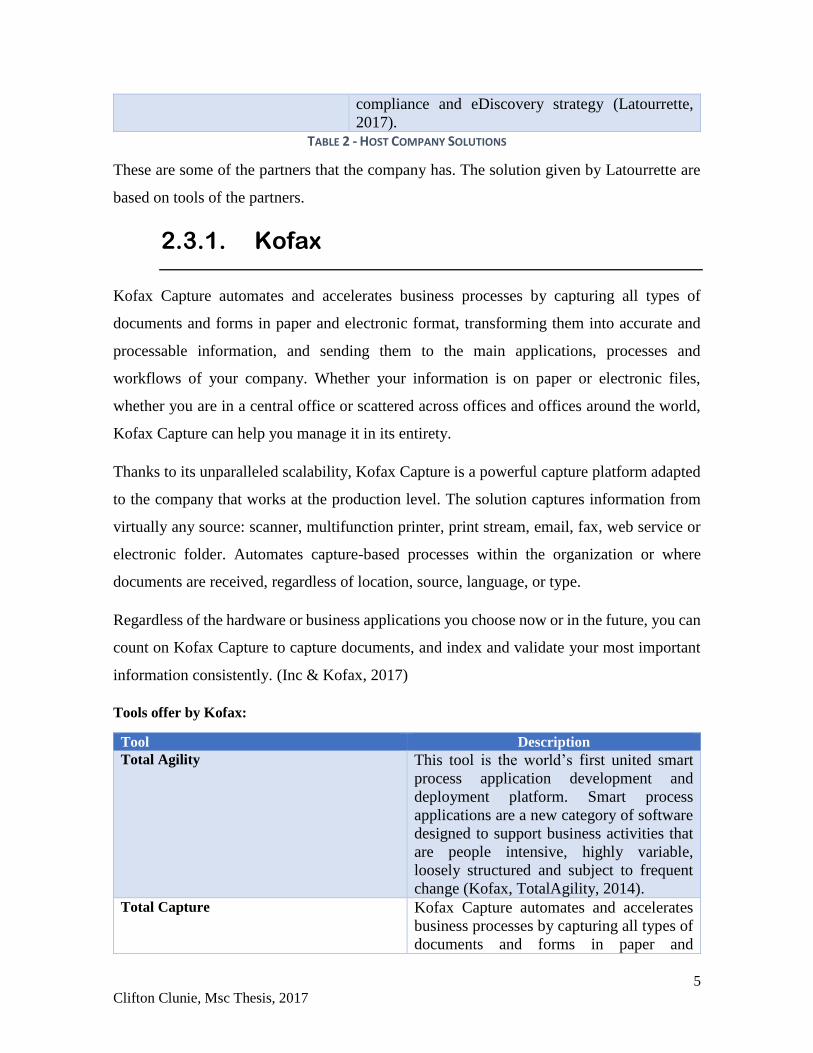
2) Connection with different data sources
Power BI allows connections with many different types of databases (Figure 2). When a
connection is established Power BI can maintain an update of the reports, to have an
automatic update it's necessary to define the correct gateway.
Power BI has 2 types of connections:
1. Direct Query: This option creates a real connection between Power BI and the
database engine. This is recommended to be done when the data model is too big,
because of the live connection that reflects the update of the database.
FIGURE 2 – POWER BI DATA SOURCE CONNECTIONS

15
Clifton Clunie, Msc Thesis, 2017
2. Import: This option is suggested to be done when the database is smaller. Power
BI import all the database data to memory and start to work with that information.
3) Creation of Reports
For the creation of reports, it is only necessary to make the combinations of what the
developer wants to show. Depending on what the developer wants to show, it can be a detail
table or a graph. To do this, dimension or measure must be used in the appropriate way.
All this information is fully interactive. A click on a chart places a general filter at the
reporting level by seeing its effect on other graphs or tables (Figure 3).
FIGURE 3 - POWER BI CREATION OF A REPORT DESKTOP APP

16
Clifton Clunie, Msc Thesis, 2017
4) Creation of Dashboards:
The Power BI dashboard is a set of tiles, these tiles are generated by the tool itself and can
be grouped in the canvas, the Power BI dashboard is a set of tiles, these tiles are generated
by the tool itself and can be grouped in the canvas, the tiles can show graphic bars, circular,
etc. can also be table details. The conjunction of tiles forms the dashboard (Figure 4).
5) Share Reports/Dashboards:
Some examples of how to share Power BI reports are shown below.
Power BI allows sharing the reports by a link that's generated by the Power BI server. The
user that owns the reports can manage the activation/deactivation of the link with another
resource. With the link to the report, the report can also be embedded in web page (Figure
5).
One of the advantages of share information in Power BI is that the user that is going to receive
the report doesn’t need an account to access the report (Figure 6).
FIGURE 4 - POWER BI DASHBOARD

17
Clifton Clunie, Msc Thesis, 2017
FIGURE 5 - POWER BI SHARE REPORT LINK
FIGURE 6 - POWER BI EMBEDDED LINK

18
Clifton Clunie, Msc Thesis, 2017
6) Other Functionalities:
This section is going to show specific functionalities of Power BI that were founded on the
learning process of the application.
Power BI allows the alteration of the data model. This alteration can be at the level of table
creation, field modification and data type. It can be done on the model that has been already
preloaded to the tool. Defining the connection type between import and direct query can show
limitation on the data model modification.
Power BI uses DAX functions like the excel tools. DAX is a collection of functions,
operators, and constants that can be used in a formula, or expression, to calculate and return
one or more values. Stated more simply, DAX helps you create new information from data
already in your model.
It’s quite easy to create a new Power BI Desktop file (Figure 7) and import some data into it.
You can even create reports that show valuable insights without using any DAX formulas at
all. DAX formulas provide this capability and many other important capabilities as well.
Learning how to create effective DAX formulas will help you get the most out of your data.
When you get the information you need, you can begin to solve real business problems that
affect your bottom line (Iseminger, Power BI, 2017).
Alterations cannot be performed when the connection is Direct query, since as it is a real-
time database connection. It does not allow alteration with the data model.
The import connection allows the alteration of the data model since Power BI makes a copy
of the database and works with an independent connection to the one of the database.
FIGURE 7 - POWER BI DAX FUNCTION

19
Clifton Clunie, Msc Thesis, 2017
There are currently a few limitations in using the Direct Query connection:
• All tables must come from a single database;
• If the Query Editor query is overly complex, an error will occur. To remedy the error
you must either delete the problematic step in Query Editor, or Import the data
instead of using Direct Query. For multi-dimensional sources like SAP Business
Warehouse, there is no Query Editor;
• Relationship filtering is limited to a single direction, rather than both directions
(though it is possible to enable cross filtering in both directions for Direct Query as
a Preview feature). For multi-dimensional sources like SAP Business Warehouse,
there are no relationships defined in the model;
• Time intelligence capabilities are not available in Direct Query. For example, special
treatment of date columns (year, quarter, month, day, so on) are not supported in
Direct Query mode;
• By default, limitations are placed on DAX expressions allowed in measures; see the
following paragraph for more information;
• There is a 1 million row limit for returning data when using Direct Query. This does
not affect aggregations or calculations used to create the dataset returned using Direct
Query, only the rows returned. For example, you can aggregate 10 million rows with
your query that runs on the data source, and accurately return the results of that
aggregation to Power BI using Direct Query as long as the data returned to Power
BI is less than 1 million rows. If more than 1 million rows would be returned from
Direct Query, Power BI returns an error (Iseminger, Microsoft, 2017).

20
Clifton Clunie, Msc Thesis, 2017
Power BI detects the key fields (Figure 9) that are in the database, this helps to find the
relationships that exist between the tables. Also, Power BI helps to prevent relationship errors
(Figure 8).
FIGURE 9 - POWER BI RELATIONSHIP
FIGURE 8 - POWER BI RELATIONSHIP WARNING MESSAGE

21
Clifton Clunie, Msc Thesis, 2017
Power BI manages context that can exist on a database model. The user can copy tables
(Figure 10) so can establish the correct path between tables. Context is a list of joins that
define a logical path through a database model. Power BI helps to solve loops that are caused
by multiple fact tables accessing common dimension tables. The joins that belong to a context
are the joins from the fact table, leading to all dimension tables that might be needed for that
fact.
FIGURE 10 - TABLE COPY

22
Clifton Clunie, Msc Thesis, 2017
One of the new functionalities that Power BI has, is the recognition of fields with coordinate
format. An example of this is the image shown in Figure 11. We have raw data (Figure 12)
and by the type of map chart, Power BI detects that these fields as coordinates and show this
on a map.
Power BI service and Power BI Desktop send Bing the geo data it needs to create the map
visualization. This may include the data in the Location, Latitude, and Longitude buckets
and geo fields in any of the Report level, Page level, or Visual level filter buckets. Exactly
what is sent varies by map type.
• For maps (bubble maps), if latitude and longitude are provided then no data is sent to
Bing. Otherwise, any data in the Location (and filter) buckets is sent to Bing.
• Filled maps require a field in the Location bucket; even if latitude and longitude are
provided. Whatever data is in the Location, Latitude, or Longitude buckets is sent to
Bing (Hart, 2017).
FIGURE 11 – POWER BI LOCATION

23
Clifton Clunie, Msc Thesis, 2017
Power BI can connect with Cortana. Cortana is a Microsoft's intelligent agent. Cortana
recognizes natural language (no need to use specific commands) and uses Bing, Yelp and
Foursquare as databases (Figure 13). This feature only works for Power BI pro version. The
advantage of this, is that allows nontechnical users to create a dashboard through the data
model. If you have a report or a dashboard that does not meet the needs of the user, in human
language you can make the queries to Cortana and this will create a chart that will answer
the user’s needs.
FIGURE 12 - BING MAP

24
Clifton Clunie, Msc Thesis, 2017
Power BI allows to share reports with Azure (Figure 14). The Azure service must be linked
with the reports, so when a query is made to the Azure it retrieves the reports.
For this, it is necessary to have the Power BI application token in Azure (Figure 15). But
before this, it's necessary to connect the reports that are created with the tool of Power BI in
the Azure.
FIGURE 13 - CORTANA
FIGURE 14 - AZURE POWER BI APP

25
Clifton Clunie, Msc Thesis, 2017
Microsoft already has a code that links the reports to the Azure application
This application of Microsoft allows only to link reports that have been done with Power BI
desktop (Figure 16).
FIGURE 15 - POWER BI TOKENS
FIGURE 16 - MICROSOFT POWER BI APP FOR AZURE CONNECTION

26
Clifton Clunie, Msc Thesis, 2017
6.1) Other Functionalities:
Advantage:
• Allows connection between Power BI reports and .NET application (Figure 17).
Disadvantages:
• The reports that are uploaded to the workspace cannot be modify.
• Doesn’t show reports with direct query connection.
• Can’t be share dashboards.
FIGURE 17 - SHAREPOINT APP WITH POWER BI

27
Clifton Clunie, Msc Thesis, 2017
4.1.2. Kofax
1) Learn How to use the application:
The Kofax Insight Analytics is a tool offered by Kofax in Business Intelligence area. With
the Kofax Insight Analytics, the user can create a dashboard and reports.
Kofax Insight Analytics it’s divided into several applications:
Administration:
This application has all the administrative configuration. In this application, it's where the
project it's created and the connection establishes with the source. (Figure 18)
Studio:
The studio application has all the configuration at the project level. The creation of records,
metrics, views (dashboard), all this can be done in this application (Figure 19). The studio
application allows the developer to create dashboards that would be the group of records and
metrics predefined on the project.
FIGURE 18 - INSIHT ADMIN APP

28
Clifton Clunie, Msc Thesis, 2017
FIGURE 19 - INSIGHT STUDIO APP

29
Clifton Clunie, Msc Thesis, 2017
Data Loader:
This application allows the user to set the timing of the data loader. Insight does an ETL to
extract data from the TotalAgility database and load in the Insight project database, in this
way the tool manages better the data and quicker. The data loader has a lot of options that
allows the user to manage the data (Figure 20).
Themes and Formats:
This section manages all the themes that are going to be shown on the dashboard. Formats
are also managed here; the user can define combination of profiles so they can have a
conjunction of themes and formats (Figure 21).
FIGURE 20 - INSIGHT DATA LOADER APP

30
Clifton Clunie, Msc Thesis, 2017
2) Connection with different Data Sources
The connections that can be made in the tool are database relations. One important fact
is that a record can be placed as a data source (Figure 22).
FIGURE 22 - INSIGHT DATA SOURCE CONNECTIONS
3) Creation of Reports
For the creation of the reports, it is necessary to create a project. Reporting is an option that
gives you the insight but it is a self-generated report that is sent by email.
FIGURE 21 - INSIGHT THEME AND FORMATS APP

31
Clifton Clunie, Msc Thesis, 2017
These are reports that are sent by email. For lack of configuration at the level of the mail
server, this task could not be performed.
4) Creation of Dashboard:
Once you have the project created you proceed to create the SQL statements for the metrics and the
records they are going to be shown on the view (dashboard). The developer can create records and
metrics (Figure 23).
5) Share Reports/Dashboards:
The dashboards that are created, are placed in view application. This tool allows the
visualization of the dashboards. To have access to this dashboard, the user must be Kofax
Total Agility user (Figure 24).
FIGURE 23 - INSIGHT CREATION OF DASHBOARD

32
Clifton Clunie, Msc Thesis, 2017
FIGURE 24 - INSIGHT VIEW PREVIEW
33
Clifton Clunie, Msc Thesis, 2017
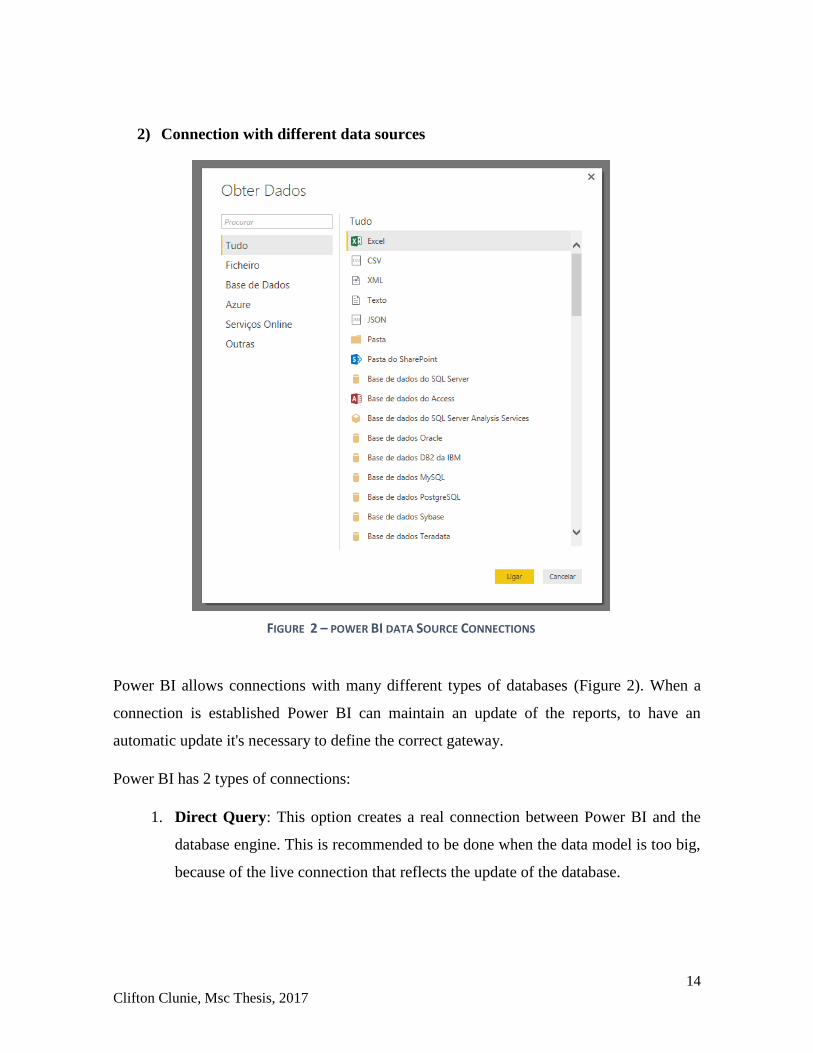
Other functionalities:
When Insight creates a query, this query behaves like a table, allowing the developer to do
relationships with this query with other queries or tables (Figure 25). This is a very flexible
option offer by Insight Analytics., in this way the forms can be quicker since it's not necessary
to load all the table, but only the fields that are included on the query. This is an advantage
offer by Insight Analytics.
Insight allows you to test SQL queries that are created. If there is an error, you can debug
this error before constructing the report and you can find the source of the error. It also allows
manual modifications of queries at the SQL level (Figure 26).
Insight Analytics allows you to test the queries that are created, the developer can check it
the relationships are correctly established (Figure 27).
If an error appears, Insight allows you to see how the SQL is built for validation by the user.
FIGURE 25 -QUERY

34
Clifton Clunie, Msc Thesis, 2017
One of the discover that where done on the learning process of Insight Analytics, is that
project KAFTA developed by KOFAX. Is a project that shows all the processes that are
running on the KTA Environment. The project shows all the information regardless the user
permission.
The authentication set with Total Agility database allows running this query to only shows
the information that the user can see regarding the users’ permission defined on the groups.
FIGURE 27 - TEST QUERY
FIGURE 26 - SQL TEST QUERY

35
Clifton Clunie, Msc Thesis, 2017
SQL used to update the dashboard:
SELECT CONVERT(VARCHAR(99), RESOURCE_ID,2) FROM AW_LOGGEDON_USER WHERE
SESSION_ID = CONVERT(binary(16),'<session_id>',2)
4.1.3. Other Information:
Power BI:
PowerBI allows a lot of type of data source like database, excel files, CSV files, SharePoint,
etc.
Power BI Pro is a paid version that gives more options for developers. This version allows
creating more complex reports. Power BI Pro also has a certain option that only works with
this version, like the Direct Query connection that only works with Power BI Pro.
Power BI also allows to share reports by an Azure application, the user can create a .NET
application and link the Power BI app with an application that allows managing the token of
the Azure with the Power BI app. With the access of tokens, the user would be able to share
the reports through the application.
Power BI Pro gives the option to the user to interact with the dashboard by using Cortana,
Cortana is the artificial personal assistance of Microsoft. The user only by inserting normal
questions in human language can query information from the dashboard. Cortana can
interpret the human language and transform into machines language, showing the request in
graphics.
Insight:
Kofax Insight allows a different kind of authentication. Authentication set by windows
Active Directory, Insight Admin or Kofax Total Agility user group.
Depending on the license of the platform the user can create and alter the dashboard. Can
also create a new project and develop their own dashboards.
A very important detail that has not to be forgotten is that the KAFTA is only going to show
the data of the KTA server that have been running the Reporting services, this service is
36
Clifton Clunie, Msc Thesis, 2017
running on the KTA server and it's doing an ETL of the data of this server to the Insight
Server.
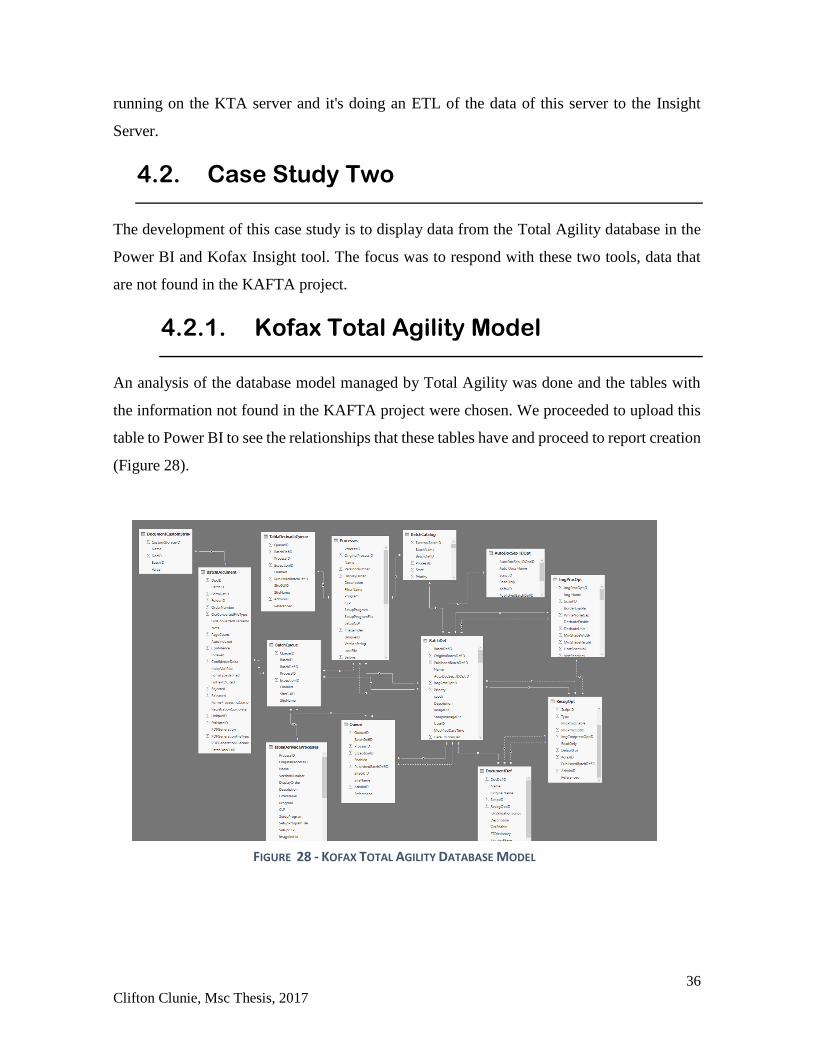
4.2. Case Study Two
The development of this case study is to display data from the Total Agility database in the
Power BI and Kofax Insight tool. The focus was to respond with these two tools, data that
are not found in the KAFTA project.
4.2.1. Kofax Total Agility Model
An analysis of the database model managed by Total Agility was done and the tables with
the information not found in the KAFTA project were chosen. We proceeded to upload this
table to Power BI to see the relationships that these tables have and proceed to report creation
(Figure 28).
FIGURE 28 - KOFAX TOTAL AGILITY DATABASE MODEL

37
Clifton Clunie, Msc Thesis, 2017
4.2.2. Power BI
A set of reports was built interactively as data found in the main Total Agility database.
The following report shows a graphical set of information about the processes that have been
executed in the KTA environment. Displays on a bar graph the total number of executed
processes. It also has a graph that shows the comparison of the type of document that has
been executed in these processes. You can see a table that shows the detail of the process
information (Figure 29).
FIGURE 29 - POWER BI PROCESS & BATCH INFORMATION

38
Clifton Clunie, Msc Thesis, 2017
In this report, you can see a detail of the documents that have been processed. You can see
in a graphic set general information of the execution of documents such as rejected
documents, those that have been released, etc. Also, has a table with the detail information
of the documents (Figure 30).
This report shows all the processes that have gone through the Kofax Queue. It also shows
all Queue processes that have been executed. The table at the bottom shows a detail of the
execution of the processes (Figure 31).
FIGURE 30 - POWER BI DOCUMENT INFORMATION

39
Clifton Clunie, Msc Thesis, 2017
This report adds more information about the processes found in the Queue. Displays the
number of processes and the state of the processes. In the table, you can see the detail of the
information (Figure 32).
FIGURE 32 - POWER BI BATCH DETAILS
FIGURE 31 - POWER BI QUEUE INFORMATION

40
Clifton Clunie, Msc Thesis, 2017
4.2.3. Kofax
In this report, we can see general information of the Kofax Total Agility database,
information about the Documents, Pages, Session Duration, and batch Session. This is an
overview of the information that is accessible through this dashboard.
This dashboard shows an overview of the information that could be obtained from the main
KTA database. This dashboard shows information of the documents, the number of pages
that have been extracted, the sessions and a detail of the execution of the processes (Figure
33).
FIGURE 33 - KOFAX TOTAL AGILITY OVERVIEW INSIGHT VIEW

41
Clifton Clunie, Msc Thesis, 2017
This dashboard shows information from the pages of the documents that have been extracted.
Which are the modules that have had more page processing and users who have interacted
with the larger volume of documents pages. It also has a table with the detail of the process.
(Figure 34).
This dashboard displays information about the processes that are running. You can see a
graph that compares the actions with the runtime. The time each user has in the execution of
the process and the number of processes that are active against the non-active ones. The table
on the right shows a detail of the processes (Figure 35).
Figure 34 - PAGES INFORMATION
Figure 35 - BATCH INFORMATION

42
Clifton Clunie, Msc Thesis, 2017
This dashboard displays information on processes that have been deleted. It also shows a
comparison of the number of processes that perform some document export. In the table, you
can see the detail of the process information (Figure 36).
This dashboard displays information about the modules that are active in the KTA. It has a
graph with the number of active users and the duration of your session. It shows the number
of fields that have been extracted and a table with the detail of this information (Figure 37).
FIGURE 36 - BACTH DETAIL
FIGURE 37 - MODULE INFORMATION

43
Clifton Clunie, Msc Thesis, 2017
5. Bancolombia Client
The client needs a tool that would allow overseeing the Kofax running process.
With this need, the installation of the Kofax Insight tool was done on the client. The client
doesn't have any Business Intelligence tool, and because of this, the best fit to show analytical
reports was the Kofax Insight tool.
The KAFTA project is a package created by Kofax that has already a set of dashboards, these
dashboards show all the information related to the process running on the Kofax Total Agility
platform. The KAFTA project was configured on the client. The first action was to check the
prerequisites that are the server roles at the IIS (Figure 38). Kofax has an installation guide
that explains step by step how the installation should be done.
The next step is to check the SQL permissions. The user to be used for the Insight installation
(Figure 39) must have the public and sysadmin roles. Also, this user must have the user
mapping on the Total Agility databases, the same database that will be used in the KAFTA
project.
FIGURE 38 - IIS
FIGURE 39 - KOFAX INSIGHT INSTALLATIONFIGURE 40 - IIS

44
Clifton Clunie, Msc Thesis, 2017
With all this information set, we proceed for the installation. The installation can be between
30 min to 45 depending on the hardware of the server.
Once the installation has been done, next step is to set the license of the Insight and finally
proceeds to start the KAFTA configuration. (Figure 40).
FIGURE 41 - KOFAX INSIGHT INSTALLATION
FIGURE 42 - LICENSE

45
Clifton Clunie, Msc Thesis, 2017
Insight Analytics allows different types of authentication. The configuration that was done
on the client was the authentication by KTA. The user can access to the KTA platform and
click on the button to see the dashboard of the KAFTA project.
To achieve this, it is necessary to choose the HTTP Request and External Database option
(Figure 41) and set some SQL on the user mapping of the Insight Analytics tools (Figure 42).
FIGURE 43 - KTA AUTHENTICATION
FIGURE 44 - USER MAPPINGFIGURE 45 - KTA AUTHENTICATION
FIGURE 46 - USER MAPPING

46
Clifton Clunie, Msc Thesis, 2017
Kofax Reporting Services gives system administrators, business process managers, and other
stakeholders’ important information about Kofax managed business processes. This product
serves as the single conduit across many Kofax products, providing centralized storage of
historical operational metrics and audit data (Figure 43). It’s important to say that this service
must be configured with administration permissions.
This service oversees the ETL. When an Insight Analytics project it’s created, it creates a
project database. This service populates the reporting database. This database already has all
the summary of the KTA process and the main information of the process that can be
displayed on dashboard/report.
The timing of the ETL can be change, depending on the user need (Figure 44).
FIGURE 47 - SERVICES
FIGURE 48 - KTA SYSTEMS TASKS

47
Clifton Clunie, Msc Thesis, 2017
With all these steps configured, the next steps it’s to link the KTA with the Insight Analytics
Server. For this it’s necessary to put the Insight server information in KTA (Figure 45).
When all the steps above are executed, the KAFTA configuration is done. For this, the user
must import the KAFTA project to the Insight Analytics environment.
When the KAFTA project has been imported. It’s necessary to update the consolidate file
with the information of the environments (Figure 46). The KAFTA project is going to read
the configuration of this file.
FIGURE 49 - INSIGHT CONFIGURATION
FIGURE 50 - CONSOLIDATED FILE

48
Clifton Clunie, Msc Thesis, 2017
With all this information set up, the KAFTA project is ready to run. The next section is
going to explain the dashboard of the KAFTA project.
KAFTA Project
This is the main dashboard, it is a dashboard with a general information that shows us the
activities that have been completed today. Several activities found in the Queue, the number
of documents and pages being processed. It also shows who is responsible for each of those
activities and the activities that have been completed (Figure 47).
This dashboard shows all documents that have been rejected. It shows a detail information
about the operator and which document, process, and activities are running (Figure 48).
FIGURE 51 - KAFTA OVERVIEW
FIGURE 52 - DOCUMENT REJECTED

49
Clifton Clunie, Msc Thesis, 2017
This dashboard shows all the complete time of the users that are using the KTA platform. It
has a graphical comparison that shows the longest time and the shortest usage time. It also
has a total amount of time for each activity that has been executed in the KTA (Figure 49).
This dashboard shows the cost information that exists per activity and the cost that exists per
KTA user (Figure 50).
FIGURE 53 - OPERATOR TIME
FIGURE 54 - OPERATOR & ACTIVITY COSTS

50
Clifton Clunie, Msc Thesis, 2017
This dashboard displays information about the user session time. If goals are defined at the
process, this dashboard is going to show if the goal of the session time was achieved or not
(Figure 51).
This dashboard shows the status of the processes that have been created. Shows the number
of processes that exists with high priority and a total of processes that have been executed
(Figure 52).
FIGURE 55 - SESSION TIME
FIGURE 56 - PROCESS STATUS AND PRIORITIES

51
Clifton Clunie, Msc Thesis, 2017
This dashboard shows an overview of activities that have already been completed. It also
shows the execution time and the user average task time (Figure 53).
When a classification of a document is made in a process, this classification is obtained by
an analytics activity, so the analytics can show this information. The first table allows drill
down where you can see the origin (Figure 54).
FIGURE 57 - ACTIVITIES RESUME
FIGURE 58 - DOCUMENTS CLASSIFCATION

52
Clifton Clunie, Msc Thesis, 2017
This dashboard shows an overview of the processes that are running. You can see the process
time vs. the average cost time (Figure 55).
This dashboard displays the information that is obtained from the user accessing the KTA
platform. The dashboard displays the session time and the activities time that have been
executed (Figure 56).
FIGURE 59 - PROCESS RESUME
FIGURE 60 - OPERATOR RESUME

53
Clifton Clunie, Msc Thesis, 2017
This dashboard displays the result of the extraction activity. It can be seen a comparison of
the extracted data with the data that has been validated, this allows to detect errors and make
improvements. It has a graph that shows the result of fields modified by the process and a
table with the detail of the fields that have been modified (Figure 57).
This dashboard shows the comparison that has the data that have been extracted, with the
data that have been validated. It shows in the table the percentage of the processes that have
undergone modifications and in a graph which are the fields that have undergone changes
(Figure 58).
FIGURE 61 - EXTRACTION DETAIL
FIGURE 62 - EXTRACTION GRAPHIC INFO

54
Clifton Clunie, Msc Thesis, 2017
This dashboard shows all the information of the Jobs, shows the information of the Jobs that
are active in the KTA queue and a history of all the Jobs that have been executed. Also, has
a graph that allows to see the comparison of which jobs have been most executed in the KTA
environment (Figure 59).
This dashboard shows a summary of which are the numbers of Jobs that has been started by
KTA users. And it shows a summary of all the activities that have been executed at the level
of Jobs and processes. Also, shows what are the activities that are in the queue (Figure 60).
FIGURE 63 - PROCESS EXECUTION
FIGURE 64 - ACTIVITIES DETAILS
55
Clifton Clunie, Msc Thesis, 2017
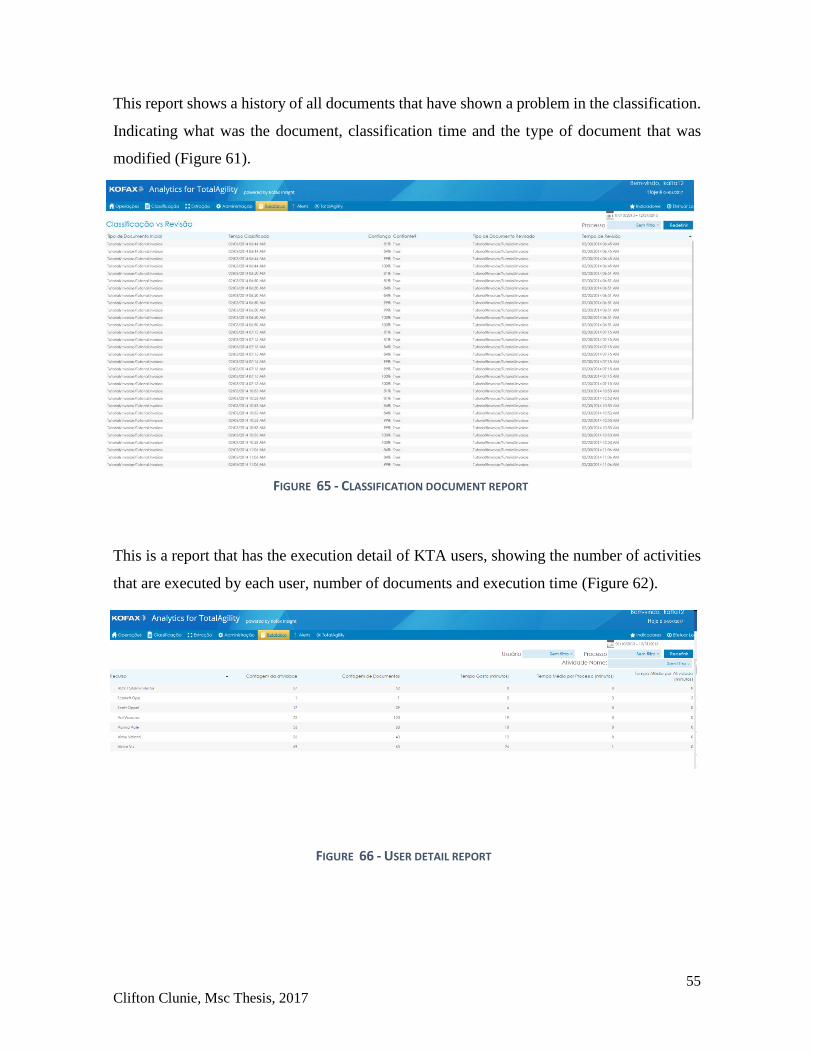
This report shows a history of all documents that have shown a problem in the classification.
Indicating what was the document, classification time and the type of document that was
modified (Figure 61).
This is a report that has the execution detail of KTA users, showing the number of activities
that are executed by each user, number of documents and execution time (Figure 62).
FIGURE 65 - CLASSIFICATION DOCUMENT REPORT
FIGURE 66 - USER DETAIL REPORT

56
Clifton Clunie, Msc Thesis, 2017
6. Liberty Client
Liberty is an insurance company that now don't have any business intelligence tools. They
have some metrics that are generated by a company each month. These metrics are shown in
a pdf so that they can see a global view of the business in this document, they are not able to
see the real-time data and historical data.
They want to see information about the Kofax platform but, the information that they were
requesting doesn't respond with KAFTA project. In this scenario, the Power BI was shown
as an option for analytical, where they can see the actual data and historical data.
Next, it shows the dashboard that was developed with Power BI tool.
We created 3 sample tables to develop these reports. The reports are focused on the insurance
area related to car accidents and how the insurance must intercede with its subscribing
companies that provide repair services.
In this first report, the user can see the amount of "supplier" that enters Liberty throughout
the year, you can also know the territorial location of the suppliers. Detailed information on
suppliers can be found in the table (Figure 63).
FIGURE 67 - SUPPLIERS INFORMATION

57
Clifton Clunie, Msc Thesis, 2017
This report shows the number and type of processes that have been executed in KTA. It also
shows information about the execution processes throughout the year and you can see which
are the users who have started the process and the users who have had to intercede in the
process (Figure 64).
In this report, the detail of the extraction behavior of the fields of the documents being
processed, can be seen. Makes a comparison with values that have undergone some alteration
with the others that have not had to be altered. Displays a graphic with all the variables
(Figure 65).
FIGURE 68 - PROCESS EXECUTION

58
Clifton Clunie, Msc Thesis, 2017
In this report, we can see the detail of the extraction behavior of the fields of the documents
being processed. Making a comparison with values that have undergone some alteration with
the others that have not had to be altered. It compares all the invoice details (Figure 66).
FIGURE 69 - EXTRACTION FIELD
FIGURE 70 - INVOICE DETAILS

59
Clifton Clunie, Msc Thesis, 2017
In this report, we can see the detail of the extraction behavior of the fields of the documents
being processed. Making a comparison with values that have undergone some alteration with
the others that have not had to be altered. It compares all the net amount details (Figure 67).
FIGURE 71 - NET AMOUNT DETAILS

60
Clifton Clunie, Msc Thesis, 2017
In this report, we can see the detail of the extraction behavior of the fields of the documents
being processed. Making a comparison with values that have undergone some alteration
with the others that have not had to be altered. It compares all the tax amount details
(Figure 68).
FIGURE 72 - TAX AMOUNT DETAIL

61
Clifton Clunie, Msc Thesis, 2017
In this report, we can see the detail of the extraction behavior of the fields of the documents
being processed. Making a comparison with values that have undergone some alteration with
the others that have not had to be altered. It compares all the tax rate details (Figure 69).
FIGURE 73 - TAX RATE DETAILS

62
Clifton Clunie, Msc Thesis, 2017
In this report, we can see the detail of the extraction behavior of the fields of the documents
being processed. Making a comparison with values that have undergone some alteration
with the others that have not had to be altered. It compares total details (Figure 70).
FIGURE 74 - TOTAL DETAILS

63
Clifton Clunie, Msc Thesis, 2017
Results and contributions
It was possible to know and learn, how it is used and how to create analytical reports on
Power BI and Kofax Insight.
You could see the strength of each of the tools and which can be better adapted depending
on the client needs.
The results were a full domain in both tools, allowing this implementation in a client and the
development of a demo for presentation.
This is a big achievement for Latourrette Consulting, opening new windows for projects and
clients and puts the Latourrette company as a competitor of other companies that develops
business intelligence reports.
Latourrette has no experience in BI area, with the knowledge that was acquired, my
contribution as part of the Latourrette team is to improve what exists in this area to get a more
opportunities on the BI area.
This contributes to the growth of the company; more clients are more projects and jobs.
More financial entry to the company allows hiring more human resources, offering a
position on the company and growing the Latourrette family.

64
Clifton Clunie, Msc Thesis, 2017
7. Conclusion
Companies collect a lot of data; this data consists of sensitive information of the companies
like business operation and strategies. Sometimes it’s hard for the end user to process and
understand all this data, in most of the scenarios are raw data.
Interpretation and analysis of this data provide valuable Insight into the business operations.
This information can help to improve different areas of the companies and improve the
process, reduce cost and create business opportunities.
Business Intelligence is the identification and analysis of company’s data. Business
intelligence is defined by research as a set of methodologies, processes, architecture, and
technologies.
Business Intelligence is the identification and analysis of company’s disparate data to extract
meaningful information for a more effective decision. Business intelligence uses as a set of
methodologies, processes, architecture, and technologies that transform raw data into
meaningful and useful information used to enable more effective strategic, tactical and
operational insight.
This information is available for the user at any time. And most of this process runs automatic
so the end user doesn’t depend on a human job to have this information updated. The end
user can receive this information, via email, through an application, pdf format, excel format.
etc. even the user can access the system and do a refresh to see the last instance of the data.
Analytics gives all the information of the business to the chief executive so can have a global
idea of the business.
65
Clifton Clunie, Msc Thesis, 2017
8. Future Work
Different adaptations to the Business Intelligence tools has been left because of different
things like real data and time-consuming.
On future work would be to improve the tools that are offered by Kofax, and the others tools
that have been developed by LC.
1. It could be a good solution to optimize the reports offered by Kofax, with a custom
version offered by Latourette.
2. A definition of an ETL to other projects that don't use KAFTA.
3. See most bugs that the actual Insight Version has and reported to Kofax, so the next
version would be an improvement of the quality of the other one.
4. With Latourrette and Microsoft partnership, see the option to create OLAP cubes with
Microsoft Server Analysis for a better use of the BI tools.

66
Clifton Clunie, Msc Thesis, 2017
9. Bibliography
Aiim. (2017). Aiim Home. Obtenido de http://www.aiim.org/
Azure, M. (2017). Microsoft . Obtenido de Azure: https://azure.microsoft.com/es-es/
BigData. (2016-2017). Business Intelligence . Obtenido de Top Business Intelligence :
http://bigdata-madesimple.com/top-business-intelligence-bi-tools-in-the-market/
Data, S. B. (3 de January de 2017). Youtube. Obtenido de
https://www.youtube.com/watch?v=2aTt1U2Y0Oo
Essential, K. (s.f.). Kofax. Obtenido de Smart Process Application:
http://www.kofax.com/smart-process-application-platform
Hart, M. (20 de July de 2017). Microsoft. Obtenido de PowerBI:
https://powerbi.microsoft.com/en-us/documentation/powerbi-service-tips-and-
tricks-for-power-bi-map-visualizations/
Inc, K., & Kofax. (2017). Kofax. Obtenido de Smart Process Application:
http://www.kofax.com/smart-process-application-platform
Inc, V. (2017). Visioneer. Obtenido de One Touch: http://www.visioneer.com/onetouch/
Information, S. (22 de April de 2014). Youtube. Obtenido de
https://www.youtube.com/watch?v=mcnCEWQMwBY
Iseminger, D. (24 de July de 2017). Microsoft. Obtenido de Power BI:
https://powerbi.microsoft.com/en-us/documentation/powerbi-desktop-use-
directquery/
Iseminger, D. (6 de June de 2017). Power BI. Obtenido de Dax Functions:
https://powerbi.microsoft.com/en-us/documentation/powerbi-desktop-quickstart-
learn-dax-basics/
Kofax. (2014). TotalAgility. Obtenido de http://www.kofax.com/downloads/datasheets/ds-
kofax-totalagility-7-en.pdf
Kofax. (s.f.). Kofax Transformation Module. Obtenido de 2015:
http://www.kofax.com/~/media/Files/Kofax/Datasheets/ds-kofax-transformation-
modules-en.pdf
Kofax, A. (2017). Kofax Analytics for Total Agility. Obtenido de
http://www.kofax.com/business-intelligence-analytics
Kofax, C. (2017). Kofax. Obtenido de Capture for Analytics:
http://www.kofax.com/analytics

67
Clifton Clunie, Msc Thesis, 2017
Latourrette. (2017). Latourrette Consulting. Obtenido de Latourrette Consulting:
http://www.latourrette-consulting.com/en/about-us/
Linkedin. (2016). Linkedin Videos. Obtenido de Linkedin Power BI:
https://www.linkedin.com/learning/topics/power-bi
Microsoft. (2017). Microsoft. Obtenido de Partner- Sharepoint:
https://products.office.com/es-es/sharepoint/collaboration
Microsoft. (2017). Microsoft. Obtenido de Power BI: https://powerbi.microsoft.com/es-es/
Microsoft. (2017). Microsoft. Obtenido de Office: https://support.office.com/en-
us/article/QuickStart-Learn-DAX-Basics-in-30-Minutes-51744643-c2a5-436a-bdf6-
c895762bec1a
Microsoft. (2017). Power BI. Obtenido de https://powerbi.microsoft.com/es-es/features/
Overview, T. (15 de November de 2016). Youtube. Obtenido de
https://www.youtube.com/watch?v=eHbEkAxnYSQ
Sharepoint. (2017). Microsoft. Obtenido de Sharepoint: https://products.office.com/es-
es/sharepoint/collaboration
SQL, S. (2017). Microsoft. Obtenido de Sql Server: https://www.microsoft.com/es-es/sql-
server/sql-server-2016
Visioneer. (2017). Visioneer Home. Obtenido de http://www.visioneer.com/en/us/
Visioneer, I. (s.f.). Xerox Scanner. Obtenido de 2017:
http://www.xeroxscanners.com/en/us/
Wikipedia. (12 de April de 2017). OLAP. Obtenido de BI:
https://es.wikipedia.org/wiki/OLAP
Wikipedia. (13 de May de 2017). Wikipedia. Obtenido de Microsoft .NET:
https://es.wikipedia.org/wiki/Microsoft_.NET
WIkipedia. (13 de May de 2017). Wikipedia. Obtenido de Microsoft .NET:
https://es.wikipedia.org/wiki/Microsoft_.NET