PORT OF MIAMI TUNNEL PROJECT 1 FDOT& MAT Presentation FDOT & MAT Presentation.

www.portofmiamitunnel.com www.portofmiamitunnel.com
PROJECT OVERVIEW
PORT OF MIAMI
TUNNEL
10/23/12

www.portofmiamitunnel.com
• Provide a direct connection
between the Seaport, Airport
and the Interstate Highway
System
• Maintain PortMiami as the
county’s second leading
economic generator
• Relieve congested downtown
Miami streets of Port passenger
and cargo traffic, improving
safety as trucks also traverse
areas of pedestrian activity
• Facilitate ongoing and future
development plans in and
around downtown Miami
American Airlines Arena Bayside Marketplace
PROJECT BENEFITS

www.portofmiamitunnel.com
SCOPE OF WORK
Shifting of EB
MacArthur Cswy MacArthur Cswy
Bridge Widening
Twin tunnels under
Government Cut
Modification of Dodge
Island Roadway System
www.portofmiamitunnel.com
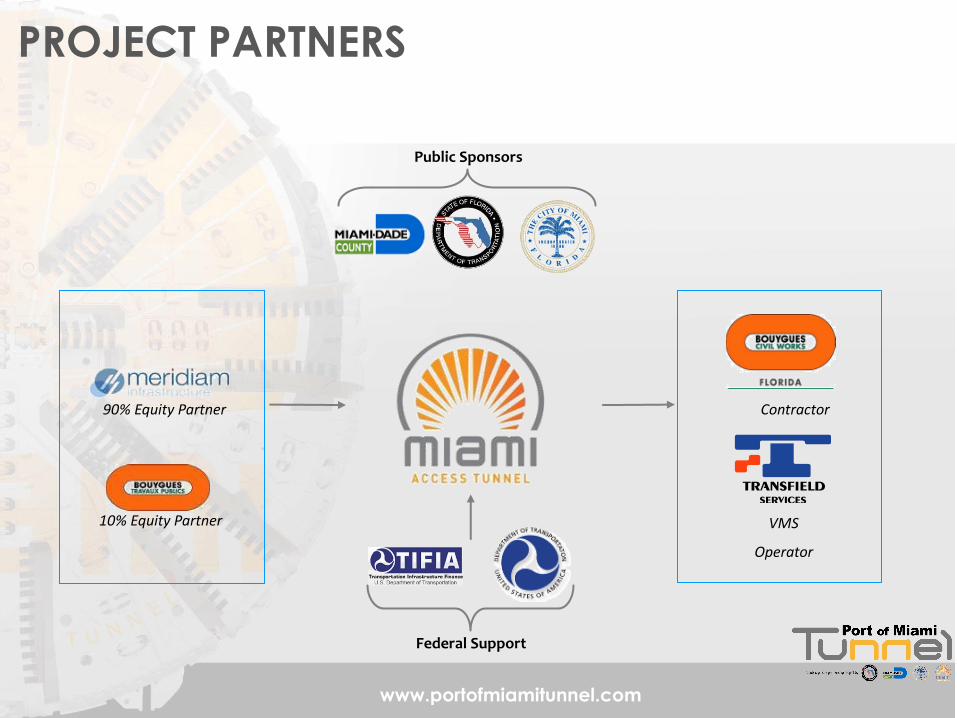
90% Equity Partner
10% Equity Partner
Contractor
VMS
Operator
Public Sponsors
Federal Support
PROJECT PARTNERS

www.portofmiamitunnel.com
• FDOT contributing 50% of capital cost
• Miami-Dade County contribution $402.5M
(including right-of-way costs)
• City of Miami contribution $50M
(including right-of-way costs)
• FDOT fully funding Tunnel Operations & Maintenance
from statewide maintenance funds
PUBLIC FUNDING PARTNERS

www.portofmiamitunnel.com
Construction Cost $607M
• $100M during Construction consisting of 4 defined milestone
payments:
1st Milestone - $20m – Tunnel Design Complete (Paid)
2nd Milestone - $40m – TBM at work in 1st Bore (Paid)
3rd Milestone - $25m – TBM at work in 2nd Bore
4th Milestone - $15m – Substantial Completion of MacArthur Causeway
• $350M at Final Acceptance of Construction
Total Milestone Payments = $450M
OVERVIEW OF PAYMENT MECHANISM DURING CONSTRUCTION

www.portofmiamitunnel.com
• Manufactured in Germany, approximate cost $45M • Arrived June 23, 2011 and came in several pieces (75
regular cargo, 20 containers and 19 heavy haul pieces). • It took 4 months for re-assembly including testing and commissioning. • Shield consists of 6 pieces
• Trailing gear is comprised of 6 gantries
TUNNEL BORING MACHINE (TBM) ASSEMBLY

www.portofmiamitunnel.com
• TBM cutter head with an outside diameter of 42.3 feet (as high as a 4 story building)
• 361 foot long trailing support gear made up of 6 gantries
• Total length of the TBM is 428.5 feet long (more than a football field).
Tunnel Boring Machine (TBM)

www.portofmiamitunnel.com
• The cutter head rotates and bores out the underground area.
• The trailing gear contains the electrical, mechanical and guidance
systems and additional support equipment.
• Excavated material is carried back on a conveyor belt and
deposited outside the tunnel entrance.
• Once the TBM moves forward it installs a precast concrete liner in
place that becomes the finished wall of the tunnel.
• Once the liner is in place, grout is pumped into the space between the liner and the excavated area to seal the tunnel in place.
TUNNEL BORING MACHINE (TBM) HOW DOES IT WORK?

www.portofmiamitunnel.com
• 12,000 Segments
• 8 Segments per Ring
• Each segment weighs 12.2 Metric Tons
• Ring installation time 60-75 minutes
• 12-16 persons in TBM & 12-14 on Surface
• TBM operates 24 hrs/day, 7 days a week
– 20 hrs/day production (alternating between
mining and ring building)
– 4 hrs/day maintenance
FEEDING THE TBM
www.portofmiamitunnel.com
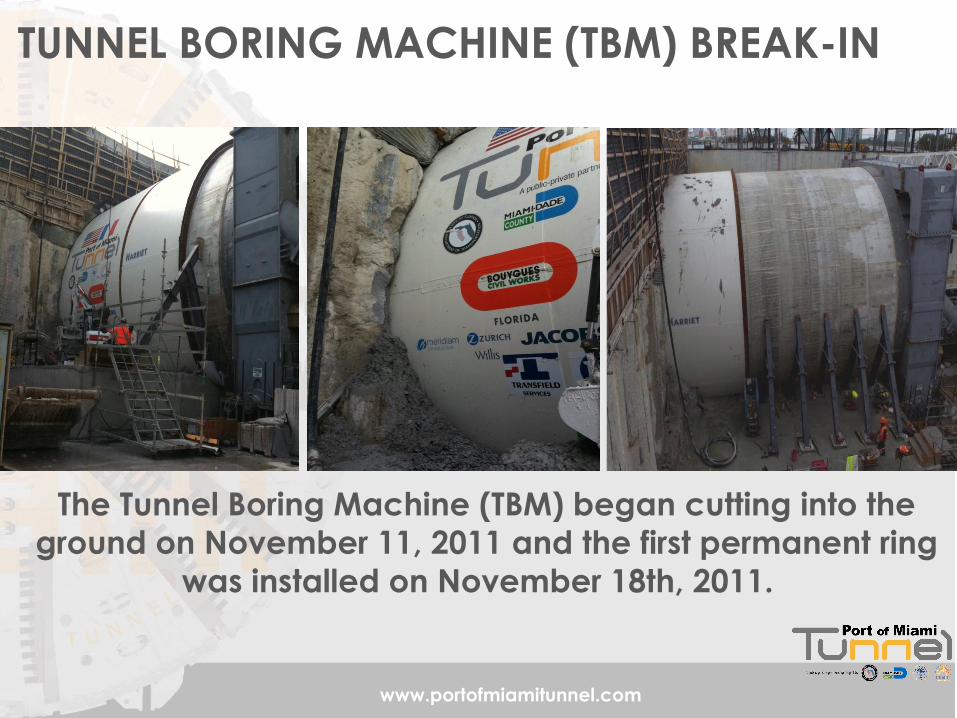
The Tunnel Boring Machine (TBM) began cutting into the
ground on November 11, 2011 and the first permanent ring
was installed on November 18th, 2011.
TUNNEL BORING MACHINE (TBM) BREAK-IN
www.portofmiamitunnel.com
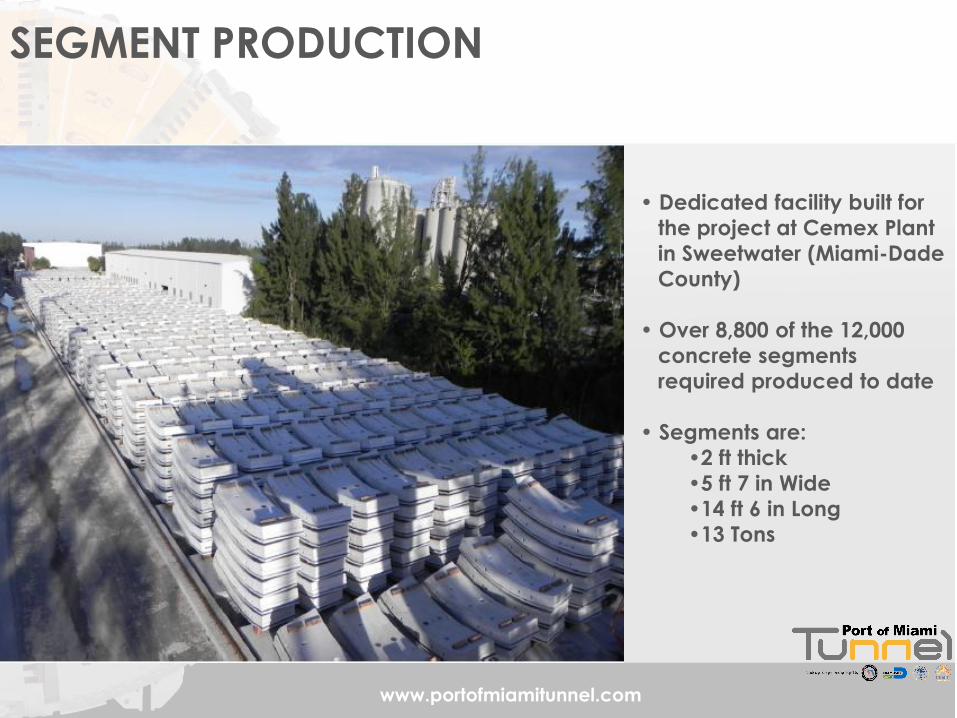
• Dedicated facility built for
the project at Cemex Plant
in Sweetwater (Miami-Dade
County)
• Over 8,800 of the 12,000
concrete segments
required produced to date
• Segments are:
•2 ft thick
•5 ft 7 in Wide
•14 ft 6 in Long
•13 Tons
SEGMENT PRODUCTION
www.portofmiamitunnel.com
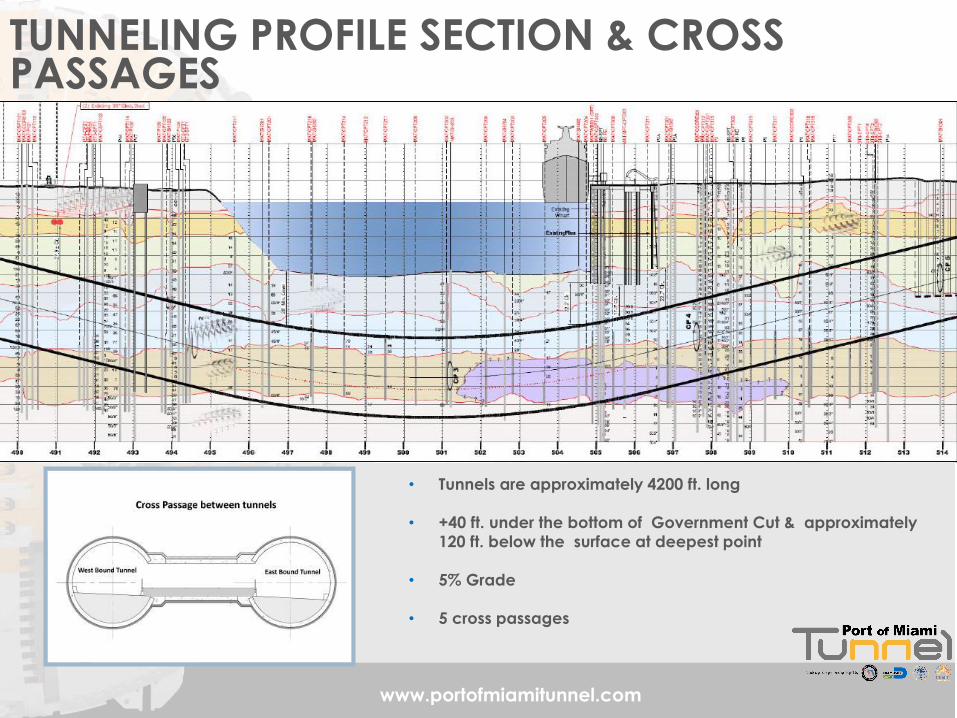
TUNNELING PROFILE SECTION & CROSS PASSAGES
• Tunnels are approximately 4200 ft. long
• +40 ft. under the bottom of Government Cut & approximately
120 ft. below the surface at deepest point
• 5% Grade
• 5 cross passages
www.portofmiamitunnel.com
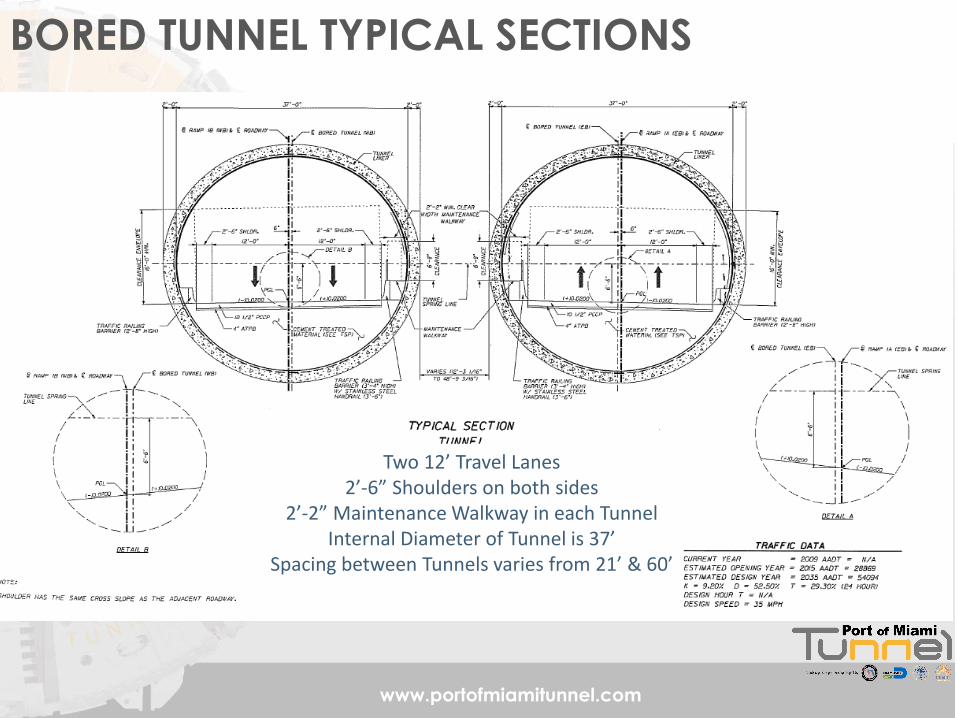
BORED TUNNEL TYPICAL SECTIONS
Two 12’ Travel Lanes 2’-6” Shoulders on both sides
2’-2” Maintenance Walkway in each Tunnel Internal Diameter of Tunnel is 37’
Spacing between Tunnels varies from 21’ & 60’
www.portofmiamitunnel.com
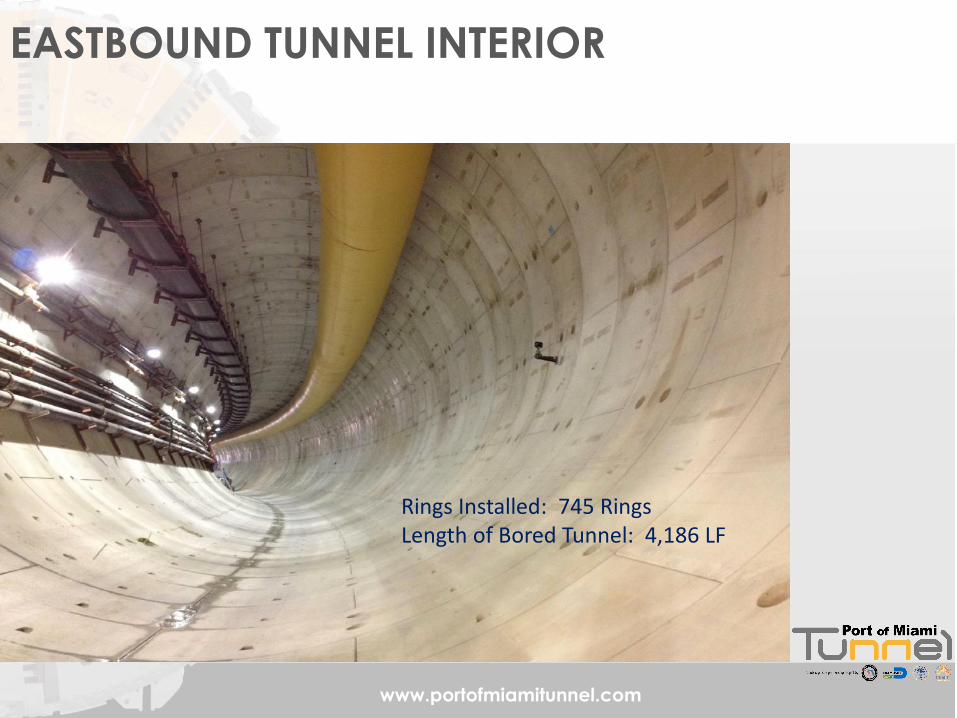
EASTBOUND TUNNEL INTERIOR
Rings Installed: 745 Rings Length of Bored Tunnel: 4,186 LF

www.portofmiamitunnel.com
• TBM Breakout
7/31/12 on
Dodge Island
TBM EASTBOUND TUNNEL BREAKOUT
www.portofmiamitunnel.com
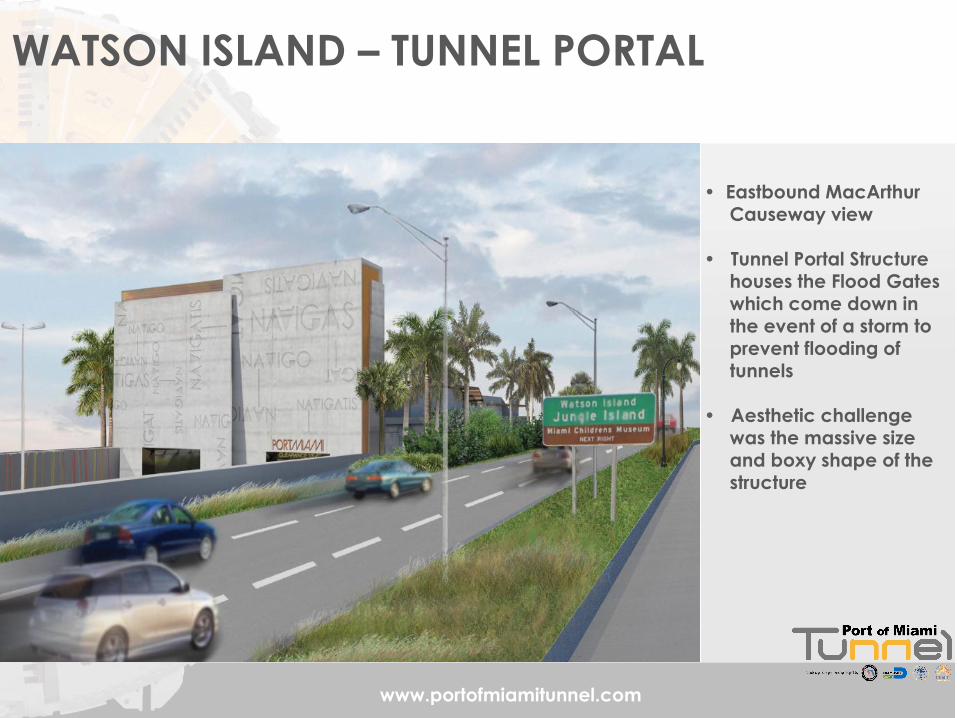
• Eastbound MacArthur
Causeway view
• Tunnel Portal Structure houses the Flood Gates which come down in the event of a storm to
prevent flooding of tunnels
• Aesthetic challenge was the massive size and boxy shape of the
structure
WATSON ISLAND – TUNNEL PORTAL

www.portofmiamitunnel.com
PUBLIC-PRIVATE PARTNERSHIP OVERVIEW
• Project structured as a P3 (1st availability payment procurement in the U.S.)
• Concessionaire will design, build, finance, operate and maintain (DBFOM) tunnel for 35 years
• Design and construction - first 55 months
• Operation and maintenance - remaining 30 years and 5 months through facility hand-back
• No tolls unlike other P3s delivered elsewhere
• Concessionaire compensated through
• Milestone payments during construction period
• Availability payments during operating period

www.portofmiamitunnel.com
• Tunnel construction and operation atypical for FDOT
• Need to share risks with contractors experienced in managing tunneling risks ; private sector innovation
• Encouraging lifecycle efficiencies requires long-term contract
• Short-term local funding , long-term work program funds
• Concern for cost overruns
• FDOT Need long-term guaranteed cost structure
• Limited Industry interest expressed for fixed-price arrangements
• Considered DB, DBOM and DBFOM project delivery
MAIN OBJECTIVES FOR P3 IMPLEMENTATION
www.portofmiamitunnel.com
• Custom-designed P3 Agreement for Unique Project
• Single-purpose facility with no tolls
• Technically challenging project
• Geotechnical risk
• Hurricanes in Miami essentially uninsurable
• First of kind in US and Florida legal system
• First Availability Payment to navigate through the FHWA major projects / federal financing process
• Optimized risk allocation with fixed 35-year overlays
ADAPTING THE AVAILABILITY PAYMENT
FRAMEWORK
www.portofmiamitunnel.com
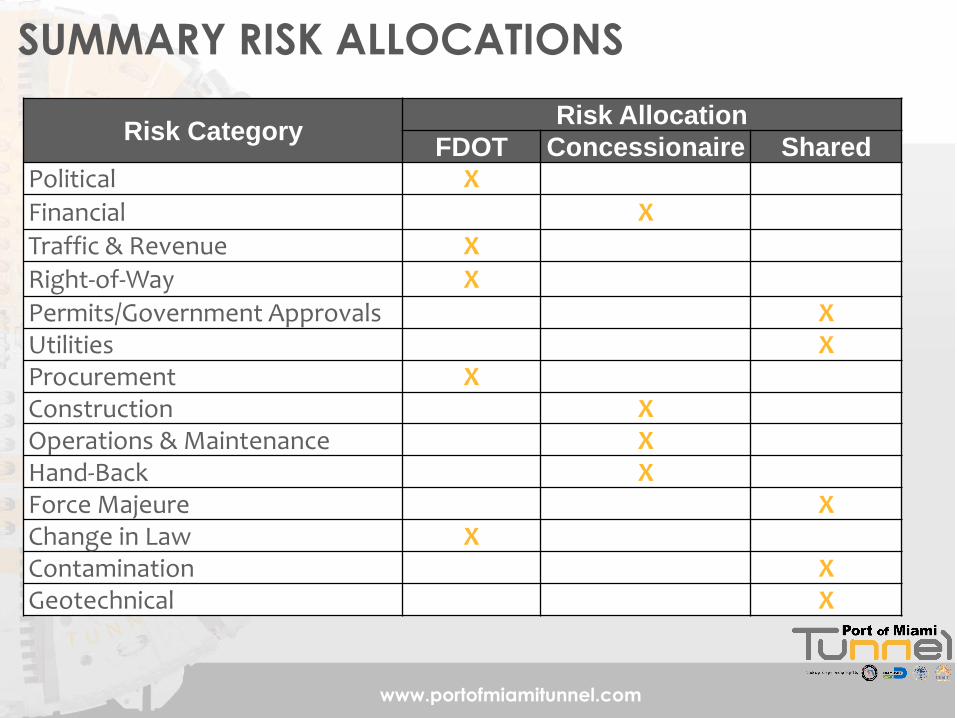
Risk Category
Risk Allocation
FDOT Concessionaire Shared
Political X
Financial X
Traffic & Revenue X
Right-of-Way X
Permits/Government Approvals X Utilities X Procurement X
Construction X Operations & Maintenance X Hand-Back X Force Majeure X Change in Law X Contamination X Geotechnical X
SUMMARY RISK ALLOCATIONS
www.portofmiamitunnel.com
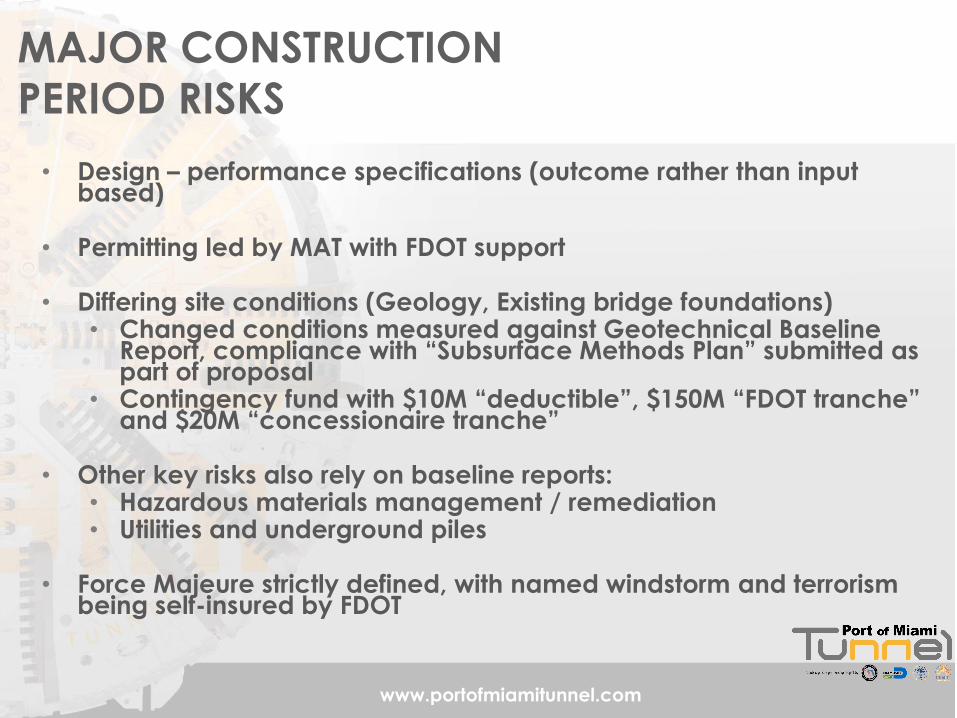
• Design – performance specifications (outcome rather than input based)
• Permitting led by MAT with FDOT support
• Differing site conditions (Geology, Existing bridge foundations) • Changed conditions measured against Geotechnical Baseline
Report, compliance with “Subsurface Methods Plan” submitted as part of proposal
• Contingency fund with $10M “deductible”, $150M “FDOT tranche” and $20M “concessionaire tranche”
• Other key risks also rely on baseline reports:
• Hazardous materials management / remediation • Utilities and underground piles
• Force Majeure strictly defined, with named windstorm and terrorism
being self-insured by FDOT
MAJOR CONSTRUCTION
PERIOD RISKS
www.portofmiamitunnel.com
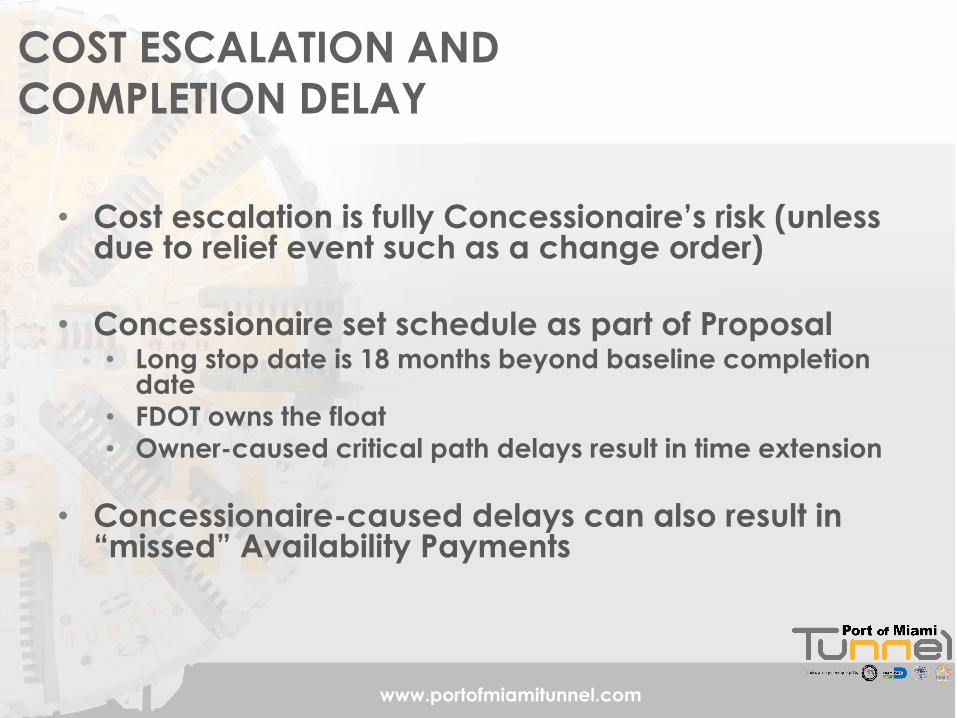
• Cost escalation is fully Concessionaire’s risk (unless due to relief event such as a change order)
• Concessionaire set schedule as part of Proposal • Long stop date is 18 months beyond baseline completion
date
• FDOT owns the float
• Owner-caused critical path delays result in time extension
• Concessionaire-caused delays can also result in “missed” Availability Payments
COST ESCALATION AND
COMPLETION DELAY

www.portofmiamitunnel.com
• Risk of O&M performance and cost of O&M and renewals essentially belongs to Concessionaire, except cases such as:
• Force Majeure
• Rectification costs
• Business interruption – inability to earn availability payment
• FDOT self-insured risks
• Shared risk via compensation formula and termination provisions
• Change in law, mandatory technical upgrades and other relief events
• Contract includes “Hand-back” requirements to ensure Tunnel is returned to FDOT in first-class condition
OPERATING PERIOD RISKS

www.portofmiamitunnel.com
PAYMENTS TO CONCESSIONAIRE
$-
$50
$100
$150
$200
$250
$300
$350
$400
2011 2012 2013 2014 2015 2016 2017 2018 2019 2020
Pay
me
nts
(in
flat
ed
Mill
ion
s $
)
Years
MAT Concessionaire Payment Structure
Final Acceptance Payment
Milestone Payments
Maximum Availability Payments350
25 15
20 + 40 19
39 40 41 43 44 45
Scheduled Substantial Completion – May 2014 Scheduled Final Acceptance – Aug 2014
2044

www.portofmiamitunnel.com
OVERVIEW OF AVAILABILITY PAYMENT MECHANISM
• Maximum Availability Payment (“MAP”) is adjusted for inflation – starts at
$32.5 million/year in 2010 dollars
• Essentially FDOT is paying pro rata for each hour of unobstructed tunnel
lane service that meets its performance criteria
• From Tunnel completion to fixed October 2044 concession end date
- built-in incentive for schedule adherence
• Includes both Capital & Operating Expenses
• Performance-based – not prescriptive (outcome vs. input-based), with
clear performance-driven targets to facilitate administration

www.portofmiamitunnel.com
• Availability Payments are calculated every quarter by itemizing all service hours for each tube to factor in potential payment reductions:
• Bank of “free closure hours” for planned routine/capital maintenance
• Incentives for timely incident response (cure periods)
Hourly Availability Payment for each tube
= 50% * Inflated MAP * ( 1 - Hourly Unavailability Factor * Time Weighting Factor ) (prorated hourly) ~ $1,850 per hour per tube at the most (in 2010 dollars)
0.10
3.00
0.0 - Tube fully operational
0.4 - Occurrence of a 1-lane
closure or a non-critical fault
1.0 - Occurrence of a 2-lane
closure or a critical fault
CALCULATING THE AMOUNT EARNED
Factor Value based on:
- Prime vs. non- prime season -Peak vs. standard day - Time of the day

www.portofmiamitunnel.com
FEDERAL PROJECT FUNDING
• Concessionaire Financial Plan includes a TIFIA loan
of $381 Million which includes accrued interest.
• FDOT coordinated with FHWA to have all contract
documents reviewed and submitted a Project
Management Plan for approval.
• FDOT obtained National Highway System Funds in the
amount of $192.5 Million to fund a portion of the
Milestones and Final Acceptance payment.
www.portofmiamitunnel.com
PROJECT AWARDS
• 2007 “PPP Project of the Year” by the American Road and Transportation Builders Association.
• 2009 Project Finance International’s Americas P3 Deal of the
Year.
• 2009 Euromoney’s Project Finance Magazine’s North American
P3 Deal of the Year and Global Deal of the Year.
• 2009 Bond Buyer’s Non-Traditional Financing of the Year (North
America).
• 2011 South Florida Chamber of Commerce – Public Outreach Award

www.portofmiamitunnel.com
July 31, 2012 – Completion of eastbound tunnel
Spring 2013 – Completion of westbound tunnel
Spring 2014 – Completion of Dodge Island roadway improvements
May 14, 2014 – Substantial Completion - Port of Miami Tunnel opens to traffic, O&M Period begins
August 14, 2014 – Final Completion
As of 10/23/12 - Construction Days to Date: 1105 of 1765 (55 months) = 63% of Design-Build
PROJECT SCHEDULE
www.portofmiamitunnel.com
THANK YOU!

www.portofmiamitunnel.com
Questions? For additional project information,
please visit our website at:
www.portofmiamitunnel.com
Project Videos & Gallery