
Project Number: 658789
45
1 Project Number: 658789 1 Project Acronym: BIDAMARK Project title: BIg DAta-driven MARKeting for better competitiveness Working Paper: USE OF BIG DATA ANALYTICS FOR CUSTOMER RELATIONSHIP MANAGEMENT: POINT OF PARITY OR SOURCE OF COMPETITIVE ADVANTAGE? Suoniemi, Samppa Meyer-Waarden Lars Munzel, Andreas Zablah, Alex R. Straub, Detmar W. 1 H2020-Marie Curie Actions—Individual Fellowships (IF)– Standard EF—ECO panel – 2014 H2020--2014MSCA-IF-EF-ST This project has received funding from the European Union’s Horizon 2020 research and innovation programme under the Marie Sklodowska-Curie grant agreement No 658789
Transcript of Project Number: 658789
1
Project Number: 6587891
Project Acronym: BIDAMARK
Project title: BIg DAta-driven MARKeting for better competitiveness
Working Paper:
USE OF BIG DATA ANALYTICS FOR CUSTOMER RELATIONSHIP
MANAGEMENT: POINT OF PARITY OR SOURCE OF
COMPETITIVE ADVANTAGE?
Suoniemi, Samppa
Meyer-Waarden Lars
Munzel, Andreas
Zablah, Alex R.
Straub, Detmar W.
1 H2020-Marie Curie Actions—Individual Fellowships (IF)– Standard EF—ECO panel – 2014
H2020--2014MSCA-IF-EF-ST
This project has received funding from the European Union’s Horizon 2020 research and innovation programme under the Marie Sklodowska-Curie grant agreement No 658789
2
USE OF BIG DATA ANALYTICS FOR CUSTOMER RELATIONSHIP
MANAGEMENT: POINT OF PARITY OR SOURCE OF COMPETITIVE
ADVANTAGE?
Firms’ ability to generate, disseminate and utilize customer information and, consequently, to
deliver superior value to its customers is regarded as key to firm performance (Day 1994; Kohli
and Jaworski 1990; Narver and Slater 1990; Webster 1988). Recent advances in big data2
technologies, and greater access to customer information through web-based channels including
e-and m-commerce, social media, sensors (the Internet of Things), and loyalty programs, offers
firms unprecedented opportunities to generate customer insight not previously possible (Chen et
al. 2012: Nunan and DiDomenico 2013). Consequently, big data initiatives offer much promise
for improving firms’ customer relationship management (CRM) efforts, and are thus commonly
championed by firm’s marketing function (Gartner 2013; Wedel and Kannan 2016).
According to the Boston Consulting Group (Gerbert et al. 2016), data analytics is
expected to transform firm CRM strategy in all key areas encompassing marketing effectiveness,
pricing and revenue management, segmentation and personalization, customer lifecycle
assessment, and customer loyalty and churn analysis. Unlike traditional CRM systems, big data
technologies enable firms to collect and analyze unfiltered customer opinions, understand
customer attitudes and behaviors, and engage in a two-way dialogue with their customers (Chen
et al. 2012; Day 2011). Web, text, sentiment, social network, mobile, and sensor-based analytics
can be used to analyze multi-structured customer data to build predictive models that outperform
those that can be generated using legacy CRM tools (Chen et al. 2012; Jelinek 2013; Wedel and
Kannan 2016), thus enabling firms to offer its customers highly personalized products and
2 Big data refers to techniques, technologies, systems, practices, methodologies, and applications related to the acquisition, storage, integration, analysis, and deployment of massive amounts of diverse data to support business decision-making (Chen et al. 2012, Jelinek and Bergey 2013).

3
services that meet their needs better than rivals, often in real-time, and at a lower cost (Einav and
Levin 2013; Jelinek and Bergey 2013; LaValle et al. 2011; McAfee and Brynjolfsson 2012).
For the majority of firms, however, a disconnect exists between the collection of data,
and the actual usage of data in decision-making. This disconnect, or “utilization gap,” is regarded
as big data’s greatest challenge (Moorman 2013). Despite virtually unlimited access to diverse
customer data, and advances in sophisticated data management tools, only an estimated 35% of
marketing decisions are made based on analytics-driven customer information (CMO Survey
2016). To explore the drivers and consequences of this utilization gap, we introduce the term big
data customer analytics use to refer to the extent to which customer information derived from
big data analytics guides customer-focused marketing decisions (Germann et al. 2013;
Jayachandran et al. 2005; Menon and Varadarajan 1992).
Unlike legacy CRM tools – which are user-intensive and often deployed across
organizational levels to support interactions at the customer-firm interface (Mithas et al. 2005;
Srinisavan and Moorman 2005) – big data customer analytics programs rely far less on human
involvement to enhance customer outcomes (Chen et al. 2015). Specifically, big data
technologies enable firms to automate CRM processes ranging from customer data collection,
management, integration and analysis, to customer information use in decision-making (Chen et
al. 2015) because they are enhanced with real-time, machine learning algorithms that render
human judgment unnecessary.
Given its advanced functionality (relative to legacy CRM systems), scholars have argued
that big data-driven decision-making leads to better managerial decisions, and is thus a potential
source of competitive advantage (Chen et al. 2012; Gillon et al. 2014). While big data success
stories of first movers turned industry leaders provide compelling evidence to support this claim
4
(Chen et al. 2015; Wedel and Kannan 2016), it is unclear whether the advantage provided by big
data customer analytics use is sustainable over time, or can be competed away by rivals to
become a necessary pre-requisite for firm survival rather than lead to a sustainable competitive
advantage (e.g., Clemons and Row 1991; Kumar et al. 2011).
In sum, prior research suggests that big data customer analytics use is expected to
dramatically improve CRM decision-making, consequently leading to higher performance and
competitive advantage. However, extant research is silent about what determines whether firms
use big data analytics to guide CRM strategy and, by extension, the extent to which big data
customer analytics use impacts customer relationship outcomes and firm financial performance.
In addition, it remains unclear whether the competitive advantage, if any, afforded by big data
customer analytics use is sustainable when its use is highly prevalent in the firm’s industry, i.e.,
whether big data customer analytics use is vulnerable to imitation by rivals. To remedy these
crucial knowledge gaps, this study addresses three research questions:
1. What are the key antecedents of big data customer analytics use?
2. How, and to what extent, does big data customer analytics use influence customer relationship
performance, and, ultimately, financial performance?
3. Is competitive advantage, if any, achieved through big data customer analytics use contingent
upon its prevalence within an industry?
To answer these questions, we primarily build on market information use theory and
related CRM research (e.g., Jayachandran et al. 2005; Menon and Varadarajan 1992; Moorman
1995), with additional support drawn from business analytics studies (Chen et al. 2012; Germann
et al. 2013; McAfee and Brynjolfsson 2011), information quality (IQ) research (Wang et al.
1996; Lee et al. 2002), and cultural customer orientation (Deshpande et al. 1993; Narver and
Slater 1990). We advance a theoretical framework to examine how informational and

5
organizational factors act to enhance big data customer analytics use, which in turn influences
customer relationship and financial performance. More specifically, we posit and find that
information quality (IQ), big data analytics culture, and customer orientation are key antecedents
of big data customer analytics use, which in turn is a critical driver of CRM and firm
performance outcomes. Finally, our findings reveal that the performance benefits of big data
customer analytics use vary depending on the prevalence of big data customer analytics use in
the firm’s industry.
This research makes three important contributions to CRM literature. First, this study
extends the CRM literature by synthesizing knowledge from diverse theories to show how
informational and organizational factors act as critical antecedents to enhance big data customer
analytics use. In particular and in contrast with prior CRM research, the results highlight the role
of information quality (IQ) in predicting big data customer analytics use. By applying well-
established IQ research into the big data (4V’s) context, the findings reveal the relative
importance of different IQ dimensions for CRM decision-makers, with the format (visualization)
of customer information being most critical. The results also indicate that customer orientation
and big data analytics culture are key antecedents of big data customer analytics use. The study’s
findings thus suggest that both firm-wide cultures are necessary to facilitate the formation of
collective values, beliefs and norms to adopt a successful big data-driven CRM strategy.
Second, this study introduces a new measure adopted from prior CRM literature that
captures the primary set of CRM activities for which firms use big data customer analytics to
better understand, classify, and prioritize their customers, and offer them products and services
that match their individual needs (Gerbert et al. 2016; Jayachandran et al. 2005; Wedel and
Kannan 2016). The findings confirm big data customer analytics use as a key predictor of firm
6
performance, and more specifically, that big data customer analytics use primarily influences
financial performance indirectly via customer relationship performance. The results also
underscore the personalization of the marketing mix as the key dimension of big data customer
analytics use.
Third, this study suggests that the performance impacts of big data customer analytics use
are highly contingent on the prevalence of big data customer analytics use within an industry.
The findings reveal that big data customer analytics use only leads to superior financial
performance directly when big data analytics use is low among industry competitors. When the
industry prevalence of big data analytics use is high, firms may still achieve sustainable
competitive advantage indirectly through better customer outcomes. Thus, the results indicate
that while some of the competitive advantage afforded by big data can be imitated away by
rivals, the hyper-personalization afforded by big data makes the firm’s customers less vulnerable
to competitor moves, allowing the firm to partially escape the game of competition and imitation
(McGahan and Ghemawat 1994).
CONCEPTUAL FRAMEWORK AND HYPOTHESES
In framing our investigation, we primarily build on market information use theory and related
CRM research (Jayachandran et al. 2005; Menon and Varadarajan 1992; Moorman 1995) to
examine how informational and organizational factors act to enhance big data customer analytics
use, which in turn influences customer relationship and financial performance. Furthermore, we
assess whether the prevalence of big data analytics use within an industry moderates the
relationships between big data customer analytics use and outcome variables of interest. When
applicable, market information theory is complemented with business analytics (BI) studies
7
(Chen et al. 2012; Germann et al. 2013; McAfee and Brynjolfsson 2011), information quality
(IQ) research (Wang et al. 1996; Lee et al. 2002), and cultural customer orientation (Deshpande
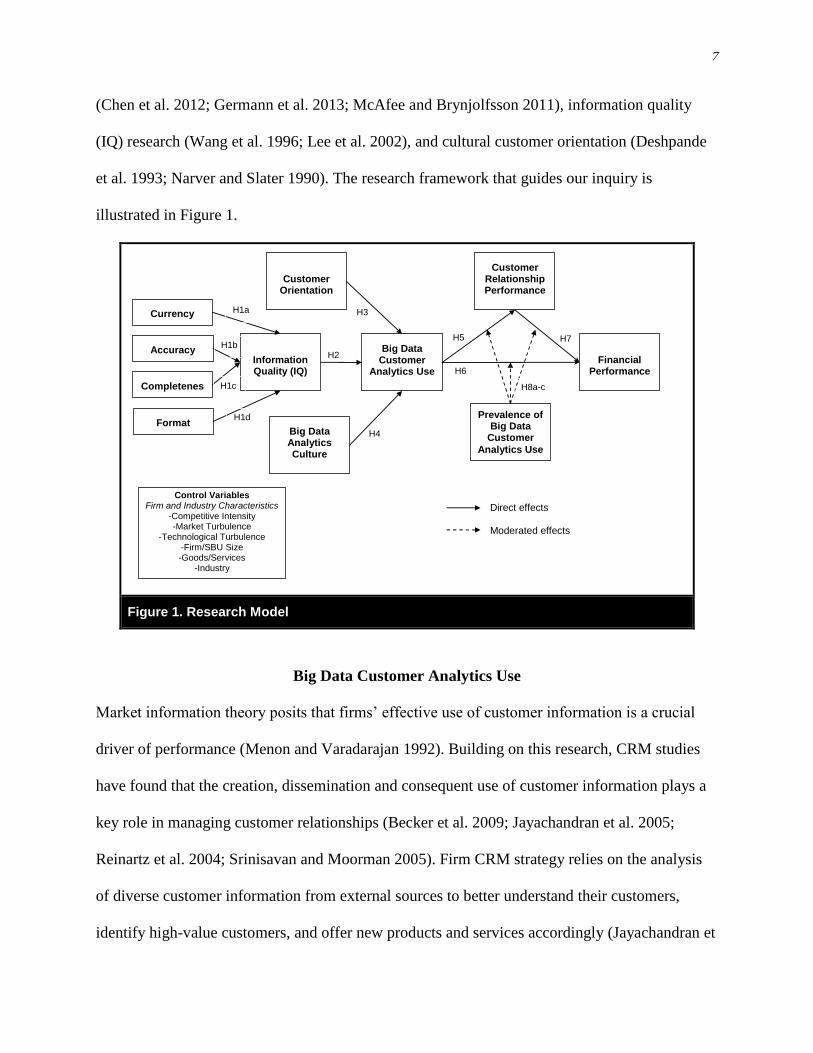
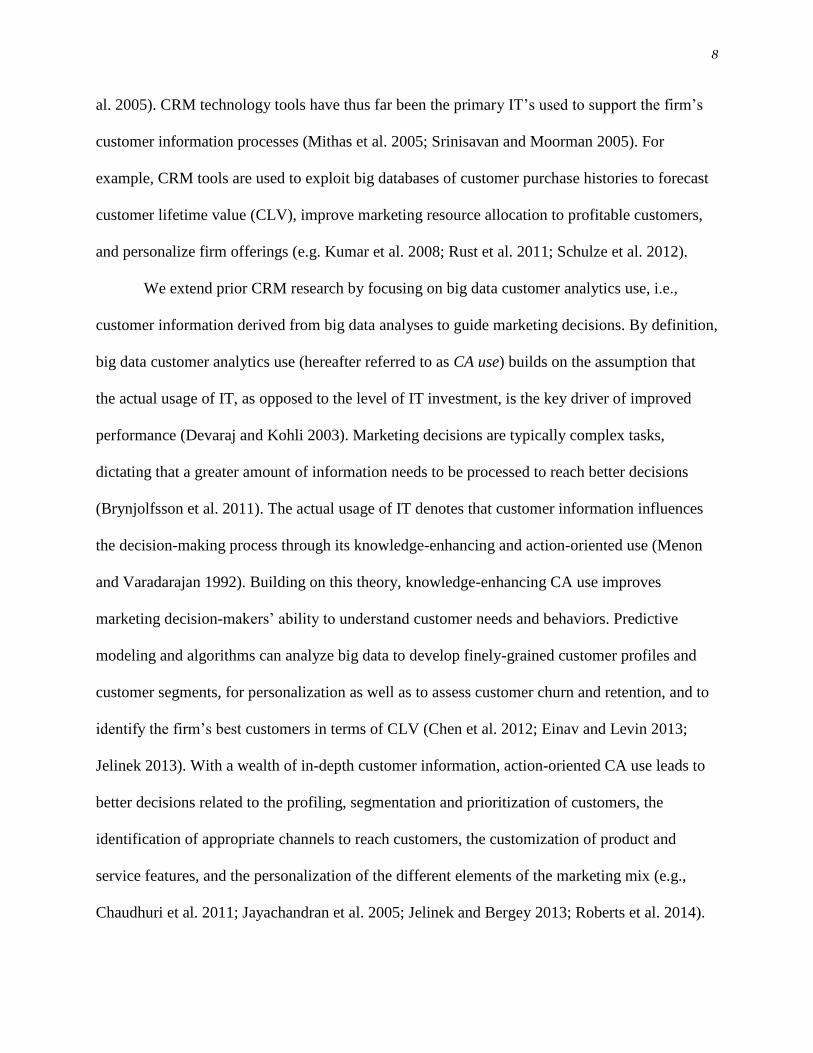
et al. 1993; Narver and Slater 1990). The research framework that guides our inquiry is
illustrated in Figure 1.
Figure 1. Research Model
Big Data Customer Analytics Use
Market information theory posits that firms’ effective use of customer information is a crucial
driver of performance (Menon and Varadarajan 1992). Building on this research, CRM studies
have found that the creation, dissemination and consequent use of customer information plays a
key role in managing customer relationships (Becker et al. 2009; Jayachandran et al. 2005;
Reinartz et al. 2004; Srinisavan and Moorman 2005). Firm CRM strategy relies on the analysis
of diverse customer information from external sources to better understand their customers,
identify high-value customers, and offer new products and services accordingly (Jayachandran et
H6
H5
H4
H2
H7
Prevalence of Big Data
Customer
Analytics Use
H3
Direct effects Moderated effects
Control Variables Firm and Industry Characteristics
-Competitive Intensity -Market Turbulence
-Technological Turbulence -Firm/SBU Size -Goods/Services
-Industry
Financial
Performance
Customer Relationship Performance
Big Data Customer
Analytics Use
Information Quality (IQ)
Customer
Orientation
Big Data Analytics Culture
Currency
Completeness
Accuracy
Format
H1a
H1b
H1c
H1d
H8a-c
8
al. 2005). CRM technology tools have thus far been the primary IT’s used to support the firm’s
customer information processes (Mithas et al. 2005; Srinisavan and Moorman 2005). For
example, CRM tools are used to exploit big databases of customer purchase histories to forecast
customer lifetime value (CLV), improve marketing resource allocation to profitable customers,
and personalize firm offerings (e.g. Kumar et al. 2008; Rust et al. 2011; Schulze et al. 2012).
We extend prior CRM research by focusing on big data customer analytics use, i.e.,
customer information derived from big data analyses to guide marketing decisions. By definition,
big data customer analytics use (hereafter referred to as CA use) builds on the assumption that
the actual usage of IT, as opposed to the level of IT investment, is the key driver of improved
performance (Devaraj and Kohli 2003). Marketing decisions are typically complex tasks,
dictating that a greater amount of information needs to be processed to reach better decisions
(Brynjolfsson et al. 2011). The actual usage of IT denotes that customer information influences
the decision-making process through its knowledge-enhancing and action-oriented use (Menon
and Varadarajan 1992). Building on this theory, knowledge-enhancing CA use improves
marketing decision-makers’ ability to understand customer needs and behaviors. Predictive
modeling and algorithms can analyze big data to develop finely-grained customer profiles and
customer segments, for personalization as well as to assess customer churn and retention, and to
identify the firm’s best customers in terms of CLV (Chen et al. 2012; Einav and Levin 2013;
Jelinek 2013). With a wealth of in-depth customer information, action-oriented CA use leads to
better decisions related to the profiling, segmentation and prioritization of customers, the
identification of appropriate channels to reach customers, the customization of product and
service features, and the personalization of the different elements of the marketing mix (e.g.,
Chaudhuri et al. 2011; Jayachandran et al. 2005; Jelinek and Bergey 2013; Roberts et al. 2014).
9
Prior research offers several examples of how customer relationships could be further
enhanced with the application of big data analytics methods (Chen et al. 2012; Manyika et al.
2011; Lycett 2013; Sung-Hyuk et al. 2012). In comparison, traditional CRM tools are used to
exploit customer purchase histories that reside in firm databases. This data is required for CLV
management actions in order to increase marketing resource allocations to profitable customers,
and to put forward personalized offerings (e.g., Bolton et al. 2004; Gupta et al. 2004; Kumar and
Reinartz 2006; Kumar et al. 2008; Rust et al. 2011; Schulze et al. 2012). With the application of
non-relational big data technologies, however, transactional data from firm databases can now be
combined with rich, multi-structured data from a variety of other sources including retailers, e-
and m-commerce, the “Internet of Things (IoT)”, and social media, to make far more accurate
customer-focused decisions (Balasubramanian et al. 2002). Similarly CA use in the areas of
customer selection and segmentation, consumer key decision processes, and repeat purchases
forecasting, is considered to add substantial value for customer relationships (Glady et al. 2015;
Sahoo et al. 2012; Snijders et al. 2012; Roberts et al. 2014). In sum, prior theory indicates that
CA use holds great potential for improving decision making related to customer relationship
strategy. Next, we discuss the antecedent factors that may influence organizational CA use.
Antecedents of Big data Customer Analytics Use
Market information use theory suggests that organizational CA use depends on informational
(characteristics of the information itself) and organizational (characteristics of the organization)
factors that facilitate or inhibit its deployment in a firm (Menon and Varadarajan 1992). Based
on a review of relevant literature, we conceptualize the former as information quality (IQ), and
the latter as customer orientation and big data analytics culture, respectively.

10
Information Quality
Information perceived as credible and useful is more likely to be utilized by organizations
(Menon and Varadarajan 1992). We borrow support from information quality (IQ) research that
refers to IQ as the desired characteristics of the information output produced by an IT (Bailey
and Pearson 1983). IQ is recognized as a multidimensional concept, the composition of which
depends on specific information usage context (Fehrenbacher and Helfert 2012; Lee et al. 2002;
Wang and Strong 1996),
Big data-driven customer information can be distinguished from prior customer
information stored in legacy CRM systems by the sheer volume, velocity, and variety of data
(the three V’s) that are used to generate customer insights (Chen et al. 2002; Wedel and Kannan
2016). Specifically, big data analytical tools can process massive amounts of multi-structured
data (varieties of data formats and data types) in real-time. More recently, visualization has been
put forward as a fourth “V” because the complexity of big data-driven customer insights should
be delivered in understandable form to executives to support decision-making (Chen et al. 2012;
Jelinek and Bergey 2013; Manyika et al. 2011; Nunan and DiDomenico 2013).
In a similar vein, prior IQ research has identified currency, accuracy, completeness and
format as the key dimensions of IQ (Wixom and Todd 2005; Xu et al. 2013). Currency refers to
the degree to which the information is up to date. Accuracy represents the degree to which the
information is correct. Completeness expresses the degree to which all relevant information is
provided. Format, in turn, refers to how well the information is presented to the decision-maker
(Wixom and Todd 2005; Zheng et al. 2013). While their relative importance depends on the
11
specific IT system setting, the afore-mentioned four dimensions have high general applicability
and relevance to the IT context such as CA use (Wixom and Todd 2005).
Based on the preceding exposition, we posit that big data –driven IQ is determined by its
timeliness (velocity), accuracy (volume), completeness (variety) and format (visualization). Big
data analytics is expected to provide firms with customer insight (IQ) that is accurate (from large
volumes of data), complete (from various types of data), and timely (from real-time parallel
processing). Furthermore, customer insights are delivered to business decision-makers who are
unfamiliar with the analytics process, suggesting that the format in which such insights are
presented (visualization) is an important dimension of overall IQ. Hence we hypothesize that:
H1a: Currency has a positive effect on information quality (IQ).
H1b: Accuracy has a positive effect on information quality (IQ).
H1c: Completeness has a positive effect on information quality (IQ).
H1d: Format has a positive effect on information quality (IQ).
As we alluded to earlier, customer information perceived as high quality enhances its
utilization by organizations. In the CA use context, customer information that is timely, accurate,
complete, and presented in understandable format, jointly influence overall IQ, which, in turn,
drives decision-makers’ choice of information use (Menon and Varadarajan 1992). We put
forward the following hypothesis:
H2: Information quality (IQ) has a positive effect on big data customer analytics use.
Customer Orientation
Organizational culture promotes expected behaviors through embedded structures of shared
values and norms (Deshpande et al. 1993). In this study, we propose that two elements of the
12
firm’s overall organizational culture are closely associated with CA use, namely, customer
orientation and big data analytics culture.
Customer orientation reflects an organization-wide culture to collect, share and use
customer information to provide superior value to customers (Deshpande et al. 1993; Narver and
Slater 1990). Customer orientation entails that customer satisfaction is an organizational priority
that dictates the implementation of necessary activities to achieve this goal (Jayachandran et al.
2005). Customer-oriented firms strive to create and respond to customer information of their
expressed and unexpressed needs to achieve competitive advantage (Deshpande et al. 1993;
Narver and Slater 1990). Because superior customer information is the means to better
understand customers, and to design offerings that meet their preferences and needs, a firm’s
customer orientation motivates the utilization of big data customer analytics (Jayachandran et al.
2005). Stated differently, we expect that:
H3: Customer orientation has a positive effect on big data customer analytics use.
Big Data Analytics Culture
Big data analytics culture refers to shared values, beliefs and norms that encourage decision-
makers to utilize customer insights provided by big data analytics (Germann et al. 2013). A
favorable culture embeds CA use as part of daily operations, which is reflected as an openness to
systematically adopt big data analytics to solve business problems (Barton and Court 2012;
McAfee and Brynjolfsson 2012).
However, marketing executives are not naturally inclined to trust or understand data-
based models, and reluctant to allow CA use to over-rule managerial experience and intuition
(LaValle et al. 2011; McAfee and Brynjolfsson 2012). Managerial resistance may be particularly
strong because CA use necessarily involves various people from different departments to first
13
create customer insight, and then to act upon it (Germann et al. 2013). Industry surveys have thus
reported that CA use is greater in firms where the importance of data analytics is appropriately
communicated and encouraged by top management (Brown et al. 2012; Bloomberg 2012; Cap
Gemini 2012; Manyika et al. 2011). Consistent with this research, we anticipate that big data
analytics culture is a key driver of CA use to support customer-focused decision-making. Hence:
H4: Big data analytics culture has a positive effect on big data customer analytics use.
Performance Impacts of Big Data Customer Analytics Use
We examine two performance outcomes in this study, customer relationship performance and
financial performance. We expect that CA use improves customer relationship performance in
terms of customer acquisition, satisfaction, and retention.
Prior CRM literature suggests that customer information derived from CRM systems
helps firms interact with customers more efficiently and effectively (Becker et al. 2009;
Jayachandran et al. 2005; Mithas et al. 2005; Srinisavan and Moorman 2005). Web-based big
data technologies enable firms to access unfiltered customer opinions, understand customer
behavior, and converse with customers unlike traditional one-way marketing with CRM
technologies (Chen et al. 2012; Day 2011). With web, text, sentiment, social network, mobile
and sensor-based analytical tools, multi-structured customer data can be analyzed to build
predictive models that help firms tap into customer attitudes and behavior as well as CLV, and
innovate and optimize marketing activities to improve customer-centric outcomes (Chen et al.
2012; Einav and Levin 2013; Jelinek 2013). Person- , context-, and location-specific product
offerings can be tailored based on data collected from mobile and sensor devices, resulting in
higher customer satisfaction and retention (Chaudhuri et al. 2011). In addition, customer
14
information is often available in real-time, and at a significantly lower cost than traditional
means to understand customers’ needs (Jelinek and Bergey 2013).
In sum, CA use puts managers in a superior position to design highly personalized
offerings that are better aligned with customer needs in real-time, leading to higher CRM
performance, such as customer acquisition, satisfaction and retention (Einav and Levin 2013;
Germann et al. 2013). Thus:
H5: Big data customer analytics use has a positive effect on customer relationship performance.
We also expect that CA use influences financial performance in terms of sales,
profitability and market share. Academic studies have shown that data analytics use in decision
making is associated with better financial performance (Brynjolfsson et al. 2011; Germann et al.
2013), which is supported by various industry reports (Bloomberg 2012; Brown et al. 2012; Cap
Gemini 2012; Manyika et al. 2011). In addition to more sales, we posit that CA use lowers costs
by automating customer information and marketing processes (Chen et al. 2012; Einav and Levin
2013; Jelinek 2013). Therefore, CA use is expected to have a dual effect on financial
performance through higher customer relationship performance as well as through increased
sales and lower costs (Rust et al. 2002). We thus hypothesize that:
H6: Big data customer analytics use has a positive effect on firm financial performance.
Prior research has also found a positive relationship between customer relationship
performance and firm financial performance because customer outcomes are antecedent to sales
growth, market share, and profitability (e.g., Ahearne et al. 2005; Day and Wensley 1988).
Hence, we propose:
H7: Customer relationship performance has a positive effect on firm financial performance.
Moderating Effect of Industry Prevalence of Big Data Customer Analytics Use
15
We also examine whether the prevalence of CA use in the firm’s industry influences the
relationship between CA use, customer relationship performance, and firm financial
performance. Stated differently, we use industry prevalence as a proxy to examine whether CA
use provides a sustainable competitive advantage in the face competitive imitation over time.
While no studies have specifically investigated whether CA use prevalence moderates the
effects of CA use on firm performance, prior research has shown that when traditional CRM
tools became more prevalent, they were no longer considered sources of competitive advantage
but necessary pre-requisites for competitive parity and firm survival (Clemons and Row 1991;
Dowling and Uncles 1997). For example, loyalty programs within CRM strategy are
characterized more by imitation and isomorphic effects than innovation because all industry
players typically adopt the same management practices, enabling them to achieve a situation of
competitive stability (Dowling and Uncles 1997). In sum, CRM tools became necessary but non-
differentiating assets as their industry prevalence increased.
In a similar vein, the firm’s differential advantage afforded by CA use is also exposed to
competitive imitation. When industry prevalence is low, first-mover advantages afforded by CA
use through a superior understanding of customer needs, and more personalized product
offerings compared to rivals, may lead to sustainable competitive advantage (Day 2011; McAfee
and Brynjolfsson 2012). Furthermore, difficult-to-copy tacit knowledge requires a learning curve
that gives first movers a highly advantageous position that may discourage other firms in the
industry, rendering CA use among imitators ineffective (Day 2011). Conversely, in industries
where the prevalence of CA use is high, such as retail and e-commerce, the potential of CA use
to sustain differential advantage may be more difficult (Brown et al. 2012). For example, big
data-driven firms have an equal opportunity to collect external customer data from web-based
16
sources, decreasing the differential advantages of CA use. Competition is also likely to have
copied the imitable explicit knowledge related to successful big data technologies and practices,
further undermining the performance impacts of CA use (Germann et al. 2013).
The preceding logic suggests that CA use may only provide for sustainable competitive
advantage in industries where CA use is not prevalent. However, we posit that CA use may lead
to sustainable competitive advantage due to its unprecedented potential in matching customer
needs with products and services, in real-time, and at lower costs through process automation
and optimization. More specifically, firms are able to retain relationship-oriented customers
through emotional exit barriers with hyper-personalization and individualized offers (Morgan
and Hunt 1994). As hyper-targeted customers become resistant against counter persuasion of
competitors, they can be isolated from competitive pressures to create internal captive,
“domesticated markets (McGahan and Ghemawat 1994)”. With differentiation through
personalization, big data-driven firms may thus be able to build isolating mechanisms against
competition and imitation that creates a sustainable competitive advantage (Arndt 1979; Kahn et
al. 1988; Fader and Schmittlein 1993; Shapiro and Varian 1999). Furthermore, the sustainability
of this advantage from CA use may be even more sustainable because the majority of firms do
not utilize the full potential of their investments into big data technologies (CMO Survey 2016;
Moorman 2013).
In sum, we expect that the prevalence of CA use influences the relationships between CA
use and firm performance. In the context of big data, there are opposing arguments that suggest
that competitive advantage from CA use is either immune or exposed to the industry prevalence
of CA use. There is no empirical evidence to inform how the two opposing forces (isolation
mechanism from differentiation versus competitive imitation) play out against each other. Thus,
17
the direction of the moderating effect of CA use prevalence on the relationships between CA use
and firm outcomes is not hypothesized. Hence:
H8a: The positive effect of big data customer analytics use on customer relationship performance
is moderated by the prevalence of big data customer analytics use.
H8b: The positive effect of big data customer analytics use on financial performance is
moderated by the prevalence of big data customer analytics use.
H8c: The positive effect of customer relationship performance on financial performance is
moderated by the prevalence of big data customer analytics use.
Control Variables
We control for firm and industry characteristics that may influence the action mechanisms
between market information use, its antecedents and consequences. Control variables (1) firm
size, (2) goods versus services firms, (3) industry, (4) competitive intensity, (5) market
turbulence, and (6) technological turbulence are included to partial out any noise in the variance
(e.g., Homburg et al. 1999; Kohli and Jaworski 1990; Menon et al. 1999).
Firm/SBU size is controlled for in terms of the number of employees because larger
business units may benefit from scale and scope economies that influence CA use and financial
performance (Germann et al. 2013). Differences in CA use and financial performance between
goods and services firms are also controlled with a dummy variable (Homburg et al. 1999;
Verhoef and Leeflang 2009). Three industry dummies are employed to account for differences
between the largest big data-driven industry sectors in our dataset, namely, B2C manufacturing,
finance and insurance, and retail. In some industries, firms may use big data analytics less or
benefit less from it due to limited access to data, dispersion of data sources, and data privacy and
18
protection laws, for instance (Brown et al. 2012; Cap Gemini 2012; Gartner 2013; Manyika et al.
2011).
We include two-item scales for competitive intensity, market turbulence and
technological turbulence as controls to account for the effects on model endogenous variables
(Kohli and Jaworski 1990). The volatility of the firm’s environment increases the need for
market information use (Homburg et al. 1999; Menon and Varadarajan 1992). Changes in
competitors’ strategies, customer needs or technologies increase the need for customer
information use to alleviate uncertainty associated with decision-making (Kohli and Jaworski
1990; Menon et al. 1999). These three factors may also decrease customer relationship
performance as customer retention becomes more difficult, thereby also affecting financial
performance (Jayachandran et al. 2005; Kirca et al. 2005). Prior marketing research also
indicates that these environmental factors may have direct effects on firm performance
(Homburg et al. 1999; Menon et al. 1999; Olson et al. 2005; Vorhies and Morgan 2005).
METHODOLOGY
Data Collection and Sample
We employed a survey study methodology and administered an online questionnaire for data
collection. All of our measures are directly adopted from or based substantially on scales
validated by prior studies (see Appendix B), and were measured on a 7-point Likert scale.
Following established measurement model specification guidelines (Petter et al. 2007), we
determined that two scales modeled in prior studies as reflective were actually formative (Big
Data Analytics Culture, Big Data Customer Analytics Use)3. Based on our literature review, an
3 We carried out additional tests following Chwelos et al. (2001) to test whether measurement model specification affects structural model
results. We tested two other versions of the model (one with all constructs formative (Mode B) and another with all constructs reflective (Mode

19
additional item (use8, personalization of the marketing mix) was added to the Big Data Customer
Analytics Use scale that is based on Jayachandran et al.’s (2005) original seven-item scale
measuring customer information use in CRM. Our sampling frame focuses on strategic business
units (SBUs) in large (>1000 employees), US-based, B2C manufacturing and service firms that
have invested in big data analytics for the marketing department.
We set forth these sample criteria for the following reasons. Firstly, due to considerable
initial investment and expertise required, large firms are more likely to have implemented big
data initiatives. Second and similar to prior marketing studies, the focus of this study is at the
SBU level (Homburg et al. 1999; Workman et al. 1998). If there were no distinct SBUs,
respondents were instructed to answer at the firm level. Third, B2C sectors are more prevalent in
terms of big data investment because understanding the needs of a large customer base is more
complicated than in B2B sectors, where the number of customers is lower, and the salesforce is
more knowledgeable about individual customers’ needs.
Using a commercial research panel provider, we targeted senior marketing executives in
SBUs across a range of B2C industries. Prior marketing studies have also adopted a multi-
industry approach (e.g., Song et al. 2007; Vorhies and Morgan 2005). The survey was sent to
senior marketing executives in 2497 SBUs, and after a rigorous screening process, 301 usable
responses (12% response rate) were received in return4. To ensure that the final informants
possessed adequate knowledge, respondent competency was assessed through a separate
question in the survey instrument (Kumar et al. 1993). Appendix A summarizes the sample
characteristics. The data was cleared for non-response biases, which included screening for
A). The results of the structural model were qualitatively similar with no path coefficients gaining or losing statistical significance, and no significant paths changed in sign. In sum, measurement model specification decisions, which are always judgment calls made by authors, do not
affect the results of the study.
4 Due to personal data protection laws, it was not possible to match the collected data with survey data from other informants or with objective
financial data.
20
possible differences in variable means between early and late responders with an independent
samples t-test (Armstrong and Overton 1977). No significant differences were found among
early and late responders.
RESULTS
Measurement Model
We used PLS-SEM (SmartPLS 3; Ringle et al. 2015) to test the measurement model and
structural model. Item descriptions, indicator reliabilities and references are summarized in
Appendix B. Descriptive statistics, construct-level validation, and latent variable correlations are
shown in Appendix C. Reflective measures were assessed in terms of item-level reliability,
construct reliability, and convergent and discriminant validity. We eliminated two items (Accu2
and Co3) after which all item loadings, composite reliability, and average variance extracted
(AVE) exceed acceptable reliability criteria (Hair et al. 2011, 2017) and all measures
discriminate well (Fornell and Larcker 1981). Formative measures were validated via
multicollinearity (VIF values) and construct validity (item weights and loadings) testing
(MacKenzie et al. 2011; Petter et al. 2007). All VIF values were below 1.5, and formative
measures showed acceptable psychometric properties for structural model assessment.
Common Method Bias
Since both independent and dependent measures are obtained from the same source, we used
CFA and Harman’s single-factor test to assess common method bias (Podsakoff et al. 2003).
Eight factors had eigenvalues greater than one, and together they accounted for 56% of the total
variance; the first factor accounted for 32% of the total variance. However, Harman’s test does

21
not completely rule out the risk of common method bias so we carried out additional common
method tests with a marker variable (Lindell and Whitney 2001).
Ideally, the marker variable should be theoretically unrelated to other substantive
variables in the study, chosen a priori, and similar to the substantive variables in content and
format (i.e., in this case latent variables, perceptual/subjective measures) (Richardson et al. 2009;
Simmering et al. 2015). To provide a plausible a priori assumption of a zero correlation between
the marker and other study variables, the marker variable was adopted from another discipline.
Following these criteria, the 4-item perceptual “Astrology interest (Mowen et al. 2009)” scale
was chosen a priori and included in the survey instrument. Pearson correlations and significance
levels between the marker and substantive variables are shown in Table 1.
Table 1. Marker Variable Analysis
The correlations between all predictor and criterion variables, ranging between .347 and
.741, are highly significant. Astrology interest, in turn, has a significant correlation of .159 with
the criterion variable “Financial performance”. However, the marker has no significant
correlations with the other nine substantive variables.
This correlation of the marker with the criterion scale is then used to partial out the
common method effect from other correlations to assess the extent of method bias. The partial
Construct 1 2 3 4 5 6 7 8 9 10 11
1 Accuracy 1.000
2 Completeness .631** 1.000
3 Currency .656** .601** 1.000
4 Format .603** .586** .629** 1.000
5 Information Quality .703** .636** .705** .723** 1.000
6 Big Data Analytics Culture .585** .515** .534** .563** .568** 1.000
7 Customer Orientation .473** .498** .548** .630** .677** .423** 1.000
8 Big Data Analytics Use .650** .649** .697** .701** .741** .601** .619** 1.000
9 Customer Relatonship Performance .445** .542** .502** .502** .515** .347** .462** .556** 1.000
10 Financial Performance .434** .470** .402** .414** .451** .350** .401** .477** .674** 1.000
11 Astrology Interest .021 .023 -.062 -.024 -.096 -.077 .008 -.059 .075 .159** 1.000
22
correlations between all predictor and criterion variables remain highly significant, indicating
that correlations in the model are not resulting from common method bias (Lindell and Whitney
2001). In sum, common method bias is not likely to be a concern in this study.
Structural Model
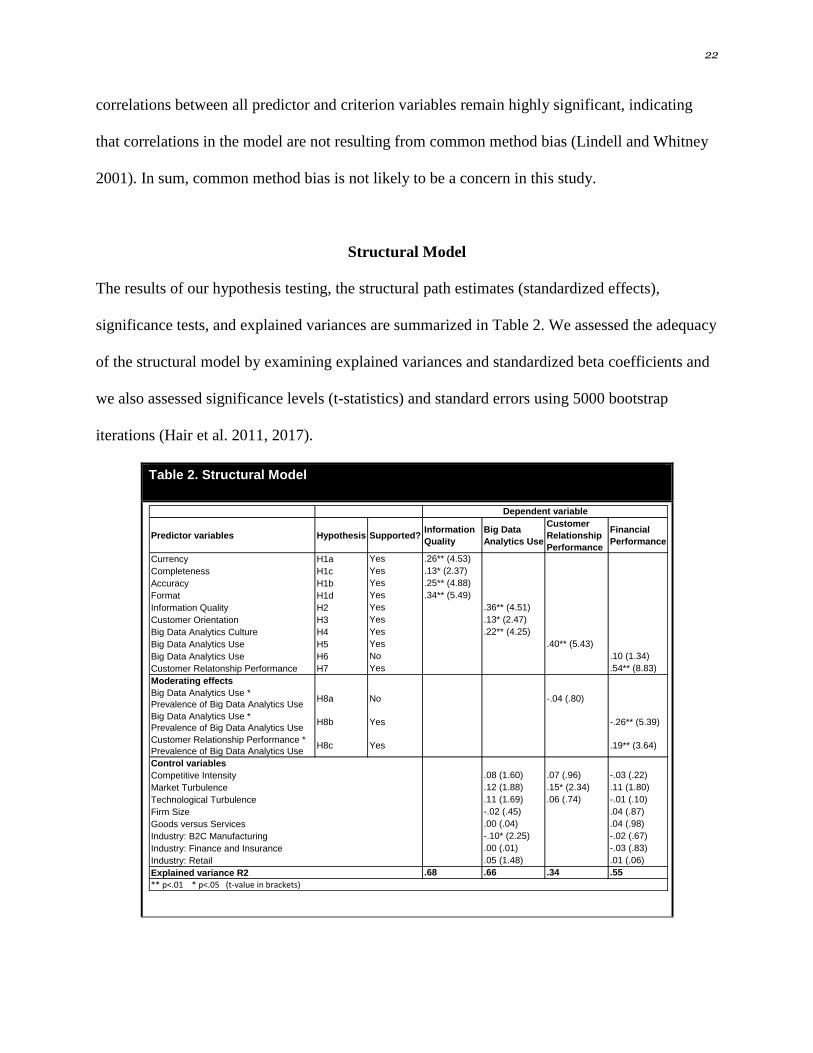
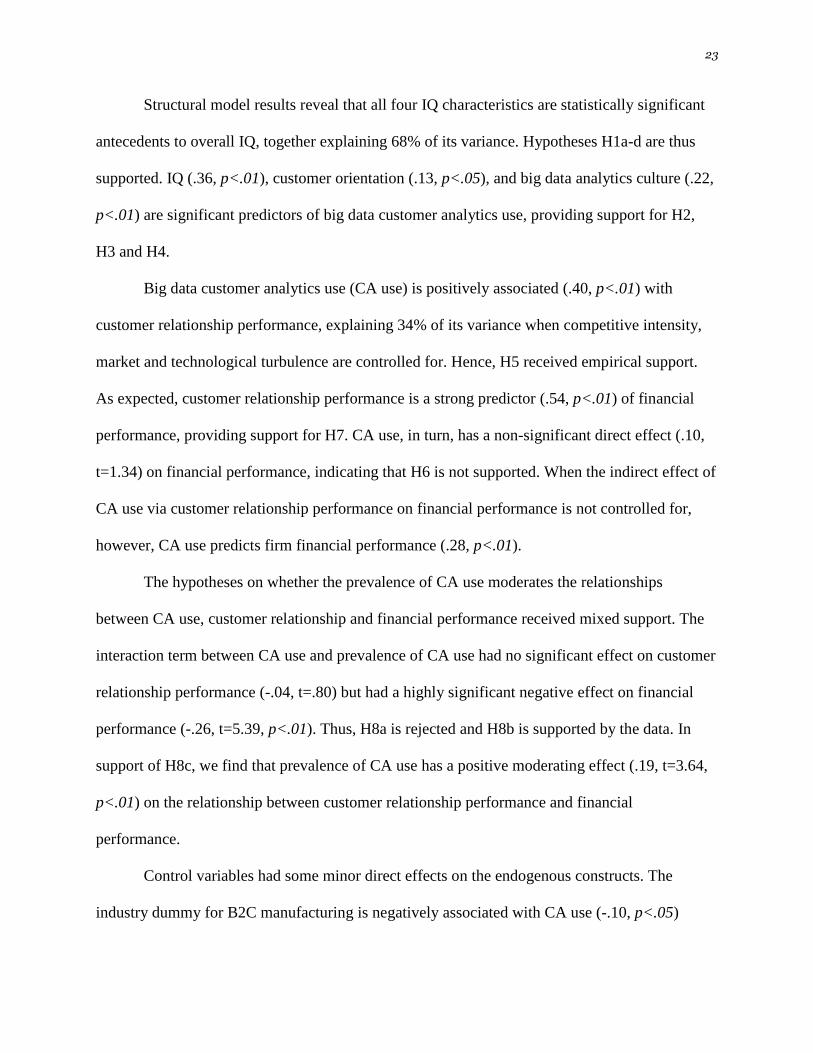
The results of our hypothesis testing, the structural path estimates (standardized effects),
significance tests, and explained variances are summarized in Table 2. We assessed the adequacy
of the structural model by examining explained variances and standardized beta coefficients and
we also assessed significance levels (t-statistics) and standard errors using 5000 bootstrap
iterations (Hair et al. 2011, 2017).
Table 2. Structural Model
Predictor variables Hypothesis Supported?Information
Quality
Big Data
Analytics Use
Customer
Relationship
Performance
Financial
Performance
Currency H1a Yes .26** (4.53)
Completeness H1c Yes .13* (2.37)
Accuracy H1b Yes .25** (4.88)
Format H1d Yes .34** (5.49)
Information Quality H2 Yes .36** (4.51)
Customer Orientation H3 Yes .13* (2.47)
Big Data Analytics Culture H4 Yes .22** (4.25)
Big Data Analytics Use H5 Yes .40** (5.43)
Big Data Analytics Use H6 No .10 (1.34)
Customer Relatonship Performance H7 Yes .54** (8.83)
Moderating effects
Big Data Analytics Use *
Prevalence of Big Data Analytics UseH8a No -.04 (.80)
Big Data Analytics Use *
Prevalence of Big Data Analytics UseH8b Yes -.26** (5.39)
Customer Relationship Performance *
Prevalence of Big Data Analytics UseH8c Yes .19** (3.64)
Control variables
Competitive Intensity .08 (1.60) .07 (.96) -.03 (.22)
Market Turbulence .12 (1.88) .15* (2.34) .11 (1.80)
Technological Turbulence .11 (1.69) .06 (.74) -.01 (.10)
Firm Size -.02 (.45) .04 (.87)
Goods versus Services .00 (.04) .04 (.98)
Industry: B2C Manufacturing -.10* (2.25) -.02 (.67)
Industry: Finance and Insurance .00 (.01) -.03 (.83)
Industry: Retail .05 (1.48) .01 (.06)
Explained variance R2 .68 .66 .34 .55
** p<.01 * p<.05 (t-value in brackets)
Dependent variable
23
Structural model results reveal that all four IQ characteristics are statistically significant
antecedents to overall IQ, together explaining 68% of its variance. Hypotheses H1a-d are thus
supported. IQ (.36, p<.01), customer orientation (.13, p<.05), and big data analytics culture (.22,
p<.01) are significant predictors of big data customer analytics use, providing support for H2,
H3 and H4.
Big data customer analytics use (CA use) is positively associated (.40, p<.01) with
customer relationship performance, explaining 34% of its variance when competitive intensity,
market and technological turbulence are controlled for. Hence, H5 received empirical support.
As expected, customer relationship performance is a strong predictor (.54, p<.01) of financial
performance, providing support for H7. CA use, in turn, has a non-significant direct effect (.10,
t=1.34) on financial performance, indicating that H6 is not supported. When the indirect effect of
CA use via customer relationship performance on financial performance is not controlled for,
however, CA use predicts firm financial performance (.28, p<.01).
The hypotheses on whether the prevalence of CA use moderates the relationships
between CA use, customer relationship and financial performance received mixed support. The
interaction term between CA use and prevalence of CA use had no significant effect on customer
relationship performance (-.04, t=.80) but had a highly significant negative effect on financial
performance (-.26, t=5.39, p<.01). Thus, H8a is rejected and H8b is supported by the data. In
support of H8c, we find that prevalence of CA use has a positive moderating effect (.19, t=3.64,
p<.01) on the relationship between customer relationship performance and financial
performance.
Control variables had some minor direct effects on the endogenous constructs. The
industry dummy for B2C manufacturing is negatively associated with CA use (-.10, p<.05)
24
suggesting that manufacturing firms have lower levels of CA use than other industries. Market
turbulence also positively influences customer relationship performance (.15, p<.05) but there
were no significant controlled paths to financial performance. Finally and as an additional test,
the control variables did not moderate any of the relationships proposed in the structural model.
Additional Mediation and Moderation Analyses
Since the research model implicitly suggests that CA use mediates the effects of the three
antecedents, information quality (IQ), customer orientation, and big data analytics culture, on the
outcome customer relationship performance, we carried out additional analyses. In addition, we
apply a more robust test to determine whether customer relationship performance mediates the
relationship between CA use and financial performance.
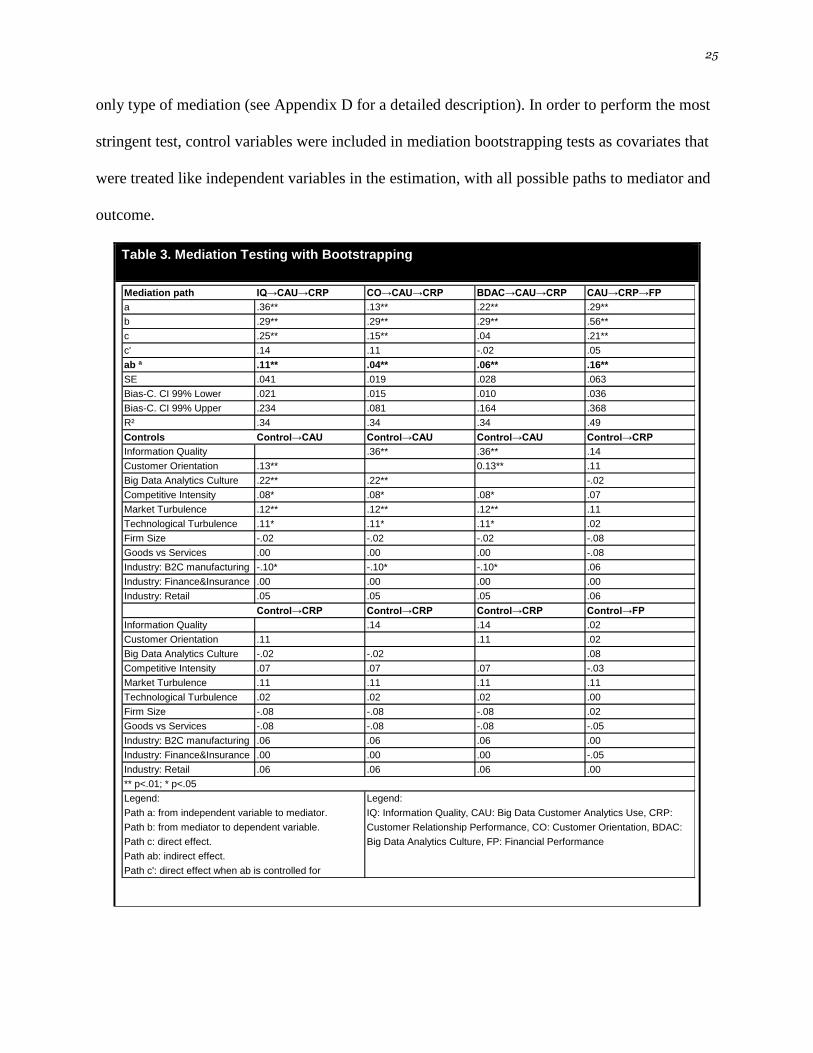
Specifically, we tested indirect effects using bootstrapping (see Table 3), which is
currently regarded as the most advanced method for mediation testing, and is also not restricted
by normality assumptions (Edwards and Lambert 2007; Kenny 2008; Preacher and Hayes 2008).
We carried out separate bootstrapping tests with Preacher and Hayes’ SPSS macros for each
possible mediation path (2008; see http://www.afhayes.com/spss-sas-and-mplus-macros-and-
code.html) using 5000 bootstrap resamples. Their macro also enabled us to control for
covariates. The results, summarized in Table 3, include unstandardized regression coefficients of
direct paths (a, b, c, and c’), and the indirect path ab with significance levels, bias-corrected 95%
confidence intervals, and standard error (Zhao et al. 2010). The indirect effect is assessed solely
based on the strength of path ab (Edwards and Lambert 2007; Preacher and Hayes 2008; Shrout
and Bolger 2002). Finally, type of mediation was determined based on Zhao et al.’s (2010)
refined classification of Baron and Kenny (1986) into complementary, competitive, and indirect-
25
only type of mediation (see Appendix D for a detailed description). In order to perform the most
stringent test, control variables were included in mediation bootstrapping tests as covariates that
were treated like independent variables in the estimation, with all possible paths to mediator and
outcome.
Table 3. Mediation Testing with Bootstrapping
Mediation path IQ→CAU→CRP CO→CAU→CRP BDAC→CAU→CRP CAU→CRP→FP
a .36** .13** .22** .29**
b .29** .29** .29** .56**
c .25** .15** .04 .21**
c' .14 .11 -.02 .05
ab ª .11** .04** .06** .16**
SE .041 .019 .028 .063
Bias-C. CI 99% Lower .021 .015 .010 .036
Bias-C. CI 99% Upper .234 .081 .164 .368
R² .34 .34 .34 .49
Controls Control→CAU Control→CAU Control→CAU Control→CRP
Information Quality .36** .36** .14
Customer Orientation .13** 0.13** .11
Big Data Analytics Culture .22** .22** -.02
Competitive Intensity .08* .08* .08* .07
Market Turbulence .12** .12** .12** .11
Technological Turbulence .11* .11* .11* .02
Firm Size -.02 -.02 -.02 -.08
Goods vs Services .00 .00 .00 -.08
Industry: B2C manufacturing -.10* -.10* -.10* .06
Industry: Finance&Insurance .00 .00 .00 .00
Industry: Retail .05 .05 .05 .06
Control→CRP Control→CRP Control→CRP Control→FP
Information Quality .14 .14 .02
Customer Orientation .11 .11 .02
Big Data Analytics Culture -.02 -.02 .08
Competitive Intensity .07 .07 .07 -.03
Market Turbulence .11 .11 .11 .11
Technological Turbulence .02 .02 .02 .00
Firm Size -.08 -.08 -.08 .02
Goods vs Services -.08 -.08 -.08 -.05
Industry: B2C manufacturing .06 .06 .06 .00
Industry: Finance&Insurance .00 .00 .00 -.05
Industry: Retail .06 .06 .06 .00
** p<.01; * p<.05
Legend: Legend:
Path a: from independent variable to mediator. IQ: Information Quality, CAU: Big Data Customer Analytics Use, CRP:
Path b: from mediator to dependent variable. Customer Relationship Performance, CO: Customer Orientation, BDAC:
Path c: direct effect. Big Data Analytics Culture, FP: Financial Performance
Path ab: indirect effect.
Path c': direct effect when ab is controlled for
26
The bootstrapping tests suggest that CA use fully mediates the effects of IQ, customer
orientation, and big data analytics culture on customer relationship performance. Customer
relationship performance also fully mediates the effect of CA use on financial performance.
Hence, all bootstrapping tests revealed indirect-only effects (the indirect effect ab is significant
and no significant direct effect c’ exists when ab is controlled for) through proposed mediators.
Next, we carried out an additional test to further examine the opposing significant
moderating effects of big data analytics prevalence on the relationships between CA use and
financial performance, and between customer relationship performance and financial
performance. Specifically, we calculated the conditional direct effects between CA use, customer
relationship performance, and financial performance at different levels of big data analytics
prevalence with the bootstrapping method, controlling for all three moderating effects (H8a-c)
simultaneously (Preacher and Hayes 2008). The analyses revealed that when big data analytics
prevalence is low (one standard deviation below mean value), the indirect effect of CA use via
customer relationship performance on financial performance is significant (.11, p<.01), and the
direct effect of CA use on financial performance is also significant (.31, p<.01). Conversely,
when big data analytics prevalence is high (standard deviation above mean value), the indirect
effect increases to .18 (p<.01) but the direct effect becomes significant of the opposite sign (-.21,
p<.05). The conditional direct effect of CA use on customer relationship performance remained
insignificant across all possible values of the moderator.
In order to facilitate the interpretation of these moderating effects, Figure 2 illustrates the
direct effects of CA use and customer relationship performance on financial performance across
different industry conditions (low vs high industry prevalence). Figure 2 suggests that when
industry prevalence of CA use is low (one standard deviation below mean value), CA use and

27
customer relationship performance are associated with financial performance to a similar degree
(.38, p<.01). However, the direct relationship between CA use and financial performance is
always more important (i.e., higher financial performance) than the indirect relationship through
customer relationship performance under low industry prevalence.
Figure 2. Direct Effects of Big Data Customer Analytics Use and Customer Relationship Performance on Financial Performance under Low and High Industry Prevalence
When industry prevalence is high, the CA use is negatively associated with financial
performance (-.14, p<.05). In stark contrast, the positive relationship between customer
relationship performance and financial performance becomes stronger (.73, p<.01) in high
prevalence conditions. As a consequence, the indirect relationship between CA use and financial
performance through customer relationship performance is more important (i.e., higher financial
performance) than the direct relationship when industry prevalence of CA use is high.
In sum, six out of eight hypotheses received full empirical support, and moderation
hypotheses H8a-c were partially supported. The model explains 34% and 55% of the variance in
customer relationship performance and financial performance, respectively. These findings are
discussed in the following section.
28
DISCUSSION
Customer information plays a vital role in managing successful long-term relationships with
valuable customers (Jayachandran et al. 2005). Our research objective was to determine to what
extent organizational big data customer analytics use (CA use) improves customer-centric and
financial outcomes, and to assess how antecedent factors influence CA use. In addition, we
examined whether the performance of CA use is conditioned by its industry prevalence among
competition. We discuss the results regarding these research objectives and offer implications for
research and practice.
Research Implications
Information Quality (IQ) and its Visualization Dimension are Key Antecedents of Big Data
Customer Analytics Use
The study advances CRM theory in at least three important ways. First, this study applies well-
established quality dimensions from IQ research into the big data analytics (4V’s) context, and
highlights information quality (IQ) as the most important predictor of CA use. By modeling IQ
as a multifaceted construct, our findings shed light on how customer information characteristics
influence CA use in customer-focused decision-making. While currency (velocity), accuracy
(volume) and completeness (variety) are all valuable facets of overall IQ in the big data context,
format (visualization) emerges as the most important characteristic of customer information for
marketing executives. This finding underscores the notion that only easily interpretable customer
insights are likely to be used by non-technical business decision-makers, regardless how high-
quality such customer information is in substance. It is also noteworthy that the completeness of
29
customer information is the least important dimension of big data-related IQ. This possibly
reflects the pace at which markets and consumers are changing, favoring less in-depth analyses
that provide rapid, moderately accurate and easily understandable results to respond to market
changes as soon as they occur. Another possible explanation is that in managerial or theoretical
modeling practices, the length of the estimation period might be limited by data availability, time
and costs. Prior research has shown that short estimation periods with reduced information and
data volume are sufficient to ensure adequate predictive validity or data veracity (Casteran et al.
2017). This important finding confirms that, even in contexts in which available data are lacking
(e.g., left-censored data, unknown customer entries, insufficient customer purchase histories,
lack of costly CRM infrastructure), managers can use incomplete data residing in the firm’s big
customer databases to derive reliable forecasting indicators, such as CLV.
In addition, the results confirm that a favorable organizational culture toward customers
as well as big data analytics lead to higher levels of CA use. Customer-oriented firms are more
open to pursuing superior customer information with novel analytics technologies (Deshpande et
al. 1993; Jayachandran et al. 2005; Narver and Slater 1990). Big data analytics culture, in turn,
helps overcome skepticism and distrust toward CA use. We posit that the effect of big data
analytics culture on CA use is further enforced by its special usage context. More specifically,
the people who carry out big data analyses (data scientists) are not the same people who use
resulting customer information (marketing executives) to guide customer-focused decisions.
Under such circumstances, big data analytics culture may play a critical role in promoting shared
norms that different organizational groups adopt to foster CA use in the organization (Germann
et al. 2013).
30
Big Data Customer Analytics Use is a Critical Driver of Firm Performance
Second, empirical studies focusing on the business value of big data analytics use are scant in
academic research and non-existent in CRM (Chen et al. 2015; Corte-Real et al. 2017; Fosso
Wamba et al. 2017; Janssen et al. 2017). This study introduces a new measure adopted from
prior CRM literature that captures the primary set of CRM activities for which firms use big data
customer analytics to better understand, classify, and prioritize their customers, and to offer them
products and services that match their individual needs (Jayachandran et al. 2005). The findings
confirm that CA use is a key driver of CRM strategy (e.g., Gerbert et al. 2016; Wedel and
Kannan 2016). The results also show that CA use primarily affects financial performance
indirectly via improved customer-centric outcomes. While the positive relationships between CA
use and performance measures are not surprising, the strength of the relationships on the CA use-
customer relationship performance-financial performance continuum underscores the potential of
CA use for competitive advantage. In addition, while all eight dimensions of big data customer
analytics use are significant, the results show that personalization of the marketing mix is the key
application area of big data customer analytics in predicting superior performance. This finding
supports the notion that highly individualized product and services are at the core of big data-
driven competitive advantage (Einav and Levin 2013; Jelinek and Bergey 2013; LaValle et al.
2011; McAfee and Brynjolfsson 2012).
Industry Prevalence Erodes Competitive Advantage of Big Data Customer Analytics Use
Third, the results show that the performance impacts of big data customer analytics use depend
on the prevalence of big data customer analytics use within an industry. The findings reveal that
big data customer analytics use only leads to superior financial performance directly when big
31
data analytics use is low among industry rivals. When the industry prevalence of big data
analytics use is high, customer-oriented firms may still achieve sustainable competitive
advantage indirectly through customer relationship performance. Thus, the results indicate that
the differential advantage driven by CA use, through increased sales and reduced operating costs
through customer process automation and optimization, can be imitated away by rivals unless the
firm is customer-oriented. Stated differently, building strong customer relationships as an
isolation mechanism is critical to financial performance in big data-driven industries because
data-driven attacks by competitors are more likely. Therefore, the findings suggest that CA use is
both necessary for competitive parity and firm survival but can also be used to build a
sustainable competitive advantage if CA use differentiates firm CRM strategy through micro-
segmentation, hyper-personalization and individualized marketing mix to make customers
immune to competing offers.
Implications for Practice
Based on study results, we highlight to practitioners that -- provided certain informational and
organizational conditions are met -- CA use may provide a solid foundation on which customer-
driven competitive advantage can be built. In particular, we stress the importance of the quality
of data-driven customer information. Marketing decision-makers demand easily understandable
and up-to-date customer insights to make swift decisions. The IT function should ensure that the
format in which customer information is delivered to marketing executives is a priority.
Developments in big data visualization tools lag behind non-relational storage, management,
integration and analytics technologies, underlining the need to pay special attention to meeting
the format requirements of business decision-makers. We also recommend that data scientists
32
focus on delivering customer insights that are timely and sufficiently accurate, and if necessary,
at the expense of more exhaustive predictive models.
We encourage top management to ensure that an organization-wide commitment to
serving customer needs and trusting analytics is implemented to facilitate CA use throughout the
entire process that ranges between big data collection and information use. Across functional
boundaries, C-level executives should make every effort to encourage IT managers, data
scientists, and front-office management in marketing, sales and customer service to buy into CA
use as an integral part of firm CRM strategy. With such shared values and norms in place, better
customer relationship performance and, ultimately, higher financial returns can be expected from
CA use.
Finally, firms should be aware that the business value of big data analytics is vulnerable
to competitive imitation. When considering big data investment in a specific industry, we urge
managers to take into account the potential upside of first-mover advantages, or the potentially
detrimental effect of competing against big data-driven rivals. On the one hand, firms should be
aware that in industries where using big data analytics is a widely-adopted business practice,
automating and optimizing CRM processes do not always yield differential advantages over
rivals but may still be necessary to ensure competitive parity. On the other hand, managers
should also know that CA use can differentiate firm CRM strategy and provide sustainable
competitive advantage when it is utilized to build stronger relationships with customers.
Limitations
This study has several limitations, some of which point to opportunities for future research. First,
the data in this research was gathered in a cross-sectional format and causal relationships

33
between constructs cannot be asserted with complete confidence. We recommend that future
studies adopt longitudinal research designs for confirming and extending our findings. Second,
we used a single-informant design with self-reported subjective data that may be a source of
common method bias, though our tests show that it should be minimal. Third, the
generalizability of results is restricted to large US-based firms/SBUs operating in B2C industries.
Future studies may explore CA use in SMEs, B2B sectors and other geographical contexts.
Fourth, this study focused on CA use in customer relationship management. Future research may
seek to improve understanding about how CA use influences firms’ general capabilities in
marketing, operations and R&D (Krasnikov and Jayachandran 2008). Finally, we examined CA
use as an organization -level concept. Future research efforts may apply more fine-grained levels
of analysis to investigate the business impacts of offline vs online CA use, CA use for automated
decision support vs strategic decision making, and of CA use across various web, text, sentiment,
social network, mobile and sensor-based analytical tools (Chen et al. 2012).
REFERENCES
Ahearne, M., Jelinek, R. and Rapp, A. 2005. “Moving beyond the direct effect of SFA adoption
on salesperson performance: Training and support as key moderating factors”, Industrial
Marketing Management, (34:4), pp. 379−388.
Armstrong, J. S., and Overton, T. S. 1977. “Estimating Nonresponse Bias in Mail Surveys,”
Journal of Marketing Research (14), pp. 396−402.
Arndt J. 1979. “Toward a Concept of Domesticated Markets”, Journal of Marketing, (43), pp.
69-75.
Bailey, J. E. and Pearson, S. W. 1983. “Development of a tool for measuring and analyzing
computer user satisfaction”, Management Science, (29:5), pp. 530–545.
Balasubramanian, S., Peterson, R. A., and Jarvenpaa, S. L. 2002. “Exploring the Implications of
M-Commerce for Markets and Marketing”, Journal of The Academy of Marketing Science,
(30:4), pp. 348-361.
Baron, R. M., and Kenny, D. A. 1986. “The Moderator-Mediator Variable Distinction in Social
Psychological Research: Conceptual, Strategic, and Statistical Considerations,” Journal of
Personality and Social Psychology (51:6), pp. 1173-1182.
34
Barton, D., and Court, D. 2012. “Making Advanced Analytics Work for You”, Harvard Business
Review, (October 2012), pp. 79-83.
Becker, J. U., Greve, G. and Albers, S. 2009. “The impact of technological and organizational
implementation of CRM on customer acquisition, maintenance, and retention”, International
Journal of Research in Marketing, (26), pp. 207–215.
Bloomberg 2012. “The Current State of Business Analytics: Where Do We Go From Here)”,
Bloomberg Businessweek Research Services.
Bolton, R. N., Lemon, K. N., and Verhoef, P. C. .2004. “The Theoretical Underpinnings of
Customer Asset Management: A Framework and Propositions for Future Research”, Journal
of the Academy of Marketing Science, (32:3), pp. 271-292.
Brown, P., Chui, M., and Manyika, J. 2012. “Are You Ready for the Era of Big Data?”, In:
Perspectives on Digital Business, pp. 27-35. McKinsey & Company: McKinsey Center for
Business Technology.
Brynjolfsson E., Hitt L.M., and Kim H.H. 2011. “Strength in Numbers: How Does Data-Driven
Decision Making Affect Firm Performance?” SSRN working paper. Available at SSRN:
http://ssrn.com/abstract = 1819486.
Cap Gemini 2012. “The Deciding Factor: Big Data & Decision Making”, Cap Gemini Research
Reports.
Castèran, H., Meyer-Waarden, L., and Reinartz, W. 2017. “Retention and Churn Modelling”, in
Handbook of Market Research, eds. Homburg, C., Klarmann, M., and Vomberg, A. Springer
Verlag.
Chaudhuri, S., Dayal, U., and Narasayya, V. 2011. “An Overview of Business Intelligence
Technology”, Communications of the ACM, (54:8), pp. 88-98.
Chen, H., Chiang, R. H. L., and Storey, V. C. 2012. “Business Intelligence and Analytics: From
Big Data to Big Impact”, MIS Quarterly (36:4), pp. 1165-1188.
Chen, D. Q., Preston, D. S., and Swink, M. 2015. “How the Use of Big Data Analytics Affects
Value Creation in Supply Chain Management”, Journal of Management Information
Systems, (32:4), pp. 4–39.
CMO Survey 2016. “CMO Survey Report: Highlights and Insights,” <
https://cmosurvey.org/wp-content/uploads/sites/11/2016/02/ The_CMO_Survey-
Highlights_and_Insights-Feb-2016.pdf/>, February 2016, retrieved April 10th
2017.
Côrte-Real, N., Oliveira, T., and Ruivo, P. 2017. “Assessing business value of Big Data
Analytics in European firms”, Journal of Business Research, (70), pp. 379–390.
Day, G. S. 1994. “The Capabilities of Market-Driven Organisations,” Journal of Marketing
(58:4), pp. 37–52.
Day, G. S. 2011. “Closing the Marketing Capabilities Gap,” Journal of Marketing, (75), July, pp.
183-195.
Day, G.S. and Wensley, R. 1988. “Assessing advantage: a framework for diagnosing competitive
superiority”, Journal of Marketing, (52:2), pp. 1-20.
Devaraj, S., and Kohli, R. 2003. "Performance Impacts of Information Technology: Is Actual
Usage the Missing Link?", Management Science, (49:3), pp. 273-289.
Deshpandé, R., Farley, J. U. and Webster, F. E. 1993. “Corporate Culture, Customer Orientation,
and Innovativeness in Japanese Firms: A Quadrad Analysis”, Journal of Marketing, (57:1),
pp. 23–37.
Dowling G.R., and Uncles M. 1997. “Do Customer Loyalty Programs Really Work?”, Sloan
Management Review, (Summer 1997), pp. 71-82.
35
Edwards, J. R., and Lambert, L. S. 2007. “Methods for Integrating Moderation and Mediation: A
General Analytical Framework Using Moderated Path Analysis,” Psychological Methods
(12), pp. 1-22.
Einav, L., and Levin, J. D. 2013. “The Data Revolution and Economic Analysis”, In: NBER
Working Paper Series, Nr. 19035, (http://nber.org/papers/w19035).
Fader P., and Schmittlein D. 1993. “Excess Behavioral Loyalty for High-Share Brands:
Deviations from the Dirichlet Model for Repeat Purchasing“, Journal of Marketing
Research, (30:4), pp. 478-93.
Fehrenbacher, D. D. and Helfert, M. 2012. “Contextual Factors Influencing Perceived
Importance and Trade-offs of Information Quality”, Comunications of the Association for
Information Systems, (30:8), pp. 111-126.
Fornell, C., and Larcker, D. F. 1981. “Evaluating Structural Equation Models with Unobservable
Variables and Measurement Error,” Journal of Marketing Research (18:1), pp. 39-50.
Fosso Wamba S., Akter, S., Edwards, A., Chopin, G., and Gnanzou, D. 2015. “How ‘Big Data’
Can Make a Big Iimpact: Findings froma Systematic Review and a Longitudinal Case
Study,” International Journal of Production Economics, (65), pp. 234–246
Fosso Wamba S., Gunasekaran, A., Akter, S., Ren, S. J., Dubey, R., and Childe, S. J. 2017. “Big
data analytics and firm performance: Effects of dynamic capabilities”, Journal of Business
Research, (70), pp. 356–365.
Gartner 2013. “Magic Quadrant for Business Intelligence and Analytics Platforms”, Gartner
Research Reports: Stamford.
Gerbert, P., Justus, J., and Muller, A. 2016. “The Double Game of Digital Management.
Managing in Times of Big Data and Analytics”, BCG Perspectives, <
https://www.bcgperspectives.com/Images/BCG-Double-Game-of-Digital-Management-Jul-
2016_tcm80-212395.pdf/>, 07/27/2016, retrieved April 10th
2017.
Germann, F., Lilien G. L., and Rangaswamy A. 2013. ”Performance implications of deploying
marketing analytics,” International Journal of Research in Marketing, (30:2), pp. 114-128.
Gillon, K., Aral, S., Ching-Yung, L., Mithas, S., and Zozulia, M. 2014 “Business analytics:
Radical shift or incremental change?”, Communications of the Association for Information
Systems, (34), pp. 287–296.
Glady, N., Lemmens, A., and Croux, C. 2015. “Unveiling the relationship between the
transaction timing, spending and dropout behavior of customers”, International Journal of
Research in Marketing, (32:1), pp. 78-93.
Gupta, S., Lehmann, D. R. and Stuart, J. A. 2004. “Valuing customers”, Journal of Marketing
Research, (41:1), pp. 7–18.
Hair, J. F., Ringle, C. M., and Sarstedt, M. 2011. “PLS-SEM: Indeed a Silver Bullet,” Journal of
Marketing Theory and Practice (19:2), pp. 139-151.
Hair, J.F., Hult, G.T.M., Ringle, C., and Sarstedt, M. 2017. A Primer on Partial Least Squares
Structural Equation Modeling (PLS-SEM). 2nd
Ed. Thousand Oaks, CA: Sage.
Homburg, C., Workman, J. P., Jr., and Krohmer, H. 1999. “Marketing’s Influence within the
Firm,” Journal of Marketing, (63:2), pp. 1–17.
Janssen, M., van der Voort, H., and Wahyudi, A. 2017. “Factors influencing big data decision-
making quality”, Journal of Business Research, (70), pp. 338–345.
Jayachandran, S., Sharma, S., Kaufman, P. and Raman, P. 2005. “The Role of Relational
Information Processes and Technology Use in Customer Relationship Management”, Journal
of Marketing, (69:10), pp. 177-192.
36
Jelinek, M., and Bergey, P. 2013. “Innovation as the Strategic Driver of Sustainability: Big Data
Knowledge for Profit and Survival”, IEEE Engineering Management Review, (41:2), pp. 14-
22.
Kahn B. K. M., and Morrison D. 1988. “Niching versus Change-of-Pace Brands: Using Purchase
Frequencies and Penetration Rates to Infer Brand Positionings”, Journal of Marketing
Research, (15:4), pp. 384-90.
Kenny, D.A. 2008. “Reflections on Mediation,” Organizational Research Methods (11:2), pp.
353-358.
Kirca, A. H., Jayachandran, S. and Bearden, W. O. 2005. “Market Orientation: A Meta-Analytic
Review and Assessment of Its Antecedents and Impact on Performance”, Journal of
Marketing, (69:4), pp. 24-41.
Kohli, A. K., and Jaworski, B. J. 1990. “Market Orientation: The Construct, Research
Propositions, and Managerial Implications”, Journal of Marketing, (54:2), pp. 1–19.
Krasnikov, A., and Jayachandran, S. 2008. “The Relative Impact of Marketing, Research-and-
Development, and Operations Capabilities on Firm Performance,” Journal of Marketing,
(72:7), pp. 1-11.
Kumar, N., Stern, L. W., and Anderson, J. C. 1993. “Conducting Interorganizational Research
Using Key Informants,” Academy of Management Journal (36:6), pp. 1633-1651.
Kumar, V., and Reinartz, W. 2006. “Customer relationship management: A databased approach.
New York: John Wiley.
Kumar, V., Jones, E., Venkatesan, R., and Leone, R. P. 2011. “Is Market Orientation a Source of
Sustainable Competitive Advantage or Simply the Cost of Competing?”, Journal of
Marketing, (75:1), pp. 16–30.
Kumar, V., Venkatesan, R., Bohling, T., and Beckmann, D. 2008. “Practice prize report: The
power of CLV: Managing customer lifetime value at IBM”, Marketing Science, (27:4), pp.
585–599.
LaValle, S., Lesser, E., Shockley, R., Hopkins, M. S., and Kruschwitz, N. 2011. “Big Data,
Analytics, and the Path from Insights to Value”, MIT Sloan Management Review, (52:2), pp.
21-31.
Lee, Y., Strong, D. M., Kahn, B. K. and Wang, R. Y. 2002. “AIMQ: A Methodology for
Information Quality Assessment”, Information & Management, (40:2), pp. 133–146.
Lindell, M. K., and Whitney, D. J. 2001. “Accounting for Common Method Variance in Cross
Sectional Research Designs,” Journal of Applied Psychology, (86), pp. 114-121.
MacKenzie, S. B., Podsakoff, P. M., and Podsakoff, N. P. 2011. “Construct Measurement and
Validation Procedures in MIS and Behavioral Research: Integrating New and Existing
Techniques,” MIS Quarterly (35:2), pp. 293-334.
Manyika J., Chui, M., Brown, B., Bughin, J., Dobbs, R., Rosburg, C., and Hung Byers, A. 2011.
“Big Data: The Next Frontier for Innovation, Competition, and Productivity”, McKinsey &
Company: McKinsey Global Institute.
McAfee, A., and Brynjolfsson, E. 2012. “Big Data: The Management Revolution”, Harvard
Business Review, (October 2012), pp. 60-68.
McGahan A. M., and Ghemawat P. 1994. “Competition to Retain Customers”, Marketing
Science, (13:2), pp. 165-176.
Menon, A. and Varadarajan, P. R. 1992. “A Model of Marketing Knowledge Use Within Firms”,
Journal of Marketing, (56:10), pp. 53–72.

37
Menon, A., Varadarajan, P. R., Adidam, P. T., and Edison, S. W. 1999. “Antecedents and
Consequences of Marketing Strategy Making: A Model and Test,” Journal of Marketing,
(63), pp. 18–40.
Mithas, S., Krishnan M. S. and Fornell, C. 2005. “Why Do Customer Relationship Management
Applications Affect Customer Satisfaction?”, Journal of Marketing, (69:10), pp. 201-209.
Moorman, C. 1995. “Organizational Market Information Processes: Cultural Antecedents and
New Product Outcomes”, Journal of Marketing Research, (32:8), pp. 318–36.
Moorman, C. 2013. “The Utilization Gap: Big Data's Biggest Challenge”, Forbes Magazine, <
https://www.forbes.com/sites/christinemoorman /2013/03/17/the-utilization-gap-big-datas-
biggest-challenge/#4419d77e 3563/>, 03/17/2013, retrieved April 10th
2017.
Morgan, R., and Hunt, S. 1994. “The Commitment-Trust Theory of Relationship Marketing,”
Journal of Marketing, (58:3), pp. 20-38.
Mowen, J. C., Fang, X., and Scott, K. 2009. “A Hierarchical Model Approach for Identifying the
Trait Antecedents of General Gambling Propensity and of Four Gambling-Related Genres,”
Journal of Business Research,(62), pp. 1262–1268.
Narver, J. C. and Slater, S. F. 1990. “The Effect of a Market Orientation on Business
Profitability”, Journal of Marketing, (54:10), pp. 20-35.
Nunan, D., and DiDomenico, M. 2013. “Market Research and Ethics of Big Data”, International
Journal of Market Research, (55:4), pp. 41-56.
Olson, E. M., Slater, S. F., and Hult, T. M. 2005. “The Performance Implications of Fit Among
Business Strategy, Marketing Organization Structure, and Strategic Behavior,” Journal of
Marketing, (69), pp. 49–65.
Petter, S., Straub, D., and Rai, A. 2007. “Specifying Formative Constructs in Information
Systems Research,” MIS Quarterly (31:4), pp. 623-656.
Podsakoff, P. M., MacKenzie, S. B., Lee, J. Y., and Podsakoff, N. P. 2003. “Common Method
Biases in Behavioral Research: A Critical Review of the Literature and Recommended
Remedies,” Journal of Applied Psychology (88:5), pp. 879−903.
Preacher, K. J., and Hayes, A. F. 2008. “Asymptotic and Resampling Strategies for Assessing
and Comparing Indirect Effects in Multiple Mediator Models,” Behavior Research Methods
(40:3), pp. 879-91.
Reinartz, W., Krafft, M. and Hoyer, W. D. 2004. “The customer relationship management
process: Its measurement and impact on performance”, Journal of Marketing Research,
(41:8), pp. 293–305.
Richardson, H. A., Simmering, M. J., and Sturman, M. C. 2009. “A Tale of Three Perspectives:
Examining Post Hoc Statistical Techniques for Detection and Correction of Common
Method Variance,” Organizational Research Methods, (12), pp. 762-800.
Ringle, C. M., Wende, S., and Becker, J.-M. 2015. SmartPLS 3, Bönningstedt: SmartPLS.
Retrieved from http://www.smartpls.com.
Roberts, J. H., Kayande, U., and Stremersch, S. 2014. “From academic research to marketing
practice: Exploring the marketing science value chain”, International Journal of Research in
Marketing, (31:2), pp. 127-140.
Rust R., Kumar V., and Venkatesan R. 2011. “Will the frog change into a prince? Predicting
future customer profitability”, International Journal of Research in Marketing, (28:4), pp.
281-294.
Rust, R. T., Moorman, C. and Dickson, P. R. 2002. “Getting Return on Quality: Revenue
Expansion, Cost Reduction, or Both?”, Journal of Marketing, (66:10), pp. 7–25.

38
Sahoo N., Param V.S., and Mukhopadhyay T. 2012. “A hidden Markov model for collaborative
filtering”, MIS Quarterly, (36:4), pp. 1329-1356.
Schulze C., Skiera B., and Wiesel T. 2012. “Linking customer and financial metrics to
shareholder value: the leverage effect in customer-based valuation”, Journal of Marketing,
(76:2), pp. 17-32.
Shapiro C., and Varian H. 1998. “Information Rules: A Strategic Guide to the Network
Economy”, Harvard Business Review Press: Cambridge, MA.
Shrout, P. E., and Bolger, N. 2002. “Mediation in Experimental and Nonexperimental Studies:
New Procedures and Recommendation,” Psychological Methods (7:4), pp. 422-445.
Simmering, M. J., Fuller, C. M., Richardson, H. A., Ocal, Y., and Atinc, G. M. 2015. “Marker
Variable Choice, Reporting, and Interpretation in the Detection of Common Method
Variance: A Review and Demonstration,” Organizational Research Methods, (18:3), pp.
473-511.
Snijders, C., Matzat, U., and Reips, U.-D. 2012. "'Big Data': Big gaps of knowledge in the field
of Internet”, International Journal of Internet Science, (7), pp. 1–5.
Song, M., Di Benedetto, C. A., and Nason, R. W. 2007. “Capabilities and Financial
Performance: The Moderating Effect of Strategic Type,” Journal of the Academy of
Marketing Science, (35:1), pp. 18–34.
Srinisavan, R. and Moorman, C. 2005. “Strategic Firm Commitments and Rewards for Customer
Relationship Management in Online Retailing”, Journal of Marketing, (69:10), pp. 193-200.
Sung-Hyuk, P., Soon-Young H., Wonseok O., and Sang P.H. 2012. ”A social network-based
inference model for validating customer profile data”, MIS Quarterly, (36:4), pp. 1217-1237.
Verhoef, P. C., and Leeflang, P. S. H. 2009. “Understanding the Marketing Department’s
Influence Within the Firm,” Journal of Marketing, (73), pp. 14–37.
Vorhies, D. W., and Morgan, N. A. 2005. “Benchmarking Marketing Capabilities for Sustainable
Competitive Advantage,” Journal of Marketing, (69), January, pp. 80-94.
Wang, R.Y. and Strong, D.M. 1996. “Beyond Accuracy: What Data Quality Means to Data
Consumers”, Journal of Management Information Systems, (12:4), pp. 5–34.
Webster, F. E. 1988. “Rediscovering the marketing concept”, Business Horizons, (31:3), pp. 29–
39.
Wedel, M. and Kannan, P. K. 2016. “Marketing Analytics for Data-Rich Environments”, Journal
of Marketing, Vol: 80, pp. 97-121.
Wixom, B. H. and Todd, P. A. 2005. “A Theoretical Integration of User Satisfaction and
Technology Acceptance”, Information Systems Research, (16:1), pp. 85-102.
Workman, J. P., Jr., Homburg, C., and Gruner, K. 1998. “Marketing Organisation: An
Integrative Framework of Dimensions and Determinants,” Journal of Marketing, (62:3), pp.
21–41.
Xu, J., Benbasat, I. and Cenfetelli, R. T. 2013. “Integrating Service Quality with System and
Information Quality: An Empirical Test in the E-Service Context”, MIS Quarterly, (37:3),
pp. 777-794.
Zhao, X., Lynch, J. G., and Chen, Q. 2010. “Reconsidering Baron and Kenny: Myths and Truths
about Mediation Analysis,” Journal of Consumer Research (37), pp. 197-206.
Zheng, Y., Zhao, K. and Stylianou, A. 2013. “The impacts of information quality and system
quality on users’ continuance intention in information-exchange virtual communities: An
empirical investigation”, Decision Support Systems, (56), pp. 513-524.
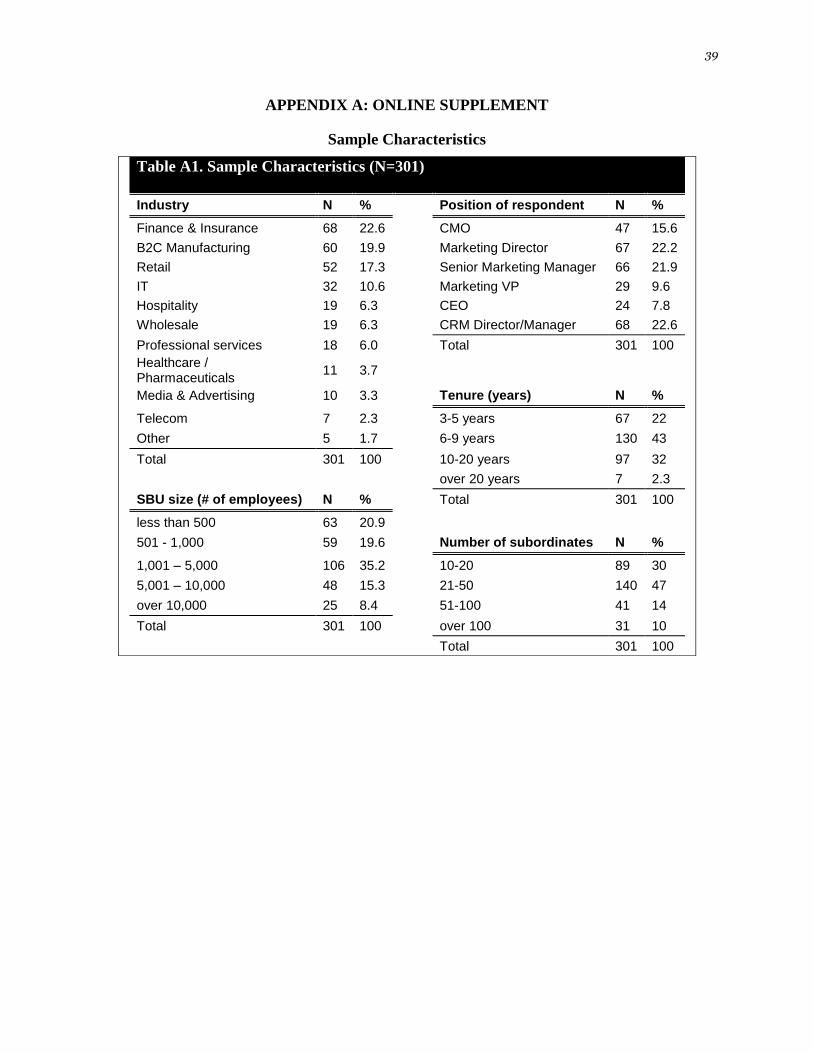
39
APPENDIX A: ONLINE SUPPLEMENT
Sample Characteristics
Table A1. Sample Characteristics (N=301)
Industry N %
Position of respondent N %
Finance & Insurance 68 22.6
CMO 47 15.6
B2C Manufacturing 60 19.9
Marketing Director 67 22.2
Retail 52 17.3
Senior Marketing Manager 66 21.9
IT 32 10.6
Marketing VP 29 9.6
Hospitality 19 6.3
CEO 24 7.8
Wholesale 19 6.3
CRM Director/Manager 68 22.6
Professional services 18 6.0
Total 301 100
Healthcare / Pharmaceuticals
11 3.7
Media & Advertising 10 3.3
Tenure (years) N %
Telecom 7 2.3
3-5 years 67 22
Other 5 1.7
6-9 years 130 43
Total 301 100
10-20 years 97 32
over 20 years 7 2.3
SBU size (# of employees) N %
Total 301 100
less than 500 63 20.9
501 - 1,000 59 19.6
Number of subordinates N %
1,001 – 5,000 106 35.2
10-20 89 30
5,001 – 10,000 48 15.3
21-50 140 47
over 10,000 25 8.4
51-100 41 14
Total 301 100
over 100 31 10
Total 301 100
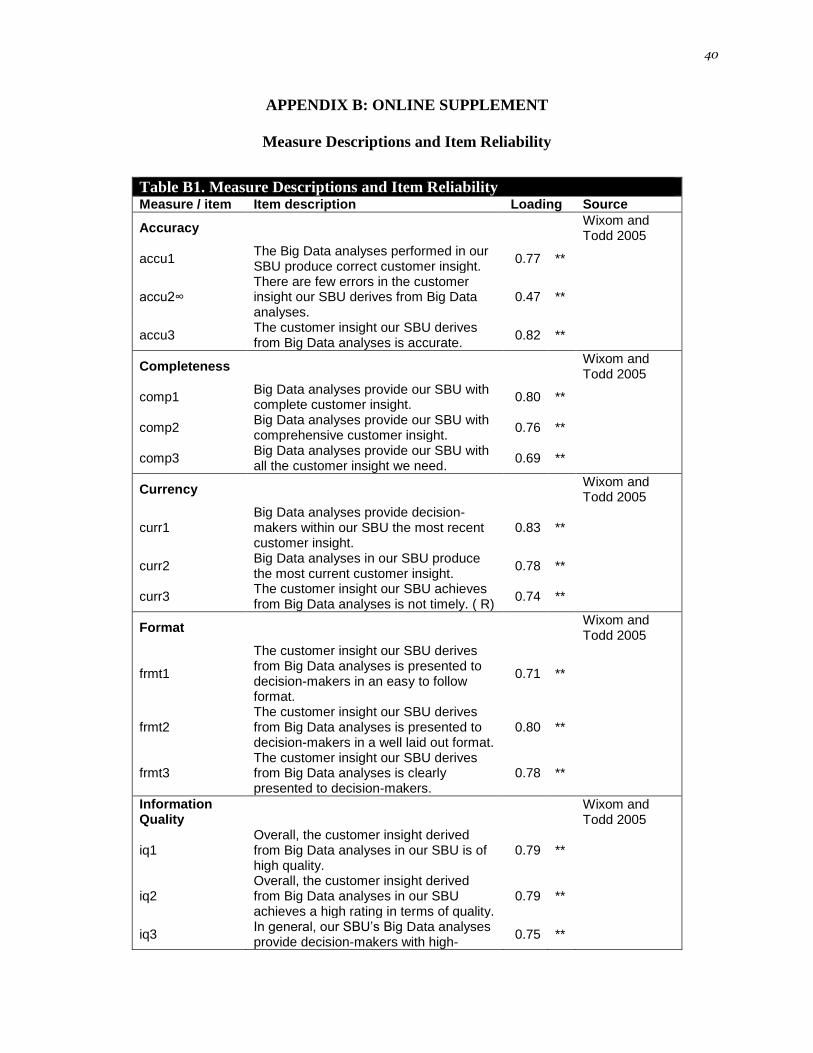
40
APPENDIX B: ONLINE SUPPLEMENT
Measure Descriptions and Item Reliability
Table B1. Measure Descriptions and Item Reliability Measure / item Item description Loading Source
Accuracy Wixom and Todd 2005
accu1 The Big Data analyses performed in our SBU produce correct customer insight.
0.77 **
accu2∞ There are few errors in the customer insight our SBU derives from Big Data analyses.
0.47 **
accu3 The customer insight our SBU derives from Big Data analyses is accurate.
0.82 **
Completeness Wixom and Todd 2005
comp1 Big Data analyses provide our SBU with complete customer insight.
0.80 **
comp2 Big Data analyses provide our SBU with comprehensive customer insight.
0.76 **
comp3 Big Data analyses provide our SBU with all the customer insight we need.
0.69 **
Currency Wixom and Todd 2005
curr1 Big Data analyses provide decision-makers within our SBU the most recent customer insight.
0.83 **
curr2 Big Data analyses in our SBU produce the most current customer insight.
0.78 **
curr3 The customer insight our SBU achieves from Big Data analyses is not timely. ( R)
0.74 **
Format Wixom and Todd 2005
frmt1
The customer insight our SBU derives from Big Data analyses is presented to decision-makers in an easy to follow format.
0.71 **
frmt2 The customer insight our SBU derives from Big Data analyses is presented to decision-makers in a well laid out format.
0.80 **
frmt3 The customer insight our SBU derives from Big Data analyses is clearly presented to decision-makers.
0.78 **
Information Quality
Wixom and Todd 2005
iq1 Overall, the customer insight derived from Big Data analyses in our SBU is of high quality.
0.79 **
iq2 Overall, the customer insight derived from Big Data analyses in our SBU achieves a high rating in terms of quality.
0.79 **
iq3 In general, our SBU’s Big Data analyses provide decision-makers with high-
0.75 **

41
quality customer insight.
Customer Orientation
Narver and Slater 1990
co1 Our SBU constantly monitors its level of commitment and orientation to serving customer needs.
0.73 **
co2 Our SBU’s strategy for competitive advantage is based on a superior understanding of customers’ needs.
0.75 **
co3∞ Our SBU measures customer satisfaction systematically and frequently.
0.66 **
co4 Our SBU exists primarily to serve customers.
0.69 **
Big Data Analytics Culture
Germann et al. 2013
cul1 If our SBU reduces its Big Data analytics activities, its profits will suffer.
0.20
*
cul2 The use of Big Data analytics improves our SBU’s ability to satisfy its customers.
0.72
**
cul3 Most people in our SBU are skeptical of Big Data-based results and recommendations. (R) 0.35
**
Big Data Customer Analytics Use
Our SBU regularly uses Big Data analytics to…
Jayachandran et al. 2005
use1 develop customer profiles. 0.19 ** use2 segment markets. 0.23 ** use3 assess customer retention. 0.12 *
use4 identify appropriate channels to reach customers. 0.14
**
use5 customize our offers. 0.21 ** use6 identify our best customers. 0.13 *
use7 to assess the lifetime value of our customers. 0.20
**
use8 to personalize the marketing mix. 0.29 **
Customer Relationship Performance
In the most recent year, relative to your major competitors, how has your SBU performed with respect to:
Rust et al. 2002
crp1 Achieving customer satisfaction? 0.80 ** crp2 Keeping current customers? 0.79 ** crp3 Attracting new customers? 0.77 **
Financial Performance
In the most recent year, relative to your major competitors, how has your SBU performed with respect to:
Rust et al. 2002
fp1 Sales? 0.80 ** fp2 Profitability? 0.82 ** fp3 Market share? 0.77 **
Competitive Intensity
Kohli and Jaworski 1990
ci1 Competition in our industry is cutthroat. 0.79 ** ci2 One hears of a new competitive move in 0.83 **
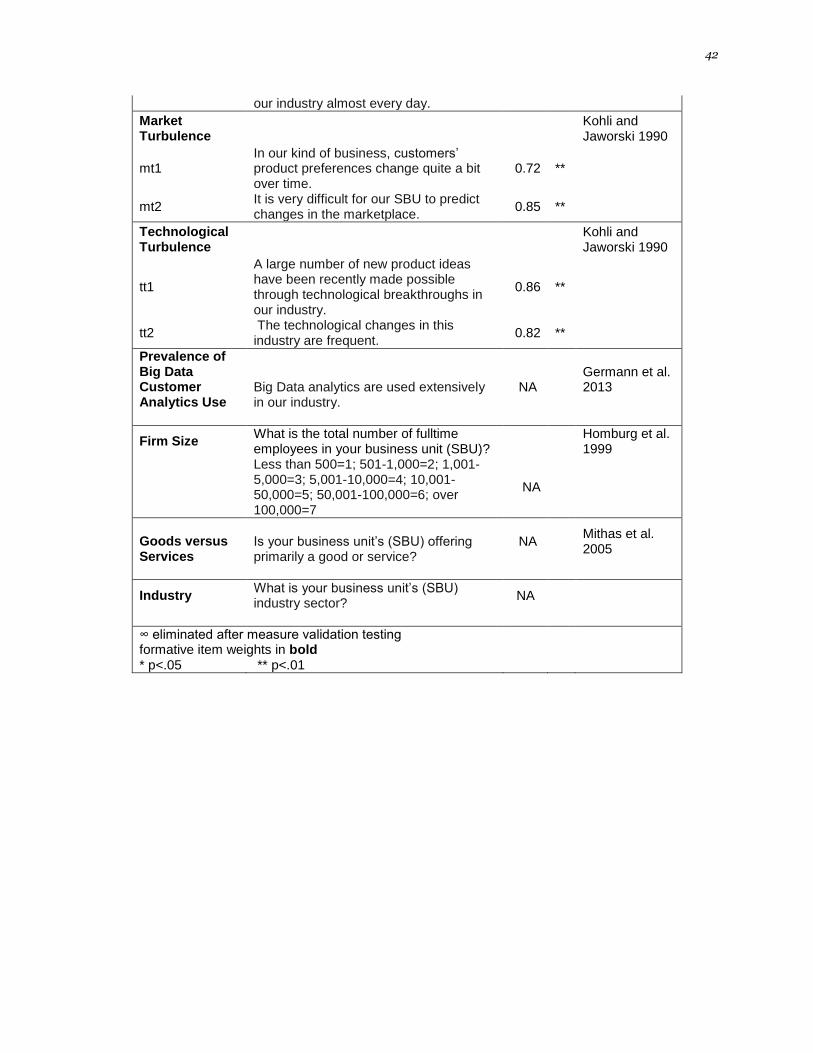
42
our industry almost every day.
Market Turbulence
Kohli and Jaworski 1990
mt1 In our kind of business, customers’ product preferences change quite a bit over time.
0.72 **
mt2 It is very difficult for our SBU to predict changes in the marketplace.
0.85 **
Technological Turbulence
Kohli and Jaworski 1990
tt1
A large number of new product ideas have been recently made possible through technological breakthroughs in our industry.
0.86 **
tt2 The technological changes in this industry are frequent.
0.82 **
Prevalence of Big Data Customer Analytics Use
Big Data analytics are used extensively in our industry.
NA
Germann et al. 2013
Firm Size What is the total number of fulltime employees in your business unit (SBU)?
Homburg et al. 1999
Less than 500=1; 501-1,000=2; 1,001-5,000=3; 5,001-10,000=4; 10,001-50,000=5; 50,001-100,000=6; over 100,000=7
NA
Goods versus Services
Is your business unit’s (SBU) offering primarily a good or service?
NA Mithas et al. 2005
Industry What is your business unit’s (SBU) industry sector?
NA
∞ eliminated after measure validation testing
formative item weights in bold
* p<.05 ** p<.01
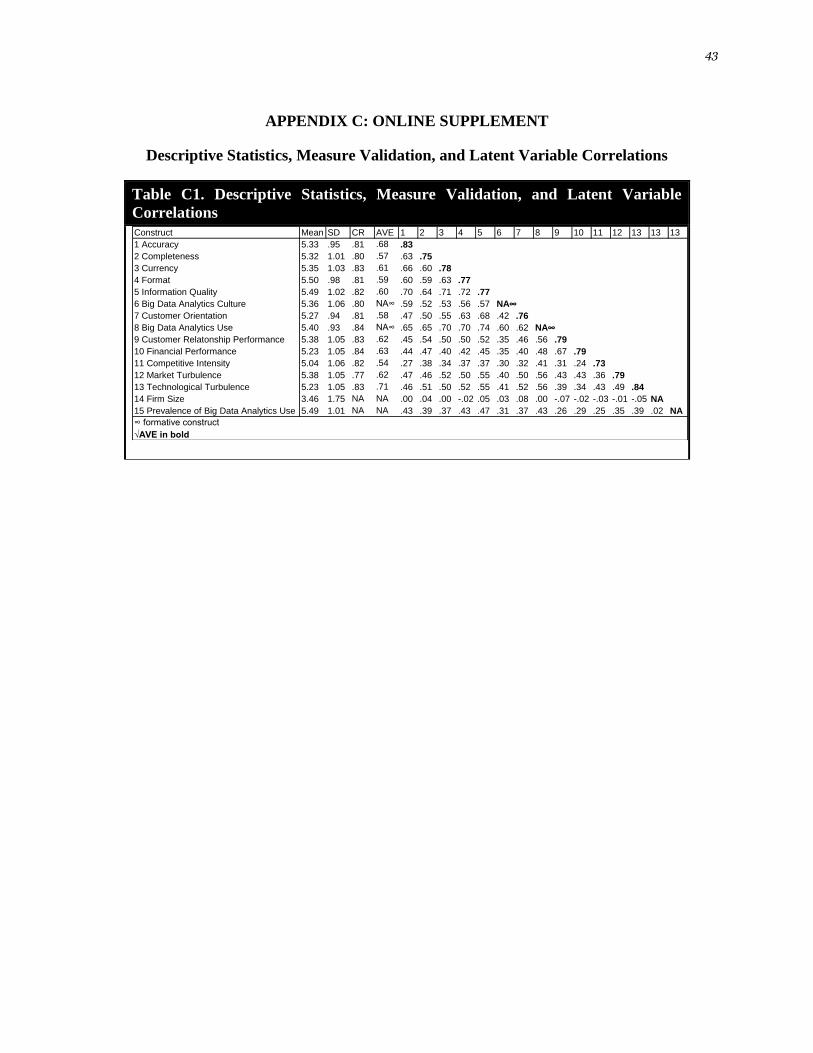
43
APPENDIX C: ONLINE SUPPLEMENT
Descriptive Statistics, Measure Validation, and Latent Variable Correlations
Table C1. Descriptive Statistics, Measure Validation, and Latent Variable
Correlations
Construct Mean SD CR AVE 1 2 3 4 5 6 7 8 9 10 11 12 13 13 13
1 Accuracy 5.33 .95 .81 .68 .83
2 Completeness 5.32 1.01 .80 .57 .63 .75
3 Currency 5.35 1.03 .83 .61 .66 .60 .78
4 Format 5.50 .98 .81 .59 .60 .59 .63 .77
5 Information Quality 5.49 1.02 .82 .60 .70 .64 .71 .72 .77
6 Big Data Analytics Culture 5.36 1.06 .80 NA∞ .59 .52 .53 .56 .57 NA∞
7 Customer Orientation 5.27 .94 .81 .58 .47 .50 .55 .63 .68 .42 .76
8 Big Data Analytics Use 5.40 .93 .84 NA∞ .65 .65 .70 .70 .74 .60 .62 NA∞
9 Customer Relatonship Performance 5.38 1.05 .83 .62 .45 .54 .50 .50 .52 .35 .46 .56 .79
10 Financial Performance 5.23 1.05 .84 .63 .44 .47 .40 .42 .45 .35 .40 .48 .67 .79
11 Competitive Intensity 5.04 1.06 .82 .54 .27 .38 .34 .37 .37 .30 .32 .41 .31 .24 .73
12 Market Turbulence 5.38 1.05 .77 .62 .47 .46 .52 .50 .55 .40 .50 .56 .43 .43 .36 .79
13 Technological Turbulence 5.23 1.05 .83 .71 .46 .51 .50 .52 .55 .41 .52 .56 .39 .34 .43 .49 .84
14 Firm Size 3.46 1.75 NA NA .00 .04 .00 -.02 .05 .03 .08 .00 -.07 -.02 -.03 -.01 -.05 NA
15 Prevalence of Big Data Analytics Use 5.49 1.01 NA NA .43 .39 .37 .43 .47 .31 .37 .43 .26 .29 .25 .35 .39 .02 NA
∞ formative construct
√AVE in bold
44
APPENDIX D: ONLINE SUPPLEMENT
Mediation Testing Using the Bootstrapping Method
The most advanced method for examining indirect effects is bootstrapping (Edwards and
Lambert 2007; Kenny 2008; Preacher and Hayes 2008; Zhao et al. 2010). Adopting Preacher and
Hayes’ (2008) bootstrapping macros for SPSS, each mediation path was assessed in the
structural model. The bootstrapping procedure is a non-parametric test without normality
assumptions which creates confidence intervals (CI) for the indirect effect. We used 5000
bootstrapping resamples with 95% bias-corrected confidence intervals to test our hypotheses.
Significant paths X→M (path a) and M→Y (path b) are necessary prerequisites for the
indirect effect X→M→Y (path ab) to occur. In contrast with Baron and Kenny’s (1986) third
condition for mediation, a significant direct effect X→Y (path c) is not necessary to establish
mediating effects. X→Y’s direct effect c does not represent the effect to be mediated but the
total effect, which is the zero-order effect of simultaneous direct and indirect effects c = c’ + ab
(c’ is the direct path when ab is controlled for). If the direct effect c’ is negative, the indirect
effect ab may be significant when the total effect c is not. Thus, the indirect effect is assessed
solely based on the strength of X→M→Y (path ab) (Edwards and Lambert 2007; Preacher and
Hayes 2008; Shrout and Bolger 2002).
Zhao et al. (2010) refined Baron and Kenny’s (1986) four tests of mediation. Following
Zhao et al’s (2010) classification of mediation and non-mediation types, we analyzed mediation
effects as: (1) complementary (significant and positive ab and c’); (2) competitive (significant ab
and c’ with opposite signs); (3) indirect-only (significant ab , no direct effect c’); (4) direct-only
non-mediation (significant c’, no indirect effect ab); and (5) no-effect non-mediation (no direct
or indirect effect exists). Baron and Kenny’s (1996) third and fourth condition tests (significance
of c and c’ paths) are used to determine the type of mediation taking place, which provides
additional information regarding the validity of mediators in the research model. Complementary
mediation overlaps with partial mediation, indirect-only mediation with full mediation, and no-
effect non-mediation with no mediation (Zhao et al. 2010). Competitive mediation, in turn, may
be partial or full mediation where the opposite sign of direct effect c’ indicates the possibility of
alternative mediators.
REFERENCES
Baron, R. M., and Kenny, D. A. 1986. “The Moderator-Mediator Variable Distinction in Social
Psychological Research: Conceptual, Strategic, and Statistical Considerations,” Journal of
Personality and Social Psychology (51:6), pp. 1173-1182.
Edwards, J. R., and Lambert, L. S. 2007. “Methods for Integrating Moderation and Mediation: A
General Analytical Framework Using Moderated Path Analysis,” Psychological Methods
(12), pp. 1-22.
Germann, F., Lilien G. L., and Rangaswamy A. 2013. ”Performance Implications of Deploying
Marketing Analytics,” International Journal of Research in Marketing, (30:2), pp. 114-128.
Homburg, C., Workman, J. P., Jr., and Krohmer, H. 1999. “Marketing’s Influence within the
Firm,” Journal of Marketing, (63:2), pp. 1–17.

45
Jayachandran, S., Sharma, S., Kaufman, P. and Raman, P. 2005. “The Role of Relational
Information Processes and Technology Use in Customer Relationship Management”, Journal
of Marketing, Vol:69, No:10, pp. 177-192.
Kenny, D.A. 2008. “Reflections on Mediation,” Organizational Research Methods (11:2), pp.
353-358.
Kohli, A. K., and Jaworski, B. J. 1990. “Market Orientation: The Construct, Research
Propositions, and Managerial Implications”, Journal of Marketing, (54:2), pp. 1–19.
Mithas, S., Krishnan M. S. and Fornell, C. 2005. “Why Do Customer Relationship Management
Applications Affect Customer Satisfaction?”, Journal of Marketing, Vol:69, No:10, pp. 201-
209.
Narver, J. C. and Slater, S. F. 1990. “The Effect of a Market Orientation on Business
Profitability”, Journal of Marketing, Vol:54, No:10, pp. 20-35.
Preacher, K. J., and Hayes, A. F. 2008. “Asymptotic and Resampling Strategies for Assessing
and Comparing Indirect Effects in Multiple Mediator Models,” Behavior Research Methods
(40:3), pp. 879-91.
Rust, R. T., Moorman, C. and Dickson, P. R. 2002. “Getting Return on Quality: Revenue
Expansion, Cost Reduction, or Both?”, Journal of Marketing, Vol:66, No:10, pp. 7–25.
Shrout, P. E., and Bolger, N. 2002. “Mediation in Experimental and Nonexperimental Studies:
New Procedures and Recommendation,” Psychological Methods (7:4), pp. 422-445.
Wixom, B. H. and Todd, P. A. 2005. “A Theoretical Integration of User Satisfaction and
Technology Acceptance”, Information Systems Research, (16:1), pp. 85-102.
Zhao, X., Lynch, J. G., and Chen, Q. 2010. “Reconsidering Baron and Kenny: Myths and Truths
about Mediation Analysis,” Journal of Consumer Research (37), pp. 197-206.


![Project Number: MAJ 0000 - University of Strathclyde€¦ · [Project Title] Project Execution Plan (PEP) PMP T09 Project Number: MAJ 0000](https://static.fdocuments.in/doc/165x107/5adc4ced7f8b9ae1408b5cfd/project-number-maj-0000-university-of-strathclyde-project-title-project-execution.jpg)