Project: Muirhead – Controlled Action · 0 27 March 2012 Draft for Client Review MED SMK CF CF...
38
Project: Muirhead – Controlled Action Nutrient Fate Modelling Reference: 38110 Prepared for: Defence Housing Australia Revision: 0 27 March 2012
Transcript of Project: Muirhead – Controlled Action · 0 27 March 2012 Draft for Client Review MED SMK CF CF...

Project: Muirhead – Controlled Action Nutrient Fate Modelling
Reference: 38110
Prepared for: Defence Housing Australia
Revision: 0
27 March 2012

ii
Project 38110| File Nutrient Fate Model Close Out Report.docx | 27 March 2012 |
Revision 0
Document Control Record
Document prepared by:
Aurecon Australia Pty Ltd
ABN 54 005 139 873
Level 1, 242 Mulgrave Road Cairns QLD 4870
PO Box 7625 Cairns QLD 4870 Australia T F E W
+61 7 4051 6266 +61 7 4051 2540 [email protected] aurecongroup.com
A person using Aurecon documents or data accepts the risk of:
a) Using the documents or data in electronic form without requesting and checking them for accuracy against the original hard copy version.
b) Using the documents or data for any purpose not agreed to in writing by Aurecon.
Report Title Nutrient Fate Modelling
Document ID Project Number 38110
File Path C:\Users\stephanie.kiem\Desktop\temp\Nutrient_Fate_Model_Close_Out_Report.docx
Client Defence Housing Australia
Client Contact
Rev Date Revision Details/Status Prepared by Author Verifier Approver
0 27 March 2012 Draft for Client Review MED SMK CF CF
Current Revision 0
Approval
Author Signature Approver Signature
Name Stephanie Kiem Name Cormac Farrell
Title Senior Environmental Engineer
Title Environmental Scientist
Project 38110 | File Nutrient Fate Model Close Out Report.docx | 27 March 2012 | Revision 0 | Page 1
Contents 1. Introduction 3
1.1 Purpose 3
1.2 Project overview 3
1.3 Background 3
1.4 Limitations of this report 7
2. Project objectives 7
3. Workshop 7
4. Nutrient Fate Model 8
4.1 GoldSim – Model Platform 8
4.2 Overview 8
4.3 Waste Water Treatment Plant 10
4.4 Existing Urban Area 15
4.5 Buffalo Creek 17
4.6 Darwin Harbour 20
4.7 Muirhead Development 20
4.8 Scenarios 21
4.8.1 General 21
4.8.2 Business As Usual (BAU) 21
4.8.3 Development with current nutrient generation 21
4.8.4 Development with reduced stormwater concentrations 22
4.8.5 Development with reduced stormwater concentrations and tertiary treatment of WWTP 23
5. Results 23
6. Recommendations 25
7. Conclusions 26
Appendices Appendix A
Workshop Presentation
Appendix B
Buffalo Creek Water Sampling Locations
Appendix C

Project 38110 | File Nutrient Fate Model Close Out Report.docx | 27 March 2012 | Revision 0 | Page 2
Model Setup
Appendix D
Scenario Results
Appendix E
References
Project 38110 | File Nutrient Fate Model Close Out Report.docx | 27 March 2012 | Revision 0 | Page 3
1. Introduction
1.1 Purpose The Muirhead Nutrient Fate Model was developed to provide predicted outcomes based on known scientific principles using Buffalo Creek water quality data to facilitate improvements in waste management infrastructure.
This document sets out the methodology used to develop the model and the results of the initial model simulations. It also includes recommendations for further options to improve the accuracy of the model predictions.
1.2 Project overview The approval for the first stage of the Muirhead Residential Subdivision was granted under the Environment Protection and Biodiversity Conservation Act 1999 (the EPBC Act) on 30 March 2011 and includes a range of conditions that Defence Housing Australia (DHA) must satisfy before further developments can commence.
These conditions specifically state any development beyond Muirhead Stage 2 can only take place once the following conditions have been met. This includes the:
• Delivery of a nutrient fate modelling study for Buffalo Creek This report outlines the results of this modelling study for Buffalo Creek.
1.3 Background Buffalo Creek is located approximately 14 km north north-east of Darwin’s central business district (CBD) and forms part of the Darwin Harbour Watershed (Figure 1). This tidal influenced creek flows into Shoal Bay (receiving waters). Shoal Bay is listed by the Northern Territory Government as a Site of International Significance (NRETAS, 2007) for a number of reasons including the following (NT, 2007) :
• Extensive tidal flats providing important feeding and roosting area for migratory shorebirds. • Small inland freshwater wetlands frequented by up to 5,000 waterbirds. • Numerous patches of rainforest around the margin of the tidal flats. • High number of threatened species including three plants, ten vertebrates and one invertebrate.

Project 38110 | File Nutrient Fate Model Close Out Report.docx | 27 March 2012 | Revision 0 | Page 4
Buffalo Creek itself consists of a long, narrow channel that grades into a few large meandering bends near its confluence with Shoal Bay (Haese & Smith, 2009). Buffalo Creek is also known to be the most polluted tributary within Darwin Harbour (Drewry, 2010), due to a number of past and present land uses, including:
• The presence of a sewage treatment plant (Leanyer-Sanderson WWTP) that continues to discharge secondary treated sewage directly into Buffalo Creek since 1971
• The discharge of untreated urban stormwater directly into the creek from existing urban development to the north
• Intermittent ongoing urban development • Existing and historic landfills • Present and past construction works • Recreational activities (including a caravan park, a water park and recreational boating) • A historic quarry mine • Historic use as a military training range
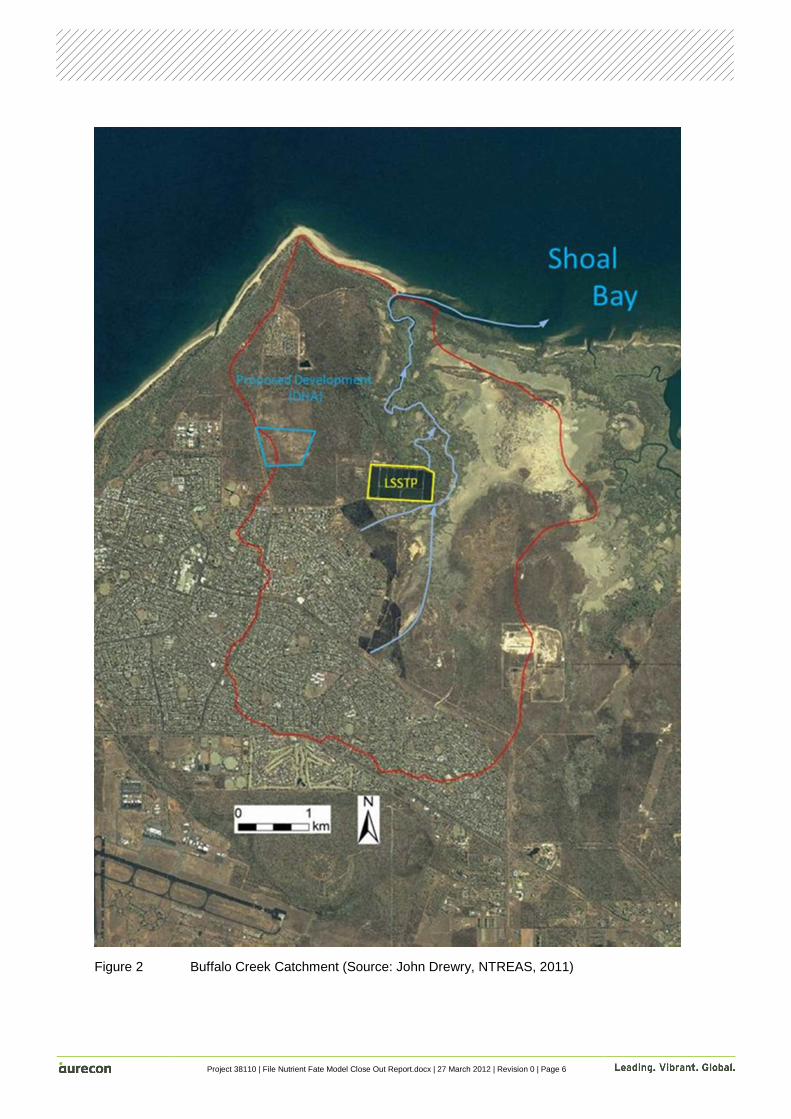
Defence Housing Australia (DHA) is proposing to develop a 1,350 dwelling residential subdivision (the Muirhead Development”) on a 167.6 ha land parcel (the “Project Area”) within Buffalo Creek’s catchment (Figure 2). The Muirhead Development has the potential to further impact on an already stressed Buffalo Creek in two primary ways:
• Municipal water generated by this development will be directed to the Leanyer-Sanderson Waste Water Treatment Plant (LSWWTP), which discharges directly into Buffalo Creek
• Alterations to stormwater quality and hydrology due to increased hard surfaces and potential sources of pollution

Project 38110 | File Nutrient Fate Model Close Out Report.docx | 27 March 2012 | Revision 0 | Page 5
Figure 1 Buffalo Creek and surrounds
Project 38110 | File Nutrient Fate Model Close Out Report.docx | 27 March 2012 | Revision 0 | Page 6
Figure 2 Buffalo Creek Catchment (Source: John Drewry, NTREAS, 2011)

Project 38110 | File Nutrient Fate Model Close Out Report.docx | 27 March 2012 | Revision 0 | Page 7
1.4 Limitations of this report All care has been taken in the preparation of this report and the model that it refers to however the accuracy of the model is dependent on the information which was used in the validation process. The water quality data that was used for the development of the model was from existing monitoring programs. These programs were not designed to be used for model development so they are limited in both temporal and spatial dimensions.
Furthermore the impact of sediments on water quality was not investigated within the model. It is known that the levels of nutrients in sediments are high (need to insert reference) and this may impact on the water quality.
The model does not take into account the impact of evaporation or seepage on the nutrient levels within Buffalo Creek. In reality water would be both lost and gained from the system through evaporation, precipitation and seepage to and from groundwater. Water loss from evaporation occurs from the ponds of the WWTP and the water body of Buffalo Creek. Both water loss and gain from seepage occurs from both the WWTP ponds and Buffalo Creek (note that groundwater seepage may also be providing a vector for leachate to find its way into Buffalo Creek for both the existing and historic landfills).
Due to both the complexity of defining suitable levels of seepage to the model and the lack of local groundwater data, this parameter was not used.
2. Project objectives The objectives of this project are to:
• Develop a nutrient fate model using the Contaminant Transport module of the simulation software GoldSim
• Undertake a workshop to confirm the assumptions and data to be used prior to the set-up of the model
• Develop the model in such a way that various dispersion rates and likely end fates from nutrients entering the creek from the existing Wastewater Treatment Plant (WWTP) can be modelled
• Develop the model to allow for future upgrades and to provide a basis for on-going planning and impact estimation for the upgraded WWTP.
3. Workshop A workshop was held on the 20th October 2011 to discuss the nutrient model with potential stakeholders. The purpose of this meeting was to identify information sources for the model and determine the basic structure of the model. A copy of the Workshop Presentation is included in Appendix A. The workshop included representatives from Power and Water Corporation (P&WC), Department of Natural Resources, Environment, The Arts and Sport (NRETAS) and Charles Darwin University. The Department of Sustainability, Environment, Water, Population and Communities (SEWPaC) was invited to attend but declined to attend.

Project 38110 | File Nutrient Fate Model Close Out Report.docx | 27 March 2012 | Revision 0 | Page 8
4. Nutrient Fate Model
4.1 GoldSim – Model Platform GoldSim is simulation software that allows the user to carry out dynamic, probabilistic simulations.
The GoldSim Contaminant Transport Module is a program extension to GoldSim which allows users to probabilistically simulate the release, transport and fate of mass (eg contaminants) within complex engineered and/or natural environmental systems.
A mass transport model is a mathematical representation of an actual system (eg the subsurface environment near a waste disposal site) which can be used to simulate (and hence predict) the release, transport (movement) and ultimate fate of mass within the system. The “mass” that is typically simulated is that of chemical contaminants that have been accidentally released or intentionally disposed of within the system. As a result, such models are often referred to as contaminant transport models.
The fundamental outcome produced by the Contaminant Transport Module consists of predicted mass fluxes at specified locations within the system and predicted concentrations within environmental media (eg groundwater, soil, air) throughout the system.
The model has been designed using a ‘top down’ approach. The theory of ‘top down’ design is that a model is defined in its most simplistic terms or elements at the highest level (see Figure 3). Each element can be thought of as a ‘black box’ which can be opened up to reveal another level of detail. This approach allows for varying levels of detail in a model where there is uncertainty in the processes occurring. Assumptions can be made at varying levels and where additional information is available extra levels of detail can be documented. This allows for the model to be updated overtime without having to completely rebuild the model.
Figure 3 Example of ‘top down’ model
4.2 Overview The model of Buffalo Creek is a simplified conceptual model (Figure 4) of the processes that occur within the creek. The model simulates the input of nutrients from the Leanyer Sanderson Waste Water Treatment Plant (WWTP), and stormwater runoff from the urban area.
Level 3
Level 2
Level 1 Model Result
Calculation 2A
Value 3A Value 3B
Value 2B

Project 38110 | File Nutrient Fate Model Close Out Report.docx | 27 March 2012 | Revision 0 | Page 9
Shoal Bay
Leanyer
Sanderson
WWTP
Existing
Urban AreasProject Area
BUFFALO CREEKSample
locations
Figure 4 Simplified view of Buffalo Creek system
The model was developed to trace the flow of nutrients through Buffalo Creek. The following nutrients were selected to be traced based on the impact to the aquatic ecosystem:
• Total nitrogen
− Total nitrogen is the sum of total kjeldahl nitrogen (organic and reduced nitrogen), ammonia and nitrate – nitrite. It is an essential nutrient for plant and animals. Excess quantities of nitrogen can lead to leaching into ground and surface waters, altered plant morphology and stimulation of aquatic plant and algal growth in surface water (ANZECC, 2000).
• Total phosphorous
− The total phosphorous content includes all phosphorus that is bound to suspended particles as well as the phosphorous that is dissolved in the water. It is a major nutrient for plant growth. Environmentally significant concentrations of phosphorous (ie concentrations which could cause algal blooms in water bodies) may be transported in dissolved or particulate forms (Kirkby CA 1997, Nash 1997, Sharpley 1993, Stevens et al. 1999). The availability of phosphorus to be taken up by algae varies depending on the form of the phosphorous solution (ANZECC, 2000)
A number of the model variables have been defined in terms of a mean and standard deviation. This has been done to simulate the natural variability of the system. These variables are referred to as stochastic variables and are calculated (or resampled) by the model at defined intervals during the simulation. Stochastic variables include:
• Monthly WWTP discharge rates • Nutrient levels in both WWTP discharge and urban runoff • Nutrient levels in tidal inflows
There are several model inputs which can be changed to model changes to the urban area. The values used for these inputs is outlined Section 4.7.
The components of model are described in more detail in the following sections. The description includes the variables used, how they are calculated and the possible ranges for inputs.
The model was developed to run using a 15 minute time step from 1/01/2000 to 31/12/2009. The model was run for 10 realisations. This allowed for a better representation of the model results.

Project 38110 | File Nutrient Fate Model Close Out Report.docx | 27 March 2012 | Revision 0 | Page 10
4.3 Waste Water Treatment Plant The Leanyer Sanderson Waste Water Treatment Plant (WWTP) is located wholly within the Buffalo Creek Catchment. The plant currently treats approximately 46,000 EP with an overall capacity of 68,000 EP. The entire Muirhead Development can be accommodated with the current spare capacity of 22,000 EP.
The treatment process at the Leanyer Sanderson sewerage plant is a secondary treatment process via Waste Stabilisation Ponds (WSP) utilising aerobic and anaerobic bacteria for purification and algae for oxygen production. The ponds treat most of the sewage from the northern suburbs of Darwin. Two sets of five ponds each operate in parallel.
Most of the secondary treated water is then discharged directly into Buffalo Creek (some of the treated water is pumped to Northlakes Water Reclamation Plant where it is treated to tertiary level before being used to irrigate the Darwin Golf Course and the Marrara sporting ovals (PowerWater, 2004)).
Table 1 Typical outfall quality from the Leanyer – Sanderson WWTP
Parameter Discharge Quality
Mean Standard Deviation
Total Nitrogen (mg/L) 17 6
Total Phosphorous(mg/L) 5.3 3
Discharge Volume (ML/mon) 370 260
Discharge data supplied from P&WC for the WWTP was analysed to determine the mean and standard deviation for the flow rate and discharge quality for use in the model. This is shown in Table 1. The data was for monthly outflows between 2000 and 2011. There were some gaps in the supplied data for the above parameters but there was sufficient information (greater than 50 records) for a statistical analysis.
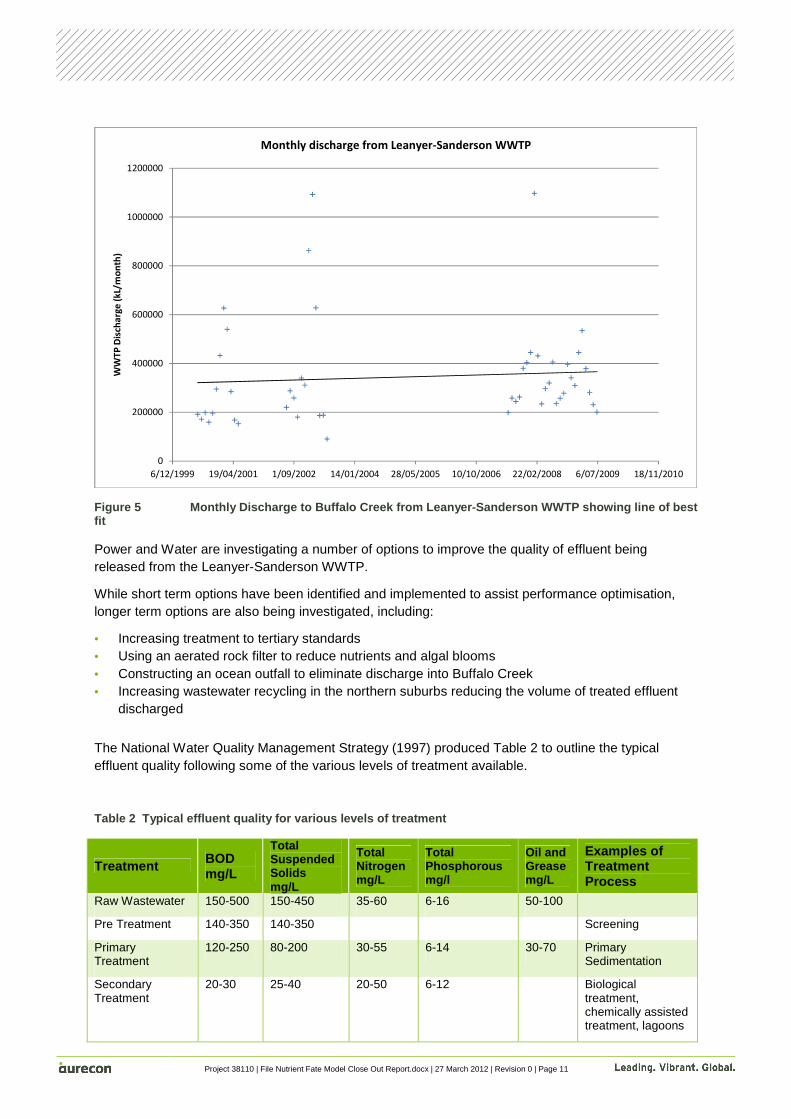
Monthly discharge is shown in Figure 5. A line of best fit has been plotted showing that the monthly discharge has been gradually increasing over the measurement period. Peak discharge is also correlated to the summer months, when Darwin receives the majority of its rainfall. This correlation between rainfall and discharge from the WWTP has not been included in the model.
Project 38110 | File Nutrient Fate Model Close Out Report.docx | 27 March 2012 | Revision 0 | Page 11
Figure 5 Monthly Discharge to Buffalo Creek from L eanyer-Sanderson WWTP showing line of best fit
Power and Water are investigating a number of options to improve the quality of effluent being released from the Leanyer-Sanderson WWTP.
While short term options have been identified and implemented to assist performance optimisation, longer term options are also being investigated, including:
• Increasing treatment to tertiary standards • Using an aerated rock filter to reduce nutrients and algal blooms • Constructing an ocean outfall to eliminate discharge into Buffalo Creek • Increasing wastewater recycling in the northern suburbs reducing the volume of treated effluent
discharged
The National Water Quality Management Strategy (1997) produced Table 2 to outline the typical effluent quality following some of the various levels of treatment available.
Table 2 Typical effluent quality for various levels of treatment
Treatment BOD mg/L
Total Suspended Solids mg/L
Total Nitrogen mg/L
Total Phosphorous mg/l
Oil and Grease mg/L
Examples of Treatment Process
Raw Wastewater 150-500 150-450 35-60 6-16 50-100
Pre Treatment 140-350 140-350 Screening
Primary Treatment
120-250 80-200 30-55 6-14 30-70 Primary Sedimentation
Secondary Treatment
20-30 25-40 20-50 6-12 Biological treatment, chemically assisted treatment, lagoons
0
200000
400000
600000
800000
1000000
1200000
6/12/1999 19/04/2001 1/09/2002 14/01/2004 28/05/2005 10/10/2006 22/02/2008 6/07/2009 18/11/2010
WW
TP
Dis
cha
rge
(k
L/m
on
th)
Monthly discharge from Leanyer-Sanderson WWTP

Project 38110 | File Nutrient Fate Model Close Out Report.docx | 27 March 2012 | Revision 0 | Page 12
Nutrient Removal 5-20 5-20 10-20 <2 <5 Biological, chemical precipitation
Disinfection Lagooning, ultraviolet, chlorination
Advance wastewater treatment
2-5 2-5 <10 <1 <5 Sand filtration, microfiltration
The dashboard which controls the WWTP variables is shown in Figure 6. A screen capture of the WWTP container in the model is in Appendix B.

Project 38110 | File Nutrient Fate Model Close Out Report.docx | 27 March 2012 | Revision 0 | Page 13
Figure 6 WWTP dashboard in model – part 1

Project 38110 | File Nutrient Fate Model Close Out Report.docx | 27 March 2012 | Revision 0 | Page 14
Figure 7 WWTP dashboard in model – part 2
Project 38110 | File Nutrient Fate Model Close Out Report.docx | 27 March 2012 | Revision 0 | Page 15
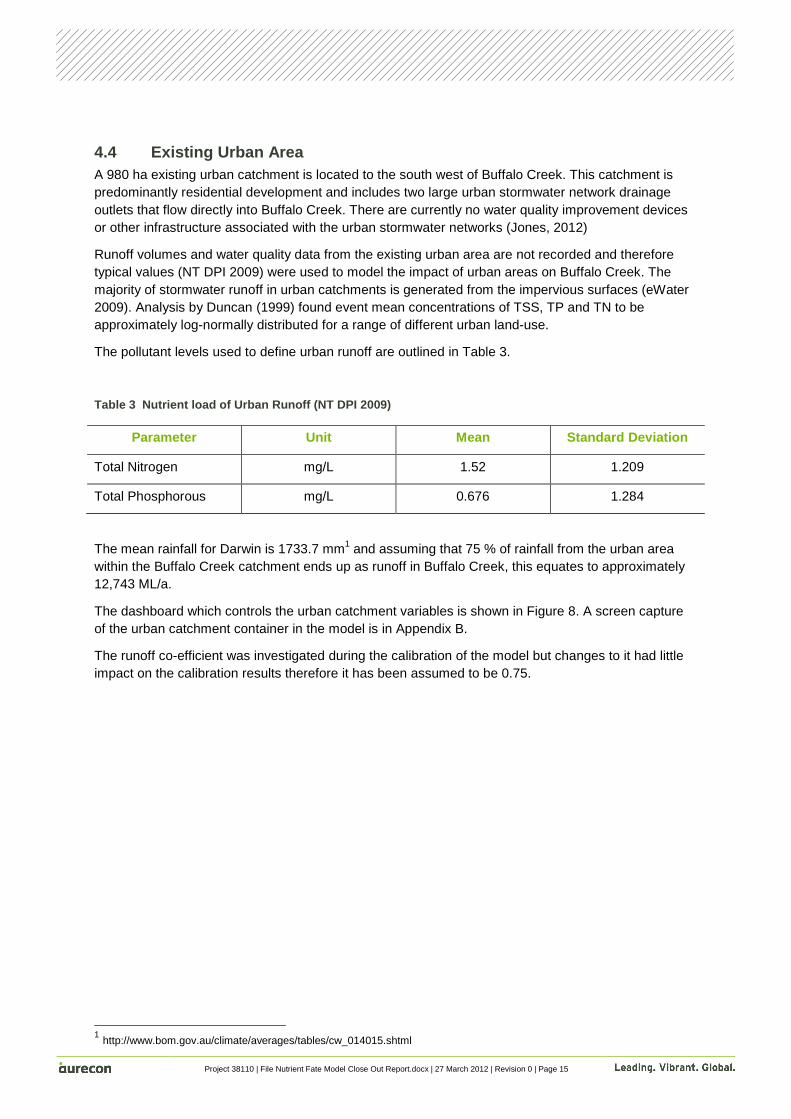
4.4 Existing Urban Area A 980 ha existing urban catchment is located to the south west of Buffalo Creek. This catchment is predominantly residential development and includes two large urban stormwater network drainage outlets that flow directly into Buffalo Creek. There are currently no water quality improvement devices or other infrastructure associated with the urban stormwater networks (Jones, 2012)
Runoff volumes and water quality data from the existing urban area are not recorded and therefore typical values (NT DPI 2009) were used to model the impact of urban areas on Buffalo Creek. The majority of stormwater runoff in urban catchments is generated from the impervious surfaces (eWater 2009). Analysis by Duncan (1999) found event mean concentrations of TSS, TP and TN to be approximately log-normally distributed for a range of different urban land-use.
The pollutant levels used to define urban runoff are outlined in Table 3.
Table 3 Nutrient load of Urban Runoff (NT DPI 2009)
Parameter Unit Mean Standard Deviation
Total Nitrogen mg/L 1.52 1.209
Total Phosphorous mg/L 0.676 1.284
The mean rainfall for Darwin is 1733.7 mm1 and assuming that 75 % of rainfall from the urban area within the Buffalo Creek catchment ends up as runoff in Buffalo Creek, this equates to approximately 12,743 ML/a.
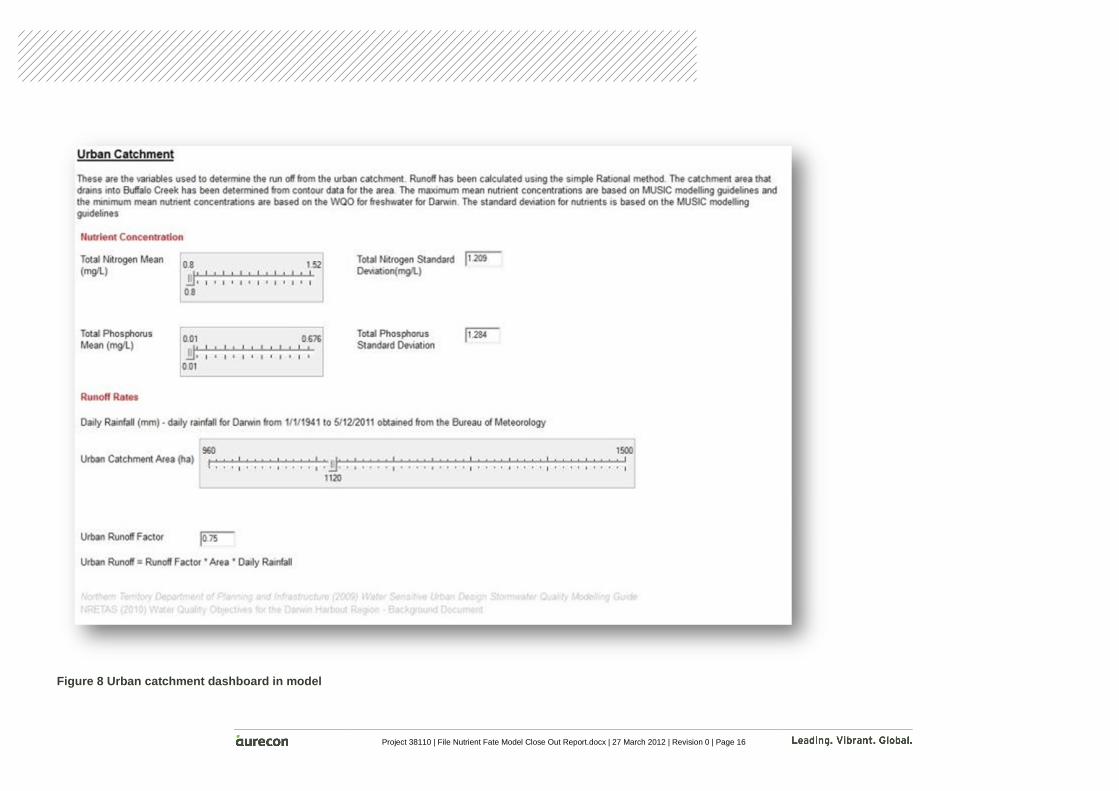
The dashboard which controls the urban catchment variables is shown in Figure 8. A screen capture of the urban catchment container in the model is in Appendix B.
The runoff co-efficient was investigated during the calibration of the model but changes to it had little impact on the calibration results therefore it has been assumed to be 0.75.
1 http://www.bom.gov.au/climate/averages/tables/cw_014015.shtml
Project 38110 | File Nutrient Fate Model Close Out Report.docx | 27 March 2012 | Revision 0 | Page 16
Figure 8 Urban catchment dashboard in model

Project 38110 | File Nutrient Fate Model Close Out Report.docx | 27 March 2012 | Revision 0 | Page 17
4.5 Buffalo Creek Buffalo Creek consists of a long, narrow channel with meandering becoming more pronounced moving downstream (Smith2009). Upstream the creek is fresh water, but becomes increasingly estuarine towards its confluence with Shoal Bay. The majority of the creek channel has straight-sided banks with the exception of intertidal mudflats on the meander bends and parts of the main channel (Smith, 2009)
The confluence of Buffalo Creek with Shoal Bay is heavily distorted by a large intertidal sand bar (the effect of this sandbar is to dampen tidal movement).
In its mid to lower reaches, Buffalo Creek is fringed by mangroves in its intertidal zone, consisting of mostly Rhizophora stylosa, Bruguiera exaristata and Camptostemon schultzii closed to open forest
In its upper reaches, Buffalo Creek splits into two tributaries, both of which are fed by stormwater drains connected to urban drainage systems that currently have no associated water quality improvement infrastructure (Jones, 2012). This part of Buffalo Creek is dominated by salt flats and fringing closed grassland/sedgeland.
Tides are semi-diurnal, with a 7.65 m mean highest water level and 0.47 m mean lowest low water level with a 4.22 m mean sea level (MSL). Poor tidal flushing has been attributed to the elevated concentrations of chlorophyll in Buffalo Creek estuary. Burford et al (2009) found that the sediments in Buffalo Creek contain a large concentration of dissolved nutrients.
The dashboard which controls the Buffalo Creek variables is shown in Figure 10. A screen capture of the Buffalo Creek container in the model is in Appendix B.
The creek was divided into five reaches, which are assumed to be of the same dimensions. In the model each of these reaches is simulated as a cell in which the concentration of nutrient is uniform.
The WWTP and urban catchment both flow into Reach 1. The model simulates inflows from the tide such that each reach can flow either upstream or downstream depending on the depth of water in the reach. A 15 minute time step has been used to simulate the lag in movement of water between each reach which would be the result of drag.
The assumed dimensions of creek reaches were calibrated against nutrient sampling data for the points indicated in Figure 9.

Project 38110 | File Nutrient Fate Model Close Out Report.docx | 27 March 2012 | Revision 0 | Page 18
Figure 9 Buffalo Creek reaches and monitoring point s

Project 38110 | File Nutrient Fate Model Close Out Report.docx | 27 March 2012 | Revision 0 | Page 19
Figure 10 Buffalo Creek dashboard
Project 38110 | File Nutrient Fate Model Close Out Report.docx | 27 March 2012 | Revision 0 | Page 20
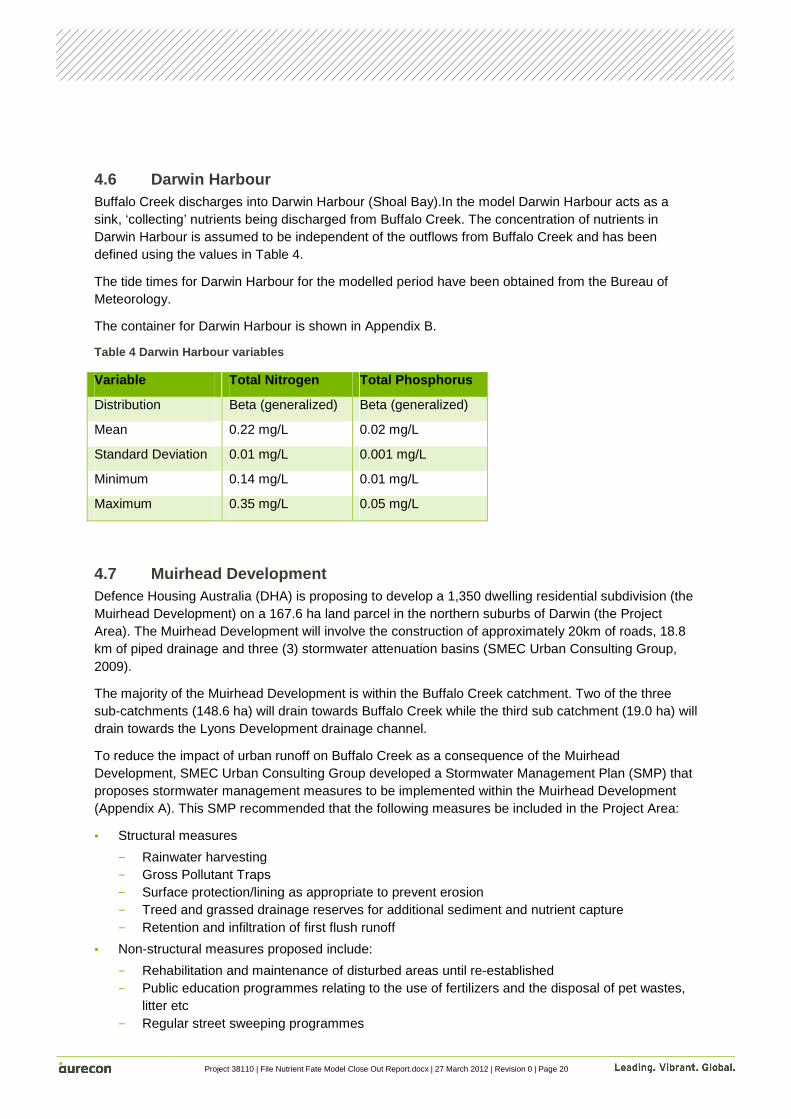
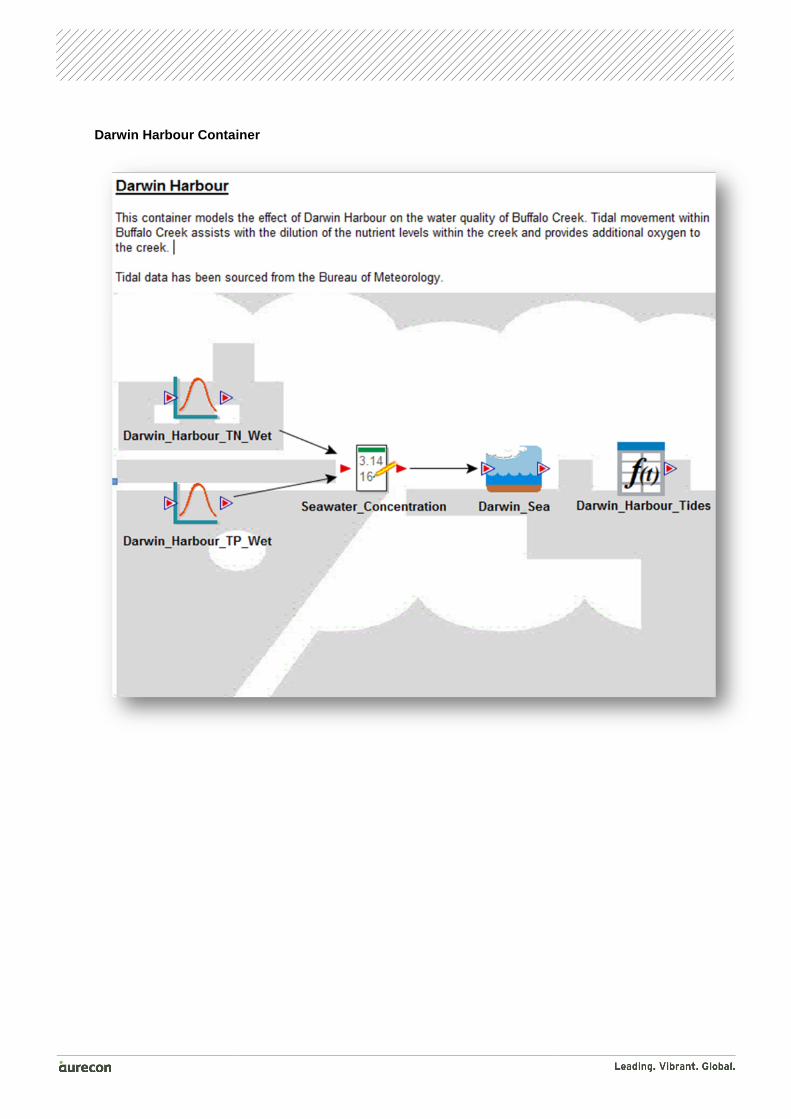
4.6 Darwin Harbour Buffalo Creek discharges into Darwin Harbour (Shoal Bay).In the model Darwin Harbour acts as a sink, ‘collecting’ nutrients being discharged from Buffalo Creek. The concentration of nutrients in Darwin Harbour is assumed to be independent of the outflows from Buffalo Creek and has been defined using the values in Table 4.
The tide times for Darwin Harbour for the modelled period have been obtained from the Bureau of Meteorology.
The container for Darwin Harbour is shown in Appendix B.
Table 4 Darwin Harbour variables
Variable Total Nitrogen Total Phosphorus
Distribution Beta (generalized) Beta (generalized)
Mean 0.22 mg/L 0.02 mg/L
Standard Deviation 0.01 mg/L 0.001 mg/L
Minimum 0.14 mg/L 0.01 mg/L
Maximum 0.35 mg/L 0.05 mg/L
4.7 Muirhead Development Defence Housing Australia (DHA) is proposing to develop a 1,350 dwelling residential subdivision (the Muirhead Development) on a 167.6 ha land parcel in the northern suburbs of Darwin (the Project Area). The Muirhead Development will involve the construction of approximately 20km of roads, 18.8 km of piped drainage and three (3) stormwater attenuation basins (SMEC Urban Consulting Group, 2009).
The majority of the Muirhead Development is within the Buffalo Creek catchment. Two of the three sub-catchments (148.6 ha) will drain towards Buffalo Creek while the third sub catchment (19.0 ha) will drain towards the Lyons Development drainage channel.
To reduce the impact of urban runoff on Buffalo Creek as a consequence of the Muirhead Development, SMEC Urban Consulting Group developed a Stormwater Management Plan (SMP) that proposes stormwater management measures to be implemented within the Muirhead Development (Appendix A). This SMP recommended that the following measures be included in the Project Area:
• Structural measures
− Rainwater harvesting − Gross Pollutant Traps − Surface protection/lining as appropriate to prevent erosion − Treed and grassed drainage reserves for additional sediment and nutrient capture − Retention and infiltration of first flush runoff
• Non-structural measures proposed include:
− Rehabilitation and maintenance of disturbed areas until re-established − Public education programmes relating to the use of fertilizers and the disposal of pet wastes,
litter etc − Regular street sweeping programmes

Project 38110 | File Nutrient Fate Model Close Out Report.docx | 27 March 2012 | Revision 0 | Page 21
If there were no in-system control measures put in place, post development loads and concentrations of sediment, nutrients and the gross pollutants would increase significantly. However by implementing an appropriate suite of water quality management measures, pollutant levels can be retained at target levels (SMEC Urban Consulting Group, 2009)
The sewage load from the Muirhead Development will be treated in the Leanyer-Sanderson WWTP.
4.8 Scenarios
4.8.1 General
Four scenarios were modelled to investigate the impact of the Muirhead Development on the nutrient loads into Buffalo Creek. The model inputs are shown in the following section with a short description of the scenario modelled.
4.8.2 Business As Usual (BAU)
This scenario is the current situation for the catchment. This represents the baseline against which the impact of the project will be compared.
Table 5 Scenario 1 - BAU inputs
Input Value
Urban Catchment
Total Nitrogen Mean (mg/L) 1.52
Total Nitrogen Standard Deviation (mg/L) 1.209
Total Phosphorus Mean (mg/L) 0.676
Total Phosphorus Standard Deviation (mg/L) 1.284
Urban Catchment Area (ha) 960
Urban Runoff Factor 0.75
WWTP
Urban Residences 11600
Equivalent Persons per residence 3.5
Waste Water Generation Rate (L/EP/day) 300
Total Nitrogen Mean (mg/L) 17
Total Nitrogen Standard Deviation (mg/L) 6
Total Phosphorus Mean (mg/L) 5.3
Total Phosphorus Standard Deviation (mg/L) 3
4.8.3 Development with current nutrient generation
This scenario includes the impact of the Muirhead development but assumes that the concentration of nutrient in stormwater and from the WWTP will be the same as is currently generated.

Project 38110 | File Nutrient Fate Model Close Out Report.docx | 27 March 2012 | Revision 0 | Page 22
Table 6 Scenario 2 – Development with current nutrie nt generation inputs
Input Value
Urban Catchment
Total Nitrogen Mean (mg/L) 1.52
Total Nitrogen Standard Deviation (mg/L) 1.209
Total Phosphorus Mean (mg/L) 0.676
Total Phosphorus Standard Deviation (mg/L) 1.284
Urban Catchment Area (ha) 1120
Urban Runoff Factor 0.75
WWTP
Urban Residences 12960
Equivalent Persons per residence 3.5
Waste Water Generation Rate (L/EP/day) 300
Total Nitrogen Mean (mg/L) 17
Total Nitrogen Standard Deviation (mg/L) 6
Total Phosphorus Mean (mg/L) 5.3
Total Phosphorus Standard Deviation (mg/L) 3
4.8.4 Development with reduced stormwater concentra tions
This scenario includes the impact of the Muirhead development but assumes that the concentration of nutrient in stormwater has been reduced such that the mean concentrations are consistent with the water quality objectives for freshwater (NRETAS, 2010). This would be the case if stormwater quality improvement devices were retrofitted to the existing stormwater catchments and were installed in the new development.
Table 7 Scenario 3 – Development with reduced stormw ater concentrations
Input Value
Urban Catchment
Total Nitrogen Mean (mg/L) 0.8
Total Nitrogen Standard Deviation (mg/L) 1.209
Total Phosphorus Mean (mg/L) 0.01
Total Phosphorus Standard Deviation (mg/L) 1.284
Urban Catchment Area (ha) 1120
Urban Runoff Factor 0.75
WWTP
Urban Residences 12960
Equivalent Persons per residence 3.5
Project 38110 | File Nutrient Fate Model Close Out Report.docx | 27 March 2012 | Revision 0 | Page 23
Input Value
Waste Water Generation Rate (L/EP/day) 300
Total Nitrogen Mean (mg/L) 17
Total Nitrogen Standard Deviation (mg/L) 6
Total Phosphorus Mean (mg/L) 5.3
Total Phosphorus Standard Deviation (mg/L) 3
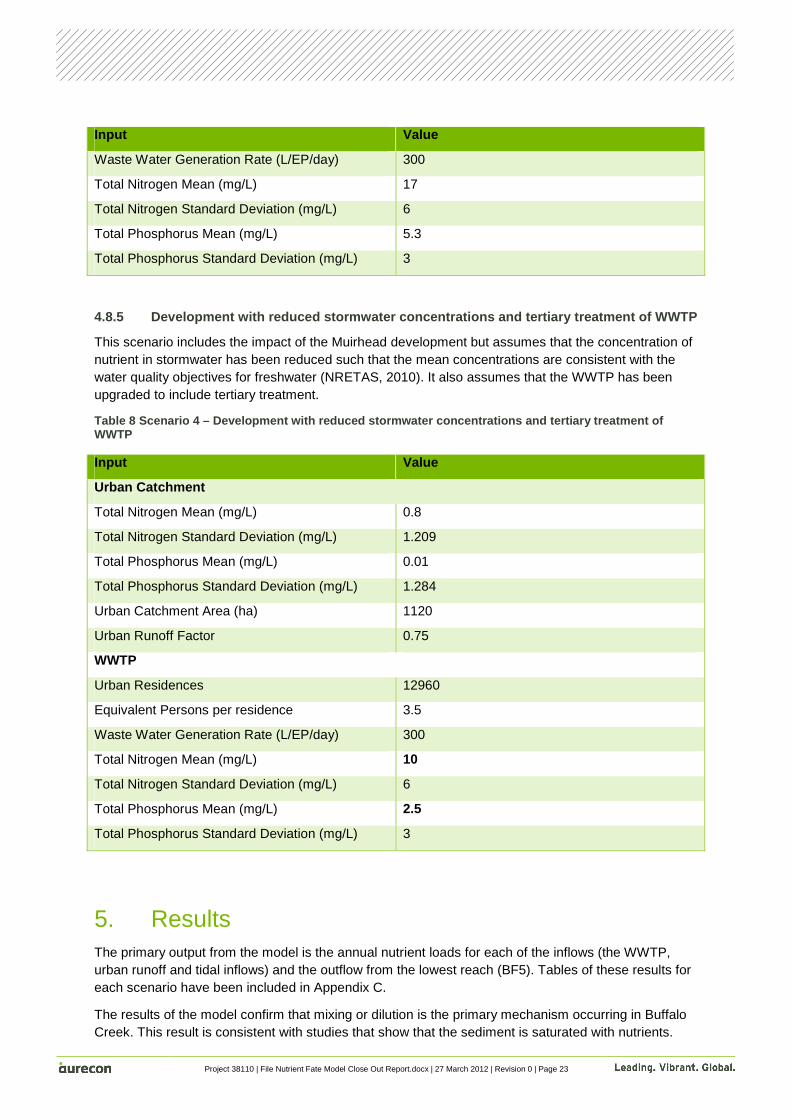
4.8.5 Development with reduced stormwater concentra tions and tertiary treatment of WWTP
This scenario includes the impact of the Muirhead development but assumes that the concentration of nutrient in stormwater has been reduced such that the mean concentrations are consistent with the water quality objectives for freshwater (NRETAS, 2010). It also assumes that the WWTP has been upgraded to include tertiary treatment.
Table 8 Scenario 4 – Development with reduced stormw ater concentrations and tertiary treatment of WWTP
Input Value
Urban Catc hment
Total Nitrogen Mean (mg/L) 0.8
Total Nitrogen Standard Deviation (mg/L) 1.209
Total Phosphorus Mean (mg/L) 0.01
Total Phosphorus Standard Deviation (mg/L) 1.284
Urban Catchment Area (ha) 1120
Urban Runoff Factor 0.75
WWTP
Urban Residences 12960
Equivalent Persons per residence 3.5
Waste Water Generation Rate (L/EP/day) 300
Total Nitrogen Mean (mg/L) 10
Total Nitrogen Standard Deviation (mg/L) 6
Total Phosphorus Mean (mg/L) 2.5
Total Phosphorus Standard Deviation (mg/L) 3
5. Results The primary output from the model is the annual nutrient loads for each of the inflows (the WWTP, urban runoff and tidal inflows) and the outflow from the lowest reach (BF5). Tables of these results for each scenario have been included in Appendix C.
The results of the model confirm that mixing or dilution is the primary mechanism occurring in Buffalo Creek. This result is consistent with studies that show that the sediment is saturated with nutrients.
Project 38110 | File Nutrient Fate Model Close Out Report.docx | 27 March 2012 | Revision 0 | Page 24
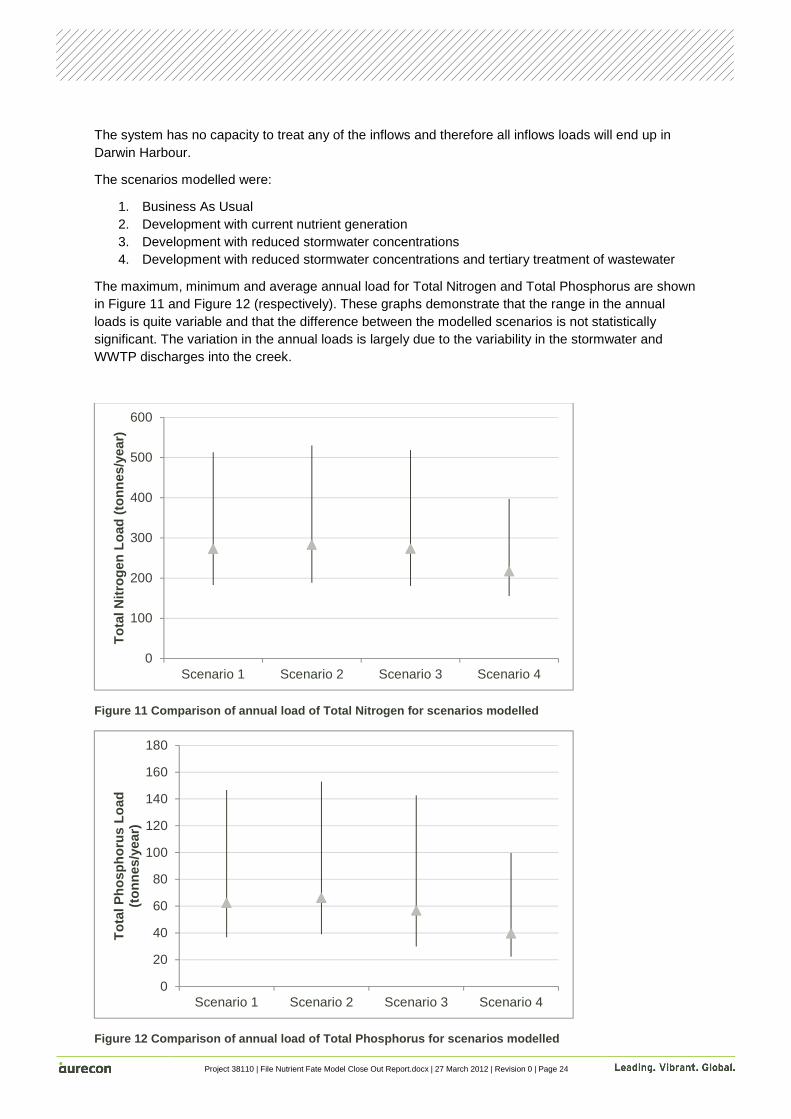
The system has no capacity to treat any of the inflows and therefore all inflows loads will end up in Darwin Harbour.
The scenarios modelled were:
1. Business As Usual 2. Development with current nutrient generation 3. Development with reduced stormwater concentrations 4. Development with reduced stormwater concentrations and tertiary treatment of wastewater
The maximum, minimum and average annual load for Total Nitrogen and Total Phosphorus are shown in Figure 11 and Figure 12 (respectively). These graphs demonstrate that the range in the annual loads is quite variable and that the difference between the modelled scenarios is not statistically significant. The variation in the annual loads is largely due to the variability in the stormwater and WWTP discharges into the creek.
Figure 11 Comparison of annual load of Total Nitrog en for scenarios modelled
Figure 12 Comparison of annual load of Total Phospho rus for scenarios modelled
0
100
200
300
400
500
600
Scenario 1 Scenario 2 Scenario 3 Scenario 4
Tot
al N
itrog
en L
oad
(ton
nes/
year
)
0
20
40
60
80
100
120
140
160
180
Scenario 1 Scenario 2 Scenario 3 Scenario 4
Tot
al P
hosp
horu
s Lo
ad
(ton
nes/
year
)
Project 38110 | File Nutrient Fate Model Close Out Report.docx | 27 March 2012 | Revision 0 | Page 25
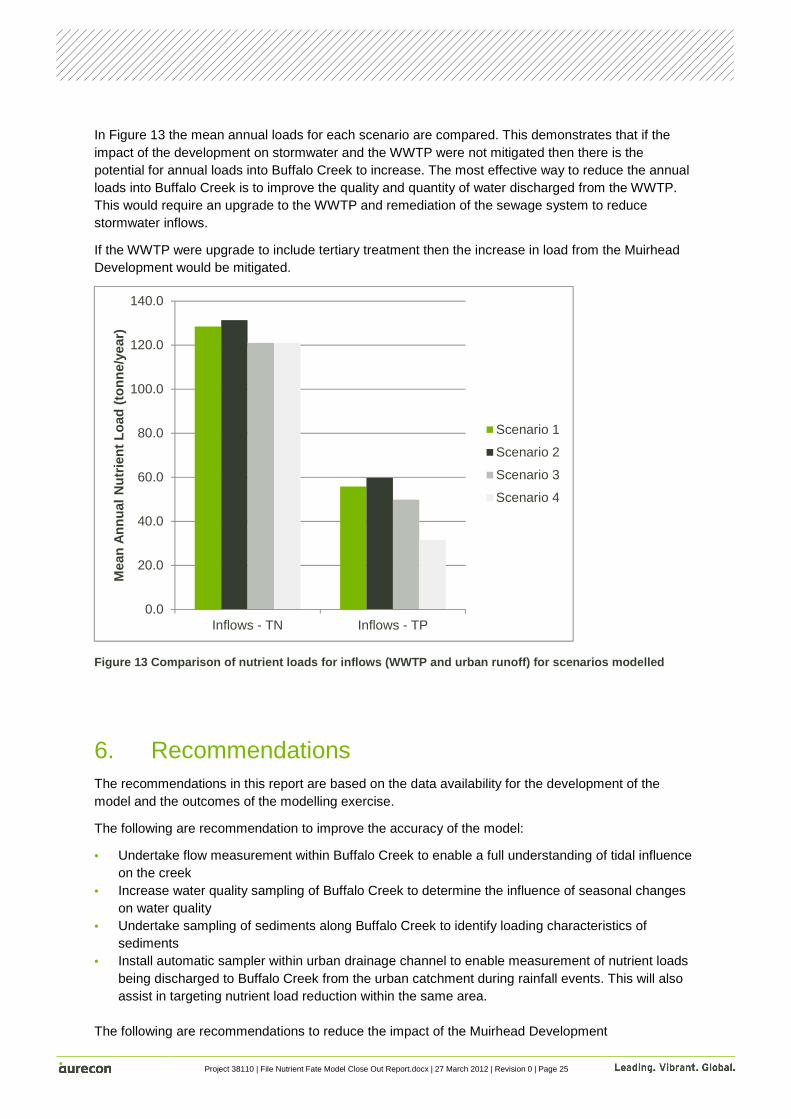
In Figure 13 the mean annual loads for each scenario are compared. This demonstrates that if the impact of the development on stormwater and the WWTP were not mitigated then there is the potential for annual loads into Buffalo Creek to increase. The most effective way to reduce the annual loads into Buffalo Creek is to improve the quality and quantity of water discharged from the WWTP. This would require an upgrade to the WWTP and remediation of the sewage system to reduce stormwater inflows.
If the WWTP were upgrade to include tertiary treatment then the increase in load from the Muirhead Development would be mitigated.
Figure 13 Comparison of nutrient loads for inflows (WWTP and urban runoff) for scenarios modelled
6. Recommendations The recommendations in this report are based on the data availability for the development of the model and the outcomes of the modelling exercise.
The following are recommendation to improve the accuracy of the model:
• Undertake flow measurement within Buffalo Creek to enable a full understanding of tidal influence on the creek
• Increase water quality sampling of Buffalo Creek to determine the influence of seasonal changes on water quality
• Undertake sampling of sediments along Buffalo Creek to identify loading characteristics of sediments
• Install automatic sampler within urban drainage channel to enable measurement of nutrient loads being discharged to Buffalo Creek from the urban catchment during rainfall events. This will also assist in targeting nutrient load reduction within the same area.
The following are recommendations to reduce the impact of the Muirhead Development
0.0
20.0
40.0
60.0
80.0
100.0
120.0
140.0
Inflows - TN Inflows - TP
Mea
n A
nnua
l Nut
rient
Loa
d (t
onne
/yea
r)
Scenario 1
Scenario 2
Scenario 3
Scenario 4

Project 38110 | File Nutrient Fate Model Close Out Report.docx | 27 March 2012 | Revision 0 | Page 26
• Install Water Sensitive Urban Design (WSUD) infrastructure within the Muirhead Development area to minimise runoff and increase water quality
• Increase level of treatment of WWTP discharge to reduce overall nutrient loads being discharged
Further development of the model should be undertaken as more data becomes available. This will also enable the complexity of the model to increase, enabling a better representation of real life processes.
7. Conclusions It was a condition of the EPBC Act approval for the Muirhead Residential Subdivision that a nutrient fate modelling study was delivered. This report meets the requirements of this condition.

Appendices

Appendix A Workshop Presentation
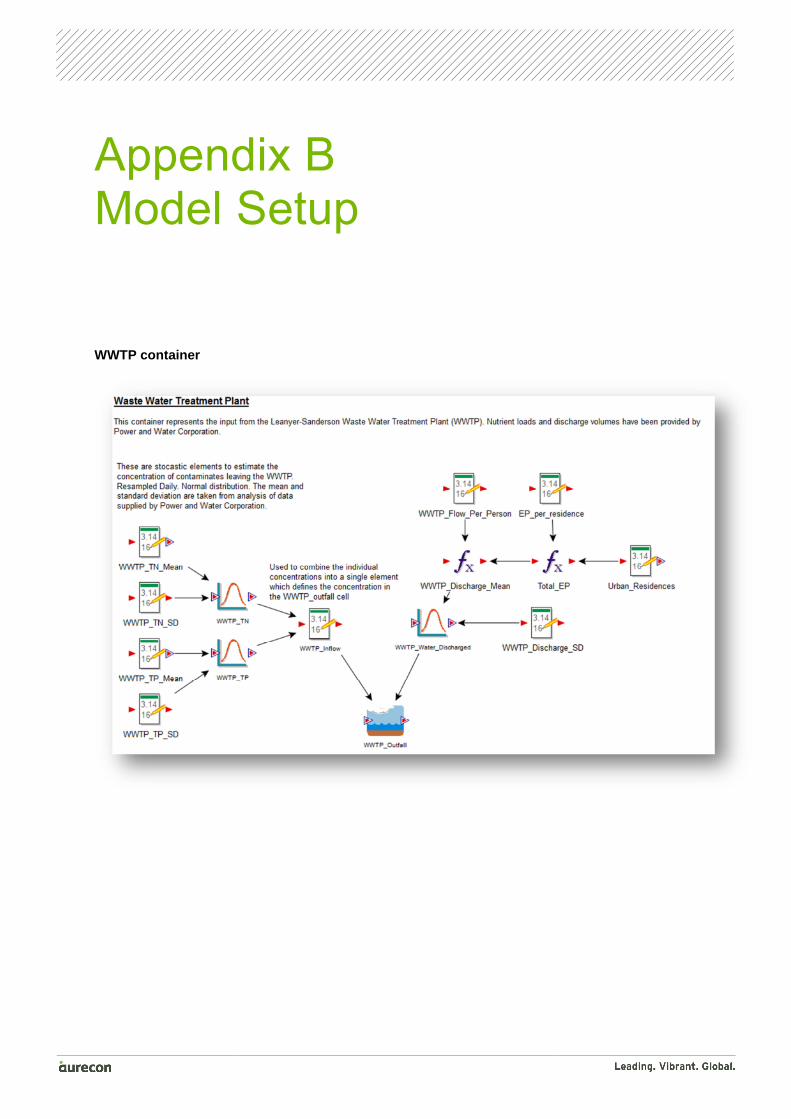
Appendix B Model Setup
WWTP container

Urban Catchment Container
Darwin Harbour Container

Buffalo Creek Container

BF1 container (same for all reaches)
Creek Flows Container

Appendix C Scenario Results

Appendix D References
ANZECC. (2000). An Introduction to Australian and New Zealand Guidelines for Fresh and Marine Water Quality.
Drewry, J. F. (2010). Spatial Distribution of Water Quality Indicators in Buffalo Creek Estuary, Darwin Harbour. Report no. 19/2010D, Darwin: Northern Territory Department of Natural Resouces, Environment, The Arts and Sport.
Haese, R. R., & Smith, J. (2009). The role of sediments in nutrient cycling in the tidal creeks of Darwin Harbour. Geoscience Australia, AusGeo News(95).
Jones, S. (2012, January 24). Crown Land Administration. (A. Thomas, Interviewer)
NRETAS. (2007). Sites of Conservation Significance in the NT. Retrieved January 2012, from Natural Resources, Environment, The Arts and Sport.
NRETAS. (2010). Water Quality Objectives for the Darwin Harbout Region - Background Document. Darwin: Northern Territory Government.
NT. (2007). Sites of Conservation Significance. Darwin: Northern Territory Government.
PowerWater. (2004). Power and Water Corporation Wastewater Treatment, Reuse and Discharge. Darwin: Power and Water Corporation.
SMEC Urban Consulting Group. (2009). Stormwater Management Plan, Lee Point Road, Darwin.
Smith, J. a. (2009, September). The role of sediments in nutrient cycling in the tidal creeks of Darwin Harbour. AUSGEO News(95).

Aurecon Australia Pty Ltd ABN 54 005 139 873
Level 1, 242 Mulgrave Road Cairns QLD 4870
PO Box 7625 Cairns QLD 4870 Australia
T +61 7 4051 6266 F +61 7 4051 2540 E [email protected] W aurecongroup.com
Aurecon offices are located in: Angola, Australia, Botswana, China, Ethiopia, Hong Kong, Indonesia, Lesotho, Libya, Malawi, Mozambique, Namibia, New Zealand, Nigeria, Philippines, Singapore, South Africa, Swaziland, Tanzania, Thailand, Uganda, United Arab Emirates, Vietnam.