
Prof. Byoungcheon Lee Joongbu University [email protected] Network Security.
Upload
marcus-howardCategory
view
218download
1
Project Management Using Network Analysis
By
Prof. Nadpurohit

• Project Planning & Scheduling • CPM & PERT Techniques
• WBS •Network drawing• Network Analysis• Updating of Network
• Project Cost v/s Project Completion time • Time Cost Trade off• Crashing of Project Completion time
• Resource Management• Types of resources• Resource Smoothening & Resource Leveling
• Project Control•Earned Value Management System
Sept 2010 Slide 2 of 64 Project Management Using Network Analysis, By Prof. Nadpurohit
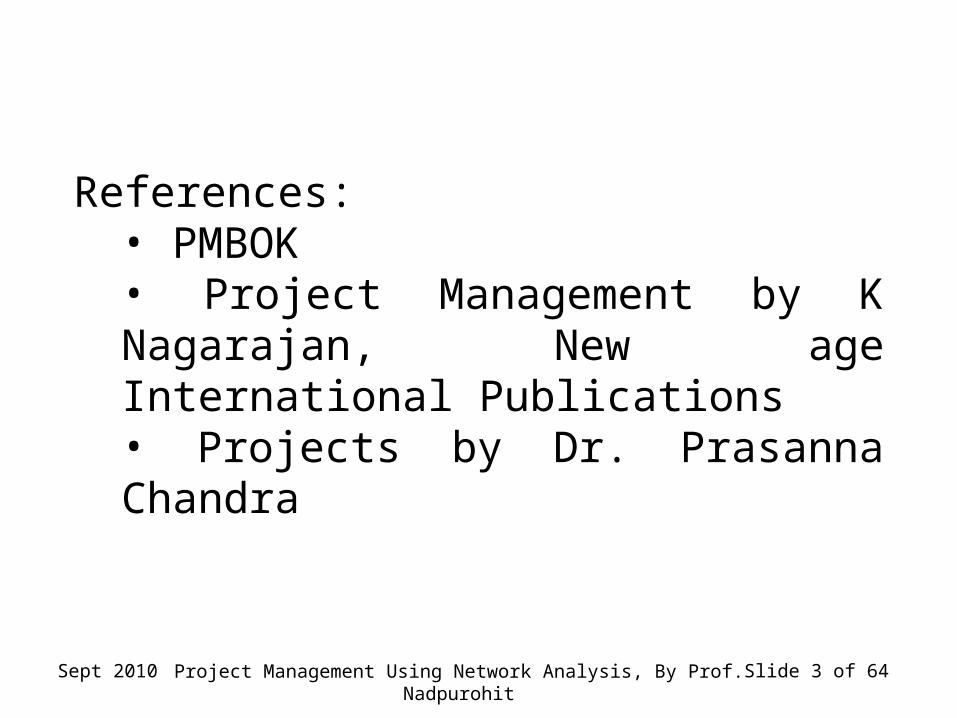
References:• PMBOK• Project Management by K Nagarajan, New age International Publications• Projects by Dr. Prasanna Chandra
Sept 2010 Slide 3 of 64 Project Management Using Network Analysis, By Prof. Nadpurohit

“A Project”
Temporary endeavor undertaken to create a unique Product, Service or Result
Sept 2010 Slide 4 of 64 Project Management Using Network Analysis, By Prof. Nadpurohit

Project Characteristics
Temporary:
means every Project has a finite duration (a definite beginning and a definite end). Projects are not ongoing efforts.
Temporary characteristics of a Project applies toOpportunityProject team working as a unit
Temporary characteristics of a Project does not apply to:Product, Service or result generated by the
Project.
Sept 2010 Slide 5 of 64 Project Management Using Network Analysis, By Prof. Nadpurohit

Project Characteristics (continued)The driving forces that create stimuli for a Project are typically referred to as Problems, Opportunities or Business requirements.
End of Project is reached when
Projects objectives have been achieved.
When it becomes clear that the Project objectives will not or cannot be met and the Project is terminated.
The need for the Project no longer exists and the Project is terminated.
Sept 2010 Slide 6 of 64 Project Management Using Network Analysis, By Prof. Nadpurohit

Project Characteristics (continued)
Uniqueness an important characteristic of Product, Service or Result
Project can create
A Product or artifact which is quantifiable, and which is either an end item itself or a component item.
A capability to perform a service, such as business functions supporting production or distribution.
A result such as outcomes or documents
Sept 2010 Slide 7 of 64 Project Management Using Network Analysis, By Prof. Nadpurohit

Relation between Product and Project Life Cycle
Project Life Cycle
Initial
IDEA
Intermediate Final
Pro
du
ct
Op
erat
ion
s
ProductLife
CycleBusinessPlan
Upgrade
Div
estm
ent
Sept 2010 Slide 8 of 64 Project Management Using Network Analysis, By Prof. Nadpurohit

Project v/s Operational work
Organization
Performs Work to achieve objectives
Projects. Temporary and Unique. Purpose to achieve objective And then terminate
Operations. Ongoing & repetitive. Objective is to sustainbusiness
Both Projects & Operations are performed by people, constrained by resources & are planned, executed and controlled
Sept 2010 Slide 9 of 64 Project Management Using Network Analysis, By Prof. Nadpurohit

Some examples of Projects
Developing a new Product or ServiceEffecting a change in organization structure
Designing a new transportation vehicleDeveloping a new or modified Information system
Constructing a buildingBuilding a water system for a communityRunning a campaign for a Political Party
Implementing a new business ProcessResponding to a contract solicitation
Sept 2010 Slide 10 of 64 Project Management Using Network Analysis, By Prof. Nadpurohit

Projects and Strategic Planning
Projects are a means of organizing activities that cannot be addressed with the organizational normal operational limits
Projects are often utilized as a means of achieving an organizations strategic plans
Sept 2010 Slide 11 of 64 Project Management Using Network Analysis, By Prof. Nadpurohit

Projects and Strategic Planning
Strategic considerations that lead to Project authorization
. Market demand
. Organizational need
. Customer request
. Technological advance
. Legal Requirement
Sept 2010 Slide 12 of 64 Project Management Using Network Analysis, By Prof. Nadpurohit

• Industrial / Commercial projects are complex in nature.
• Handling of these projects calls for a systematic approach which takes into account– Identification of numerous activities– Required time and other resources– Availability of these resources– Coordination and control
Sept 2010 Slide 13 of 64 Project Management Using Network Analysis, By Prof. Nadpurohit

Program Evaluation and Review Technique - PERT
• Developed by US Department of Navy for their “Polaris missile” program in 1958.
• Is a form of network analysis technique consisting of– Translating the proposed job into a model by drawing
a network of activities involved.– Evaluating the network and manipulating it to the
extent possible so as to ensure that there will be a reasonable chance of achieving the objective (viz. completing the job) with in the constraints of time and other resources.
– Using the network to monitor and control the job.
Sept 2010 Slide 14 of 64 Project Management Using Network Analysis, By Prof. Nadpurohit

PERT• Is of special relevance to
– One-time tasks such as construction of dams, factories, bridges etc.
– Manufacture of ships, missiles and such other activities which though repetitive are of huge proportion
– R&D projects– Major repairs and overhaul of plant /
machinery– Organization of large events / conferences.
Sept 2010 Slide 15 of 64 Project Management Using Network Analysis, By Prof. Nadpurohit

Critical Path Method (CPM)
• CPM originated in Du Pont de Nemours company almost at the same time in 1958.
• CPM is also a Network analysis method and differs from PERT only in the approach to the network analysis.
Sept 2010 Slide 16 of 64 Project Management Using Network Analysis, By Prof. Nadpurohit

Gantt Chart
• A planning and control tool used for scheduling jobs and depicting the progress made from time to time.
• In a Gantt chart, a division of space represents both an amount of time and an amount of work to be done in that time
Sept 2010 Slide 17 of 64 Project Management Using Network Analysis, By Prof. Nadpurohit

Sept 2010 Slide 18 of 64 Project Management Using Network Analysis, By Prof. Nadpurohit
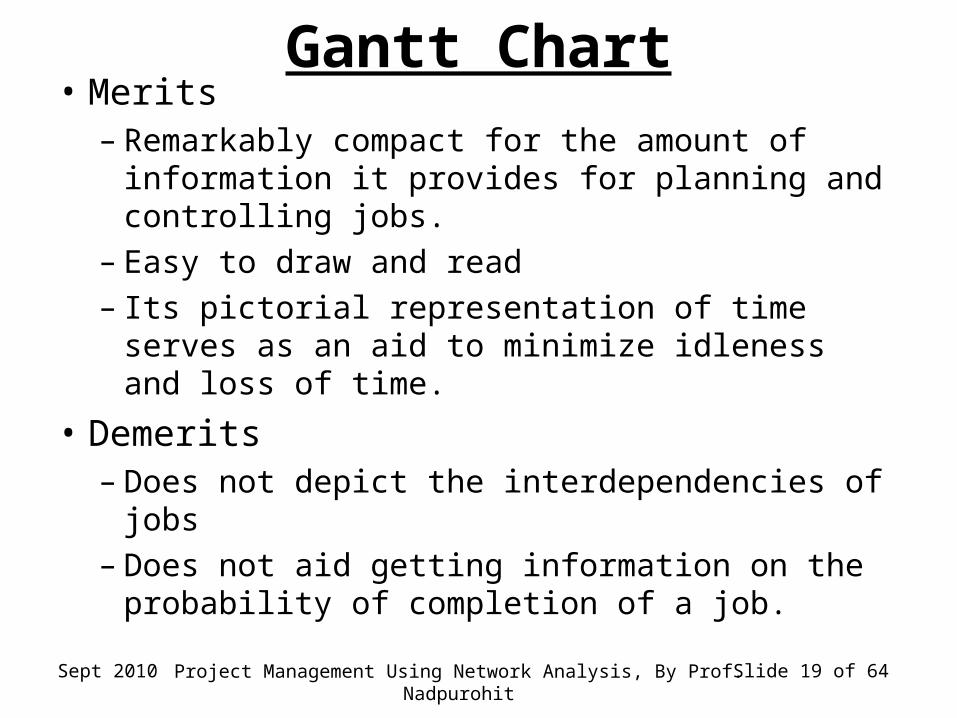
Gantt Chart• Merits
– Remarkably compact for the amount of information it provides for planning and controlling jobs.
– Easy to draw and read– Its pictorial representation of time serves as
an aid to minimize idleness and loss of time.
• Demerits– Does not depict the interdependencies of jobs– Does not aid getting information on the
probability of completion of a job.
Sept 2010 Slide 19 of 64 Project Management Using Network Analysis, By Prof. Nadpurohit

Stages in application of PERT/CPM
• Drawing the network– The purpose of this is to identify all the events /
activities that are essential for completion of a Project and to bring out their interrelationship to satisfy the technological / logical sequencing requirements.
• Network Analysis– By incorporating the time required for completing
each of the activities in the network, the project duration as well as the criticality of the activity can be found out. At this stage it is also possible to compute the probability of completing the Project or part of the project in a given specified time
Sept 2010 Slide 20 of 64 Project Management Using Network Analysis, By Prof. Nadpurohit

Stages in application of PERT/CPM
• Resource Allocation and Scheduling– Based on the network calculation and assessment of
resources required for each of the activities, the plan is translated into a time schedule. If it is possible to expedite the activities by incurring additional cost, the economics of doing so are also examined before finalizing the schedule.
Sept 2010 Slide 21 of 64 Project Management Using Network Analysis, By Prof. Nadpurohit

Stages in application of PERT/CPM
• Project control– This stage calls for periodic updating of the network
amongst other things to monitor the progress of the Project, and making necessary changes in the schedules to ensure completion of the Project as close to the target time as possible.
Sept 2010 Slide 22 of 64 Project Management Using Network Analysis, By Prof. Nadpurohit

Concepts / Definitions
• ProjectTemporary endeavor undertaken to create a unique
Product, Service or Result.
• Work breakdown structure (WBS)A work breakdown structure is a deliverable oriented
grouping of project elements that organizes and defines the total scope of the project.
Work not in the WBS is outside the scope of the project. As with the scope statement, the WBS is often used to
develop or confirm a common understanding of project scope. Each descending level represents an increasingly detailed description of the project elements.
Sept 2010 Slide 23 of 64 Project Management Using Network Analysis, By Prof. Nadpurohit

Concepts / Definitions
• ActivityIs a task or item of work to be done, that consumes time, effort, money or other resources.
Sept 2010 Slide 24 of 64 Project Management Using Network Analysis, By Prof. Nadpurohit

• Event– Events do not consume resources.– Events are represented by circle– An Event is realized only when all activities
terminating at it are completed.
Concepts / Definitions
Sept 2010 Slide 25 of 64 Project Management Using Network Analysis, By Prof. Nadpurohit

• Network diagram – Shows how the tasks will flow from beginning
to end
Sept 2010 Slide 26 of 64 Project Management Using Network Analysis, By Prof. Nadpurohit
Concepts / Definitions

Steps involved in drawing a Network
• Identify the End objective and define the events which are precedent to the End objective
• List out the activities required to accomplish these events
• Draw the events and activities and connect them according to the defined logic.
• Now for every activity answer the following questions– What should precede it– What needs to follow it– What can be done concurrently
• Modify redraw the diagram to suit answers for above.• Check for errors• Number the events as per convention.
Sept 2010 Slide 27 of 64 Project Management Using Network Analysis, By Prof. Nadpurohit

Activity sequencing: tools and techniques
• Network diagram – Shows how the tasks will flow from beginning
to end– Types
• Precedence diagramming method (PDM) • Arrow diagramming method (ADM)
Sept 2010 Slide 28 of 64 Project Management Using Network Analysis, By Prof. Nadpurohit

• Precedence diagramming method (PDM) : method of constructing a project network diagram to represent the activities using nodes and to represent dependencies using arrows
• Also called activity on node
D
C
B
A
start finish
Activity sequencing: tools and techniques
Sept 2010 Slide 29 of 64 Project Management Using Network Analysis, By Prof. Nadpurohit

• PDM could have four types of dependencies– Finish-to-start – Finish-to-finish– Start-to-start– Start-to-finish
Activity sequencing: tools and techniques
Sept 2010 Slide 30 of 64 Project Management Using Network Analysis, By Prof. Nadpurohit

• Arrow diagramming method (ADM) : method of constructing project network diagram using arrows to represent activities and connecting them at nodes to show their dependencies. The nodes are Events
Activity sequencing: tools and techniques
Sept 2010 Slide 31 of 64 Project Management Using Network Analysis, By Prof. Nadpurohit

Concepts / Definitions
• ActivityIs a task or item of work to be done, that consumes time, effort, money or other resources.It is represented by an arrow with its head indicating direction of the progress in the project. i.e. The tail of the arrow marks the commencement of the activity and the Head of the arrow marks the completion of the activity.
5
The number 5 over the arrow indicates the Time required for completion of the activity
Sept 2010 Slide 32 of 64 Project Management Using Network Analysis, By Prof. Nadpurohit

• Event– An activity is bound by 2 events referred to as Tail
event and Head event.– Events do not consume resources.– Events are represented by circle– An Event is realized only when all activities
terminating at it are completed.
Concepts / Definitions
Tail Event
HeadEvent
Activity
1 2 A
Activity A or 1-2 requiring 5 units of time, Event 1 Event 2
5
Sept 2010 Slide 33 of 64 Project Management Using Network Analysis, By Prof. Nadpurohit

• Network– A network is a graphic representation of a
Project’s operation and is composed of activities and events
Concepts / Definitions
Event 1 is Start of Project and does not have any activity before it
Event 5 is End of Project and does not have any activity after it
4
3
2
1 5
A
B
C
D
E
GF
F is a Dummy activityIt does not consume any resourceIt is introduce in Network to preserve logic
Sept 2010 Slide 34 of 64 Project Management Using Network Analysis, By Prof. Nadpurohit

Rules for drawing a Network
• Only 1 activity may connect any 2 Events• Except for the Start and the End event,
every event must have at least 1 activity entering it and at least 1 activity leaving it.
• Every activity must have a Tail event and a Head event.
• There must be no loops in the Network, i.e. no continuous path must go through one Event 2 times.
Sept 2010 Slide 35 of 64 Project Management Using Network Analysis, By Prof. Nadpurohit

NetworkErrors in drawing Network -
Looping
1 2
3
How to determine Looping in a NetworkHead event must always have number higher than Tail event
Sept 2010 Slide 36 of 64 Project Management Using Network Analysis, By Prof. Nadpurohit

NetworkErrors in drawing Network -
Dangling
1
4
2 3
Event 1 is Start of Project Event 3 is end of Project
Ways to avoid Danglinga) All Activities must start and finish with an
Eventb) Except for the Start and End Event, each event must
have at least 1 activity entering and 1 activity leaving it.
Sept 2010 Slide 37 of 64 Project Management Using Network Analysis, By Prof. Nadpurohit

ACTIVITY Predecessor
A -
B -
C B
D B
E A
F A
G F
H C.E,G
I F
BC
BD A
E
AF
FG
FI
H
C
E
G
1
3
2
4
56
A
BC
D
E
H
F
IG
Sept 2010 Slide 38 of 64 Project Management Using Network Analysis, By Prof. Nadpurohit

• A Project consists of a series of activities labeled A, B, C, D, E, F, G, H, and I. The interdependency of activities is as followsA<D,E; B,D<F; C<G; B<H; F,G<I and G<H.
AD
E
B
D
F C G B H
G
F
IG H
Sept 2010 Slide 39 of 64 Project Management Using Network Analysis, By Prof. Nadpurohit
1
3
47
2
8
AE
D
B F
ICG
HD1
D2
6
95
D3 D4

Earliest Event Time Latest Event Time
0
01
E
L4
E
L6
E
L7
E
L3
E
L2
E
L5
A(23)
B(8)
C(20)
G(19)
H(4)
D(16)E(24)
F(18) I(10)
D1D2
Sept 2010 Slide 40 of 64 Project Management Using Network Analysis, By Prof. Nadpurohit

0
01
E
L4
E
L6
E
L7
E
L3
E
L2
E
L5
A(23)
B(8)
C(20)
G(19)
H(4)
D(16)E(24)
F(18) I(10)
D1D2
Determination of Earliest Event Time of EventStart from the 1st Event i.e. Start of the Project. The Earliest Event time for it = 0Consider the next event 2.Consider all activities terminating at that event i.e. C. C starts at event 1 and requires 20 days. For event 2 occur activity C has to be completed. Hence event 2 can occur only after the time event 1 has occurred and after C is completedi.e after 0 + 20 days = 20 daysSimilarly event 3 will occur after event 1 has occurred and activity A is completedi.e. after 0 +23 days = 23 daysFor event 4 to occur we need to complete activities B and D. The earliest that event 4 can occur is after the completion of activity B and D. i.e. Maximum of (0 + 8), (23 + 16) = 39 days
Sept 2010 Slide 41 of 64 Project Management Using Network Analysis, By Prof. Nadpurohit

Hence earliest completion of Project time is 67 days
0
01
39
L4
57
L6
67
L7
23
L3
20
L2
39
L5
A(23)
B(8)
C(20)
G(19)
H(4)
D(16)
E(24)
F(18) I(10)
D1D28,39
20
23
39, 5743, 67, 47
39, 39
Sept 2010 Slide 42 of 64 Project Management Using Network Analysis, By Prof. Nadpurohit

0
01
39
L4
57
L6
67
L7
23
L3
20
L2
39
L5
A(23)
B(8)
C(20)
G(19)
H(4)
D(16)E(24)
F(18) I(10)
D1D2
Determination of Latest Event Time of EventStart from the last Event i.e. End of the Project. The Latest Event time for it = Project completion time = 67 daysConsider the next earlier event 6.Consider all activities starting from that event i.e. I. I requires 10 days. Latest time that event 6 can occurWith out delaying the Project completion time is 67 – 10 = 57 days Similarly Latest Time for event 5 = Minimum of (57 – 0) or 67 – 4 = 57 days.For event 4 Latest time is Minimum of (57 – 0) or (57 – 18) = 39 daysFor event 3 the latest event time = Minimum of (39 – 16) or (67 – 24) = 23 daysFor event 2 the latest event time = 57 -19 = 38 days
For event 1 Latest time is Minimum of (38 – 20), (39 – 8), (23 – 23) = 0
Sept 2010 Slide 43 of 64 Project Management Using Network Analysis, By Prof. Nadpurohit

0
01
39
394
57
576
67
677
23
233
20
382
39
575
A(23)
B(8)
C(20)
G(19)
H(4)
D(16)E(24)
F(18) I(10)
D1D2
57, 63
5739, 57
23, 43
38
0, 31, 18
Sept 2010 Slide 44 of 64 Project Management Using Network Analysis, By Prof. Nadpurohit

0
01
39
394
57
576
67
677
23
233
20
382
39
575
A(23)
B(8)
C(20)
G(19)
H(4)
D(16)E(24)
F(18) I(10)
D1D2
Activity I,j Normal Time
Earliest Time Latest Time Total Float or Slack
availableStart Finish Start Finish
C (1-2) 20 0 20 18 38 18
A (1-3) 23 0 23 0 23 0
B (1-4) 8 0 8 31 39 31
G (2-5) 19 20 39 38 57 18
D (3-4) 16 23 39 23 39 0
E (3-7) 24 23 47 43 67 20
D1 (4-5) 0 39 39 57 57 18
F (4-6) 18 39 57 39 57 0
D2 (5-6) 0 39 39 57 57 18
H (5-7) 4 39 43 63 67 24
I (6-7) 10 57 67 57 67 0
Activities that have Total float = 0 or No Slack available are the activities on the critical path.
Hence Critical path is A-D-F-I
Sept 2010 Slide 45 of 64 Project Management Using Network Analysis, By Prof. Nadpurohit

Free Float, Interference Float, Independent Float
10
0
27
13
48
15 617
18
728
28
38
85
12
12
A (7)
B (6)
C (8) D
E (3) I (10)
F (5)
K (3)
G (4)
H (5)
J (16)
Activity I:Total Float = 28 – 17 - 10 = 1 dayActivity F:Total Float = 18-7-5 =6 daysIf F absorbs all its float then I has no float, but if F absorbs only 5 days of its float then I still has its 1 day floatThe float in an activity which can be used with out affecting float of any succeeding activity is called as Free Float
Interference Float = Difference between Total float and Free float
Consider activity K: If the tail event of this K activity is reached as late as possible and the Head event of the activity starts as early as possible then the float for K is 17-8-3 = 6 days. This float of 6 days whose absorption does not affect neither preceding activity nor the subsequent activity is called Independent Float
Total Float = Free float + Interference FloatTotal Float = Lj – Ei – t, Free Float = Ej – Ei – t,. Interference Float = Lj – Ej,, Independent Float = Ej – Li - t
Sept 2010 Slide 46 of 64 Project Management Using Network Analysis, By Prof. Nadpurohit

UPDATING PROJECT
• Can be done in 2 ways– Use the revised time estimate of incomplete activities
and calculate from initial event the earliest completion time and the latest completion time of each event in the usual manner to know the Project completion time.
– Change the complete work to zero duration and represent all the activities already finished by an arrow called the Elapsed time arrow. Events in the revised network are renumbered.
Sept 2010 Slide 47 of 64 Project Management Using Network Analysis, By Prof. Nadpurohit

• The network for a project is shown below. A review of the project after 15 days reveals that – Activities 1-2, 1-3, 2-3, 2-4 and 3-4 are completed.– Activities 3-5 and 4-6 are in progress and need 2 and 4 days more resp.– The revised estimate shows that activity 8-9 will take only 8 days but
activity 7-9 will need 10 days.• Draw the new network after updating the Project and determine
the Critical path.
Sept 2010 Slide 48 of 64 Project Management Using Network Analysis, By Prof. Nadpurohit
10
0
23
3
37
7
413
13
514
15
616
16
719
26
824
249
34
34
2
3
46
7
7
5
9
3
12
810
8
Network at the start of the Project

Sept 2010 Slide 49 of 64 Project Management Using Network Analysis, By Prof. Nadpurohit
10
0
23
3
37
7
413
13
514
15
616
16
719
26
824
249
34
34
2
3
46
7
7
5
9
3
12
810
8
Network at the start of the Project
10
0
23
3
37
7
413
13
1517
18
1619
19
1722
25
1827
2719
35
35
2
3
46
7
2
5
9
4
128
8
10
Updated Network after day 15 of the Project
1415
15
1315
15
(Finished 4-6) 2
(Finished 3-5) 8
Review at the end of 15th day
Activity Time reqd. (Days)
Activity Status
1-2 0 completed
1-3 0 completed
2-3 0 completed
2-4 0 completed
3-4 0 completed
3-5(13-15) 2 In Progress
4-6(14-16) 4 In Progress
5-7(15-17) 5 Not started
5-8(15-18) 9 Not started
6-8(16-18) 8 Not started
6-9(16-19) 12 Not started
7-9(17-19) 10 Not started
8-9(18-19) 8 Not started
New critical path1-2-3-4-14-16-18-19
Project duration increased by 1 day to 35 days

Review at the end of 15th day
Activity Time reqd. (Days)
Activity Status
1-2 0 completed
1-3 0 completed
2-3 0 completed
2-4 0 completed
3-4 0 completed
3-5(10-15) 2 In Progress
4-6(10-16) 4 In Progress
5-7(15-17) 5 Not started
5-8(15-18) 9 Not started
6-8(16-18) 8 Not started
6-9(16-19) 12 Not started
7-9(17-19) 10 Not started
8-9(18-19) 8 Not started
New critical path1-10-16-18-19
Project duration increased by 1 day to 35 days
Sept 2010 Slide 50 of 64 Project Management Using Network Analysis, By Prof. Nadpurohit
2nd Method
10
0
23
3
37
7
413
13
514
15
616
16
719
26
824
249
34
34
2
3
46
7
7
5
9
3
12
810
8
Network at the start of the Project
10
010
15
15
1619
19
1517
1817
22
25
1827
2719
35
3515
4
12
8
9
2
5
10
8
Updated Network after day 15 of the Project

Probability Assessment in PERT Network
• 3 time estimates are used for every activity• Most optimistic time (to): it is the duration of the
activity when everything goes well. It is assumed that such performance can be improved only in about 1% of the cases
• Most likely time (tm): Normal time the activity would take. It is the time that would occur most often if the activity was to be repeated several times under the same conditions.
• Most Pessimistic time (tp): It is the longest duration expected under the assumption that every thing goes wrong. There is only 1 % chance that the activity will extend beyond this value.
• Expected Time (te) is given by (to + 4 tm + tp)/6• Standard Deviation ( σ ) is given by (tp - to)/6• Variance is given by ( σ )2
Sept 2010 Slide 51 of 64 Project Management Using Network Analysis, By Prof. Nadpurohit

Probability Assessment in PERT Network
• The range specified by optimistic time and pessimistic time is assumed to enclose every possible estimate of the duration of the activity.
• The most likely time estimate may not coincide with the midpoint (to+ tp)/2.
• Hence it is justified to assume that the duration of each activity follows Beta (β) distribution with its unimodal point occurring at tm and its end points at to & tp
Sept 2010 Slide 52 of 64 Project Management Using Network Analysis, By Prof. Nadpurohit

Probability Assessment in PERT Network
In a PERT Network the critical path comprises of 6 activities whose estimated duration in days is given below If the Project is scheduled for completion with in 42 days, what is the probability of achieving the schedule
Activity Optimistic Time Most likely Time Pessimistic Time
1 3 6 12
2 8 9 10
3 6 8 10
4 2 5 8
5 3 9 12
6 3 4 5
Sept 2010 Slide 53 of 64 Project Management Using Network Analysis, By Prof. Nadpurohit

Activity Optimistic Time Most likely Time Pessimistic Time
1 3 6 12
2 8 9 10
3 6 8 10
4 2 5 8
5 3 9 12
6 3 4 5
Activity Time Estimate Expected Time T
Std. Dev. σ Variance (σ)2
t1 t2 t3
1 3 6 12 6.5 1.5 2.25
2 8 9 10 9.0 0.33 0.11
3 6 8 10 8.0 0.67 0.45
4 2 5 8 5.0 1.00 1.00
5 3 9 12 8.5 1.5 2.25
6 3 4 5 4.0 0.33 0.11
TE = 41 6.17
Expected Time for completion of Project, TE = 41 daysVariance of Project Time = 6.17Hence σ for project = √6.17 = 2.48 daysScheduled time of the Project TS = 42 daysStandard normal variate = Z = (TS – TE)/σ = (42 -41)/2.48 = 0.4From table for area under the normal curve for value Z = 0.4 The area = 0.5 + 0.1544 = 0.6554Hence the probability of completing the project by schedule time is 65.54%
Sept 2010 Slide 54 of 64 Project Management Using Network Analysis, By Prof. Nadpurohit

Example
The following table gives the data for the activities of a small Project. Draw the Network and determine the Expected completion of the Project. What is the probability that the Project would take 5 more days for completion from the Expected completion time. Find the Project completion time that will have 95% probability of success (2010, MU)
Activity Optimistic Time Most likely Time Pessimistic Time
1 - 2 1 4 7
1 - 3 5 10 17
2 - 4 3 3 3
2 - 6 1 4 7
3 - 4 8 15 26
3 - 5 2 4 8
4 - 5 5 5 5
5 - 6 2 5 8
Sept 2010 Slide 55 of 64 Project Management Using Network Analysis, By Prof. Nadpurohit

Sept 2010 Project Management Using Network Analysis, By Prof. Nadpurohit Slide 56 of 64

PERT CPMThe result of analysis are expressed in terms of events. PERT is hence said to be Event oriented
The results of calculations are considered in terms of activities of the Project. CPM is activity oriented
The duration of activity is computed from multiple time estimates. This is done to take into account time uncertainties. These estimates are used to arrive at the probable achievement of any given scheduled date of Project completion.
CPM uses only single time estimates and hence does not consider time uncertainties
Does not usually consider costs Attempts to bring out relationship between Project duration and cost on the premise that it would be possible to manipulate project duration with in certain limits by incurring certain costs. Thus a shorter duration means deployment of additional resources and hence incidence of additional costs.
Sept 2010 Slide 57 of 64 Project Management Using Network Analysis, By Prof. Nadpurohit

Time-Cost Trade-Off
• Project costs– Direct costs
• Those expenses that can be directly charged to each and every activity of the Project. E.g. Manpower costs, material consumed, equipment cost, etc.
– Indirect costs• These are related to overall Project duration.
E.g. service and administration costs.• Any reduction in the Project duration leads to
reduction of these costs.
Sept 2010 Slide 58 of 64 Project Management Using Network Analysis, By Prof. Nadpurohit

• Normal duration of an activity– That duration of the activity for which the cost is
minimum
• Normal cost of the activity– The minimum cost of the activity at its normal
duration
Time-Cost Trade-Off
Sept 2010 Slide 59 of 64 Project Management Using Network Analysis, By Prof. Nadpurohit

• Cost Slope– Cost Slope for an activity =
(Crash cost – Normal cost) / (Normal time – Crash time)
Time-Cost Trade-Off
Minimum Project Time
Op
tim
um
Pro
ject
Co
st
Pro
jec
t T
ota
l C
os
t
Project Duration
Project Total Cost Curve
Project Indirect Cost Curve
Project Direct Cost Curve
Total Project Cost Time Relationship
Sept 2010 Slide 60 of 64 Project Management Using Network Analysis, By Prof. Nadpurohit

• Optimal Project Duration– Is the one which results in minimum overall cost
of the Project.– To determine this optimal duration we should
know• Normal duration of each activity• Normal cost of each activity• Cost of crashing the activity and hence the Cost slope of
the activity• Extend to which the activity can be crashed and • Indirect cost of Project per unit time of Project duration
Time-Cost Trade-Off
Sept 2010 Slide 61 of 64 Project Management Using Network Analysis, By Prof. Nadpurohit

Example for determination of Optimal Project duration and Minimum Project cost
• The following table shows details of a Project.The indirect cost is Rs. 400/- per day of Project duration.
• Determine the optimum Project Duration and minimum Project cost
Activity
Immediate Predecessor
Normal
Time (Weeks)
Crash
Time (Weeks)
Normal
Cost (Rs.’000)
Crash
Cost (Rs.’000)
Cost Slop
e (Rs.’000)
A - 10 7 20 30 3.33
B - 8 6 15 20 2.5
C B 5 4 8 14 6
D B 6 4 11 15 2
E B 8 5 9 15 2
F E 5 4 5 8 3
G A, D, C
12 8 3 4 0.25
Sept 2010 Slide 62 of 64 Project Management Using Network Analysis, By Prof. Nadpurohit
1
0
0
2
8
8
3
13
14
414
14
A(10)
5
16
21
6
26
26
B(8)
C(5)
D(6)
D1(0)
E(8)
F(5)
G(12)
10, 13, 14
26, 21
14
21
1614
13
8
9, 8, 13
4, 0

• The following table shows details of a Project.The indirect cost is Rs. 400/- per day of Project duration.
Activity
Immediate Predecessor
Normal
Time (Weeks)
Crash
Time (Weeks)
Normal
Cost (Rs.’000)
Crash
Cost (Rs.’000)
Cost Slop
e (Rs.’000)
A - 10 7 20 30 3.33
B - 8 6 15 20 2.5
C B 5 4 8 14 6
D B 6 4 11 15 2
E B 8 5 9 15 2
F E 5 4 5 8 3
G A, D, C
12 8 3 4 0.25
Sept 2010 Slide 63 of 64 Project Management Using Network Analysis, By Prof. Nadpurohit
1
0
0
2
8
8
3
13
14
414
14
A(10)
5
16
21
6
26
26
B(8)
C(5)
D(6)
D1(0)
E(8)
F(5)
G(12)
10, 13, 14
26, 21
14
21
1614
13
8
9, 8, 13
4, 0
Normal Project Time = 26 daysNormal direct cost = Rs. 71,000/-Indirect cost = 400*26 = 10,400Total Project cost = Normal direct cost + Indirect cost = 71,000 + 10,400 = Rs. 81,400/-Critical path B-D-G (1-2, 2-4, 4-6)Crashing critical activity with minimum cost slope i.e. activity G by 4 days, we get
10
0
28
8
313
14
414
14
516
21
622
22
G(8)
F(5)
E(8)
D(6)
A(10)
B(8)
C(5)
D1(0)

• The following table shows details of a Project.The indirect cost is Rs. 400/- per day of Project duration.
Activity
Immediate Predecessor
Normal
Time (Weeks)
Crash
Time (Weeks)
Normal
Cost (Rs.’000)
Crash
Cost (Rs.’000)
Cost Slop
e (Rs.’000)
A - 10 7 20 30 3.33
B - 8 6 15 20 2.5
C B 5 4 8 14 6
D B 6 4 11 15 2
E B 8 5 9 15 2
F E 5 4 5 8 3
G A, D, C
12 8 3 4 0.25
Sept 2010 Slide 64 of 64 Project Management Using Network Analysis, By Prof. Nadpurohit
Project Time = 22 daysDirect cost = Rs. 71,000/- + 4*250 = 72,000/-Indirect cost = 400*22 = 8,800Total Project cost = Direct cost + Indirect cost = 72,000 + 8,800 = Rs. 80,800/-Critical path B-D-G (1-2, 2-4, 4-6)Critical activity G has reached its crash limit and hence cannot be crashed furtherCrashing other critical activity with minimum cost slope i.e. activity D by 1 day, we get
10
0
28
8
313
14
414
14
516
21
622
22
G(8)
F(5)
E(8)
D(6)
A(10)
B(8)
C(5)
D1(0)
0
01
13
133
8
82
13
134
16
165
21
216
A(10)
B(8)
C(5)
D1(0)G(8)
D(5)
E(8)
F(5)

• The following table shows details of a Project.The indirect cost is Rs. 400/- per day of Project duration.
Activity
Immediate Predecessor
Normal
Time (Weeks)
Crash
Time (Weeks)
Normal
Cost (Rs.’000)
Crash
Cost (Rs.’000)
Cost Slop
e (Rs.’000)
A - 10 7 20 30 3.33
B - 8 6 15 20 2.5
C B 5 4 8 14 6
D B 6 4 11 15 2
E B 8 5 9 15 2
F E 5 4 5 8 3
G A, D, C
12 8 3 4 0.25
Sept 2010 Slide 65 of 64 Project Management Using Network Analysis, By Prof. Nadpurohit
Project Time = 21 daysDirect cost = Rs. 72,000/- + 2000/- = 74,000/-Indirect cost = 400*21 = 8,400Total Project cost = Direct cost + Indirect cost = 74,000 + 8,400 = Rs. 82,400/-This Total Project cost (Rs. 82,400/- ) is > the Total Project cost for 22 days viz. Rs. 80,800/-Hence Optimal Project Duration is 22 days and Minimum Total Project cost is Rs. 80,800/-
0
01
13
133
8
82
13
134
16
165
21
216
A(10)
B(8)
C(5)
D1(0)G(8)
D(5)
E(8)
F(5)
Example for determination of Optimal Project duration and Minimum Project cost
• The network given below gives the normal activity durations and the table given below gives the data on the various costs and crash times. The indirect cost is Rs. 120/- per day of Project duration.
• Determine the optimum Project Duration and minimum Project cost
1
0
0
2
5
5
3
11
11
417
17
96
6
5
10
Activity Normal Time (days)
Crash Time
(Days)
Normal Cost (Rs.)
Crash Cost (Rs.)
Cost Slope (Rs.)
1-2 5 4 170 240 70
1-3 9 6 310 550 80
2-3 6 4 80 200 60
2-4 10 8 130 230 50
3-4 6 4 110 290 90
Sept 2010 Slide 66 of 64 Project Management Using Network Analysis, By Prof. Nadpurohit

1
0
0
2
5
5
3
11
11
417
17
96
6
5
10
1
0
0
2
5
5
3
11
11
417
17
96
6
5
10
Normal Project Time = 17 daysNormal direct cost = Rs. 800/-Total Project cost = Normal direct cost + Indirect cost / day x Duration of the Project = 800 + 120 x 17 = Rs. 2840Critical path 1-2, 2-3, 3-4Activity 1-3 and 2-4, each have a float of 2 daysCrashing activity critical with minimum cost slope i.e. activity 2-3 we get
Activity Normal Time (days)
Crash Time
(Days)
Normal Cost (Rs.)
Crash Cost (Rs.)
Cost Slope (Rs.)
1-2 5 4 170 240 70
1-3 9 6 310 550 80
2-3 6 4 80 200 60
2-4 10 8 130 230 50
3-4 6 4 110 290 90
Critical Path
1
0
0
2
5
5
3
10
10
416
16
96
5
5
10
Sept 2010 Slide 67 of 64 Project Management Using Network Analysis, By Prof. Nadpurohit

Activity Normal Time (days)
Crash Time
(Days)
Normal Cost (Rs.)
Crash Cost (Rs.)
Cost Slope (Rs.)
1-2 5 4 170 240 70
1-3 9 6 310 550 80
2-3 6 4 80 200 60
2-4 10 8 130 230 50
3-4 6 4 110 290 90
1
0
0
2
5
5
3
10
10
416
16
96
5
5
10
Project Time = 16 daysDirect cost = Rs. 800/- + 60 = Rs. 860Total Project cost = Direct cost + Indirect cost / day x Duration of the Project = 860 + 120 x 16 = Rs. 2780Critical path 1-2, 2-3, 3-4Activity 1-3 and 2-4, each have a float of 1 daysCrashing critical activity with minimum cost slope i.e. activity 2-3 we get
1
0
0
2
5
5
3
9
9
415
15
96
4
5
10
Sept 2010 Slide 68 of 64 Project Management Using Network Analysis, By Prof. Nadpurohit

Activity Normal Time (days)
Crash Time
(Days)
Normal Cost (Rs.)
Crash Cost (Rs.)
Cost Slope (Rs.)
1-2 5 4 170 240 70
1-3 9 6 310 550 80
2-3 6 4 80 200 60
2-4 10 8 130 230 50
3-4 6 4 110 290 90
1
0
0
2
5
5
3
9
9
415
15
96
4
5
10Project Time = 15 daysDirect cost = Rs. 860/- + 60 = Rs. 920Total Project cost = Direct cost + Indirect cost / day x Duration of the Project = 920 + 120 x 15 = Rs. 2720Critical path: All paths are critical viz. 1-2-3-4; 1-2-4 & 1-3-4Now Activity 1-3 and 2-4, do not have any float Activity 2-3 has reached its crash duration and cannot be reduced furtherCrashing optionsa) Crash 1-2 & 1-3 at a crash cost of 70+80=Rs.150b) Crash 2-4 & 3-4 at a crash cost of 50+90=Rs. 140
1
0
0
2
4
4
3
8
8
414
14
86
4
4
10
1
0
0
2
5
5
3
9
9
414
14
95
4
5
9
Sept 2010 Slide 69 of 64 Project Management Using Network Analysis, By Prof. Nadpurohit

Activity Normal Time (days)
Crash Time
(Days)
Normal Cost (Rs.)
Crash Cost (Rs.)
Cost Slope (Rs.)
1-2 5 4 170 240 70
1-3 9 6 310 550 80
2-3 6 4 80 200 60
2-4 10 8 130 230 50
3-4 6 4 110 290 90
Crashing optionsa) Crash 1-2 & 1-3 at a crash cost of 70+80=Rs.150b) Crash 2-4 & 3-4 at a crash cost of 50+90=Rs. 140
1
0
0
2
4
4
3
8
8
414
14
86
4
4
10
1
0
0
2
5
5
3
9
9
414
14
95
4
5
9
a b
Option B looks to be the most beneficial
Project Time 14 daysDirect cost = 920+140=1060Indirect cost = 14x120=1680Hence Total Project cost = 1680+1060=2740
Sept 2010 Slide 70 of 64 Project Management Using Network Analysis, By Prof. Nadpurohit

Activity Normal Time (days)
Crash Time
(Days)
Normal Cost (Rs.)
Crash Cost (Rs.)
Cost Slope (Rs.)
1-2 5 4 170 240 70
1-3 9 6 310 550 80
2-3 6 4 80 200 60
2-4 10 8 130 230 50
3-4 6 4 110 290 90
Crashing optionsa) Crash 1-2 & 1-3 at a crash cost of 70+80=Rs.150b) Crash 2-4 & 3-4 at a crash cost of 50+90=Rs. 140
1
0
0
2
4
4
3
8
8
414
14
86
4
4
10
1
0
0
2
5
5
3
9
9
414
14
95
4
5
9
a b
Option c)Activity 2-3 which was at crash time has been relaxed by 1 day to 5 days. By doing this it would be still at a time < its normal time.Activity 1-2 has been crashed by 1 day to 4 days while activity 2-4 has been relaxed to original 10 daysThe crash cost from the original network would be 70+60+90=Rs.220Therefore the Direct cost for this option of 14 days Project Time = 800+220=1020.Indirect cost = 14x120=1680Hence Total Project cost = 1680+1020=2700 Hence this c) option would be the best option
c 1
0
0
2
4
4
3
9
9
414
14
95
5
4
10
Sept 2010 Slide 71 of 64 Project Management Using Network Analysis, By Prof. Nadpurohit

Activity Normal Time (days)
Crash Time
(Days)
Normal Cost (Rs.)
Crash Cost (Rs.)
Cost Slope (Rs.)
1-2 5 4 170 240 70
1-3 9 6 310 550 80
2-3 6 4 80 200 60
2-4 10 8 130 230 50
3-4 6 4 110 290 90
Project Time = 14 days, Total Project cost = Direct cost + Indirect cost / day x Duration of the Project = 1020 + 120 x 14 = Rs. 2700
All activities are criticalActivity 1-2 is at its crash time & hence cannot be further crashedFor a Project duration of 13 days the crashing options are a) Crash 2-4 and 3-4 at a crash cost of 50+90=140b) Crash 1-3, 2-3 and 2-4 at a crash cost of 80+60+50=190Choosing a option we get
1
0
0
2
4
4
3
9
9
414
14
95
5
4
10
d
1
0
0
2
4
4
3
9
9
413
13
94
5
4
9
Total Project Cost:= Direct costs + Indirect cost / day x Duration of the project= 1020+140 + 120x13 = Rs. 2720/-
This total Project cost is > Rs. 2700/Hence Optimal Project duration at a minimum Total cost of Rs. 2700/- is 14 days
Sept 2010 Slide 72 of 64 Project Management Using Network Analysis, By Prof. Nadpurohit

End of Chapter
Sept 2010 Slide 73 of 64 Project Management Using Network Analysis, By Prof. Nadpurohit

Planning is essential for successful accomplishment of any task
The details and depth of planning is related to the complexity of the task to be achieved.

Major elements of planning• Objective
– Defining what is supposed to be achieved.
• Analysis– Gathering facts on what is required to reach the objective.
• Evaluation– Examining the time & effort involved in adapting various
ways to reach the end objective.
• Risk appraisal– Determining the allowance to be made for uncertainty.
• Decision– Specifying the method for implementation
• Schedule– Establishing the time schedule for implementation of the
segment of plan.
Sept 2010 Slide 75 of 64 Project Management Using Network Analysis, By Prof. Nadpurohit

NetworkRestraints and Ladders
1 2
3 4
5 6
7 8
A
B
C
DE
Activity 1-3, Waiting to receive 1st lot for starting activity B
Activity 2-4, Time taken to process last lot to complete activity B
Sept 2010 Slide 76 of 64 Project Management Using Network Analysis, By Prof. Nadpurohit

• Conditional diagramming methods – Allow for non-sequential activities such as
loops or conditional branches – Neither PDM nor ADM allows loops or
conditional branches
• Network templates – Standardized networks can be used for entire
project or portions (subnets or fragnets) of it
Activity sequencing: tools & techniques
Sept 2010 Slide 77 of 64 Project Management Using Network Analysis, By Prof. Nadpurohit

• Project network diagrams– Schematic displays of projects activities and
logical relationships among them – May include full project details or have one or
more summary activities (hammocks)– E.g. PERT
Activity sequencing: outputs
Sept 2010 Slide 78 of 64 Project Management Using Network Analysis, By Prof. Nadpurohit

• Project Planning & Scheduling (3 sessions)• CPM & PERT Techniques
• WBS •Network drawing• Network Analysis• Updating of Network
• Project Cost v/s Project Completion time (2 sessions)• Time Cost Trade off• Crashing of Project Completion time
• Resources allocation (1 session)• Resource Smoothening and Resource Leveling
• Project Control (1 session)• Earned Value Management
Sept 2010 Slide 79 of 64 Project Management Using Network Analysis, By Prof. Nadpurohit

• Project: Characteristics & Types• Project Identification & Formulation• Project Management & Appraisal
• Project Cost Estimation & DPR• Project Financing• Project Appraisal
• Technical• Financial &• Market
Sept 2010 Slide 80 of 64 Project Management Using Network Analysis, By Prof. Nadpurohit

• Arrow diagramming method (ADM) : method of constructing project network diagram using arrows to represent activities and connecting them at nodes to show their dependencies – (called activity-on-arrow AOA)
start finish
A
C
DE
F
B
GH
What type of activity is this?
Activity sequencing: tools and techniques
Sept 2010 Slide 81 of 64 Project Management Using Network Analysis, By Prof. Nadpurohit