Project Management
23
PVK-HT05 2 Project Management Project Management Activities Project Scheduling Cost Estimation
-
Upload
liberty-haley -
Category
Documents
-
view
29 -
download
0
description
Project Management. Project Management Activities Project Scheduling Cost Estimation. Project Management Activities. Project acquisition Project planning Resource assessment Risk and option analysis Cost estimation Project scheduling Work breakdown structure Effort distribution - PowerPoint PPT Presentation
Transcript of Project Management

PVK-HT05 2
Project Management
Project Management Activities
Project Scheduling
Cost Estimation

PVK-HT05 3
Project Management Activities
Project acquisitionProject planningo Resource assessmento Risk and option analysis
Cost estimationProject schedulingo Work breakdown structureo Effort distributiono Resource assignment
Project tracking and controlReporting
PVK-HT05 4
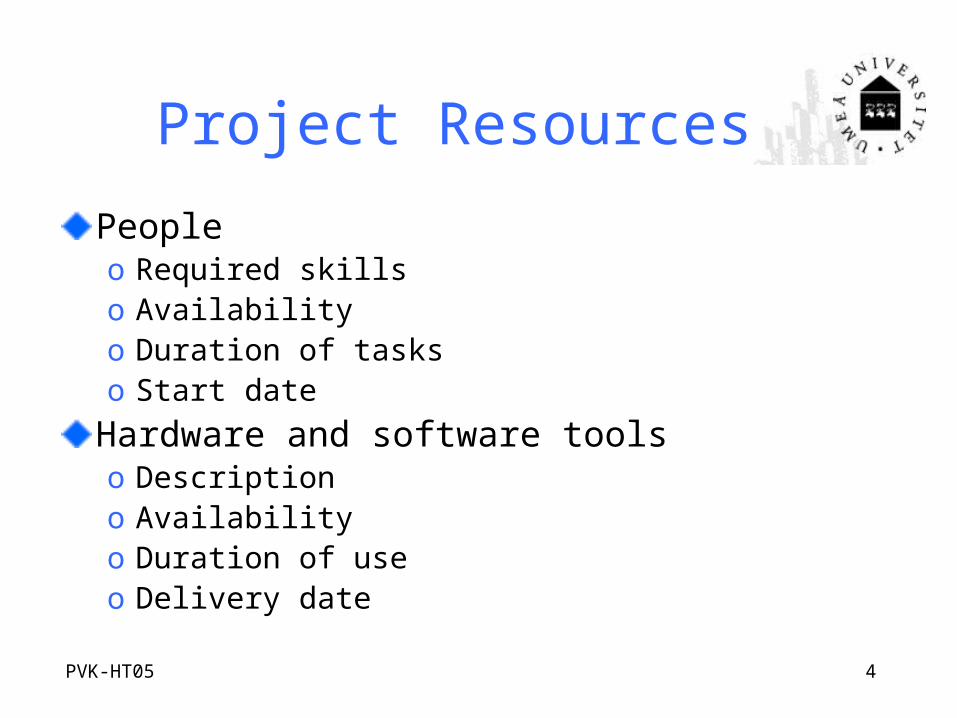
Project Resources
Peopleo Required skillso Availabilityo Duration of taskso Start date
Hardware and software toolso Descriptiono Availabilityo Duration of useo Delivery date

PVK-HT05 5
Risk Analysis
What is a risk?
Risk impact: the loss associated with the eventRisk probability: the likelihood that the event will occurRisk control: the degree to which we can change the outcome
Risk exposure = (risk probability) x (risk impact)

PVK-HT05 6
Top Ten Project RisksStaff deficienciesUnrealistic schedules and budgetsDeveloping the wrong functionsDeveloping the wrong interfaceOver-engineeringChanging requirementsExternally developed itemsExternally performed tasksPerformance problemsAssumptions on technology

PVK-HT05 7
Define Work Breakdown Structure
Activityo Major work unito Start date o End dateo Consumes resourceso Results in work
products (and milestones)
Project
Phase 1
Phase 2
Phase N
Step 1
Step 2
Step 1
Step 2
Step 1
Step 2
Activity 1Activity 2Activity 3
Activity 1Activity 2 Task 1
Task 2Task 3
Project functiono Continue
throughout the project
o Not bound to specific phases
PVK-HT05 8
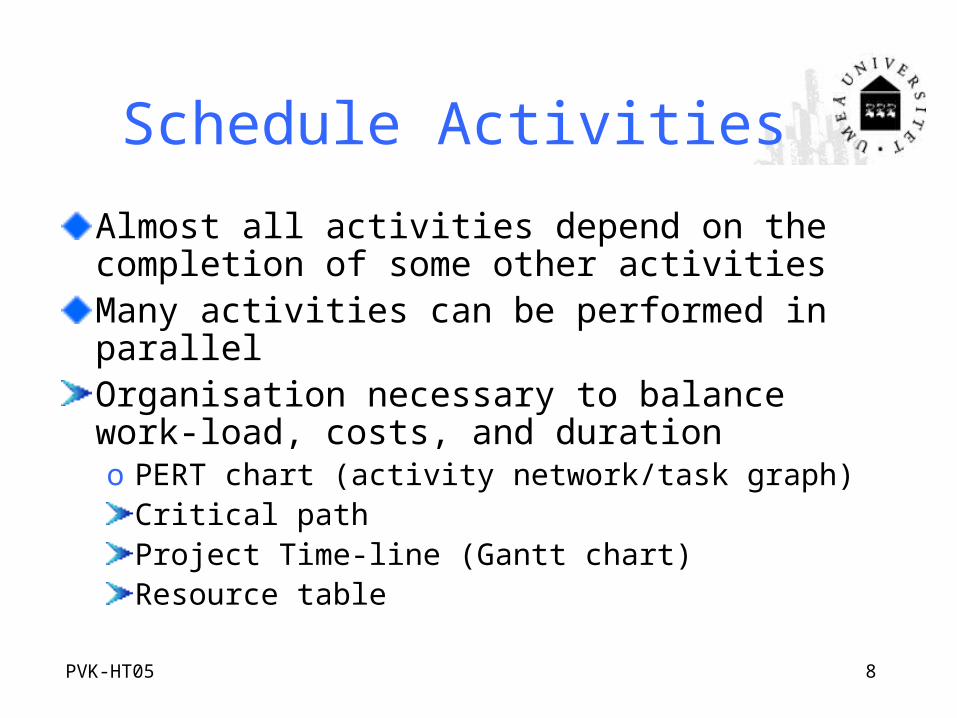
Schedule Activities
Almost all activities depend on the completion of some other activitiesMany activities can be performed in parallelOrganisation necessary to balance work-load, costs, and durationo PERT chart (activity network/task graph)
Critical pathProject Time-line (Gantt chart)Resource table
PVK-HT05 9
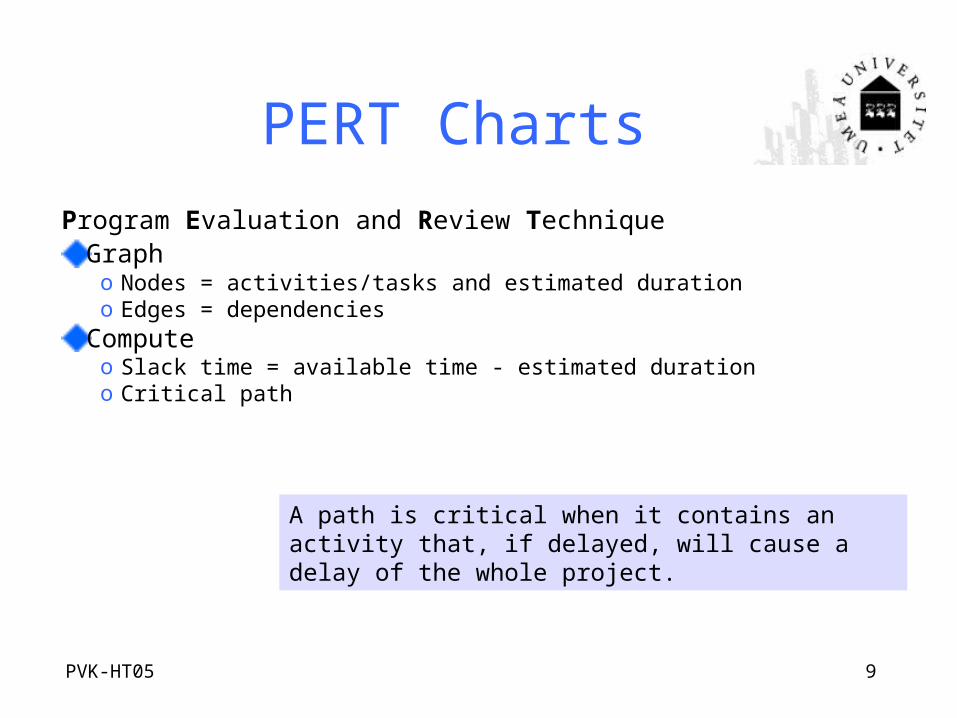
PERT Charts
Program Evaluation and Review TechniqueGrapho Nodes = activities/tasks and estimated durationo Edges = dependencies
Computeo Slack time = available time - estimated durationo Critical path
A path is critical when it contains an activity that, if delayed, will cause a delay of the whole project.

PVK-HT05 10
Example PERT Chart
Design electrical andpneumatic renovations
4 4d
5/4/00 5/9/00
Schedule down-time withproduction supervisor
5 2d
5/10/00 5/11/00
Renovate electrical andpneumatic
13 2d
5/17/00 5/18/00
Get final report from PSU
1 5d
4/27/00 5/3/00
Schedule contractor forelectrical and pneumatic
8 1d
5/12/00 5/12/00
InformPSUabout pickup
7 2d
5/5/00 5/8/00
Removeold hardware
11 2d
5/15/00 5/16/00
Shut down production line
10 1d
5/12/00 5/12/00
Install new hardware
14 3d
5/19/00 5/23/00
Schedule truck to pickuphardware at PSU
6 1d
5/4/00 5/4/00
Get blueprints for oldhardware
2 1d
4/27/00 4/27/00
Time-motionstudy ofexisting hardware
3 2d
5/4/00 5/5/00
Store old hardware (justin case)
12 10d
5/17/00 5/30/00
Transport hardware fromPSU
9 2d
5/9/00 5/10/00

PVK-HT05 11
Gantt charts
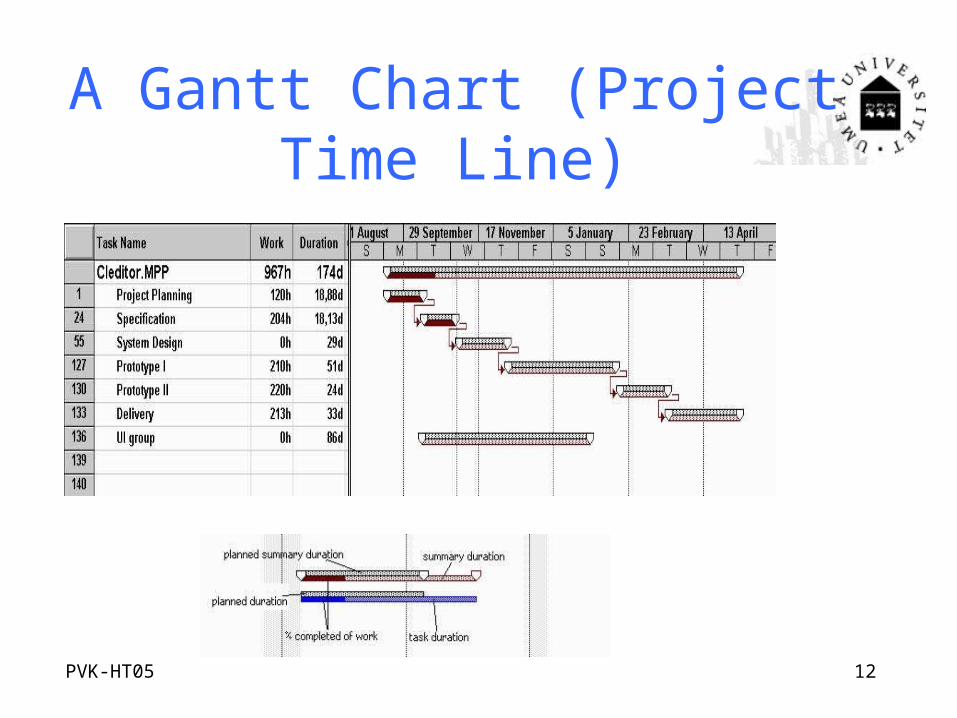
A Gantt chart is used to graphically present the start and end dates of each software engineering task o One axis shows time.o The other axis shows the activities that will be
performed.o The black bars are the top-level tasks. o The white bars are subtaskso The diamonds are milestones:
• Important deadline dates, at which specific events may occur
PVK-HT05 12
A Gantt Chart (Project Time Line)

PVK-HT05 13
Another Gantt Chart

PVK-HT05 14
Cost Estimation
Approacho Decompose problemo Check for experiences/
data on sub problemso Make qualified
estimationso (Make at least two
independent estimates)
Problems:o What are good measures?o Do the estimates affect the
result?o Does the type of software
affect the result?o Does the project environment
affect the result?o ...
Use empirical and historical dataAlgorithmic cost modelling
COCOMO (based on LOC) FP (based on function points)
PVK-HT05 15
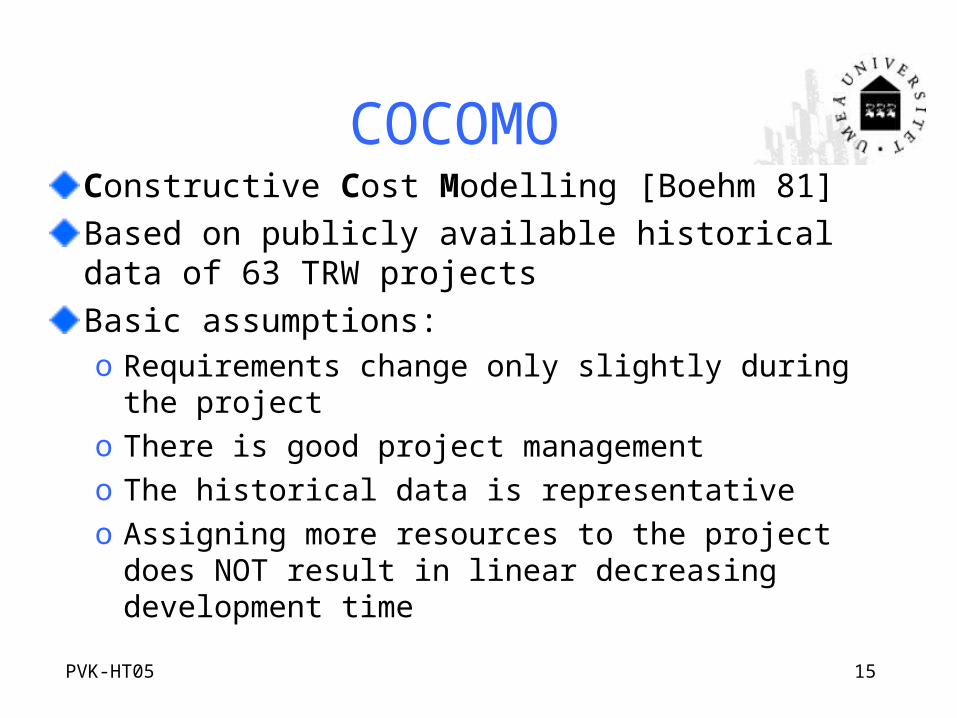
COCOMOConstructive Cost Modelling [Boehm 81]Based on publicly available historical data of 63 TRW projectsBasic assumptions:o Requirements change only slightly during the
projecto There is good project managemento The historical data is representativeo Assigning more resources to the project does NOT
result in linear decreasing development time

PVK-HT05 16
Large and inexperienced teams, many constraints
a b c d
2.4
3.0
3.6
1.05
1.12
1.20
2.5
2.5
2.5
0.38
0.35
0.32
Boehm, Software Engineering Economics, Prentice-Hall, 1981.
Basic Model
•KDSI = Kilo Delivered Source Instructions ( LOC - comments)•The a, b, c, and d factors vary depending on the type of project•Effort is measured in PM (Person Months = 152h of work)•Schedule is the Development Time measured in Months
Organic
Semi-detached
Embedded
In-house IS, Development in a familiar environment
Between OM- and EM projects
Effort = a (KDSI)b Schedule = c (Effort)d

PVK-HT05 17
COCOMO Summary
Works quite well in practiceNeeds KLOC as inputProblems:o Estimating KLOC in early project stages o Comparison of projects using different LOC countso Outdated metrics base (70s)
Solutions:o Cross-check using an other estimation techniqueo Standardised LOC countso Continuous model calibration
COCOMO II is a recent new version

PVK-HT05 18
COCOMO II
Goal: To develop a software cost and schedule estimation model tuned to the life cycle practices of the 1990’s and 2000’s
3 Modelso Application Composition: prototyping to resolve high-
risk user interface issues, 2 environment drivers, 0 process drivers, Sizing in Object Points
o Early Design Model: to explore alternative architectures and concepts,7 environment drivers, 5 process drivers, Sizing in Function Points or SLOC
o Post Architecture Model: development has begun, 17 environment drivers, 5 process drivers, Sizing in Function Points or SLOC

PVK-HT05 19
FactorsScaleProcessSizeEffort Multiplier
s
Environment
FactorsScaleProcess EffortSchedule Multiplier
Effort and schedule in COCOMO 2
• Environment: product, platform, people, project factors
• Process: constraint, risk/architecture, team, maturity factors
Effort = NOP/productivity NOP = OP * [(100 -%reuse)/100] Productivity = NOP/man-months, 5 productivity levels
depending on the 2 environment drivers (table 3.12 course book)
Early Design and Post-architecture Model
Application Composition Model

PVK-HT05 20
Feasibility
Concept ofOperation
Rqts.Spec.
Plansand
Rqts.
ProductDesign
ProductDesignSpec.
DetailDesignSpec.
DetailDesign
Devel.and Test
AcceptedSoftware
Phases and Milestones
RelativeSize Range x
4x
2x
1.25x
1.5x
0.25x
0.5x ApplicationsComposition
(3 parameters)
Early Design(13 parameters)
Post-Architecture(23 parameters)0.67x
0.8x
COCOMO II Model Stages
Overestimated
Underestimated

PVK-HT05 21
COCOMO II summary
COCOMO II +allow for spiral model instead of waterfall
model only+Size of project can be listed as object
points, function points or source lines of code (SLOC)
+The environmental multipliers are calculated from seventeen cost drivers better suited for today's methods
- Calibration is difficult, but can improve accuracy by a factor of five

PVK-HT05 22
Function PointsFunction Point Analysis (FPA) measures the size of a software product in terms of the functionality it delivers to the users. A.J. Albrecht 1979o What the software must do from the user’s perspectiveo Irrespective of software construction
Based on five function types:o Inputso Outputso Inquirieso Logic Fileso Interfaces

PVK-HT05 23
Project plan contents
Project scopeProject scheduleProject team organizationTechnical description of systemProject standards and proceduresQuality assurance planConfiguration management plan
Documentation planData management planResource management planTest planTraining planSecurity planRisk management planMaintenance plan

PVK-HT05 24
Difficulties and Risks in Project Management
Accurately estimating costs is a constant challengeIt is very difficult to measure progress and meet deadlines It is difficult to deal with lack of human resources or technology needed to successfully run a projectCommunicating effectively in a large project is hard It is hard to obtain agreement and commitment from others