All BEMS Course Sponsors Approved, 5/31/2017 · PDF fileAll BEMS Course Sponsors Approved, 5/31/2017

Project in New Mexico
1. Albuquerque 2. Los Alamos
NEDO’s Smart Grid Demonstration Projects in the U. S.

Micro Grid Plant
Mesa del Sol Aperture Center
Micro Grid Plant in Albuquerque
1. Albuquerque
Sandia National Laboratories University of New Mexico Public Service of New Mexico Mesa Del Sol
2
Substation
Feed
er
PCC
Estimated load of building 400kW
Thermal storage tank Air-cooled refrigerator
70USRT
Air-cooled refrigerator 20USRT
Cooling tower
PV 50kW
Heat controller
Gas engine generator 240kW
Fuel cell 80kW
Lead storage battery 50/90kW, 160kWh
Dummy load
100kW
Smart meter
500kW PV 2MWh batteries
Constructed power line
Communica3on line
Exis3ng power line
PV Inverter 50kW
Power controller
BEMS
μEMS+MDMS
BEMS Configuration
3
1. Albuquerque
PCC: Point of common coupling
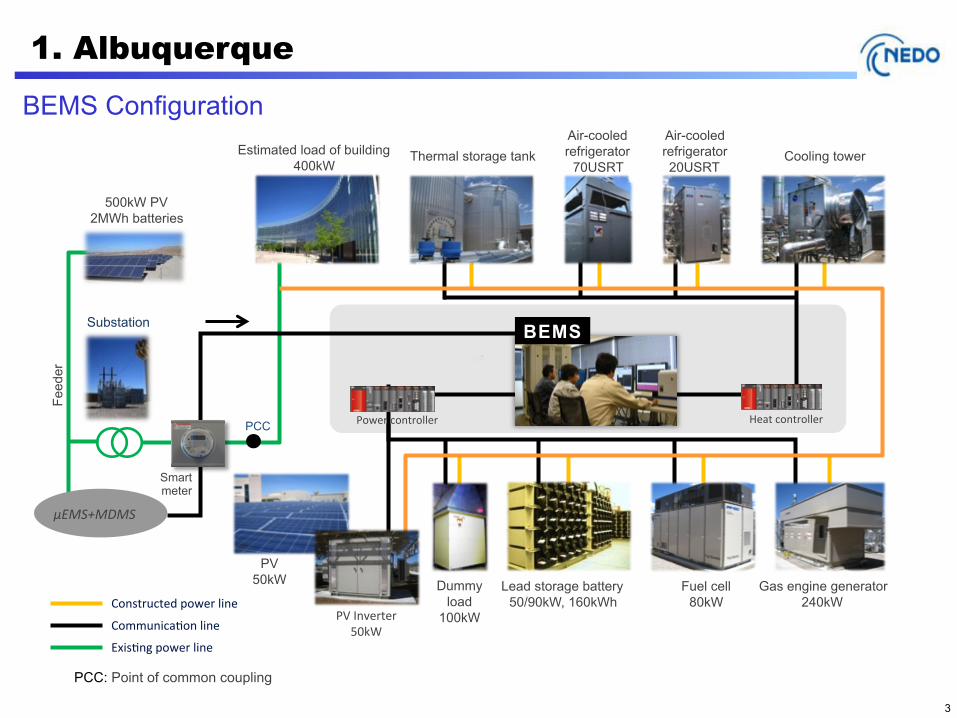
a) Independent Operation of Microgrid
b) Virtual Power Plant
BEMS
BEMS Co-operation with local utility
4
Main Demonstration Contents
1. Albuquerque

1-a Independent Operation of Micro-grid BEMS System
5
Day-ahead supply-demand plan
Supply-demand control (electric power and thermal energy control)
Load (demand) forecast PV generation forecast
Operation plan (supply power and heat plan)
Real-time active control gas-engine, fuel cells, battery, cooling tower, thermal storage
Function of supply demand management by BEMS
µ-EMS
OR BEMS
Battery Energy Storage System for reactive power control
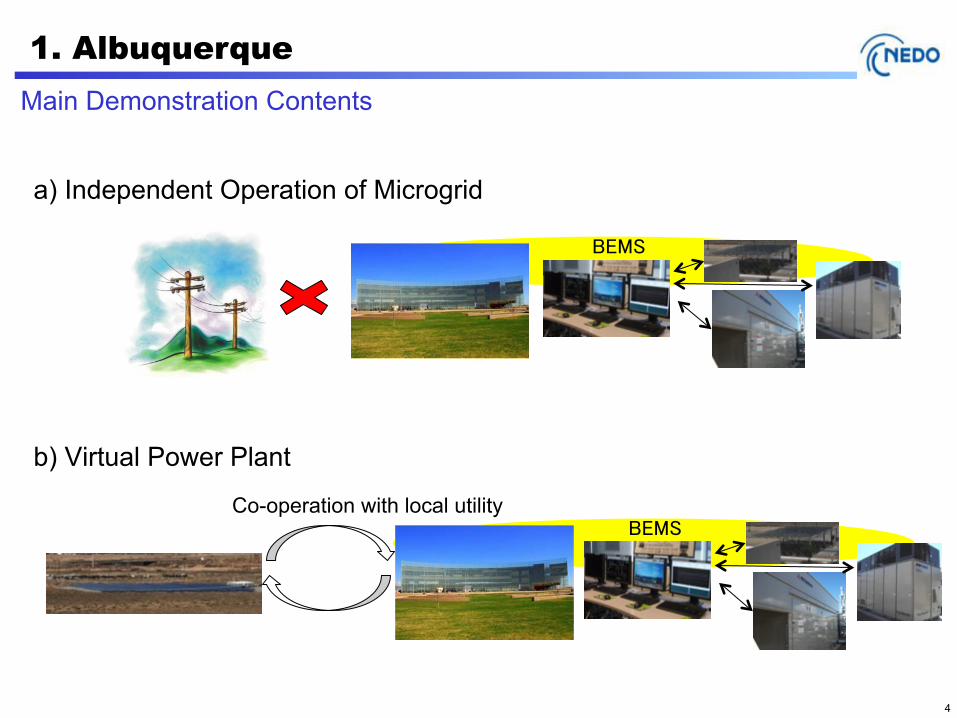
1-a Independent Operation of Micro-grid
Performance results in BEMS islanding mode • BEMS perfectly controlled the balance between demand and supply of electricity.
6
-‐150
-‐100
-‐50
0
50
100
150
200
250
300
350
13:00 13:15 13:30 13:45 14:00 14:15 14:30 14:45 15:00 15:15 15:30
Pow
er [k
W]
PCC BAT PV GE FC LOAD
Load
Gas Engine
PCC Fuel Cell
PV
Battery
→ → → → → → Islanding → → → → → →

1-b Virtual Power Plant Performance Results in Grid-connected Mode • The system has the ability to change the target value at connected point to the Grid. • The system can shift from the grid-connected mode to the islanding mode without any
instantaneous interruption.
7

2. Los Alamos
8
Los Alamos National Laboratory Los Alamos County

Point of common coupling(PCC)
System Configuration in Los Alamos Site
9
2. Los Alamos
1.0MW 6.0MWh
0.8MW 2.3MWh

Main Demonstration Contents
Monitoring
Control
Price Signal
Result of demand curve
Demonstration of Smart House System
10
2. Los Alamos
a) Integrated Energy Management System (µEMS)
b) Demand Response
c) Smart House
Prediction (Demand, PV Output)
Supply-demand Scheduling
Coordination with Upper Level System
Optimum Control of Hybrid Batteries
Demand Response
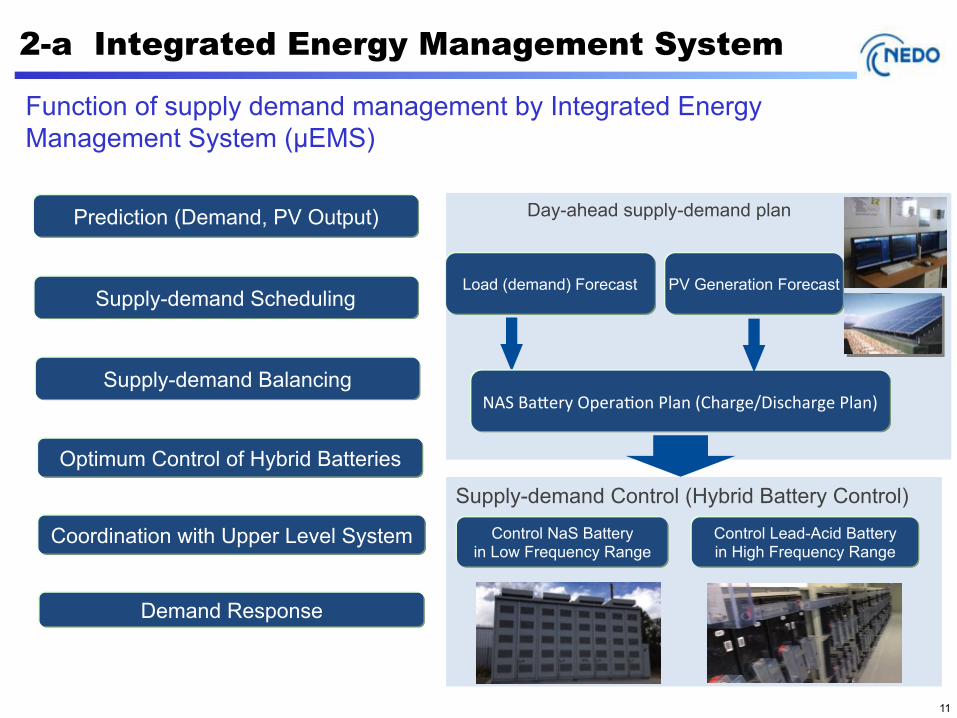
2-a Integrated Energy Management System
Function of supply demand management by Integrated Energy Management System (µEMS)
Supply-demand Balancing
Day-ahead supply-demand plan
Supply-demand Control (Hybrid Battery Control)
Load (demand) Forecast PV Generation Forecast
NAS BaIery Opera3on Plan (Charge/Discharge Plan)
Control NaS Battery in Low Frequency Range
Control Lead-Acid Battery in High Frequency Range
11

µEMS Demonstration Results
• µEMS keeps the power flow flat with 50% Renewables under light load condition on distribution line level.
• µEMS can contribute to the issue of high renewable energy penetration.
2-a Integrated Energy Management System
12

インホームディスプレイ(IHD)
参加者PC携帯
μEMS(東芝)
実証データ管理システム(東芝ソリューション)
ポータルサイト
スマートメータ(ランディス・ギア社)
MDMS/HES(ランディス・ギア社)
Implement demand response based on
weather and demand forecasts
Manage smart meter data
Calculate incentive
Display price info on PC and mobile phone.
Display price info on IHD
Demand response
Demand response management information
Meter info. Price info.
Price info., meter info.
Price info.
Price info.
Participant
Smart meter
In-home display (IHD)
Portal site
Mobile phone
Demonstration Data Management System
2-b Demand Response
Demand Response Related System
• In Los Alamos site, 900 households with installed smart meters volunteered to participate in the demand response demonstration.
Mater Data Management System
13

Demand Response Menu Applied in the Experiment
Group Initial Opt-in Opt-out
Opt-in CPP Flat CPP -
Opt-out CPP CPP - Flat
Opt-out PTR PTR - Flat
Control Flat - -
CPP (Critical Peak Pricing) : Very high price during peak period and discounted price during off-peak period [Price] Peak: 75¢/KWh, LAC flat rate: 9.52¢/KWh, Off-Peak: 7.77¢/KWh
PTR (Peak Time Rebate) : Customers with peak--time consumption less than baseline will receive rebate. [Rebate] 75¢/KWh x kWh saved
Combinations of the two pricing scenarios with default options (Opt-in and Opt-out)
2-b Demand Response
14

Result of DR experiment in 2013
Group TOT Effect Choice Probability ITT Effect
Summer Opt-in CPP -10.49% 64% -6.90%
Opt-out CPP -4.71% 98% -4.59% Opt-out PTR -4.17% 97% -4.06%
Winter Opt-in CPP -7.12% 64% -4.78%
Opt-out CPP -4.41% 98% -4.27% Opt-out PTR -3.37% 97% -3.26%
• TOT effect : Treatment on the Treated. Net peak cut effect when a treatment was given. • ITT effect : Intention to Treat. Choice probability x TOT effect. • The majority of people do not own air conditioners.
• The best result was obtained with Opt-in CPP in summer time where TOT was 10.49%, showing very high peak reduction effect.
15
2-b Demand Response
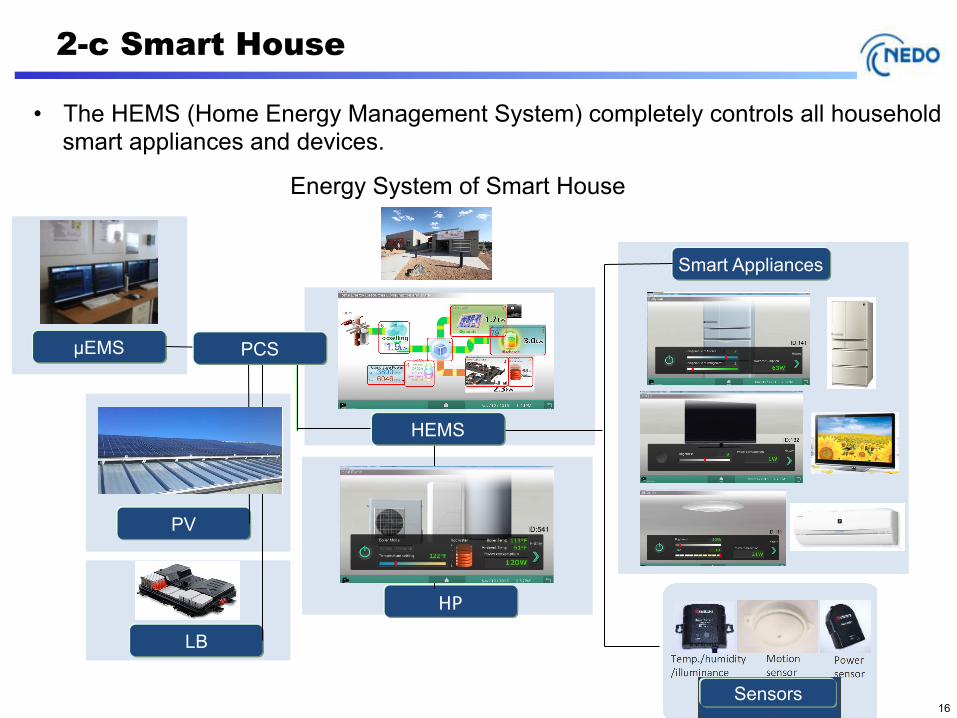
2-c Smart House
Energy System of Smart House
• The HEMS (Home Energy Management System) completely controls all household smart appliances and devices.
16
LB
HP
PV
Smart Appliances
µEMS PCS
Sensors
HEMS

Optimizing Energy Consumption in Association with TOU
Result of Demonstration of TOU Control
• HEMS minimizes energy costs of the home in association with TOU and does not disturb the resident's comfort.
• The result of the demonstration is a maximum profit is $20/day.
17
2-c Smart House

Result of Control in Response toµEMS’ Request
Optimizing Energy Use in Response to the Request from µEMS
18
2-c Smart House
• HEMS Perfectly controls the power output to the grid based on the request from µEMS.
Target Value of Power at Connected Point