Progression of Chronic Kidney Disease After Acute Kidney...
19
921 T he incidence of acute kidney injury (AKI) is rising 1,2 and continues to be associated with elevated acute mortality rates. 3 During the past decade, it has been clearly established that AKI is also associated with an increased risk of developing chronic kidney disease (CKD), end-stage renal disease, and the associated increases in long-term morbidity and mortality. 4–7 Moreover, the risk of developing end-stage renal disease after recovery from AKI is substantially greater in patients with preexisting CKD. 7 Yet, considerable uncertainty exists on the relative contribution of the various mechanisms that have been proposed to accelerate progression of renal disease after AKI, especially in preexisting CKD states. AKI can impact many different cell types along the entire length of the nephron and lead to a heterogeneous injury pat- tern; however, the main pathology associated with AKI is tubulointerstitial fibrosis (TIF), especially within the inner cortical and outer medullary regions, with only minimal to modest levels of glomerular injury. 8 In the acute stages after AKI, severely injured tubular epithelial cells and microvas- cular endothelial cells can undergo both necrosis and apop- tosis and lead to the entire loss of their associated nephrons with ensuing TIF. 8 Although most sublethally injured tubules do recover normal structure and function after AKI, a subset of tubules remain in a dedifferentiated state and continue to release profibrotic and proinflammatory molecules. 9–11 The impaired recovery of such tubules is thought to be related to pathological processes initiated during AKI, such as, hypoxia, cellular senescence, maladaptive repair, and inflammation that can also contribute to the loss of nephrons and development of TIF after AKI. 6,12–18 Of note, the loss of nephrons and ensu- ing TIF that develops acutely after AKI (ie, 1–4 weeks after injury), because of either lethally injured cells or impaired recovery of sublethally injured cells, denotes the AKI–CKD transition. 11 In contrast to the AKI–CKD transition, the progression of CKD after AKI requires injury to and loss of nephrons that were either uninjured during AKI or had essentially recovered from the AKI episode. In all forms of CKD progression, the loss of renal function correlates best with the level of TIF. 19 Yet, there is considerable uncertainty on the pathogenesis of de novo TIF after recovery from AKI. 6 Such mechanisms of TIF produc- tion can be broadly separated into those pathways initiated Abstract—The relative contribution of self-perpetuating versus hemodynamic-induced fibrosis to the progression of chronic kidney disease (CKD) after acute kidney injury (AKI) is unclear. In the present study, male Sprague-Dawley rats underwent right uninephrectomy and were instrumented with a blood pressure radiotelemeter. Two weeks later, separate groups of rats were subjected to 40 minutes renal ischemia–reperfusion or sham surgery and followed up for 4 or 16 weeks to determine the extent to which glomerulosclerosis and tubulointerstitial fibrosis as a result of the AKI–CKD transition (ie, at 4 weeks post AKI) change over time during the progression of CKD (ie, at 16 weeks post AKI). On average, tubulointerstitial fibrosis was ≈3-fold lower (P<0.05), whereas glomerulosclerosis was ≈6-fold higher (P<0.05) at 16 versus 4 weeks post AKI. At 16 weeks post AKI, marked tubulointerstitial fibrosis was only observed in rats exhibiting marked glomerulosclerosis, proteinuria, and kidney hypertrophy consistent with a hemodynamic pathogenesis of renal injury. Moreover, quantitative analysis between blood pressure and renal injury revealed a clear and modest blood pressure threshold (average 16-week systolic blood pressure of ≈127 mm Hg) for the development of glomerulosclerosis. In summary, modest levels of blood pressure may be playing a substantial role in the progression of renal disease after AKI in settings of preexisting CKD associated with 50% loss of renal mass. In contrast, these data do not support a major role of self-perpetuating tubulointerstitial fibrosis in the progression CKD after AKI in such settings. (Hypertension. 2016;68:921-928. DOI: 10.1161/HYPERTENSIONAHA.116.07749.) • Online Data Supplement Key Words: fibrosis ■ glomerular filtration rate ■ glomerulosclerosis, focal segmental ■ hypertension ■ ischemia ■ renal circulation Received April 24, 2016; first decision May 14, 2016; revision accepted July 22, 2016. From the Research and Development Service, Edward Hines Jr. VA Hospital, Hines, IL (A.J.P.); Department of Medicine, (A.J.P.) and Department of Pathology (M.P.), Loyola University–Chicago, Maywood, IL; and Department of Electrical and Computer Engineering, Illinois Institute of Technology, Chicago (J.L., G.A.W.). The online-only Data Supplement is available with this article at http://hyper.ahajournals.org/lookup/suppl/doi:10.1161/HYPERTENSIONAHA. 116.07749/-/DC1. Correspondence to Aaron J. Polichnowski, Edward Hines Jr. VA Hospital, 5000 S 5th Ave, Hines, IL 60143. E-mail [email protected] Progression of Chronic Kidney Disease After Acute Kidney Injury Role of Self-Perpetuating Versus Hemodynamic-Induced Fibrosis Maria Picken, Jianrui Long, Geoffrey A. Williamson, Aaron J. Polichnowski © 2016 American Heart Association, Inc. Hypertension is available at http://hyper.ahajournals.org DOI: 10.1161/HYPERTENSIONAHA.116.07749 Kidney by guest on May 28, 2018 http://hyper.ahajournals.org/ Downloaded from by guest on May 28, 2018 http://hyper.ahajournals.org/ Downloaded from by guest on May 28, 2018 http://hyper.ahajournals.org/ Downloaded from by guest on May 28, 2018 http://hyper.ahajournals.org/ Downloaded from by guest on May 28, 2018 http://hyper.ahajournals.org/ Downloaded from by guest on May 28, 2018 http://hyper.ahajournals.org/ Downloaded from by guest on May 28, 2018 http://hyper.ahajournals.org/ Downloaded from by guest on May 28, 2018 http://hyper.ahajournals.org/ Downloaded from by guest on May 28, 2018 http://hyper.ahajournals.org/ Downloaded from by guest on May 28, 2018 http://hyper.ahajournals.org/ Downloaded from by guest on May 28, 2018 http://hyper.ahajournals.org/ Downloaded from by guest on May 28, 2018 http://hyper.ahajournals.org/ Downloaded from
Transcript of Progression of Chronic Kidney Disease After Acute Kidney...

921
The incidence of acute kidney injury (AKI) is rising1,2 and continues to be associated with elevated acute mortality
rates.3 During the past decade, it has been clearly established that AKI is also associated with an increased risk of developing chronic kidney disease (CKD), end-stage renal disease, and the associated increases in long-term morbidity and mortality.4–7 Moreover, the risk of developing end-stage renal disease after recovery from AKI is substantially greater in patients with preexisting CKD.7 Yet, considerable uncertainty exists on the relative contribution of the various mechanisms that have been proposed to accelerate progression of renal disease after AKI, especially in preexisting CKD states.
AKI can impact many different cell types along the entire length of the nephron and lead to a heterogeneous injury pat-tern; however, the main pathology associated with AKI is tubulointerstitial fibrosis (TIF), especially within the inner cortical and outer medullary regions, with only minimal to modest levels of glomerular injury.8 In the acute stages after AKI, severely injured tubular epithelial cells and microvas-cular endothelial cells can undergo both necrosis and apop-tosis and lead to the entire loss of their associated nephrons
with ensuing TIF.8 Although most sublethally injured tubules do recover normal structure and function after AKI, a subset of tubules remain in a dedifferentiated state and continue to release profibrotic and proinflammatory molecules.9–11 The impaired recovery of such tubules is thought to be related to pathological processes initiated during AKI, such as, hypoxia, cellular senescence, maladaptive repair, and inflammation that can also contribute to the loss of nephrons and development of TIF after AKI.6,12–18 Of note, the loss of nephrons and ensu-ing TIF that develops acutely after AKI (ie, 1–4 weeks after injury), because of either lethally injured cells or impaired recovery of sublethally injured cells, denotes the AKI–CKD transition.11
In contrast to the AKI–CKD transition, the progression of CKD after AKI requires injury to and loss of nephrons that were either uninjured during AKI or had essentially recovered from the AKI episode. In all forms of CKD progression, the loss of renal function correlates best with the level of TIF.19 Yet, there is considerable uncertainty on the pathogenesis of de novo TIF after recovery from AKI.6 Such mechanisms of TIF produc-tion can be broadly separated into those pathways initiated
Abstract—The relative contribution of self-perpetuating versus hemodynamic-induced fibrosis to the progression of chronic kidney disease (CKD) after acute kidney injury (AKI) is unclear. In the present study, male Sprague-Dawley rats underwent right uninephrectomy and were instrumented with a blood pressure radiotelemeter. Two weeks later, separate groups of rats were subjected to 40 minutes renal ischemia–reperfusion or sham surgery and followed up for 4 or 16 weeks to determine the extent to which glomerulosclerosis and tubulointerstitial fibrosis as a result of the AKI–CKD transition (ie, at 4 weeks post AKI) change over time during the progression of CKD (ie, at 16 weeks post AKI). On average, tubulointerstitial fibrosis was ≈3-fold lower (P<0.05), whereas glomerulosclerosis was ≈6-fold higher (P<0.05) at 16 versus 4 weeks post AKI. At 16 weeks post AKI, marked tubulointerstitial fibrosis was only observed in rats exhibiting marked glomerulosclerosis, proteinuria, and kidney hypertrophy consistent with a hemodynamic pathogenesis of renal injury. Moreover, quantitative analysis between blood pressure and renal injury revealed a clear and modest blood pressure threshold (average 16-week systolic blood pressure of ≈127 mm Hg) for the development of glomerulosclerosis. In summary, modest levels of blood pressure may be playing a substantial role in the progression of renal disease after AKI in settings of preexisting CKD associated with 50% loss of renal mass. In contrast, these data do not support a major role of self-perpetuating tubulointerstitial fibrosis in the progression CKD after AKI in such settings. (Hypertension. 2016;68:921-928. DOI: 10.1161/HYPERTENSIONAHA.116.07749.) • Online Data Supplement
Key Words: fibrosis ■ glomerular filtration rate ■ glomerulosclerosis, focal segmental ■ hypertension ■ ischemia ■ renal circulation
Received April 24, 2016; first decision May 14, 2016; revision accepted July 22, 2016.From the Research and Development Service, Edward Hines Jr. VA Hospital, Hines, IL (A.J.P.); Department of Medicine, (A.J.P.) and Department of
Pathology (M.P.), Loyola University–Chicago, Maywood, IL; and Department of Electrical and Computer Engineering, Illinois Institute of Technology, Chicago (J.L., G.A.W.).
The online-only Data Supplement is available with this article at http://hyper.ahajournals.org/lookup/suppl/doi:10.1161/HYPERTENSIONAHA. 116.07749/-/DC1.
Correspondence to Aaron J. Polichnowski, Edward Hines Jr. VA Hospital, 5000 S 5th Ave, Hines, IL 60143. E-mail [email protected]
Progression of Chronic Kidney Disease After Acute Kidney Injury
Role of Self-Perpetuating Versus Hemodynamic-Induced Fibrosis
Maria Picken, Jianrui Long, Geoffrey A. Williamson, Aaron J. Polichnowski
© 2016 American Heart Association, Inc.
Hypertension is available at http://hyper.ahajournals.org DOI: 10.1161/HYPERTENSIONAHA.116.07749
Kidney
by guest on May 28, 2018
http://hyper.ahajournals.org/D
ownloaded from
by guest on M
ay 28, 2018http://hyper.ahajournals.org/
Dow
nloaded from
by guest on May 28, 2018
http://hyper.ahajournals.org/D
ownloaded from
by guest on M
ay 28, 2018http://hyper.ahajournals.org/
Dow
nloaded from
by guest on May 28, 2018
http://hyper.ahajournals.org/D
ownloaded from
by guest on M
ay 28, 2018http://hyper.ahajournals.org/
Dow
nloaded from
by guest on May 28, 2018
http://hyper.ahajournals.org/D
ownloaded from
by guest on M
ay 28, 2018http://hyper.ahajournals.org/
Dow
nloaded from
by guest on May 28, 2018
http://hyper.ahajournals.org/D
ownloaded from
by guest on M
ay 28, 2018http://hyper.ahajournals.org/
Dow
nloaded from
by guest on May 28, 2018
http://hyper.ahajournals.org/D
ownloaded from
by guest on M
ay 28, 2018http://hyper.ahajournals.org/
Dow
nloaded from

922 Hypertension October 2016
during AKI versus remote pathways that are independent of the AKI event, per se. The persistence of pathological processes initiated during AKI (eg, hypoxia, cellular senescence, mal-adaptive repair, inflammation, etc) have been proposed to con-tribute to CKD progression primarily via a self-perpetuating TIF pathway.6,12–18 According to this theory, the TIF commonly observed as part of the AKI–CKD transition (ie, 2–4 weeks post AKI in rodents) should expand over time.15–17 Conversely, hemodynamic mechanisms similar to those responsible for the progression of CKD in rats with 5/6 renal ablation, which are, per se, independent of AKI, are also thought to contrib-ute to CKD progression after AKI.6,9–11,20,21 Such pathways are activated after a sufficient loss of renal mass and include sys-temic and glomerular hypertension, impaired renal blood flow (RBF) autoregulation, hyperfiltration, and hypertrophy.10,11,22 In this setting, CKD progression primarily occurs as a result of barotrauma-mediated glomerulosclerosis-induced TIF.23,24 As described by Kaissling et al23 and Kriz and LeHir,24 this injury pathway results from adhesions of injured glomerular capillaries to areas of the Bowman capsule as a result of glo-merular hypertension coupled with reduced podocyte density. The resulting glomerular tuft–Bowman capsule synechia leads to misdirected filtration to the tubulointerstitium resulting in an inflammatory and TIF response that encapsulates the glo-merular tuft and early proximal tubule. This process can ulti-mately lead to atubular glomeruli and the complete loss of the nephron. According to this theory, elevated levels of TIF at extended time points after AKI should primarily be observed in kidneys exhibiting renal morphological and histological mani-festations of hypertension-induced renal injury (eg, glomerular hypertrophy, proteinuria, focal segmental glomerulosclerosis, etc). Currently, the relative importance of these 2 pathways of TIF production to the progression of CKD after AKI is vague, and we are not aware of any previous study that has rigorously evaluated the blood pressure (BP)–renal injury relationships at extended time points after AKI in rats.
The major goal of this study was to investigate the poten-tial contribution of self-perpetuating versus hemodynamic-induced TIF production to the progression of CKD after ischemia-reperfusion (IR)–induced AKI in uninephrecto-mized rats. We focused on uninephrectomized rats because previous studies have shown that significant progression of CKD does occur after IR injury in this model of preexisting renal mass reduction as opposed to the modest progression of CKD observed after IR injury in rats with 2 kidneys.13,25–27 The pattern and magnitude of renal injury, consisting of TIF, glomerulosclerosis, and vascular injury, was assessed at 4 and 16 weeks post IR in different groups of rats to determine the extent to which such pathologies observed as a result of the AKI–CKD transition (ie, 4 weeks post IR) change during the progression of CKD (ie, 16 weeks post IR). To investigate the potential role of hemodynamic mechanisms in the progression of CKD after AKI, we examined the quantitative relationships between radiotelemetrically measured BP and renal injury at 16 weeks post IR. In addition, we also assessed the effects of IR on renal hemodynamics and injury at an early time point (ie, 4 weeks) after AKI in chronically instrumented unine-phrectomized rats. We hypothesized that if self-perpetuating TIF was playing a major role in the progression of CKD after
AKI, then levels of TIF at 16 weeks post AKI would be sig-nificantly greater than that observed at 4 weeks post AKI.
MethodsA detailed description of the surgical procedures and methods are provided in the online-only Data Supplement.
Experimental AnimalsA total of 71 male Sprague-Dawley rats (Charles River) were obtained at 8 weeks of age and provided a standard rat chow (1.0% NaCl, Purina) and drinking water ad libitum. The animals were cared for in accordance with National Institutes of Health and institutional guidelines, and studies were approved by the Institutional Animal Care and Use Committee at Edward Hines Veterans Administration Hospital and Loyola University.
Experimental Design
Assessment of BP and Renal Injury 16 Weeks Post AKIRats recovered for 2 weeks after uninephrectomy+BP radiotelemeter implantation to allow for completion of compensatory increases in renal size and function.28 Two weeks post uninephrectomy, a 24-hour urine collection and blood sample were obtained to assess baseline proteinuria and serum creatinine (S
Cr). Rats were then subjected to
40-minute IR (n=36) or sham IR (n=8) as described previously.9 A blood sample was obtained at 48 hours post IR for the assessment of S
Cr, which was used as an index of AKI severity. Proteinuria and
SCr
were assessed every 4 weeks during the 16-week protocol. At 16 weeks post IR, renal injury was assessed in a blinded fashion.
Assessment of Renal Injury, Hemodynamics, and RBF Autoregulation 4 Weeks Post AKIThese rats underwent similar surgical procedures as those described above with respect to uninephrectomy, radiotelemeter implantation, and IR (n=17) or sham IR (n=10). At 3 weeks post IR, all rats were chronically instrumented with a RBF transducer and an osmotic mini-pump containing fluorescein isothiocyanate–inulin for the determina-tion of glomerular filtration rate (GFR). One week later, BP and RBF were obtained (200 Hz) for 2 to 3 hours/d for 3 days in conscious rats. A blood sample and a 24-hour urine collection were then obtained for the measurement of hematocrit and GFR. After measurements in the conscious state, rats were prepared for steady-state step RBF autoregulation experiments. At the completion of these studies, renal injury was assessed in a blinded fashion.
Statistical AnalysisResults are given as means±SE. Statistical comparisons between groups over time were performed using 2-way repeated-measures ANOVA. Post hoc comparisons were made using a Student–Newman–Keuls test. A nonparametric Mann–Whitney test was used to evaluate differences in renal injury parameters between IR and sham IR groups at each time point and within IR and sham IR groups at different time points. Linear regression analysis was used to calculate the slope of the relationship between glomerular injury and BP and between autoregulatory index and GFR. Unpaired t tests were used to evaluate differences among all other variables between IR and sham IR groups. P values of <0.05 were considered statistically significant.
ResultsBP and Renal Injury During 16 Weeks Post AKIOf the 36 rats subjected to IR, 12 were euthanized within 3 days, and 2 were euthanized within 4 to 8 weeks after IR for humane reasons and were not included in the analysis. There were no significant differences at baseline between IR and sham IR groups with respect to body weight (271±7 versus 247±14 g), S
Cr (Figure S1 in the online-only Data Supplement),
by guest on May 28, 2018
http://hyper.ahajournals.org/D
ownloaded from

Picken et al Progression of CKD Following AKI 923
systolic BP (Figure 1), and proteinuria (Figure 2). SCr
at 48 hours post IR was significantly greater in rats subjected to IR versus sham IR (3.6±0.5 versus 0.5±0.1 mg/dL, respectively); however, by 4 weeks post IR and for the remainder of the pro-tocol, no significant differences were noted between groups (Figure S1). Systolic BP was significantly higher in IR versus sham IR groups at 1 and 2 weeks post IR, but subsequently returned toward baseline levels such that no differences were noted between groups at 3 weeks post IR (Figure 1). Yet, a modest but steady increase in BP occurred in the IR group beginning at 5 weeks post IR, which became significantly higher, versus sham IR rats by 9 weeks post IR and for the remainder of the protocol. A similar pattern was observed for proteinuria with significantly greater levels observed in rats subjected to IR versus sham IR at 12 and 16 weeks post IR.
At 16 weeks post IR, no significant differences in body weight (585±14 versus 626±21 g) or hematocrit (41±1 ver-sus 42±1%) were observed between IR and sham IR groups, respectively. Kidney weight was greater in the IR versus sham IR group when expressed either as absolute weight (5.3±0.1 versus 4.0±0.2 g; P<0.001) or relative to body weight (9.2±0.4 versus 6.6±0.2 g/kg; P<0.001). Renal injury was significantly greater in the IR versus sham IR group as evidenced by a ≈5-fold greater level of glomerulosclerosis and the observance of TIF only in the IR group (Figure 3B). The glomerulosclerosis phenotype in all rats consisted of segmental/global glomerulo-sclerosis as opposed to ischemic glomerulosclerosis. Vascular injury was not observed in either group. Figure 4A illustrates the quantitative relationships between BP and glomeruloscle-rosis among all rats. In general, although a significant positive correlation between BP and glomerulosclerosis was observed, there was a clear BP threshold (≈127 mm Hg) for the develop-ment of substantial glomerulosclerosis within the IR group. For example, the level of glomerulosclerosis in rats (n=11) whose average 16-week systolic BP was >127 mm Hg was 15.8±3.5% as compared with the modest 3.6±0.8% observed in rats (n=11) whose BP was <127 mm Hg after IR (P<0.05). Similar quantitative relationships were noted between BP and TIF (Figure 4B). The TIF score for rats whose 16-week
average systolic BP was >127 mm Hg was 1.3±0.4 versus 0.2±0.1 in rats whose 16-week average systolic BP was <127 mm Hg after IR (P<0.05). Of note, there was a strong cor-relation between glomerulosclerosis and TIF within the IR group (Figure 4C), indicating that the progression of CKD after AKI, manifest as high levels of TIF, was only observed in those rats that developed substantial levels of glomerulo-sclerosis (ie, >10% glomerulosclerosis). Similar robust and significant relationships were also observed between glomer-ulosclerosis and TIF versus proteinuria and renal mass at 16 weeks post IR (Figures S2 and S3), consistent with a hemody-namic pathogenesis of renal injury. In contrast, weaker, albeit significant, relationships between S
Cr 48 hours post IR and
glomerulosclerosis (r2=0.21; P<0.05) and SCr
48 hours post IR and TIF (r2=0.33; P<0.05) were observed, indicating that the severity of AKI, per se, was not likely a major determi-nant in the progression of renal disease after IR (Figure S4). Moreover, no clear 48-hour S
Cr threshold for elevated levels of
glomerulosclerosis or TIF at 16 weeks post IR was apparent, unlike that observed for BP.
Renal Injury, Hemodynamics, and RBF Autoregulation 4 Weeks Post AKIOf the 17 rats subjected to IR, 5 were euthanized within 3 days after IR for humane reasons. Hemodynamic measurements and injury were successfully obtained in the remaining 12 rats in the IR group. At 48 hours post IR, S
Cr was significantly ele-
vated in the IR versus sham IR group (4.1±0.6 versus 0.6±0.1 mg/dL, respectively). Of note, the 48-hour S
Cr values in the
rats subjected to IR and studied at 4 weeks post IR were simi-lar in the group of rats subjected to IR and studied at 16 weeks post IR, suggesting a comparable severity of AKI (Figure S1). At 4 weeks post IR, no significant differences in body weight were noted between the IR and sham IR groups (460±11 ver-sus 452±13 g). Kidney weight was significantly greater in the IR versus sham IR groups when expressed as absolute weight (3.4±0.2 versus 2.4±0.1 g; P<0.001) or relative to body weight (7.5±0.6 versus 5.3±0.1 g/kg; P<0.002). In the sham IR group, no glomerulosclerosis or TIF was observed. In contrast, rats
Figure 1. Weekly averages of radiotelemetrically measured systolic blood pressure (BP) at baseline (time 0) and during the subsequent 16 wk in uninephrectomized rats subjected to 40-min renal ischemia–reperfusion (IR) or sham IR. *P<0.05 maximum vs rats subjected to sham IR at respective time point.
Figure 2. Proteinuria, as determined from 24-h urine collections, at baseline (time 0) and every 4 wk for 16 wk in uninephrectomized rats subjected to 40-min renal ischemia–reperfusion (IR) or sham IR. *P<0.05 maximum vs rats subjected to sham IR at respective time point.
by guest on May 28, 2018
http://hyper.ahajournals.org/D
ownloaded from

924 Hypertension October 2016
subjected to IR exhibited substantial TIF but modest glomeru-losclerosis (Figure 3A). Moreover, there was a strong relation-ship (r2=0.82; P<0.0001) between S
Cr 48 hours post IR and the
level of TIF at 4 weeks post IR (Figure S5), indicating that the severity of AKI was likely a major determinant of the level of TIF observed during the AKI–CKD transition.
Of note, the level of glomerulosclerosis was significantly greater at 16 versus 4 weeks post IR, whereas the level of TIF was significantly greater at 4 versus 16 weeks post IR (Figure 3B). Thus, glomerulosclerosis increased, whereas TIF decreased over time. Indeed, the evidence that the majority of kidneys (15 of 22) examined at 16 weeks post IR had TIF scores of 0 to 0.5 on a scale of 0 to 4, indicating minimal to modest levels of TIF, whereas the majority of kidneys (9 of 12) examined at 4 weeks post IR had TIF scores >2, indicating the presence of TIF in ≥50% of the kidney, despite a similar severity of AKI is consistent with the notion that TIF tends to shrink over time.11,23,24,29
Table presents the results of the hemodynamic assessment at 4 weeks post IR (n=12) or sham IR (n=10) in conscious rats. No significant differences in mean arterial pressure were observed. However, a significantly elevated renal vas-cular resistance (P<0.05) and consequently reduced RBF
(P<0.005) were observed in rats subjected to IR versus sham IR. Rats subjected to IR also had a lower renal plasma flow (P<0.05), despite their substantially lower (P<0.005) hema-tocrit levels as compared with the sham IR group. Although GFR was lower in the IR versus sham IR group, the differ-ence was not significant (P=0.24). Similarly, FF was not significantly different between groups (P=0.30). A summary of the conventional step RBF autoregulatory assessment is presented in Table and Figure 5. Autoregulatory assessments were made in 7 of the 10 chronically instrumented rats in the sham IR group. In the IR group, autoregulatory capacity was not assessed in 1 rat because of technical issues. In both groups, RBF did not significantly change across mean arterial pressure steps of ≈ 100, 120, and 140 mm Hg, indicating that autoregulatory capacity, on average, was not substantially impaired in either group. Indeed, the autoregulatory indices were similar between groups (Table); however, a wide range was seen in both the IR (0.07–0.89) and sham IR (0.03–0.80) groups. Given that the severity of and recovery from IR within individual groups is highly variable, we examined the relationship between autoregulatory index and GFR in rats subjected to IR. As shown in Figure 5, those rats with the lowest GFR values, and likely greatest loses of functional
Figure 3. Semi-quantification of glomerulosclerosis (% of 100 examined glomeruli exhibiting any degree of sclerosis) and tubulointerstitial fibrosis (TIF, 0–4 scale with 0=no TIF, 1=25%, 2=50%, 3=75%, and 4=100% of section exhibiting TIF) at (A) 4 weeks and (B) 16 wk post renal ischemia–reperfusion (IR) or sham IR in different groups of rats. *P<0.05 maximum vs sham IR group. &P<0.05 maximum vs respective score at 4 or 16 wk post IR.
Figure 4. Quantitative relationships between (A) percentage of glomerulosclerosis and 16-wk average systolic blood pressure (BP), (B) tubulointerstitial fibrosis (TIF) and 16-wk average systolic BP, and (C) TIF and percentage of glomerulosclerosis at 16 wk post renal ischemia–reperfusion (IR) or sham IR.
by guest on May 28, 2018
http://hyper.ahajournals.org/D
ownloaded from
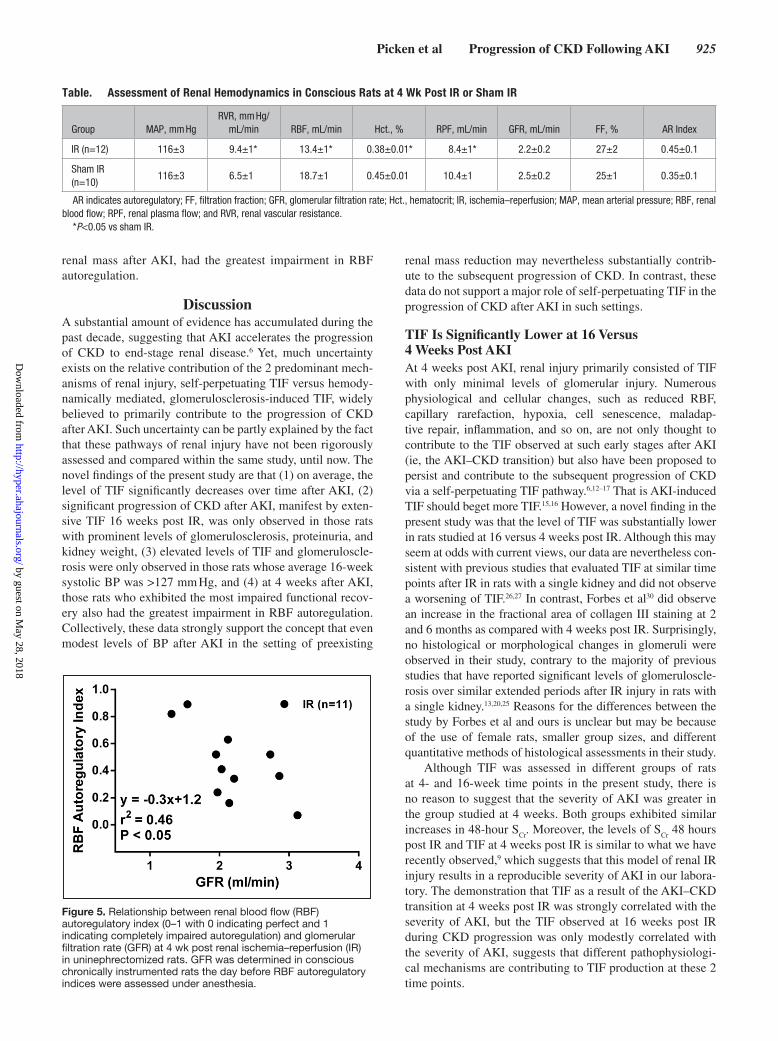
Picken et al Progression of CKD Following AKI 925
renal mass after AKI, had the greatest impairment in RBF autoregulation.
DiscussionA substantial amount of evidence has accumulated during the past decade, suggesting that AKI accelerates the progression of CKD to end-stage renal disease.6 Yet, much uncertainty exists on the relative contribution of the 2 predominant mech-anisms of renal injury, self-perpetuating TIF versus hemody-namically mediated, glomerulosclerosis-induced TIF, widely believed to primarily contribute to the progression of CKD after AKI. Such uncertainty can be partly explained by the fact that these pathways of renal injury have not been rigorously assessed and compared within the same study, until now. The novel findings of the present study are that (1) on average, the level of TIF significantly decreases over time after AKI, (2) significant progression of CKD after AKI, manifest by exten-sive TIF 16 weeks post IR, was only observed in those rats with prominent levels of glomerulosclerosis, proteinuria, and kidney weight, (3) elevated levels of TIF and glomeruloscle-rosis were only observed in those rats whose average 16-week systolic BP was >127 mm Hg, and (4) at 4 weeks after AKI, those rats who exhibited the most impaired functional recov-ery also had the greatest impairment in RBF autoregulation. Collectively, these data strongly support the concept that even modest levels of BP after AKI in the setting of preexisting
renal mass reduction may nevertheless substantially contrib-ute to the subsequent progression of CKD. In contrast, these data do not support a major role of self-perpetuating TIF in the progression of CKD after AKI in such settings.
TIF Is Significantly Lower at 16 Versus 4 Weeks Post AKIAt 4 weeks post AKI, renal injury primarily consisted of TIF with only minimal levels of glomerular injury. Numerous physiological and cellular changes, such as reduced RBF, capillary rarefaction, hypoxia, cell senescence, maladap-tive repair, inflammation, and so on, are not only thought to contribute to the TIF observed at such early stages after AKI (ie, the AKI–CKD transition) but also have been proposed to persist and contribute to the subsequent progression of CKD via a self-perpetuating TIF pathway.6,12–17 That is AKI-induced TIF should beget more TIF.15,16 However, a novel finding in the present study was that the level of TIF was substantially lower in rats studied at 16 versus 4 weeks post IR. Although this may seem at odds with current views, our data are nevertheless con-sistent with previous studies that evaluated TIF at similar time points after IR in rats with a single kidney and did not observe a worsening of TIF.26,27 In contrast, Forbes et al30 did observe an increase in the fractional area of collagen III staining at 2 and 6 months as compared with 4 weeks post IR. Surprisingly, no histological or morphological changes in glomeruli were observed in their study, contrary to the majority of previous studies that have reported significant levels of glomeruloscle-rosis over similar extended periods after IR injury in rats with a single kidney.13,20,25 Reasons for the differences between the study by Forbes et al and ours is unclear but may be because of the use of female rats, smaller group sizes, and different quantitative methods of histological assessments in their study.
Although TIF was assessed in different groups of rats at 4- and 16-week time points in the present study, there is no reason to suggest that the severity of AKI was greater in the group studied at 4 weeks. Both groups exhibited similar increases in 48-hour S
Cr. Moreover, the levels of S
Cr 48 hours
post IR and TIF at 4 weeks post IR is similar to what we have recently observed,9 which suggests that this model of renal IR injury results in a reproducible severity of AKI in our labora-tory. The demonstration that TIF as a result of the AKI–CKD transition at 4 weeks post IR was strongly correlated with the severity of AKI, but the TIF observed at 16 weeks post IR during CKD progression was only modestly correlated with the severity of AKI, suggests that different pathophysiologi-cal mechanisms are contributing to TIF production at these 2 time points.
Table. Assessment of Renal Hemodynamics in Conscious Rats at 4 Wk Post IR or Sham IR
Group MAP, mm HgRVR, mm Hg/
mL/min RBF, mL/min Hct., % RPF, mL/min GFR, mL/min FF, % AR Index
IR (n=12) 116±3 9.4±1* 13.4±1* 0.38±0.01* 8.4±1* 2.2±0.2 27±2 0.45±0.1
Sham IR (n=10)
116±3 6.5±1 18.7±1 0.45±0.01 10.4±1 2.5±0.2 25±1 0.35±0.1
AR indicates autoregulatory; FF, filtration fraction; GFR, glomerular filtration rate; Hct., hematocrit; IR, ischemia–reperfusion; MAP, mean arterial pressure; RBF, renal blood flow; RPF, renal plasma flow; and RVR, renal vascular resistance.
*P<0.05 vs sham IR.
Figure 5. Relationship between renal blood flow (RBF) autoregulatory index (0–1 with 0 indicating perfect and 1 indicating completely impaired autoregulation) and glomerular filtration rate (GFR) at 4 wk post renal ischemia–reperfusion (IR) in uninephrectomized rats. GFR was determined in conscious chronically instrumented rats the day before RBF autoregulatory indices were assessed under anesthesia.
by guest on May 28, 2018
http://hyper.ahajournals.org/D
ownloaded from

926 Hypertension October 2016
Additional evidence supporting a lack of a major role of self-perpetuating TIF in the progression of CKD after AKI in the present study was the pattern of glomerular injury. If self-perpetuating TIF were mediating such progression of CKD, we would have expected that glomerular injury at 16 weeks post AKI would primarily consist of shrunken tufts with sig-nificant periglomerular fibrosis because the TIF expanded into the renal cortex. In contrast, the only glomerular lesion observed was segmental or global glomerulosclerosis, and such lesions were mainly seen in larger glomeruli and hyper-trophied kidneys. This phenotype of glomerular injury is con-sistent with an intravascular origin and is commonly seen in hyperperfused and hypertrophied glomeruli exposed to mod-estly elevated levels of glomerular capillary pressures for extended time periods.31
The significantly lower level of TIF at 16 versus 4 weeks post AKI is nevertheless consistent with the notion that a fundamental feature of TIF is that it shrinks. Kaissling et al23 and and Kriz and LeHir24 have postulated, that TIF, per se, is a protective mechanism that serves to anatomically con-fine lethally injured nephrons to maintain renal parenchymal architecture and preserve normal renal structure and func-tion in uninjured nephrons. Venkatachalam et al11 have also suggested that AKI-induced TIF should shrink over time as long as other mechanisms that promote the development of TIF are not initiated after AKI. Finally, our data are in agree-ment with those recently reported in kidney transplant recip-ients in which fibrosis and transcript expression of disease processes were longitudinally evaluated for over a year.29 They reported that kidneys exhibiting extensive fibrosis for extended time periods after receiving a kidney transplant were not dependent on an autonomous fibrosis response, but rather on new disease processes that developed after AKI and were independent of the acute transplant-associated fibrotic response.
Potential Role of Modest Elevations in BP in the Progression of CKD After AKIA novel finding in the present study was the modest, yet sig-nificant, increase in BP after AKI in uninephrectomized rats fed a normal 1% NaCl diet during a 16-week period. Previous studies have demonstrated the significance of nephron loss32 and TIF,21,33 both consequences of AKI in the setting of pre-existing CKD, in increasing the susceptibility to salt-sensitive hypertension, in part via an impairment in the pressure natri-uresis mechanism.34 Indeed, rats previously subjected to bilat-eral IR exhibit significant increases in BP when switched from a 1% to 4% NaCl diet.21,34 However, in the few studies that have assessed BP after IR in uninephrectomized rats fed a normal NaCl diet, significant increase in BP were not detected.21,26,27 However, the small sample sizes, limited follow-up time, and the use of inadequate tail-cuff methods35 to accurately detect modest changes in BP in these previous studies provide likely explanations for the different results. Of note, our study using gold-standard techniques to chronically assess BP after AKI are in agreement with a recent clinical study demonstrating that AKI predisposes to the development of hypertension.36
Importantly, our study suggests that modest levels of BP may nevertheless be playing a major role in the progression
of CKD after AKI in rats with preexisting 50% renal mass reduction. The quantitative relationships between BP and renal injury revealed a considerable amount of variability in the extent of glomerulosclerosis and TIF; nevertheless, such analysis led to the important observation that substan-tial CKD progression, manifest by robust levels of TIF, was only observed in those rats that developed significant levels of glomerulosclerosis. These data suggest that development of glomerulosclerosis after AKI may be essential to the subsequent progression of CKD. Indeed, the phenotype of glomerular injury (ie, focal segmental or global glomeru-losclerosis), the strong correlations between BP, glomer-ulosclerosis, TIF, proteinuria and kidney weight, and the clear systolic BP threshold for the development of glomer-ulosclerosis and TIF (≈ 127 mm Hg) is consistent with a hemodynamically mediated pathogenesis of CKD progres-sion.22 In contrast to the modest susceptibility to hyperten-sion-induced renal injury in the majority of patients and experimental models with intact renal mass,22,31 the risk is substantially greater in CKD states, such as that observed after AKI in the presence of preexisting renal mass reduc-tion. We have demonstrated that such differences in susceptibility can be explained by differences in RBF auto-regulation.22,31 Impairment in RBF autoregulation in CKD states allows a greater degree of systemic BP to be transmit-ted to the renal microvasculature, including the glomerular capillaries. The strong correlation between glomeruloscle-rosis and proteinuria, a robust index of glomerular capillary hypertension,37,38 observed in the present study is support-ive of these concepts. Such differences in the renal trans-mission of systemic BP to the glomerular capillaries may also explain, in part, the greater rate of CKD progression after IR in rats with a single kidney as compared with those with intact kidneys.13,25 The significant negative correlation between autoregulatory index and GFR at 4 weeks post IR, before the development of significant glomerulosclerosis, is also supportive of the concept that further reductions of renal mass after AKI in rats with preexisting CKD increase the susceptibility to hypertensive renal injury. The general importance of impaired RBF autoregulation associated with reductions in renal mass in increasing the susceptibil-ity to CKD progression has also recently been described in clinical populations.39 Thus, our study highlights the poten-tial importance of even modest levels of BP, that would be considered normotensive by current guidelines,40 to neverthe-less substantially contribute to the progression renal disease after AKI in the presence of preexisting CKD.
Potential Role of Hemodynamic Factors in the Contribution to the AKI–CKD TransitionDespite no significant differences in GFR between rats sub-jected to IR versus sham IR at 4 weeks post AKI, RBF was significantly lower in the IR group. These data may have important implications with respect to the role of hypoxia in contributing to the extent of acute nephron loss as a direct result of the AKI event or recovery from it (ie, the AKI–CKD transi-tion). Because GFR is a major determinant of renal oxygen consumption, chronic reductions in RBF in the IR group sug-gest that oxygen demand may be greater than oxygen supply.
by guest on May 28, 2018
http://hyper.ahajournals.org/D
ownloaded from

Picken et al Progression of CKD Following AKI 927
The mechanisms that mediate such potential mismatches in oxygen supply and demand are likely related to microvas-cular rarefaction and impairments in renal metabolism after IR.11,13,41,42 It has been suggested that improving oxygen sup-ply or the impairments in renal metabolism could mitigate the loss of nephrons after IR by improving recovery of sublethally injured cells.11,13,42
PerspectivesWe conclude that self-perpetuating TIF is not playing a major role in CKD progression after AKI in uninephrecto-mized rats. In contrast, our data suggest that even modest elevations in BP after AKI in such settings may nevertheless be substantially contributing to CKD progression via hemo-dynamically mediated, glomerulosclerosis-induced TIF. Of particular relevance to our study, early nephrology follow-up after severe AKI has been shown to be associated with a significant reduction in mortality during a 2-year period.43 It is possible that such early follow-up is associated with a more aggressive lowering of BP and greater attention to preventing increases in proteinuria, which is indicative of glomerular hypertension, after AKI. Similar striking ben-efits of aggressive BP lowering on reducing cardiovascu-lar morbidity and mortality have recently been reported in the Systolic Blood Pressure Intervention Trial (SPRINT).44 Future studies using the experimental paradigm described in this study will examine whether aggressive (ie, systolic BP <120 mm Hg) versus conventional (ie, systolic BP <140 mm Hg) antihypertensive therapy is required to prevent CKD progression after AKI in preexisting CKD states. Moreover, such studies will also examine whether specific antihypertensive classes (eg, renin–angiotensin system inhibitors) confer greater protection against CKD progres-sion after AKI via BP-independent pathways. It is unclear at this time whether the progression of CKD after AKI in various preexisting CKD states is largely dependent on BP lowering, as observed in the majority of hypertensive CKD models,22 or if it is associated with a greater BP-independent component.
AcknowledgmentsWe acknowledge Theresa Herbst for technical support and Martha Prado for secretarial support. Dr Polichnowski also wishes to ac-knowledge Drs Anil Bidani and Karen Griffin for their careful review of the article and helpful comments.
Sources of FundingThis work was supported by a Career Development Award 1K2BX001285 from the Office of Research and Development of the Department of Veterans Affairs and a Young Investigator Award from the National Kidney Foundation of IL to Dr Polichnowski.
DisclosuresNone.
References 1. Hsu CY, McCulloch CE, Fan D, Ordoñez JD, Chertow GM, Go
AS. Community-based incidence of acute renal failure. Kidney Int. 2007;72:208–212. doi: 10.1038/sj.ki.5002297.
2. Rewa O, Bagshaw SM. Acute kidney injury-epidemiology, outcomes and eco-nomics. Nat Rev Nephrol. 2014;10:193–207. doi: 10.1038/nrneph.2013.282.
3. Chertow GM, Burdick E, Honour M, Bonventre JV, Bates DW. Acute kid-ney injury, mortality, length of stay, and costs in hospitalized patients. J Am Soc Nephrol. 2005;16:3365–3370. doi: 10.1681/ASN.2004090740.
4. Bagshaw SM. Short- and long-term survival after acute kidney injury. Nephrol Dial Transplant. 2008;23:2126–2128. doi: 10.1093/ndt/gfn300.
5. Chawla LS, Amdur RL, Amodeo S, Kimmel PL, Palant CE. The sever-ity of acute kidney injury predicts progression to chronic kidney disease. Kidney Int. 2011;79:1361–1369. doi: 10.1038/ki.2011.42.
6. Chawla LS, Eggers PW, Star RA, Kimmel PL. Acute kidney injury and chronic kidney disease as interconnected syndromes. N Engl J Med. 2014;371:58–66. doi: 10.1056/NEJMra1214243.
7. Ishani A, Xue JL, Himmelfarb J, Eggers PW, Kimmel PL, Molitoris BA, Collins AJ. Acute kidney injury increases risk of ESRD among elderly. J Am Soc Nephrol. 2009;20:223–228. doi: 10.1681/ASN.2007080837.
8. Sharfuddin AA, Weisbord, S.D., Palevsky, P.M., Molitoris, B.A. Acute kidney injury. In: Shorecki K, Chertow, G.M., Marsden, P.A., Taal, M.W., Yu, A.S.L, eds. Brenner & Rector’s The Kidney. Philadelphia, PA: Elseiver, Inc; 2016:958–1011.
9. Polichnowski AJ, Lan R, Geng H, Griffin KA, Venkatachalam MA, Bidani AK. Severe renal mass reduction impairs recovery and promotes fibro-sis after AKI. J Am Soc Nephrol. 2014;25:1496–1507. doi: 10.1681/ASN.2013040359.
10. Venkatachalam MA, Griffin KA, Lan R, Geng H, Saikumar P, Bidani AK. Acute kidney injury: a springboard for progression in chronic kidney dis-ease. Am J Physiol Renal Physiol. 2010;298:F1078–F1094. doi: 10.1152/ajprenal.00017.2010.
11. Venkatachalam MA, Weinberg JM, Kriz W, Bidani AK. Failed tubule recovery, AKI-CKD transition, and kidney disease progression. J Am Soc Nephrol. 2015;26:1765–1776. doi: 10.1681/ASN.2015010006.
12. Basile DP, Donohoe D, Roethe K, Osborn JL. Renal ischemic injury results in permanent damage to peritubular capillaries and influences long-term function. Am J Physiol Renal Physiol. 2001;281:F887–F899.
13. Basile DP, Donohoe DL, Roethe K, Mattson DL. Chronic renal hypoxia after acute ischemic injury: effects of L-arginine on hypoxia and second-ary damage. Am J Physiol Renal Physiol. 2003;284:F338–F348. doi: 10.1152/ajprenal.00169.2002.
14. Ferenbach DA, Bonventre JV. Mechanisms of maladaptive repair after AKI leading to accelerated kidney ageing and CKD. Nat Rev Nephrol. 2015;11:264–276. doi: 10.1038/nrneph.2015.3.
15. Fine LG, Bandyopadhay D, Norman JT. Is there a common mechanism for the progression of different types of renal diseases other than protein-uria? Towards the unifying theme of chronic hypoxia. Kidney Int Suppl. 2000;75:S22–S26.
16. Nangaku M. Chronic hypoxia and tubulointerstitial injury: a final com-mon pathway to end-stage renal failure. J Am Soc Nephrol. 2006;17:17–25. doi: 10.1681/ASN.2005070757.
17. Rockey DC, Bell PD, Hill JA. Fibrosis–a common pathway to organ injury and failure. N Engl J Med. 2015;372:1138–1149. doi: 10.1056/NEJMra1300575.
18. Zager RA. ‘Biologic memory’ in response to acute kidney injury: cytoresis-tance, toll-like receptor hyper-responsiveness and the onset of progressive renal disease. Nephrol Dial Transplant. 2013;28:1985–1993. doi: 10.1093/ndt/gft101.
19. Nath KA. Tubulointerstitial changes as a major determinant in the pro-gression of renal damage. Am J Kidney Dis. 1992;20:1–17.
20. Azuma H, Nadeau K, Takada M, Mackenzie HS, Tilney NL. Cellular and molecular predictors of chronic renal dysfunction after initial ischemia/reperfusion injury of a single kidney. Transplantation. 1997;64:190–197.
21. Spurgeon-Pechman KR, Donohoe DL, Mattson DL, Lund H, James L, Basile DP. Recovery from acute renal failure predisposes hypertension and secondary renal disease in response to elevated sodium. Am J Physiol Renal Physiol. 2007;293:F269–F278. doi: 10.1152/ajprenal.00279.2006.
22. Bidani AK, Polichnowski AJ, Loutzenhiser R, Griffin KA. Renal micro-vascular dysfunction, hypertension and CKD progression. Curr Opin Nephrol Hypertens. 2013;22:1–9. doi: 10.1097/MNH.0b013e32835b36c1.
23. Kaissling B, Lehir M, Kriz W. Renal epithelial injury and fibrosis. Biochim Biophys Acta. 2013;1832:931–939. doi: 10.1016/j.bbadis.2013.02.010.
24. Kriz W, LeHir M. Pathways to nephron loss starting from glomerular diseases-insights from animal models. Kidney Int. 2005;67:404–419. doi: 10.1111/j.1523-1755.2005.67097.x.
25. Cruzado JM, Torras J, Riera M, Herrero I, Hueso M, Espinosa L, Condom E, Lloberas N, Bover J, Alsina J, Grinyó JM. Influence of nephron mass in development of chronic renal failure after prolonged warm renal ischemia. Am J Physiol Renal Physiol. 2000;279:F259–F269.
by guest on May 28, 2018
http://hyper.ahajournals.org/D
ownloaded from

928 Hypertension October 2016
26. Pagtalunan ME, Olson JL, Meyer TW. Contribution of angiotensin II to late renal injury after acute ischemia. J Am Soc Nephrol. 2000;11:1278–1286.
27. Pagtalunan ME, Olson JL, Tilney NL, Meyer TW. Late consequences of acute ischemic injury to a solitary kidney. J Am Soc Nephrol. 1999;10:366–373.
28. Chamberlain RM, Shirley DG. Time course of the renal functional response to partial nephrectomy: measurements in conscious rats. Exp Physiol. 2007;92:251–262. doi: 10.1113/expphysiol.2006.034751.
29. Venner JM, Famulski KS, Reeve J, Chang J, Halloran PF. Relationships among injury, fibrosis, and time in human kidney transplants. JCI Insight. 2016;1:e85323.
30. Forbes JM, Hewitson TD, Becker GJ, Jones CL. Ischemic acute renal failure: long-term histology of cell and matrix changes in the rat. Kidney Int. 2000;57:2375–2385. doi: 10.1046/j.1523-1755.2000.00097.x.
31. Bidani AK, Griffin KA. Pathophysiology of hypertensive renal dam-age: implications for therapy. Hypertension. 2004;44:595–601. doi: 10.1161/01.HYP.0000145180.38707.84.
32. Brenner BM, Garcia DL, Anderson S. Glomeruli and blood pressure. Less of one, more the other? Am J Hypertens. 1988;1(4 pt 1):335–347.
33. Franco M, Sanchez-Lozada LG, Bautista R, Johnson RJ, Rodriguez-Iturbe B. Pathophysiology of salt-sensitive hypertension: a new scope of an old problem. Blood Purif. 2008;26:45–48. doi: 10.1159/000110563.
34. Pechman KR, De Miguel C, Lund H, Leonard EC, Basile DP, Mattson DL. Recovery from renal ischemia-reperfusion injury is associated with altered renal hemodynamics, blunted pressure natriuresis, and sodium-sensitive hypertension. Am J Physiol Regul Integr Comp Physiol. 2009;297:R1358–R1363. doi: 10.1152/ajpregu.91022.2008.
35. Kurtz TW, Griffin KA, Bidani AK, Davisson RL, Hall JE; Subcommittee of Professional and Public Education of the American Heart Association. Recommendations for blood pressure measurement in humans and experi-mental animals. Part 2: blood pressure measurement in experimental ani-mals: a statement for professionals from the subcommittee of professional and public education of the American Heart Association council on high blood pressure research. Hypertension. 2005;45:299–310. doi: 10.1161/01.HYP.0000150857.39919.cb.
36. Hsu CY, Hsu RK, Yang J, Ordonez JD, Zheng S, Go AS. Elevated BP after AKI. J Am Soc Nephrol. 2016;27:914–923. doi: 10.1681/ASN.2014111114.
37. Griffin KA, Polichnowski A, Litbarg N, Picken M, Venkatachalam MA, Bidani AK. Critical blood pressure threshold depen-dence of hypertensive injury and repair in a malignant nephro-sclerosis model. Hypertension. 2014;64:801–807. doi: 10.1161/HYPERTENSIONAHA.114.03609.
38. Yoshioka T, Shiraga H, Yoshida Y, Fogo A, Glick AD, Deen WM, Hoyer JR, Ichikawa I. “Intact nephrons” as the primary origin of proteinuria in chronic renal disease. Study in the rat model of sub-total nephrectomy. J Clin Invest. 1988;82:1614–1623. doi: 10.1172/JCI113773.
39. Fotheringham J, Odudu A, McKane W, Ellam T. Modification of the relationship between blood pressure and renal albumin permeability by impaired excretory function and diabetes. Hypertension. 2015;65:510–516. doi: 10.1161/HYPERTENSIONAHA.114.04656.
40. Taler SJ, Agarwal R, Bakris GL, Flynn JT, Nilsson PM, Rahman M, Sanders PW, Textor SC, Weir MR, Townsend RR. KDOQI US commentary on the 2012 KDIGO clinical practice guideline for management of blood pressure in CKD. Am J Kidney Dis. 2013;62:201–213. doi: 10.1053/j.ajkd.2013.03.018.
41. Basile DP. The endothelial cell in ischemic acute kidney injury: implica-tions for acute and chronic function. Kidney Int. 2007;72:151–156. doi: 10.1038/sj.ki.5002312.
42. Tanaka S, Tanaka T, Nangaku M. Hypoxia as a key player in the AKI-to-CKD transition. Am J Physiol Renal Physiol. 2014;307:F1187–F1195. doi: 10.1152/ajprenal.00425.2014.
43. Harel Z, Wald R, Bargman JM, Mamdani M, Etchells E, Garg AX, Ray JG, Luo J, Li P, Quinn RR, Forster A, Perl J, Bell CM. Nephrologist follow-up improves all-cause mortality of severe acute kidney injury survivors. Kidney Int. 2013;83:901–908. doi: 10.1038/ki.2012.451.
44. Wright JT, Jr, Williamson JD, Whelton PK, et al. A randomized trial of intensive versus standard blood-pressure control. N Engl J Med. 2015;373:2103–2116.
What Is New?•The quantitative relationships between radiotelemetrically measured
blood pressure (BP) and renal injury during extended time periods after acute kidney injury (AKI) in uninephrectomized rats suggest that even modest elevations in BP may nevertheless be substantially contributing to progression of renal disease via glomerulosclerosis-induced tubuloin-terstitial fibrosis (TIF) production.
•Self-perpetuating TIF is not likely playing a major role in the progression of renal disease after AKI in uninephrectomized rats.
What Is Relevant?•These data indicate that intensive antihypertensive therapy after AKI in
patients with preexisting chronic kidney disease may offer substantial benefits in reducing the subsequent progression of renal disease.
Summary
This study examined the potential contribution of self-perpetuating TIF versus hemodynamically mediated, glomerulosclerosis-induced TIF in the progression of chronic kidney disease after AKI in unine-phrectomized rats. Although TIF was significantly lower at 16 ver-sus 4 weeks post AKI, glomerulosclerosis was significantly greater, and a modest BP threshold (average systolic BP≈127 mm Hg) for the development of such glomerulosclerosis was observed. These data indicate that modest BP elevations, as opposed to self-perpet-uating TIF, may be largely responsible for the development of de novo TIF during the progression of chronic kidney disease after AKI in rats with preexisting 50% renal mass reduction.
Novelty and Significance by guest on May 28, 2018
http://hyper.ahajournals.org/D
ownloaded from

Maria Picken, Jianrui Long, Geoffrey A. Williamson and Aaron J. PolichnowskiSelf-Perpetuating Versus Hemodynamic-Induced Fibrosis
Progression of Chronic Kidney Disease After Acute Kidney Injury: Role of
Print ISSN: 0194-911X. Online ISSN: 1524-4563 Copyright © 2016 American Heart Association, Inc. All rights reserved.
is published by the American Heart Association, 7272 Greenville Avenue, Dallas, TX 75231Hypertension doi: 10.1161/HYPERTENSIONAHA.116.077492016;68:921-928; originally published online August 22, 2016;Hypertension.
http://hyper.ahajournals.org/content/68/4/921World Wide Web at:
The online version of this article, along with updated information and services, is located on the
http://hyper.ahajournals.org/content/suppl/2016/08/22/HYPERTENSIONAHA.116.07749.DC1Data Supplement (unedited) at:
http://hyper.ahajournals.org//subscriptions/
is online at: Hypertension Information about subscribing to Subscriptions:
http://www.lww.com/reprints Information about reprints can be found online at: Reprints:
document. Permissions and Rights Question and Answer this process is available in the
click Request Permissions in the middle column of the Web page under Services. Further information aboutOffice. Once the online version of the published article for which permission is being requested is located,
can be obtained via RightsLink, a service of the Copyright Clearance Center, not the EditorialHypertensionin Requests for permissions to reproduce figures, tables, or portions of articles originally publishedPermissions:
by guest on May 28, 2018
http://hyper.ahajournals.org/D
ownloaded from

ONLINE DATA SUPPLEMENT
Progression of Chronic Kidney Disease Following Acute Kidney Injury:
Role of Self-perpetuating vs. Hemodynamic-induced Fibrosis
Maria Picken3,
Jianrui Long4,
Geoffrey A. Williamson4,
Aaron J. Polichnowski1,2
Edward Hines Jr. VA Hospital
Hines, IL1
Department of Medicine, Loyola University - Chicago
Maywood, IL2
Department of Pathology, Loyola University - Chicago
Maywood, IL3
Dept. of Electrical and Computer Engineering, Illinois Institute of Technology
Chicago, IL4
Running Title: Progression of CKD Following AKI
Keywords: hypertension, acute kidney injury, chronic kidney disease, ischemia-reperfusion,
autoregulation, glomerular filtration rate, tubulointerstitial fibrosis
Manuscript Word Count: 6,941
Abstract Word Count: 240
Number of Figures: 5
Correspondence:
Aaron J. Polichnowski, Ph.D.
5000 S. 5th Avenue
Hines, IL 60143
Phone: 708-202-4120
Fax: 708-202-7978
E-mail: [email protected]

Surgical Procedures and Methods
Penicillin (40,000 IU) was administered (i.m.) prior to all surgical procedures. Following all
surgical procedures, rats were administered (s.c.) buprenorphine (0.1 mg/kg) immediately
following surgery and on day one post-op and acetaminophen (~200 mg/kg/day) was
continuously provided via the drinking water for 3 days post-op for analgesia. All rats were
euthanized with inactin (100 mg/kg IP).
Implantation of BP radiotelemeter + uninphrectomy (UNX): At 9 weeks of age, all rats were
subjected to a right UNX and instrumented with a BP radiotelemeter (PA-C40, Data Sciences
International, St. Paul, MN) under isoflurane anesthesia (2.5% in 100% oxygen) as described
previously 1. BP was measured every 10 min, for 10 sec., 24 hr/day throughout the entire
protocol. The average BP over 11-14 days post UNX was used as baseline.
Renal IR injury: Rats were anesthetized with sodium pentobarbital (50 mg/kg IP) and subjected
to a 40 min. renal IR injury via a clamp placed on the left renal pedicle as described previously 1.
Core body temperature was maintained at 37° C throughout the entire IR protocol using a servo-
controlled heated surgical table. Rats subjected to sham IR underwent identical surgical
procedures except that the clamp was never placed on the renal pedicle.
Assessment of renal hemodynamics in conscious rats: At 3 weeks post IR or sham IR, rats were
anesthetized with isoflurane and chronically instrumented with a renal blood flow (RBF)
transducer (1RB, Transonic Systems, Ithaca, New York) and an osmotic minipump (2ML2,
Durect, Cupertino, CA) containing 20 mg/ml FITC-inulin (Sigma-Aldrich, St. Louis, MO) to
measure RBF and glomerular filtration rate (GFR) in the conscious state as described previously 2,3. Renal vascular resistance (RVR) was calculated as mean arterial pressure [(MAP) / RBF],
renal plasma flow (RPF) was calculated as [RBF x (1-Hct)], filtration fraction (FF) was
calculated as [(GFR/RPF) x 100].
Assessment of RBF autoregulation in anesthetized rats: The same rats used to assess renal
hemodynamics in the conscious state were used to assess RBF autoregulation under anesthesia.
Following measurements in the conscious state, rats were anesthetized with isoflurane and
prepared for steady-state step RBF autoregulation studies as described previously 3-6. Briefly, a
carotid and femoral artery were cannulated with PE-50 tubing filled with saline for continuous
recording of BP. A femoral vein was cannulated with PE-50 tubing for the continuous
administration of 2% BSA in saline to replace fluid loss during surgery. Aortic occluders were
positioned above and below the left renal artery to lower or raise renal perfusion pressure.
During surgery, 2% BSA was infused at 1 ml/h per 100g body weight and lowered to 0.5 ml/h
per 100g body weight during the subsequent 60 minute equilibration period and steady-state step
autoregulation assessment. Three steady-state BP and corresponding RBF steps were obtained in
each rat using the aortic occluders to lower and raise renal perfusion pressure. BP was first
raised to the highest step and then followed by step reductions in BP. After the RBF was
measured at the lowest step BP, BP was then raised in a stepwise manner so that the RBF
responses at each step were obtained in both directions. RBF was allowed to stabilize for 1
minute at each BP step before measurements were made. The RBF responses at each step were
averaged for each rat. Autoregulatory indices were calculated as the fractional change in
RBF/fractional change MAP 3-6.

Measurement of Proteinuria and Serum Creatinine
Proteinuria (spectrophotometrically using sulfosalicylic acid assay) was determined from 24-
hour urine collections while rats were in metabolic cages. SCr (QuantiChrom Creatinine Assay
Kit, BioAssay Systems, Hayward, CA), respectively.
Assessment of Renal Injury
Renal injury was assessed in a blinded fashion from 4-µm-thick sections stained with periodic
acid-Schiff 3,5,7. Glomerular injury was quantified as the total percentage of glomeruli (at least
100 per section) exhibiting lesions of segmental or global GS and/or ischemic GS. TIF was
assessed on a scale of 0-4 with 0=no TIF and 4=75-100% of the section exhibiting TIF.
Vascular injury was assessed as the number of vessels exhibiting acute disruptive injury (lesions
of necrosis, thrombosis, aneurysmal dilatation, and/or onion skinning) per 100 glomeruli.

REFERENCES
1. Polichnowski AJ, Lan R, Geng H, Griffin KA, Venkatachalam MA, Bidani AK. Severe
renal mass reduction impairs recovery and promotes fibrosis after aki. J Am Soc Nephrol.
2014;25:1496-1507.
2. Polichnowski AJ, Griffin KA, Long J, Williamson GA, Bidani AK. Blood pressure-renal
blood flow relationships in conscious angiotensin ii- and phenylephrine-infused rats. Am
J Physiol Renal Physiol. 2013;305:F1074-1084.
3. Polichnowski AJ, Licea-Vargas H, Picken M, Long J, Bisla R, Williamson GA, Bidani
AK, Griffin KA. Glomerulosclerosis in the diet-induced obesity model correlates with
sensitivity to nitric oxide inhibition but not glomerular hyperfiltration or hypertrophy. Am
J Physiol Renal Physiol. 2015;309:F791-799.
4. Bidani AK, Hacioglu R, Abu-Amarah I, Williamson GA, Loutzenhiser R, Griffin KA.
"Step" vs. "Dynamic" autoregulation: Implications for susceptibility to hypertensive
injury. Am J Physiol Renal Physiol. 2003;285:F113-120.
5. Griffin K, Polichnowski A, Licea-Vargas H, Picken M, Long J, Williamson G, Bidani A.
Large bp-dependent and -independent differences in susceptibility to nephropathy after
nitric oxide inhibition in sprague-dawley rats from two major suppliers. Am J Physiol
Renal Physiol. 2012;302:F173-182.
6. Griffin KA, Picken M, Bidani AK. Method of renal mass reduction is a critical modulator
of subsequent hypertension and glomerular injury. J Am Soc Nephrol. 1994;4:2023-2031.
7. Polichnowski AJ, Griffin KA, Picken MM, Licea-Vargas H, Long J, Williamson GA,
Bidani AK. Hemodynamic basis for the limited renal injury in rats with angiotensin ii-
induced hypertension. Am J Physiol Renal Physiol. 2015;308:F252-260.

Figure S1. Time course of SCr changes in uninephrectomized rats followed for 4 weeks or
16 weeks post ischemia-reperfusion (IR) or sham IR. A similar increase in SCr at 48 hours
post IR and its recovery at 4 weeks post IR was observed in rats followed for A) 4 and B) 16
weeks. A similar increase and variation in 48 hour post IR SCr value between rats followed for 4
and 16 weeks is also shown in C. These data demonstrate that the severity of and recovery from
IR-induced acute kidney injury was similar in the two groups of rats studied at 4 and 16 weeks
post IR. * P < 0.05 vs. respective sham IR group at similar time point.

Figure S2. Relationships among Proteinuria, BP and Renal Injury 16 Weeks Post
Ischemia-reperfusion (IR) or Sham IR. Statistically significant correlations were observed
between A) average 16-week systolic BP and proteinuria, B) glomerulosclerosis and proteinuria
and C) tubulointerstitial fibrosis (TIF) and proteinuria at 16 weeks post IR or sham IR. These
data strongly support the notion that hemodynamic factors (i.e., elevated BP and its transmission
to the glomerular capillaries) were playing a major role in the progression of renal disease
following acute kidney injury in uninephrectomized rats.

Figure S3. Relationships Between Renal Mass and Injury at 16 Weeks Post Ischemia-
reperfusion (IR) or Sham IR. Statistically significant correlations were observed between A)
kidney weight and glomerulosclerosis and between B) kidney weight and tubulointerstitial
fibrosis (TIF) at 16 weeks post IR or sham IR. These data reinforce the concept that
hemodynamic factors (BP and its transmission to the renal microvasculature likely due to
preglomerular vasodilation and impaired autoregulation) were playing a major role in the
progression of renal disease following acute kidney injury in uninephrectomized rats.

Figure S4. Relationship between SCr 48 hours post ischemia-reperfusion (IR) or sham IR
and the development of renal injury 16 weeks later. Statistically significant, but more
modest, correlations were observed between the severity of renal IR injury (SCr at 48 hours post
IR) and the development of A) glomerulosclerosis and B) tubulointerstitial fibrosis (TIF) 16
weeks later in uninephrectomized rats subjected to IR or sham IR. Unlike the clear BP threshold
that was observed for the development of GS and TIF (Fig. 4 of manuscript), a threshold
between SCr 48 hours post IR, an index of the severity of IR injury, and GS and TIF 16 weeks
later was not observed. These data indicate that the severity of acute kidney injury was not a
major determinant of the subsequent progression of renal disease following IR.

Figure S5. Relationship between SCr 48 hours post ischemia-reperfusion (IR) or sham IR
and tubulointerstitial fibrosis (TIF) 4 weeks later. A very robust and significant correlation
was observed between the severity of renal IR injury (SCr at 48 hours post IR) and the
development of TIF 4 weeks later in uninephrectomized rats subjected to IR or sham IR. These
data support the well-known effects of AKI severity as a determinant of the magnitude of the
AKI – CKD transition. However, the strong correlation observed between AKI severity and TIF
at 4 weeks post IR (i.e., AKI – CKD progression) was not observed at 16 weeks post IR during
the progression of CKD (Suppl. Fig. 4) suggesting that different pathophysiological mechanisms
were contributing to TIF at these two time points.