Progress towards targets for air pollutant emissions · PDF fileProgress towards targets for...
28
Technical Report No. Progress towards targets for air pollutant emissions Assessing national programmes and projections reported under the National Emission Ceilings Directive Prepared by: Claire Handley, Peter Taylor European Topic Centre on Air and Climate Change With input from: Dora Petroula, Rob Swart Bernd, Gugele, Kati Huttunen and Bernd Strobel Project manager: Andreas Barkman European Environment Agency
-
Upload
nguyenminh -
Category
Documents
-
view
217 -
download
0
Transcript of Progress towards targets for air pollutant emissions · PDF fileProgress towards targets for...
Technical Report No.
Progress towards targets for air pollutant emissions
Assessing national programmes and
projections reported under the National Emission Ceilings Directive
Prepared by: Claire Handley, Peter Taylor
European Topic Centre on Air and Climate Change
With input from: Dora Petroula, Rob Swart Bernd, Gugele,
Kati Huttunen and Bernd Strobel
Project manager: Andreas Barkman
European Environment Agency

CONTENTS
1 INTRODUCTION................................................................................................1
2 REPORTING BY MEMBER STATES UNDER THE NECD........................2
2.1 Quality of Member State reporting............................................................2 2.2 Gaps in reporting and recommendations for improvement.......................4
3 PROGRESS TOWARDS CEILINGS................................................................6
3.1 Current Progress .......................................................................................6 3.2 Projected progress .....................................................................................9 3.3 Socio-economic assumptions and projection methodologies ..................10 3.4 Policies and measures..............................................................................15
4 CONCLUSIONS ON MEMBER STATE PROGRESS .................................21
ANNEX 1 ....................................................................................................................23
Recommended parameters and assumptions under the EU Greenhouse Gas Monitoring Mechanism (to consider as an example to harmonise aspects of the reporting of 'National Programmes' under the NECD).......................................23
ANNEX II MEMBER STATE ANALYSES ...........................................................25
1 Introduction
This paper presents an assessment of progress by Member States towards the emissions ceilings contained in the National Emission Ceilings Directive (NECD), 2001/81/EC. Progress has been evaluated based on the reports of National Programmes and projections submitted by Member States as required by Articles 6, 7 and 8 of the Directive. The paper is divided into two parts: • quality of reporting; • evaluation of current trends, projections and policies and measures. The section on quality of reporting assesses the standard of reporting and the extent to which Member States have provided the information required by the Directive and other data that would be useful for evaluation purposes. Recommendations are made for future improvements to reporting. This information is then used to assess the current and projected progress of Member States and the EU as a whole towards the emission ceilings for SO2, NOx VOC and NH3. The analysis covers: • assessment of current progress through the use of a 'distance to target' indicator; • assessment of projected progress through a comparison of projections with emission
ceilings in 2010; • information on socio-economic assumptions underlying the projections; • qualitative and quantitative evaluation of policies and measures. Finally, conclusions are presented on the progress of Member States towards meeting the objectives of the National Emission Ceilings Directive. This assessment was prepared on request of the European Commission, DG Environment.
1
2 Reporting by Member States under the NECD
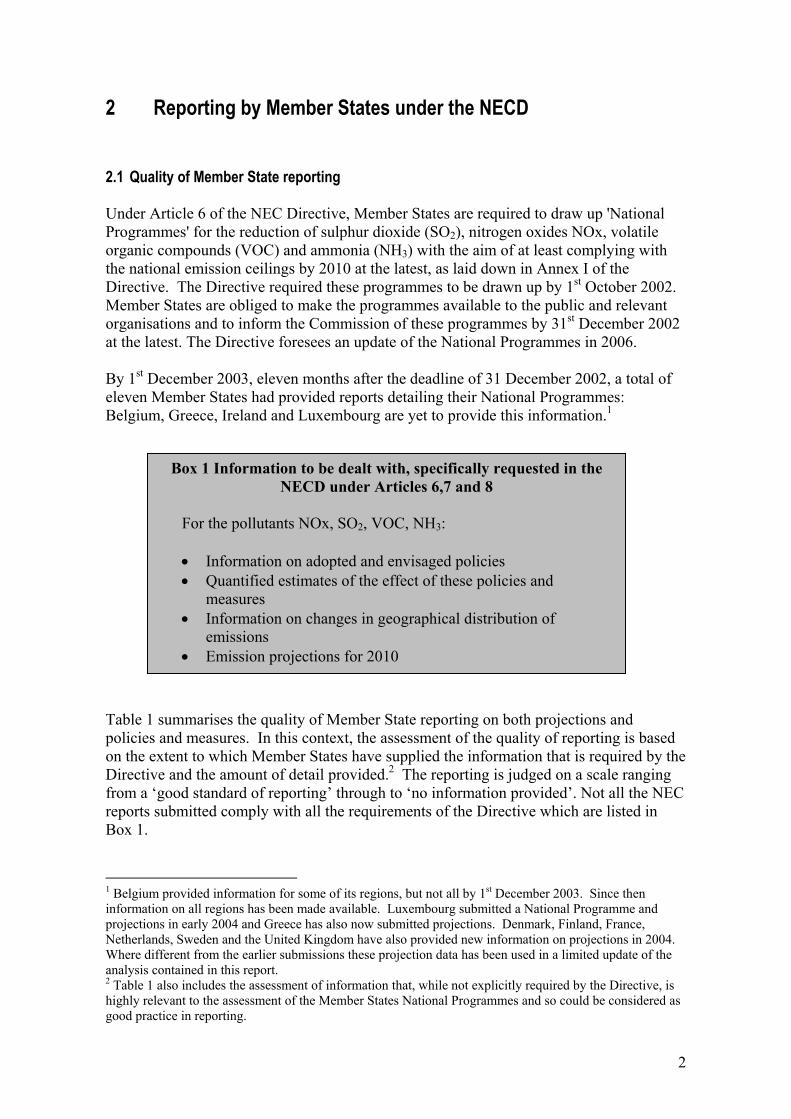
2.1 Quality of Member State reporting Under Article 6 of the NEC Directive, Member States are required to draw up 'National Programmes' for the reduction of sulphur dioxide (SO2), nitrogen oxides NOx, volatile organic compounds (VOC) and ammonia (NH3) with the aim of at least complying with the national emission ceilings by 2010 at the latest, as laid down in Annex I of the Directive. The Directive required these programmes to be drawn up by 1st October 2002. Member States are obliged to make the programmes available to the public and relevant organisations and to inform the Commission of these programmes by 31st December 2002 at the latest. The Directive foresees an update of the National Programmes in 2006. By 1st December 2003, eleven months after the deadline of 31 December 2002, a total of eleven Member States had provided reports detailing their National Programmes: Belgium, Greece, Ireland and Luxembourg are yet to provide this information.1
Table 1 spolicies aon the exDirectivefrom a ‘greports suBox 1.
1 Belgium informatioprojectionsNetherlandWhere diffanalysis co2 Table 1 ahighly relegood pract
Box 1 Information to be dealt with, specifically requested in the NECD under Articles 6,7 and 8
For the pollutants NOx, SO2, VOC, NH3:
• Information on adopted and envisaged policies • Quantified estimates of the effect of these policies and
measures • Information on changes in geographical distribution of
emissions • Emission projections for 2010
ummarises the quality of Member State reporting on both projections and nd measures. In this context, the assessment of the quality of reporting is based tent to which Member States have supplied the information that is required by the and the amount of detail provided.2 The reporting is judged on a scale ranging ood standard of reporting’ through to ‘no information provided’. Not all the NEC bmitted comply with all the requirements of the Directive which are listed in
provided information for some of its regions, but not all by 1st December 2003. Since then n on all regions has been made available. Luxembourg submitted a National Programme and in early 2004 and Greece has also now submitted projections. Denmark, Finland, France, s, Sweden and the United Kingdom have also provided new information on projections in 2004. erent from the earlier submissions these projection data has been used in a limited update of the ntained in this report. lso includes the assessment of information that, while not explicitly required by the Directive, is vant to the assessment of the Member States National Programmes and so could be considered as ice in reporting.
2
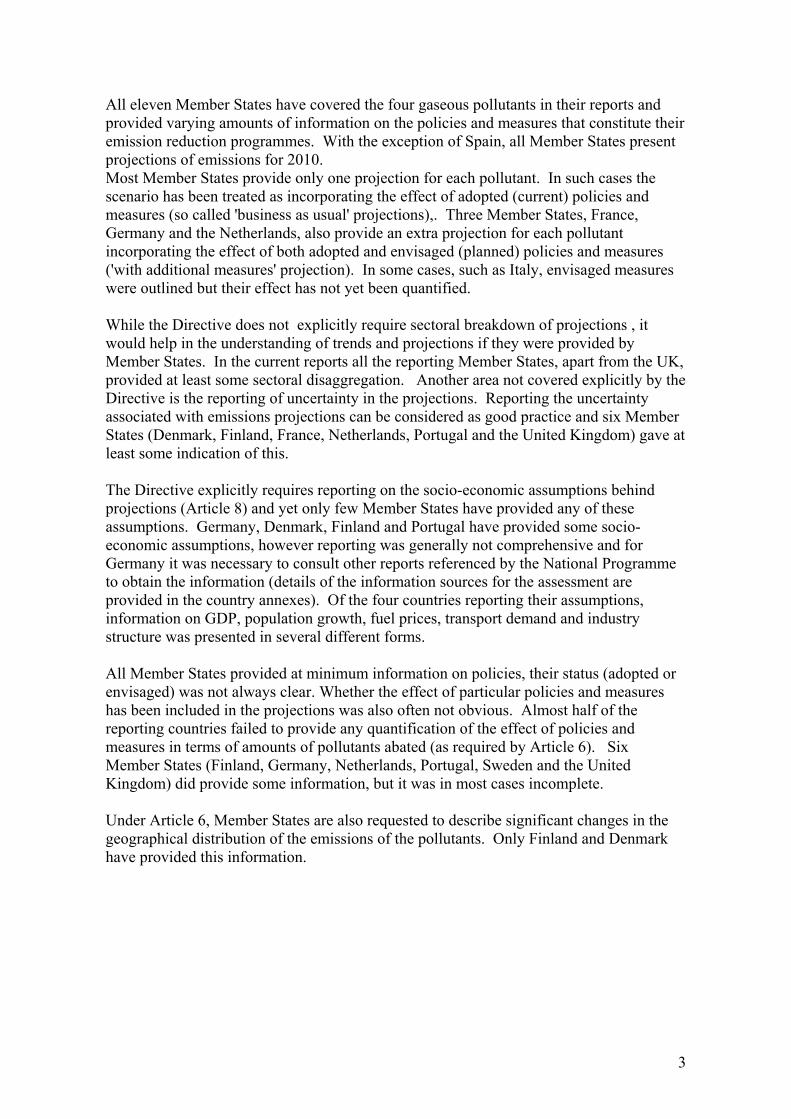
All eleven Member States have covered the four gaseous pollutants in their reports and provided varying amounts of information on the policies and measures that constitute their emission reduction programmes. With the exception of Spain, all Member States present projections of emissions for 2010. Most Member States provide only one projection for each pollutant. In such cases the scenario has been treated as incorporating the effect of adopted (current) policies and measures (so called 'business as usual' projections),. Three Member States, France, Germany and the Netherlands, also provide an extra projection for each pollutant incorporating the effect of both adopted and envisaged (planned) policies and measures ('with additional measures' projection). In some cases, such as Italy, envisaged measures were outlined but their effect has not yet been quantified. While the Directive does not explicitly require sectoral breakdown of projections , it would help in the understanding of trends and projections if they were provided by Member States. In the current reports all the reporting Member States, apart from the UK, provided at least some sectoral disaggregation. Another area not covered explicitly by the Directive is the reporting of uncertainty in the projections. Reporting the uncertainty associated with emissions projections can be considered as good practice and six Member States (Denmark, Finland, France, Netherlands, Portugal and the United Kingdom) gave at least some indication of this. The Directive explicitly requires reporting on the socio-economic assumptions behind projections (Article 8) and yet only few Member States have provided any of these assumptions. Germany, Denmark, Finland and Portugal have provided some socio-economic assumptions, however reporting was generally not comprehensive and for Germany it was necessary to consult other reports referenced by the National Programme to obtain the information (details of the information sources for the assessment are provided in the country annexes). Of the four countries reporting their assumptions, information on GDP, population growth, fuel prices, transport demand and industry structure was presented in several different forms. All Member States provided at minimum information on policies, their status (adopted or envisaged) was not always clear. Whether the effect of particular policies and measures has been included in the projections was also often not obvious. Almost half of the reporting countries failed to provide any quantification of the effect of policies and measures in terms of amounts of pollutants abated (as required by Article 6). Six Member States (Finland, Germany, Netherlands, Portugal, Sweden and the United Kingdom) did provide some information, but it was in most cases incomplete. Under Article 6, Member States are also requested to describe significant changes in the geographical distribution of the emissions of the pollutants. Only Finland and Denmark have provided this information.
3
Table 1 Relative quality of Member States reporting on projections and policies and measures
Information provided on projections Information provided on policies and measures
Pollu
tant
s cov
ered
Scen
ario
s pre
sent
ed
Split
of p
roje
ctio
ns b
y se
ctor
*
Pres
enta
tion
of re
sults
* C
hang
es o
f em
issi
ons i
n ge
ogra
phic
al d
istri
butio
n
Soci
o-ec
onom
ic a
ssum
ptio
ns
Dis
cuss
ion
of u
ncer
tain
ty*
Nam
e of
pol
icy
Obj
ectiv
es o
f pol
icie
s *
Whi
ch p
ollu
tant
s are
aff
ecte
d?
Stat
us o
f Im
plem
enta
tion
Im
plem
enta
tion
body
sp
ecifi
ed*
Qua
ntita
tive
asse
ssm
ent o
f ef
fect
In
tera
ctio
n w
ith o
ther
pol
icie
s an
d m
easu
res d
iscu
ssed
*
Austria +++ + + + o o o +++ + +++ +++ + o + Belgium Denmark +++ ++ +++ +++ + + + +++ ++ +++ ++ + o o Finland +++ ++ ++ + +++ + ++ +++ +++ +++ +++ ++ + ++ France +++ ++ +++ ++ o o +++ + ++ ++ ++ + o + Germany +++ + ++ ++ o + o ++ + ++(+) + o + o Greece Ireland Italy +++ + +++ ++ o o o ++ ++ + + + o + Luxembourg Netherlands +++ ++ ++ +++ o o ++ +++ +++ ++ + ++ +++ + Portugal +++ + +++ + o ++ + ++ + +++ + o ++ o Spain +++ + + + o o o ++ + ++ + o o o Sweden +++ + +++ + o o o + ++ +++ + + + ++ United Kingdom +++ ++ o + o o ++ +++ +++ ++ ++ ++ + + *Denotes information that while not explicitly requested by the Directive could be considered as good practice in reporting +++ Good quality of reporting ++ Fair quality of reporting
+ Some information provided o No information provided The relative quality of reporting in table 1 is based on a qualitative judgement; more information about the content of each National Programme - the quality of projections, policies and measures - can be found in individual annexes for each Member State (see annex 2). Due the nature of reporting and the variation in information presentation in the National Programmes, it is not possible to carry out a quantitative assessment. 2.2 Gaps in reporting and recommendations for improvement Considering the National programmes and projections of the eleven Member States that have reported so far, the most significant gaps in reporting are:
• Emissions projections incorporating envisaged policies and measures; • Consistent sectoral disaggregation of projections (not obligatory); • Discussion of the uncertainty associated with the projections (not obligatory); • Information on the socio-economic assumptions behind the projections; • Information on the status of policies and measures;
4
• Quantification of the effect of policies and measures; • Information or comment on the changes in geographical distribution of pollutant
emissions. The gaps in reporting, listed above, highlight the need for a more structured reporting process. The areas where improvements are recommended are outlined below. Recommendations following the requirements in the Directive: Member States should report two scenarios – a 'business as usual' projection including
current policies and measures3 and also a 'with additional measures' projection, accounting for planned policies and measures. If there are no additional or planned policies or measures then this should be clearly stated. Quantification of the effect of individual planned, adopted and implemented policies
and measures would improve reporting standards and allow the most important policies and measures to be identified. At least the aggregated effect of groups of policies must be estimated. Member States need to report on changes in geographical distribution of national
emissions or, if there is no change, then make this clear – this is specifically requested in the NECD. Key socio-economic assumptions and model parameters must be given in the
programme reports. Recommendations on the type of assumptions that should be reported may help and this is discussed below. Good practice would also include (optional): Projections should be disaggregated to show the trends in key sectors, where possible
such disaggregation should be consistent with that used in the emission inventories. A short discussion on the uncertainty in emission projections would be helpful in
understanding the confidence that can be attached to the results and so the likelihood of the emissions ceiling being achieved. Listing the implementing body for each policy and the type of policy instrument is
helpful in understanding the way in which Member States are implementing policies and measures to meet the emission ceilings. In March 2003, the EEA produced a paper on ‘Recommendations for reporting of key parameters underlying projections’ as part of its work supporting the European Commission’s Monitoring Mechanism for CO2 and other greenhouse gases. The paper recommends the types of information that should be provided under the Monitoring Mechanism for CO2 and other greenhouse gases. Such guidelines may also be appropriate for reporting under the NECD and the main findings, taken directly from this paper, are attached as annex 1.
3 Sometimes also known as a 'with measures' projection.
5
3 Progress towards ceilings
3.1 Current Progress This section evaluates the current progress of Member States towards meeting their emissions ceilings, through the use of a 'distance-to-target' indicator. Figures 1 to 4 present the distance to target indicator for each of the pollutants covered by the NECD. The distance-to-target indicator (DTI) is a measure for the deviation of actual emissions in 2001 from the (hypothetical) linear path between 1990 and 2010 (i.e. the target date for the EU National Emissions Ceiling Directive). Since the assumption of a linear emission trend is somewhat hypothetical this analysis has only an indicative character. The distance-to-target indicators are presented for each country, in order to evaluate their progress towards meeting their national targets. The distance to target assessment consists of four steps:
1) Plotting the index of actual performance (i.e. 1990 to 2001 index of pollutant emissions) against the index of the NECD target path (hypothetical linear line between 1990 and 2010), 1990=100.
2) Calculating the interpolated, value on the target path in 2001. 3) Calculating the deviation of the emission index value in 2001 from the value on
the target path. 4) Awarding ‘smileys’ according to the achievements with the following ratings: ☺ Positive contribution to trend: the negative distance-to-target indicator means that the country is below its linear target path
Negative contribution to EU trend: the positive distance-to-target indicator means that the country is above its linear target path.
Based on these assumptions, in 2001, 11 Member States were heading towards emissions above their emission ceilings for NOx. Based on the linear target path, only Germany, the UK, Italy and Finland are on track to comply with the NECD for this pollutant. As a result the EU as a whole is significantly above its linear target path to meet the emissions ceiling for NOx. Progress on SO2 abatement is more encouraging, with 12 Member States doing significantly better than their linear target paths for meeting the emission ceilings in 2010. Only Portugal, Ireland and Spain are above the target paths. Consequently, the EU as a whole is also on track to meet its emission ceiling for SO2 in 2010. For VOCs emissions, 6 Member States (Spain, Ireland, Portugal, Italy, Luxembourg and Denmark) are falling behind the linear target path to their NECD ceilings and the EU is also very slightly above its linear target path. For NH3 emissions, 6 Member States (Portugal, Spain, Belgium, Ireland, Greece and Denmark) are above their linear target path to their NECD ceilings and the EU is also above its linear target path.
6
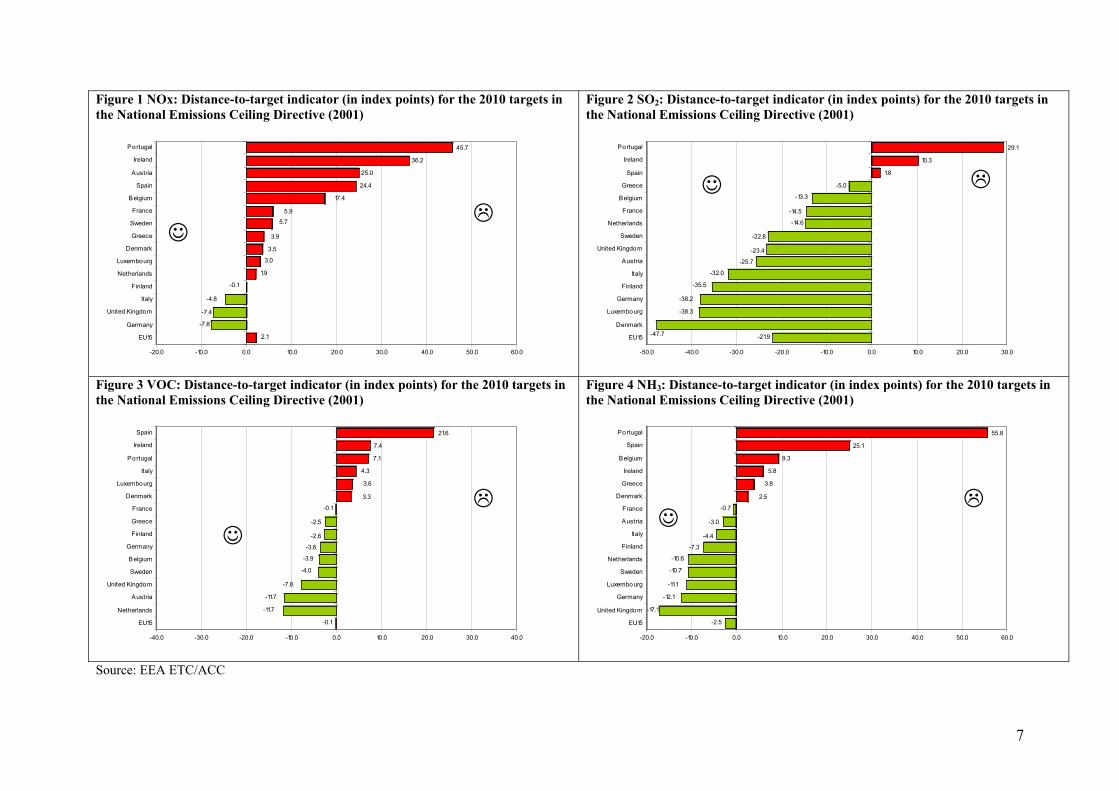
Figure 1 NOx: Distance-to-target indicator (in index points) for the 2010 targets in the National Emissions Ceiling Directive (2001)
2.1
-7.8
-7.4
-4.8
-0.1
1.9
3.0
3.5
3.9
5.7
5.9
17.4
24.4
25.0
36.2
45.7
-20.0 -10.0 0.0 10.0 20.0 30.0 40.0 50.0 60.0
EU15
Germany
United Kingdom
Italy
Finland
Netherlands
Luxembourg
Denmark
Greece
Sweden
France
Belgium
Spain
Austria
Ireland
Portugal
☺
Figure 2 SO2: Distance-to-target indicator (in index points) for the 2010 targets in the National Emissions Ceiling Directive (2001)
-21.9-47.7
-38.3
-38.2
-35.5
-32.0
-25.7
-23.4
-22.8
-14.6
-14.5
-13.3
-5.0
1.8
10.3
29.1
-50.0 -40.0 -30.0 -20.0 -10.0 0.0 10.0 20.0 30.0
EU15
Denmark
Luxembourg
Germany
Finland
Italy
Austria
United Kingdom
Sweden
Netherlands
France
Belgium
Greece
Spain
Ireland
Portugal
☺
Figure 3 VOC: Distance-to-target indicator (in index points) for the 2010 targets in the National Emissions Ceiling Directive (2001)
-0.1
-11.7
-11.7
-7.8
-4.0
-3.9
-3.6
-2.6
-2.5
-0.1
3.3
3.6
4.3
7.1
7.4
21.6
-40.0 -30.0 -20.0 -10.0 0.0 10.0 20.0 30.0 40.0
EU15
Netherlands
Austria
United Kingdom
Sweden
Belgium
Germany
Finland
Greece
France
Denmark
Luxembourg
Italy
Portugal
Ireland
Spain
☺
Figure 4 NH3: Distance-to-target indicator (in index points) for the 2010 targets in the National Emissions Ceiling Directive (2001)
-2.5
-17.1
-12.1
-11.1
-10.7
-10.6
-7.3
-4.4
-3.0
-0.7
2.5
3.8
5.8
9.3
25.1
55.8
-20.0 -10.0 0.0 10.0 20.0 30.0 40.0 50.0 60.0
EU15
United Kingdom
Germany
Luxembourg
Sweden
Netherlands
Finland
Italy
Austria
France
Denmark
Greece
Ireland
Belgium
Spain
Portugal
☺
Source: EEA ETC/ACC
7

3.2 Projected progress Comparison of projections and emission ceilings for 2010 Table 2 summarises the projections and emissions ceilings for 2010 for each of the pollutants covered by the NECD. Where only one scenario has been submitted this has been used as the 'business as usual' scenarios, including adopted (current) policies and measures,. The effects of envisaged polices and measures are not included in these ‘business as usual’ projections. The table also shows the difference between the projection and emissions ceilings in 2010 and highlights where the ceilings are exceeded. Based on the 'business as usual' projections reported by Member States, only Finland and the United Kingdom will comply with all of their emission ceilings in 2010. It should be noted that the UK emission projections are identical to their ceilings for 2010. For Finland the emission ceilings are only just met and so only small increases in the projected emissions from either country would change this result. The Netherlands is projected to fall short of all its emission ceilings and so is Portugal if their high projection scenario is considered. Table 3 summarises the 'with additional measures' projections provided by the Netherlands, Germany and France. Only these three Member States have quantified the effect of envisaged policies within a 'with additional measures' projection and the resultant additional savings brings them in line with more of their emissions ceilings. Only the Netherlands falls short of the target under the additional measures projection, exceeding the NOx ceiling by 4%. France has an additional measures projection solely for SO2: the envisaged measures bring emissions to 4% below the SO2 ceiling. Germany is compliant with all four ceilings under this projection scenario. Aggregating the projections and ceilings for the ten Member States that have reported emissions gives results for an EU10 group of countries. Table 1 shows that on the basis of the 'business-as-usual' projection the EU10 will not meet the ceilings for any of the pollutants. The most significant gap is for NOx (8 %), with the other pollutants having less serious exceedances; SO2 (2.7%), VOC (2.9%), Ammonia (2.9%). Of the four gases, the Member State projections for NOx emissions show the most significant exceedances compared to the ceilings. Only two Member States are predicted to meet or come under the level of the ceiling (Finland and UK) with 'business as usual' measures. Based on two reported projections, Portugal is likely to exceed the emission ceiling. Emission projections for Austria show a 46% gap in 2010 and emissions from France, Denmark and the Netherlands will have a gap of over 10%. Germany’s saving of 111kt from additional measures is large enough to cover the shortfall reported for the ‘business as usual’ and brings the projection within the ceiling. For SO2, nearly two thirds of the reporting Member States are projected to meet or go below their SO2 emission ceilings, based on the impact of adopted policies. The Netherlands and France also meet their ceilings if their additional measures are taken into account. This would leave only Portugal and Denmark exceeding the emission ceiling by 3-6% and 2% respectively.
9
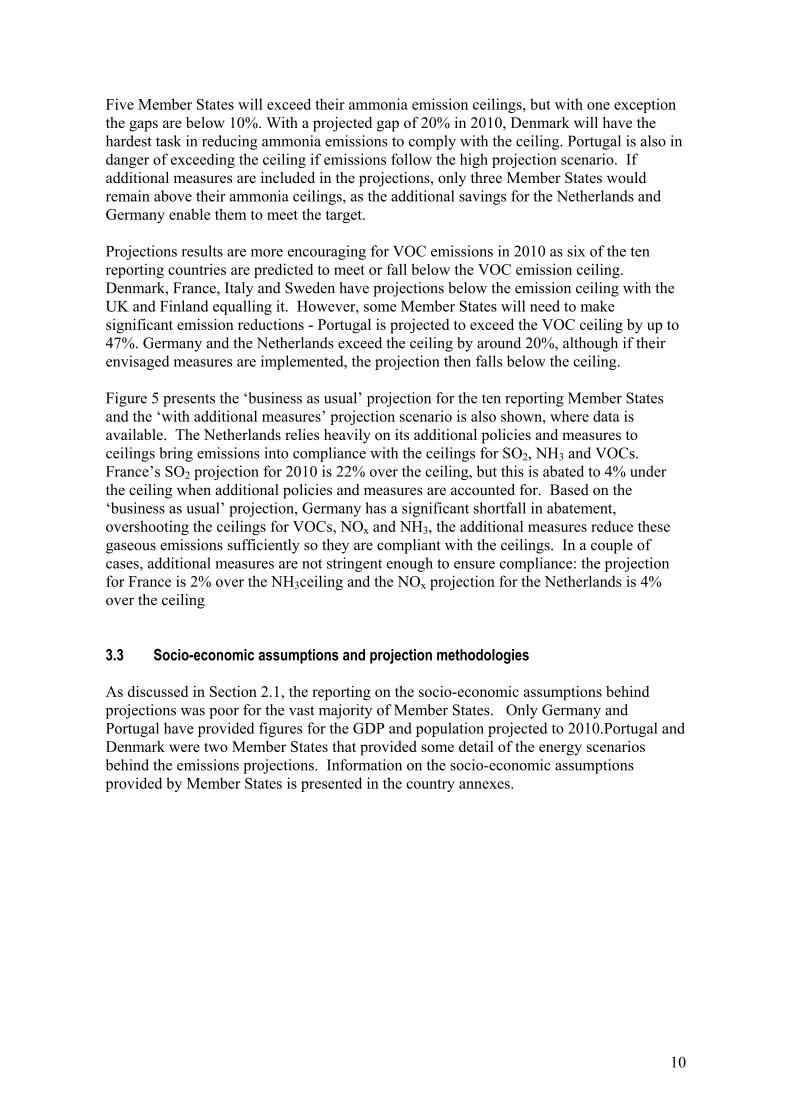
Five Member States will exceed their ammonia emission ceilings, but with one exception the gaps are below 10%. With a projected gap of 20% in 2010, Denmark will have the hardest task in reducing ammonia emissions to comply with the ceiling. Portugal is also in danger of exceeding the ceiling if emissions follow the high projection scenario. If additional measures are included in the projections, only three Member States would remain above their ammonia ceilings, as the additional savings for the Netherlands and Germany enable them to meet the target. Projections results are more encouraging for VOC emissions in 2010 as six of the ten reporting countries are predicted to meet or fall below the VOC emission ceiling. Denmark, France, Italy and Sweden have projections below the emission ceiling with the UK and Finland equalling it. However, some Member States will need to make significant emission reductions - Portugal is projected to exceed the VOC ceiling by up to 47%. Germany and the Netherlands exceed the ceiling by around 20%, although if their envisaged measures are implemented, the projection then falls below the ceiling. Figure 5 presents the ‘business as usual’ projection for the ten reporting Member States and the ‘with additional measures’ projection scenario is also shown, where data is available. The Netherlands relies heavily on its additional policies and measures to ceilings bring emissions into compliance with the ceilings for SO2, NH3 and VOCs. France’s SO2 projection for 2010 is 22% over the ceiling, but this is abated to 4% under the ceiling when additional policies and measures are accounted for. Based on the ‘business as usual’ projection, Germany has a significant shortfall in abatement, overshooting the ceilings for VOCs, NOx and NH3, the additional measures reduce these gaseous emissions sufficiently so they are compliant with the ceilings. In a couple of cases, additional measures are not stringent enough to ensure compliance: the projection for France is 2% over the NH3ceiling and the NOx projection for the Netherlands is 4% over the ceiling 3.3 Socio-economic assumptions and projection methodologies As discussed in Section 2.1, the reporting on the socio-economic assumptions behind projections was poor for the vast majority of Member States. Only Germany and Portugal have provided figures for the GDP and population projected to 2010.Portugal and Denmark were two Member States that provided some detail of the energy scenarios behind the emissions projections. Information on the socio-economic assumptions provided by Member States is presented in the country annexes.
10
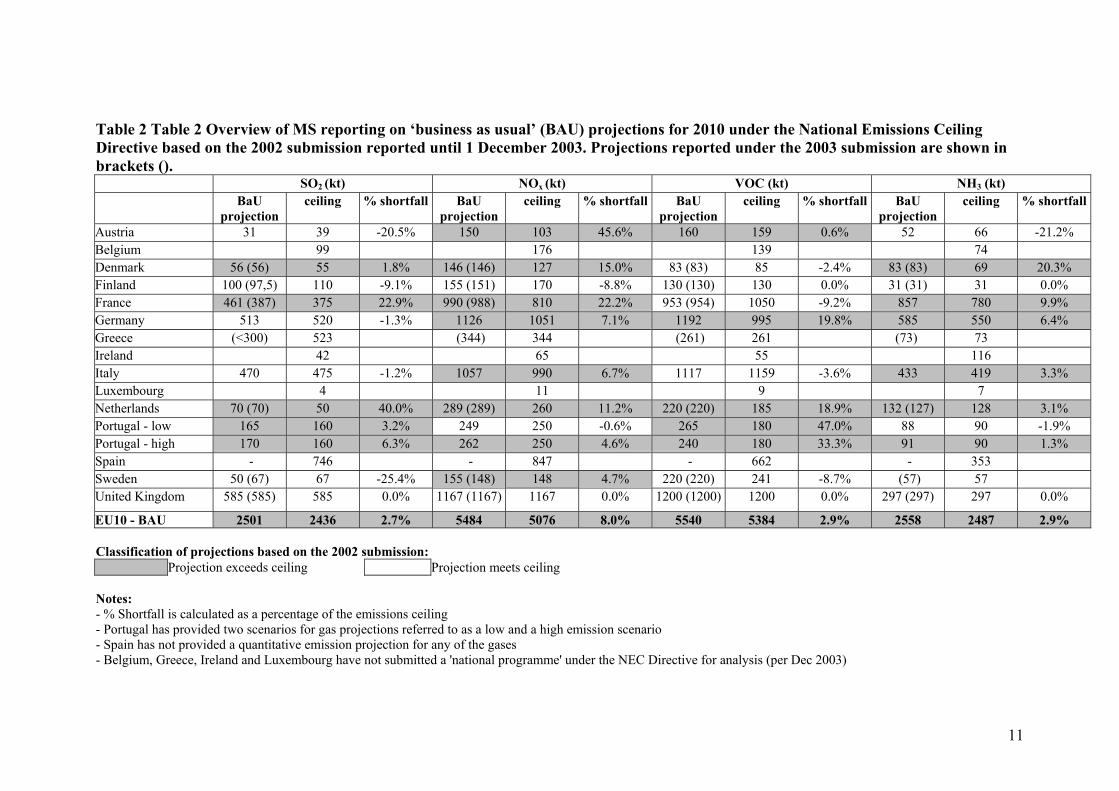
Table 2 Table 2 Overview of MS reporting on ‘business as usual’ (BAU) projections for 2010 under the National Emissions Ceiling Directive based on the 2002 submission reported until 1 December 2003. Projections reported under the 2003 submission are shown in brackets (). SO2 (kt) NOx (kt) VOC (kt) NH3 (kt) BaU
projection ceiling % shortfall BaU
projection ceiling % shortfall BaU
projection ceiling % shortfall BaU
projection ceiling % shortfall
Austria 31 39 -20.5% 150 103 45.6% 160 159 0.6% 52 66 -21.2% Belgium 99 176 139 74 Denmark 56 (56) 55 1.8% 146 (146) 127 15.0% 83 (83) 85 -2.4% 83 (83) 69 20.3% Finland 100 (97,5) 110 -9.1% 155 (151) 170 -8.8% 130 (130) 130 0.0% 31 (31) 31 0.0% France 461 (387) 375 22.9% 990 (988) 810 22.2% 953 (954) 1050 -9.2% 857 780 9.9% Germany 513 520 -1.3% 1126 1051 7.1% 1192 995 19.8% 585 550 6.4% Greece (<300) 523 (344) 344 (261) 261 (73) 73 Ireland 42 65 55 116 Italy 470 475 -1.2% 1057 990 6.7% 1117 1159 -3.6% 433 419 3.3% Luxembourg 4 11 9 7 Netherlands 70 (70) 50 40.0% 289 (289) 260 11.2% 220 (220) 185 18.9% 132 (127) 128 3.1% Portugal - low 165 160 3.2% 249 250 -0.6% 265 180 47.0% 88 90 -1.9%Portugal - high 170 160 6.3% 262 250 4.6% 240 180 33.3% 91 90 1.3% Spain - 746 - 847 - 662 - 353 Sweden 50 (67) 67 -25.4% 155 (148) 148 4.7% 220 (220) 241 -8.7% (57) 57 United Kingdom 585 (585) 585 0.0% 1167 (1167) 1167 0.0% 1200 (1200) 1200 0.0% 297 (297) 297 0.0%
EU10 - BAU 2501 2436 2.7% 5484 5076 8.0% 5540 5384 2.9% 2558 2487 2.9% Classification of projections based on the 2002 submission:
Projection exceeds ceiling Projection meets ceiling Notes: - % Shortfall is calculated as a percentage of the emissions ceiling - Portugal has provided two scenarios for gas projections referred to as a low and a high emission scenario - Spain has not provided a quantitative emission projection for any of the gases - Belgium, Greece, Ireland and Luxembourg have not submitted a 'national programme' under the NEC Directive for analysis (per Dec 2003)
11
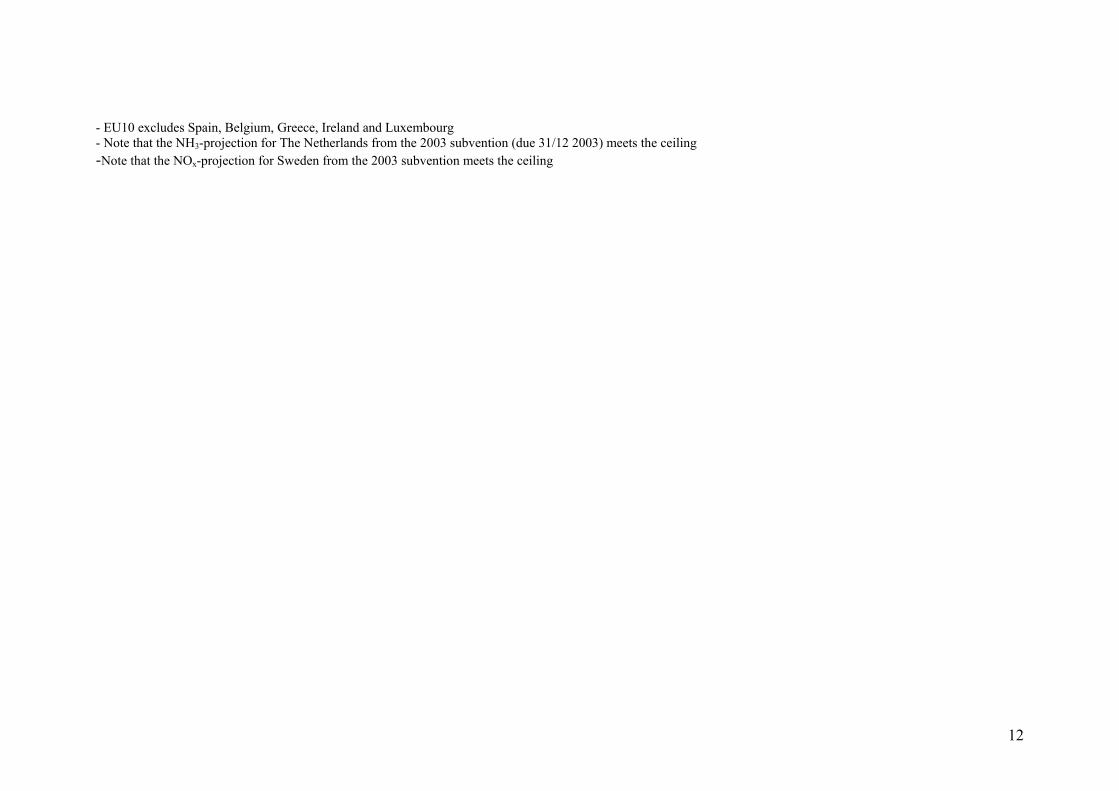
- EU10 excludes Spain, Belgium, Greece, Ireland and Luxembourg - Note that the NH3-projection for The Netherlands from the 2003 subvention (due 31/12 2003) meets the ceiling -Note that the NOx-projection for Sweden from the 2003 subvention meets the ceiling
12
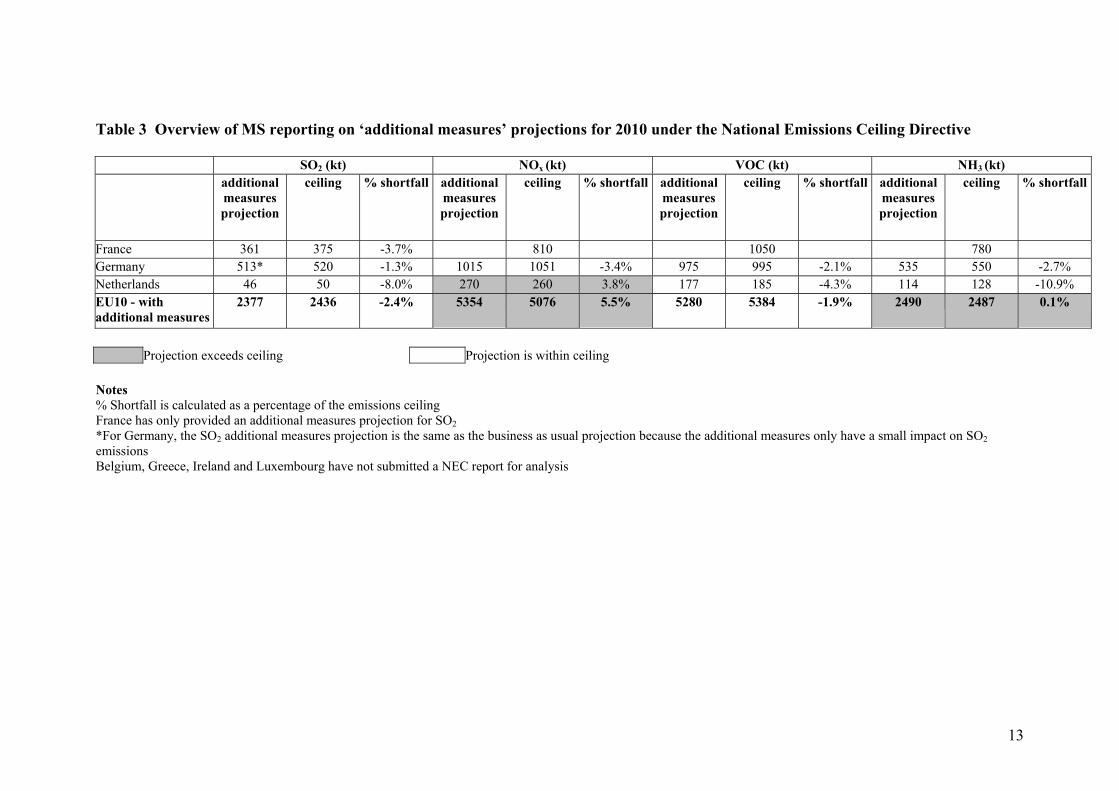
Table 3 Overview of MS reporting on ‘additional measures’ projections for 2010 under the National Emissions Ceiling Directive
SO2 (kt) NOx (kt) VOC (kt) NH3 (kt) additional
measures projection
ceiling % shortfall additional measures projection
ceiling % shortfall additionalmeasures projection
ceiling % shortfall additionalmeasures projection
ceiling % shortfall
France 361 375 -3.7% 810 1050 780Germany 513* 520 -1.3% 1015 1051 -3.4% 975 995 -2.1% 535 550 -2.7%Netherlands 46 50 -8.0% 270 260 3.8% 177 185 -4.3% 114 128 -10.9%EU10 - with additional measures
2377 2436 -2.4% 5354 5076 5.5% 5280 5384 -1.9% 2490 2487 0.1%
Projection exceeds ceiling Projection is within ceiling Notes % Shortfall is calculated as a percentage of the emissions ceiling France has only provided an additional measures projection for SO2 *For Germany, the SO2 additional measures projection is the same as the business as usual projection because the additional measures only have a small impact on SO2 emissions Belgium, Greece, Ireland and Luxembourg have not submitted a NEC report for analysis
13
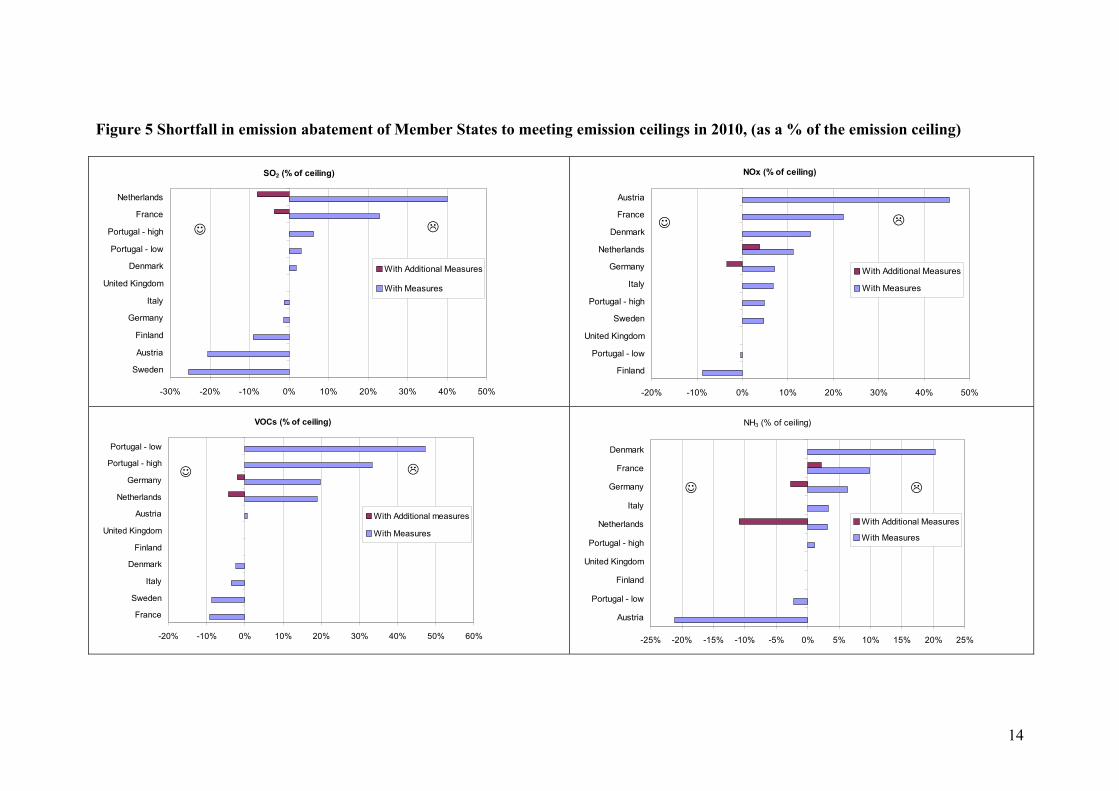
Figure 5 Shortfall in emission abatement of Member States to meeting emission ceilings in 2010, (as a % of the emission ceiling)
SO2 (% of ceiling)
-30% -20% -10% 0% 10% 20% 30% 40% 50%
Sweden
Austria
Finland
Germany
Italy
United Kingdom
Denmark
Portugal - low
Portugal - high
France
Netherlands
With Additional Measures
With Measures
☺
NOx (% of ceiling)
-20% -10% 0% 10% 20% 30% 40% 50%
Finland
Portugal - low
United Kingdom
Sweden
Portugal - high
Italy
Germany
Netherlands
Denmark
France
Austria
With Additional Measures
With Measures
☺
VOCs (% of ceiling)
-20% -10% 0% 10% 20% 30% 40% 50% 60%
France
Sweden
Italy
Denmark
Finland
United Kingdom
Austria
Netherlands
Germany
Portugal - high
Portugal - low
With Additional measures
With Measures
☺
NH3 (% of ceiling)
-25% -20% -15% -10% -5% 0% 5% 10% 15% 20% 25%
Austria
Portugal - low
Finland
United Kingdom
Portugal - high
Netherlands
Italy
Germany
France
Denmark
With Additional Measures
With Measures
☺
14
3.4 Policies and measures Types of policies and measures All of the eleven reporting Member States have listed their policies and measures for the abatement of VOCs, NOx, SO2 and NH3. EU Directives that directly or indirectly abate the NECD pollutants represent a significant proportion of the policies listed by Member States. Directives addressing road transport vehicle emissions are a major instrument for reducing NOx and VOC emissions and measures to address petrol and diesel quality and sulphur content will directly lead to a reduction in SO2. Integrated Pollution Prevention and Control (IPPC) is an important directive to achieve the NECD ceilings as it addresses all four pollutants. The solvent emissions directive and the directive to limit solvents in products are expected to have a significant impact on VOC emissions across Europe. The EU legislation most frequently reported in the National Programmes is as follows:
• Reduction in the sulphur content of certain liquid fuels (99/32/EC) • Quality of petrol and diesel fuels Directive (98/70/EC) • EURO standards I-V on air pollution by emissions from vehicles (98/69/EC) • Control of VOC emissions from petrol storage and distribution (94/63/EEC) • Integrated Pollution Prevention and Control (96/61/EC) • Limitation of emissions from large combustion plants (2001/80/EC) • Directive on the incineration of waste (2000/76/EEC) • Limitation of emissions of VOCs from organic solvents (99/13/EEC) • Labelling and limitation of solvents in products COM(2002)750
The Member States referring to each Directive in their National Programmes are shown in
. A ticked box indicates that the directive was listed as a policy or measure. The quality of reporting on the implementation status of directives was poor, therefore in many cases it was not possible to determine whether they had been adopted or not. The listing of directives addressed was not consistent, so it is likely that some directives will go unreported by Member States, even though they are being implemented and have an effect on emissions.
Table 4
The EU’s 1999 solvents directive is the most commonly reported directive, with ten out of the eleven Member States citing this directive as a key VOC measure. Finland did not report implementing the solvents directive, but as the 2001 deadline has passed, it is likely that this directive has been transposed to some extent by Finland. Another key directive influencing the NECD is the Large Combustion Plant Directive. Again, ten Member States reported this as a measure for reducing NOx and SO2. Directives associated with road transport emissions are a key feature of Member State strategies to address NOx, VOCs and SO2 from vehicles. EURO I-V and the sulphur content of fuels were cited by eight Member States. The petrol distribution and the quality of fuels directives were also commonly mentioned as NECD pollutant reduction measures. NECD reporting on the implementation of IPPC was fairly poor as only five Member States listed this in their emission reduction programmes. This directive addresses all four
15
NECD pollutants and was introduced seven years ago, thus a higher level of reporting on the implementation of this relevant directive was expected. However, since the NECD does not require reporting on the implementation of other Directives explicitly, it is possible that Member States fulfilled their obligations but did not mention it in the National Programmes. The proposed directive limiting solvents in products such as paint and varnishes was reported as a planned measure by three Member States. The impact of the EU draft directive, due to enter into force from 2007, will become more significant towards the end of the decade and thus will have a limited time to reduce the emissions of VOCs to within the ceiling targets. National policies and measures focussed on reducing energy consumption and converting to renewable energy sources will have an indirect effect on NECD pollutants. For example, Sweden’s energy tax will help to abate NOx and SO2 from power generation by acting as an incentive to reduce energy use and increase efficiency, in turn reducing gaseous emissions. The emissions abatement impact of the tax was not quantified. Policies and measures for ammonia abatement varied across Europe. This pollutant had the least abatement activity reported, with no directive featuring strongly. Policies and measures for ammonia reduction were based on agricultural policies, livestock farming and housing, and manure management practices. Germany mentioned the Common Agricultural Policy (CAP) as a key instrument to address ammonia emissions; the reform to the CAP legislation (COM(2003)698 final) is at an early stage of development and, in the future, may help to fill the gap in ammonia reduction measures. For example, the reforms encourage reduced stocking density, as payment to EU farmers would be independent of production. The effect of policies and measures Less than half of the reporting Member States provided any quantification of the effect of policies and measures. Sweden, Finland and the UK reported on the 2010 abatement potential of one or two of policies and Portugal and Germany gave a more comprehensive list of the effects of their policies. Figure 6 summarises the 2010 abatement projected for all the policies and measures that were quantified. Unfortunately, only a few policies were quantified in the programmes submitted and thus the bar charts often reflect the abatement in just one or two countries. The emission abatements are presented above to demonstrate what can be achieved from comprehensive reporting, however, they cannot be used to consider the pattern over Europe as a whole, nor can they act as a reliable way to compare policies as the number of countries reporting on abatement varies between policies.
16
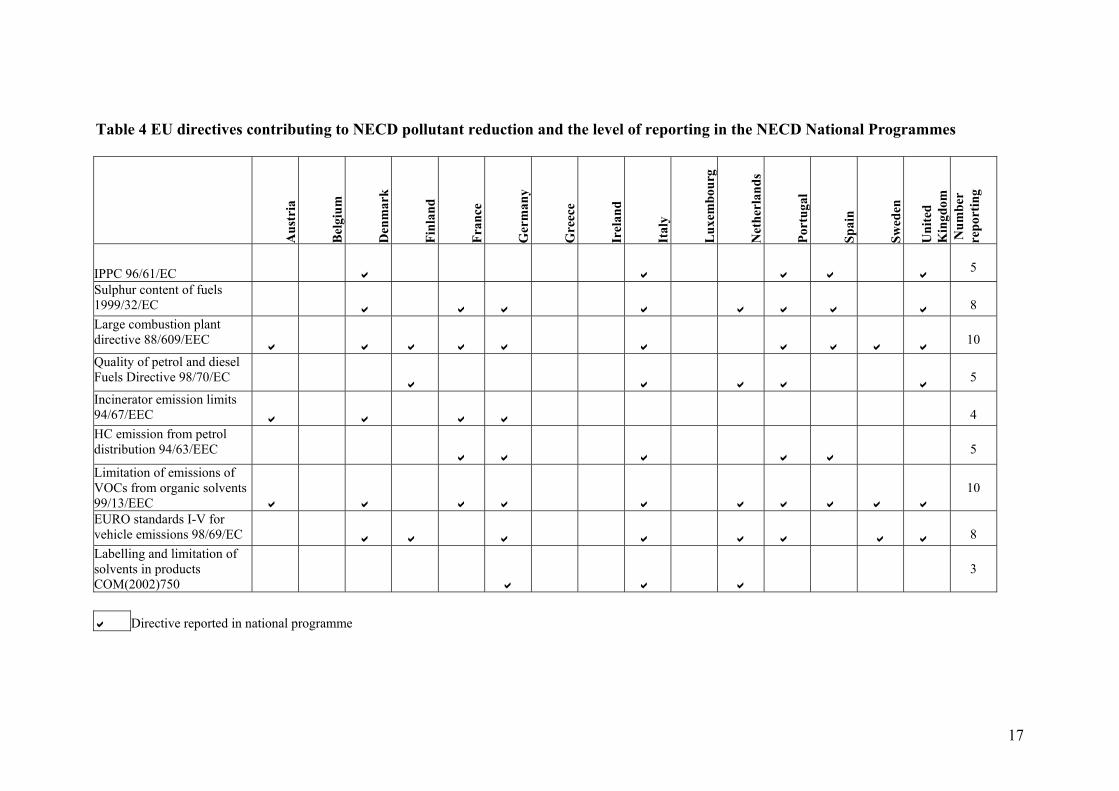
Table 4 EU directives contributing to NECD pollutant reduction and the level of reporting in the NECD National Programmes
Aus
tria
Bel
gium
Den
mar
k
Finl
and
Fran
ce
Ger
man
y
Gre
ece
Irel
and
Ital
y
Lux
embo
urg
Net
herl
ands
Port
ugal
Spai
n
Swed
en
Uni
ted
umK
ingd
om
Nbe
r tin
g re
por
IPPC 96/61/EC
5
Sulphur content of fuels 1999/32/EC
8
Large combustion plant directive 88/609/EEC
10
Quality of petrol and diesel Fuels Directive 98/70/EC
5
Incinerator emission limits 94/67/EEC
4
HC emission from petrol distribution 94/63/EEC
5
Limitation of emissions of VOCs from organic solvents 99/13/EEC
10
EURO standards I-V for vehicle emissions 98/69/EC
8
Labelling and limitation of solvents in products COM(2002)750
3
Directive reported in national programme
17

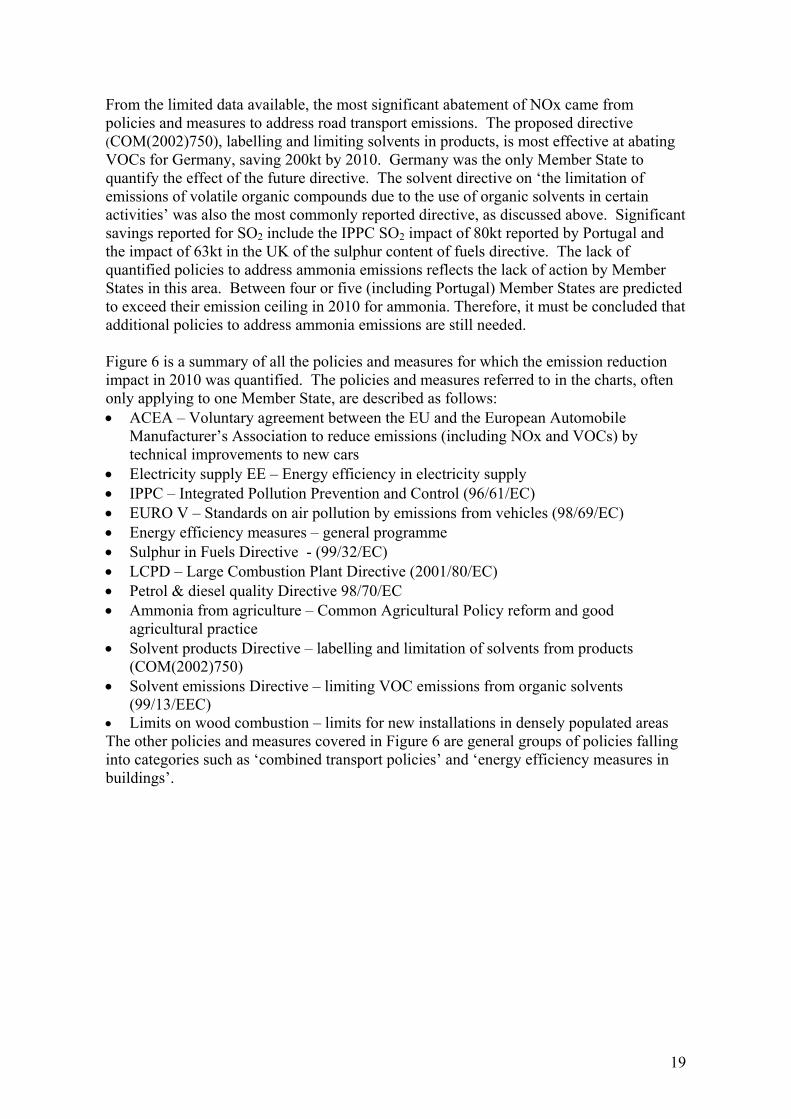
From the limited data available, the most significant abatement of NOx came from policies and measures to address road transport emissions. The proposed directive (COM(2002)750), labelling and limiting solvents in products, is most effective at abating VOCs for Germany, saving 200kt by 2010. Germany was the only Member State to quantify the effect of the future directive. The solvent directive on ‘the limitation of emissions of volatile organic compounds due to the use of organic solvents in certain activities’ was also the most commonly reported directive, as discussed above. Significant savings reported for SO2 include the IPPC SO2 impact of 80kt reported by Portugal and the impact of 63kt in the UK of the sulphur content of fuels directive. The lack of quantified policies to address ammonia emissions reflects the lack of action by Member States in this area. Between four or five (including Portugal) Member States are predicted to exceed their emission ceiling in 2010 for ammonia. Therefore, it must be concluded that additional policies to address ammonia emissions are still needed. Figure 6
Figure 6
is a summary of all the policies and measures for which the emission reduction impact in 2010 was quantified. The policies and measures referred to in the charts, often only applying to one Member State, are described as follows: • ACEA – Voluntary agreement between the EU and the European Automobile
Manufacturer’s Association to reduce emissions (including NOx and VOCs) by technical improvements to new cars
• Electricity supply EE – Energy efficiency in electricity supply • IPPC – Integrated Pollution Prevention and Control (96/61/EC) • EURO V – Standards on air pollution by emissions from vehicles (98/69/EC) • Energy efficiency measures – general programme • Sulphur in Fuels Directive - (99/32/EC) • LCPD – Large Combustion Plant Directive (2001/80/EC) • Petrol & diesel quality Directive 98/70/EC • Ammonia from agriculture – Common Agricultural Policy reform and good
agricultural practice • Solvent products Directive – labelling and limitation of solvents from products
(COM(2002)750) • Solvent emissions Directive – limiting VOC emissions from organic solvents
(99/13/EEC) • Limits on wood combustion – limits for new installations in densely populated areas The other policies and measures covered in are general groups of policies falling into categories such as ‘combined transport policies’ and ‘energy efficiency measures in buildings’.
19
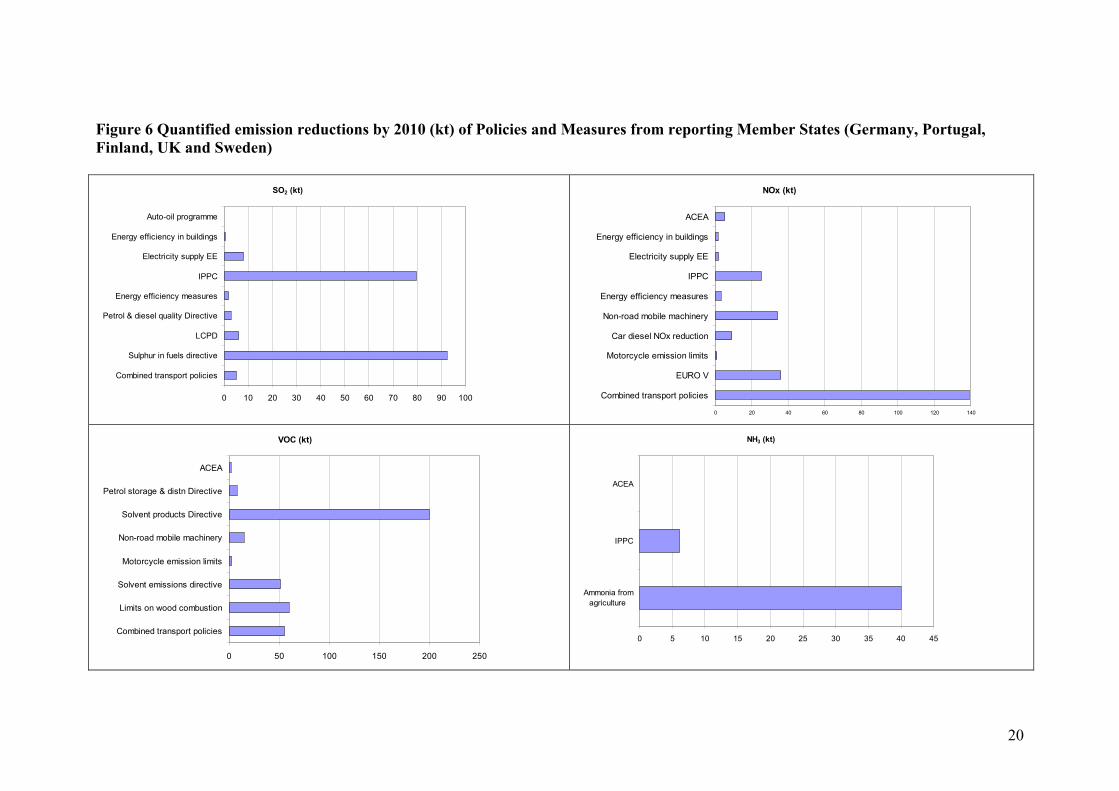
Figure 6 Quantified emission reductions by 2010 (kt) of Policies and Measures from reporting Member States (Germany, Portugal, Finland, UK and Sweden)
SO2 (kt)
0 10 20 30 40 50 60 70 80 90 100
Combined transport policies
Sulphur in fuels directive
LCPD
Petrol & diesel quality Directive
Energy efficiency measures
IPPC
Electricity supply EE
Energy efficiency in buildings
Auto-oil programme
NOx (kt)
0 20 40 60 80 100 120 140
Combined transport policies
EURO V
Motorcycle emission limits
Car diesel NOx reduction
Non-road mobile machinery
Energy efficiency measures
IPPC
Electricity supply EE
Energy efficiency in buildings
ACEA
VOC (kt)
0 50 100 150 200 250
Combined transport policies
Limits on wood combustion
Solvent emissions directive
Motorcycle emission limits
Non-road mobile machinery
Solvent products Directive
Petrol storage & distn Directive
ACEA
NH3 (kt)
0 5 10 15 20 25 30 35 40 45
Ammonia fromagriculture
IPPC
ACEA
20
National Emissions Ceiling Directive – Initial Assessment
4 Conclusions on Member State progress
Four Member States had by 1 December 2003 still failed to submit a 'National Programme' or projections report and so assessment of their progress has been limited to an evaluation of current trends based on inventory data. • Analysis of current trends shows that, of the four pollutants covered by Directive, SO2
emissions show most progress towards meeting the emissions ceilings. 12 Member States and the EU as a whole are on track to meet their targets for this pollutant. Only Portugal, Ireland and Spain are above their linear target paths in 2001.
• For VOC and NH3 emissions the majority of Member States and the EU as a whole are also on track to meet their targets.
• Currently, Member States are experiencing most difficulties in moving towards the emissions ceilings for NOx, with 11 Member States and the EU as a whole currently not on track to meet their targets. Only Italy, United Kingdom and Germany have emissions below their linear target paths in 2001.
Analysis of projections for the ten Member States that reported this information shows that: • On the basis of adopted policies and measures and according to their reports, only
Finland and the United Kingdom expect to meet their emissions ceilings for all pollutants in 2010.4 If envisaged policies and measures are also considered then Germany will also meet all its emission ceilings.
• For SO2 emissions, only two countries project that they will not meet their ceilings (including the effect of envisaged measures) and these are Portugal and Denmark. Two additional Member States (France and the Netherlands) would only meet their SO2 ceilings with additional measures. The aggregate EU10 projection shows the emissions ceiling will be met when the effects of envisaged policies are included.
• For NOx emissions, six countries' projections are higher than their emissions ceilings (including the effect of envisaged measures). These are Austria, France, Denmark, Netherlands, Italy and Sweden.5 Portugal exceeds its emissions ceiling under the high projection, but meets it under the lower projection. Germany would only meet their NOx ceiling with additional measures envisaged. The aggregated EU10 projection shows that the emission ceiling will be exceeded.
• For VOC emissions, only Portugal and Austria (to a small extent) expect to exceed their emission ceilings once the effect of envisaged policies are taken into account. Germany and the Netherlands would only meet their VOC ceilings with additional measures envisaged. The aggregate EU10 projection shows that the ceiling will be met when the effects of envisaged policies are included.
4 On the basis of information provided in early 2004, Greece also expects to at least meet all its emissions ceilings. 5 On the basis of information provided by Sweden in 2004, it now expects to meet its NOx ceiling. The NOx projection for Luxembourg provided in 2004 is also higher than its emissions ceiling.
21
National Emissions Ceiling Directive – Initial Assessment
• For NH3 emissions two countries (Denmark and Italy) expect their emissions to be higher than the ceilings, while Portugal's emissions exceed the ceiling for the high projection. Two Member States (Germany and the Netherlands) would only meet their NH3 ceilings with additional measures envisaged.6 The aggregate EU10 projection shows the emissions ceiling will be met when the effects of envisaged policies are included.
Considering the National programmes and projections of the eleven Member States that have reported so far, the most significant gaps in reporting are:
• Emissions projections incorporating envisaged policies and measures are lacking; • Consistent sectoral disaggregation of projections (not obligatory); • Discussion of the uncertainty associated with the projections; • Information on the socio-economic assumptions behind the projections; • Information on the status of policies and measures; • Quantification of the effect of policies and measures; • Information or comment on the changes in geographical distribution of pollutant
emissions. The following recommendations have therefore been made: Member States should report two scenarios – a 'business as usual' projection including
current policies and measures and also a 'with additional measures' projection, accounting for planned policies and measures. If there are no additional or planned policies or measures then this should be clearly stated. Quantification of the effect of individual planned, adopted and implemented policies
and measures would improve reporting standards and allow the most important policies and measures to be identified. At least the aggregated effect of groups of policies must be estimated. Member States need to report on changes in geographical distribution of national
emissions or, if there is no change, then make this clear – this is specifically requested in the NECD. Key socio-economic assumptions and model parameters must be given in the
programme reports. Recommendations for which assumptions need reporting may help and this is discussed below. Good practice would also include (optional): Projections should be disaggregated to show the trends in key sectors, where possible
such disaggregation should be consistent with that used in the emission inventories. A short discussion on the uncertainty in emission projections would be helpful in
understanding the confidence that can be attached to the results and so the likelihood of the emissions ceiling being achieved. Listing the implementing body for each policy and the type of policy instrument is
helpful in understanding the way in which Member States are implementing policies and measures to meet the emission ceilings.
6 A revised NH3 projection for the Netherlands provided in 2004, shows that it now expects to meet the ceiling on the basis of current policies.
22
National Emissions Ceiling Directive – Initial Assessment
Annex 1
Recommended parameters and assumptions under the EU Greenhouse Gas Monitoring Mechanism (to consider as an example to harmonise aspects of the reporting of 'National Programmes' under the NECD)
The EEA have recommended a list of parameters that, if accepted, would need to be provided under the EU Greenhouse Gas Monitoring Mechanism, summarised in the report:
• ‘Reporting of key parameters underlying projections’, Final Version March 03, Prepared by: European Topic Centre on Air and Climate Change, EEA
The parameters for reporting are listed below. A similar approach could be taken for the reporting under the National Emissions Ceiling Directive, after discussion with the Commission and consultation with Member States. Standard units are given, but it is recognised that some models may not use or produce parameters in these units. The EEA recommended that, wherever possible, these units should be used or information provided to convert to the units. Data can be temperature corrected or not, but it must be clear which they are. The list below is taken directly from the report on the reporting of key parameters, this report can be consulted for a full explanation of the terms in the list.
General Economic GDP (value at given years or annual growth rate and base year; millions euro) Population (value at given years or annual growth rate and base year; millions) International coal prices at given years (at least 2000 and 2010) (euro/tonne) International oil prices at given years (at least 2000 and 2010) (euro/bbl) International gas prices at given years (at least 2000 and 2010) (euro/m3) National carbon or energy taxes Energy Total primary energy demand (PJ) split by oil, gas, coal, renewables, nuclear, other. Total electricity production by fuel type (this may be a model output) Total production of district heating by type of energy Energy demand by sector split by fuel (delivered); suggested sectors are energy industries, other industries, commercial or tertiary, residential and transport. (this may be a model output) Heating and cooling degree days Industry Macroeconomic models: Share of GDP for industrial sector and growth rate Other models: Production index for industrial sector - suggested split in energy intensive industry based on physical production and manufacturing industry based on monetary value. Transport
23

National Emissions Ceiling Directive – Initial Assessment
Macroeconomic models Growth of transport relative to GDP Other models Increase in passenger vehicle kms Increase in freight tonne kms Buildings Macroeconomic models Level of private consumption Share of GDP in buildings (excluding roads) Other models Rate of change of floor space or number of buildings (split between housing and other) Agriculture Macroeconomic models - Share of GDP in agriculture and relative growth Other models - Livestock numbers by type (for enteric fermentation beef cattle and dairy cows, sheep, for manure management also include pigs and poultry)
- Emissions factors by type of livestock for enteric fermentation and manure management, and by type of crop
- Fertiliser use (tonnes) Waste Tonnes municipal solid waste (MSW) or tonnes per head of population or tonnes per GDP. Organic fraction of MSW. Tonnes (or %) of MSW disposed to landfill Tonnes (or %) of MSW incinerated Tonnes (or %) of MSW composted
24

National Emissions Ceiling Directive – Initial Assessment
25
Annex II Member State Analyses
Annex II contains more detailed analysis of Member State National Programmes and Projections under the National Emissions Ceiling Directive. By 1st December 2003, a total of eleven Member States had provided reports detailing their National Programmes - Belgium7, Greece, Ireland and Luxembourg are yet to provide this information. • Austria • Denmark • Finland • France • Germany • Italy • Netherlands • Portugal • Spain • Sweden • UK
7 Belgium has provided information for some of its regions but not all.