
Air Pollutant Emissions from Confined Animal Buildings ... · Air Pollutant Emissions from Confined...
13
Copyright 2011 ASABE ISBN 1-892769-80-8 1/13 Air Pollutant Emissions from Confined Animal Buildings (APECAB) Project Summary Larry D. Jacobson, Brian P. Hetchler, and Neslihan Akdeniz, University of Minnesota Steven Hoff, Iowa State University Albert J. Heber and Ji-Qin Ni, Purdue University Yuanhui Zhang, University of Illinois Jacek Koziel, Iowa State University (formerly West Texas A&M University) INTRODUCTION To address the need for gas, odor, and particulate matter (PM) emission from animal production buildings, funding was secured in the fall of 2001 by a six-state research team for a USDA project entitled “Air Pollutants Emissions from Confined Animal Buildings,” or APECAB. The main objective of the APECAB project was to quantify long-term (yearly) air pollutant emissions from confined animal buildings and establish methodologies for real time measurement of these emissions and build a database of air emissions for US livestock and poultry buildings. The APECAB study was a collaboration of land-grant universities in Minnesota (lead institution), Indiana, Illinois, Texas, Iowa, and North Carolina. Extensive planning occurred during the first nine months for protocol development and equipment selection and purchase. Data collection began at various times during the fall of 2002 for each of the cooperating universities and ended at various times in 2004. The immediate goal of the study was a 15-month sampling period to assure that long-term emissions from actual animal production buildings were determined. Long-term measurements revealed the variations in air emissions due to seasonal effects, animal growth cycles, diurnal variations, and manure handling systems. KEYWORDS: Confined animal buildings, air pollutant emissions, gas emissions, odor, PM emissions, long-term emission measurements, real time measurements. EXPERIMENTAL METHODS The study utilized common instrumentation and protocol at the six sites. At each measurement site, an instrument trailer was stationed between two similar, mechanically-ventilated, confined animal production buildings and emission measurements were quasi-continuous for gas and continuous for PM (Figure 1). The descriptions of the sampled production barns and monitoring plans for each state are described in Table 1. Four swine (including grow-finish, gestation, and farrowing production stages) sites were selected along with two poultry (layer and broiler) sites. The instrument trailer housed a gas sampling system (GSS), gas analyzers, environmental instrumentation, a computer, data acquisition system, controller units for tapered element oscillating microbalances or TEOMs, calibration gas cylinders, and other supplies (Heber et al., 2006a). The specific gas and PM instrumentation included: a chemiluminescence NO x analyzer with NH 3 converter (Model 17C, Thermal Environmental Instruments (TEI), Franklin, MA), a pulsed fluorescence SO 2 detector with H 2 S converter (Model 45C), two photo-acoustic infrared
Transcript of Air Pollutant Emissions from Confined Animal Buildings ... · Air Pollutant Emissions from Confined...

Copyright 2011 ASABE ISBN 1-892769-80-8 1/13
Air Pollutant Emissions from Confined Animal Buildings (APECAB) Project Summary
Larry D. Jacobson, Brian P. Hetchler, and Neslihan Akdeniz, University of Minnesota Steven Hoff, Iowa State University
Albert J. Heber and Ji-Qin Ni, Purdue University Yuanhui Zhang, University of Illinois
Jacek Koziel, Iowa State University (formerly West Texas A&M University)
INTRODUCTION To address the need for gas, odor, and particulate matter (PM) emission from animal production buildings, funding was secured in the fall of 2001 by a six-state research team for a USDA project entitled “Air Pollutants Emissions from Confined Animal Buildings,” or APECAB. The main objective of the APECAB project was to quantify long-term (yearly) air pollutant emissions from confined animal buildings and establish methodologies for real time measurement of these emissions and build a database of air emissions for US livestock and poultry buildings.
The APECAB study was a collaboration of land-grant universities in Minnesota (lead institution), Indiana, Illinois, Texas, Iowa, and North Carolina. Extensive planning occurred during the first nine months for protocol development and equipment selection and purchase. Data collection began at various times during the fall of 2002 for each of the cooperating universities and ended at various times in 2004. The immediate goal of the study was a 15-month sampling period to assure that long-term emissions from actual animal production buildings were determined. Long-term measurements revealed the variations in air emissions due to seasonal effects, animal growth cycles, diurnal variations, and manure handling systems.
KEYWORDS: Confined animal buildings, air pollutant emissions, gas emissions, odor, PM emissions, long-term emission measurements, real time measurements. EXPERIMENTAL METHODS
The study utilized common instrumentation and protocol at the six sites. At each measurement site, an instrument trailer was stationed between two similar, mechanically-ventilated, confined animal production buildings and emission measurements were quasi-continuous for gas and continuous for PM (Figure 1). The descriptions of the sampled production barns and monitoring plans for each state are described in Table 1. Four swine (including grow-finish, gestation, and farrowing production stages) sites were selected along with two poultry (layer and broiler) sites. The instrument trailer housed a gas sampling system (GSS), gas analyzers, environmental instrumentation, a computer, data acquisition system, controller units for tapered element oscillating microbalances or TEOMs, calibration gas cylinders, and other supplies (Heber et al., 2006a). The specific gas and PM instrumentation included: a chemiluminescence NOx analyzer with NH3 converter (Model 17C, Thermal Environmental Instruments (TEI), Franklin, MA), a pulsed fluorescence SO2 detector with H2S converter (Model 45C), two photo-acoustic infrared

Copyright 2011 ASABE ISBN 1-892769-80-8 2/13
CO2 analyzers (2,000-ppm & 10,000-ppm) (Model 3600, Mine Safety Appliances Co., Pittsburgh, PA) and two “tapered element oscillating microbalances” or TEOM PM monitors (Model 1400a, Rupprecht & Patashnick, Albany, NY). Gas concentrations (Heber et al., 2006a) were measured at the air inlets and outlets of each building while simultaneously monitoring total building airflow rates (Casey et al., 2002; Hoff et al., 2009). The PM10 concentration was measured continuously by the TEOM but PM2.5 and total suspended particulates (TSP) were also measured periodically with the TEOM (Heber et al., 2006b; Jerez et al., 2006). Odor samples are taken biweekly to determine odor emissions (Jacobson et al., 2008).
Each university entered the raw data collected from each site into a custom designed common software package (Eisentraut et al., 2004a, 2004b) for calculation of emission rates for each site. Emission rates are calculated by multiplying concentration differences between inlet and outlet air by building airflow rates. As an example, the gas emission rate was calculated as:
b actual out inexhaust
ME =Q ( C - C )0.0821*(273+T )
where: Eb = gas emission rate from the barn, mg/s Qactual = outlet airflow rate at Texhaust, m3/s Cout = gas concentration outlet sampling location, ppm Cin = gas concentration inlet or ambient sampling location, ppm M = gas molecular weight Texhaust = temperature at the exhaust sampling location, ºC The gas concentrations were also adjusted for standard temperature (20°C) and pressure (101,325 Pa) and the airflow rates were based on dry air.
Figure 1. Instrument trailer at Minnesota’s swine gestation/breeding barn site.

Copyright 2011 ASABE ISBN 1-892769-80-8 3/13
Table 1. Characteristics of test sites and buildings (Heber et al., 2006a). Location by state NC IN IL MN IA TX Livestock type Broilers Layers Farrow Gestation Grow-Finish Grow-Finish Inventory† 22,000 250,000 56 630 960 1080 Average mass, kg 1.0 1.8 200 200 68 68 Animal occupation, d 63 365 21 120 140 140 # buildings at site 4 16 2 2 4 5 Year of construction 2001 2002 1997/98 1994/97 1997 2000 Building type litter HR PP PPR DP PPR Orientation NE-SW N-S N-S N-S E-W E-W Distance to site, km 120 69 96 160 29 144 Shower in/out N N Y Y N Y Building width, m 12.8 30.5 18.0 14.6 12.5 12.7 Building length, m 152.4 181.4 22.5 77.4 58.5 72.0 Building area, m2 1951 5533 405 1130 731 914 Ridge height, m 3.2 11.6 7.6 4.9 4.6 4.6 Sidewall height, m 2.20 6.40 3.05 2.29 2.44 2.44 Barn Spacing, m 18.3 22.9 0 9.2 18.3 15.2 Barn Manure storage, d 730 730 21 14 365 7 Outdoor storage none none none* basin none lagoon Number air inlets† 48 10 8 14 9 20 Inlet type slot/EP slot CCB CCB CCB CCB Controls vendor HH AE MF AV VF AS Number of fans† 13 75 4 6 8 5 # variable speed fans 0 0 2 1 4 1 Largest fan dia., cm 122 122 122 122 122 122 Smallest fan dia., cm 91 122 46 91 46 91 Fan manufacturer HH/DA AT MF AV MF AS # ventilation stages‡ 7 9 4 6 7 4 # temperature sensors† 3 15 1 1 2 2 Artificial heating Y N Y Y Y Y Summer cooling EP/tun EP EP/tun EP/tun SK/tun Mist/tun Number of inlet SLG† 1/2 1 2 1/2 2 2 Number of exhaust SLG†
4/5 4 2 2 3 2
Gas probe lengths, m 15-123 12-115 10-50 10-80 10-70 23-107 Internet service type phone wireless phone WDSL phone Satellite Start date in 2002 11/25 12/1 11/15 8/28 8/15 10/10 *Manure stored in deep pit of adjacent building †Per building or room ‡Includes continuous winter fans as the first stage ††One sampling probe located between the buildings represents inlet air for both buildings; AE= Automated Environments, AS= Airstream, AT=Aerotech, AV=Aerovent, CCB=center-ceiling baffled inlet, DP=deep pit, EP=evaporative pad, HR=high rise, HH = Hired Hand, MF=Multifan, PP=Pull-plug manure gutter, PPR=Pull-plug manure gutter with recharge, SLG=sample location groups, SK=sprinkler system, tun=tunnel ventilation, VF=Varifan

Copyright 2011 ASABE ISBN 1-892769-80-8 4/13
In the APECAB study, each gas analyzer was automatically switched sequentially to sample air from up to 12 sampling location groups (SLG). Gas concentrations of each SLG were measured continuously during a 10-min sampling period before switching to the next SLG. For sampling cycles with 12 SLGs, gas concentrations were therefore measured during twelve, 120-min sampling cycles per day. The pre-equilibration gas concentration readings during each sampling period were flagged invalid while the gas concentration readings during the remainder of the sampling period were valid (Heber et al., 2006a). The number of invalid readings depends on the time required for equilibrium, which varies depending on the analyzer and its condition. The invalid and valid periods for each analyzer are given below:
Ammonia 7 min invalid, 3 min valid Hydrogen sulfide 5 min invalid, 5 min valid Carbon dioxide 3 min invalid, 7 min valid
Also, to avoid errors due to partial data days (data was bad due to calibration or other reasons) that could result in biased daily averages, a policy of requiring 70% valid data for calculating average daily means for a complete-data day was established and followed. Similarly, hourly averages was reported only if over 70% of the data during that hour was valid and monthly averages were reported only if over 70% of the days were valid.
DESCRIPTION OF INDIVIDUAL MONITORING SITES
A brief description of the animal production monitoring sites, including a plan and/or cross-section of the confinement buildings, in Minnesota, Texas, Illinois, Iowa, and Indiana are listed below. Unfortunately, the North Carolina site experienced numerous problems with data collection and analysis over the course of the study that did not meet the above mentioned complete data criteria. Minnesota
A plan view of the two dry sow or gestation buildings monitored by the University of Minnesota are shown in Figure 2. They were located in southern Minnesota on an existing 1300-sow farrowing to wean pig production facility. The operators of the facilities designated these two barns as the “breeding and gestation” barns. Weaned sows were initially moved to the breeding barn into one of the 22 pens. The sows were then bred and put in one of the 512 individual stalls. After roughly one month, the sows were pregnancy checked and then transferred to the gestation barn that contained 645 individual gestation stalls where they stayed until they were again ready to “farrow” in the farrowing rooms. Manure was removed from each of the two barns approximately every two weeks by a gravity drain “pull plug” manure handling system from the shallow gutters to the outside earthen storage basin, located on the east side of the site.

Copyright 2011 ASABE ISBN 1-892769-80-8 5/13
1st Stage Earthen Basin
2nd Stage Earthen Basin
Gestation Barn
Breeding Barn
Farrowing Barn7 rooms
Office
InstrumentTrailer
Weather Station
Cool Cell Inlets
Weaner Holding
North
Gas sampling andtemperature sensor location
TEOM and humidity sensor
Breeding Barn End View Gestation Barn End View
Ventilation per barn: 1 Aerotech 90-cm direct-drive continuous fan 5 Aerotech 120-cm belt-driven fans
15m x 78m 512 crates 22 pens
15m x 78 m 645 crates
Ceiling inlet gas sampling and temperature sensorlocation
Pen areas for breeding
Figure 2. Plan and end views of the Minnesota dry sow buildings (breeding and gestation) monitored for the APECAB study (Jacobson et al., 2005).

Copyright 2011 ASABE ISBN 1-892769-80-8 6/13
Texas
The swine finishing barns were located about 160 km from Texas A & M Agricultural Research and Extension Center in Amarillo, Texas, in a flat and open area with limited crop farming. The nearest neighbors were two identical farms 1.6 km away to the west and north from the sampled farm. The nearest community of over 1,000 people was located 21 km away. The buildings had been operated since April, 2000. The buildings were oriented E-W and spaced 15.2 m apart. The site consisted of five identical barns with 1080-head capacity each (Figure 3).
Figure 3. Schematic of swine finishing operation in Texas (Koziel et al., 2005).
The pigs were confined in 54 pens per barn located on both sides of a narrow center walkway. The barn ridge height was 4.6 m and the side wall height was 2.4 m. Each building was 72.1 m × 12.6 m. Manure dropped through the slatted floor and was collected in the shallow pit with a slanted bottom reaching a maximum depth of 1.2 m. The pit was divided into two sloped sections separated by a 1-m tall spill-over wall. There were two outlet pipes per building located in the lowest sections of the pit. Accumulated manure was gravity-drained by pulling a plug in the shallow pit and discharging it to an on-site lagoon every seven days. The drain plug was left open for 24 hours as the manure in the pit drained by gravity to an onsite lagoon. After this time, the drain plug was replaced and the shallow pit was recharged with effluent from the same lagoon or with fresh ground water, depending on the amount of water in the lagoon. The depth of the recharge water in the gutter was approximately 0.1 m. The lagoon was located approximately 50 m north from the northernmost house on the site and was situated downwind from the direction of prevailing winds. The swine finishing periods extended between 20 to 21 weeks.

Copyright 2011 ASABE ISBN 1-892769-80-8 7/13
Illinois
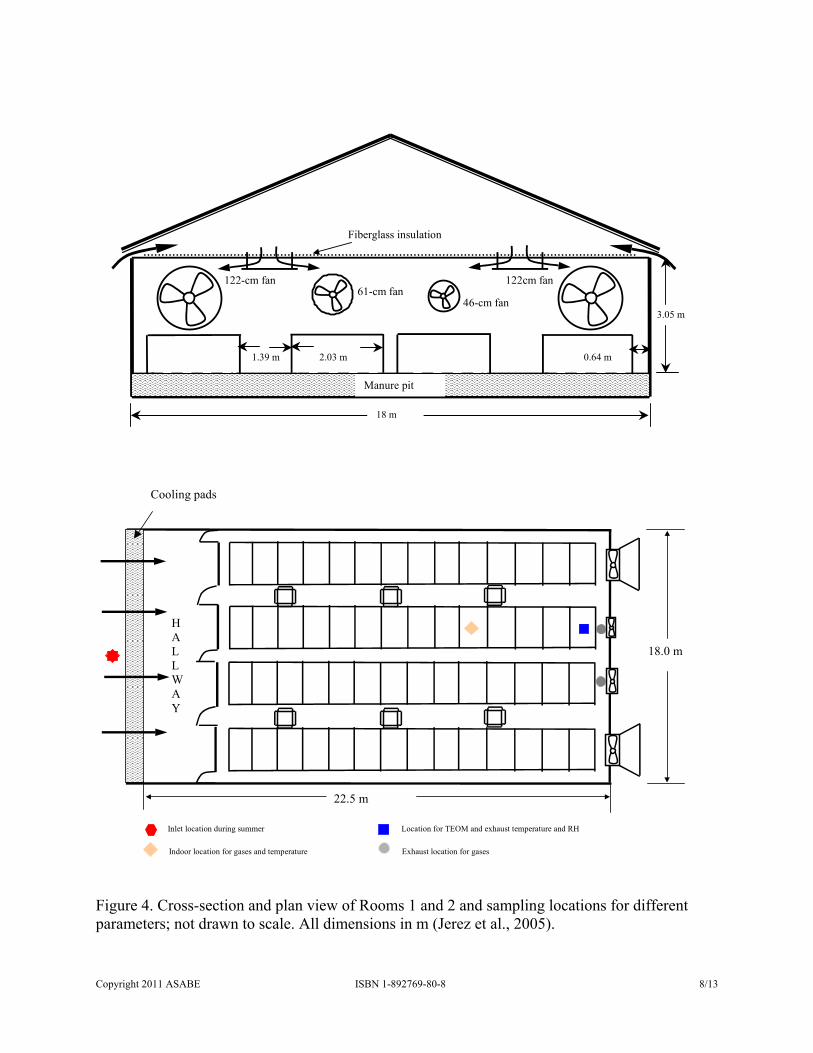
The swine building used in this study was a 2400-sow (breeding/gestation and farrowing) facility located in central Illinois. The facility was constructed in 1997-1998 and contained six farrowing rooms. The breeding and farrowing sections were connected by a hallway. Two similar farrowing rooms (Rooms 1 and 2), located adjacent to one another, were monitored for this study. Both facilities had 56 individual 2.0 m × 1.6 m farrowing crates with slotted plastic floors; the crates were in four rows with two in the middle and with walkways on both sides; the other two rows were on the sides of the rooms with a small walkway. Overall dimensions of each room were 21.4 m long and 18 m wide. The rooms had a shallow pit or gutter (1.2 m deep) underneath the floor with a pull-plug manure handling system; manure flowed by gravity in a 25.4 cm-diameter drainage pipe to a deep-pit (2.6 m) storage underneath the breeding barn. The manure from each room was drained once every three weeks or prior to each new batch of sows. Figure 4 shows the approximate sampling location for gases, PM, temperature, and relative humidity (RH) in both farrowing rooms. The concentrations of gaseous contaminants (NH3, H2S, CO2, and odor) were measured immediately in front of the inlet section of the 46- and 61-cm fans. The tapered element oscillating microbalance (TEOM) monitor, which was used for exhaust PM10 measurements, was located in the crate nearest the 46-cm fan. The temperature and RH of the exhaust air were monitored close to the TEOM location while the indoor concentration of gases and indoor temperature were measured from about 1/3 of the room length from the exhaust fans. Two inlet locations were sampled for gaseous contaminant concentrations: one sampler was located before the entrance to the attic (winter) and the other was located before the cooling pads.
Copyright 2011 ASABE ISBN 1-892769-80-8 8/13
3.05 m
61-cm fan
2.03 m
Fiberglass insulation
46-cm fan
122cm fan 122-cm fan
1.39 m
Manure pit
0.64 m
18 m
H A L L W A Y
Cooling pads
22.5 m
Inlet location during summer
Indoor location for gases and temperature
Location for TEOM and exhaust temperature and RH
Exhaust location for gases
18.0 m
Figure 4. Cross-section and plan view of Rooms 1 and 2 and sampling locations for different parameters; not drawn to scale. All dimensions in m (Jerez et al., 2005).
Copyright 2011 ASABE ISBN 1-892769-80-8 9/13
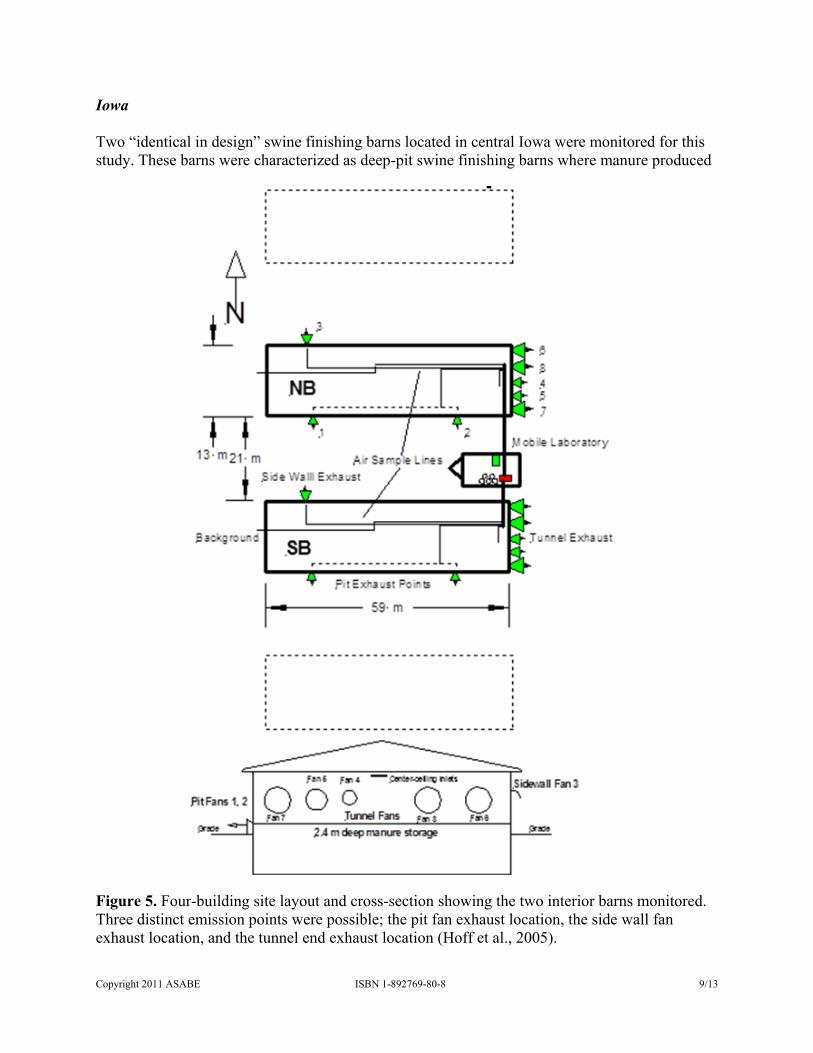
Iowa Two “identical in design” swine finishing barns located in central Iowa were monitored for this study. These barns were characterized as deep-pit swine finishing barns where manure produced
Figure 5. Four-building site layout and cross-section showing the two interior barns monitored. Three distinct emission points were possible; the pit fan exhaust location, the side wall fan exhaust location, and the tunnel end exhaust location (Hoff et al., 2005).
Copyright 2011 ASABE ISBN 1-892769-80-8 10/13
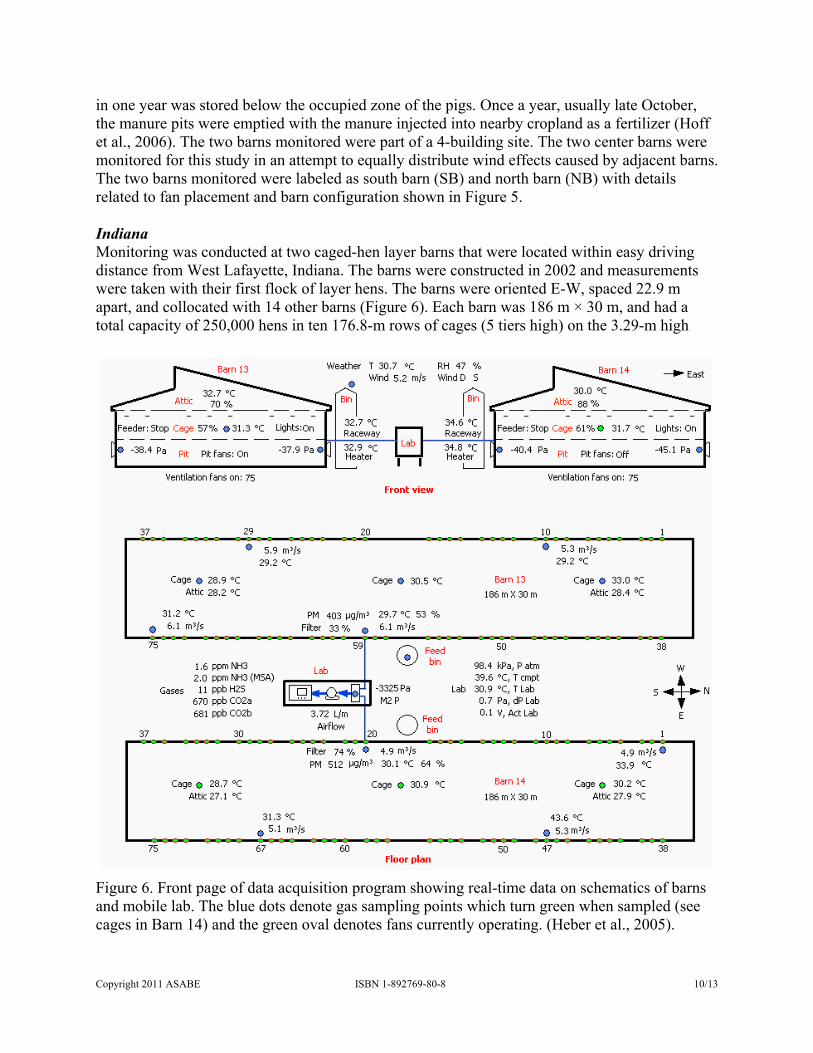
in one year was stored below the occupied zone of the pigs. Once a year, usually late October, the manure pits were emptied with the manure injected into nearby cropland as a fertilizer (Hoff et al., 2006). The two barns monitored were part of a 4-building site. The two center barns were monitored for this study in an attempt to equally distribute wind effects caused by adjacent barns. The two barns monitored were labeled as south barn (SB) and north barn (NB) with details related to fan placement and barn configuration shown in Figure 5. Indiana Monitoring was conducted at two caged-hen layer barns that were located within easy driving distance from West Lafayette, Indiana. The barns were constructed in 2002 and measurements were taken with their first flock of layer hens. The barns were oriented E-W, spaced 22.9 m apart, and collocated with 14 other barns (Figure 6). Each barn was 186 m × 30 m, and had a total capacity of 250,000 hens in ten 176.8-m rows of cages (5 tiers high) on the 3.29-m high
Figure 6. Front page of data acquisition program showing real-time data on schematics of barns and mobile lab. The blue dots denote gas sampling points which turn green when sampled (see cages in Barn 14) and the green oval denotes fans currently operating. (Heber et al., 2005).
Copyright 2011 ASABE ISBN 1-892769-80-8 11/13
upper floor. Manure was scraped off the floor under the cages into the 3.15-m deep manure pit and was stored for at least 12 months. Manure drying in the pit was enhanced with 918-mm auxiliary circulation fans (Model 40404-36, Choretime-Brock, Milford, IN). Fresh air flowed into the attic through the 2.72-m wide evaporative cooling pad in the roof, which was operated only when barn temperature exceeded the hot-weather set point. Ventilation air entered the second floor from the attic through temperature-adjusted baffled ceiling air inlets above the cages and exited through continuous manure slots beneath each cage row into the pit. The ventilation exhaust fans in the pit consisted of 37 fans (fan # 1-37) on the west sidewall and 38 fans (fan # 38-75) on the east sidewall. All fans were 122-mm belt-driven exhaust fans (Model AT481Z3CP-24, Aerotech, Lansing, MI) equipped with 0.75-kW motors (PN B-176835-04, General Electric, Dekalb, IL). The fans were 3.7 m apart within groups of three or four fans and the groups were spaced 7.3 m apart (Figure 6). Lights in the second floor, where the cages were located, were shut off automatically between 20:00 and 04:00. RESULTS The results from this study are presented in a series of spreadsheets. Daily means with standard deviations for each day of a month that data were collected are listed in a set of seven spreadsheets with the following data given in each of the seven spreadsheets:
1. Weather parameters and animal characteristics 2. Environmental parameters and particulate concentrations 3. Ammonia concentrations 4. Hydrogen sulfide concentrations 5. Carbon dioxide concentrations 6. Ammonia and hydrogen sulfide emission rates 7. Carbon dioxide and particulate matter emission rates
The set of seven spreadsheets are listed for each month that data was collected at any particular site. Missing daily data in any of the spreadsheet indicate that the 70% valid data for calculating average daily means for a complete-data day was not obtained for that particular day at that site. The spreadsheets are divided or segmented by state or monitoring site. REFERENCES Casey, K. D., E. F. Wheeler, R. S. Gates, H. Xin, P. A. Topper, J. Zajaczkowski, Y. Liang, A. J. Heber, and L. D. Jacobson. 2002. Quality assured measurements of animal building emissions: Part 4. Airflow. Presented at Symposium on Air Quality Measurement Methods and Technology, Nov 13-15, 2002 in San Francisco, CA. Sponsored by the Air & Waste Management Association.

Copyright 2011 ASABE ISBN 1-892769-80-8 12/13
Eisentraut, M. A., A. J. Heber, and J.-Q. Ni. 2004a. CAPECAB Part I: Processing barn emission data. A&WMA 97th Annual Conference and Exhibition, Air and Waste Management Association, Pittsburgh, PA. Eisentraut, M. A., A. J. Heber, T. T. Lim, and S. J. Hoff. 2004b. CAPECAB Part II: Calculating barn ventilation and emission rates. A&WMA 97th Annual Conference and Exhibition, Air and Waste Management Association, Pittsburgh, PA. Heber, A. J., J.-Q. Ni, T. T. Lim, R. Chervil, P. C. Tao, L. D. Jacobson, S. J. Hoff, J. A. Koziel, Y. Zhang, D. B. Beasley, and J. M. Sweeten. 2005. Aerial pollutant emissions from two high-rise layer barns in Indiana. Paper # 1368. Presented at the Annual Meeting of the Air & Waste Management Association Meeting, Minneapolis, MN, June 21-24, 2005. Available on the proceedings CD ROM. Heber, A. J., J.-Q. Ni, T.-T. Lim, A. M. Schmidt, J. A. Koziel, P. C. Tao, D. B. Beasley, S. J. Hoff, R. E. Nicolai, L. D. Jacobson, and Y. Zhang. 2006a. Quality assured measurements of animal building emissions: gas concentrations. Journal of the Air & Waste Management Association 56(10): 1472-1483. Heber, A. J., T.-T. Lim, J.-Q. Ni, P. C. Tao, A. M. Schmidt, J. A. Koziel, S. J. Hoff, L. D. Jacobson, Y. Zhang, and G. B. Baughman. 2006b. Quality assured measurements of animal building emissions: Particulate matter concentrations. Journal of the Air & Waste Management Association 56(12): 1642-1648. Hoff, S. J., D. S. Bundy, M. A. Huebner, B. C. Zelle, L. D. Jacobson, A. J. Heber, J.-Q. Ni, J. A. Koziel, J. M. Sweeten, Y. Zhang, and D. B. Beasley. 2005. NH3, H2S, CO2, PM, and odor animal emission data from the six-state (APECAB) project, swine deep-pit finishing buildings. Paper #648. Presented at the Annual Meeting of the Air & Waste Management Association Meeting, Minneapolis, MN, June 21-24, 2005. Available on the proceedings CD ROM. Hoff, S. J., D. S. Bundy, M. A. Nelson, B. C. Zelle, L. D. Jacobson, A. J. Heber, J.-Q. Ni, Y. H. Zhang, J. A. Koziel, and D. B. Beasley. 2006. Emissions of ammonia, hydrogen sulfide, and odor before, during and after slurry removal from a deep-pit swine finisher. Journal of the Air & Waste Management Association 56(5): 581-590. Hoff, S. J., D. S. Bundy, M. A. Nelson, B. C. Zelle, L. D. Jacobson, A. J. Heber, J.-Q. Ni, Y. H. Zhang, J. A. Koziel, and D. B. Beasley. 2009. Real-time airflow rate measurements from mechanically ventilated animal buildings. Journal of the Air & Waste Management Association 59(6): 683-694. Jacobson, L. D., B. P. Hetchler, V. J. Johnson, D. R. Schmidt, R. E. Nicolai, A. J. Heber, J.-Q. Ni, J. A. Koziel, J. M. Sweeten, S. J. Hoff, D. S. Bundy, Y. Zhang, and D. B. Beasley. 2005. Air pollutant emissions from confined animal buildings-dry sow buildings in Minnesota. Paper #53. Presented at the Annual Meeting of the Air & Waste Management Association Meeting, Minneapolis, MN, June 21-24, 2005. Available on the proceedings CD ROM.

Copyright 2011 ASABE ISBN 1-892769-80-8 13/13
Jacobson, L. D., B. Hetchler, D. R. Schmidt, R. E. Nicolai, A. J. Heber, J.-Q. Ni, S. J. Hoff, J. A. Koziel, D. B. Parker, Y. Zhang, and D. B. Beasley. 2008. Quality assured measurements of animal building emissions: odor concentrations. Journal of the Air & Waste Management Association 58(6): 806-811. Jerez, S., Y. Zhang, J. W. McClure, A. J. Heber, J.-Q. Ni, L. D. Jacobson, S. J Hoff, J. A. Koziel, J. M. Sweeten, and D. B. Beasley. 2005. Aerial pollutant concentrations and emission rate measurements from a swine farrowing building in Illinois. Paper #1026. Presented at the Annual Meeting of the Air & Waste Management Association Meeting, Minneapolis, MN, June 21-24, 2005. Available on the proceedings CD ROM. Jerez, S. B, Y. Zhang, J. McClure, L. Jacobson, A. Heber, S. Hoff, J. Koziel, and D. Beasley. 2006. Comparison of measured total suspended particulate matter concentration using tapered element oscillating microbalance and a TSP sampler. Journal of the Air & Waste Management Association 56: 261-270. Koziel, J. A., B. H. Baek, C. L. Bayley, K. J. Bush, J. P. Spinhirne, A. Balota, D. B. Parker, J. M. Sweeten, L. D. Jacobson, A. J. Heber, J.-Q. Ni, S. J. Hoff, Y. Zhang, D. B. Beasley. 2005. Aerial Pollutant Emissions from Confined Animal Buildings: Swine Finisher Buildings in Texas. Paper #1043, Proceedings of the Air and Waste Management Association Symposium, Minneapolis, MN.


