PROGRESS REPORT 2016 - Regional Transportation...
14
2016 STRATEGIC PLAN PROGRESS REPORT
Transcript of PROGRESS REPORT 2016 - Regional Transportation...
2016
STRATEGIC PLANPROGRESS REPORT
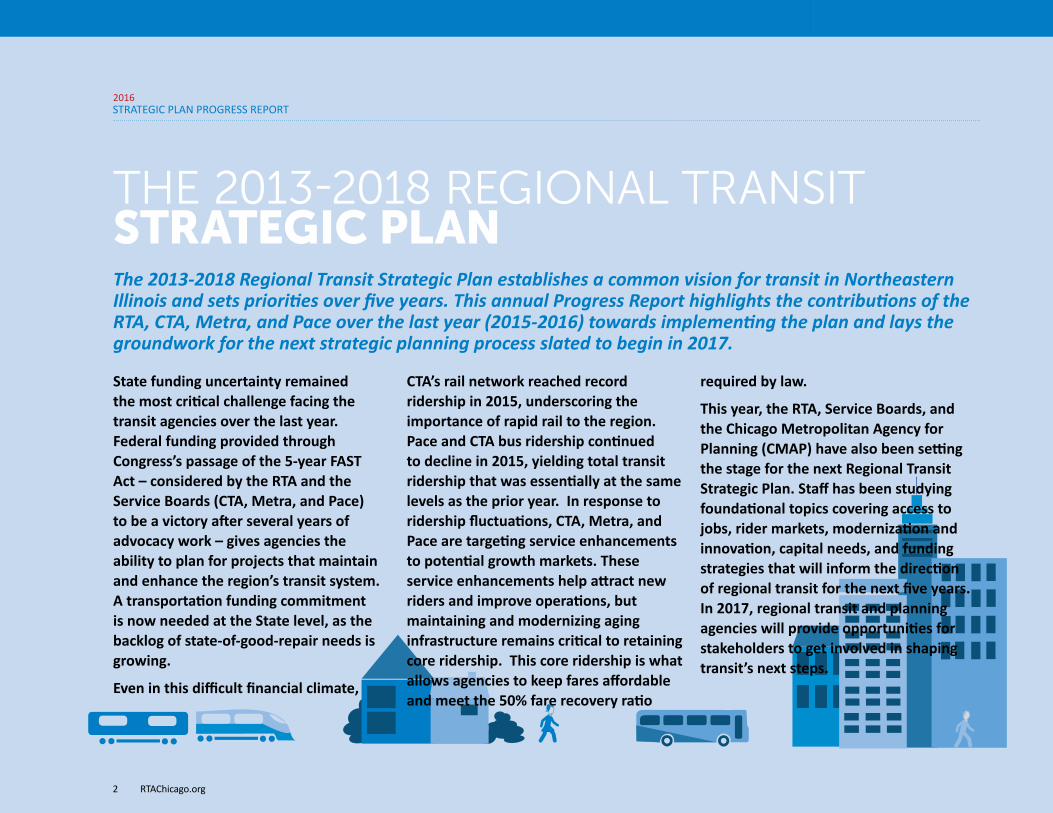
THE 2013-2018 REGIONAL TRANSIT STRATEGIC PLAN The 2013-2018 Regional Transit Strategic Plan establishes a common vision for transit in Northeastern Illinois and sets priorities over five years. This annual Progress Report highlights the contributions of the RTA, CTA, Metra, and Pace over the last year (2015-2016) towards implementing the plan and lays the groundwork for the next strategic planning process slated to begin in 2017.
State funding uncertainty remained the most critical challenge facing the transit agencies over the last year. Federal funding provided through Congress’s passage of the 5-year FAST Act – considered by the RTA and the Service Boards (CTA, Metra, and Pace) to be a victory after several years of advocacy work – gives agencies the ability to plan for projects that maintain and enhance the region’s transit system. A transportation funding commitment is now needed at the State level, as the backlog of state-of-good-repair needs is growing.
Even in this difficult financial climate,
CTA’s rail network reached record ridership in 2015, underscoring the importance of rapid rail to the region. Pace and CTA bus ridership continued to decline in 2015, yielding total transit ridership that was essentially at the same levels as the prior year. In response to ridership fluctuations, CTA, Metra, and Pace are targeting service enhancements to potential growth markets. These service enhancements help attract new riders and improve operations, but maintaining and modernizing aging infrastructure remains critical to retaining core ridership. This core ridership is what allows agencies to keep fares affordable and meet the 50% fare recovery ratio
required by law.
This year, the RTA, Service Boards, and the Chicago Metropolitan Agency for Planning (CMAP) have also been setting the stage for the next Regional Transit Strategic Plan. Staff has been studying foundational topics covering access to jobs, rider markets, modernization and innovation, capital needs, and funding strategies that will inform the direction of regional transit for the next five years. In 2017, regional transit and planning agencies will provide opportunities for stakeholders to get involved in shaping transit’s next steps.
2016
RTAChicago.org2
STRATEGIC PLAN PROGRESS REPORT

A world-class regional public transportation system providing a foundation to the region’s prosperity, livability and vitality.
THE 2013-2018 REGIONAL TRANSIT STRATEGIC PLAN
Promotea green, livable, and prosperous region
• Promote transit, both alone and in combination with walking and cycling, as an alternative to motor vehicle use.
• Reduce transit’s impact on the environment.
• Encourage Transit-Oriented Development by partnering with communities, employers and other stakeholders.
• Connect employers to a broad and diverse workforce.
• Partner with communities to improve transportation infrastructure that adds lasting value to all users.
Ensurefinancial viability
• Prioritize capital investments based on safety, State of Good Repair, reliability, ridership and operating costs.
• Control costs through improved operational efficiencies, effective management, coordinated planning, innovation and technology.
• Increase and stabilize revenue through existing and new funding sources in order to maintain reasonable fares.
Providevaluable, reliable,
accessible, and attractive transportation options
• Provide public transportation choices that link people to jobs, education, services, cultural activities and other life commitments.
• Connect communities within the region through an enhanced and coordinated transit network that provides reliable and time competitive transportation options.
• Ensure that the transit system is more accessible and easier to use.
• Deliver safe, clean, reliable and affordable transportation services.
• Provide a customer experience that offers modern amenities utilizing state-of-the-art technology.
Advocatefor and be a trusted
steward of public transportation
• Elevate transit’s needs by educating elected officials and citizens on the benefits of public transportation such as its contribution to the region’s economic vitality, sustainability and individual health and well-being.
• Engage the public in meaningful and constructive ways.
• Increase transparency through improved oversight and information availability.
• Attract more riders to the system by promoting regional programs and services to businesses and residents.
• Increase awareness of transit through coordinated marketing and promotion.
VISION
GOALS
OBJECTIVES
Continue to
2016
RTAChicago.org 3
STRATEGIC PLAN PROGRESS REPORT

PROVIDE VALUABLE, RELIABLE, ACCESSIBLE, AND ATTRACTIVE TRANSPORTATION OPTIONSIn 2015 the transit agencies invested $775 million in new and rehabilitated vehicles, technology innovations, and infrastructure upgrades to the rail and bus system. Revamped and expanded services were also initiated to better connect communities to jobs, education, services, and cultural activities.
Rail ridership continued its growth to the highest levels in decades with CTA adding 3.6 million rail trips in 2015 and achieving yet another record high of 241.7 million rides. This milestone underscores the value of the region's rapid transit system as a key means of travel.
Transit usage, measured as transit trips per resident, remains on a ten-year upward trend, but has declined over the last three years. Pace is working to stem decreases in bus ridership by modifying services, such as recent restructuring in the western suburbs that increased Saturday ridership on Route 307 by 18 percent and weekday ridership on Route 318 ridership by 13 percent. CTA has also enhanced several routes. Metra has expanded off-peak service in order to boost commuter rail ridership, which declined a modest 2.1 percent in 2015, likely due to ongoing low gas costs.
New York
Boston
Washington D.C.
Chicago
Philadelphia
Los Angeles
Miami
Atlanta
Houston
Dallas
201
86
74
59
51
28
24
13
11
66
TRAN
SIT TRIPS PER RESIDEN
T (2014)2
2015-2016 ACTIONS• CTA, Metra, and Pace launch Ventra
app to allow customers to load transit value for all three systems
• CTA adds 4G wireless to all Blue and Red Line subway stations & tunnels
• CTA & CDOT debut Loop Link downtown bus enhancements
• Metra opens a larger, accessible Ravenswood Station
• Pace adds $7.6 million in new service in Aurora, West Cook, Niles, and DuPage County
• Metra begins rehabilitation of 47 railcars & upgrade of 27 locomotives
• CTA completes track renewal & slow-zone eliminations on Green Line West and North Main Line
• Pace implements I-55 Bus on Shoulders service enhancements, including addition of 2 new routes
• Pace upgrades more flag stops to posted stops
• Metra completes on-board WiFi pilot with expansion to 50 additional cars
2017 OUTLOOK• Pace to begin service on Pulse
Milwaukee Line• CTA to complete Wilson station and
95th Street south terminal• Pace/IDOT to plan I-94 Edens Bus on
Shoulders service• CTA to make 4 more stations
wheelchair accessible
(1) Region definition changed from the 2014 Progress Report to now use Metropolitan Statistical Area (instead of 6-county area) for consistency across RTA reports & comparability with peer reporting (2) RTA 2014 Regional Peer Review https://www.rtachicago.com/plans-programs/performance-measures/peer-performance-reports Chart Data Sources: Federal Transit Administration National Transit Database (2015 data from Service Boards), U.S. Census Bureau Intercensal Population Estimates
TRANSIT TRIPS PER RESIDENT 1 Transit trips per resident is stable year-over-year but has trended downward since a peak in 2012
70
65
60
552006 2007 2008 2009 2010 2011 2012 2013 2014 2015
Growth Trend Annual Transit Trips per MSA Resident
2016
RTAChicago.org4
STRATEGIC PLAN PROGRESS REPORT
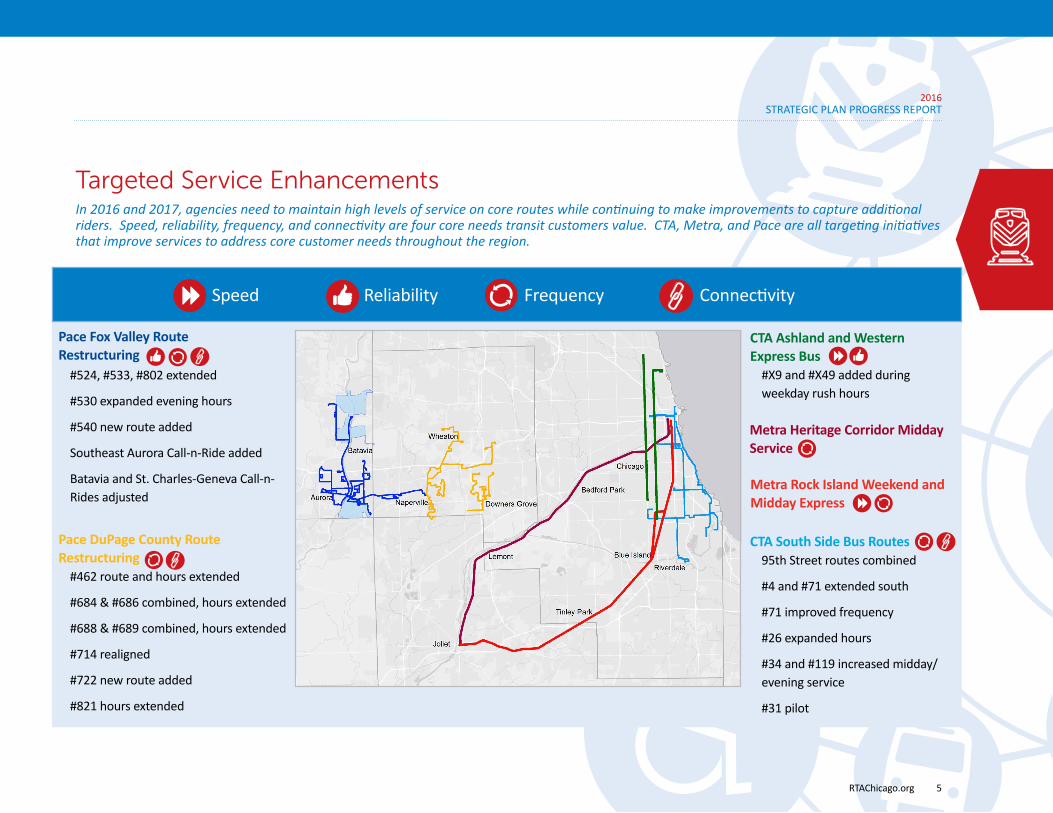
Targeted Service EnhancementsIn 2016 and 2017, agencies need to maintain high levels of service on core routes while continuing to make improvements to capture additional riders. Speed, reliability, frequency, and connectivity are four core needs transit customers value. CTA, Metra, and Pace are all targeting initiatives that improve services to address core customer needs throughout the region.
Pace Fox Valley RouteRestructuring
#524, #533, #802 extended
#530 expanded evening hours
#540 new route added
Southeast Aurora Call-n-Ride added
Batavia and St. Charles-Geneva Call-n-Rides adjusted
Pace DuPage County RouteRestructuring
#462 route and hours extended
#684 & #686 combined, hours extended
#688 & #689 combined, hours extended
#714 realigned
#722 new route added
#821 hours extended
CTA South Side Bus Routes95th Street routes combined
#4 and #71 extended south
#71 improved frequency
#26 expanded hours
#34 and #119 increased midday/evening service
#31 pilot
Metra Heritage Corridor MiddayService
Metra Rock Island Weekend and Midday Express
CTA Ashland and WesternExpress Bus
#X9 and #X49 added during weekday rush hours
Speed Reliability Frequency Connectivity
2016
RTAChicago.org 5
STRATEGIC PLAN PROGRESS REPORT

ENSURE FINANCIAL VIABILITYThe RTA is required by law to balance costs and revenue, a task that posed a significant challenge in 2015 due to the uncertainty of the State's finances. The agencies addressed the challenge and successfully sustained daily operations by selectively delaying construction projects.
The State FY16 began and ended without a full fiscal year budget. While the transit agencies received most operations funding through continuing appropriations, the State Reduced Fare Reimbursement was funded at half of budgeted levels, ADA Paratransit funding was reduced by 55%, several projects suffered administrative delays, and some construction projects slated to be funded through state bond funds were put on hold. These construction slow-downs were required to manage cash flow realities but delayed important maintenance projects. This strategy makes it difficult to retain the lowest operating cost per passenger mile of all peer regions in the U.S. and continue to operate reliable transit service. The RTA's AAA credit-rating allowed the agency to initiate short-term borrowing that supported the region's operating budget cash flow and bonding that supported the Service Board capital programs.
New York
Boston
Washington D.C.
Chicago
Philadelphia
Los Angeles
Miami
Atlanta
Houston
Dallas
$0.77
$0.73
$0.83
$1.03
$0.66
$0.68
$0.69
$0.74
$0.77
$0.59
OPERATIN
G CO
ST PER PASSEN
GER M
ILE (2014) 1
(1) RTA 2014 Regional Peer Review https://www.rtachicago.com/plans-programs/performance-measures/peer-performance-reports Chart Data Sources: Federal Transit Administration National Transit Database (2015 data from Service Boards)
2015-2016 ACTIONS• CTA completes project development
and enters the engineering phase for Red and Purple Modernization (RPM) Phase One
• CTA applies for $1 billion FTA Core Capacity grant for RPM Phase One construction
• Metra adjusts capital program using operating funds and TIGER grant to replace Fox River bridge, in partnership with Canadian Pacific
• Pace raises cash fares 25 cents to encourage greater use of Ventra card
• Metra implements fare increase to help fund system modernization and undertakes fare study
• Metra launches new Small Business Enterprise Program
2017 OUTLOOK• CTA to implement a supplemental
capital maintenance program to keep fleet operating at top performance
• Metra to apply for Positive Train Control (PTC) grant funds
• CTA to upgrade financial management Enterprise Resource Planning System and transit scheduling and route planning software
• Pace to control costs of ADA Paratransit service with new contracts
• Metra to continue its car and locomotive rehabilitation program
$0.00
$0.10
$0.20
$0.30
$0.40
$0.50
$0.60
$0.70
2006 2007 2008 2009 2010 2011 2012 2013 2014
Operating Costs Public Operating Funding
Fare & Other Revenues
COSTS AND REVENUES PER PASSENGER MILE ARE BALANCEDPublic operating
funding was increased through the 2008 RTA
Reform Legislation
In 2010 the least productive services
were cut to ensure cost effectiveness
2015
2016
RTAChicago.org6
STRATEGIC PLAN PROGRESS REPORT
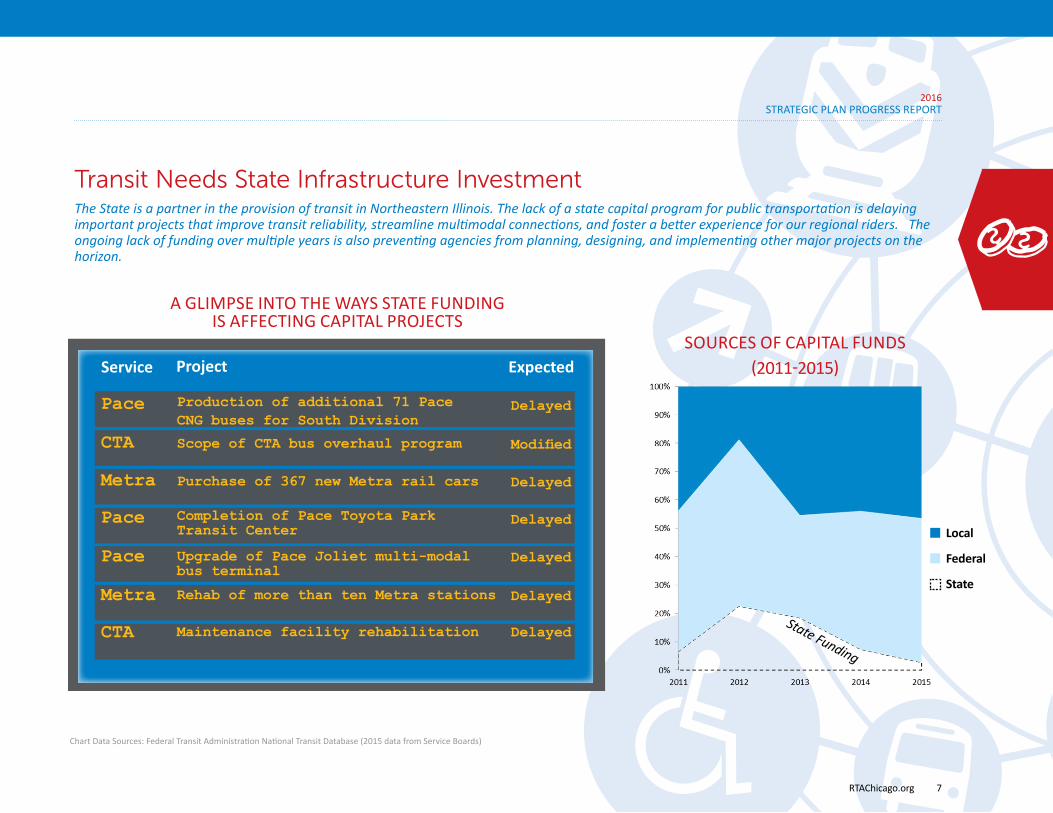
Transit Needs State Infrastructure InvestmentThe State is a partner in the provision of transit in Northeastern Illinois. The lack of a state capital program for public transportation is delaying important projects that improve transit reliability, streamline multimodal connections, and foster a better experience for our regional riders. The ongoing lack of funding over multiple years is also preventing agencies from planning, designing, and implementing other major projects on the horizon.
Chart Data Sources: Federal Transit Administration National Transit Database (2015 data from Service Boards)
• Production of additional 71 Pace CNG buses for South Division delayed
• Scope of CTA bus overhaul program modified
• Purchase of 357 new Metra rail cars delayed
• Completion of Pace Toyota Park Transit Center delayed
• Upgraded Pace Joliet multi-modal bus terminal delayed
• Rehab of more than ten Metra stations delayed
• Start of Pace transit planning studies in South suburbs and Joliet express bus service delayed
SOURCES OF CAPITAL FUNDS(2011-2015)
Local
Federal
State
State Funding
Service Project Expected
Pace Production of additional 71 Pace CNG buses for South Division
Delayed
CTA Scope of CTA bus overhaul program Modified
Metra Purchase of 367 new Metra rail cars Delayed
Pace Completion of Pace Toyota Park Transit Center
Delayed
Pace Upgrade of Pace Joliet multi-modal bus terminal
Delayed
Metra Rehab of more than ten Metra stations Delayed
CTA Maintenance facility rehabilitation Delayed
A GLIMPSE INTO THE WAYS STATE FUNDINGIS AFFECTING CAPITAL PROJECTS
2016
RTAChicago.org 7
STRATEGIC PLAN PROGRESS REPORT

PROMOTE A GREEN, LIVABLE AND PROSPEROUS REGIONTransit affects people's quality of life, from daily commuters to those dependent on it for all life activities. It connects communities, reduces traffic congestion, and provides access to jobs, schools, hospitals, and shopping. Transit also shapes the built environment, as the presence of a rail line or bus line allows developers to build with confidence knowing that future residents will have access to transportation whether or not they own a car.
The agencies worked this year to improve the transit experience and transit's carbon footprint. Innovations in the Ventra app, expanded real time travel information, and improvements in the RTA’s Travel Training Program make it easier to get around. The transit mode share for work trips remains on a ten-year growth trend, indicating that riding transit is an increasingly attractive way of commuting.
2015-2016 ACTIONS• CTA and City Colleges partnership
expands CTA’s Second Chance Program
• CTA continues to expand public art program
• Pace dedicates CNG facility, first 20 CNG buses delivered
• RTA, Metra, Amtrak, City of Chicago partner on Union Station redevelopment
• Metra allows pets on trains on weekends
• Metra recognized by AAR for safety initiatives - 4th consecutive year
• CTA awarded $3.6 million FTA grant to purchase all-electric buses
• RTA secures $5 million in funding for 11 Access to Transit projects
• CTA launches new system for real-time elevator status alerts
• RTA, Pace, and CTA kick off Flooding Resiliency Plan for bus operations
2017 OUTLOOK• Pace to expand I-90 service with
Tollway partnership• CTA to order more electric buses,
including charging stations• Pace to purchase additional CNG
buses, provided state capital program is funded
• Regional Transit Signal Priority (TSP) to be implemented
(1) Region definition changed from the 2014 Progress Report to now use Metropolitan Statistical Area (instead of 6-county area) for consistency across RTA reports & comparability with peer reporting and mode share data source changed from the 2015 Progress Report to now use ACS 1-year estimates for year-over-year reporting and U.S. Census Bureau discontinuation of ACS 3-year estimates (2) U.S. Census Bureau American Community Survey 1-year Estimates Chart Data Sources: U.S. Census Bureau American Community Survey 1-year Estimates
9%
10%
11%
12%
13%
2005 2006 2007 2008 2009 2010 2011 2012 2013
REGIONAL TRANSIT MODE SHARE FOR WORK TRIPS1
14%
2014
In 2014, transit mode share
for work trips continued to grow
in the region
Growth Trend Transit Mode Share Average
Washington D.C
Miami
Houston
New York
Los Angeles
Boston
Philadelphia
Chicago
Atlanta
Dallas
3.7%
3.1%
2.4%
1.6%
14.3%
12.9%
11.9%
9.7%
5.8%
TRAN
SIT MO
DE SH
ARE PEER CO
MPA
RISON
(2014) 2
31.1%
2016
RTAChicago.org8
STRATEGIC PLAN PROGRESS REPORT
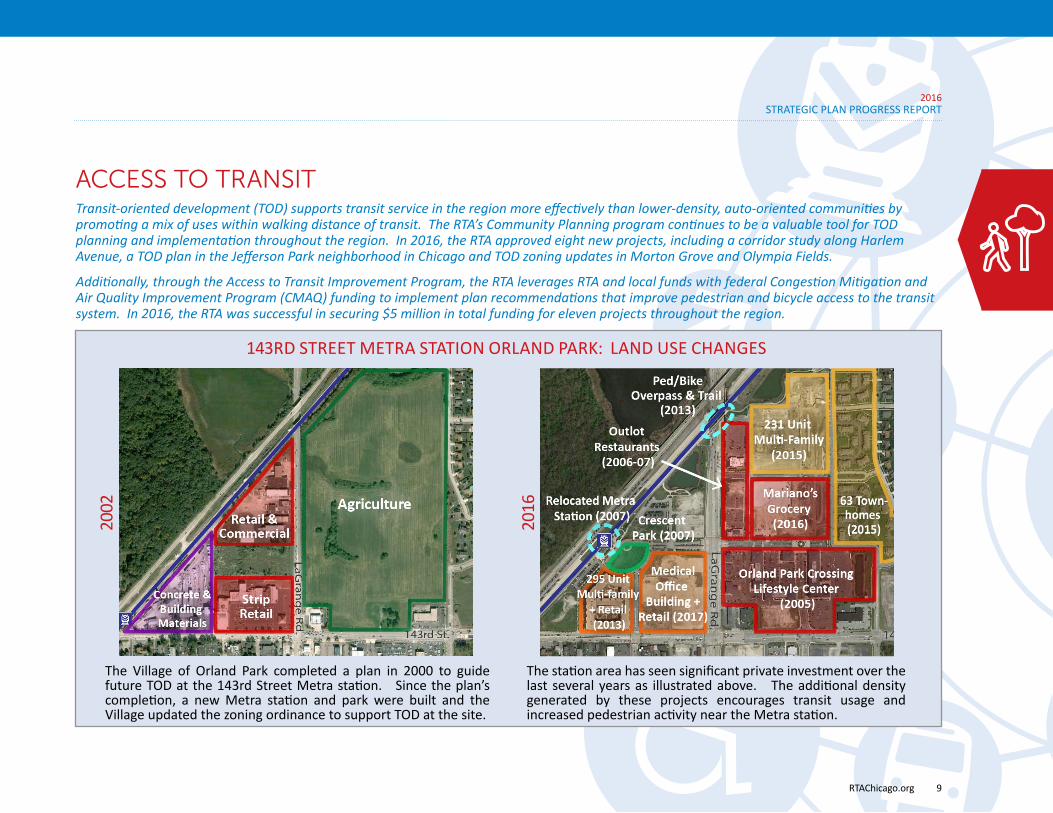
ACCESS TO TRANSITTransit-oriented development (TOD) supports transit service in the region more effectively than lower-density, auto-oriented communities by promoting a mix of uses within walking distance of transit. The RTA’s Community Planning program continues to be a valuable tool for TOD planning and implementation throughout the region. In 2016, the RTA approved eight new projects, including a corridor study along Harlem Avenue, a TOD plan in the Jefferson Park neighborhood in Chicago and TOD zoning updates in Morton Grove and Olympia Fields.
Additionally, through the Access to Transit Improvement Program, the RTA leverages RTA and local funds with federal Congestion Mitigation and Air Quality Improvement Program (CMAQ) funding to implement plan recommendations that improve pedestrian and bicycle access to the transit system. In 2016, the RTA was successful in securing $5 million in total funding for eleven projects throughout the region.
143RD STREET METRA STATION ORLAND PARK: LAND USE CHANGES
The Village of Orland Park completed a plan in 2000 to guide future TOD at the 143rd Street Metra station. Since the plan’s completion, a new Metra station and park were built and the Village updated the zoning ordinance to support TOD at the site.
The station area has seen significant private investment over the last several years as illustrated above. The additional density generated by these projects encourages transit usage and increased pedestrian activity near the Metra station.
2002
2016
2016
RTAChicago.org 9
STRATEGIC PLAN PROGRESS REPORT
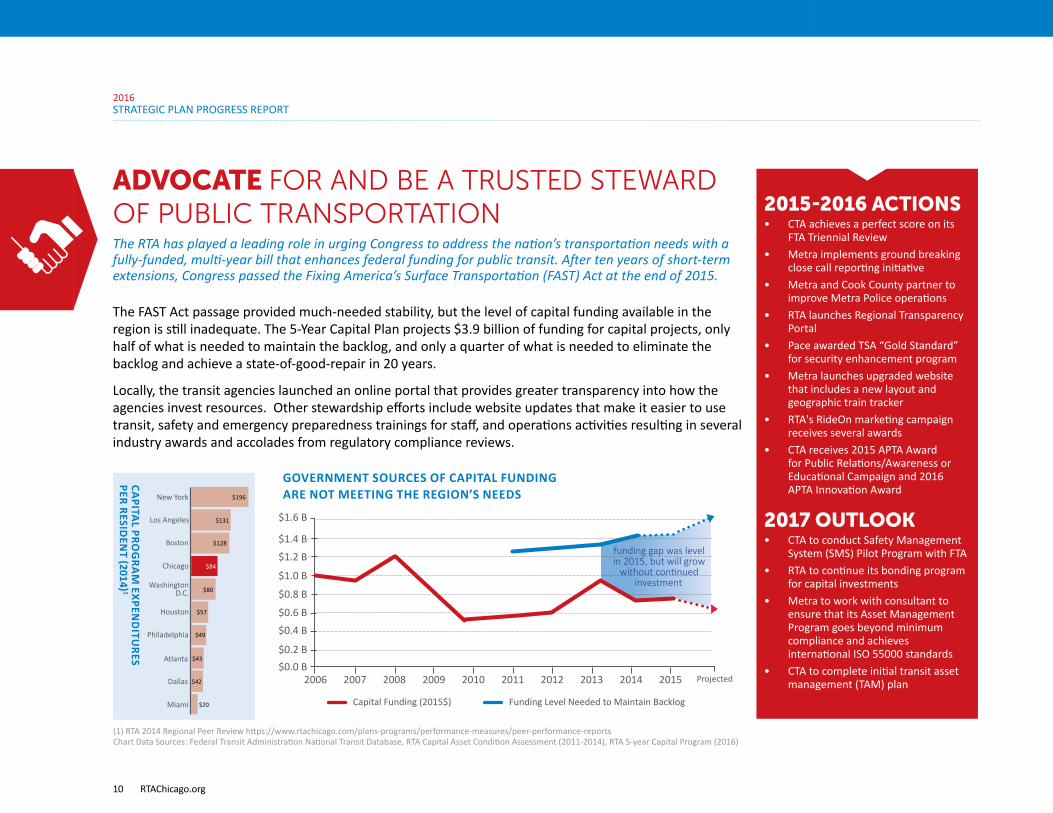
ADVOCATE FOR AND BE A TRUSTED STEWARD OF PUBLIC TRANSPORTATIONThe RTA has played a leading role in urging Congress to address the nation’s transportation needs with a fully-funded, multi-year bill that enhances federal funding for public transit. After ten years of short-term extensions, Congress passed the Fixing America’s Surface Transportation (FAST) Act at the end of 2015.
The FAST Act passage provided much-needed stability, but the level of capital funding available in the region is still inadequate. The 5-Year Capital Plan projects $3.9 billion of funding for capital projects, only half of what is needed to maintain the backlog, and only a quarter of what is needed to eliminate the backlog and achieve a state-of-good-repair in 20 years.
Locally, the transit agencies launched an online portal that provides greater transparency into how the agencies invest resources. Other stewardship efforts include website updates that make it easier to use transit, safety and emergency preparedness trainings for staff, and operations activities resulting in several industry awards and accolades from regulatory compliance reviews.
2015-2016 ACTIONS• CTA achieves a perfect score on its
FTA Triennial Review• Metra implements ground breaking
close call reporting initiative• Metra and Cook County partner to
improve Metra Police operations• RTA launches Regional Transparency
Portal• Pace awarded TSA “Gold Standard”
for security enhancement program• Metra launches upgraded website
that includes a new layout and geographic train tracker
• RTA's RideOn marketing campaign receives several awards
• CTA receives 2015 APTA Award for Public Relations/Awareness or Educational Campaign and 2016 APTA Innovation Award
2017 OUTLOOK• CTA to conduct Safety Management
System (SMS) Pilot Program with FTA• RTA to continue its bonding program
for capital investments• Metra to work with consultant to
ensure that its Asset Management Program goes beyond minimum compliance and achieves international ISO 55000 standards
• CTA to complete initial transit asset management (TAM) plan
(1) RTA 2014 Regional Peer Review https://www.rtachicago.com/plans-programs/performance-measures/peer-performance-reports Chart Data Sources: Federal Transit Administration National Transit Database, RTA Capital Asset Condition Assessment (2011-2014), RTA 5-year Capital Program (2016)
CAPITA
L PROG
RAM
EXPEND
ITURES
PER RESIDEN
T (2014) 1
Boston
Miami
Houston
New York
Los Angeles
Chicago
Philadelphia
Washington D.C.
Atlanta
Dallas
$196
$131
$84
$80
$57
$49
$128
$42
$20
$43
Capital Funding (2015$) Funding Level Needed to Maintain Backlog
2006 2007 2008 2009 2010 2011 2012 2013 2014 2015 Projected$0.0 B$0.2 B
$0.4 B
$0.6 B
$0.8 B
$1.0 B
$1.2 B
$1.4 B
$1.6 B
GOVERNMENT SOURCES OF CAPITAL FUNDING ARE NOT MEETING THE REGION’S NEEDS
funding gap was level in 2015, but will grow
without continued investment
2016
RTAChicago.org10
STRATEGIC PLAN PROGRESS REPORT

Funding Transit The five-year FAST Act package includes $61 billion for public transportation nationally, a moderate increase compared to previous funding levels. The RTA estimates that the increased levels of funding in this bill could translate to more than $250 million in additional formula funding for the region over a five year period. This gives CTA, Metra, and Pace some certainty in federal funding to plan for projects that maintain and enhance our region’s transit system. Ongoing support from federal, state, and local officials can propel the agencies toward modernization and ridership growth in the coming years.
FAST ACT HIGHLIGHTS FOR TRANSIT:• Increases FTA’s national State of Good Repair program funding to $2.68 billion annually by 2020• Provides $199 million in 2017 to help agencies like Metra implement Positive Train Control (PTC) technology• Planning for Transit Oriented Development (TOD) retains $10 million annual grant program and certain TOD projects can now tap into federal
financing programs (TIFIA, RIFF)• Reestablishes competitive grant program for buses and bus facilities
Transit Investment at the federal level reduces U.S. consumer costs on gasoline by $10 billion annually and mitigates the release of 37 million metric tons of personal vehicle CO2 emissions1.
Transit Investment at the state level attracts businesses to Illinois, speeds intrastate commerce by reducing congestion, ensures accessible mobility for residents, and provides access to jobs thus reducing reliance on social services.
Transit Investment at the local level improves quality of life for all, removes barriers to opportunities, and creates equity for everyone who cannot afford or chooses not to own a car.
FEDERAL STATE LOCAL
(1) 2015 APTA Factbook http://www.apta.com/resources/statistics/Documents/FactBook/2015-APTA-Fact-Book.pdf
2016
RTAChicago.org 11
STRATEGIC PLAN PROGRESS REPORT
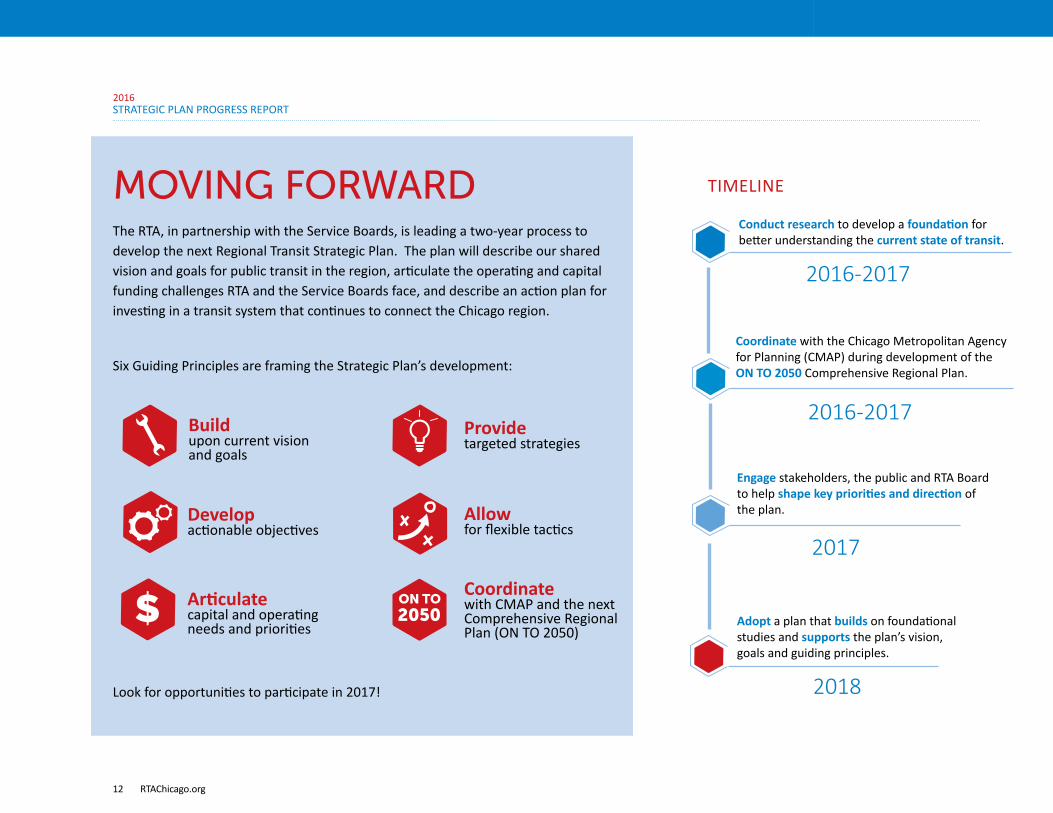
MOVING FORWARDThe RTA, in partnership with the Service Boards, is leading a two-year process to develop the next Regional Transit Strategic Plan. The plan will describe our shared vision and goals for public transit in the region, articulate the operating and capital funding challenges RTA and the Service Boards face, and describe an action plan for investing in a transit system that continues to connect the Chicago region.
Six Guiding Principles are framing the Strategic Plan’s development:
Look for opportunities to participate in 2017!
Build upon current vision and goals
Develop actionable objectives
Provide targeted strategies
Allow for flexible tactics
Articulate capital and operating needs and priorities
Coordinate with CMAP and the next Comprehensive Regional Plan (ON TO 2050)
2050ON TO
Conduct research to develop a foundation for better understanding the current state of transit.
2016-2017
Coordinate with the Chicago Metropolitan Agency for Planning (CMAP) during development of the ON TO 2050 Comprehensive Regional Plan.
2016-2017
Engage stakeholders, the public and RTA Board to help shape key priorities and direction of the plan.
2017
2018
Adopt a plan that builds on foundational studies and supports the plan’s vision, goals and guiding principles.
TIMELINE
2016
RTAChicago.org12
STRATEGIC PLAN PROGRESS REPORT
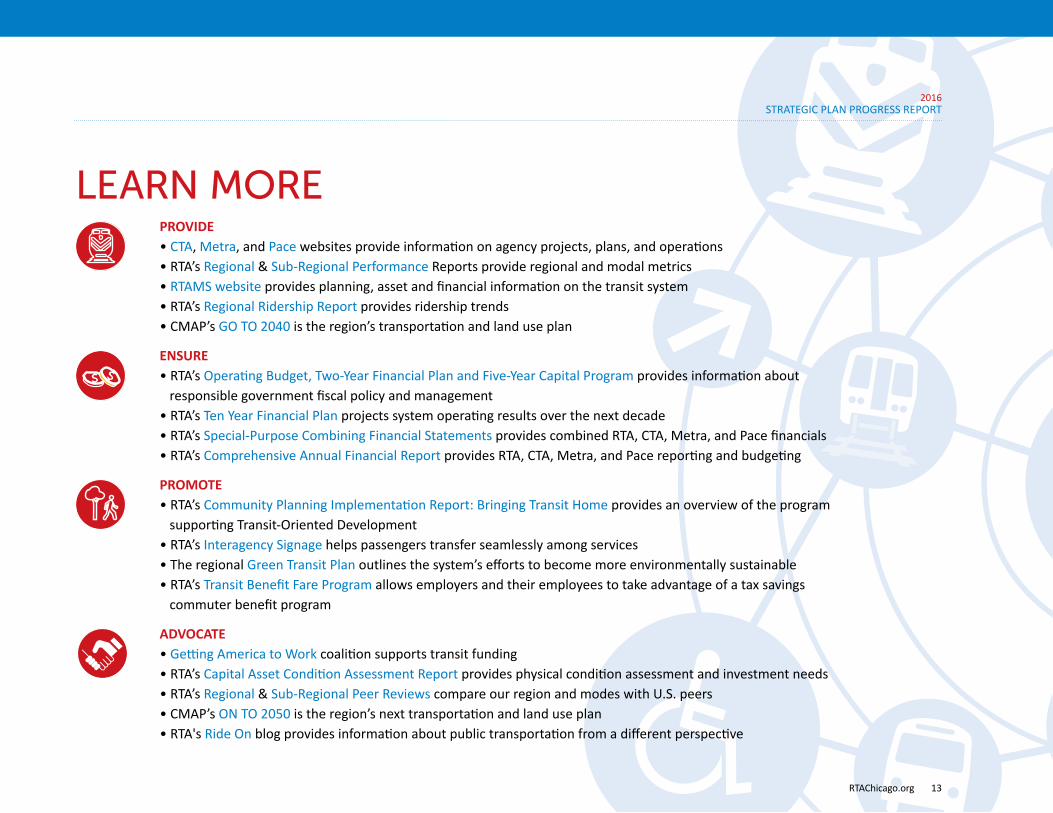
LEARN MORE PROVIDE
• CTA, Metra, and Pace websites provide information on agency projects, plans, and operations • RTA’s Regional & Sub-Regional Performance Reports provide regional and modal metrics • RTAMS website provides planning, asset and financial information on the transit system • RTA’s Regional Ridership Report provides ridership trends • CMAP’s GO TO 2040 is the region’s transportation and land use plan
ENSURE • RTA’s Operating Budget, Two-Year Financial Plan and Five-Year Capital Program provides information about responsible government fiscal policy and management • RTA’s Ten Year Financial Plan projects system operating results over the next decade • RTA’s Special-Purpose Combining Financial Statements provides combined RTA, CTA, Metra, and Pace financials • RTA’s Comprehensive Annual Financial Report provides RTA, CTA, Metra, and Pace reporting and budgeting
PROMOTE • RTA’s Community Planning Implementation Report: Bringing Transit Home provides an overview of the program supporting Transit-Oriented Development • RTA’s Interagency Signage helps passengers transfer seamlessly among services • The regional Green Transit Plan outlines the system’s efforts to become more environmentally sustainable • RTA’s Transit Benefit Fare Program allows employers and their employees to take advantage of a tax savings commuter benefit program
ADVOCATE • Getting America to Work coalition supports transit funding • RTA’s Capital Asset Condition Assessment Report provides physical condition assessment and investment needs • RTA’s Regional & Sub-Regional Peer Reviews compare our region and modes with U.S. peers• CMAP’s ON TO 2050 is the region’s next transportation and land use plan• RTA's Ride On blog provides information about public transportation from a different perspective
2016
RTAChicago.org 13
STRATEGIC PLAN PROGRESS REPORT

www.RTAChicago.org
RTA Administration Offices 175 West Jackson Boulevard, Suite 1650 Chicago, Illinois 60604
Phone: 312-913-3200
Follow us on social media
ChicagoRTA @RTA_Chicagorideonrtachicago.com