
Progress and Outcomes Report for Webb County … and Outcomes Report for Webb County Head Start...
32
Webb County Head Start Program Progress and Outcomes Report for Webb County Head Start Program Demographic Breakdown: Complete class Based on The Creative Curriculum® Developmental Continuum July 9, 2010 Printed on: This report covers 3 to 4 year olds and 4 to 5 year olds Reporting Period: Fall/Winter/Spring of School Year 2009-2010
Transcript of Progress and Outcomes Report for Webb County … and Outcomes Report for Webb County Head Start...
Webb County Head Start Program
Progress and Outcomes Report
for Webb County Head Start
Program
Demographic Breakdown: Complete class
Based on The Creative Curriculum® Developmental Continuum
July 9, 2010Printed on:
This report covers 3 to 4 year olds and 4 to 5 year olds
Reporting Period: Fall/Winter/Spring of School Year 2009-2010
Page 2 of 32Progress and Outcomes Report for Webb County Head Start Program
Webb County Head Start ProgramProgress and Outcomes Report
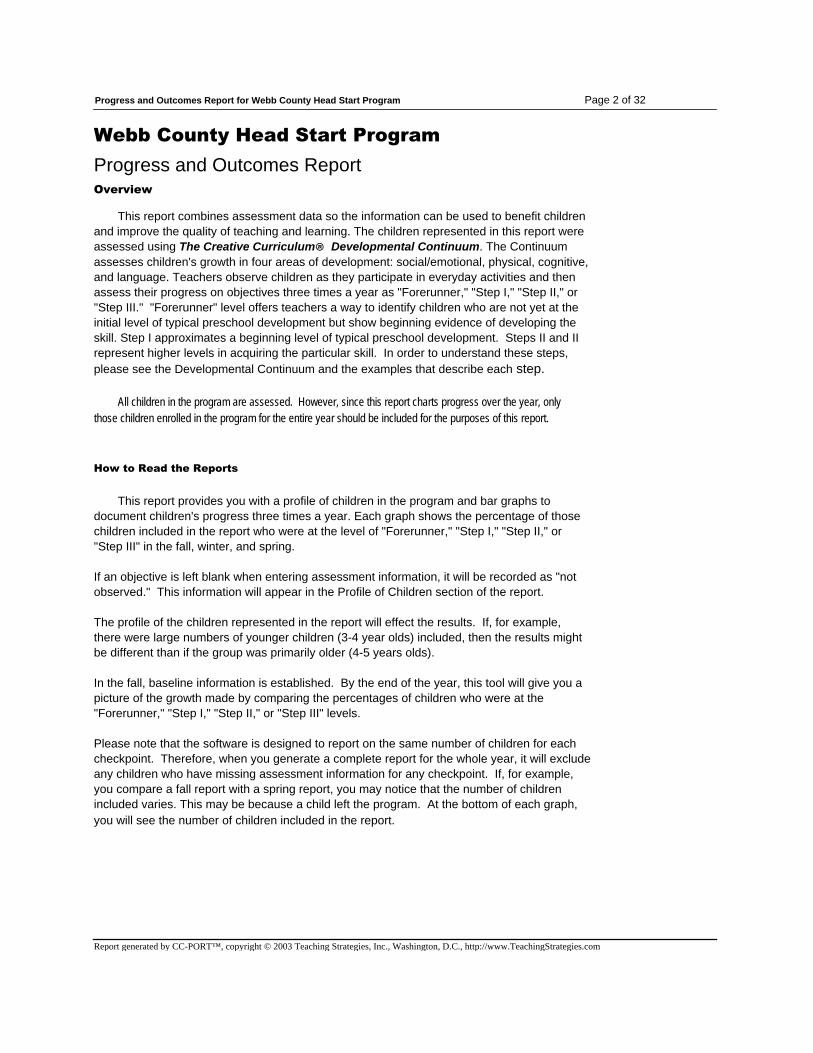
Overview
This report combines assessment data so the information can be used to benefit children
and improve the quality of teaching and learning. The children represented in this report were
assessed using The Creative Curriculum® Developmental Continuum. The Continuum
assesses children's growth in four areas of development: social/emotional, physical, cognitive,
and language. Teachers observe children as they participate in everyday activities and then
assess their progress on objectives three times a year as "Forerunner," "Step I," "Step II," or
"Step III." "Forerunner" level offers teachers a way to identify children who are not yet at the
initial level of typical preschool development but show beginning evidence of developing the
skill. Step I approximates a beginning level of typical preschool development. Steps II and II
represent higher levels in acquiring the particular skill. In order to understand these steps,
please see the Developmental Continuum and the examples that describe each step.
All children in the program are assessed. However, since this report charts progress over the year, only
those children enrolled in the program for the entire year should be included for the purposes of this report.
How to Read the Reports
This report provides you with a profile of children in the program and bar graphs to
document children's progress three times a year. Each graph shows the percentage of those
children included in the report who were at the level of "Forerunner," "Step I," "Step II," or
"Step III" in the fall, winter, and spring.
If an objective is left blank when entering assessment information, it will be recorded as "not
observed." This information will appear in the Profile of Children section of the report.
The profile of the children represented in the report will effect the results. If, for example,
there were large numbers of younger children (3-4 year olds) included, then the results might
be different than if the group was primarily older (4-5 years olds).
In the fall, baseline information is established. By the end of the year, this tool will give you a
picture of the growth made by comparing the percentages of children who were at the
"Forerunner," "Step I," "Step II," or "Step III" levels.
Please note that the software is designed to report on the same number of children for each
checkpoint. Therefore, when you generate a complete report for the whole year, it will exclude
any children who have missing assessment information for any checkpoint. If, for example,
you compare a fall report with a spring report, you may notice that the number of children
included varies. This may be because a child left the program. At the bottom of each graph,
you will see the number of children included in the report.
Report generated by CC-PORT™, copyright © 2003 Teaching Strategies, Inc., Washington, D.C., http://www.TeachingStrategies.com
Page 3 of 32Progress and Outcomes Report for Webb County Head Start Program
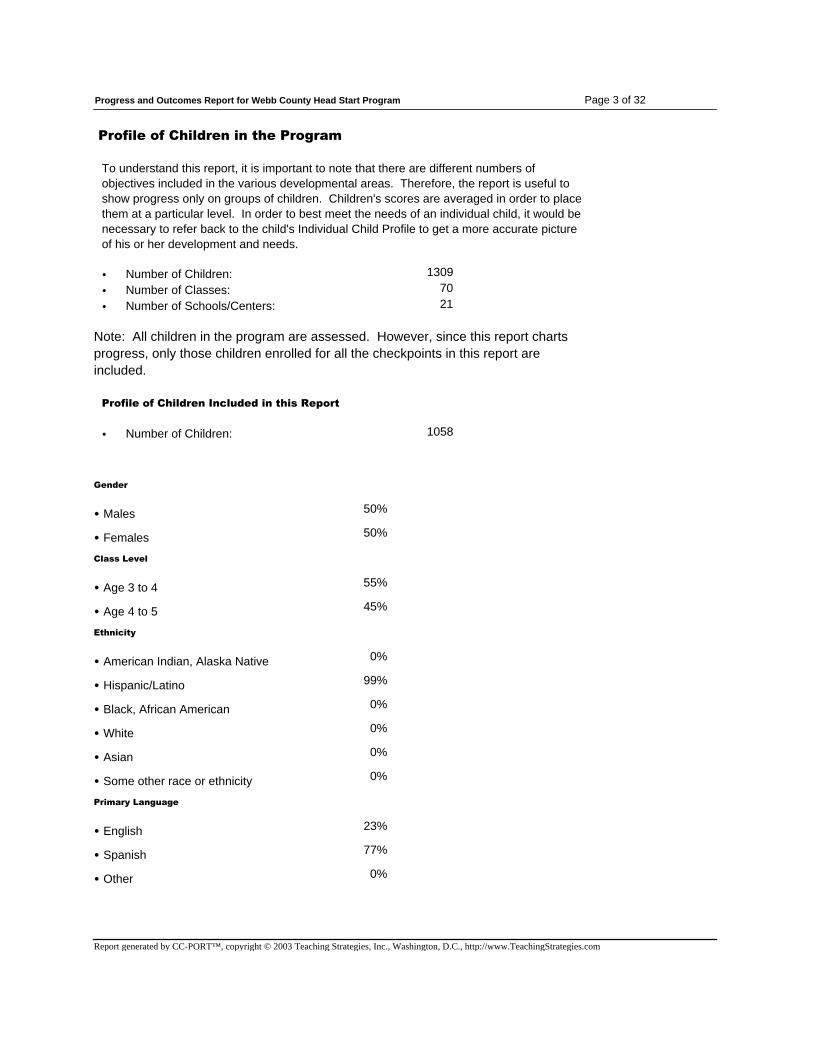
Profile of Children in the Program
To understand this report, it is important to note that there are different numbers of
objectives included in the various developmental areas. Therefore, the report is useful to
show progress only on groups of children. Children's scores are averaged in order to place
them at a particular level. In order to best meet the needs of an individual child, it would be
necessary to refer back to the child's Individual Child Profile to get a more accurate picture
of his or her development and needs.
• Number of Children:
• Number of Classes:
• Number of Schools/Centers:
1309
70
21
Note: All children in the program are assessed. However, since this report charts
progress, only those children enrolled for all the checkpoints in this report are
included.
Profile of Children Included in this Report
• Number of Children: 1058
Gender
• Males
50%
• Females
50%
Class Level
• Age 3 to 4
55%
• Age 4 to 5
45%
Ethnicity
• American Indian, Alaska Native
0%
• Hispanic/Latino
99%
• Black, African American
0%
• White
0%
• Asian
0%
• Some other race or ethnicity
0%
Primary Language
• English
23%
• Spanish
77%
• Other
0%
Report generated by CC-PORT™, copyright © 2003 Teaching Strategies, Inc., Washington, D.C., http://www.TeachingStrategies.com

Page 4 of 32Progress and Outcomes Report for Webb County Head Start Program
Understanding the Completion Rate for This Report
Completion Rate for The Creative Curriculum Developmental
Areas
There are a different number of objectives included in each developmental area on
Developmental Continuum. For example, in the area of Social/Emotional Development, there
are 13 objectives, and for Physical Development, there are 8 objectives. In CC-PORT, the
teacher records a checkmark for each objective observed for each child. Sometimes,
however, a teacher may not have marked a response for a given objective for a child. This
chart shows the percentage of objectives that are checked in each area for the group as a
whole. The figures do not represent percentages of children; rather they are percentages of
responses completed. Administrators can use this chart as a means of quality control.
Number of
Objectives
Potential
Total
Responses
Number of
Responses
Recorded
% of Total
Responses
Creative Curriculum Developmental
Areas
Social-Emotional Development 41262 23891 57.90% 13
Physical Development 25392 21927 86.35% 8
Cognitive Development 50784 27492 54.14% 16
Language Development 41262 22352 54.17% 13
OVERALL PROGRESS 158700 95662 60.28% 50
Report generated by CC-PORT™, copyright © 2003 Teaching Strategies, Inc., Washington, D.C., http://www.TeachingStrategies.com
Page 5 of 32Progress and Outcomes Report for Webb County Head Start Program
Number of
Objectives
Potential
Total
Responses
Number of
Responses
Recorded
% of Total
Responses
Head Start Developmental Areas
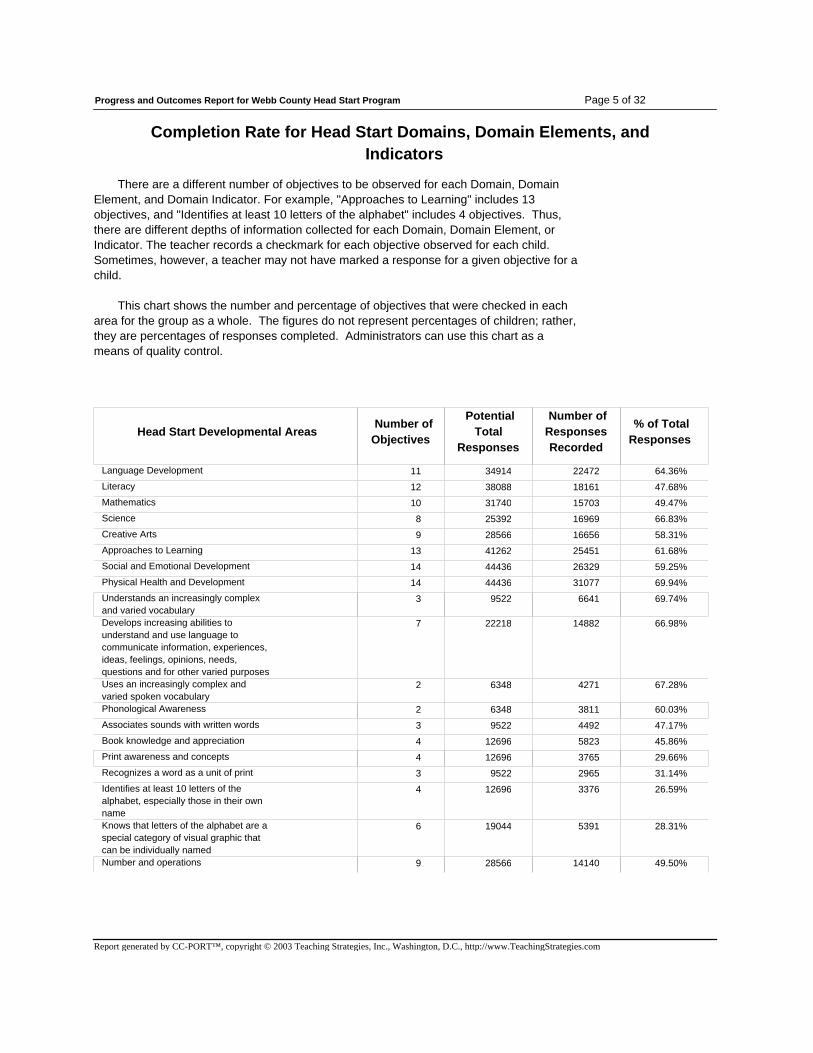
Completion Rate for Head Start Domains, Domain Elements, and
Indicators
There are a different number of objectives to be observed for each Domain, Domain
Element, and Domain Indicator. For example, "Approaches to Learning" includes 13
objectives, and "Identifies at least 10 letters of the alphabet" includes 4 objectives. Thus,
there are different depths of information collected for each Domain, Domain Element, or
Indicator. The teacher records a checkmark for each objective observed for each child.
Sometimes, however, a teacher may not have marked a response for a given objective for a
child.
This chart shows the number and percentage of objectives that were checked in each
area for the group as a whole. The figures do not represent percentages of children; rather,
they are percentages of responses completed. Administrators can use this chart as a
means of quality control.
Language Development 34914 22472 64.36% 11
Literacy 38088 18161 47.68% 12
Mathematics 31740 15703 49.47% 10
Science 25392 16969 66.83% 8
Creative Arts 28566 16656 58.31% 9
Approaches to Learning 41262 25451 61.68% 13
Social and Emotional Development 44436 26329 59.25% 14
Physical Health and Development 44436 31077 69.94% 14
Understands an increasingly complex
and varied vocabulary
9522 6641 69.74% 3
Develops increasing abilities to
understand and use language to
communicate information, experiences,
ideas, feelings, opinions, needs,
questions and for other varied purposes
22218 14882 66.98% 7
Uses an increasingly complex and
varied spoken vocabulary
6348 4271 67.28% 2
Phonological Awareness 6348 3811 60.03% 2
Associates sounds with written words 9522 4492 47.17% 3
Book knowledge and appreciation 12696 5823 45.86% 4
Print awareness and concepts 12696 3765 29.66% 4
Recognizes a word as a unit of print 9522 2965 31.14% 3
Identifies at least 10 letters of the
alphabet, especially those in their own
name
12696 3376 26.59% 4
Knows that letters of the alphabet are a
special category of visual graphic that
can be individually named
19044 5391 28.31% 6
Number and operations 28566 14140 49.50% 9
Report generated by CC-PORT™, copyright © 2003 Teaching Strategies, Inc., Washington, D.C., http://www.TeachingStrategies.com
Page 6 of 32Progress and Outcomes Report for Webb County Head Start Program
List of Progress Reports
Creative Curriculum® Developmental Areas
• Overall Development
• Social/Emotional Development
• Cognitive Development
• Physical Development
• Language Development
• Domain: Language Development
• Domain: Literacy
• Domain: Mathematics
• Domain: Science
• Domain: Creative Arts
• Domain: Approaches to Learning
• Domain: Social & Emotional Development
• Domain: Physical Health and Development
• Indicator: Understands an increasingly complex and varied vocabulary
• Indicator: Develops increasing abilities to understand and use language to
communicate information, experiences, ideas, feelings, opinions, needs,
questions and for other varied purposes
• Indicator: Uses an increasingly complex and varied spoken vocabulary
• Domain Element: Phonological Awareness
• Indicator: Associates sounds with written words
• Domain Element: Book knowledge and appreciation
• Domain Element: Print awareness and concepts
• Indicator: Recognizes a word as a unit of print
• Indicator: Identifies at least 10 letters of the alphabet, especially those in
own name
• Indicator: Knows that letters of the alphabet are a special category of
visual graphics that can be individually named
• Domain Element: Number and operations
Progress On Head Start Performance Domains, Elements And Indicators
Report generated by CC-PORT™, copyright © 2003 Teaching Strategies, Inc., Washington, D.C., http://www.TeachingStrategies.com
Page 7 of 32Progress and Outcomes Report for Webb County Head Start Program
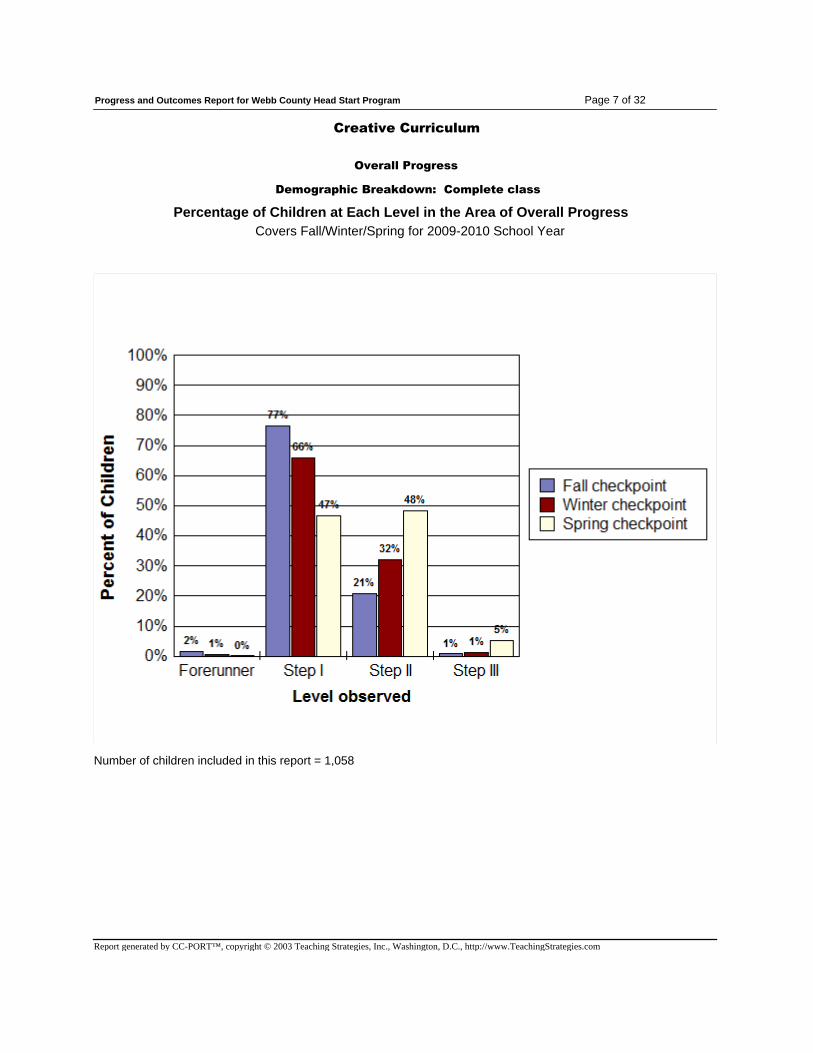
Creative Curriculum
Overall Progress
Demographic Breakdown: Complete class
Percentage of Children at Each Level in the Area of Overall Progress
Covers Fall/Winter/Spring for 2009-2010 School Year
Number of children included in this report = 1,058
Report generated by CC-PORT™, copyright © 2003 Teaching Strategies, Inc., Washington, D.C., http://www.TeachingStrategies.com
Page 8 of 32Progress and Outcomes Report for Webb County Head Start Program
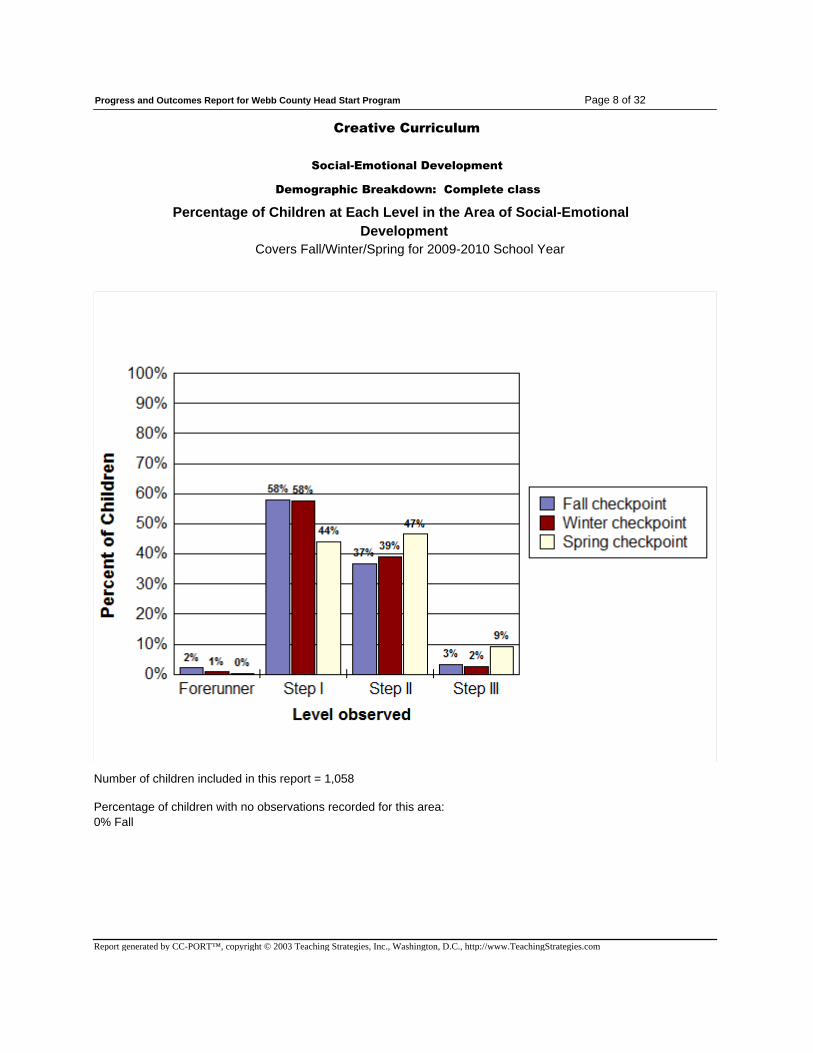
Creative Curriculum
Social-Emotional Development
Demographic Breakdown: Complete class
Percentage of Children at Each Level in the Area of Social-Emotional
Development
Covers Fall/Winter/Spring for 2009-2010 School Year
Percentage of children with no observations recorded for this area:
0% Fall
Number of children included in this report = 1,058
Report generated by CC-PORT™, copyright © 2003 Teaching Strategies, Inc., Washington, D.C., http://www.TeachingStrategies.com

Page 9 of 32Progress and Outcomes Report for Webb County Head Start Program
Creative Curriculum
Physical Development
Demographic Breakdown: Complete class
Percentage of Children at Each Level in the Area of Physical
Development
Covers Fall/Winter/Spring for 2009-2010 School Year
Percentage of children with no observations recorded for this area:
0% Fall
Number of children included in this report = 1,058
Report generated by CC-PORT™, copyright © 2003 Teaching Strategies, Inc., Washington, D.C., http://www.TeachingStrategies.com

Page 10 of 32Progress and Outcomes Report for Webb County Head Start Program
Creative Curriculum
Cognitive Development
Demographic Breakdown: Complete class
Percentage of Children at Each Level in the Area of Cognitive
Development
Covers Fall/Winter/Spring for 2009-2010 School Year
Percentage of children with no observations recorded for this area:
0% Fall
Number of children included in this report = 1,058
Report generated by CC-PORT™, copyright © 2003 Teaching Strategies, Inc., Washington, D.C., http://www.TeachingStrategies.com

Page 11 of 32Progress and Outcomes Report for Webb County Head Start Program
Creative Curriculum
Language Development
Demographic Breakdown: Complete class
Percentage of Children at Each Level in the Area of Language
Development
Covers Fall/Winter/Spring for 2009-2010 School Year
Percentage of children with no observations recorded for this area:
0% Fall 0% Spring
Number of children included in this report = 1,058
Report generated by CC-PORT™, copyright © 2003 Teaching Strategies, Inc., Washington, D.C., http://www.TeachingStrategies.com

Page 12 of 32Progress and Outcomes Report for Webb County Head Start Program
Progress on Head Start Child Outcomes Framework Domains,
Domain Elements, and Indicators*
Each Head Start program is required to have in place an assessment system and approach to
reporting outcomes for groups of children. The following reports cover each of eight Head
Start Domains of learning and development.
• Language Development
• Literacy
• Mathematics
• Science
• Creative Arts
• Approaches to Learning
• Social and Emotional Development
• Physical Health and Development
In addition, because they are legislatively mandated, programs must gather and analyze
data on specific Domain Elements and/or Indicators:*
• Understands an increasingly complex and varied vocabulary (Indicator)
• Develops increasing abilities to understand and use language to communicate
information, experiences, ideas, feelings, opinions, needs, questions and for other
varied purposes (Indicator)
• Uses an increasingly complex and varied spoken vocabulary (Indicator)
• Phonological Awareness (Domain Element)
• Associates sounds with written words (Indicator)
• Book knowledge and appreciation (Domain Element)
• Print awareness and concepts (Domain Element)
• Recognizes a word as a unit of print (Indicator)
• Identifies at least 10 letters of the alphabet, especially those in their own name.
(Indicator)
• Knows that letters of the alphabet are a special category of visual graphic that can be
individually named (Indicator)
• Number and operations (Domain Element)
• The remainder of this report will address these reporting requirements. There are also
two areas on learning English that this report does not address.
• For non-English-speaking children, progresses in listening to and understanding English
(Indicator)'
• For non-English-speaking children, progresses in speaking English (Indicator)
*Please note, for children whose first language is not English, The Creative Curriculum® Developmental
Continuum does not assess a child's progress toward acquisition of English. Thus, this reporting tool does not
provide information about progress in this area.
Report generated by CC-PORT™, copyright © 2003 Teaching Strategies, Inc., Washington, D.C., http://www.TeachingStrategies.com

Page 13 of 32Progress and Outcomes Report for Webb County Head Start Program
Head Start
Domain : Language Development
Demographic Breakdown: Complete class
Percentage of Children at Each Level in Domain : Language
Development
Covers Fall/Winter/Spring for 2009-2010 School Year
Percentage of children with no observations recorded for this area:
0% Fall
Number of children included in this report = 1,058
Report generated by CC-PORT™, copyright © 2003 Teaching Strategies, Inc., Washington, D.C., http://www.TeachingStrategies.com
Page 14 of 32Progress and Outcomes Report for Webb County Head Start Program
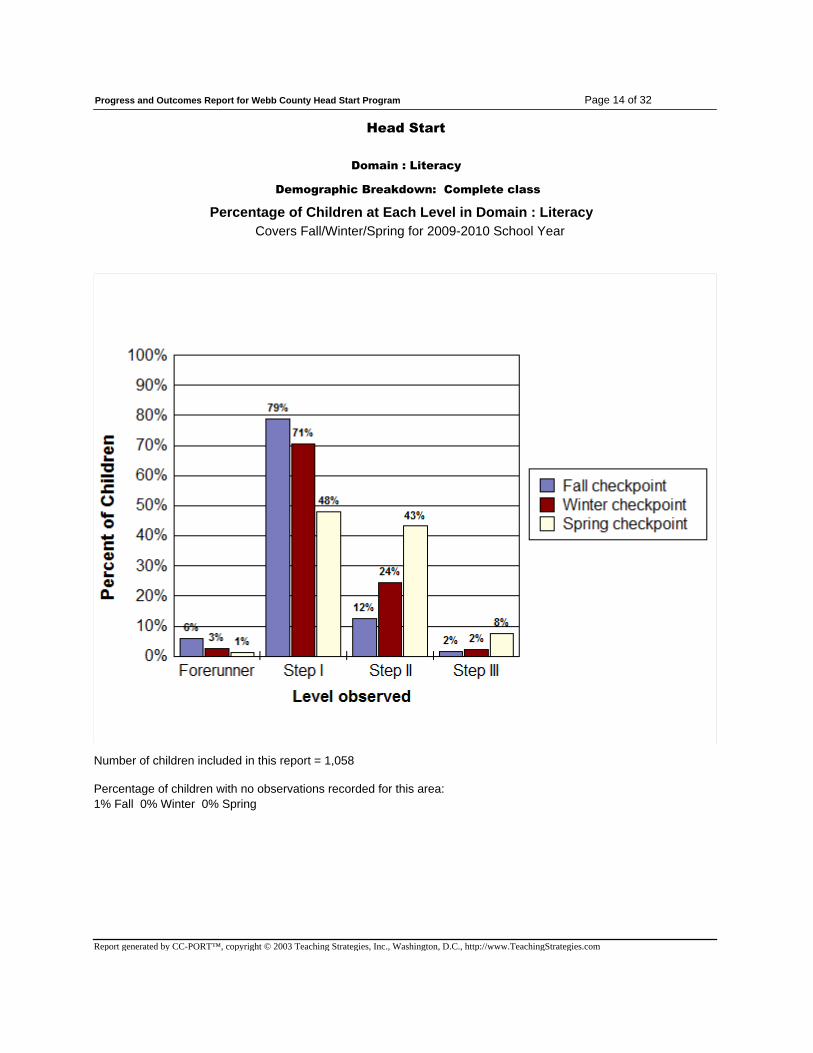
Head Start
Domain : Literacy
Demographic Breakdown: Complete class
Percentage of Children at Each Level in Domain : Literacy
Covers Fall/Winter/Spring for 2009-2010 School Year
Percentage of children with no observations recorded for this area:
1% Fall 0% Winter 0% Spring
Number of children included in this report = 1,058
Report generated by CC-PORT™, copyright © 2003 Teaching Strategies, Inc., Washington, D.C., http://www.TeachingStrategies.com

Page 15 of 32Progress and Outcomes Report for Webb County Head Start Program
Head Start
Domain : Mathematics
Demographic Breakdown: Complete class
Percentage of Children at Each Level in Domain : Mathematics
Covers Fall/Winter/Spring for 2009-2010 School Year
Percentage of children with no observations recorded for this area:
4% Fall 1% Winter
Number of children included in this report = 1,058
Report generated by CC-PORT™, copyright © 2003 Teaching Strategies, Inc., Washington, D.C., http://www.TeachingStrategies.com

Page 16 of 32Progress and Outcomes Report for Webb County Head Start Program
Head Start
Domain : Science
Demographic Breakdown: Complete class
Percentage of Children at Each Level in Domain : Science
Covers Fall/Winter/Spring for 2009-2010 School Year
Percentage of children with no observations recorded for this area:
1% Fall
Number of children included in this report = 1,058
Report generated by CC-PORT™, copyright © 2003 Teaching Strategies, Inc., Washington, D.C., http://www.TeachingStrategies.com
Page 17 of 32Progress and Outcomes Report for Webb County Head Start Program
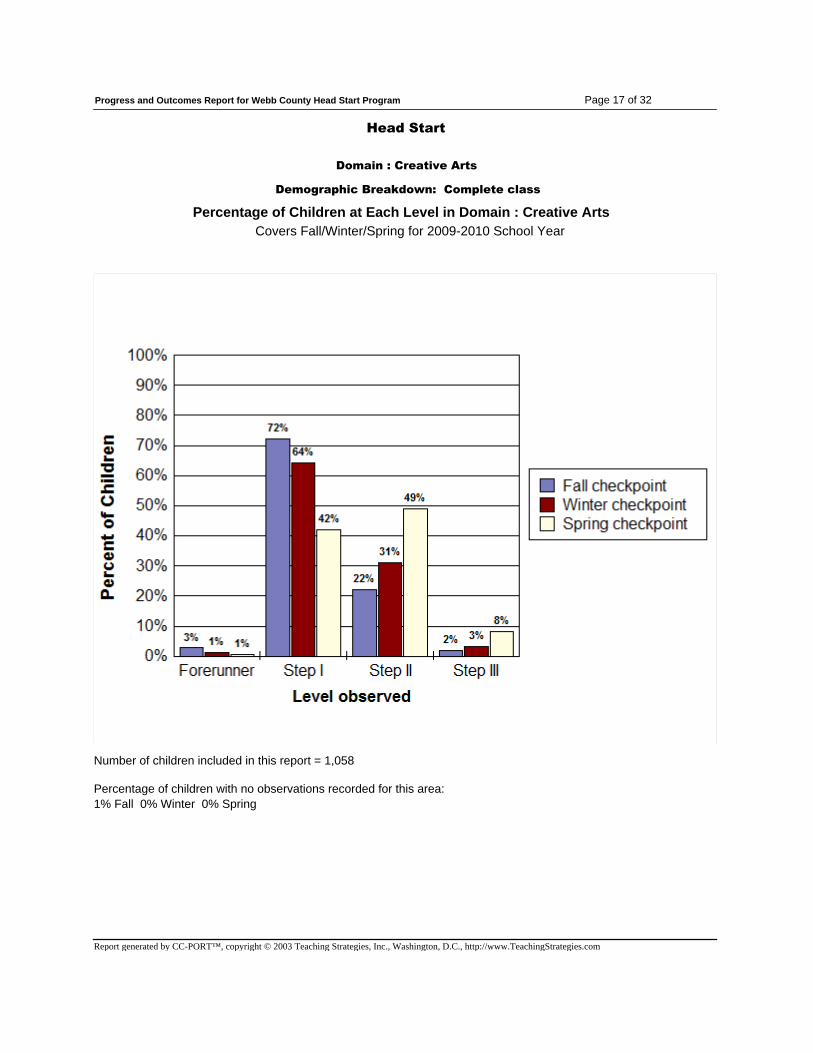
Head Start
Domain : Creative Arts
Demographic Breakdown: Complete class
Percentage of Children at Each Level in Domain : Creative Arts
Covers Fall/Winter/Spring for 2009-2010 School Year
Percentage of children with no observations recorded for this area:
1% Fall 0% Winter 0% Spring
Number of children included in this report = 1,058
Report generated by CC-PORT™, copyright © 2003 Teaching Strategies, Inc., Washington, D.C., http://www.TeachingStrategies.com
Page 18 of 32Progress and Outcomes Report for Webb County Head Start Program
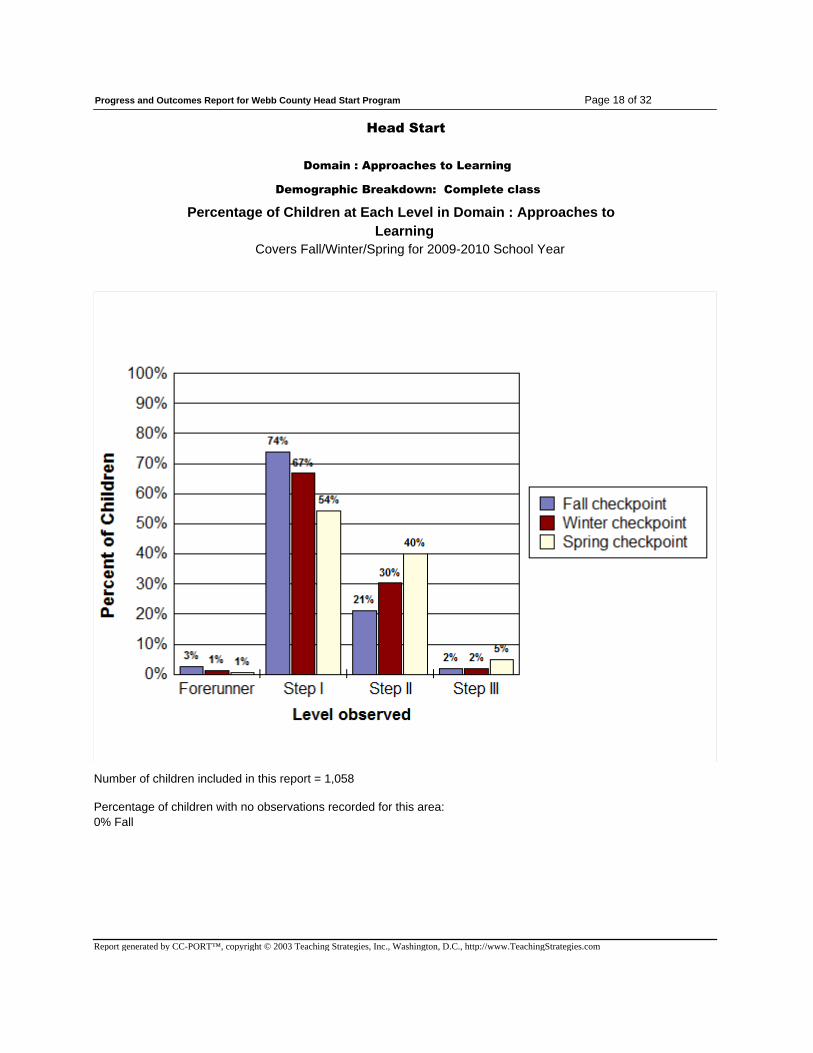
Head Start
Domain : Approaches to Learning
Demographic Breakdown: Complete class
Percentage of Children at Each Level in Domain : Approaches to
Learning
Covers Fall/Winter/Spring for 2009-2010 School Year
Percentage of children with no observations recorded for this area:
0% Fall
Number of children included in this report = 1,058
Report generated by CC-PORT™, copyright © 2003 Teaching Strategies, Inc., Washington, D.C., http://www.TeachingStrategies.com

Page 19 of 32Progress and Outcomes Report for Webb County Head Start Program
Head Start
Domain : Social and Emotional Development
Demographic Breakdown: Complete class
Percentage of Children at Each Level in Domain : Social and
Emotional Development
Covers Fall/Winter/Spring for 2009-2010 School Year
Percentage of children with no observations recorded for this area:
0% Fall
Number of children included in this report = 1,058
Report generated by CC-PORT™, copyright © 2003 Teaching Strategies, Inc., Washington, D.C., http://www.TeachingStrategies.com

Page 20 of 32Progress and Outcomes Report for Webb County Head Start Program
Head Start
Domain : Physical Health and Development
Demographic Breakdown: Complete class
Percentage of Children at Each Level in Domain : Physical Health
and Development
Covers Fall/Winter/Spring for 2009-2010 School Year
Percentage of children with no observations recorded for this area:
0% Fall
Number of children included in this report = 1,058
Report generated by CC-PORT™, copyright © 2003 Teaching Strategies, Inc., Washington, D.C., http://www.TeachingStrategies.com
Page 21 of 32Progress and Outcomes Report for Webb County Head Start Program
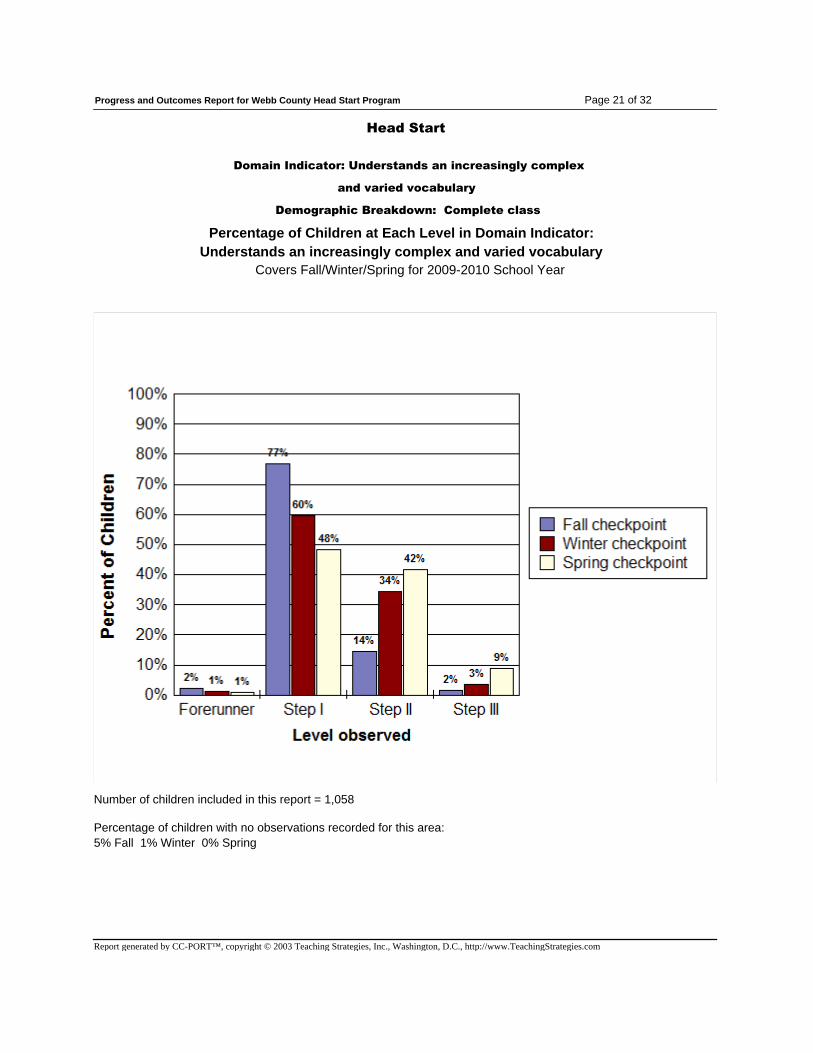
Head Start
Domain Indicator: Understands an increasingly complex
and varied vocabulary
Demographic Breakdown: Complete class
Percentage of Children at Each Level in Domain Indicator:
Understands an increasingly complex and varied vocabulary
Covers Fall/Winter/Spring for 2009-2010 School Year
Percentage of children with no observations recorded for this area:
5% Fall 1% Winter 0% Spring
Number of children included in this report = 1,058
Report generated by CC-PORT™, copyright © 2003 Teaching Strategies, Inc., Washington, D.C., http://www.TeachingStrategies.com
Page 22 of 32Progress and Outcomes Report for Webb County Head Start Program
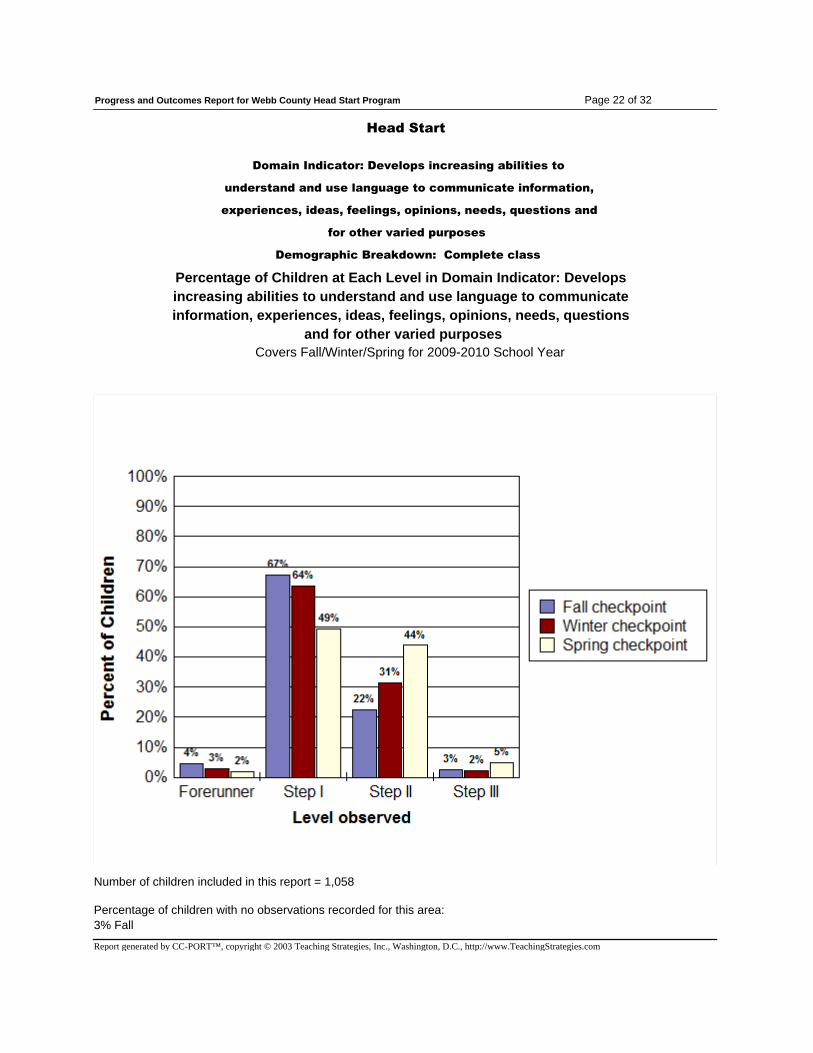
Head Start
Domain Indicator: Develops increasing abilities to
understand and use language to communicate information,
experiences, ideas, feelings, opinions, needs, questions and
for other varied purposes
Demographic Breakdown: Complete class
Percentage of Children at Each Level in Domain Indicator: Develops
increasing abilities to understand and use language to communicate
information, experiences, ideas, feelings, opinions, needs, questions
and for other varied purposes
Covers Fall/Winter/Spring for 2009-2010 School Year
Percentage of children with no observations recorded for this area:
3% Fall
Number of children included in this report = 1,058
Report generated by CC-PORT™, copyright © 2003 Teaching Strategies, Inc., Washington, D.C., http://www.TeachingStrategies.com
Page 23 of 32Progress and Outcomes Report for Webb County Head Start Program
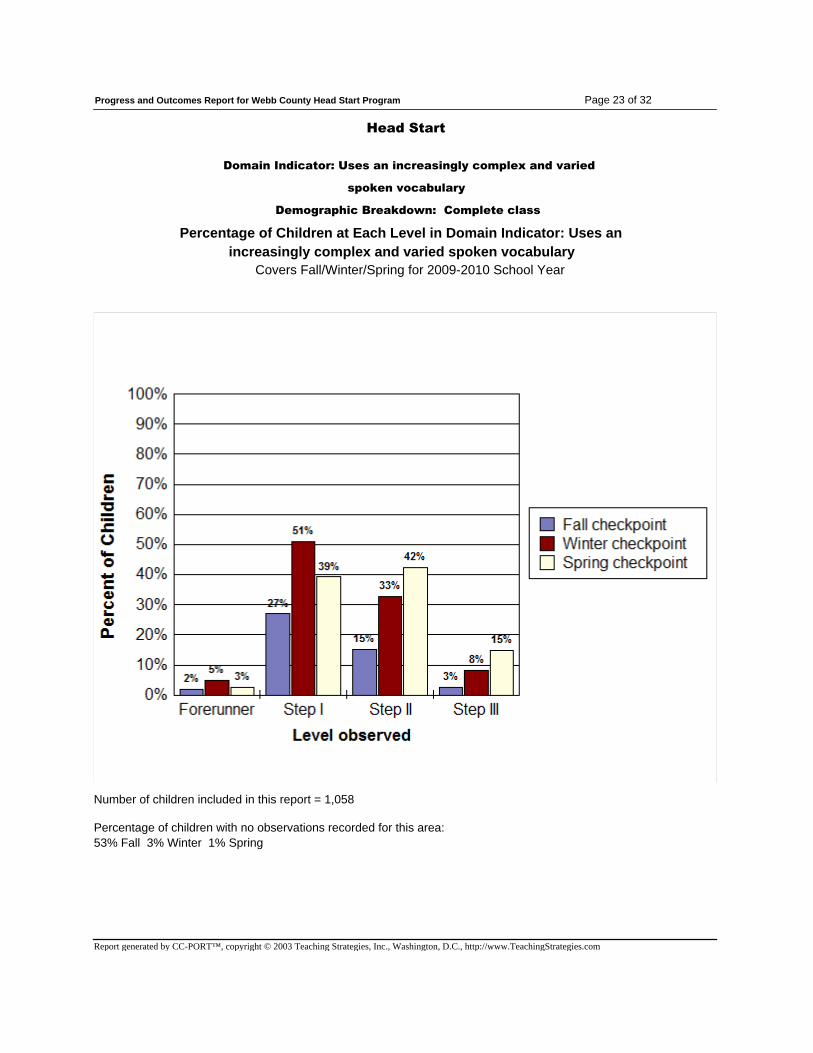
Head Start
Domain Indicator: Uses an increasingly complex and varied
spoken vocabulary
Demographic Breakdown: Complete class
Percentage of Children at Each Level in Domain Indicator: Uses an
increasingly complex and varied spoken vocabulary
Covers Fall/Winter/Spring for 2009-2010 School Year
Percentage of children with no observations recorded for this area:
53% Fall 3% Winter 1% Spring
Number of children included in this report = 1,058
Report generated by CC-PORT™, copyright © 2003 Teaching Strategies, Inc., Washington, D.C., http://www.TeachingStrategies.com

Page 24 of 32Progress and Outcomes Report for Webb County Head Start Program
Head Start
Domain Element: Phonological Awareness
Demographic Breakdown: Complete class
Percentage of Children at Each Level in Domain Element:
Phonological Awareness
Covers Fall/Winter/Spring for 2009-2010 School Year
Percentage of children with no observations recorded for this area:
25% Fall 6% Winter 2% Spring
Number of children included in this report = 1,058
Report generated by CC-PORT™, copyright © 2003 Teaching Strategies, Inc., Washington, D.C., http://www.TeachingStrategies.com

Page 25 of 32Progress and Outcomes Report for Webb County Head Start Program
Head Start
Domain Indicator: Associates sounds with written words
Demographic Breakdown: Complete class
Percentage of Children at Each Level in Domain Indicator:
Associates sounds with written words
Covers Fall/Winter/Spring for 2009-2010 School Year
Percentage of children with no observations recorded for this area:
25% Fall 6% Winter 2% Spring
Number of children included in this report = 1,058
Report generated by CC-PORT™, copyright © 2003 Teaching Strategies, Inc., Washington, D.C., http://www.TeachingStrategies.com
Page 26 of 32Progress and Outcomes Report for Webb County Head Start Program
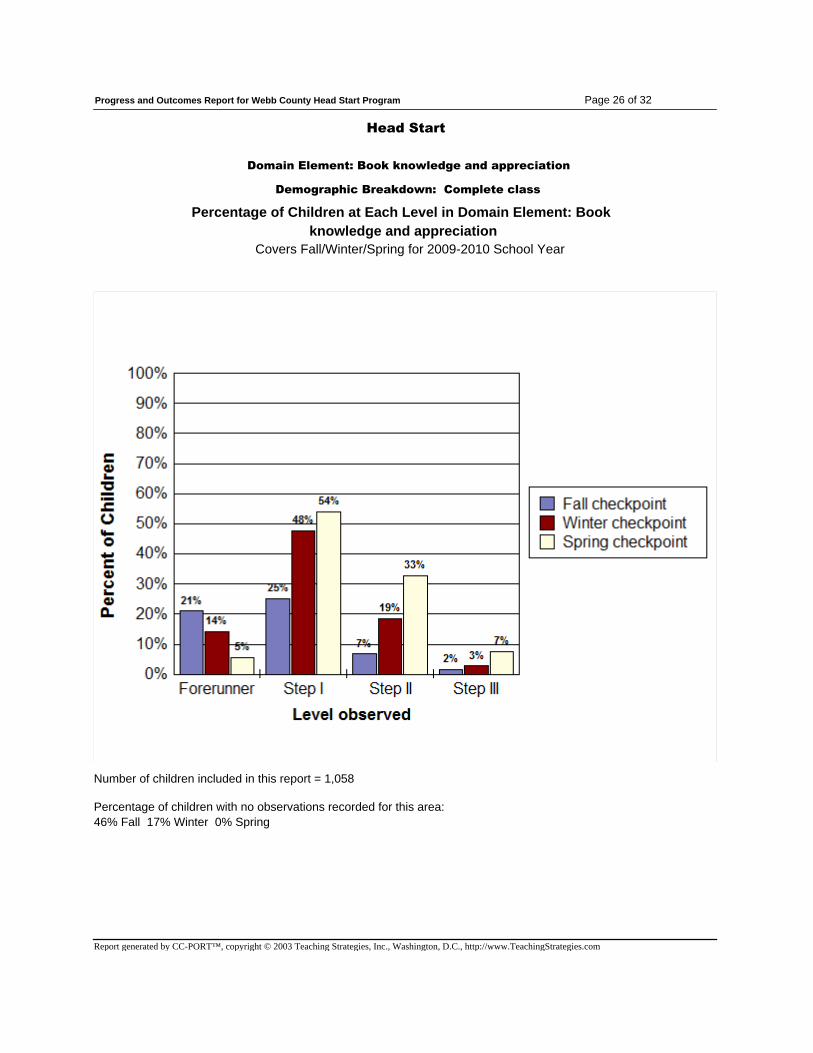
Head Start
Domain Element: Book knowledge and appreciation
Demographic Breakdown: Complete class
Percentage of Children at Each Level in Domain Element: Book
knowledge and appreciation
Covers Fall/Winter/Spring for 2009-2010 School Year
Percentage of children with no observations recorded for this area:
46% Fall 17% Winter 0% Spring
Number of children included in this report = 1,058
Report generated by CC-PORT™, copyright © 2003 Teaching Strategies, Inc., Washington, D.C., http://www.TeachingStrategies.com
Page 27 of 32Progress and Outcomes Report for Webb County Head Start Program
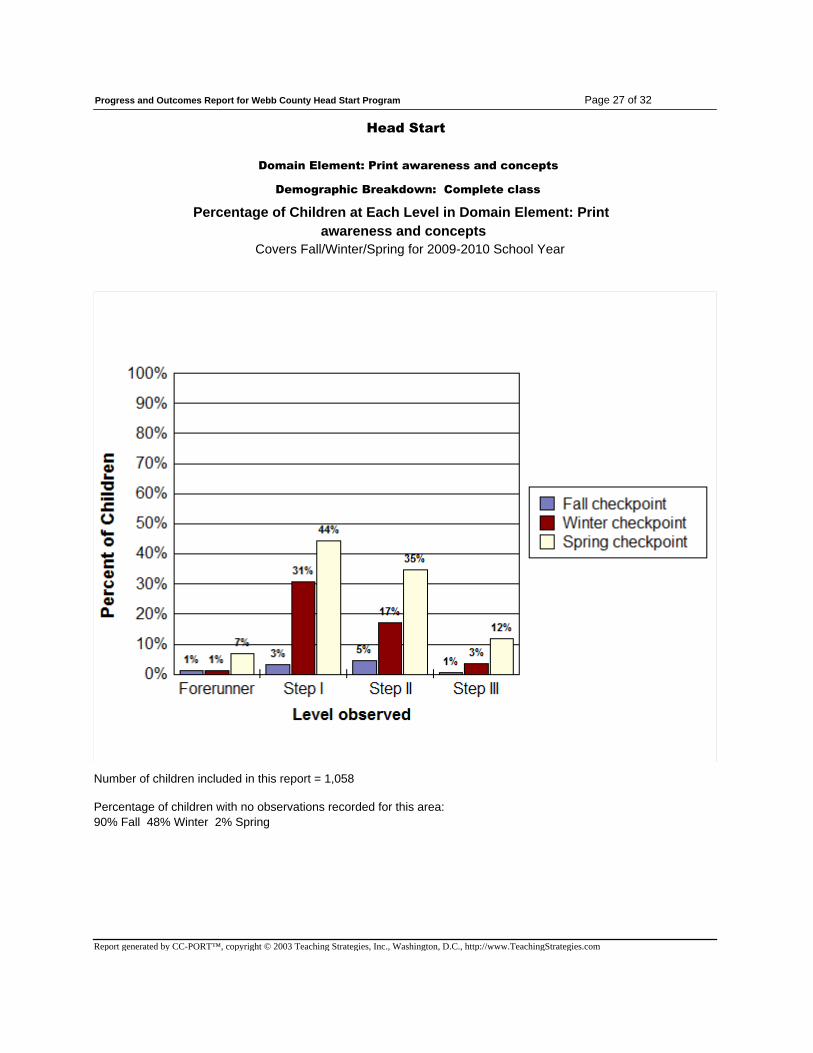
Head Start
Domain Element: Print awareness and concepts
Demographic Breakdown: Complete class
Percentage of Children at Each Level in Domain Element: Print
awareness and concepts
Covers Fall/Winter/Spring for 2009-2010 School Year
Percentage of children with no observations recorded for this area:
90% Fall 48% Winter 2% Spring
Number of children included in this report = 1,058
Report generated by CC-PORT™, copyright © 2003 Teaching Strategies, Inc., Washington, D.C., http://www.TeachingStrategies.com
Page 28 of 32Progress and Outcomes Report for Webb County Head Start Program
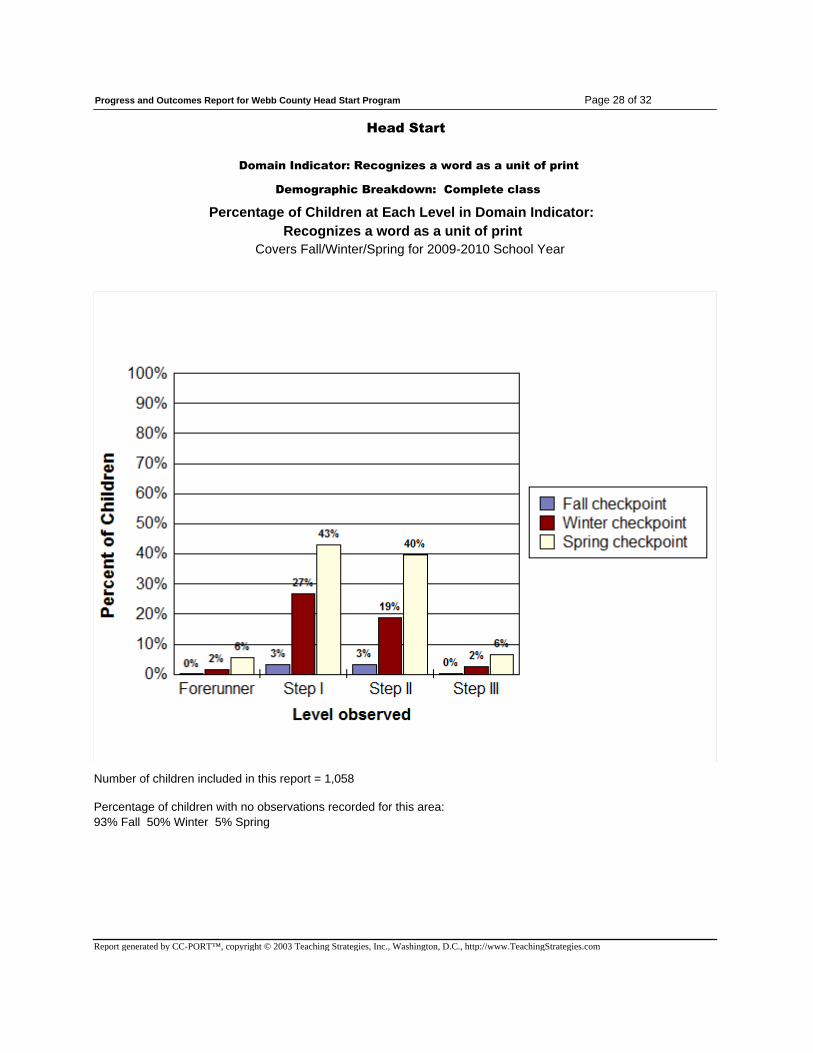
Head Start
Domain Indicator: Recognizes a word as a unit of print
Demographic Breakdown: Complete class
Percentage of Children at Each Level in Domain Indicator:
Recognizes a word as a unit of print
Covers Fall/Winter/Spring for 2009-2010 School Year
Percentage of children with no observations recorded for this area:
93% Fall 50% Winter 5% Spring
Number of children included in this report = 1,058
Report generated by CC-PORT™, copyright © 2003 Teaching Strategies, Inc., Washington, D.C., http://www.TeachingStrategies.com

Page 29 of 32Progress and Outcomes Report for Webb County Head Start Program
Head Start
Domain Indicator: Identifies at least 10 letters of the
alphabet, especially those in their own name
Demographic Breakdown: Complete class
Percentage of Children at Each Level in Domain Indicator: Identifies
at least 10 letters of the alphabet, especially those in their own name
Covers Fall/Winter/Spring for 2009-2010 School Year
Percentage of children with no observations recorded for this area:
91% Fall 61% Winter 10% Spring
Number of children included in this report = 1,058
Report generated by CC-PORT™, copyright © 2003 Teaching Strategies, Inc., Washington, D.C., http://www.TeachingStrategies.com
Page 30 of 32Progress and Outcomes Report for Webb County Head Start Program
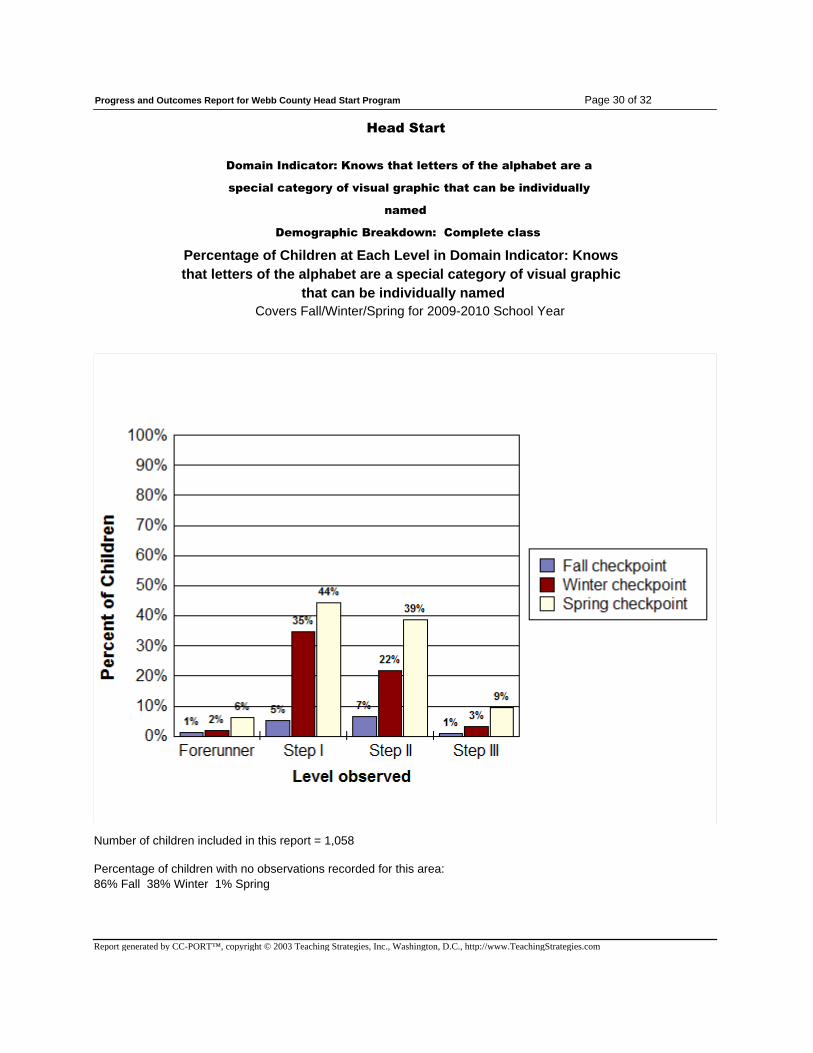
Head Start
Domain Indicator: Knows that letters of the alphabet are a
special category of visual graphic that can be individually
named
Demographic Breakdown: Complete class
Percentage of Children at Each Level in Domain Indicator: Knows
that letters of the alphabet are a special category of visual graphic
that can be individually named
Covers Fall/Winter/Spring for 2009-2010 School Year
Percentage of children with no observations recorded for this area:
86% Fall 38% Winter 1% Spring
Number of children included in this report = 1,058
Report generated by CC-PORT™, copyright © 2003 Teaching Strategies, Inc., Washington, D.C., http://www.TeachingStrategies.com
Page 31 of 32Progress and Outcomes Report for Webb County Head Start Program
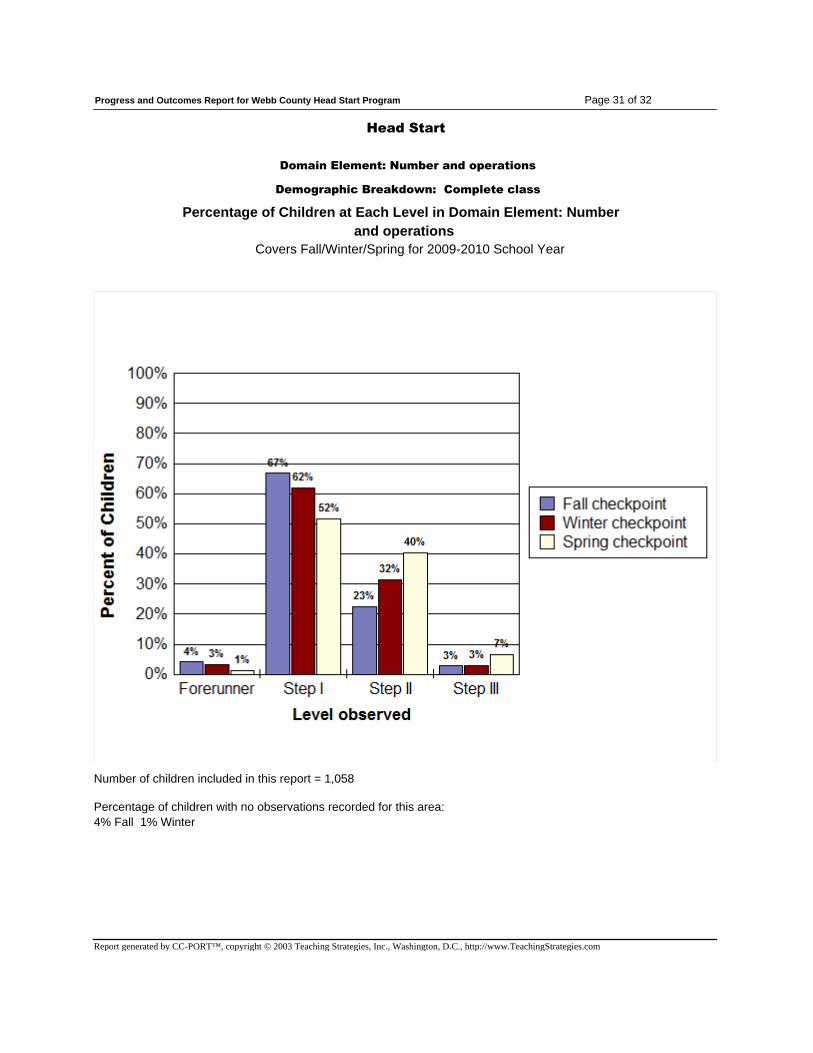
Head Start
Domain Element: Number and operations
Demographic Breakdown: Complete class
Percentage of Children at Each Level in Domain Element: Number
and operations
Covers Fall/Winter/Spring for 2009-2010 School Year
Percentage of children with no observations recorded for this area:
4% Fall 1% Winter
Number of children included in this report = 1,058
Report generated by CC-PORT™, copyright © 2003 Teaching Strategies, Inc., Washington, D.C., http://www.TeachingStrategies.com
Page 32 of 32Progress and Outcomes Report for Webb County Head Start Program
Conclusion
By analyzing the data contained in this report, teachers and administrators can
determine what aspects of the program are effective and which need attention.
Analysis of program outcome data may lead program administrators or managers
to pose questions such as the following:
• Do we need to provide a greater variety of materials for children?
(Do we have enough books, writing materials, math manipulatives, puzzles,
art supplies?)
• Do teachers need training and support in specific areas?
(Do they know how to observe and individualize? Do they need to know more
about literacy development based on recent research or the revised math
standards?)
• Are there ways that we can use volunteers and community partners in our
program to meet our goals for children? (Do we want adults to come in to
read with children?)
• Do we need to shift resources to accomplish our program goals?
(Do we need money for training, materials, or planning time?)
Using the data included in this report to benefit children is the most important
aspect of this study.
Report generated by CC-PORT™, copyright © 2003 Teaching Strategies, Inc., Washington, D.C., http://www.TeachingStrategies.com


![Chapter Five 1850 Virginia Census Webb Families · Chapter Five 1850 Virginia Census Webb Families Carroll County Abner Webb .....29 [s/o John & Hannah (Cock) Webb] Sarah .....25](https://static.fdocuments.in/doc/165x107/5b04c8997f8b9a3c378e25c5/chapter-five-1850-virginia-census-webb-five-1850-virginia-census-webb-families-carroll.jpg)
