Program on Dairy Markets and Policy Working Paper Seriesdairymarkets.org/PubPod/Pubs/WP14-02.pdf ·...
19
1 Program on Dairy Markets and Policy Working Paper Series Milk Price Cycles in the U.S. Dairy Supply Chain and Their Management Implications Working Paper Number WP14-02 May 2014 Charles F. Nicholson and Mark W. Stephenson ABSTRACT The existence of farm-milk price cycles in the U.S. has been a topic of significant discussion for the past 20 years, but empirical evidence based on analysis of recent data is limited. We develop a structural time series model based on state-space methods and including feed costs as an exogenous regressor to assess the nature of cyclical behavior of the quarterly U.S. All-milk price during 1996 to 2014. Although deterministic seasonal price movements are present, a stochastic large-amplitude cycle with a period of 3.3 years is the predominant source of variation in the U.S. All-milk price during the period analyzed. These cycles are consistent with the hypothesis that supply chain managers make decisions based on bounded rationality, with limited supply chain coordination. The presence of price cycles in the U.S. dairy industry has important management implications for dairy farmers, dairy processors, exporters and food retailers. Forecasting and analytical models of U.S. farm milk prices should be designed to account for cyclical farm milk price behavior. Acknowledgements Harry Kaiser, Dennis Bergmann, Declan O’Connor and Edward Jesse provided helpful comments on earlier versions of this Working Paper.
Transcript of Program on Dairy Markets and Policy Working Paper Seriesdairymarkets.org/PubPod/Pubs/WP14-02.pdf ·...
1
Program on Dairy Markets and Policy Working Paper Series Milk Price Cycles in the U.S. Dairy Supply Chain and Their Management Implications
Working Paper Number WP14-02
May 2014
Charles F. Nicholson and Mark W. Stephenson
ABSTRACT
The existence of farm-milk price cycles in the U.S. has been a topic of significant discussion for the past 20 years, but empirical evidence based on analysis of recent data is limited. We develop a structural time series model based on state-space methods and including feed costs as an exogenous regressor to assess the nature of cyclical behavior of the quarterly U.S. All-milk price during 1996 to 2014. Although deterministic seasonal price movements are present, a stochastic large-amplitude cycle with a period of 3.3 years is the predominant source of variation in the U.S. All-milk price during the period analyzed. These cycles are consistent with the hypothesis that supply chain managers make decisions based on bounded rationality, with limited supply chain coordination. The presence of price cycles in the U.S. dairy industry has important management implications for dairy farmers, dairy processors, exporters and food retailers. Forecasting and analytical models of U.S. farm milk prices should be designed to account for cyclical farm milk price behavior.
Acknowledgements
Harry Kaiser, Dennis Bergmann, Declan O’Connor and Edward Jesse provided helpful comments on earlier versions of this Working Paper.
2
TABLE OF CONTENTS
ABSTRACT ........................................................................................................................ 1
TABLE OF CONTENTS ...................................................................................................... 2
INTRODUCTION ............................................................................................................. 3
METHODS ........................................................................................................................ 5
Data .......................................................................................................................... 6
Model Evaluation ...................................................................................................... 7
RESULTS AND DISCUSSION ............................................................................................ 9
Implications of Price Cycles for Management Decisions ........................................ 13
Implications of Price Cycles for Forecasting and Policy Analysis ............................ 15
CONCLUSION ............................................................................................................... 16
REFERENCES ................................................................................................................... 17
APPENDIX FIGURES ....................................................................................................... 19
3
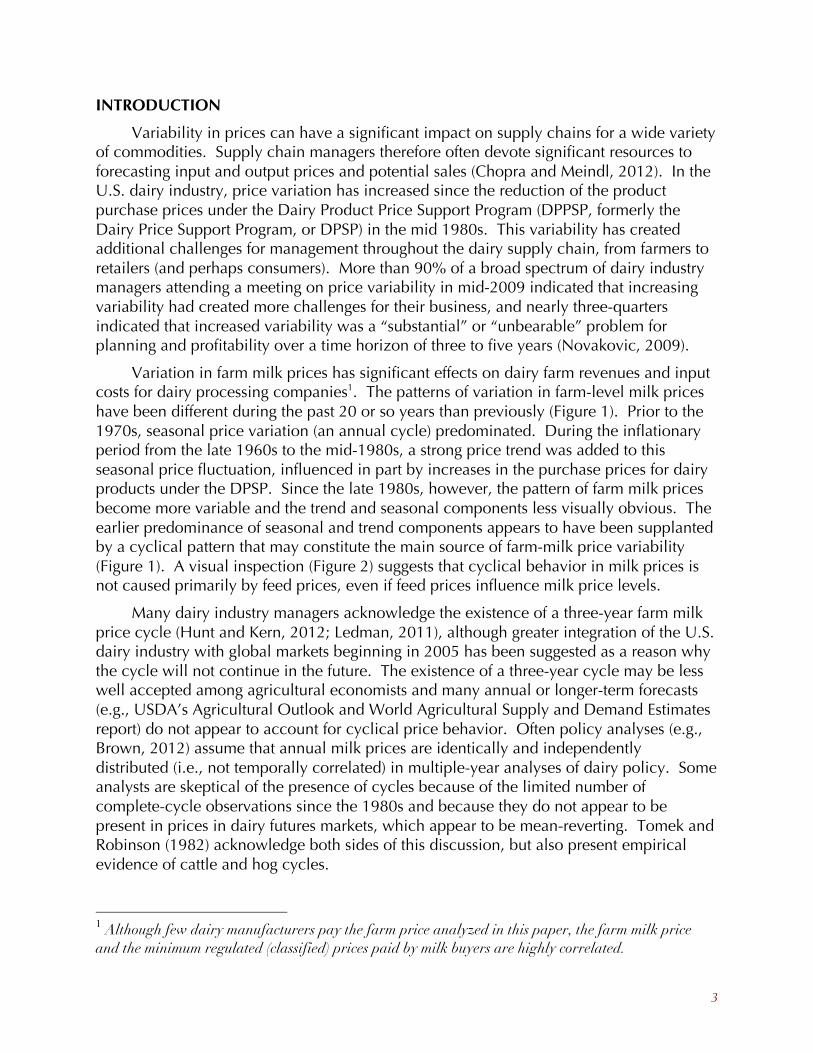
INTRODUCTION
Variability in prices can have a significant impact on supply chains for a wide variety of commodities. Supply chain managers therefore often devote significant resources to forecasting input and output prices and potential sales (Chopra and Meindl, 2012). In the U.S. dairy industry, price variation has increased since the reduction of the product purchase prices under the Dairy Product Price Support Program (DPPSP, formerly the Dairy Price Support Program, or DPSP) in the mid 1980s. This variability has created additional challenges for management throughout the dairy supply chain, from farmers to retailers (and perhaps consumers). More than 90% of a broad spectrum of dairy industry managers attending a meeting on price variability in mid-2009 indicated that increasing variability had created more challenges for their business, and nearly three-quarters indicated that increased variability was a “substantial” or “unbearable” problem for planning and profitability over a time horizon of three to five years (Novakovic, 2009).
Variation in farm milk prices has significant effects on dairy farm revenues and input costs for dairy processing companies1. The patterns of variation in farm-level milk prices have been different during the past 20 or so years than previously (Figure 1). Prior to the 1970s, seasonal price variation (an annual cycle) predominated. During the inflationary period from the late 1960s to the mid-1980s, a strong price trend was added to this seasonal price fluctuation, influenced in part by increases in the purchase prices for dairy products under the DPSP. Since the late 1980s, however, the pattern of farm milk prices become more variable and the trend and seasonal components less visually obvious. The earlier predominance of seasonal and trend components appears to have been supplanted by a cyclical pattern that may constitute the main source of farm-milk price variability (Figure 1). A visual inspection (Figure 2) suggests that cyclical behavior in milk prices is not caused primarily by feed prices, even if feed prices influence milk price levels.
Many dairy industry managers acknowledge the existence of a three-year farm milk price cycle (Hunt and Kern, 2012; Ledman, 2011), although greater integration of the U.S. dairy industry with global markets beginning in 2005 has been suggested as a reason why the cycle will not continue in the future. The existence of a three-year cycle may be less well accepted among agricultural economists and many annual or longer-term forecasts (e.g., USDA’s Agricultural Outlook and World Agricultural Supply and Demand Estimates report) do not appear to account for cyclical price behavior. Often policy analyses (e.g., Brown, 2012) assume that annual milk prices are identically and independently distributed (i.e., not temporally correlated) in multiple-year analyses of dairy policy. Some analysts are skeptical of the presence of cycles because of the limited number of complete-cycle observations since the 1980s and because they do not appear to be present in prices in dairy futures markets, which appear to be mean-reverting. Tomek and Robinson (1982) acknowledge both sides of this discussion, but also present empirical evidence of cattle and hog cycles.
1 Although few dairy manufacturers pay the farm price analyzed in this paper, the farm milk price and the minimum regulated (classified) prices paid by milk buyers are highly correlated.

4
Figure 1. Quarterly US All-Milk Price, 1949(1) to 1968(4), 1969(1) to 1988(4) and
1989(1) to 2014(1), $/cwt
Figure 2. Quarterly U.S. All Milk Price and NASS 16% Protein Ration,
1996 to 2014, $/cwt

5
Despite the importance of apparent cyclical behavior, no formal analysis of cyclical behavior of farm milk prices in the U.S. dairy supply chain has been undertaken in recent years. Thus, our principal objective is to assess whether there are cyclical patterns in U.S. farm milk prices, and if so, to assess their characteristics such as amplitude, period and contribution to overall farm-milk price variability. We also discuss the possible causes of cyclical farm-milk price behavior, and the implications of cyclical behavior for dairy industry managers.
METHODS
Much of the research on analyzing and forecasting milk prices has focused on what is sometimes called the “time domain” using variants of the ARMA time-series methods developed by Box and Jenkins (1970). This paper examines cycles in the U.S. All-milk price using quarterly data from 1996 to 2014 and the structural time series approach, state space methods (SSM; Durbin and Koopman, 2001). Although farm-level prices vary monthly (NASS announces the All-milk price each month in Agricultural Prices), quarterly data are used because models using monthly data resulted in residuals that violated the assumptions of normality, heteroskedasticity and independence, whereas models based on quarterly data had appropriate residual characteristics. In addition, the quarterly aggregation of monthly data is more appropriate for the inclusion of other regressors that may have an effect on milk prices over the period of a quarter such as feed costs.
The SSM differs from the ARMA and ARIMA approaches (although both assume that a series may have trend and seasonal components) because the former typically proceeds by elimination of trend and seasonal components, then considers the remaining series to be stationary and invariant. Durbin and Koopman (2001) show that both the ARMA and ARIMA models can be written as SSM. They note that when the structure of the time series is sufficiently simple, the SSM and ARIMA models are essentially equivalent, but for more complex series this is not the case (p. 51). They argue that a key advantage of the SMM approach is that it is a “structural analysis” that can include all of the above components but also other explanatory variables and interventions, including extension of the model to include multiple variables. Moreover, the series need not be stationary to apply the SSM approach, and model parameters can be modeled as stochastic. Bergmann et al (2013) provide a recent application of SSM to milk prices in Germany, Ireland and the average for the European Union, whereas Chidmi and Fadiga (2007) provide an application SSM to analysis of price-cost margins in the U.S. meat industry.

6
The SSM estimate includes components for the level (the average), the slope (trend, or changes in the level), seasonality (a 4-quarter cycle), a cyclical component and an irregular component that represents the residual not predicted by the other components. The SSM estimated for this analysis has the form:
yt = µt +ν t +γ t +ct +βX +εt ; ε ~ N 0,σε( ) (1)
where
µt+1 = µt +ν t (2)
ν t+1 =ν t (3)
γ t+1 = γ t+1− j +ωt ; ω ~ N 0,σω2( )
j =1
s−1
∑ (4)
ct+1 = ct ⋅cosλc +ct* sinλc +ξt ; ξ ~ N 0,σξ
2( ) (5)
Y is the observed All-milk price, µ is the level, ν is the slope component, γ is the seasonal component using dummy variables and for which all four quarterly components sum to 0, c is a set of cyclical components and ε, ω and ξ are error term components. The level, slope and seasonal components are fixed, and the cyclical component is stochastic. X is matrix of other exogenous (non-price) variables with their associated β coefficients. The X variables can be used to control for other factors that often are assumed to influence milk prices (or price cycles). Because many industry analysts attribute changes (or cycles) in milk prices to exogenous factors such as feed prices or export value or quantity, these variables were initially included in the SSM. The total value of U.S. dairy product exports and the quantities of exports in HTS (Harmonized Tariff Schedule) categories 0402 (milk powders), 0404 (whey products) and 0406 (cheese products) reported by the U.S. Census Bureau were included in initial model formulations, but were subsequently excluded from the model because the regression coefficients were small and statistically insignificant.
The model is estimated using Maximum Likelihood methods based on a Kalman Filter approach. The model was estimated using the STAMP™8 software (Koopman et al., 2007) using quarterly data from 1996(2) to 2014(1).
Data
This study uses data on the nominal U.S. All-milk price and feed costs from 1996 to 2014. The All-milk price is a weighted average of the prices dairy processors pay per hundred pounds (hundredweight, abbreviated cwt) for all grade A and grade B milk, calculated by the National Agricultural Statistics Service (NASS) and usually reported for milk of average fat composition. It is appropriate for this analysis because it is a commonly reported measure, one more representative of the prices paid to farmers than alternatives such as the regulated minimum class prices under milk marketing orders or the “mailbox price” that subtracts specified marketing costs. The explanatory X variable (regressors) in the final model included the NASS 16% dairy ration cost. Monthly values

7
were aggregated to quarters using the average value for each three-month period. Data from 1996 to 2014 are used because they provide a sufficient number of observations to allow identification of cyclical and other components of the U.S. All-milk price, non-seasonal cyclical components appear more prominent after 1996, and because they post-date the entry into force of major trade agreements such as NAFTA and the URA, which may have altered U.S. price relationships.
Model Evaluation
Model residuals were evaluated for normality using the test statistic:
N = n s 2
6+K −3( )
2
24
"
#
$$$
%
&
''' (6)
where s represents skewness and K the kurtosis (Commandeur and Koopman, 2007). This test statistic is compared to a Χ2 distribution with two degrees of freedom, and this test indicates that the null hypothesis of the normality cannot be rejected. Independent tests for skewness and kurtosis and the Bowman-Shenton (1975) test statistic also indicate the null hypothesis of normal residuals could not be rejected (Table 1). The H statistic was used to assess homoskedasticity, and is given by:
H h( ) =et2
t=n−h+1
n
∑
et2
t=d +1
d +h
∑ (7)
where d is the number of diffuse initial elements (parameters to be estimated), and h is the nearest integer to (n-d)/3. In this case, h=19. The value of the H statistic is compared to an F-distribution with (h,h) degrees of freedom, and indicated that the hypothesis of homoskedaistic residuals could not be rejected. Independence was evaluated with the Box-Ljung statistic, given as:
Q k( ) = n n + 2( ) rl2
n − ll =1
k
∑ (8)
where the rl is the residual autocorrelation for lag l. This is compared to a Χ2 distribution with k-w+1 degrees of freedom, where w is the number of disturbance variances to be estimated. Based on this test statistic value and the Box-Ljung test for lags of 4, 8 and 12 quarters, and the null hypothesis of independence of the residuals could not be rejected.

8
Table 1. Model Evaluation for Quarterly State-Space Model of US All-Milk Price, 1996(2) to 2014(1)
Model Characteristic Value p value
Basic Model Characteristics N (observations) 72 P (parameters) 6 Log-likelihood -36.470 AIC 0.744 BIC 0.965 R2 a 0.388 Normality Evaluation Normality test statistic 3.970 0.137 N, residuals 66 Mean -0.014 s.d. 0.998 Skewness 0.470 0.119 Kurtosis 1.591 0.2072 Bowman-Shenton test statistic 4.022 0.134 Heteroskedasticity Evaluation H(h) 1.421 0.208 h for H(h) 22 Independence Evaluation DW 1.886 r(1) -0.012 r(13) -0.001 Q(13,13-6) 5.373 0.717 Box-Ljung, Lag 4 1.898 1.000 Box-Ljung, Lag 8 3.715 0.446 Box-Ljung, Lag 12 5.372 0.717
a Based on difference around the seasonal mean. Standard R2 value is 0.834 and R2 based on differences is 0.471.
The autocorrelation function of the residuals was also examined and no correlations fell outside the confidence intervals for up to 16-quarter lags (Figure A1).
9
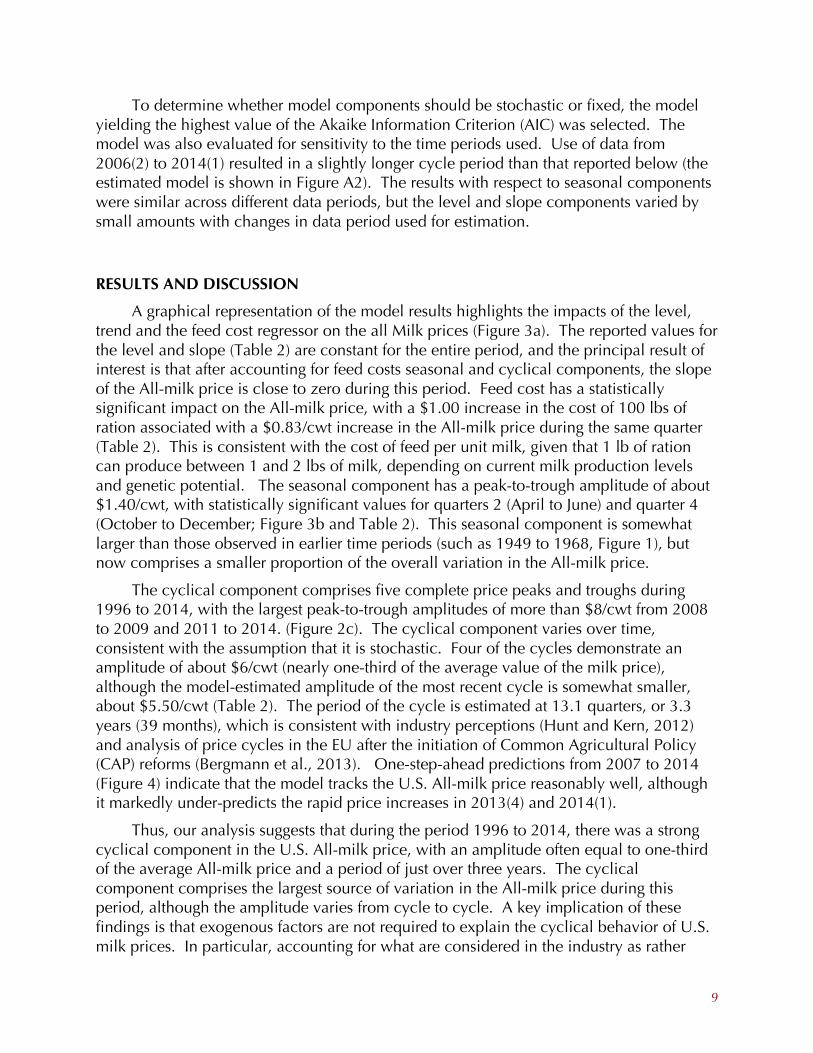
To determine whether model components should be stochastic or fixed, the model yielding the highest value of the Akaike Information Criterion (AIC) was selected. The model was also evaluated for sensitivity to the time periods used. Use of data from 2006(2) to 2014(1) resulted in a slightly longer cycle period than that reported below (the estimated model is shown in Figure A2). The results with respect to seasonal components were similar across different data periods, but the level and slope components varied by small amounts with changes in data period used for estimation.
RESULTS AND DISCUSSION
A graphical representation of the model results highlights the impacts of the level, trend and the feed cost regressor on the all Milk prices (Figure 3a). The reported values for the level and slope (Table 2) are constant for the entire period, and the principal result of interest is that after accounting for feed costs seasonal and cyclical components, the slope of the All-milk price is close to zero during this period. Feed cost has a statistically significant impact on the All-milk price, with a $1.00 increase in the cost of 100 lbs of ration associated with a $0.83/cwt increase in the All-milk price during the same quarter (Table 2). This is consistent with the cost of feed per unit milk, given that 1 lb of ration can produce between 1 and 2 lbs of milk, depending on current milk production levels and genetic potential. The seasonal component has a peak-to-trough amplitude of about $1.40/cwt, with statistically significant values for quarters 2 (April to June) and quarter 4 (October to December; Figure 3b and Table 2). This seasonal component is somewhat larger than those observed in earlier time periods (such as 1949 to 1968, Figure 1), but now comprises a smaller proportion of the overall variation in the All-milk price.
The cyclical component comprises five complete price peaks and troughs during 1996 to 2014, with the largest peak-to-trough amplitudes of more than $8/cwt from 2008 to 2009 and 2011 to 2014. (Figure 2c). The cyclical component varies over time, consistent with the assumption that it is stochastic. Four of the cycles demonstrate an amplitude of about $6/cwt (nearly one-third of the average value of the milk price), although the model-estimated amplitude of the most recent cycle is somewhat smaller, about $5.50/cwt (Table 2). The period of the cycle is estimated at 13.1 quarters, or 3.3 years (39 months), which is consistent with industry perceptions (Hunt and Kern, 2012) and analysis of price cycles in the EU after the initiation of Common Agricultural Policy (CAP) reforms (Bergmann et al., 2013). One-step-ahead predictions from 2007 to 2014 (Figure 4) indicate that the model tracks the U.S. All-milk price reasonably well, although it markedly under-predicts the rapid price increases in 2013(4) and 2014(1).
Thus, our analysis suggests that during the period 1996 to 2014, there was a strong cyclical component in the U.S. All-milk price, with an amplitude often equal to one-third of the average All-milk price and a period of just over three years. The cyclical component comprises the largest source of variation in the All-milk price during this period, although the amplitude varies from cycle to cycle. A key implication of these findings is that exogenous factors are not required to explain the cyclical behavior of U.S. milk prices. In particular, accounting for what are considered in the industry as rather

10
a
c
b
d
Figure 3. Graphical Representation of the Estimated Model for 1996(2)-2014(1), $/cwt a) All-milk price and impact of feed costs; b) Seasonal component of All-milk price; c)
Cyclical component of All-milk price; d) Irregular component of All-milk price
Figure 4. One-Step Ahead Predictions for 2007(1) to 2014(1) from Model Using 1996(2)
to 2014(1) Data, $/cwt
11
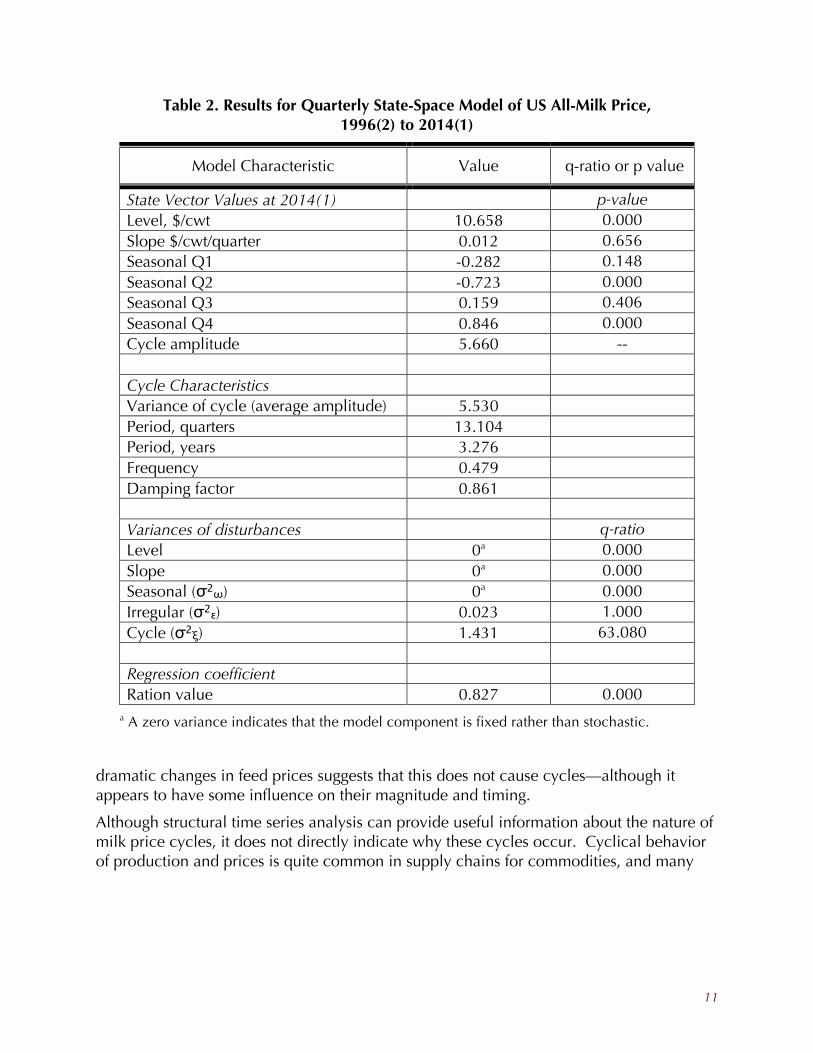
Table 2. Results for Quarterly State-Space Model of US All-Milk Price, 1996(2) to 2014(1)
Model Characteristic Value q-ratio or p value
State Vector Values at 2014(1) p-value Level, $/cwt 10.658 0.000 Slope $/cwt/quarter 0.012 0.656 Seasonal Q1 -0.282 0.148 Seasonal Q2 -0.723 0.000 Seasonal Q3 0.159 0.406 Seasonal Q4 0.846 0.000 Cycle amplitude 5.660 -- Cycle Characteristics Variance of cycle (average amplitude) 5.530 Period, quarters 13.104 Period, years 3.276 Frequency 0.479 Damping factor 0.861 Variances of disturbances q-ratio Level 0a 0.000 Slope 0a 0.000 Seasonal (σ2ω) 0a 0.000 Irregular (σ2ε) 0.023 1.000 Cycle (σ2ξ) 1.431 63.080 Regression coefficient Ration value 0.827 0.000
a A zero variance indicates that the model component is fixed rather than stochastic.
dramatic changes in feed prices suggests that this does not cause cycles—although it appears to have some influence on their magnitude and timing.
Although structural time series analysis can provide useful information about the nature of milk price cycles, it does not directly indicate why these cycles occur. Cyclical behavior of production and prices is quite common in supply chains for commodities, and many
12
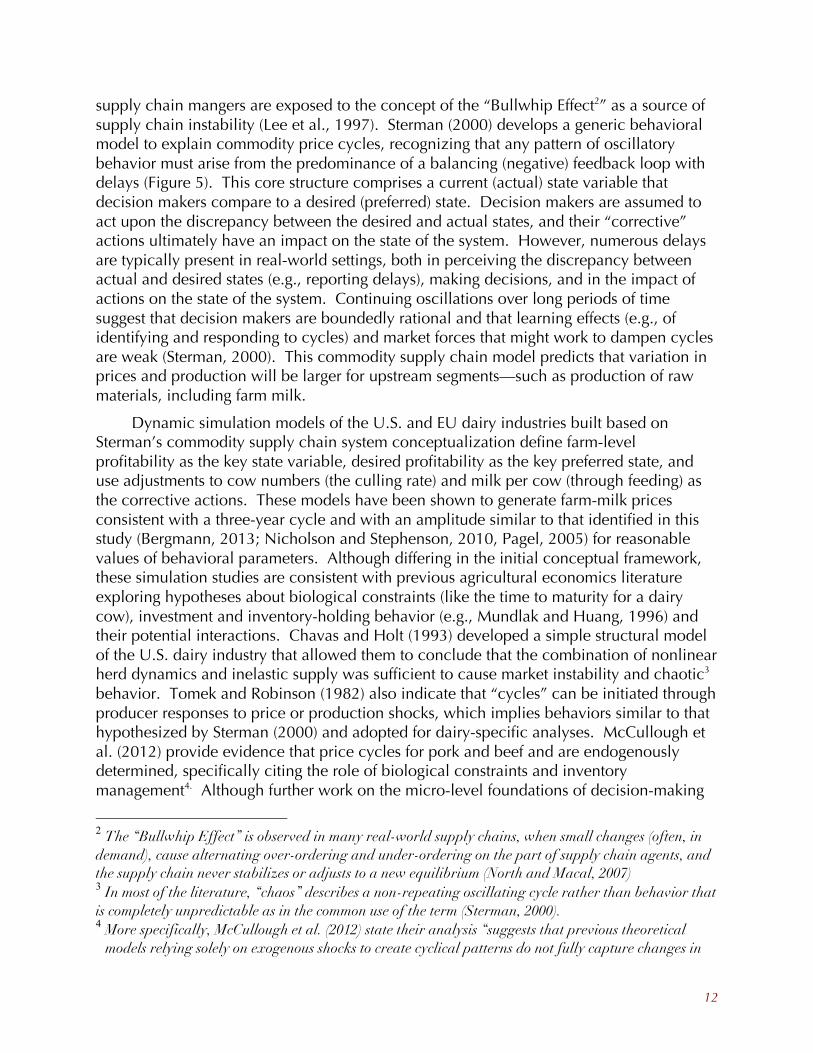
supply chain mangers are exposed to the concept of the “Bullwhip Effect2” as a source of supply chain instability (Lee et al., 1997). Sterman (2000) develops a generic behavioral model to explain commodity price cycles, recognizing that any pattern of oscillatory behavior must arise from the predominance of a balancing (negative) feedback loop with delays (Figure 5). This core structure comprises a current (actual) state variable that decision makers compare to a desired (preferred) state. Decision makers are assumed to act upon the discrepancy between the desired and actual states, and their “corrective” actions ultimately have an impact on the state of the system. However, numerous delays are typically present in real-world settings, both in perceiving the discrepancy between actual and desired states (e.g., reporting delays), making decisions, and in the impact of actions on the state of the system. Continuing oscillations over long periods of time suggest that decision makers are boundedly rational and that learning effects (e.g., of identifying and responding to cycles) and market forces that might work to dampen cycles are weak (Sterman, 2000). This commodity supply chain model predicts that variation in prices and production will be larger for upstream segments—such as production of raw materials, including farm milk.
Dynamic simulation models of the U.S. and EU dairy industries built based on Sterman’s commodity supply chain system conceptualization define farm-level profitability as the key state variable, desired profitability as the key preferred state, and use adjustments to cow numbers (the culling rate) and milk per cow (through feeding) as the corrective actions. These models have been shown to generate farm-milk prices consistent with a three-year cycle and with an amplitude similar to that identified in this study (Bergmann, 2013; Nicholson and Stephenson, 2010, Pagel, 2005) for reasonable values of behavioral parameters. Although differing in the initial conceptual framework, these simulation studies are consistent with previous agricultural economics literature exploring hypotheses about biological constraints (like the time to maturity for a dairy cow), investment and inventory-holding behavior (e.g., Mundlak and Huang, 1996) and their potential interactions. Chavas and Holt (1993) developed a simple structural model of the U.S. dairy industry that allowed them to conclude that the combination of nonlinear herd dynamics and inelastic supply was sufficient to cause market instability and chaotic3 behavior. Tomek and Robinson (1982) also indicate that “cycles” can be initiated through producer responses to price or production shocks, which implies behaviors similar to that hypothesized by Sterman (2000) and adopted for dairy-specific analyses. McCullough et al. (2012) provide evidence that price cycles for pork and beef and are endogenously determined, specifically citing the role of biological constraints and inventory management4. Although further work on the micro-level foundations of decision-making
2 The “Bullwhip Effect” is observed in many real-world supply chains, when small changes (often, in demand), cause alternating over-ordering and under-ordering on the part of supply chain agents, and the supply chain never stabilizes or adjusts to a new equilibrium (North and Macal, 2007) 3 In most of the literature, “chaos” describes a non-repeating oscillating cycle rather than behavior that is completely unpredictable as in the common use of the term (Sterman, 2000). 4 More specifically, McCullough et al. (2012) state their analysis “suggests that previous theoretical
models relying solely on exogenous shocks to create cyclical patterns do not fully capture changes in

13
Figure 5. Hypothesized Core System Structure Underlying Oscillatory Behavior in Commodity Supply Chains, Adapted from Sterman (2000).
by dairy farmers and processors incorporated into this dynamic feedback structure would strengthen our understanding of the origins of (and possible responses to) dairy price cycles, our analysis provides substantive empirical evidence consistent with an underlying theory of cyclical behavior for commodities.
Implications of Price Cycles for Management Decisions
The presence of farm-milk price cycles has a number of implications for management of dairy industry businesses, for forecasting and for analysis of dairy industry policies. Prior to discussing these implications, it is important to note that the presence of a three-year cycle of large amplitude, even over a period of 17 years, does not mean that this cycle will continue indefinitely into the future. As Hunt and Kern (2012) noted, increased
system dynamics. Specifically, the biological constraint in livestock dynamics has become less significant while technology and information are relatively more significant. Concurrently, vertical integration of the supply chain may have improved inventory management, all resulting in a small, less deterministic, cyclical effect.”
State of theSystem
Desired State
Discrepancy
CorrectiveAction
!+
+
+Measurement,Reporting and
PerceptionDelays
Administrativeand
Decision-MakingDelays
Action andEffectDelays
14
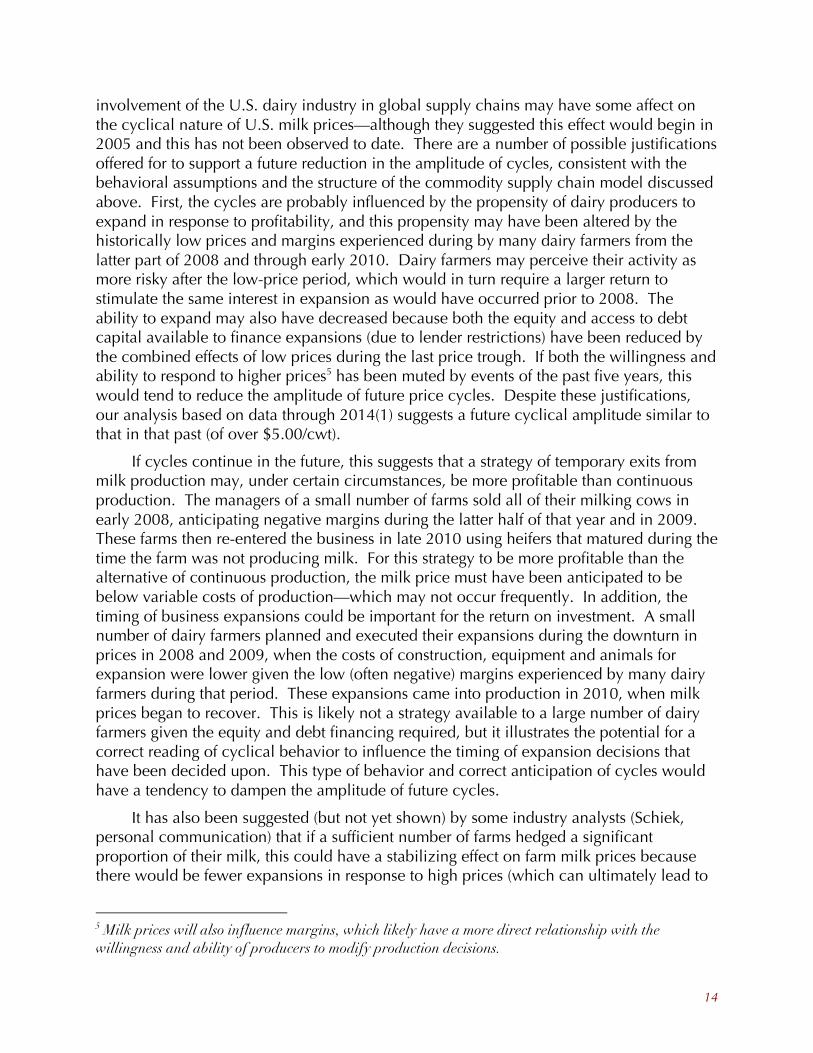
involvement of the U.S. dairy industry in global supply chains may have some affect on the cyclical nature of U.S. milk prices—although they suggested this effect would begin in 2005 and this has not been observed to date. There are a number of possible justifications offered for to support a future reduction in the amplitude of cycles, consistent with the behavioral assumptions and the structure of the commodity supply chain model discussed above. First, the cycles are probably influenced by the propensity of dairy producers to expand in response to profitability, and this propensity may have been altered by the historically low prices and margins experienced during by many dairy farmers from the latter part of 2008 and through early 2010. Dairy farmers may perceive their activity as more risky after the low-price period, which would in turn require a larger return to stimulate the same interest in expansion as would have occurred prior to 2008. The ability to expand may also have decreased because both the equity and access to debt capital available to finance expansions (due to lender restrictions) have been reduced by the combined effects of low prices during the last price trough. If both the willingness and ability to respond to higher prices5 has been muted by events of the past five years, this would tend to reduce the amplitude of future price cycles. Despite these justifications, our analysis based on data through 2014(1) suggests a future cyclical amplitude similar to that in that past (of over $5.00/cwt).
If cycles continue in the future, this suggests that a strategy of temporary exits from milk production may, under certain circumstances, be more profitable than continuous production. The managers of a small number of farms sold all of their milking cows in early 2008, anticipating negative margins during the latter half of that year and in 2009. These farms then re-entered the business in late 2010 using heifers that matured during the time the farm was not producing milk. For this strategy to be more profitable than the alternative of continuous production, the milk price must have been anticipated to be below variable costs of production—which may not occur frequently. In addition, the timing of business expansions could be important for the return on investment. A small number of dairy farmers planned and executed their expansions during the downturn in prices in 2008 and 2009, when the costs of construction, equipment and animals for expansion were lower given the low (often negative) margins experienced by many dairy farmers during that period. These expansions came into production in 2010, when milk prices began to recover. This is likely not a strategy available to a large number of dairy farmers given the equity and debt financing required, but it illustrates the potential for a correct reading of cyclical behavior to influence the timing of expansion decisions that have been decided upon. This type of behavior and correct anticipation of cycles would have a tendency to dampen the amplitude of future cycles.
It has also been suggested (but not yet shown) by some industry analysts (Schiek, personal communication) that if a sufficient number of farms hedged a significant proportion of their milk, this could have a stabilizing effect on farm milk prices because there would be fewer expansions in response to high prices (which can ultimately lead to
5 Milk prices will also influence margins, which likely have a more direct relationship with the willingness and ability of producers to modify production decisions.
15
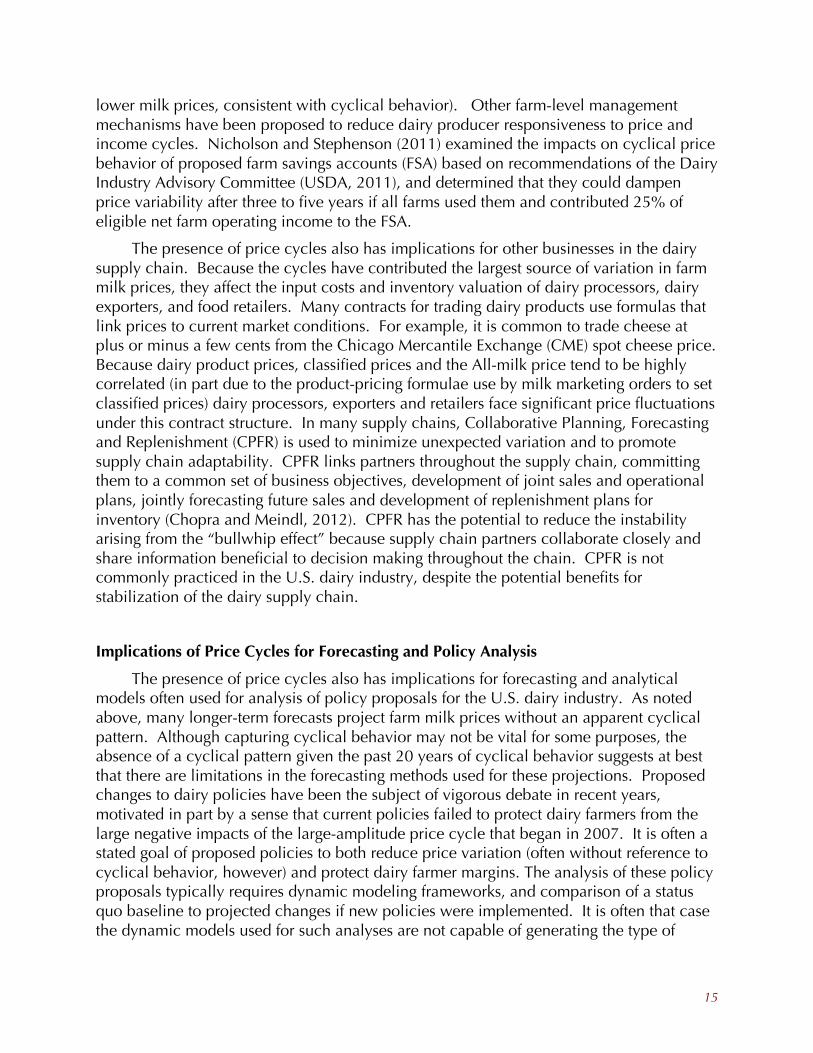
lower milk prices, consistent with cyclical behavior). Other farm-level management mechanisms have been proposed to reduce dairy producer responsiveness to price and income cycles. Nicholson and Stephenson (2011) examined the impacts on cyclical price behavior of proposed farm savings accounts (FSA) based on recommendations of the Dairy Industry Advisory Committee (USDA, 2011), and determined that they could dampen price variability after three to five years if all farms used them and contributed 25% of eligible net farm operating income to the FSA.
The presence of price cycles also has implications for other businesses in the dairy supply chain. Because the cycles have contributed the largest source of variation in farm milk prices, they affect the input costs and inventory valuation of dairy processors, dairy exporters, and food retailers. Many contracts for trading dairy products use formulas that link prices to current market conditions. For example, it is common to trade cheese at plus or minus a few cents from the Chicago Mercantile Exchange (CME) spot cheese price. Because dairy product prices, classified prices and the All-milk price tend to be highly correlated (in part due to the product-pricing formulae use by milk marketing orders to set classified prices) dairy processors, exporters and retailers face significant price fluctuations under this contract structure. In many supply chains, Collaborative Planning, Forecasting and Replenishment (CPFR) is used to minimize unexpected variation and to promote supply chain adaptability. CPFR links partners throughout the supply chain, committing them to a common set of business objectives, development of joint sales and operational plans, jointly forecasting future sales and development of replenishment plans for inventory (Chopra and Meindl, 2012). CPFR has the potential to reduce the instability arising from the “bullwhip effect” because supply chain partners collaborate closely and share information beneficial to decision making throughout the chain. CPFR is not commonly practiced in the U.S. dairy industry, despite the potential benefits for stabilization of the dairy supply chain.
Implications of Price Cycles for Forecasting and Policy Analysis
The presence of price cycles also has implications for forecasting and analytical models often used for analysis of policy proposals for the U.S. dairy industry. As noted above, many longer-term forecasts project farm milk prices without an apparent cyclical pattern. Although capturing cyclical behavior may not be vital for some purposes, the absence of a cyclical pattern given the past 20 years of cyclical behavior suggests at best that there are limitations in the forecasting methods used for these projections. Proposed changes to dairy policies have been the subject of vigorous debate in recent years, motivated in part by a sense that current policies failed to protect dairy farmers from the large negative impacts of the large-amplitude price cycle that began in 2007. It is often a stated goal of proposed policies to both reduce price variation (often without reference to cyclical behavior, however) and protect dairy farmer margins. The analysis of these policy proposals typically requires dynamic modeling frameworks, and comparison of a status quo baseline to projected changes if new policies were implemented. It is often that case the dynamic models used for such analyses are not capable of generating the type of
16
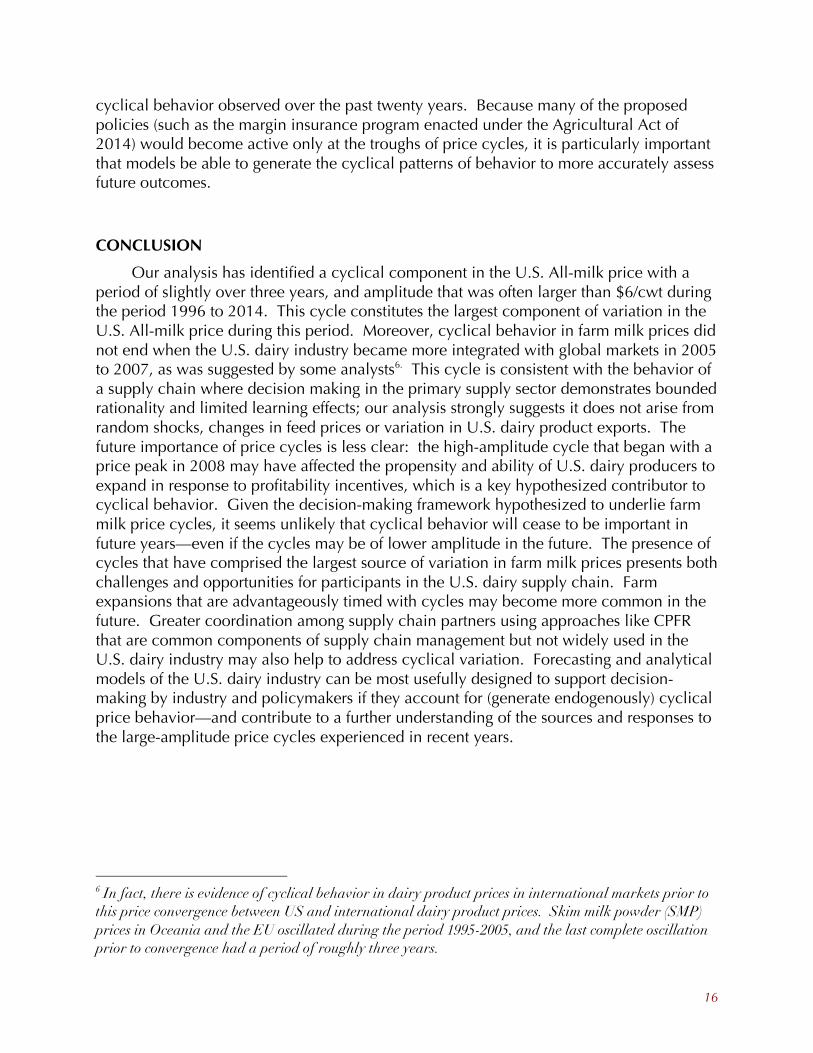
cyclical behavior observed over the past twenty years. Because many of the proposed policies (such as the margin insurance program enacted under the Agricultural Act of 2014) would become active only at the troughs of price cycles, it is particularly important that models be able to generate the cyclical patterns of behavior to more accurately assess future outcomes.
CONCLUSION
Our analysis has identified a cyclical component in the U.S. All-milk price with a period of slightly over three years, and amplitude that was often larger than $6/cwt during the period 1996 to 2014. This cycle constitutes the largest component of variation in the U.S. All-milk price during this period. Moreover, cyclical behavior in farm milk prices did not end when the U.S. dairy industry became more integrated with global markets in 2005 to 2007, as was suggested by some analysts6. This cycle is consistent with the behavior of a supply chain where decision making in the primary supply sector demonstrates bounded rationality and limited learning effects; our analysis strongly suggests it does not arise from random shocks, changes in feed prices or variation in U.S. dairy product exports. The future importance of price cycles is less clear: the high-amplitude cycle that began with a price peak in 2008 may have affected the propensity and ability of U.S. dairy producers to expand in response to profitability incentives, which is a key hypothesized contributor to cyclical behavior. Given the decision-making framework hypothesized to underlie farm milk price cycles, it seems unlikely that cyclical behavior will cease to be important in future years—even if the cycles may be of lower amplitude in the future. The presence of cycles that have comprised the largest source of variation in farm milk prices presents both challenges and opportunities for participants in the U.S. dairy supply chain. Farm expansions that are advantageously timed with cycles may become more common in the future. Greater coordination among supply chain partners using approaches like CPFR that are common components of supply chain management but not widely used in the U.S. dairy industry may also help to address cyclical variation. Forecasting and analytical models of the U.S. dairy industry can be most usefully designed to support decision-making by industry and policymakers if they account for (generate endogenously) cyclical price behavior—and contribute to a further understanding of the sources and responses to the large-amplitude price cycles experienced in recent years.
6 In fact, there is evidence of cyclical behavior in dairy product prices in international markets prior to this price convergence between US and international dairy product prices. Skim milk powder (SMP) prices in Oceania and the EU oscillated during the period 1995-2005, and the last complete oscillation prior to convergence had a period of roughly three years.
17
REFERENCES
Bergmann, D. 2013. Forecasting an EU farm gate milk price using the system dynamics methodology. Paper presented at the Collaborative European Research Conference, Cork, Ireland, October 17-18, 2013.
Bergmann, D., D. O’Connor and A. Thummel. 2013. A Decomposition Analysis of the EU Farm Gate Milk Price. Paper presented at the 87th Annual Conference of the Agricultural Economics Society, University of Warwick, United Kingdom, 8-10 April 2013.
Bowman, K.O.; Shenton, L.R. (1975). "Omnibus contours for departures from normality based on √b1 and b2". Biometrika. 62: 243–250.
Box, George and Gwilym Jenkins. 1970. Time Series Analysis: Forecasting and Control. San Francisco: Holden-Day.
Brown, S. 2012. The Effects of a Modified Dairy Security Act of 2011 on Dairy Markets. Report published by the Integrated Policy Group (IPGr), Division of Applied Social Sciences, College of Agriculture, Food and Natural Resources (CAFNR), University of Missouri, April.
Chavas, Jean Paul and Matthew Holt. 1993. Market Instability and Nonlinear Dynamics. American Journal of Agricultural Economics, 75:113-120.
Chopra, S. and P. Meindl. 2012. Supply Chain Management: Strategy, Planning and Operation. Prentice Hall.
Chidmi, Benaissa and Mohamadou L. Fadiga. 2007. Dynamics of Price-Cost Margins in the US Meat Industry. Selected Paper prepared for presentation at the AAEA Annual Meeting, Portland, OR, July 29-August 1, 2007.
Commandeur, J. J. F. and S. J. Koopman. 2007. An Introduction to State Space Time Series Analysis. Oxford: Oxford University Press.
Durbin, J. and S. J. Koopman. 2001. Time Series Analysis by State Space Methods. Oxford: Oxford University Press.
Hunt, T. and M. Kern. 2012. Dysrhythmia: The End of the Old US Dairy Price Cycle. Rabobank Industry Note 335, October.
Koopman, Siem Jan, Andrew C. Harvey, Jurgen A. Doornik and Neil Shepard. 2007. Structural Time Series Analyser and Modeler and Predictor: STAMP8. London: Timberlake Consultants Ltd.

18
Ledman, M. “Will the three-year price cycle sack milk prices?” Hoard’s Dairyman, October 2011. << http://www.hoards.com/11oct10-milk-price-cycle, accessed 8/27/13 >>
Lee, H. L., V. Pradmanabhan and S. Whang. 1997. The Bullwhip Effect in Supply Chains. MIT Sloan Management Review, 38:93-102.
McCullough, M. P., R. Huffaker and T. L. Marsh. 2012. Endogenously Determined Cycles: Empirical Evidence from Livestock Industries. Nonlinear Dynamics, Psychology and Life Sciences. 16:205-231.
Mundlak, Yair and He Huang. 1996. International Comparisons of Cattle Cycles. American Journal of Agricultural Economics, 78:855-868.
Nicholson, C. F. and M. W. Stephenson. 2011. Analysis of the Impacts of a Farm Savings Account Program for US Dairy Farmers. [unpublished manuscript]
Nicholson, C. F. and M. W. Stephenson. 2014. Dynamic Market Impacts of the Dairy Margin Protection Program of the Agricultural Act of 2014. Program on Dairy Markets and Policy, Working Paper 14-03, May.
North, Michael J. and Charles M. Macal. 2007. Managing Business Complexity: Discovering Strategic Solutions with Agent-based Modeling and Simulation. Londdon: Oxford University Press.
Novakovic, A. M. 2009. Dairy Market Price Volatility: Causes, Consequences and Solutions. Presentation at workshop Organized by the Extension Education Committee of the National Institute for Livestock and Dairy Policy, Chicago, IL, June 9, 2009.
Pagel, Erica. 2005. Dynamic Patterns of Change in Structure Under Different Support Policy Regimes: an Examination of US Dairy Farming. MS Thesis, Cornell University.
Sterman, John D. 2000. Business Dynamics: Systems Thinking and Modeling for a Complex World. Boston: Irwin/McGraw-Hill.
Tomek, W.G. and K.L. Robinson. 1982. Agricultural Product Prices. Ithaca and London: Cornell University Press.
US Department of Agriculture. 2011. Report of the Dairy Industry Advisory Committee. Submitted to the Secretary of Agriculture, March.

19
APPENDIX FIGURES
Figure A1. Evaluation of Residuals from State-space Model Using 1996(2) to 2014(1)
Data, $/cwt
Figure A2. Estimated Model for 2006(2)-2014(1), $/cwt