profit planning and standard costs & operating performance measures”
34
“Case study on profit planning and standard costs & operating performance measures” Course: Managerial Accounting Course code: 302 Submitted to: Shakila Halim Lecturer Department of Finance University of Dhaka Submitted by: Group: Section: A Department of Finance University of Dhaka Date of Submission: 28 th June 2015
-
Upload
rifat-ahsan -
Category
Business
-
view
122 -
download
0
Transcript of profit planning and standard costs & operating performance measures”

“Case study on profit planning and standard costs & operating
performance measures”
Course: Managerial Accounting
Course code: 302
Submitted to:
Shakila Halim Lecturer Department of Finance University of Dhaka
Submitted by:
Group: Section: A Department of Finance University of Dhaka Date of Submission: 28th June 2015

Group Members:
Serial Name ID
1 Maruf Hossain 19-013
2 Manjurul Ahsan 19-099
3 Md. Abdul Quyum 19-121
4 Md. Ripon Molla 19-123
5 Raqib Hossain 19-157

Letter of Transmittal 28th June 2015 Shakila Halim Lecturer Department of Finance University of Dhaka
Subject: A report on “Case study on profit planning and standard costs &operating performance
measures”
Honorable Madam, This is a great pleasure for us to submit the report on “Case study on profit planning and standard costs
& operating performance measures” as a partial requirement of the BBA program in University of
Dhaka.
Preparation of this report has been a great pleasure & an interesting experience. It enabled us to know about profit planning more broadly than before and also their economic condition. This report helped us tremendously to understand and to know the various term of profit planning and standard costs & operating performance measures. We have undertaken our sincere effort for successful completion of the BBA program. If we have any unintentional errors and omissions that may have entered into this report will be considered with sympathy. Therefore, we beg your kind consideration in this regard, we will be very grateful if you accept our report and oblige there by. Sincerely, On the behalf of members of group

Acknowledgement
We would like to pay our gratitude to all of the related books, articles, journals, authors and related Web Sites that helped us a lot for the completion of this report before, during, and after the working period. At first we would like to acknowledge the Almighty, who helped us every time and was with us and gave us moral support and strength every moment. We are especially grateful to our honorable course instructor Shakila Halim for giving us valuable
suggestions and support to prepare this report. Without her advice and support, it would not be
possible for us to prepare this report.

Executive Summary
The report shows a hypothetical case on profit planning and standard costs & operating
performance measures. Budgeting is an estimate of costs, revenues, and resources over a
specified period, reflecting a reading of future financial conditions and goals. The process of
creating a budget takes management away from its short-term, day-to-day management of
the business and forces it to think longer-term.
The master budget is the aggregation of all lower-level budgets produced by a company's
various functional areas, and also includes budgeted financial statements, cash forecast,
and a financing plan. The master budget is typically presented in either a monthly or
quarterly format or usually covers a company's entire fiscal year. An explanatory text may
be included with the master budget, which explains the company's strategic direction, how
the master budget will assist in accomplishing specific goals, and the management actions
needed to achieve the budget. A properly structured budget should derive the amount of
cash that will be spun off or which will be needed to support operations. This information
is used by the treasurer to plan for the company's funding needs.
The variance calculations that typically accompany a standard costing report are
accumulated in aggregate for a company’s entire production department, and so are unable
to provide information about discrepancies at a lower level, such as the individual work
cell, batch, or unit.

Table of Contents Chapter-1 ...................................................................................................................................................... 7
Introduction .................................................................................................................................................. 7
1.1 Introduction: ........................................................................................................................................... 8
1.2 Origin of the Study: ................................................................................................................................. 8
1.3 Objective of the Study: ........................................................................................................................... 8
1.4 Scope of study: ........................................................................................................................................ 9
1.5 Methodology: .......................................................................................................................................... 9
Chapter 2 ..................................................................................................................................................... 10
Budgeting & its Negative and Positive Aspects .......................................................................................... 10
2.1 What is Budgeting? ............................................................................................................................... 11
2.2 Why do Budgeting? ............................................................................................................................... 11
Planning orientation ................................................................................................................................... 11
Profitability review ...................................................................................................................................... 11
Performance evaluations ............................................................................................................................ 11
Funding planning ......................................................................................................................................... 12
Cash allocation ............................................................................................................................................ 12
Bottleneck analysis ..................................................................................................................................... 12
2.3 Limitations & Disadvantages of Budgeting: .......................................................................................... 12
Time required. ............................................................................................................................................. 12
Gaming the system. .................................................................................................................................... 12
Blame for outcomes .................................................................................................................................... 13
Expense allocations .................................................................................................................................... 13
Spend it or lose it ........................................................................................................................................ 13
Only considers financial outcomes ............................................................................................................. 13
Strategic rigidity .......................................................................................................................................... 13
2.4 What is Master Budget? ....................................................................................................................... 14
2.5 Components of Master Budget: ............................................................................................................ 14
2.7 Standard Cost & Operating Performance Measures: ........................................................................... 15
What is Standard Costing? .......................................................................................................................... 15
Why do Standard Costing? .......................................................................................................................... 15
Budgeting. ................................................................................................................................................... 15

Inventory costing ........................................................................................................................................ 15
Overhead application .................................................................................................................................. 16
Price formulation ........................................................................................................................................ 16
Limitation of standard costing: ................................................................................................................... 16
Cost-plus contracts ..................................................................................................................................... 16
Drives inappropriate activities .................................................................................................................... 16
Fast-paced environment ............................................................................................................................. 17
Slow feedback ............................................................................................................................................. 17
Unit-level information ................................................................................................................................. 17
Chapter 3 ..................................................................................................................................................... 18
Hypothetical Case of Budgeting .................................................................................................................. 18
Schedule 1: .................................................................................................................................................. 19
Schedule 2: .................................................................................................................................................. 21
Schedule 3: .................................................................................................................................................. 22
Schedule 4: .................................................................................................................................................. 23
Schedule 5: .................................................................................................................................................. 24
Schedule 6: .................................................................................................................................................. 25
Schedule 7: .................................................................................................................................................. 26
Schedule 8: .................................................................................................................................................. 27
Schedule 9: .................................................................................................................................................. 28
Schedule 10: ................................................................................................................................................ 29
Chapter 4 ..................................................................................................................................................... 30
Comparison between actual and standard operation ................................................................................ 30
Direct Material Variance ............................................................................................................................. 31
Direct Labor Variance .................................................................................................................................. 31
Variable Overhead Variance ....................................................................................................................... 32
Conclusion: .................................................................................................................................................. 33

Chapter-1
Introduction

1.1 Introduction: A budget is a quantitative expression of a plan for a defined period of time. It may include
planned sales volumes and revenues, resource quantities, costs and expenses, assets,
liabilities and cash flows. It expresses strategic plans of business units, organizations,
activities or events in measurable terms. Budget should be logical and have basement for
historical data. In a budget, we need to consider future possibilities as well as the future
threat that can affect company’s operation.
1.2 Origin of the Study: This paper is prepared for Ms. Shakila Halim Course instructor of “Managerial Accounting”,
Department of Finance, and Faculty of Business Studies at University of Dhaka as a partial
requirement of the course. Our course instructor has assigned us to make a report on “Case
Study on Budgeting & Standard Cost and Operating Performance Measures”. This report is
prepared during the first Semester, Third Year and would be submitted in the same
semester. The standard procedure for the long, formal report is followed here as part of the
instruction of the course instructor.
1.3 Objective of the Study: The main objectives of this report are stated below:
To review the concept of budgeting
To know the practical implication of budgeting
To overview the steps of budgeting
To develop future forecasting skill
To review the concept of standard cost and operating performance measures.
To outline the importance of standard cost and operating performance measures.
To review the method of real-life variance
To apply the knowledge in practical problem

1.4 Scope of study: This report will give a clear idea about “Case study on profit planning and standard costs &
operating performance measures”
What is profit Budgeting?
What are the ways of budget planning?
What are the steps of budget planning?
What is the importance of Budget Planning?
How does budget planning use in practical world?
What is standard cost and operating performance measures?
What is the importance of it?
What is the application in real case of standard cost and operating performance?
1.5 Methodology: Each and every information used here is hypothetical.
Assumptions are done after study on this sector.
Logical flow of information is maintained over calculations and assumptions.
Steps are taken from Course Book ( Managerial Accounting, Garrison-Noreen-
Brewer)

Chapter 2
Budgeting & its Negative and Positive
Aspects
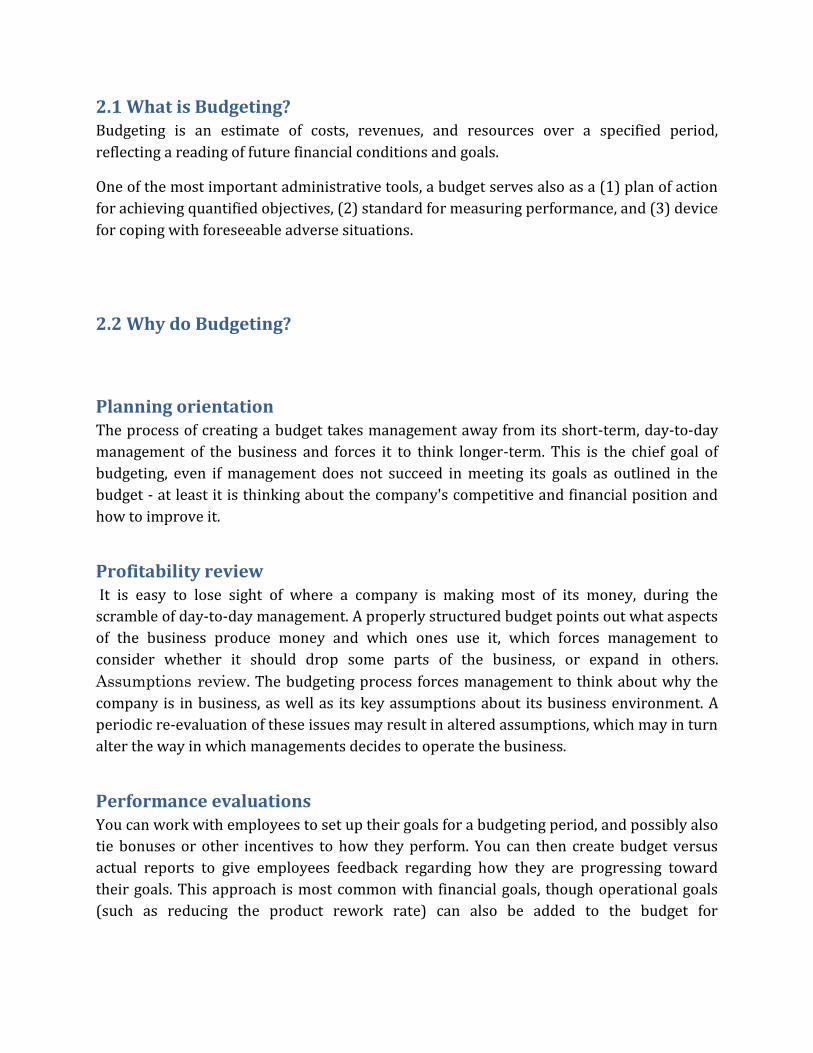
2.1 What is Budgeting? Budgeting is an estimate of costs, revenues, and resources over a specified period,
reflecting a reading of future financial conditions and goals.
One of the most important administrative tools, a budget serves also as a (1) plan of action
for achieving quantified objectives, (2) standard for measuring performance, and (3) device
for coping with foreseeable adverse situations.
2.2 Why do Budgeting?
Planning orientation The process of creating a budget takes management away from its short-term, day-to-day
management of the business and forces it to think longer-term. This is the chief goal of
budgeting, even if management does not succeed in meeting its goals as outlined in the
budget - at least it is thinking about the company's competitive and financial position and
how to improve it.
Profitability review It is easy to lose sight of where a company is making most of its money, during the
scramble of day-to-day management. A properly structured budget points out what aspects
of the business produce money and which ones use it, which forces management to
consider whether it should drop some parts of the business, or expand in others.
Assumptions review. The budgeting process forces management to think about why the
company is in business, as well as its key assumptions about its business environment. A
periodic re-evaluation of these issues may result in altered assumptions, which may in turn
alter the way in which managements decides to operate the business.
Performance evaluations You can work with employees to set up their goals for a budgeting period, and possibly also
tie bonuses or other incentives to how they perform. You can then create budget versus
actual reports to give employees feedback regarding how they are progressing toward
their goals. This approach is most common with financial goals, though operational goals
(such as reducing the product rework rate) can also be added to the budget for

performance appraisal purposes. This system of evaluation is called responsibility
accounting.
Funding planning A properly structured budget should derive the amount of cash that will be spun off or
which will be needed to support operations. This information is used by the treasurer to
plan for the company's funding needs.
Cash allocation There is only a limited amount of cash available to invest in fixed assets and working
capital, and the budgeting process forces management to decide which assets are most
worth investing in.
Bottleneck analysis Nearly every company has a bottleneck somewhere, and the budgeting process can be
used to concentrate on what can be done to either expand the capacity of that bottleneck or
to shift work around it.
2.3 Limitations & Disadvantages of Budgeting:
Time required. It can be very time-consuming to create a budget, especially in a poorly-organized
environment where many iterations of the budget may be required. The time involved is
lower if there is a well-designed budgeting procedure in place, employees are accustomed
to the process, and the company uses budgeting software. The time requirement can be
unusually large if there is a participative budgeting process in place, since such a system
involves an unusually large number of employees.
Gaming the system. An experienced manager may attempt to introduce budgetary slack, which involves
deliberately reducing revenue estimates and increasing expense estimates, so that he can
easily achieve favorable variances against the budget. This can be a serious problem, and
requires considerable oversight to spot and eliminate.
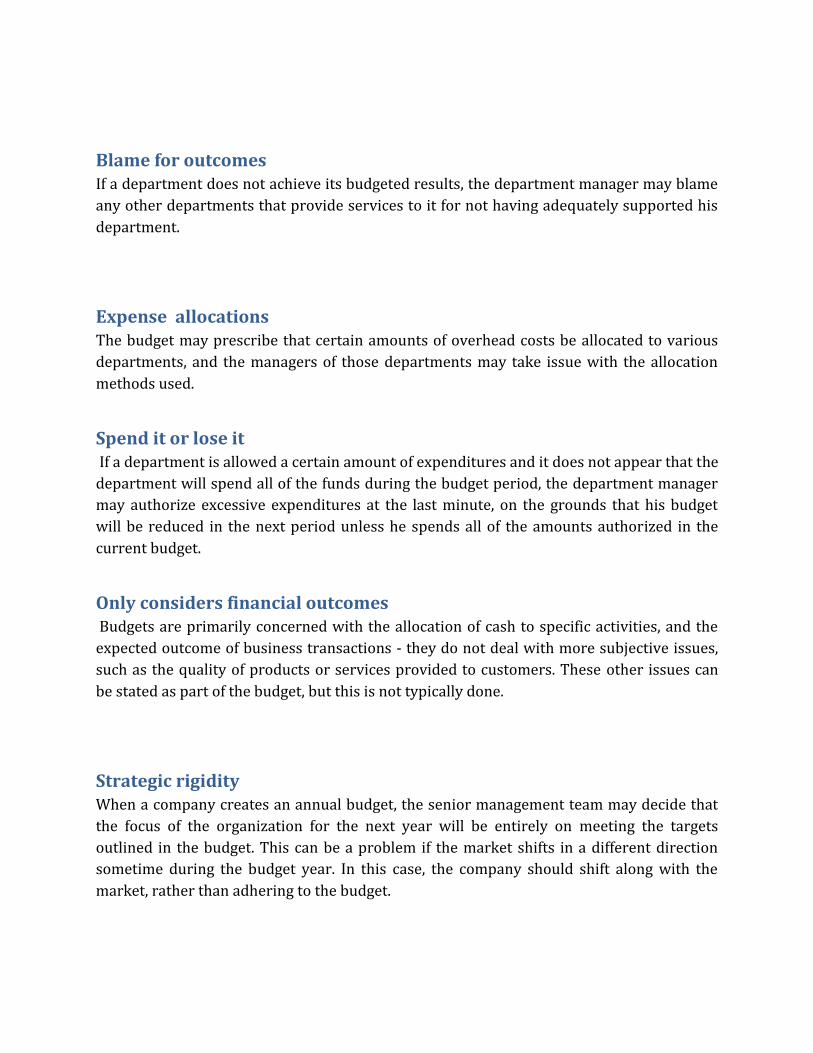
Blame for outcomes If a department does not achieve its budgeted results, the department manager may blame
any other departments that provide services to it for not having adequately supported his
department.
Expense allocations The budget may prescribe that certain amounts of overhead costs be allocated to various
departments, and the managers of those departments may take issue with the allocation
methods used.
Spend it or lose it If a department is allowed a certain amount of expenditures and it does not appear that the
department will spend all of the funds during the budget period, the department manager
may authorize excessive expenditures at the last minute, on the grounds that his budget
will be reduced in the next period unless he spends all of the amounts authorized in the
current budget.
Only considers financial outcomes Budgets are primarily concerned with the allocation of cash to specific activities, and the
expected outcome of business transactions - they do not deal with more subjective issues,
such as the quality of products or services provided to customers. These other issues can
be stated as part of the budget, but this is not typically done.
Strategic rigidity When a company creates an annual budget, the senior management team may decide that
the focus of the organization for the next year will be entirely on meeting the targets
outlined in the budget. This can be a problem if the market shifts in a different direction
sometime during the budget year. In this case, the company should shift along with the
market, rather than adhering to the budget.

2.4 What is Master Budget?
The master budget is the aggregation of all lower-level budgets produced by a company's
various functional areas, and also includes budgeted financial statements, cash forecast,
and a financing plan. The master budget is typically presented in either a monthly or
quarterly format or usually covers a company's entire fiscal year. An explanatory text may
be included with the master budget, which explains the company's strategic direction, how
the master budget will assist in accomplishing specific goals, and the management actions
needed to achieve the budget. There may also be a discussion of the headcount changes
that are required to achieve the budget. A master budget is the central planning tool that a
management team uses to direct the activities of a corporation, as well as to judge the
performance of its various responsibility centers. It is customary for the senior
management team to review a number of iterations of the master budget and incorporate
modifications until it arrives at a budget that allocates funds to achieve the desired results.
Hopefully, a company uses participative budgeting to arrive at this final budget, but it may
also be imposed on the organization by senior management, with little input from other
employees.
2.5 Components of Master Budget: Master budget has two major sections which are the operational budget and the financial
budget. They have following components:
1. Operational Budget
Sales Budget
Production Budget
Direct Material Purchases Budget
Direct Labor Budget
Overhead Budget
Selling and Administrative Expenses Budget
Cost of Goods Manufactured Budget
2. Financial Budget
Schedule of Expected Cash Receipts from Customers
Schedule of Expected Cash Payments to Suppliers
Cash Budget
Budgeted Income Statement
Budgeted Balance Sheet

2.7 Standard Cost & Operating Performance Measures:
What is Standard Costing? Standard costing is an important subtopic of cost accounting. Standard costs are usually
associated with a manufacturing company's costs of direct material, direct labor, and
manufacturing overhead. Standard costing is the practice of substituting an expected cost
for an actual cost in the accounting records, and then periodically recording variances
showing the difference between the expected and actual costs.
Why do Standard Costing? Though most companies do not use standard costing in its original application of
calculating the cost of ending inventory, it is still useful for a number of other applications.
In most cases, users are probably not even aware that they are using standard costing, only
that they are using an approximation of actual costs. Here are some potential uses:
Budgeting. A budget is always composed of standard costs, since it would be impossible to include in
it the exact actual cost of an item on the day the budget is finalized. Also, since a key
application of the budget is to compare it to actual results in subsequent periods, the
standards used within it continue to appear in financial reports through the budget period.
Inventory costing It is extremely easy to print a report showing the period-end inventory balances (if you are
using a perpetual inventory system), multiply it by the standard cost of each item, and
instantly generate an ending inventory valuation. The result does not exactly match the
actual cost of inventory, but it is close. However, it may be necessary to update standard
costs frequently, if actual costs are continually changing. It is easiest to update costs for the
highest-dollar components of inventory on a frequent basis, and leave lower-value items
for occasional cost reviews.

Overhead application If it takes too long to aggregate actual costs into cost pools for allocation to inventory, then
you may use a standard overhead application rate instead, and adjust this rate every few
months to keep it close to actual costs.
Price formulation If a company deals with custom products, then it uses standard costs to compile the
projected cost of a customer’s requirements, after which it adds on a margin. This may be
quite a complex system, where the sales department uses a database of component costs
that change depending upon the unit quantity that the customer wants to order. This
system may also account for changes in the company’s production costs at different volume
levels, since this may call for the use of longer production runs that are less expensive.
Limitation of standard costing: Despite the advantages just noted for some applications of standard costing, there are
substantially more situations where it is not a viable costing system. Here are some
problem areas:
Cost-plus contracts If you have a contract with a customer under which the customer pays you for your costs
incurred, plus a profit (known as a cost-plus contract), then you must use actual costs, as
per the terms of the contract. Standard costing is not allowed.
Drives inappropriate activities A number of the variances reported under a standard costing system will drive
management to take incorrect actions to create favorable variances. For example, they may
buy raw materials in larger quantities in order to improve the purchase price variance,
even though this increases the investment in inventory. Similarly, management may
schedule longer production runs in order to improve the labor efficiency variance, even
though it is better to produce in smaller quantities and accept less labor efficiency in
exchange.

Fast-paced environment A standard costing system assumes that costs do not change much in the near term, so that
you can rely on standards for a number of months or even a year, before updating the costs.
However, in an environment where product lives are short or continuous improvement is
driving down costs, a standard cost may become out-of-date within a month or two.
Slow feedback A complex system of variance calculations are an integral part of a standard costing system,
which the accounting staff completes at the end of each reporting period. If the production
department is focused on immediate feedback of problems for instant correction, the
reporting of these variances is much too late to be useful.
Unit-level information The variance calculations that typically accompany a standard costing report are
accumulated in aggregate for a company’s entire production department, and so are unable
to provide information about discrepancies at a lower level, such as the individual work
cell, batch, or unit.

Chapter 3
Hypothetical Case of Budgeting

Fortuna Perfume Ltd.
31st July, 2016
Schedule 1:
Assumptions for Sales Budget
Budgeted Sales 500000 Unit
Quarter 1 100000 Unit
Quarter 2 200000 Unit
Quarter 3 100000 Unit
Quarter 4 100000 Unit
Selling Price 200 Taka
Percentage of sales on account 50%
Percentage of sales on Cash 50%
Account Receivable 500000 Taka
Fortuna Perfume Ltd.
31st July, 2016
Sales Budget
Quarter Total
1 2 3 4
Budgeted Sales Unit
100,000
200,000
100,000
100,000
500,000
Sales Price 180 180 180 180 180
Total Sales ( TK. )
18,000,000
36,000,000
18,000,000
18,000,000
90,000,000

Expected Cash Collection
Quarter Total
1 2 3 4
Beginning Account Receivable
8,000,000
8,000,000
1st Quarter 9,000,000
9,000,000
18,000,000
2nd Quarter 18,000,000
18,000,000
36,000,000
3rd Quarter 9,000,000
9,000,000
18,000,000
4th Quarter 9,000,000
9,000,000
Total Cash Collection 17000000 27,000,000
27,000,000
18,000,000
89,000,000

Schedule 2:
Fortuna Perfume Ltd.
31st July, 2016
Assumption for Production Budget
Ending Inventory for each quarter 15% of next quarter sales
Ending Inventory for last quarter 50000 Unit
Beginning Inventory 40000 Unit
Production Budget
Quarter Total
1 2 3 4
Budgeted Sales 100,000
200,000
100,000
100,000
500,000
Add: Desired Ending Inventory
30,000
15,000
15,000
50000 50000
Total Needs 130,000
215,000
115,000
150,000
550,000
Less: Beginning Inventory
40,000
30,000
15,000
15,000
40000
Required Production 90,000
185,000
100,000
135,000
510,000

Schedule 3:
Fortuna Perfume Ltd.
31st July, 2016
Assumption for Direct Material Budget
DM Needed Per Unit 10
Ending Inventory for each quarter 20% of Following Quarter
Beginning Inventory for each quarter 10% of Previous Quarter
Ending Inventory 500000
Beginning Inventory 400000
Percentage of buy on Cash 40%
Percentage of buy on Account 60%
Per Unit Price 6 TK.
A/C Payable 700000
Direct Material Budget
Quarter Total
1 2 3 4
Required Production 90,000
185,000
100,000
135,000
510,000
DM Needed Per Unit 10 10 10 10 10
Production Needs 900,000
1,850,000
1,000,000
1,350,000
5,100,000
Add: Ending Inventory 370,000
200,000
270,000
500000 500000
Total Needs 1,270,000
2,050,000
1,270,000
1,850,000
5,600,000
Less: Beginning Inventory
400000 370,000
200,000
270,000
400000
Raw Material to be Produced
870,000
1,680,000
1,070,000
1,580,000
5,200,000
Cost of RM per unit 6 6 6 6 6
Cost for RM 5,220,000
10,080,000
6,420,000
9,480,000
31,200,000

Expected Cash Payment
Quarter Total
1 2 3 4
Beginning Account Payable
700,000
700,000
1st Quarter 2,088,000
3,132,000
5,220,000
2nd Quarter 4,032,000
6,048,000
10,080,000
3rd Quarter 2,568,000
5,688,000
8,256,000
4th Quarter 3,792,000
3,792,000
Total Cash Collection 2788000 7,164,000
8,616,000
9,480,000
28,048,000
Schedule 4:
Fortuna Perfume Ltd.
31st July, 2016
Assumption for Direct Labor
Direct Labor per Unit 2
Cost per Unit 15
Direct Labor Budget
Quarter Total
1 2 3 4
Required Production
90,000
185,000
100,000
135,000
510,000
DL per Unit 2 2 2 2 2
Total Direct Labor
180,000
370,000
200,000
270,000
1,020,000
DL per Unit Cost 15 15 15 15 15
Total Cost 2,700,000
5,550,000
3,000,000
4,050,000
15,300,000

Schedule 5:
Fortuna Perfume Ltd.
31st July, 2016
Manufacturing Overhead Assumptions
Variable Manufacturing Overhead Rate 10
Fixed Manufacturing Overhead 1,000,000
Depreciation 500,000
Manufacturing Overhead Budget
Quarter Total
1 2 3 4
Budgeted Direct Labor 180,000
370,000
200,000
270,000
1,020,000
Variable Manufacturing Overhead Rate
10 10 10 10 10
Variable Manufacturing Overhead
1,800,000
3,700,000
2,000,000
2,700,000
10,200,000
Fixed Manufacturing Overhead
1000000 1000000 1000000 1000000 4000000
Total Manufacturing Overhead
2,800,000
4,700,000
3,000,000
3,700,000
14,200,000
Less: Depreciation 500,000
500000 500000 500000 2000000
Cash Disbursement for MO 2,300,000
4,200,000
2,500,000
3,200,000
12,200,000
Total Manufacturing Overhead 14,200,000
Budgeted Direct Labor Hour 1,020,000
Predetermined Overhead Rate 13.92

Schedule 6:
Fortuna Perfume Ltd.
31st July, 2016
Ending Finished Good Inventory Budget
Quantity Cost Total
Production Per Unit: 10 6 60
Direct Material 2 15 30
Direct Labor 2 13.92 27.84
Manufacturing Overhead
117.84
Unit Product Cost
Finished Goods Inventory:
Ending Finished Goods 3000
Per Unit Cost 117.84
Ending Finished Goods in TK.
353,529

Schedule 7:
Fortuna Perfume Ltd.
31st July, 2016
Assumption for Selling & Administrative Budget
Variable selling and administrative cost 10
Advertising 200000
Executive Salaries 500000
Insurance 100000
Property Tax 40000
Depreciation 60000
Selling & Administrative Budget
Quarter Total
1 2 3 4
Budgeted Sales Unit 100,000
200,000
100,000
100,000
500,000
Variable selling and administrative cost
10 10 10 10 10
Variable selling and administrative cost
1,000,000
2,000,000
1,000,000
1,000,000
5,000,000
Fixed Selling & Administrative Expense:
Advertising 200000 200000 200000 200000 800000
Executive Salaries 500000 500000 500000 500000 2000000
Insurance 100000 100000 100000 100000 400000
Property Tax 40000 40000 40000 40000 160000
Depreciation 60000 60000 60000 60000 240000
Total Fixed Selling & Administrative Expense
900000 900000 900000 900000 3600000
Total Selling & Administrative Expense
1,900,000
2,900,000
1,900,000
1,900,000
8,600,000
Less: Depriciation 60000 60000 60000 60000 240000
Cash Disbursement for selling & administrative Expense
1,840,000
2,840,000
1,840,000
1,840,000
8,360,000

Schedule 8: Fortuna Perfume Ltd.
31st July, 2016
Cash Budget
For the Year Ended December31,
Quarter Total
1 2 3 4
Cash & bank balance beginning
1,500,000
8,372,000
15,118,000
25,662,000
1,500,000
Add receipts:
Collections from customers 17,000,000
27,000,000
27,000,000
18,000,000
89,000,000
Total cash available 18,500,000
35,372,000
42,118,000
43,662,000
90,500,000
Less disbursements
Direct materials 2,788,000
7,164,000
8,616,000
9,480,000
28,048,000
Direct labor 2,700,000
5,550,000
3,000,000
4,050,000
15,300,000
Manufacturing overhead 2,800,000
4,700,000
3,000,000
3,700,000
14,200,000
Selling and administrative 1,840,000
2,840,000
1,840,000
1,840,000
8,360,000
Equipment purchase 10,000,000
10,000,000
Total disbursments 20,128,000
20,254,000
16,456,000
19,070,000
75,908,000
Excess(deficiency) of cash (1,628,000)
15,118,000
25,662,000
24,592,000
14,592,000
Borrowings(at the begaining of the quarter)
10,000,000
10,000,000
Repayments (10,000,000)
(10,000,000)
Interest (1,200,000)
(1,200,000)
Total financing 10,000,000
-12000000
Cash balance,ending 8,372,000
15,118,000
25,662,000
13,392,000
13,392,000

Schedule 9:
Fortuna Perfume Ltd.
31st July, 2016
Income Statement
For the Year Ended December 31,
BDT
Sales 90,000,000
Cost of goods sold 65,902,200
Gross margin 24,097,800
Selling and administrative expense 8,360,000
Net operating income 15,737,800
Interest expense 1,200,000
Net income 14,537,800

Schedule 10:
Fortuna Perfume Ltd.
Balance Sheet
31st July, 2016
Balance Sheet
As on December 31,2016
BDT
Current Assets:
Cash & bank balance 13,392,000
Accounts receivable 9,000,000
Raw materials inventory 3,000,000
Finished goods inventory 353,529
Total current assets
25,745,529
Plant & equipment
Land 5,000,000
Buildings and equipment 40,000,000
45,000,000
Accumulated depreciation 2,240,000
Plant & equipment net
42,760,000
Total assets 68,505,529
Liabilities& owners’ equity
Current liabilities:
Accounts payable
5,688,000
Long-term loan
10,000,000
Stockholders’ equity
Common stock 7,000,000
Retained earnings 12,491,660
Total stockholder equity
19,491,660
Total liabilities & stockholder equity 35,179,660

Chapter 4
Comparison between actual and standard
operation
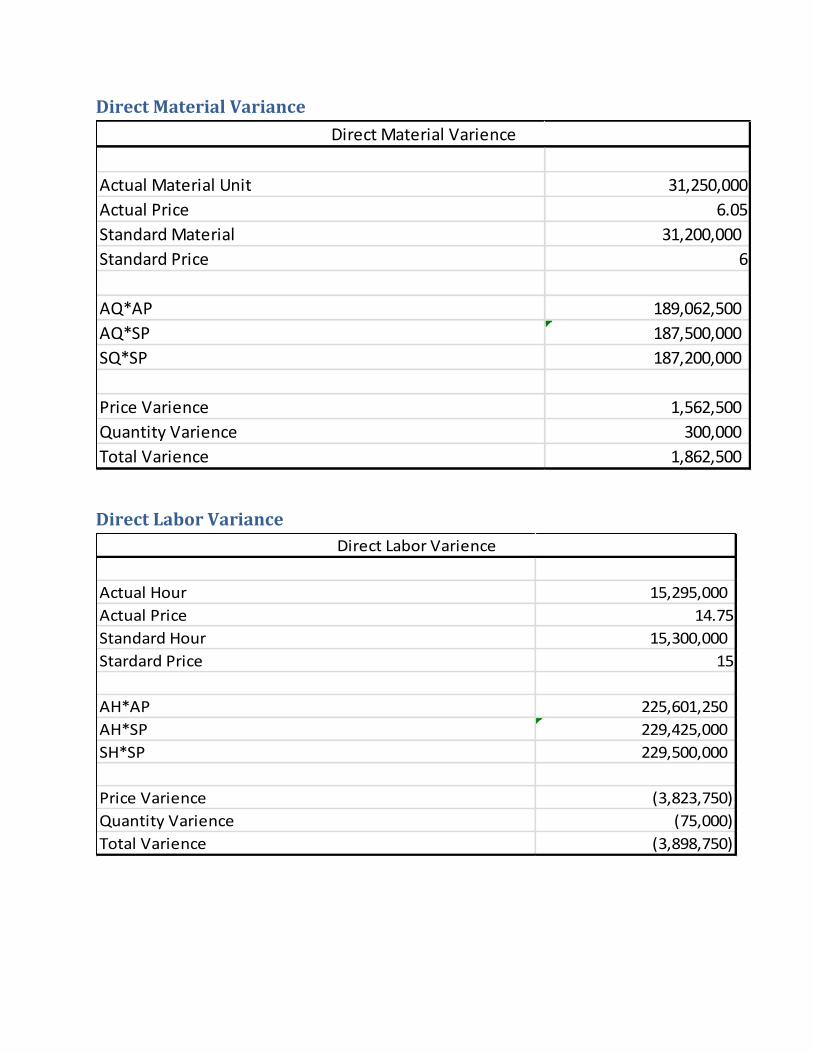
Direct Material Variance
Direct Labor Variance
Actual Material Unit 31,250,000
Actual Price 6.05
Standard Material 31,200,000
Standard Price 6
AQ*AP 189,062,500
AQ*SP 187,500,000
SQ*SP 187,200,000
Price Varience 1,562,500
Quantity Varience 300,000
Total Varience 1,862,500
Direct Material Varience
Actual Hour 15,295,000
Actual Price 14.75
Standard Hour 15,300,000
Stardard Price 15
AH*AP 225,601,250
AH*SP 229,425,000
SH*SP 229,500,000
Price Varience (3,823,750)
Quantity Varience (75,000)
Total Varience (3,898,750)
Direct Labor Varience

Variable Overhead Variance
Actual Hour 14205000
Actual Price 9.75
Standard Hour 14,200,000
Stardard Price 10
AH*AP 138,498,750
AH*SP 142,050,000
SH*SP 142,000,000
Price Varience (3,551,250)
Quantity Varience 50,000
Total Varience (3,501,250)
Varience of Manufacturing Overhead

Conclusion:
A budget is a quantitative expression of a plan for a defined period of time. It includes
planned sales volumes and revenues, resource quantities, costs and expenses, assets,
liabilities and cash flows. It expresses strategic plans of business units, organizations,
activities or events in measurable terms. It should be properly managed or the
organizational goals cannot be gained. . Planning is accomplished through the preparation of a
number of budgets, which, when brought through, from an integrated business plan known as
master budget. The master budget is an essential management tool that communicates
management’s plan throughout the organization, allocates resources, and coordinates activities.
Budget should be logical and have basement for historical data. In a budget, we need to
consider future possibilities as well as the future threat that can affect company’s
operation. This will help mangers to accomplish their decisions.