PROFILE ON RED OXIDE PAINT (ANTI-RUST) PRODUCTION · This profile envisages the establishment of a...
26
66. PROFILE ON THE PRODUCTION OF RED OXIDE PAINT
Transcript of PROFILE ON RED OXIDE PAINT (ANTI-RUST) PRODUCTION · This profile envisages the establishment of a...

66. PROFILE ON THE PRODUCTION OF
RED OXIDE PAINT
66-1
TABLE OF CONTENTS
PAGE
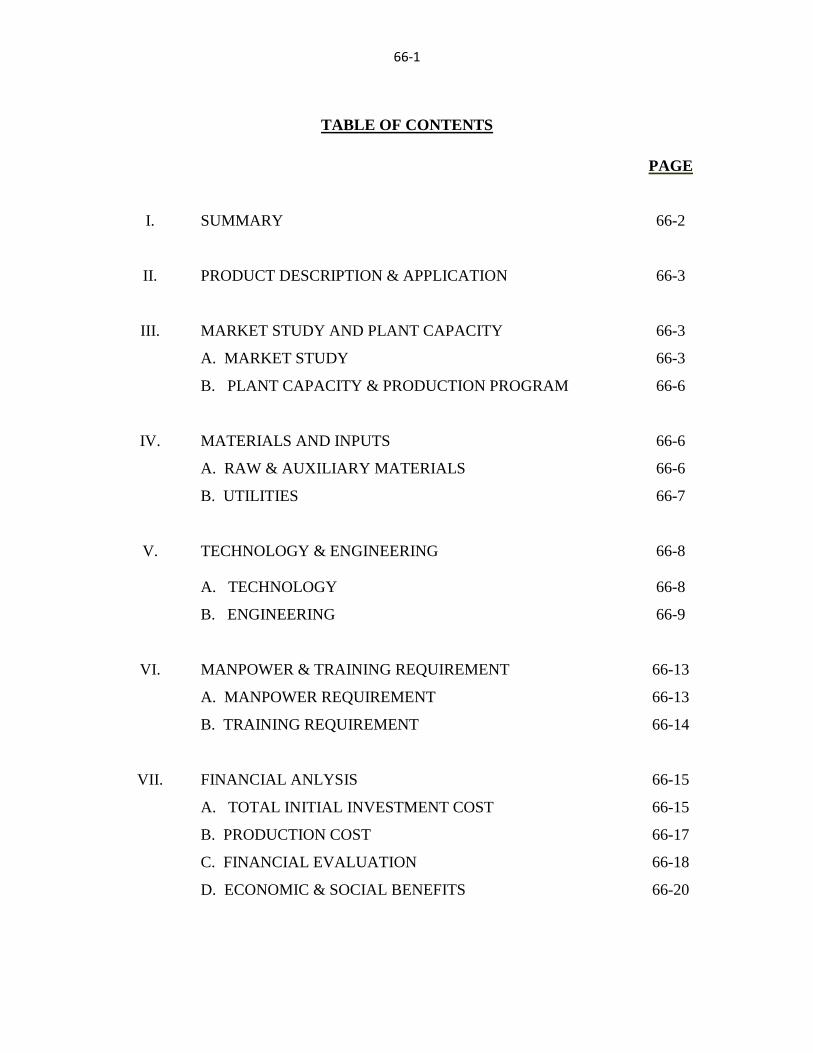
I. SUMMARY 66-2
II. PRODUCT DESCRIPTION & APPLICATION 66-3
III. MARKET STUDY AND PLANT CAPACITY 66-3
A. MARKET STUDY 66-3
B. PLANT CAPACITY & PRODUCTION PROGRAM 66-6
IV. MATERIALS AND INPUTS 66-6
A. RAW & AUXILIARY MATERIALS 66-6
B. UTILITIES 66-7
V. TECHNOLOGY & ENGINEERING 66-8
A. TECHNOLOGY 66-8
B. ENGINEERING 66-9
VI. MANPOWER & TRAINING REQUIREMENT 66-13
A. MANPOWER REQUIREMENT 66-13
B. TRAINING REQUIREMENT 66-14
VII. FINANCIAL ANLYSIS 66-15
A. TOTAL INITIAL INVESTMENT COST 66-15
B. PRODUCTION COST 66-17
C. FINANCIAL EVALUATION 66-18
D. ECONOMIC & SOCIAL BENEFITS 66-20

66-2
I. SUMMARY
This profile envisages the establishment of a plant for the production of red oxide paint with a
capacity of 1,000 tons per annum. Red oxide paint is a coating applied to a surface or substrate
(base material) to decorate and protect the material from corrosion.
The country`s requirement of red oxide paint is met through import. The present (2012) demand
for red oxide paint is estimated at 693 tons. The demand for the product is projected to reach to
1,228 tones and 1,978 tones by the years 2018 and 2023, respectively.
The principal raw materials required are pickle liquor, iron scrap, soda ash, magnesium
carbonate, zinc chromate, microtalc, whiting (caco3), cobalt naphthenate, lead naphethenate,
M.T.O and matie varnish. All raw materials except iron scrap, soda ash and calcium carbonate
have to be imported.
The total investment cost of the project including working capital is estimated at Birr 19.74
million. From the total investment cost the highest share (Birr 14.90 million or 71.38%) is
accounted by fixed investment cost followed by initial working capital (3.65 million or 18.51%)
and pre operation cost (Birr 1.20 million or 10.11%). From the total investment cost, Birr 6.48
million or 32.83% is required in foreign currency.
The project is financially viable with an internal rate of return (IRR) of 20.13% and a net present
value (NPV) of Birr 11.85 million, discounted at 10%.
The project can create employment for 22 persons. The establishment of such factory will have a
foreign exchange saving effect to the country by substituting the current imports. The project
will also create backward linkage with the chemical manufacturing sub sector and also generates
income for the Government in terms of tax revenue and payroll tax.

66-3
II. PRODUCTION DESCRIPTION AND APPLICATION
Paints are surface coating fluid materials which, when spread over a surface in the form of a thin
layer, will form a solid, adherent and cohesive film. Paints can be defined as coatings applied to
a surface or substrate (base material) to decorate and protect it or perform some other specialized
functions.
The red oxide paints are manufactured from red iron oxide which can be obtained either from
nature or manufactured synthetically from scrap iron. The fluid red oxide paint contains three
major ingredients that are pigment, binders and these can be varied to produce films with any
desired physical and application characteristics.
Red oxide paints are widely used in the decorative as well as in industrial coatings. The function
of red oxide pigment is to provide color and opacity, to enhance film’s durability and hardness
and in primers to suppress corrosion and reduce the moisture permeability of films.
III. MARKET STUDY AND PLANT CAPACITY
A. MARKET STUDY
1. Past Supply and Present Demand
The demand for red/iron oxide paints is largely met through import. Table 3.1 presents the total
imported quantity of iron oxides & hydroxides and iron (iii) oxides in the past 12 years covering
the period 2000--2011.
As could be seen from Table 3.1, import of red/iron oxide paint in the past 12 years has shown a
general increasing trend except slight fluctuations in few years. During the initial three year of
the data set i.e. year 2000--2002 the yearly average volume of import was only 205 tons. But in
the following three years (2003--2005) it increased to a yearly average of 372 tons, which is an
increase of by about 81%. Similarly, during the period 2006--2008 and 2009--2011 the imported
quantity increased to a yearly average of 540 tones and 630 tones, respectively. Generally,
import of the product in the past 12 years has been growing by about 10% annually.

66-4
Table 3.1
IMPORT OF IRON OXIDE (TONS)
Year Import
2000 217
2001 178
2002 220
2003 382
2004 360
2005 375
2006 419
2007 511
2008 691
2009 770
2010 702
2011 420
Source: - Ethiopian Revenues and Customs Authority.
In order to estimate the present (year 2012) effective demand, the recent three years average has
been taken as a base. Then, the growth trend observed in the past 12 years, which is 10% per
annum, has been applied. Accordingly, the present demand for the product is set at 693 tons.
2. Projected Demand
Since the main application of the product is to protect corrosion (anti rust) its demand will grow
with the consumption of metal based products. Consumption of metal based products are in turn
influenced by many factors among which are income (GDP) rise, growth of the urban and rural
population, growth of the metal manufacturing sub-sector and the construction sector. Due to the
positive trends observed in the past and the feature prospects, the combined effects of the above
factors will boost the demand for the product. However, to be conservative an annual average
growth rate of only 10%, which is observed in the past, is taken in forecasting the future demand
(see Table 3.2).

66-5
Table 3.2
PROJECTED DEMAND FOR IRON OXIDE (TONS)
Year Projected
Demand
2013 762
2014 838
2015 922
2016 1,014
2017 1,116
2018 1,228
2019 1,351
2020 1,486
2021 1,634
2022 1,780
2023 1,978
The demand for red/ iron oxide paint will increase from 762 tons in the year 2013 to 1,228 tones
and 1,978 tones by the years 2018 and 2023, respectively.
3. Pricing and distribution
Based on year 2011 CIF value of the product and considering other costs related to import a
factory gate price of Birr 26,720 per tone is recommended for sales revenue projection and
financial evaluation.
Red/ iron oxide paint is used in various activities of the metal manufacturing and construction
sector. Its end users are numerous and cover a wide geographical area. Hence, the project has to
appoint agents and/or distributors in the major cities and towns of the country. Then, the final
consumers of the product will access the product from the existing building materials retail shops
which are widely distributed throughout the country.

66-6
B. PLANT CAPACITY AND PRODUCTION PROGRAM
1. Plant Capacity
Based on the indication of the market study, the production capacity at 100% capacity utilization
and 300 days’ two shift operation of the plant is 1,000 tons of red oxide paint per annum.
2. Production Program
The envisaged plant is scheduled to start production during first year at 60% of designed
capacity of the plant and to grow to 75%, 90% and 100% in year second, third and fourth years
of its production years.
IV. MATERIALS AND INPUTS
A. RAW MATERIALS
The major raw materials required for the production of red oxide paint are pickle liquor, iron
scrap, soda ash, magnesium carbonate, zinc chromate, microtalc, whiting (caco3), cobalt
naphthenate, lead naphethenate, M.T.O and matie varnish. All raw materials except iron scrap,
soda ash and calcium carbonate are to be imported. Annual requirement of raw materials at
100% capacity utilization of the plant and the respective cost is given in Table 4.1.

66-7
Table 4.1
RAW MATERIALS REQUIREMENT AND COST
Sr.No. Material Qty (Tons) Unit Price
('000
Birr)
Cost('000 Birr)
F.C L.C Total
1 Pickle Liquor 4,166.67 0.40 1,665.14 - 1,665.14
2 Iron Scrap 166.67 6.75 - 1,125.00 1,125.00
3 Soda Ash 500.00 5.85 - 2,925.00 2,925.00
4 Magnesium Carbonate 73.33 22.50 1,650.00 - 1,650.00
5 Zince Chromate 100.00 22.50 2,250.00 - 2,250.00
6 Microtalc 3.33 1.53 5.10 - 5.10
7 Whiting (CaCO3) 16.67 4.05 67.50 - 67.50
8 Cobalt Naphthenate 4.00 45.00 180.0 - 180.00
9 Lead Naphthenate 10.00 20.73 207.31 - 207.31
10 M.T.O 200.00 8.21 1,642.21 - 1,642.21
11 Matie Varnish 333.33 6.29 2,097.86 - 2,097.86
12 Plastic package 1,000,000 0.003 - 3,000.00 3,000.00
13 Labels (pcs) 1,000,000 0.001 - 1,000.00 1,000.00
Total 9,765.12 8,050.00 17,815.12
B. UTILITIES
The main required utilities by the envisaged plant are electricity and water. The annual electric
power and water demand of the plant is 186.67 MWH and 15,000 m3, respectively. The price rate
of electric power and water is: 0.65 Birr/kWh for electric power and 10 Birr/m3 for water.
Therefore, the total estimated annual expense of utility is Birr 254,666.67.
66-8
IV. TECHNOLOGY AND ENGINEERING
C. TECHNOLOGY
1. Production Processes
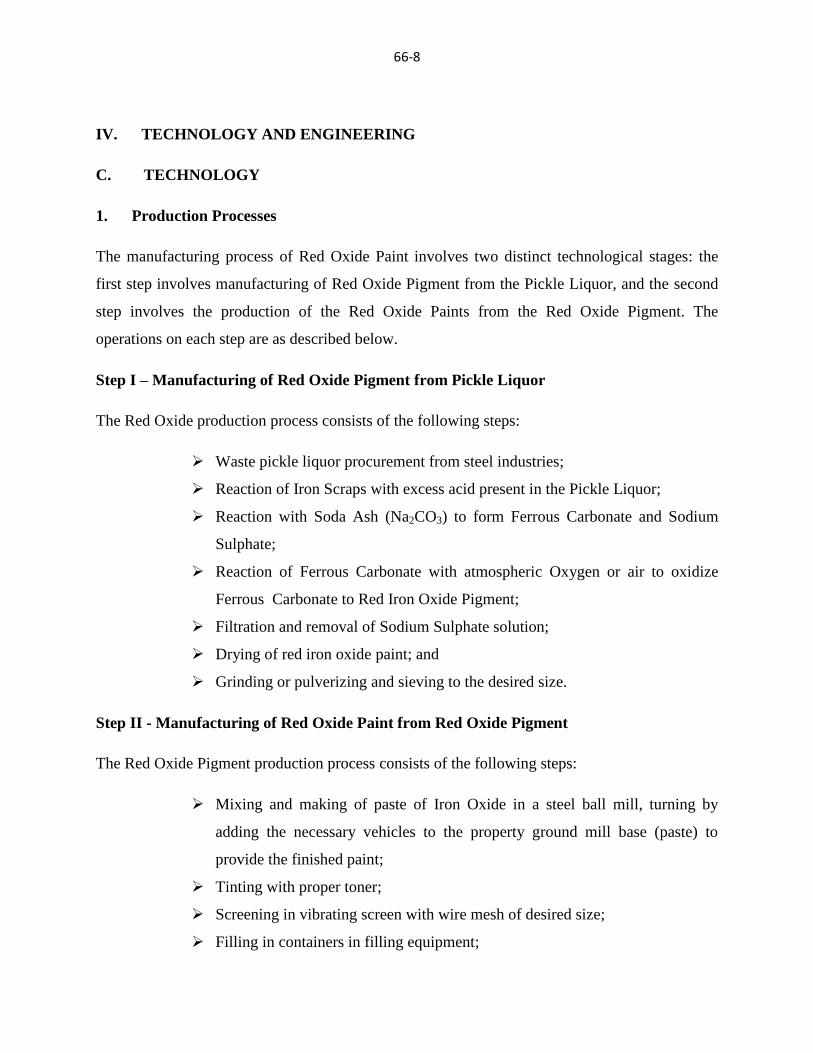
The manufacturing process of Red Oxide Paint involves two distinct technological stages: the
first step involves manufacturing of Red Oxide Pigment from the Pickle Liquor, and the second
step involves the production of the Red Oxide Paints from the Red Oxide Pigment. The
operations on each step are as described below.
Step I – Manufacturing of Red Oxide Pigment from Pickle Liquor
The Red Oxide production process consists of the following steps:
Waste pickle liquor procurement from steel industries;
Reaction of Iron Scraps with excess acid present in the Pickle Liquor;
Reaction with Soda Ash (Na2CO3) to form Ferrous Carbonate and Sodium
Sulphate;
Reaction of Ferrous Carbonate with atmospheric Oxygen or air to oxidize
Ferrous Carbonate to Red Iron Oxide Pigment;
Filtration and removal of Sodium Sulphate solution;
Drying of red iron oxide paint; and
Grinding or pulverizing and sieving to the desired size.
Step II - Manufacturing of Red Oxide Paint from Red Oxide Pigment
The Red Oxide Pigment production process consists of the following steps:
Mixing and making of paste of Iron Oxide in a steel ball mill, turning by
adding the necessary vehicles to the property ground mill base (paste) to
provide the finished paint;
Tinting with proper toner;
Screening in vibrating screen with wire mesh of desired size;
Filling in containers in filling equipment;

66-9
Labeling in labeling machine; and
Packaging in suitable cartons.
2. Environmental Impact
The production of red oxide paint does not have any negative impact on the environment.
B. ENGINEERING
1. Machinery and Equipment
The list and quantity of plant machinery and equipment required are given in Table 5.1. The
total cost of machinery and equipment is estimated at Birr 8.10 million out of which Birr 6.48
million is in foreign currency.
Table 5.1
LIST OF THE REQUIRED MACHINERY AND EQUIPMENT
Sr.No Description Qty.
1 Storage Tank 3
2 Settling Tank 2
3 Precipitation tank 1
4 Soda Ash Solution Tank 1
5 Oxidation Tank for Iron Oxide 1
6 Filter Press 1
7 Fluidized Bed Drier 1
8 Sieving Machine 1
9 Mini Boiler 1
10 Edge Runner 1
11 Ball Mill 1
12 Pulveriser 1
13 Mixer or Thinning Tank 1
14 D.G. Set 1

66-10
2. Land, Building and Civil Works
The total land area required by the plant is 1,500 m2, out of which the built-up area is 950 m
2.
Based on a rate of Birr 5,000 /m2
and the building and civil work cost are estimated to be Birr
4.75 million.
According to the Federal Legislation on the Lease Holding of Urban Land (Proclamation No
721/2004) in principle, urban land permit by lease is on auction or negotiation basis, however,
the time and condition of applying the proclamation shall be determined by the concerned
regional or city government depending on the level of development.
The legislation has also set the maximum on lease period and the payment of lease prices. The
lease period ranges from 99 years for education, cultural research health, sport, NGO , religious
and residential area to 80 years for industry and 70 years for trade while the lease payment
period ranges from 10 years to 60 years based on the towns grade and type of investment.
Moreover, advance payment of lease based on the type of investment ranges from 5% to
10%.The lease price is payable after the grace period annually. For those that pay the entire
amount of the lease will receive 0.5% discount from the total lease value and those that pay in
installments will be charged interest based on the prevailing interest rate of banks. Moreover,
based on the type of investment, two to seven years grace period shall also be provided.
However, the Federal Legislation on the Lease Holding of Urban Land apart from setting the
maximum has conferred on regional and city governments the power to issue regulations on the
exact terms based on the development level of each region.
In Addis Ababa, the City’s Land Administration and Development Authority is directly
responsible in dealing with matters concerning land. However, regarding the manufacturing
sector, industrial zone preparation is one of the strategic intervention measures adopted by the
City Administration for the promotion of the sector and all manufacturing projects are assumed
to be located in the developed industrial zones.

66-11
Regarding land allocation of industrial zones if the land requirement of the project is below
5,000 m2,
the land lease request is evaluated and decided upon by the Industrial Zone
Development and Coordination Committee of the City’s Investment Authority. However, if the
land request is above 5,000 m2 the request is evaluated by the City’s Investment Authority and
passed with recommendation to the Land Development and Administration Authority for
decision, while the lease price is the same for both cases.
Moreover, the Addis Ababa City Administration has recently adopted a new land lease floor
price for plots in the city. The new prices will be used as a benchmark for plots that are going to
be auctioned by the city government or transferred under the new “Urban Lands Lease Holding
Proclamation.”
The new regulation classified the city into three zones. The first Zone is Central Market District
Zone, which is classified in five levels and the floor land lease price ranges from Birr 1,686 to
Birr 894 per m2. The rate for Central Market District Zone will be applicable in most areas of the
city that are considered to be main business areas that entertain high level of business activities.
The second zone, Transitional Zone, will also have five levels and the floor land lease price
ranges from Birr 1,035 to Birr 555 per m2 .This zone includes places that are surrounding the city
and are occupied by mainly residential units and industries.
The last and the third zone, Expansion Zone, is classified into four levels and covers areas that
are considered to be in the outskirts of the city, where the city is expected to expand in the future.
The floor land lease price in the Expansion Zone ranges from Birr 355 to Birr 191 per m2
(see
Table 5.2).

66-12
Table 5.2
NEW LAND LEASE FLOOR PRICE FOR PLOTS IN ADDIS ABABA
Zone Level
Floor
price/m2
Central Market
District
1st 1686
2nd
1535
3rd
1323
4th
1085
5th
894
Transitional zone
1st 1035
2nd
935
3rd
809
4th
685
5th
555
Expansion zone
1st 355
2nd
299
3rd
217
4th
191
Accordingly, in order to estimate the land lease cost of the project profiles it is assumed that all
new manufacturing projects will be located in industrial zones located in expansion zones.
Therefore, for the profile a land lease rate of Birr 266 per m2
which is equivalent to the average
floor price of plots located in expansion zone is adopted.
On the other hand, some of the investment incentives arranged by the Addis Ababa City
Administration on lease payment for industrial projects are granting longer grace period and
extending the lease payment period. The criterions are creation of job opportunity, foreign
exchange saving, investment capital and land utilization tendency etc. Accordingly, Table 5.3
shows incentives for lease payment.

66-13
Table 5.3
INCENTIVES FOR LEASE PAYMENT OF INDUSTRIAL PROJECTS
Scored Point
Grace
Period
Payment
Completion
Period
Down
Payment
Above 75% 5 Years 30 Years 10%
From 50 - 75% 5 Years 28 Years 10%
From 25 - 49% 4 Years 25 Years 10%
For the purpose of this project profile, the average i.e. five years grace period, 28 years payment
completion period and 10% down payment is used. The land lease period for industry is 60
years.
Accordingly, the total land lease cost at a rate of Birr 266 per m2 is estimated at Birr 399,000 of
which 10% or Birr 39,900 will be paid in advance. The remaining Birr 359,100 will be paid in
equal installments with in 28 years i.e. Birr 12,825 annually.
VI. HUMAN RESOURCE AND TRAINING REQUIREMENT
A. HUMAN RESOURCE REQUIREMENT
The total human resource required for the envisaged plant is 22 persons with an annual cost of
Birr 930,000. The details of human resource requirement and its related costs are given in Table
6.1.

66-14
Table 6.1
HUMAN RESOURCE REQUIREMENT AND COST
Sr.No.
Position No. of
Persons
Salary (Birr)
Monthly Annual
1 Manager 1 8,000 96,000.00
2 Sales Person 1 5,000 60,000.00
3 Secretary 1 3,000 36,000.00
4 Accountant 1 5,000 60,000.00
5 Engineer 1 6,000 72,000.00
6 Supervisor 2 4,000 96,000.00
7 Operators 5 2000 120,000.00
8 Unskilled
workers
5 1500 90,000.00
9 Diver 1 1500 18,000.00
10 Guards 4 2000 96,000.00
Sub -total 22 744,000.00
Employees’
Benefit (25%
of Basic
Salary)
186,000.00
Total 930,000.00
B. TRAINING REQUIREMENT
On job-training is proposed to be given to two technical persons for a minimum of two weeks
during the commissioning period on project site by experts of machinery supplier. The cost of
training is estimated at Birr 50,000.

66-15
VII. FINANCIAL ANALYSIS
The financial analysis of the red oxide paint project is based on the data presented in the previous
chapters and the following assumptions:-
Construction period 1 year
Source of finance 30 % equity & 70 loan
Tax holidays 3 years
Bank interest 10%
Discount cash flow 10%
Accounts receivable 30 days
Raw material local 30 days
Raw material imported 120 days
Work in progress 1 day
Finished products 30 days
Cash in hand 5 days
Accounts payable 30 days
Repair and maintenance 5% of machinery cost
A. TOTAL INITIAL INVESTMENT COST
The total investment cost of the project including working capital is estimated at Birr 19.74
million (see Table 7.1). From the total investment cost the highest share (Birr 14.90 million or
71.38%) is accounted by fixed investment cost followed by initial working capital (3.65 million
or 18.51%) and pre operation cost (Birr 1.20 million or 10.11%). From the total investment cost,
Birr 6.48 million or 32.83% is required in foreign currency.

66-16
Table 7.1
INITIAL INVESTMENT COST ( ‘000 Birr)
Sr.
No Cost Items
Local
Cost
Foreign
Cost
Total
Cost
%
Share
1 Fixed investment
1.1 Land Lease 39.90 39.90 0.20
1.2 Building and civil work 4,750.00 4,750.00 24.06
1.3 Machinery and equipment 1,620.00 6,480.00 8,100.00 41.03
1.4 Vehicles 900.00 900.00 4.56
1.5 Office furniture and equipment 300.00 300.00 1.52
Sub total 7,609.90 6,480.00 14,089.90 71.38
2 Pre operating cost *
2.1 Pre operating cost 705.00 705.00 3.57
2.2 Interest during construction 1,291.42 1,291.42 6.54
Sub total 1,996.42 1,996.42 10.11
3 Working capital ** 3,654.00 3,654.00 18.51
Grand Total 13,260.32 6,480.00 19,740.32 100
* N.B Pre operating cost include project implementation cost such as installation, startup,
commissioning, project engineering, project management etc and capitalized interest during
construction.
** The total working capital required at full capacity operation is Birr 6.13 million. However,
only the initial working capital of Birr 3.65 million during the first year of production is
assumed to be funded through external sources. During the remaining years the working
capital requirement will be financed by funds to be generated internally (for detail working
capital requirement see Appendix 7.A.1).
B. PRODUCTION COST
The annual production cost at full operation capacity is estimated at Birr 23.45 million (see Table
7.2). The cost of raw material account for 75.98% of the production cost. The other major
components of the production cost are depreciation, financial cost and labor which account for
9.22%, 5.30% and 3.17% respectively. The remaining 6.33% is the share of utility, repair and

66-17
maintenance, labor overhead and administration cost. For detail production cost see Appendix
7.A.2.
Table 7.2
ANNUAL PRODUCTION COST AT FULL CAPACITY (YEAR THREE)
Items Cost
(in 000
Birr) %
Raw Material and Inputs
17,815.12 75.98
Utilities
254.66 1.09
Maintenance and repair
243.00 1.04
Labour direct
744.00 3.17
Labour overheads
186.00 0.79
Administration Costs
300.00 1.28
Land lease cost - -
Cost of marketing and distribution
500.00 2.13
Total Operating Costs
20,042.78 85.48
Depreciation
2,161.00 9.22
Cost of Finance
1,242.99 5.30
Total Production Cost
23,446.77 100
C. FINANCIAL EVALUATION
1. Profitability
Based on the projected profit and loss statement, the project will generate a profit throughout its
operation life. Annual net profit after tax ranges from Birr 2.41 million to Birr 4.51 million
during the life of the project. Moreover, at the end of the project life the accumulated net cash

66-18
flow amounts to Birr 34.39 million. For profit and loss statement and cash flow projection see
Appendix 7.A.3 and 7.A.4, respectively.
2. Ratios
In financial analysis financial ratios and efficiency ratios are used as an index or yardstick for
evaluating the financial position of a firm. It is also an indicator for the strength and weakness of
the firm or a project. Using the year-end balance sheet figures and other relevant data, the most
important ratios such as return on sales which is computed by dividing net income by revenue,
return on assets (operating income divided by assets), return on equity (net profit divided by
equity) and return on total investment (net profit plus interest divided by total investment) has
been carried out over the period of the project life and all the results are found to be satisfactory.
3. Break-even Analysis
The break-even analysis establishes a relationship between operation costs and revenues. It
indicates the level at which costs and revenue are in equilibrium. To this end, the break-even
point for capacity utilization and sales value estimated by using income statement projection are
computed as followed.
Break - Even Sales Value = Fixed Cost + Financial Cost = Birr 11,222,400
Variable Margin ratio (%)
Break - Even Capacity utilization = Break -even Sales Value X 100 = 37.08%
Sales revenue
4. Pay-back Period
The pay-back period, also called pay – off period is defined as the period required for recovering
the original investment outlay through the accumulated net cash flows earned by the project.
Accordingly, based on the projected cash flow it is estimated that the project’s initial investment
will be fully recovered within 6 years.

66-19
5. Internal Rate of Return
The internal rate of return (IRR) is the annualized effective compounded return rate that can be
earned on the invested capital, i.e., the yield on the investment. Put another way, the internal rate
of return for an investment is the discount rate that makes the net present value of the
investment's income stream total to zero. It is an indicator of the efficiency or quality of an
investment. A project is a good investment proposition if its IRR is greater than the rate of return
that could be earned by alternate investments or putting the money in a bank account.
Accordingly, the IRR of this project is computed to be 20.13% indicating the viability of the
project.
6. Net Present Value
Net present value (NPV) is defined as the total present (discounted) value of a time series of cash
flows. NPV aggregates cash flows that occur during different periods of time during the life of a
project in to a common measuring unit i.e. present value. It is a standard method for using the
time value of money to appraise long-term projects. NPV is an indicator of how much value an
investment or project adds to the capital invested. In principle, a project is accepted if the NPV is
non-negative.
Accordingly, the net present value of the project at 10% discount rate is found to be Birr 11.85
million which is acceptable. For detail discounted cash flow see Appendix 7.A.5.
D. ECONOMIC AND SOCIAL BENEFITS
The project can create employment for 22 persons. The project will generate Birr 11.26 million
in terms of tax revenue. The establishment of such factory will have a foreign exchange saving
effect to the country by substituting the current imports. The project will also create backward
linkage with the chemical manufacturing sub sector and also generates income for the
Government in terms of payroll tax.

66-20
Appendix 7.A
FINANCIAL ANALYSES SUPPORTING TABLES

66-21
Appendix 7.A.1
NET WORKING CAPITAL ( in 000 Birr)
Items Year 2 Year 3 Year 4 Year 5 Year 6 Year 7 Year 8 Year 9 Year 10 Year 11
Total inventory 2,672.27 3,563.02 4,453.78 4,453.78 4,453.78 4,453.78 4,453.78 4,453.78 4,453.78 4,453.78
Accounts receivable 1,018.81 1,344.52 1,670.23 1,670.23 1,670.80 1,670.80 1,670.80 1,670.80 1,670.80 1,670.80
Cash-in-hand 12.28 16.37 20.46 20.46 20.55 20.55 20.55 20.55 20.55 20.55
CURRENT ASSETS 3,703.35 4,923.91 6,144.47 6,144.47 6,145.14 6,145.14 6,145.14 6,145.14 6,145.14 6,145.14
Accounts payable 49.35 65.80 82.25 82.25 82.25 82.25 82.25 82.25 82.25 82.25
CURRENT
LIABILITIES 49.35 65.80 82.25 82.25 82.25 82.25 82.25 82.25 82.25 82.25
TOTAL WORKING
CAPITAL 3,654.00 4,858.11 6,062.22 6,062.22 6,062.89 6,062.89 6,062.89 6,062.89 6,062.89 6,062.89
66-22
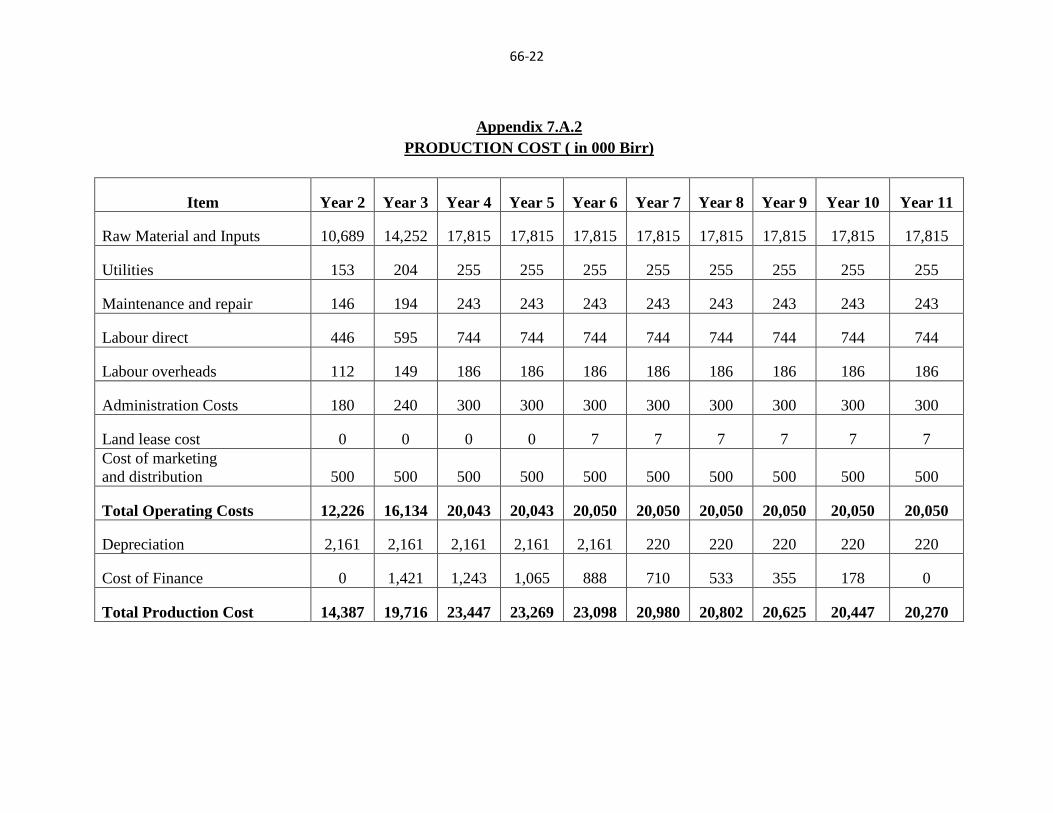
Appendix 7.A.2
PRODUCTION COST ( in 000 Birr)
Item Year 2 Year 3 Year 4 Year 5 Year 6 Year 7 Year 8 Year 9 Year 10 Year 11
Raw Material and Inputs 10,689 14,252 17,815 17,815 17,815 17,815 17,815 17,815 17,815 17,815
Utilities 153 204 255 255 255 255 255 255 255 255
Maintenance and repair 146 194 243 243 243 243 243 243 243 243
Labour direct 446 595 744 744 744 744 744 744 744 744
Labour overheads 112 149 186 186 186 186 186 186 186 186
Administration Costs 180 240 300 300 300 300 300 300 300 300
Land lease cost 0 0 0 0 7 7 7 7 7 7
Cost of marketing
and distribution 500 500 500 500 500 500 500 500 500 500
Total Operating Costs 12,226 16,134 20,043 20,043 20,050 20,050 20,050 20,050 20,050 20,050
Depreciation 2,161 2,161 2,161 2,161 2,161 220 220 220 220 220
Cost of Finance 0 1,421 1,243 1,065 888 710 533 355 178 0
Total Production Cost 14,387 19,716 23,447 23,269 23,098 20,980 20,802 20,625 20,447 20,270

66-23
Appendix 7.A.3
INCOME STATEMENT ( in 000 Birr)
Item
Year
2
Year
3
Year
4
Year
5
Year
6
Year
7
Year
8
Year
9 Year 10 Year 11
Sales revenue 16,032 20,040 24,048 26,720 26,720 26,720 26,720 26,720 26,720 26,720
Less variable costs 11,726 15,634 19,543 19,543 19,543 19,543 19,543 19,543 19,543 19,543
VARIABLE MARGIN 4,306 4,406 4,505 7,177 7,177 7,177 7,177 7,177 7,177 7,177
in % of sales revenue 26.86 21.98 18.73 26.86 26.86 26.86 26.86 26.86 26.86 26.86
Less fixed costs 2,661 2,661 2,661 2,661 2,668 727 727 727 727 727
OPERATIONAL MARGIN 1,645 1,745 1,844 4,516 4,509 6,450 6,450 6,450 6,450 6,450
in % of sales revenue 10.26 8.71 7.67 16.90 16.88 24.14 24.14 24.14 24.14 24.14
Financial costs 1,421 1,243 1,065 888 710 533 355 178 0
GROSS PROFIT 1,645 324 601 3,451 3,622 5,740 5,918 6,095 6,273 6,450
in % of sales revenue 10.26 1.62 2.50 12.91 13.55 21.48 22.15 22.81 23.48 24.14
Income (corporate) tax 0 0 0 1,035 1,086 1,722 1,775 1,829 1,882 1,935
NET PROFIT 1,645 324 601 2,416 2,535 4,018 4,142 4,267 4,391 4,515
in % of sales revenue 10.26 1.62 2.50 9.04 9.49 15.04 15.50 15.97 16.43 16.90

66-24
Appendix 7.A.4
CASH FLOW FOR FINANCIAL MANAGEMENT ( in 000 Birr)
Item Year 1 Year 2 Year 3 Year 4 Year 5 Year 6 Year 7 Year 8 Year 9 Year 10 Year 11 Scrap
TOTAL CASH INFLOW 14,795 21,027 20,056 24,064 26,720 26,720 26,720 26,720 26,720 26,720 26,720 10,244
Inflow funds 14,795 4,995 16 16 0 0 0 0 0 0 0 0
Inflow operation 0 16,032 20,040 24,048 26,720 26,720 26,720 26,720 26,720 26,720 26,720 0
Other income 0 0 0 0 0 0 0 0 0 0 0 10,244
TOTAL CASH
OUTFLOW 14,795 17,220 20,551 24,282 23,919 23,800 24,258 24,133 24,009 23,885 21,985 0
Increase in fixed assets 14,795 0 0 0 0 0 0 0 0 0 0 0
Increase in current assets 0 3,703 1,221 1,221 0 1 0 0 0 0 0 0
Operating costs 0 11,726 15,634 19,543 19,543 19,550 19,550 19,550 19,550 19,550 19,550 0
Marketing and
Distribution cost 0 500 500 500 500 500 500 500 500 500 500 0
Income tax 0 0 0 0 1,035 1,086 1,722 1,775 1,829 1,882 1,935 0
Financial costs 0 1,291 1,421 1,243 1,065 888 710 533 355 178 0 0
Loan repayment 0 0 1,776 1,776 1,776 1,776 1,776 1,776 1,776 1,776 0 0
SURPLUS (DEFICIT) 0 3,806 -495 -218 2,801 2,920 2,462 2,587 2,711 2,835 4,735 10,244
CUMULATIVE CASH
BALANCE 0 3,806 3,312 3,094 5,895 8,815 11,277 13,864 16,575 19,410 24,145 34,389

66-25
Appendix 7.A.5
DISCOUNTED CASH FLOW ( in 000 Birr)
Item Year 1
Year
2 Year 3
Year
4 Year 5
Year
6 Year 7
Year
8 Year 9
Year
10 Year 11 Scrap
TOTAL CASH INFLOW 0 16,032 20,040 24,048 26,720 26,720 26,720 26,720 26,720 26,720 26,720 10,244
Inflow operation 0 16,032 20,040 24,048 26,720 26,720 26,720 26,720 26,720 26,720 26,720 0
Other income 0 0 0 0 0 0 0 0 0 0 0 10,244
TOTAL CASH OUTFLOW 18,449 13,430 17,338 20,043 21,079 21,136 21,772 21,825 21,878 21,931 21,985 0
Increase in fixed assets 14,795 0 0 0 0 0 0 0 0 0 0 0
Increase in net working capital 3,654 1,204 1,204 0 1 0 0 0 0 0 0 0
Operating costs 0 11,726 15,634 19,543 19,543 19,550 19,550 19,550 19,550 19,550 19,550 0
Marketing and Distribution cost 0 500 500 500 500 500 500 500 500 500 500 0
Income (corporate) tax 0 0 0 1,035 1,086 1,722 1,775 1,829 1,882 1,935 0
NET CASH FLOW -18,449 2,602 2,702 4,005 5,641 5,584 4,948 4,895 4,842 4,789 4,735 10,244
CUMULATIVE NET CASH FLOW -18,449
-
15,847 -13,145 -9,140 -3,498 2,085 7,034 11,929 16,771 21,559 26,294 36,539
Net present value -18,449 2,366 2,233 3,009 3,853 3,467 2,793 2,512 2,259 2,031 1,826 3,950
Cumulative net present value -18,449
-
16,083 -13,850
-
10,841 -6,988 -3,521 -728 1,784 4,043 6,074 7,899 11,849
NET PRESENT VALUE 11,849
INTERNAL RATE OF RETURN 20.13%
NORMAL PAYBACK 6 years