Professional Services Vendor Performance Review Webinar Slides
25
TBR T E C H N O L O G Y B U S IN E SS R E SE A R C H , IN C. TBR’s Professional Services Business Quarterly SM Research Highlights and Outlook Technology Business Research Quarterly Webinar Series Oct. 17, 2012
-
Upload
tbr -
Category
Technology
-
view
451 -
download
0
Transcript of Professional Services Vendor Performance Review Webinar Slides

TBR
TECHNOLOGY BUSINESS RESEARCH, INC.
TBR’s Professional Services Business QuarterlySM
Research Highlights and Outlook
Technology Business Research Quarterly Webinar Series
Oct. 17, 2012

TBR
2 TBR Quarterly Webinar Series | 10.17.12 | www.tbri.com | ©2012 Technology Business Research Inc.
PSBQ Research Highlights and Outlook: Webinar Presenters
Bryan BelangerAnalyst, Professional Services [email protected]@bbelangerTBR
Ramunas SvarcasSenior Analyst and Engagement Manager, TBR’s Professional Services [email protected]@rjsTBR

TBR
3 TBR Quarterly Webinar Series | 10.17.12 | www.tbri.com | ©2012 Technology Business Research Inc.
• We cover, on an ongoing basis, 36 vendors in our Professional Services Practice, publishing quarterly and semiannual reports. • Of those vendors, 31 are included in our IT Services
Vendor Benchmark. TBR reports are unique due to their deep holistic
analysis of leading vendor businesses. Financial modeling and TBR insights help customers
build a better understanding of vendor business models. TBR reports and webinars are designed to be responsive
to client timelines, to be clear and concise, and to provide insights across multiple layers of an organization.
TBR’s strategic assessment provides an impartial reality check on how vendors are performing in regard to their strategic objectives and the overall market.
TBR’s IT Services Vendor Benchmark report delivers unique insight and value through in-depth analysis in a concise, consumable formatClients are gaining advantages and are better understanding revenue opportunities through not only our reports, but also through their personal relationships with TBR.
PSBQ Research Highlights and Outlook: Webinar Overview

TBR
4 TBR Quarterly Webinar Series | 10.17.12 | www.tbri.com | ©2012 Technology Business Research Inc.
Portfolio Expansion: Vendors are utilizing M&As to add geographic scale and portfolio depth in BPO.
Delivery Efficiency: Resource investments aim to add low-cost resources and delivery tools to grow services profitability, particularly in BPO.
Client IT spend centralizes on “run the business” cost takeout projects, compelling vendors to invest in BPO and expand global delivery models
PSBQ 2Q12 Research Highlights and Outlook: Key Trends
Professional Services Vendor Trends for 2012
Cost Takeout: Client IT spend focuses on near-term cost reduction and operational efficiency improvement, driving BPO demand growth.
SOURCE: TBR RESEARCH AND ESTIMATES; COMPANY DATA AND ESTIMATES

TBR
5 TBR Quarterly Webinar Series | 10.17.12 | www.tbri.com | ©2012 Technology Business Research Inc.
Portfolio Expansion: Vendors are utilizing M&As to add geographic scale and portfolio depth in BPO.
Delivery Efficiency: Resource investments aim to add low-cost resources and delivery tools to grow services profitability, particularly in BPO.
Client IT spend centralizes on “run the business” cost takeout projects, compelling vendors to invest in BPO and expand global delivery models
PSBQ 2Q12 Research Highlights and Outlook: Cost Takeout
Professional Services Vendor Trends for 2012
Cost Takeout: Client IT spend focuses on near-term cost reduction and operational efficiency improvement, driving BPO demand growth.
SOURCE: TBR RESEARCH AND ESTIMATES; COMPANY DATA AND ESTIMATES

TBR
6 TBR Quarterly Webinar Series | 10.17.12 | www.tbri.com | ©2012 Technology Business Research Inc.
Customers are spending on IT services that trim costs and improve near-term efficiency:• Total TTM IT services revenue growth decelerated to 4.4% in 2Q12 from 8.4% in 2Q11 and 7.6% in 1Q12.• Revenue growth decelerated across all service lines in 2Q12, with the largest decelerations occurring in Other and C&SI.
Vendors addressing concurrent demand for cost reduction and business improvement will outperform peer averages.
Cost takeout priorities are driving IT services spend and fueling growth for well-positioned vendors
Professional Services Vendor Trends for 2012 — Cost Takeout
SOURCE: TBR RESEARCH AND ESTIMATES; COMPANY DATA AND ESTIMATES
PSBQ 2Q12 Research Highlights and Outlook: Cost Takeout

TBR
7 TBR Quarterly Webinar Series | 10.17.12 | www.tbri.com | ©2012 Technology Business Research Inc. SOURCE: TBR RESEARCH AND ESTIMATES; COMPANY DATA AND ESTIMATES
AO and BPO led service line growth and outpaced overall TTM services revenue growth in 2Q12, as clients continued to move applications and noncore business processes to outsourcing vendors for near-term cost reduction.
AO and BPO will remain the primary drivers of IT services growth in 3Q12, as IT spend remains centered on cost and efficiency
$99 $103
$38 $41 $42 $46
$84 $85
$43 $45
8.6%
3.9%
12.4%
8.7%
10.6%
8.8%
3.7%
1.5%
10.6%
3.2%
0.0%
2.0%
4.0%
6.0%
8.0%
10.0%
12.0%
14.0%
$0
$20
$40
$60
$80
$100
$120
2Q11 2Q12 2Q11 2Q12 2Q11 2Q12 2Q11 2Q12 2Q11 2Q12
C&SI BPO AO ITO Other
Year
-to-
year
Gro
wth
(%
)
TTM
Rev
enue
(In
$ Bi
llion
s)
IT SERVICES VENDOR BENCHMARK TTM REVENUES BY SERVICE LINE TBR
PSBQ 2Q12 Research Highlights and Outlook: Cost Takeout

TBR
8 TBR Quarterly Webinar Series | 10.17.12 | www.tbri.com | ©2012 Technology Business Research Inc.
SOURCE: TBR RESEARCH AND ESTIMATES; COMPANY DATA AND ESTIMATESNOTE: INCLUDES TOTAL TTM BPO REVENUE FROM TBR’S IT SERVICES VENDOR BENCHMARK, NOT REPRESENTATIVE OF A TOTAL GLOBAL MARKET VIEW.
BPO revenue growth has traditionally outpaced overall benchmark IT services growth due to its ease of adoption and cost-savings value proposition; however, evolving client demands will require new approaches to capture BPO growth.
Vendors will adapt BPO portfolios as client requirements expand to drive BPO growth above industry-average growth rates
$34 $35 $36 $37
$38 $39 $39 $40 $41
0.0%
2.0%
4.0%
6.0%
8.0%
10.0%
12.0%
14.0%
16.0%
18.0%
$0
$5
$10
$15
$20
$25
$30
$35
$40
$45
2Q10 3Q10 4Q10 1Q11 2Q11 3Q11 4Q11 1Q12 2Q12
Year
-to-
year
Gro
wth
(%
)
TTM
Rev
enue
(In
$ Bill
ions
)
TTM BPO REVENUE, GROWTH, AND OVERALL INDUSTRY GROWTH
TTM BPO Revenue YTY TTM BPO Revenue Growth YTY TTM IT Services Growth
TBR
PSBQ 2Q12 Research Highlights and Outlook: Cost Takeout
TBR
9 TBR Quarterly Webinar Series | 10.17.12 | www.tbri.com | ©2012 Technology Business Research Inc.
WIPRO
CONVERGYS
EXL
ACCENTURE
HCLT
TCS
XEROX SVCS
CSC AON/HEWITT
INFOSYS
GENPACT
BT SERVICES
HP SERVICES
UNISYS
ORACLE SERVICES
ATOS
T-SYSTEMS
COGNIZANT
CAPITA
WNS
CAPGEMINICGI
LOGICA
IBM GS
DELL SERVICES
FUJITSU
SAP SERVICES
-30%
-10%
10%
30%
50%
70%
-25% -15% -5% 5% 15% 25% 35% 45% 55%
Tota
l Ser
vice
s TTM
Rev
enue
Gro
wth
Y/Y
BPO TTM Revenue Growth Y/Y
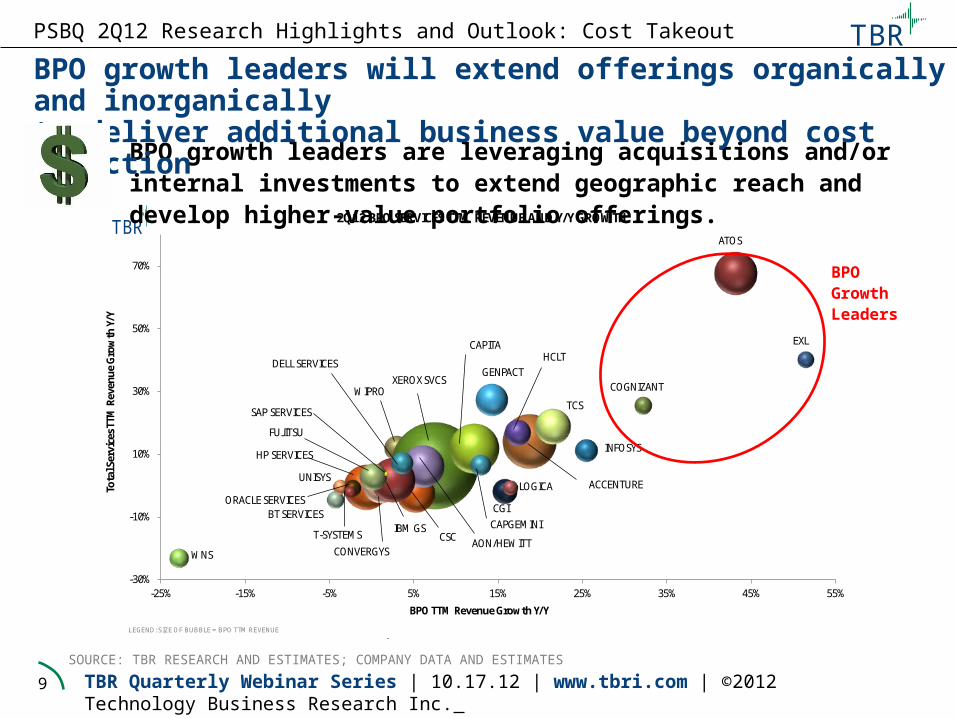
2Q12 BPO SERVICES TTM REVENUE AND Y/Y GROWTH TBR
LEGEND: SIZE OF BUBBLE = BPO TTM REVENUE
SOURCE: TBR RESEARCH AND ESTIMATES; COMPANY DATA AND ESTIMATES
BPO growth leaders are leveraging acquisitions and/or internal investments to extend geographic reach and develop higher-value portfolio offerings.
BPO growth leaders will extend offerings organically and inorganically to deliver additional business value beyond cost reduction
BPO Growth Leaders
PSBQ 2Q12 Research Highlights and Outlook: Cost Takeout
TBR
10 TBR Quarterly Webinar Series | 10.17.12 | www.tbri.com | ©2012 Technology Business Research Inc.
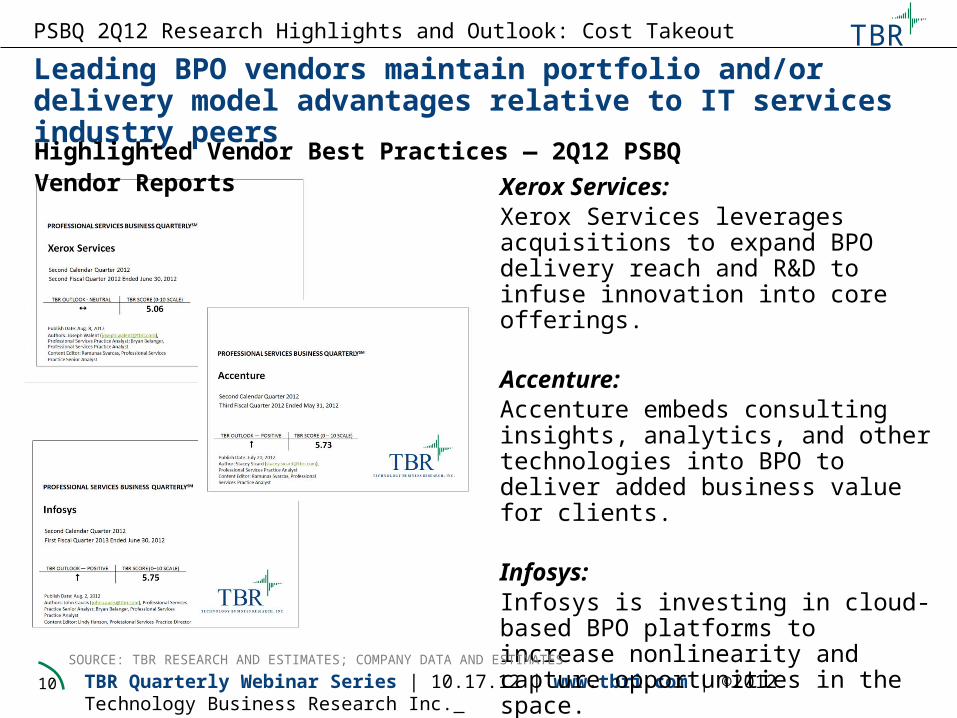
Leading BPO vendors maintain portfolio and/or delivery model advantages relative to IT services industry peers
Xerox Services:Xerox Services leverages acquisitions to expand BPO delivery reach and R&D to infuse innovation into core offerings.
Accenture:Accenture embeds consulting insights, analytics, and other technologies into BPO to deliver added business value for clients.
Infosys:Infosys is investing in cloud-based BPO platforms to increase nonlinearity and capture opportunities in the space.
Highlighted Vendor Best Practices — 2Q12 PSBQ Vendor Reports
SOURCE: TBR RESEARCH AND ESTIMATES; COMPANY DATA AND ESTIMATES
PSBQ 2Q12 Research Highlights and Outlook: Cost Takeout

TBR
11 TBR Quarterly Webinar Series | 10.17.12 | www.tbri.com | ©2012 Technology Business Research Inc.
Xerox Services will expand global delivery and invest in innovative BPO services to maintain its BPO revenue lead in 2H12 and 2013
Xerox Services will maintain its revenue lead in BPO by extending capabilities in new geographic markets through acquisition and leveraging Xerox’s R&D backbone to infuse greater automation into core BPO solutions.
SOURCE: TBR RESEARCH AND ESTIMATES; COMPANY DATA AND ESTIMATES
$6,953
$7,837
$8,879
$8,997 $9,176 $9,338 $9,511 $9,747 $9,853
0.0%
10.0%
20.0%
30.0%
40.0%
50.0%
60.0%
70.0%
80.0%
$-
$2,000
$4,000
$6,000
$8,000
$10,000
$12,000
2Q10 3Q10 4Q10 1Q11 2Q11 3Q11 4Q11 1Q12 2Q12
Year
-to-
year
Gro
wth
(%
)
Reve
nue
(IN
$ M
illi
ons)
XEROX SERVICES BPO REVENUE AND GROWTH
TTM BPO Revenue YTY TTM BPO Revenue GrowthYTY TTM Total Services Revenue Growth
TBR
PSBQ 2Q12 Research Highlights and Outlook: Cost Takeout
Reve
nue
(In $
Mill
ions
)

TBR
12 TBR Quarterly Webinar Series | 10.17.12 | www.tbri.com | ©2012 Technology Business Research Inc.
Portfolio Expansion: Vendors are utilizing M&As to add geographic scale and portfolio depth in BPO.
Delivery Efficiency: Resource investments aim to add low-cost resources and delivery tools to grow services profitability, particularly in BPO.
Client IT spend centralizes on “run the business” cost takeout projects, compelling vendors to invest in BPO and expand global delivery models
Professional Services Vendor Trends for 2012
Cost Takeout: Client IT spend focuses on near-term cost reduction and operational efficiency improvement, driving BPO demand growth.
SOURCE: TBR RESEARCH AND ESTIMATES; COMPANY DATA AND ESTIMATES
PSBQ 2Q12 Research Highlights and Outlook: Portfolio Expansion

TBR
13 TBR Quarterly Webinar Series | 10.17.12 | www.tbri.com | ©2012 Technology Business Research Inc.
As customers pressure BPO vendors to deliver business value beyond pure “lift and shift” low-cost BPO services, IT services firms are utilizing acquisitions to address one or more of four key BPO portfolio needs:•Global delivery reach •Vertical-specific BPO capabilities • Technology solutions in analytics, cloud, mobility and/or social media• Tools/IP assets
Professional Services Vendor Trends for 2012 — Portfolio Expansion
To keep pace with customers’ evolving purchasing needs, BPO vendors are seeking M&As to broaden their go-to-market and portfolio capabilities
SOURCE: TBR RESEARCH AND ESTIMATES; COMPANY DATA AND ESTIMATES
PSBQ 2Q12 Research Highlights and Outlook: Portfolio Expansion

TBR
14 TBR Quarterly Webinar Series | 10.17.12 | www.tbri.com | ©2012 Technology Business Research Inc.
Atos:Atos expands its Hi-Tech Transaction Services portfolio via strategic M&As.
Genpact:Genpact is leveraging selective acquisitions to expand cadre of Business Process as a Service (BPaaS) offerings.
CGI:CGI is utilizing large-scale M&As to add geographic and vertical revenue streams, including BPO.
Established BPO vendors leverage M&A to add scale in new geographies and/or develop technology-led offerings that deliver business value
Highlighted Vendor Best Practices — 2Q12 PSBQ Vendor Reports
SOURCE: TBR RESEARCH AND ESTIMATES; COMPANY DATA AND ESTIMATES
PSBQ 2Q12 Research Highlights and Outlook: Portfolio Expansion

TBR
15 TBR Quarterly Webinar Series | 10.17.12 | www.tbri.com | ©2012 Technology Business Research Inc.
Genpact’s BPO Acquisitions Activity, Strategy and Growth BPO Acquisitions Strategy• With seven acquisitions since the start of
2011, Genpact is diversifying its BPO portfolio by acquiring specialized providers with vertical-specific expertise, particularly in healthcare, BFSI and retail. • Focuses heavily on acquisitions that
augment its suite of cloud-based BPaaS offerings, such as the purchase of High Performance Partners in October 2011
BPO Revenue Growth and StrategiesGenpact will pursue continued 15% to 20% year-to-year BPO growth by leveraging alliances and acquisitions to build out its portfolio of industry-aligned, platform-based BPaaS solutions.
Selective acquisitions of specialized BPO shops will expand Genpact’s roster of BPaaS offerings and fuel continued 15% to 20% segment growth
SOURCE: TBR RESEARCH AND ESTIMATES; COMPANY DATA AND ESTIMATES
$1,325 $1,380 $1,428 $1,454 $1,568
$66 $119 $172 $251
$207
$-
$500
$1,000
$1,500
$2,000
2Q11 3Q11 4Q11 1Q12 2Q12
Reve
nue
(In
$ M
illi
ons)
GENPACT ORGANIC AND INORGANIC REVENUE
TTM Inorganic Revenue TTM Organic Revenue
TBR
$1,172
$1,215
$1,252
$1,294
$1,339
0.0%
5.0%
10.0%
15.0%
20.0%
25.0%
30.0%
35.0%
$1,050
$1,100
$1,150
$1,200
$1,250
$1,300
$1,350
$1,400
2Q11 3Q11 4Q11 1Q12 2Q12
Year
-to-
year
Gro
wth
(%
)
Reve
nue
(IN
$ M
illi
ons)
GENPACT BPO REVENUE AND GROWTH
TTM BPO Revenue TTM YTY BPO Revenue Growth
TBR
PSBQ 2Q12 Research Highlights and Outlook: Portfolio Expansion

TBR
16 TBR Quarterly Webinar Series | 10.17.12 | www.tbri.com | ©2012 Technology Business Research Inc.
Portfolio Expansion: Vendors are utilizing M&As to add geographic scale and portfolio depth in BPO.
Delivery Efficiency: Resource investments aim to add low-cost resources and delivery tools to grow services profitability, particularly in BPO.
Client IT spend centralizes on “run the business” cost takeout projects, compelling vendors to invest in BPO and expand global delivery models
Professional Services Vendor Trends for 2012
Cost Takeout: Client IT spend focuses on near-term cost reduction and operational efficiency improvement, driving BPO demand growth.
SOURCE: TBR RESEARCH AND ESTIMATES; COMPANY DATA AND ESTIMATES
PSBQ 2Q12 Research Highlights and Outlook: Delivery Efficiency

TBR
17 TBR Quarterly Webinar Series | 10.17.12 | www.tbri.com | ©2012 Technology Business Research Inc.
Vendors are coping with slowing top-line revenue growth rates and preserving services profitability by optimizing delivery efficiency through increased low-cost resource leverage and investments in tools and platforms.
Vendors maintain profitability by expanding low-cost delivery, and infusing tools and automation into service delivery
Professional Services Vendor Trends for 2012 — Delivery Efficiency
SOURCE: TBR RESEARCH AND ESTIMATES; COMPANY DATA AND ESTIMATES
PSBQ 2Q12 Research Highlights and Outlook: Delivery Efficiency
TBR
18 TBR Quarterly Webinar Series | 10.17.12 | www.tbri.com | ©2012 Technology Business Research Inc.
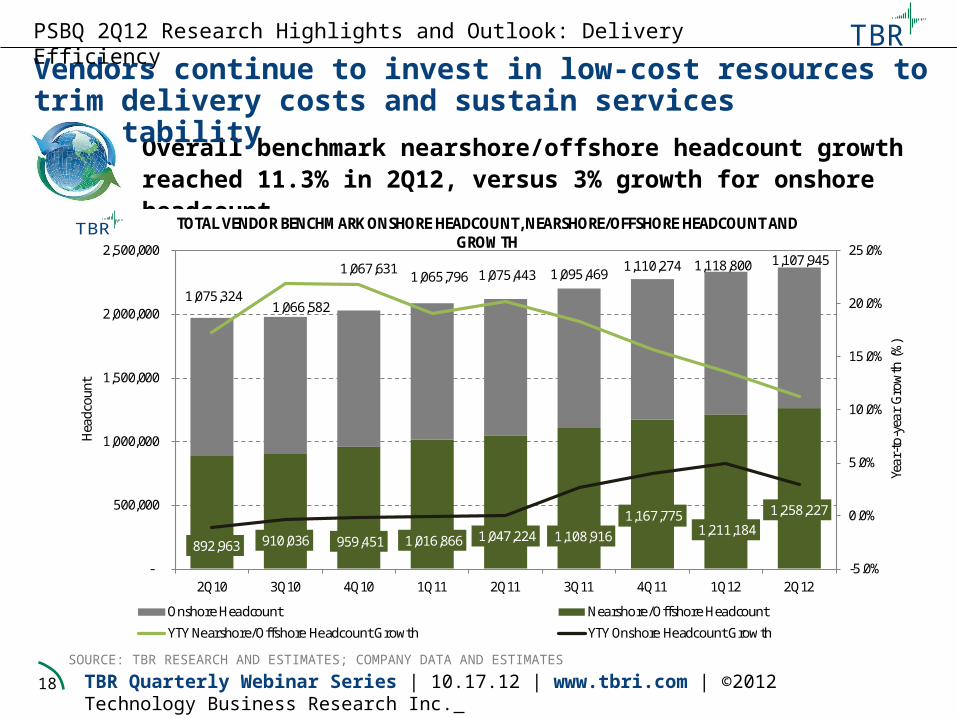
Overall benchmark nearshore/offshore headcount growth reached 11.3% in 2Q12, versus 3% growth for onshore headcount.
Vendors continue to invest in low-cost resources to trim delivery costs and sustain services profitability
SOURCE: TBR RESEARCH AND ESTIMATES; COMPANY DATA AND ESTIMATES
PSBQ 2Q12 Research Highlights and Outlook: Delivery Efficiency
892,963 910,036 959,451 1,016,866 1,047,224 1,108,916 1,167,775
1,211,184 1,258,227
1,075,324 1,066,582
1,067,631 1,065,796 1,075,443 1,095,469 1,110,274 1,118,800 1,107,945
-5.0%
0.0%
5.0%
10.0%
15.0%
20.0%
25.0%
-
500,000
1,000,000
1,500,000
2,000,000
2,500,000
2Q10 3Q10 4Q10 1Q11 2Q11 3Q11 4Q11 1Q12 2Q12
Year
-to-
year
Gro
wth
(%
)
Hea
dcou
nt
TOTAL VENDOR BENCHMARK ONSHORE HEADCOUNT, NEARSHORE/OFFSHORE HEADCOUNT AND GROWTH
Onshore Headcount Nearshore/Offshore Headcount
YTY Nearshore/Offshore Headcount Growth YTY Onshore Headcount Growth
TBR
TBR
19 TBR Quarterly Webinar Series | 10.17.12 | www.tbri.com | ©2012 Technology Business Research Inc.
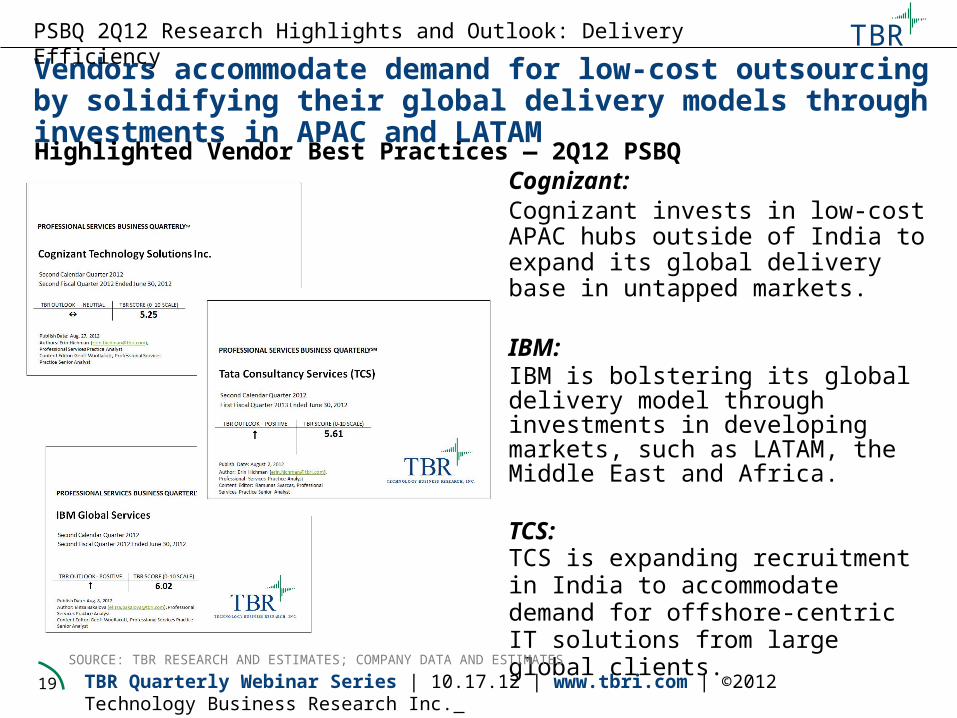
Vendors accommodate demand for low-cost outsourcing by solidifying their global delivery models through investments in APAC and LATAM
Cognizant:Cognizant invests in low-cost APAC hubs outside of India to expand its global delivery base in untapped markets. IBM:IBM is bolstering its global delivery model through investments in developing markets, such as LATAM, the Middle East and Africa.
TCS:TCS is expanding recruitment in India to accommodate demand for offshore-centric IT solutions from large global clients.
Highlighted Vendor Best Practices — 2Q12 PSBQ Vendor Reports
SOURCE: TBR RESEARCH AND ESTIMATES; COMPANY DATA AND ESTIMATES
PSBQ 2Q12 Research Highlights and Outlook: Delivery Efficiency

TBR
20 TBR Quarterly Webinar Series | 10.17.12 | www.tbri.com | ©2012 Technology Business Research Inc.
IBM Global Services’ Headcount and Operating Margin PerformanceTBR Assessment• IBM maintains an expansive global
delivery model, enabling the firm to pool resources from onshore, offshore and nearshore bases to optimize delivery efficiency. • IBM also actively invests in tools and IP
assets to automate service delivery processes, reduce delivery costs and improve margin performance. • IBM will pursue continued BPO
profitability growth by pairing low-cost delivery with a broadened portfolio in higher-value areas (analytics-based solutions, vertical-specific BPO).
IBM optimizes BPO delivery and improves profitability by emphasizing its global delivery model and expanding into higher-margin service areas
PSBQ 2Q12 Research Highlights and Outlook: Delivery Efficiency

TBR
21 TBR Quarterly Webinar Series | 10.17.12 | www.tbri.com | ©2012 Technology Business Research Inc.
Portfolio Expansion: IT service providers will remain aggressive in seeking both inorganic and organic avenues for portfolio growth.
Delivery Efficiency: Vendors gaining market share are able to blend low-cost global delivery with client-facing, domain-oriented C&SI resources.
Client IT spend centralizes on “run the business” cost takeout projects, compelling vendors to invest in BPO and expand global delivery models
Professional Services Vendor Trends for 2012
Cost Takeout: Leading vendors are able to concurrently address cost reduction and deliver additional business value.
SOURCE: TBR RESEARCH AND ESTIMATES; COMPANY DATA AND ESTIMATES
PSBQ 2Q12 Research Highlights and Outlook: Key Topics

TBR
22 TBR Quarterly Webinar Series | 10.17.12 | www.tbri.com | ©2012 Technology Business Research Inc.
PSP Research Current Topics 3Q12 Report Key Themes• Vendor Reports:o Accenture o Atoso Capgeminio Cognizanto CSCo Dell Serviceso Fujitsuo HP Serviceso IBM Global
Serviceso Infosyso TCSo Wipro ITS
• Benchmarks: Management Consulting, HITS, Public Sector, Software Alliance
How are vendors leveraging alliances, acquisitions and/or R&D investments to bolster healthcare-specific solutions breadth and capture opportunity in the space?
What growth opportunities exist for vendors within the parameters of their SAP alliance relationships? How are vendors adapting portfolios and delivery models to capture SAP-related deals?
What vendors are leading/lagging in developing and bringing to market solutions addressing big data management and analytics? How are these vendors investing in big data?
• What vendors are leading/lagging in expansion into China? What investment strategies are conducive to success in China? • Are the majority of vendors seeking domestic
growth in China, or utilizing the region as a low-cost delivery hub?
Vertical Growth
Strategy: Healthcare
IT services vendors will pursue growth in 2H12 by addressing demand for increased vertical specialization and emerging technology adoption
SOURCE: TBR RESEARCH AND ESTIMATES; COMPANY DATA AND ESTIMATES
SAP Partnership
Storage – Big Data
Emerging Markets Growth
Strategy: China
PSBQ 2Q12 Research Highlights and Outlook: 3Q12 Key Topics
TBR
23 TBR Quarterly Webinar Series | 10.17.12 | www.tbri.com | ©2012 Technology Business Research Inc.
Questions?
PSBQ 2Q12 Research Highlights and 2012 Outlook

TBR
24 TBR Quarterly Webinar Series | 10.17.12 | www.tbri.com | ©2012 Technology Business Research Inc.
For further information, please contact:
Lindy Hanson James McIlroyDirector, Professional Services Practice Vice President, [email protected] [email protected]
Bryan BelangerAnalyst, Professional Services [email protected]@bbelangerTBR
Ramunas SvarcasSenior Analyst and Engagement Manager, Professional Services [email protected]@rjsTBR

TBR
TECHNOLOGY BUSINESS RESEARCH, INC.
About TBR
Technology Business Research (TBR) is a leading independent technology market research and consulting firm specializing in the business and financial analyses of hardware, software, networking equipment, wireless, portal and professional services vendors.
Serving a global clientele, TBR provides timely and accurate market research and business intelligence in formats that are tailored to clients’ needs. Our analysts are available to further address client-specific issues or information needs on an inquiry or proprietary consulting basis.
TBR has been empowering corporate decision makers since 1996.
To learn how our analysts can address your unique business needs, please visit our website or contact us today.
Contact Us
[email protected] Merrill DriveHampton, NH 03842USA
This report is based on information made available to the public by the vendor and other public sources. No representation is made that this information is accurate or complete. Technology Business Research will not be held liable or responsible for any decisions that are made based on this information. The information contained in this report and all other TBR products is not and should not be construed to be investment advice. TBR does not make any recommendations or provide any advice regarding the value, purchase, sale or retention of securities. This report is copyright-protected and supplied for the sole use of the recipient. Contact Technology Business Research, Inc. for permission to reproduce.