
BV Webinar Slides
64
BUILDING A WORLD OF DIFFERENCE ® IFAS and MBBR Webcast March 18, 2010 Process and Practical Design Process and Practical Design Considerations for the IFAS Considerations for the IFAS and MBBR Technologies and MBBR Technologies Mark Steichen, P.E. Heather M. Phillips, P.E.
description
mbbr vs mbr analysis
Transcript of BV Webinar Slides

BUILDING A WORLD OF DIFFERENCE®
IFAS and MBBR Webcast March 18, 2010
Process and Practical Design Process and Practical Design Considerations for the IFAS Considerations for the IFAS
and MBBR Technologies and MBBR Technologies
Mark Steichen, P.E.
Heather M. Phillips, P.E.
Slide - 2 IFAS and MBBR Webcast March 18, 2010
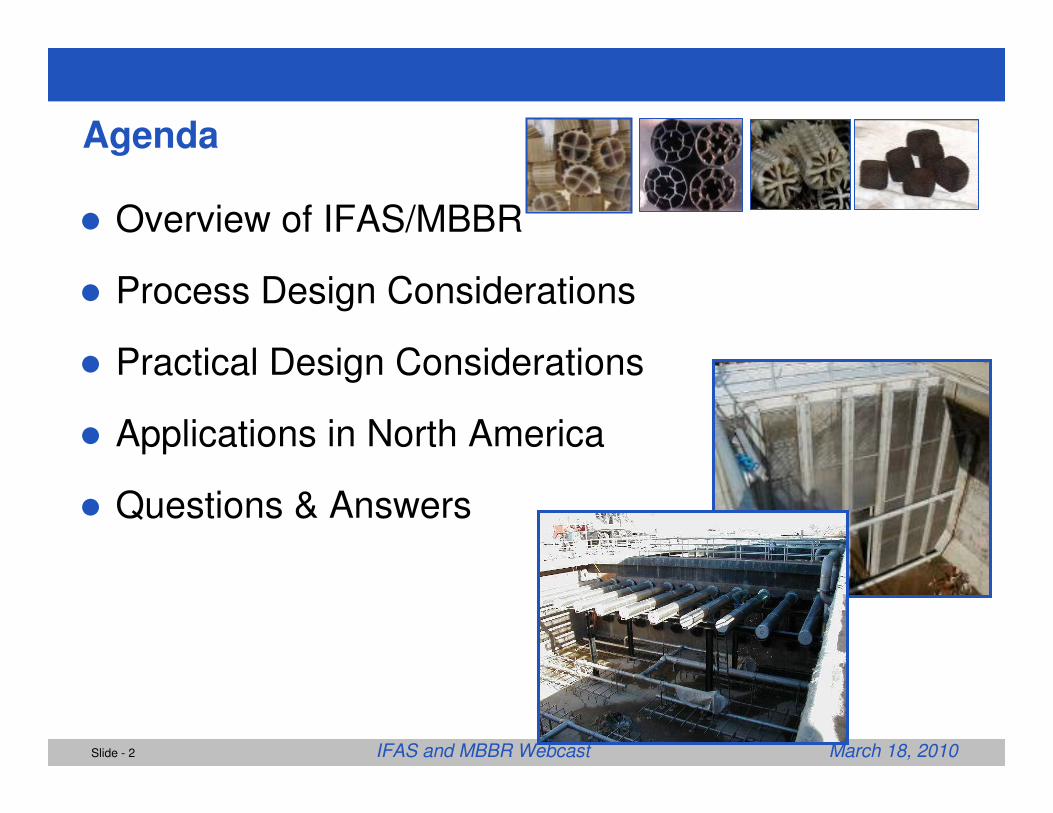
Agenda
� Overview of IFAS/MBBR
� Process Design Considerations
� Practical Design Considerations
� Applications in North America
� Questions & Answers
Slide - 3 IFAS and MBBR Webcast March 18, 2010
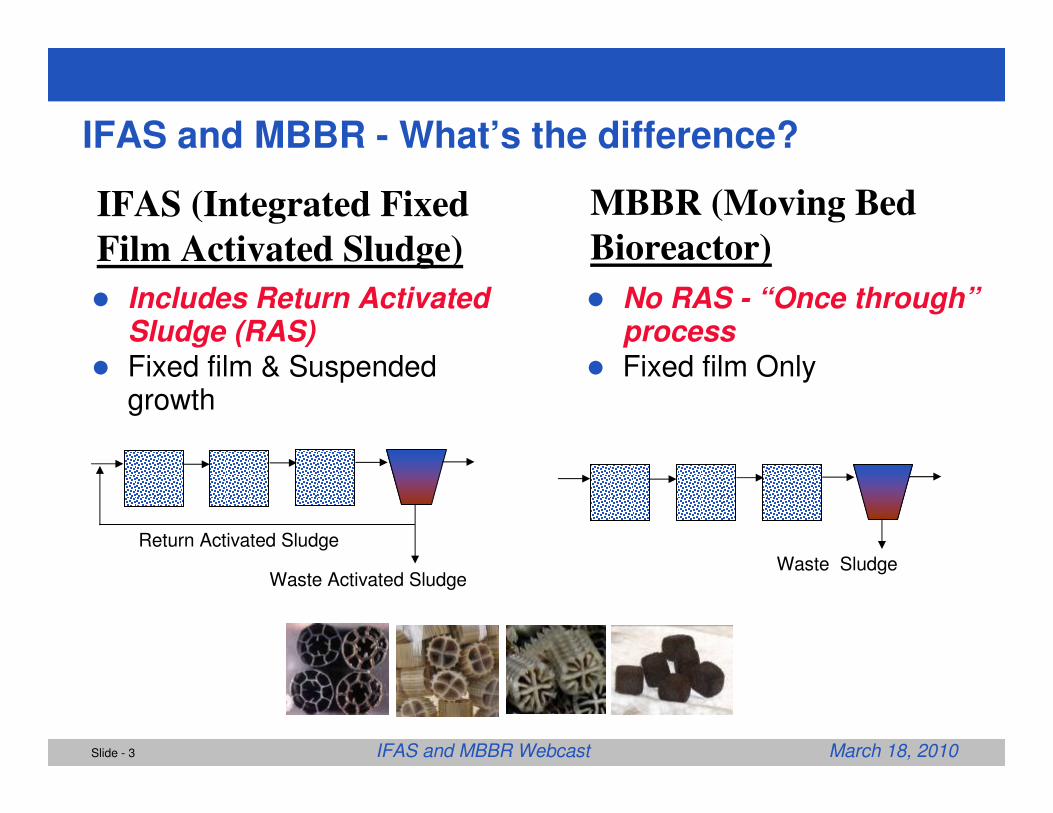
IFAS and MBBR - What’s the difference?
� Includes Return Activated Sludge (RAS)
� Fixed film & Suspended growth
� No RAS - “Once through”process
� Fixed film Only
IFAS (Integrated Fixed
Film Activated Sludge)
MBBR (Moving Bed
Bioreactor)
Waste Activated Sludge
Return Activated Sludge
Waste Sludge
Slide - 4 IFAS and MBBR Webcast March 18, 2010
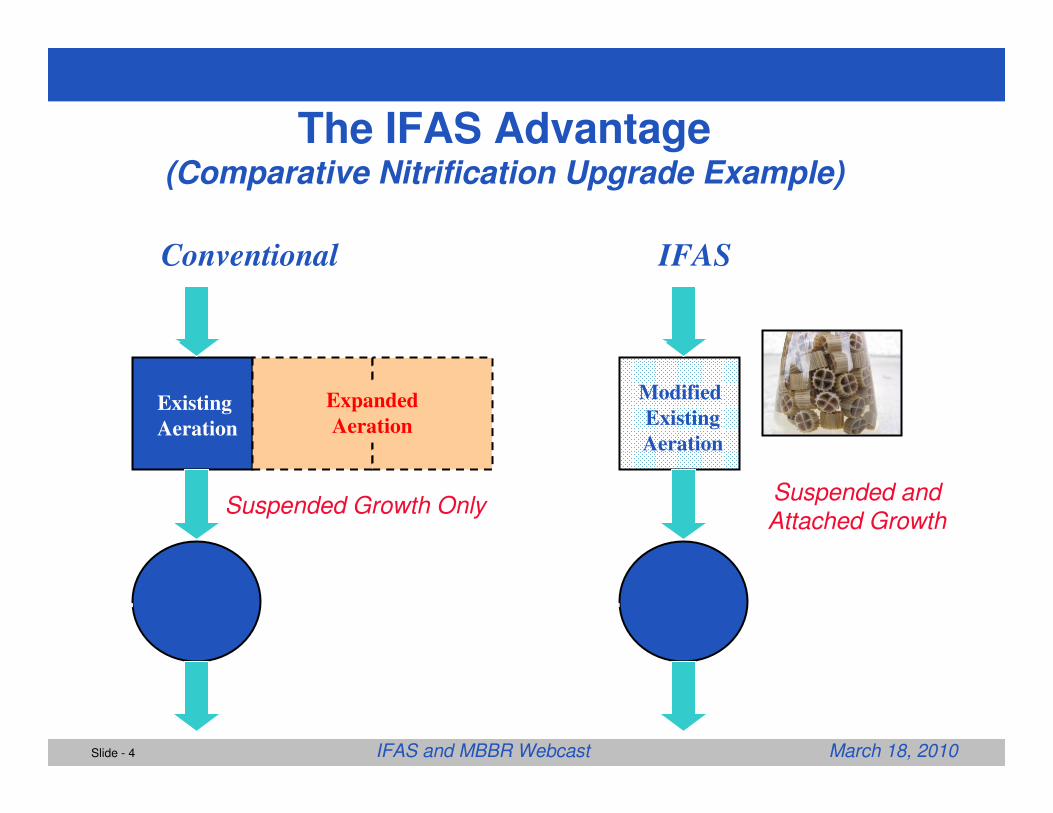
The IFAS Advantage(Comparative Nitrification Upgrade Example)
Conventional IFAS
Expanded
Aeration
Modified
Existing
Aeration
Existing
Aeration
Suspended Growth OnlySuspended and
Attached Growth
Slide - 5 IFAS and MBBR Webcast March 18, 2010
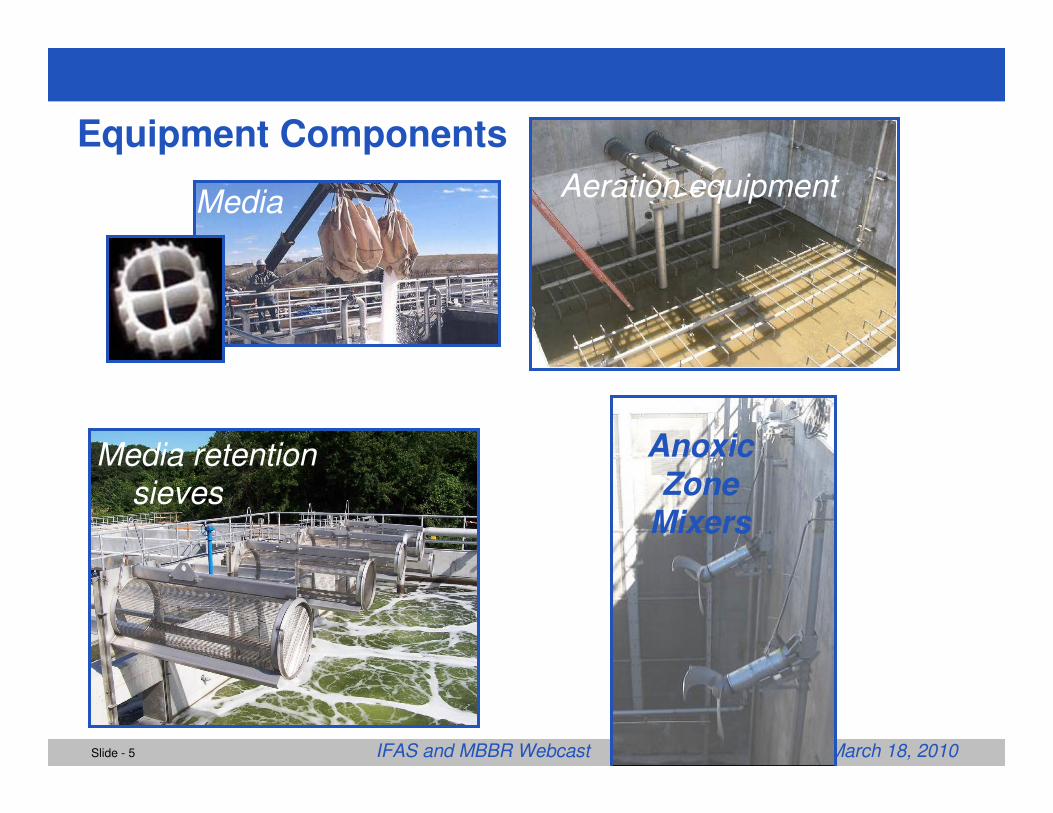
Anoxic Zone
Mixers
Equipment Components
MediaAeration equipment
Media retention sieves
Slide - 6 IFAS and MBBR Webcast March 18, 2010
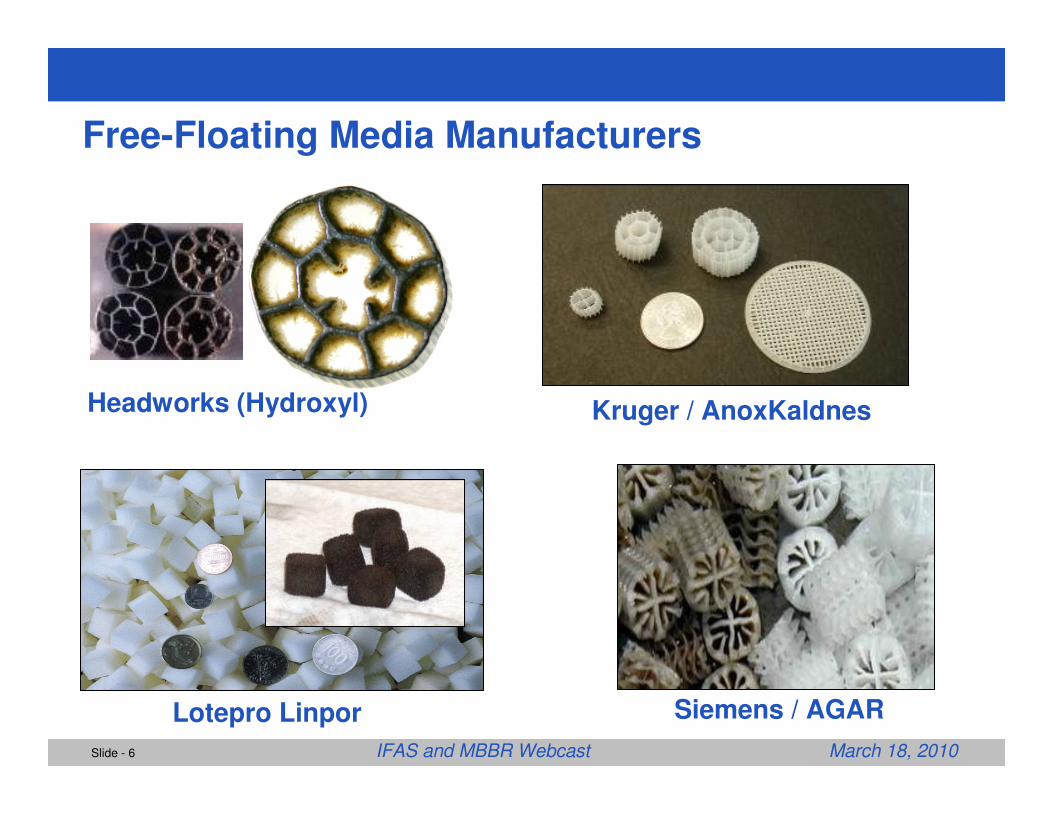
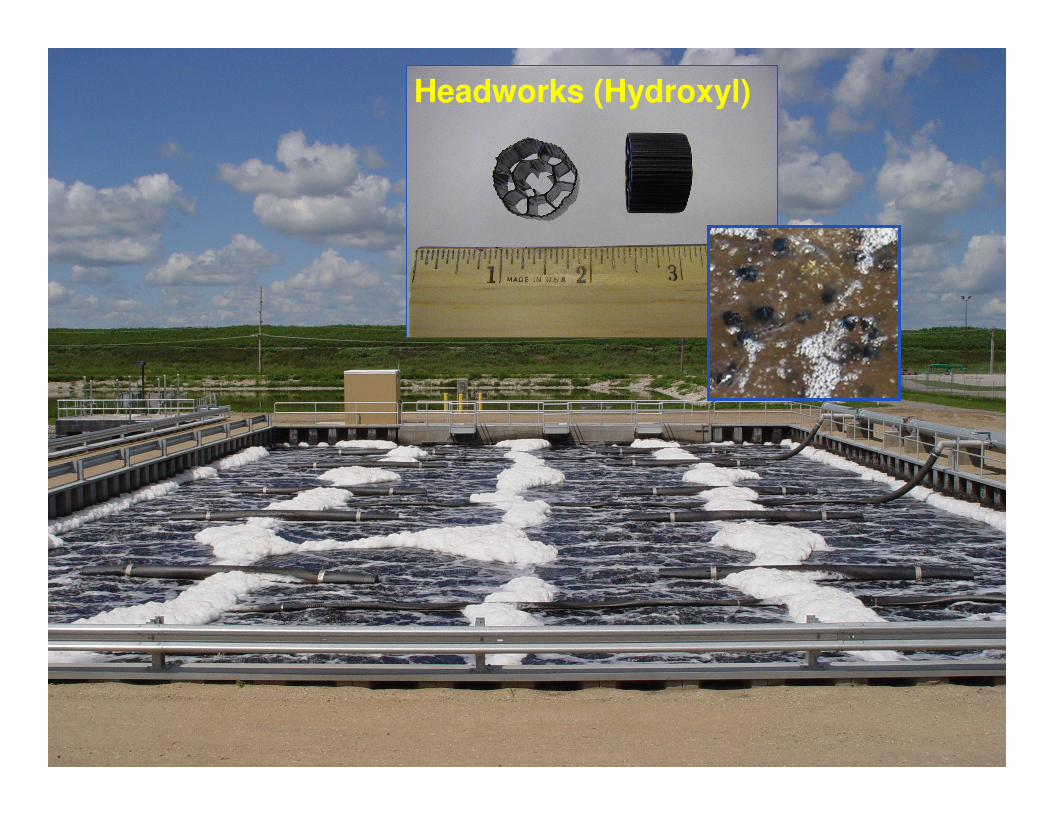
Free-Floating Media Manufacturers
Kruger / AnoxKaldnes
Lotepro Linpor Siemens / AGAR
Headworks (Hydroxyl)
Slide - 7 IFAS and MBBR Webcast March 18, 2010
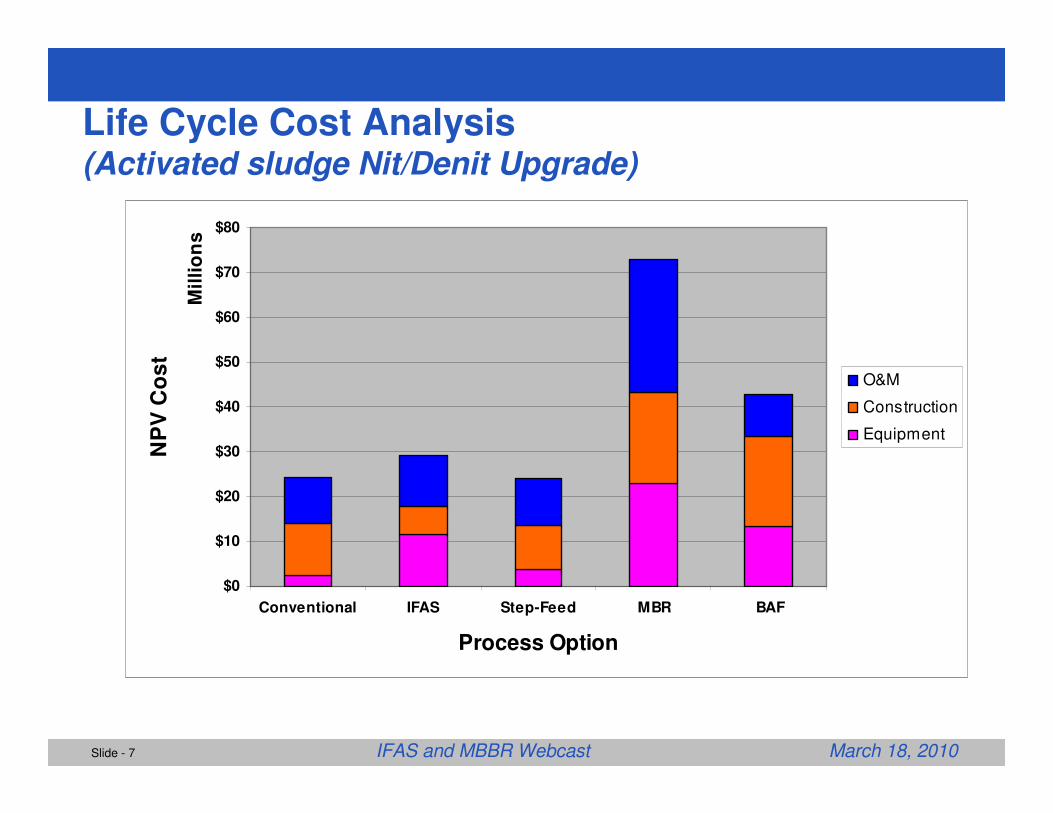
Life Cycle Cost Analysis (Activated sludge Nit/Denit Upgrade)
$0
$10
$20
$30
$40
$50
$60
$70
$80
Conventional IFAS Step-Feed MBR BAF
Mil
lio
ns
Process Option
NP
V C
os
t
O&M
Construction
Equipment
Slide - 8 IFAS and MBBR Webcast March 18, 2010
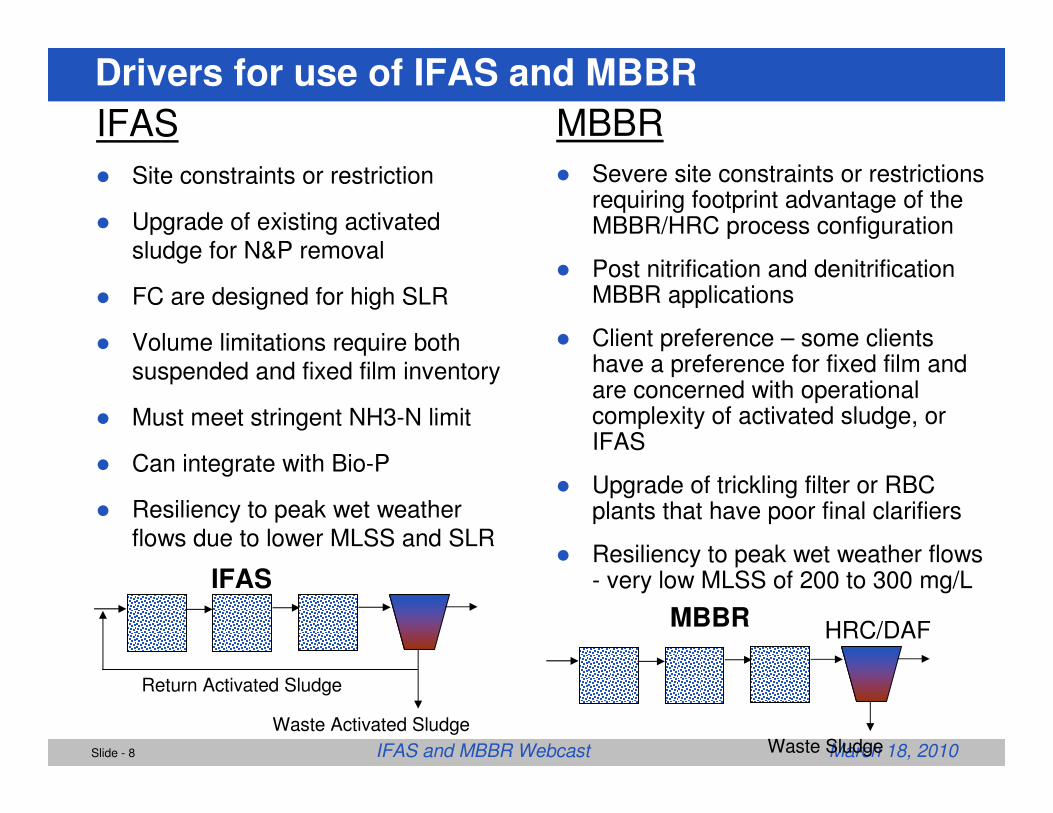
Drivers for use of IFAS and MBBR
MBBR
� Severe site constraints or restrictions requiring footprint advantage of the MBBR/HRC process configuration
� Post nitrification and denitrification MBBR applications
� Client preference – some clients have a preference for fixed film and are concerned with operational complexity of activated sludge, or IFAS
� Upgrade of trickling filter or RBC plants that have poor final clarifiers
� Resiliency to peak wet weather flows - very low MLSS of 200 to 300 mg/L
IFAS
� Site constraints or restriction
� Upgrade of existing activated sludge for N&P removal
� FC are designed for high SLR
� Volume limitations require both suspended and fixed film inventory
� Must meet stringent NH3-N limit
� Can integrate with Bio-P
� Resiliency to peak wet weather flows due to lower MLSS and SLR
Waste Activated Sludge
IFAS
Return Activated Sludge
Waste Sludge
MBBR HRC/DAF
Slide - 9 IFAS and MBBR Webcast March 18, 2010
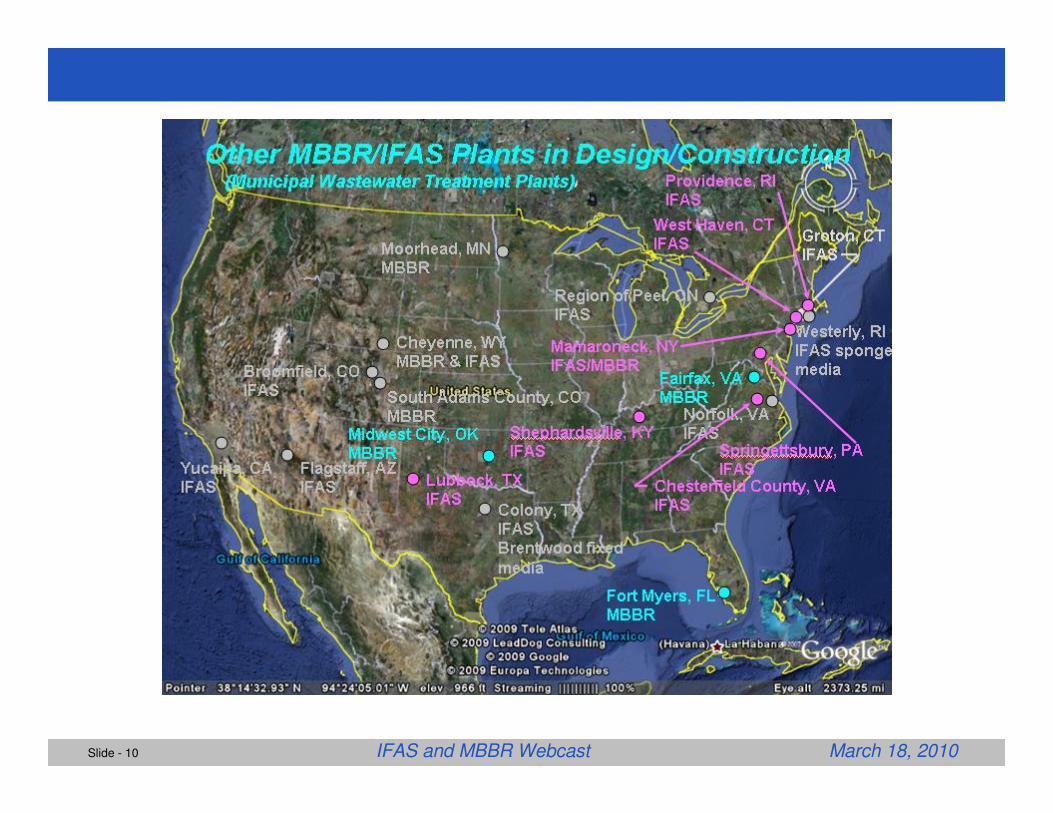
Slide - 10 IFAS and MBBR Webcast March 18, 2010
BUILDING A WORLD OF DIFFERENCE®
Slide - 11 IFAS and MBBR Webcast March 18, 2010
Process Design Considerations
Process Design Considerations
Slide - 12 IFAS and MBBR Webcast March 18, 2010
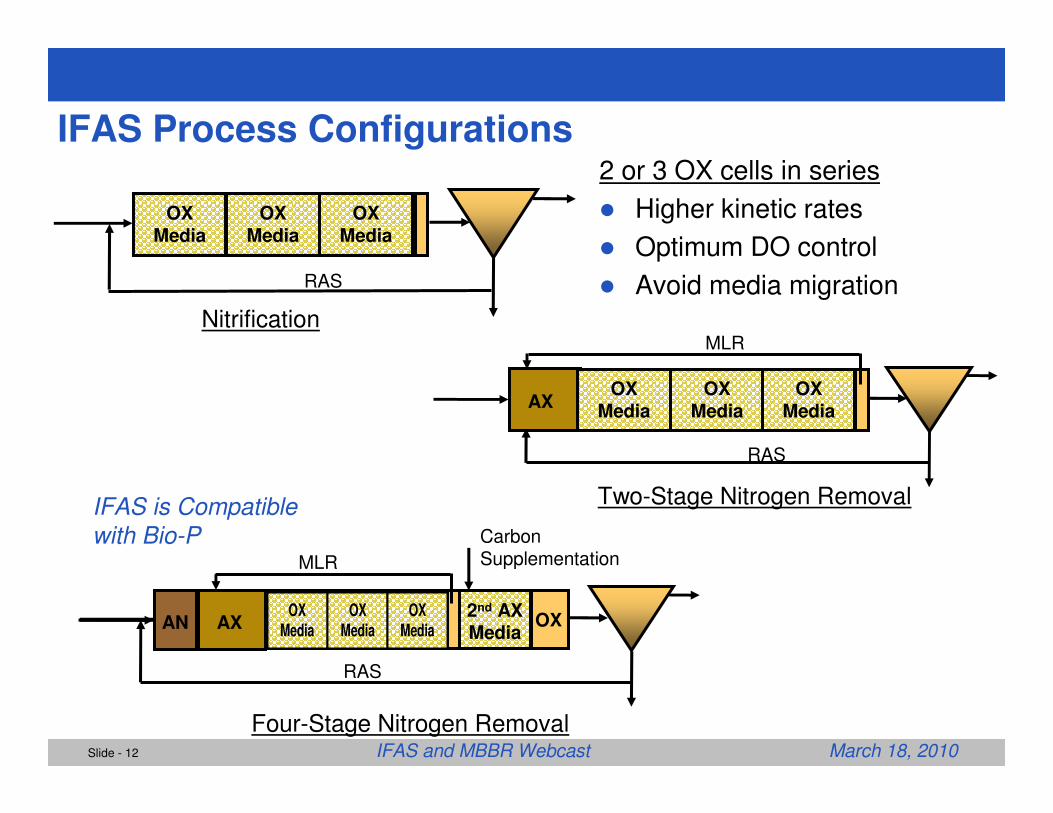
IFAS Process Configurations
AX
MLR
RAS
Two-Stage Nitrogen Removal
OX Media
OX Media
OX Media
Carbon Supplementation
OX MediaAX
MLR
RAS
Four-Stage Nitrogen Removal
2nd AXMedia
OXOX
MediaOX
MediaOX
Media
OX Media
RAS
Nitrification
OX Media
OX Media
2 or 3 OX cells in series
� Higher kinetic rates
� Optimum DO control
� Avoid media migration
AN
IFAS is Compatible
with Bio-P
Slide - 13 IFAS and MBBR Webcast March 18, 2010
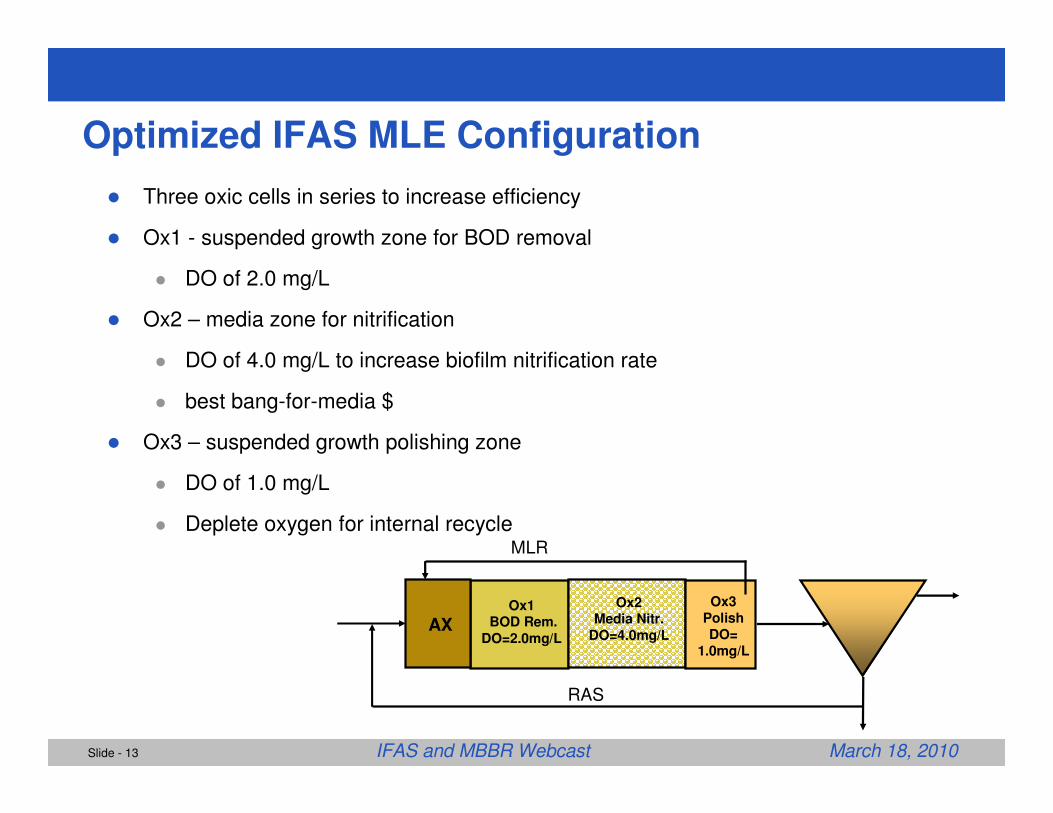
Optimized IFAS MLE Configuration
� Three oxic cells in series to increase efficiency
� Ox1 - suspended growth zone for BOD removal
� DO of 2.0 mg/L
� Ox2 – media zone for nitrification
� DO of 4.0 mg/L to increase biofilm nitrification rate
� best bang-for-media $
� Ox3 – suspended growth polishing zone
� DO of 1.0 mg/L
� Deplete oxygen for internal recycle
Ox1BOD Rem.
DO=2.0mg/L
Ox2Media Nitr.
DO=4.0mg/L
Ox3PolishDO=
1.0mg/L
AX
MLR
RAS
Slide - 14 IFAS and MBBR Webcast March 18, 2010
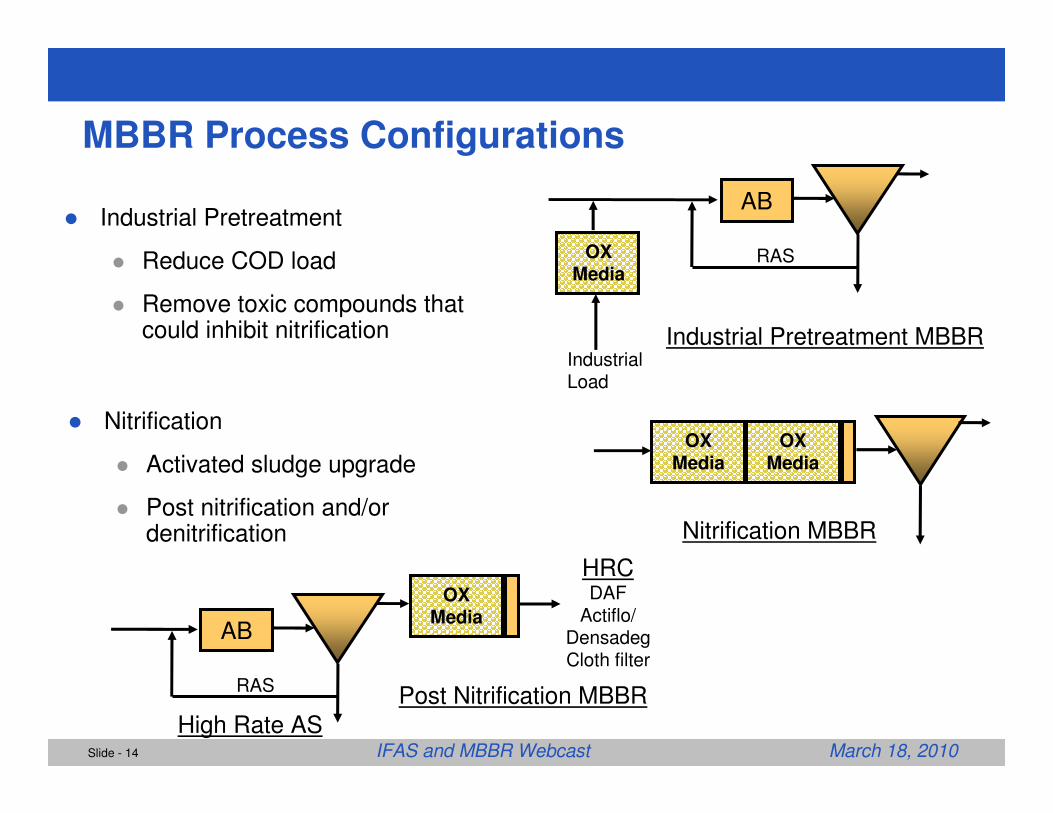
MBBR Process Configurations
� Industrial Pretreatment
� Reduce COD load
� Remove toxic compounds that could inhibit nitrification
AB
OX Media
RAS
Industrial Pretreatment MBBRIndustrialLoad
OX Media
Nitrification MBBR
OX Media
AB
RAS
High Rate ASPost Nitrification MBBR
OX Media
HRCDAF
Actiflo/DensadegCloth filter
� Nitrification
� Activated sludge upgrade
� Post nitrification and/or denitrification
Slide - 15 IFAS and MBBR Webcast March 18, 2010
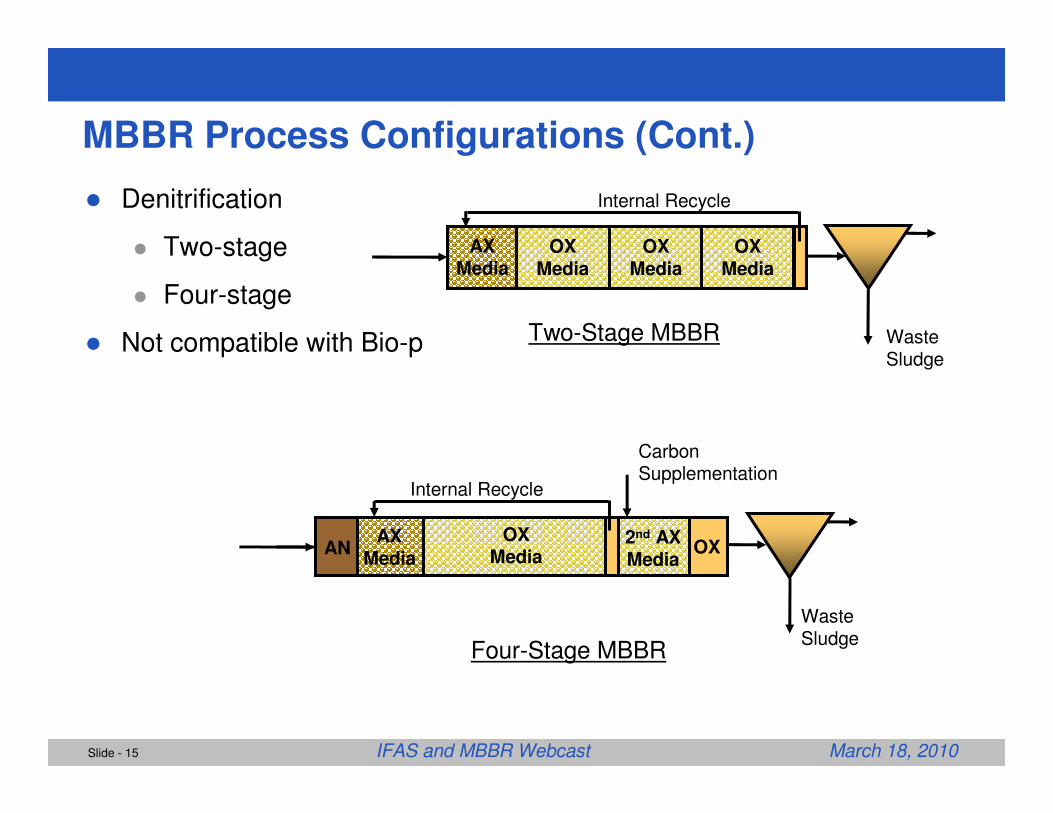
MBBR Process Configurations (Cont.)
� Denitrification
� Two-stage
� Four-stage
� Not compatible with Bio-p
AXMedia
Internal Recycle
Two-Stage MBBR
OX Media
OX Media
OX Media
Waste Sludge
OX Media
AXMedia
Internal Recycle
Four-Stage MBBR
2nd AXMedia
OX
Carbon Supplementation
AN
Waste Sludge
Slide - 16 IFAS and MBBR Webcast March 18, 2010
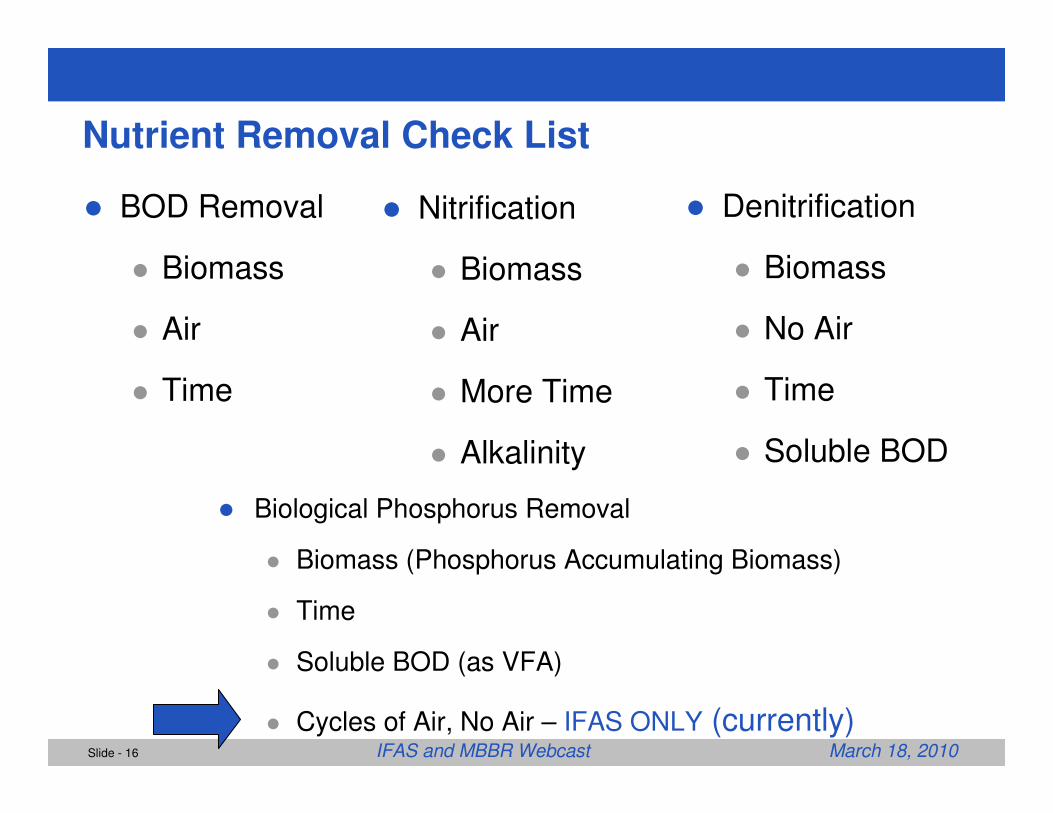
Nutrient Removal Check List
� BOD Removal
� Biomass
� Air
� Time
� Nitrification
� Biomass
� Air
� More Time
� Alkalinity
� Denitrification
� Biomass
� No Air
� Time
� Soluble BOD
� Biological Phosphorus Removal
� Biomass (Phosphorus Accumulating Biomass)
� Time
� Soluble BOD (as VFA)
� Cycles of Air, No Air – IFAS ONLY (currently)
Slide - 17 IFAS and MBBR Webcast March 18, 2010
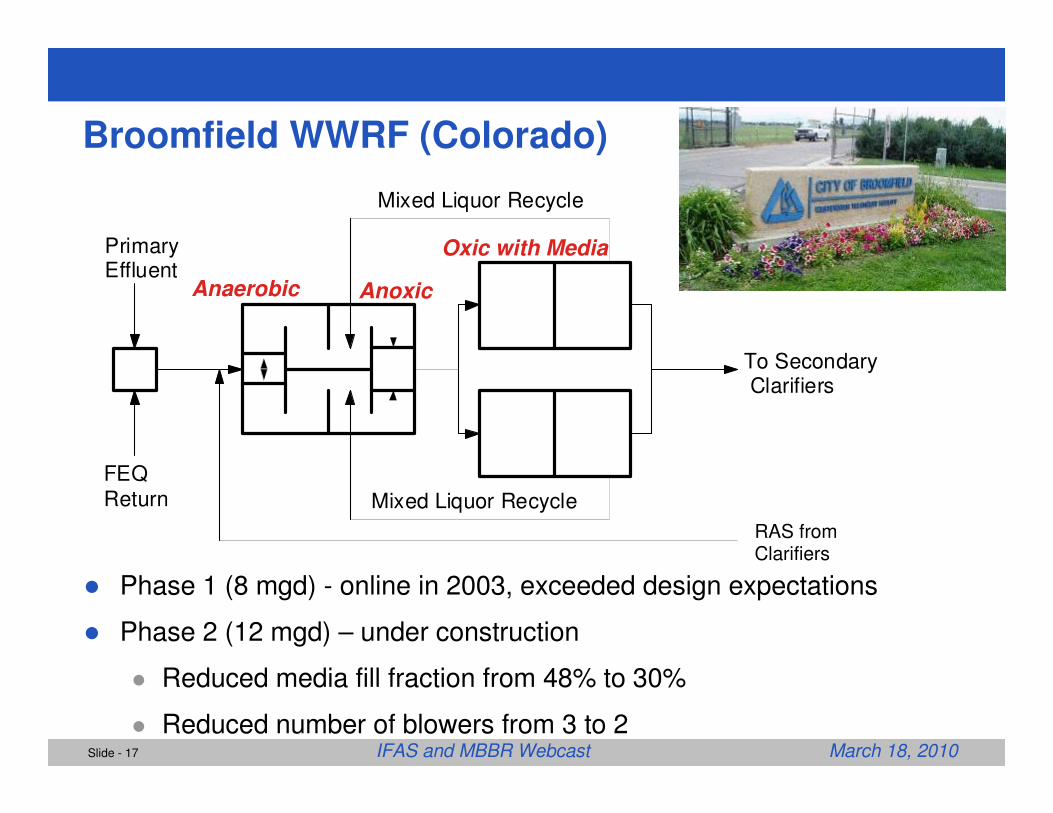
Broomfield WWRF (Colorado)
� Phase 1 (8 mgd) - online in 2003, exceeded design expectations
� Phase 2 (12 mgd) – under construction
� Reduced media fill fraction from 48% to 30%
� Reduced number of blowers from 3 to 2
Mixed Liquor Recycle
Mixed Liquor Recycle
RAS fromClarifiers
To Secondary Clarifiers
Primary Effluent
FEQ Return
Anaerobic Anoxic
Oxic with Media
Slide - 18 IFAS and MBBR Webcast March 18, 2010
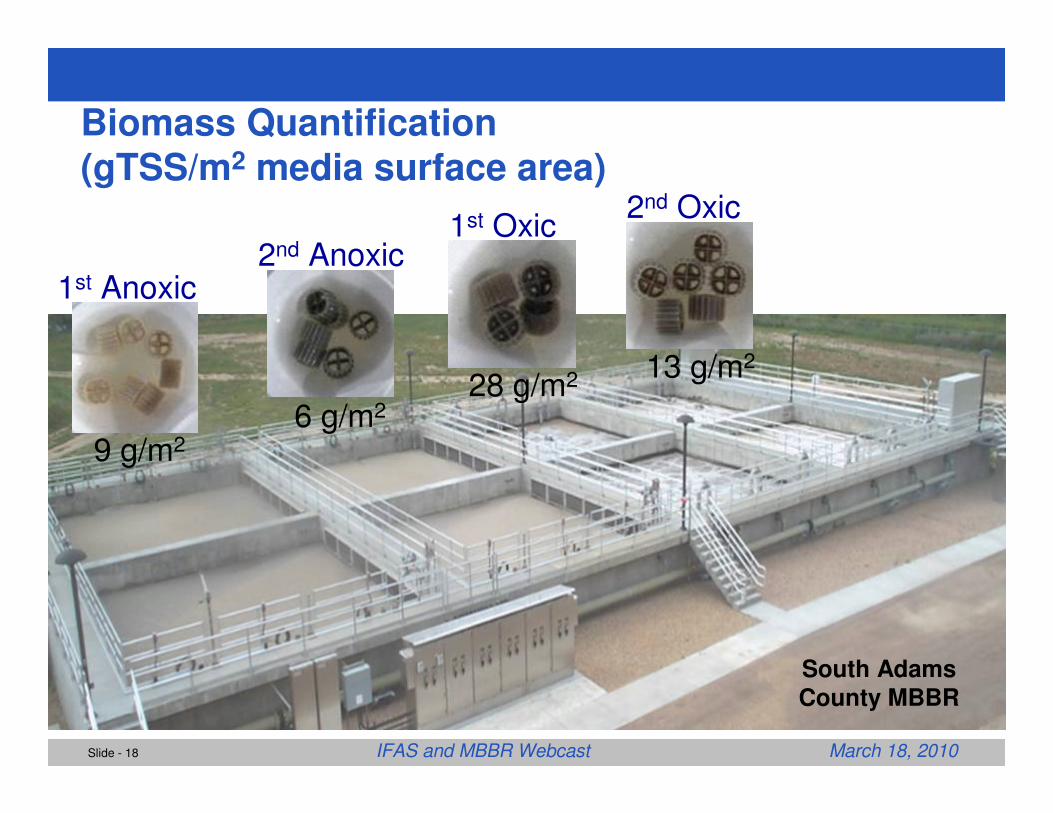
Biomass Quantification(gTSS/m2 media surface area)
2nd Anoxic1st Anoxic
1st Oxic2nd Oxic
6 g/m2
9 g/m2
28 g/m2 13 g/m2
South Adams County MBBR
Slide - 19 IFAS and MBBR Webcast March 18, 2010
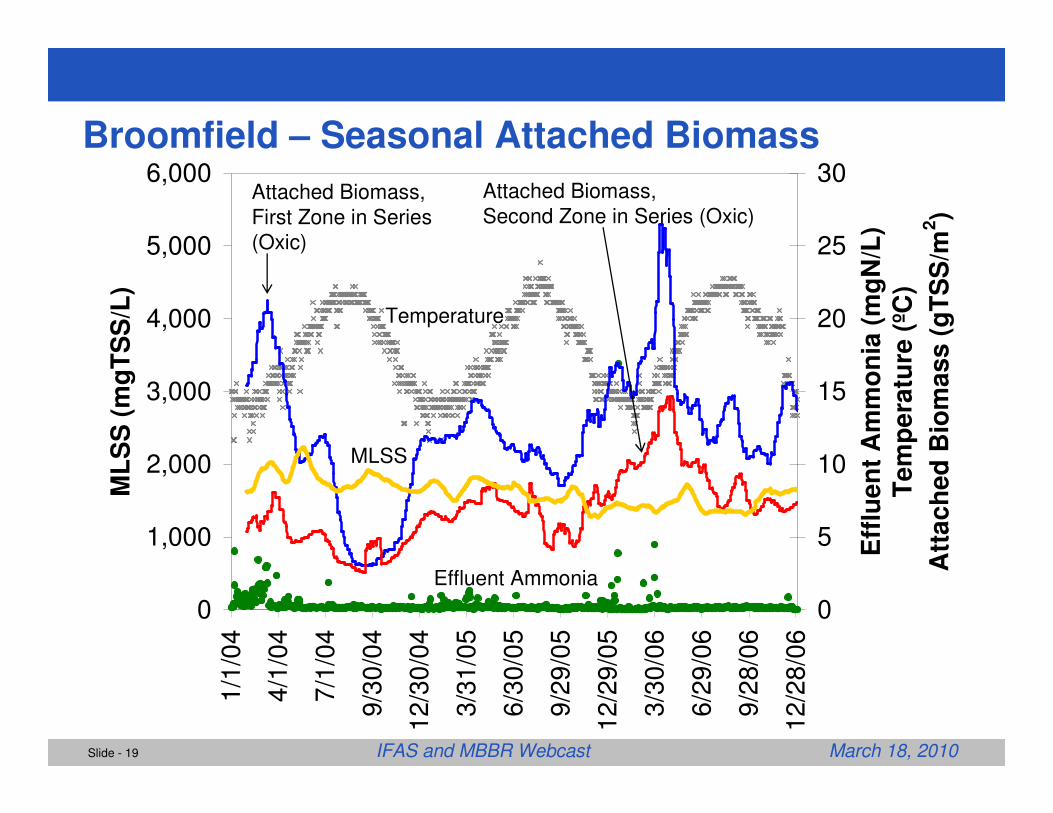
Broomfield – Seasonal Attached Biomass
0
1,000
2,000
3,000
4,000
5,000
6,000
1/1
/04
4/1
/04
7/1
/04
9/3
0/0
4
12
/30
/04
3/3
1/0
5
6/3
0/0
5
9/2
9/0
5
12
/29
/05
3/3
0/0
6
6/2
9/0
6
9/2
8/0
6
12
/28
/06
ML
SS
(m
gT
SS
/L)
0
5
10
15
20
25
30
Eff
lue
nt
Am
mo
nia
(m
gN
/L)
Te
mp
era
ture
(ºC
)
Att
ac
he
d B
iom
as
s (
gT
SS
/m2)
Temperature
MLSS
Attached Biomass,First Zone in Series (Oxic)
Attached Biomass,Second Zone in Series (Oxic)
Effluent Ammonia
Slide - 20 IFAS and MBBR Webcast March 18, 2010
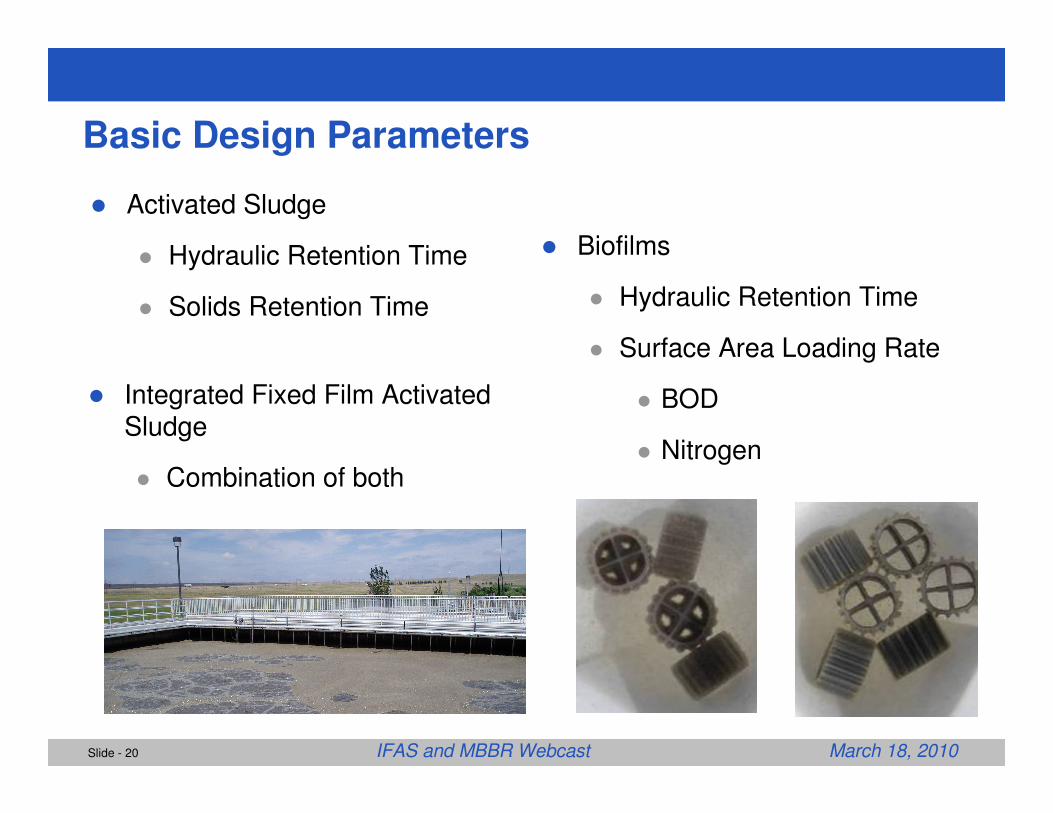
Basic Design Parameters
� Biofilms
� Hydraulic Retention Time
� Surface Area Loading Rate
� BOD
� Nitrogen
� Activated Sludge
� Hydraulic Retention Time
� Solids Retention Time
� Integrated Fixed Film Activated Sludge
� Combination of both
Slide - 21 IFAS and MBBR Webcast March 18, 2010
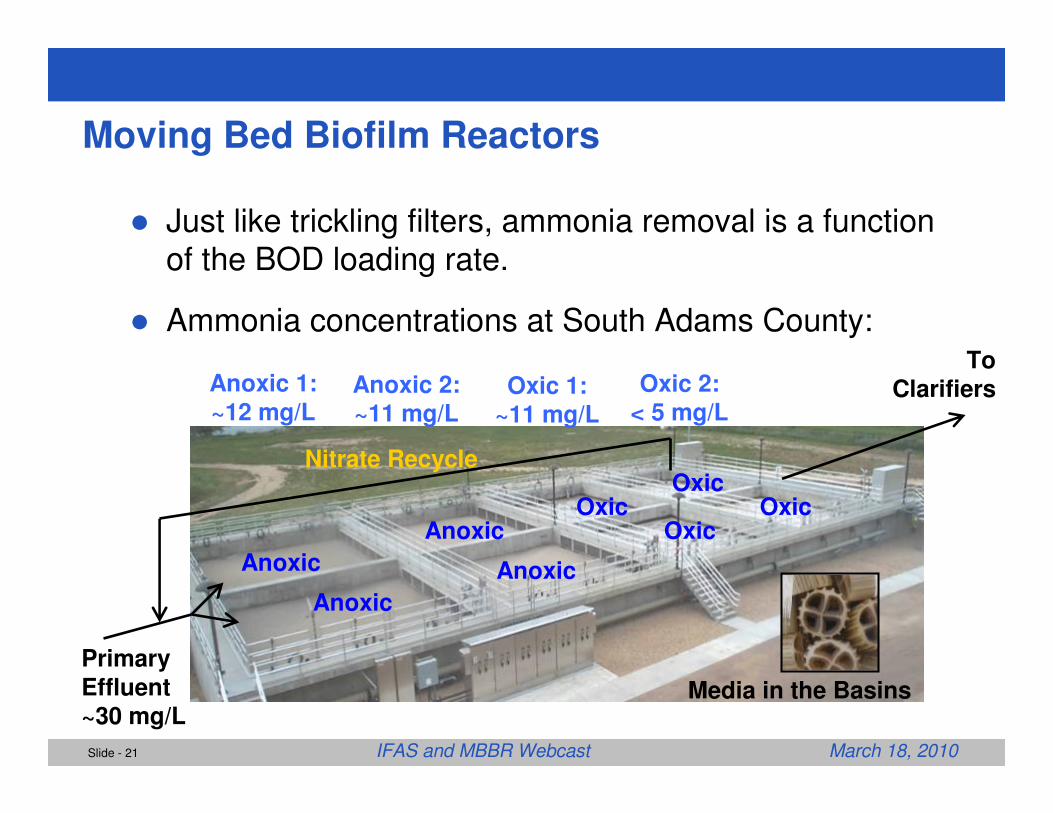
Moving Bed Biofilm Reactors
� Just like trickling filters, ammonia removal is a function of the BOD loading rate.
� Ammonia concentrations at South Adams County:
Anoxic
Anoxic
OxicOxic Oxic
Oxic
Anoxic
Anoxic
Nitrate Recycle
Primary Effluent ~30 mg/L
To Clarifiers
Media in the Basins
Anoxic 1: ~12 mg/L
Anoxic 2: ~11 mg/L
Oxic 1: ~11 mg/L
Oxic 2: < 5 mg/L
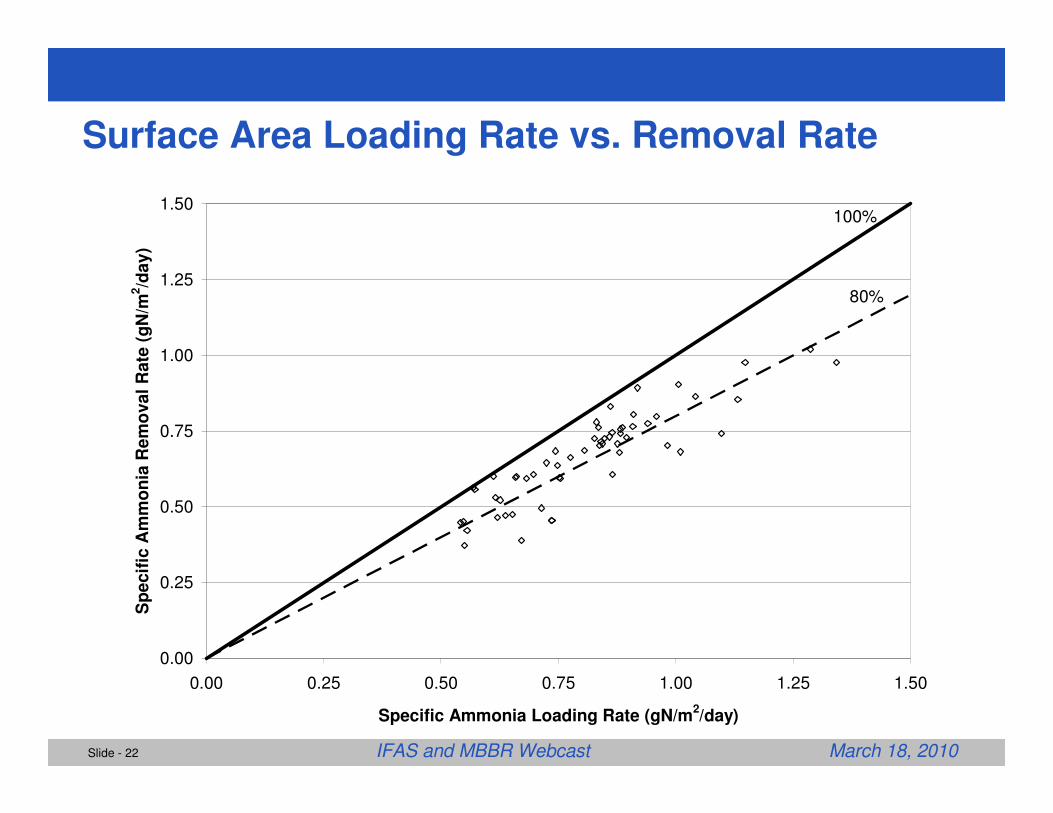
Slide - 22 IFAS and MBBR Webcast March 18, 2010
Surface Area Loading Rate vs. Removal Rate
0.00
0.25
0.50
0.75
1.00
1.25
1.50
0.00 0.25 0.50 0.75 1.00 1.25 1.50
Specific Ammonia Loading Rate (gN/m2/day)
Sp
ecif
ic A
mm
on
ia R
em
ova
l R
ate
(g
N/m
2/d
ay
)
100%
80%
Slide - 23 IFAS and MBBR Webcast March 18, 2010
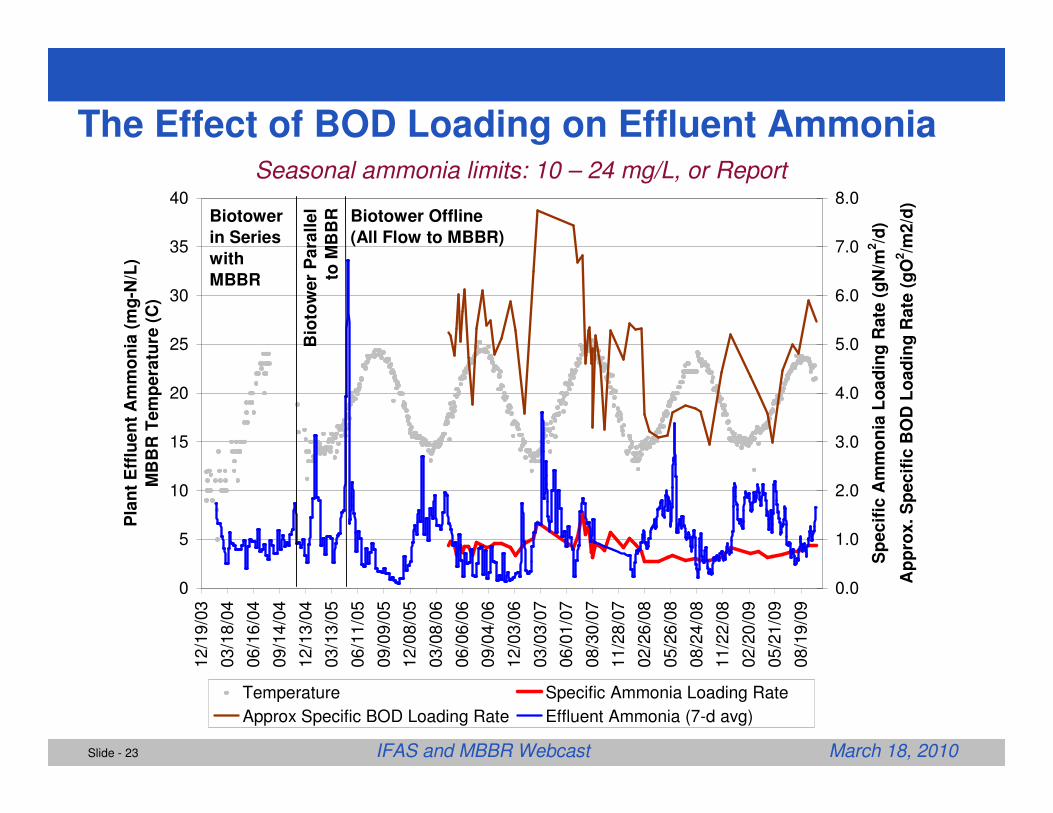
The Effect of BOD Loading on Effluent Ammonia
0
5
10
15
20
25
30
35
4012
/19
/03
03
/18
/04
06
/16
/04
09
/14
/04
12
/13
/04
03
/13
/05
06
/11
/05
09
/09
/05
12
/08
/05
03
/08
/06
06
/06
/06
09
/04
/06
12
/03
/06
03
/03
/07
06
/01
/07
08
/30
/07
11
/28
/07
02
/26
/08
05
/26
/08
08
/24
/08
11
/22
/08
02
/20
/09
05
/21
/09
08
/19
/09
Pla
nt
Eff
lue
nt
Am
mo
nia
(m
g-N
/L)
MB
BR
Tem
pera
ture
(C
)
0.0
1.0
2.0
3.0
4.0
5.0
6.0
7.0
8.0
Sp
ec
ific
Am
mo
nia
Lo
ad
ing
Rate
(g
N/m
2/d
)
Ap
pro
x.
Sp
ec
ific
BO
D L
oad
ing
Rate
(g
O2/m
2/d
)
Temperature Specific Ammonia Loading Rate
Approx Specific BOD Loading Rate Effluent Ammonia (7-d avg)
Biotower
in Series
with
MBBR
Bio
tow
er
Para
lle
l
to M
BB
R Biotower Offline
(All Flow to MBBR)
Seasonal ammonia limits: 10 – 24 mg/L, or Report
Slide - 24 IFAS and MBBR Webcast March 18, 2010
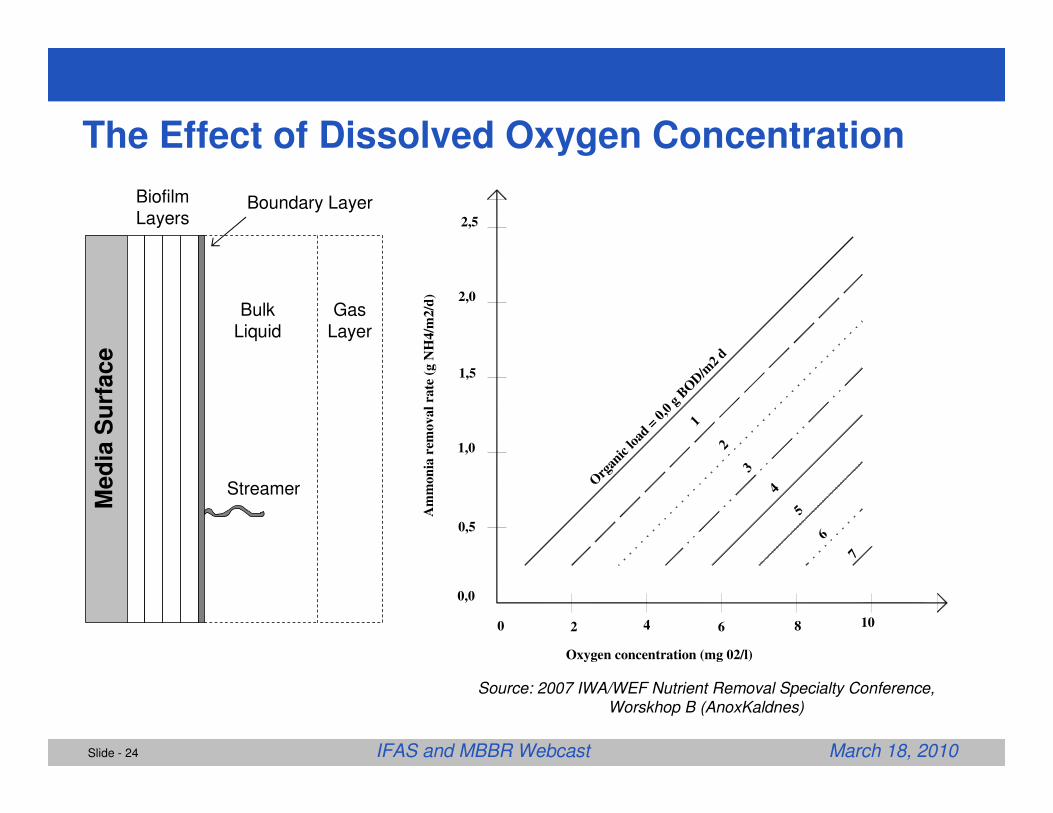
The Effect of Dissolved Oxygen Concentration
Org
anic
load
= 0
,0 g
BO
D/m
2 d
0,0
1
2
3
4
5
6
7
0,5
1,0
1,5
2,0
2,5
0 2 4 6 8 10
Oxygen concentration (mg 02/l)
Am
mon
ia r
emov
al
rate
(g
NH
4/m
2/d
)
Me
dia
Su
rfa
ce
Boundary Layer
Bulk Liquid
Gas Layer
BiofilmLayers
Streamer
Source: 2007 IWA/WEF Nutrient Removal Specialty Conference, Worskhop B (AnoxKaldnes)
Slide - 25 IFAS and MBBR Webcast March 18, 2010
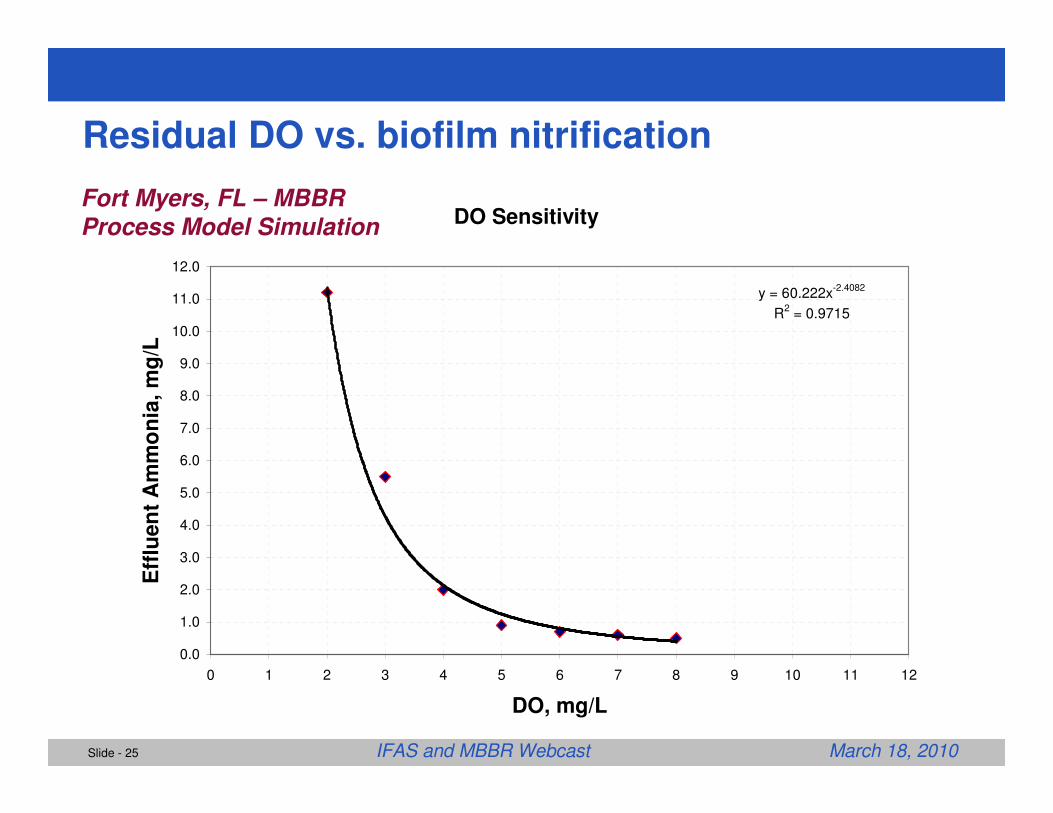
DO Sensitivity
y = 60.222x-2.4082
R2 = 0.9715
0.0
1.0
2.0
3.0
4.0
5.0
6.0
7.0
8.0
9.0
10.0
11.0
12.0
0 1 2 3 4 5 6 7 8 9 10 11 12
DO, mg/L
Eff
luen
t A
mm
on
ia,
mg
/LResidual DO vs. biofilm nitrification
Fort Myers, FL – MBBR
Process Model Simulation
Slide - 26 IFAS and MBBR Webcast March 18, 2010
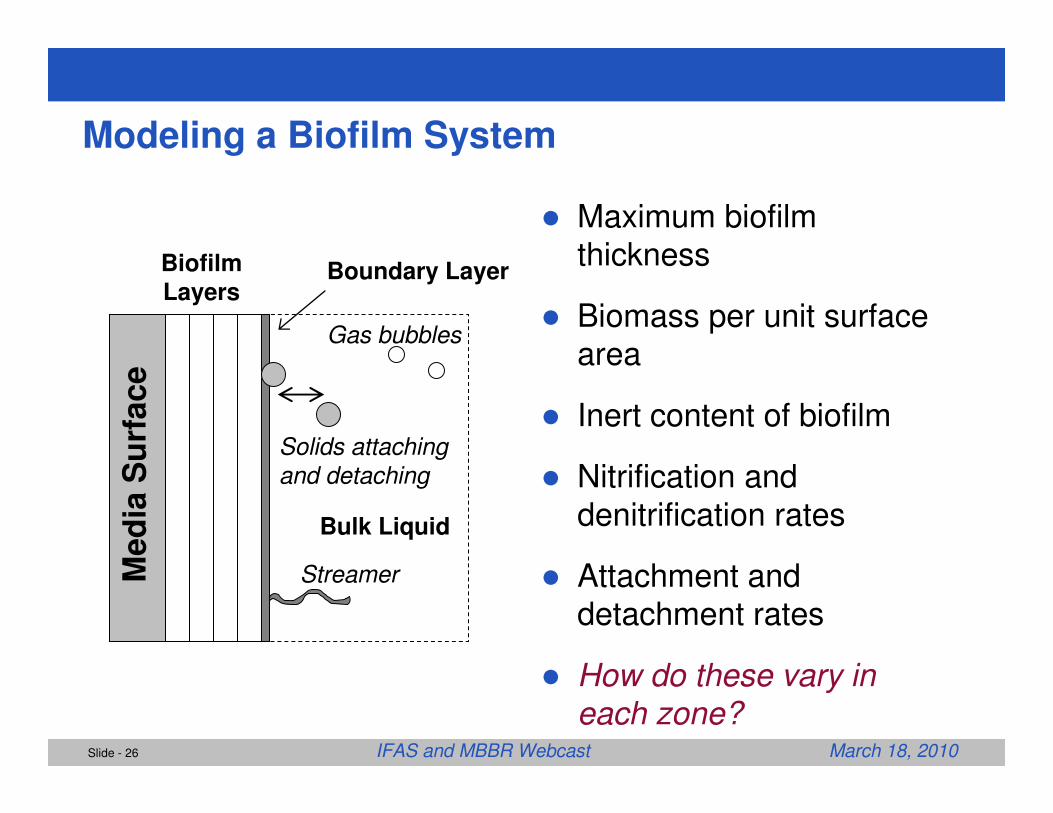
Modeling a Biofilm SystemM
ed
ia S
urf
ace
Boundary Layer
Bulk Liquid
BiofilmLayers
Streamer
Gas bubbles
Solids attaching
and detaching
� Maximum biofilmthickness
� Biomass per unit surface area
� Inert content of biofilm
� Nitrification and denitrification rates
� Attachment and detachment rates
� How do these vary in each zone?
Slide - 27 IFAS and MBBR Webcast March 18, 2010
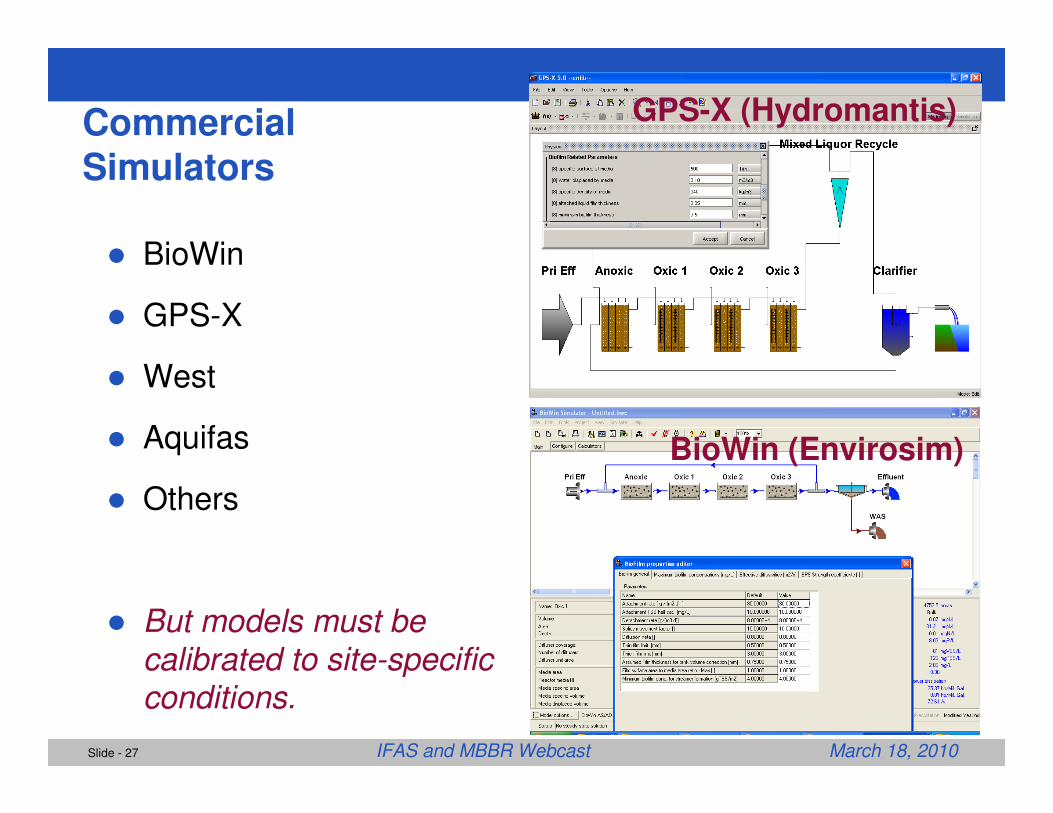
Commercial Simulators
� BioWin
� GPS-X
� West
� Aquifas
� Others
� But models must be
calibrated to site-specific conditions.
GPS-X (Hydromantis)
BioWin (Envirosim)
Slide - 28 IFAS and MBBR Webcast March 18, 2010
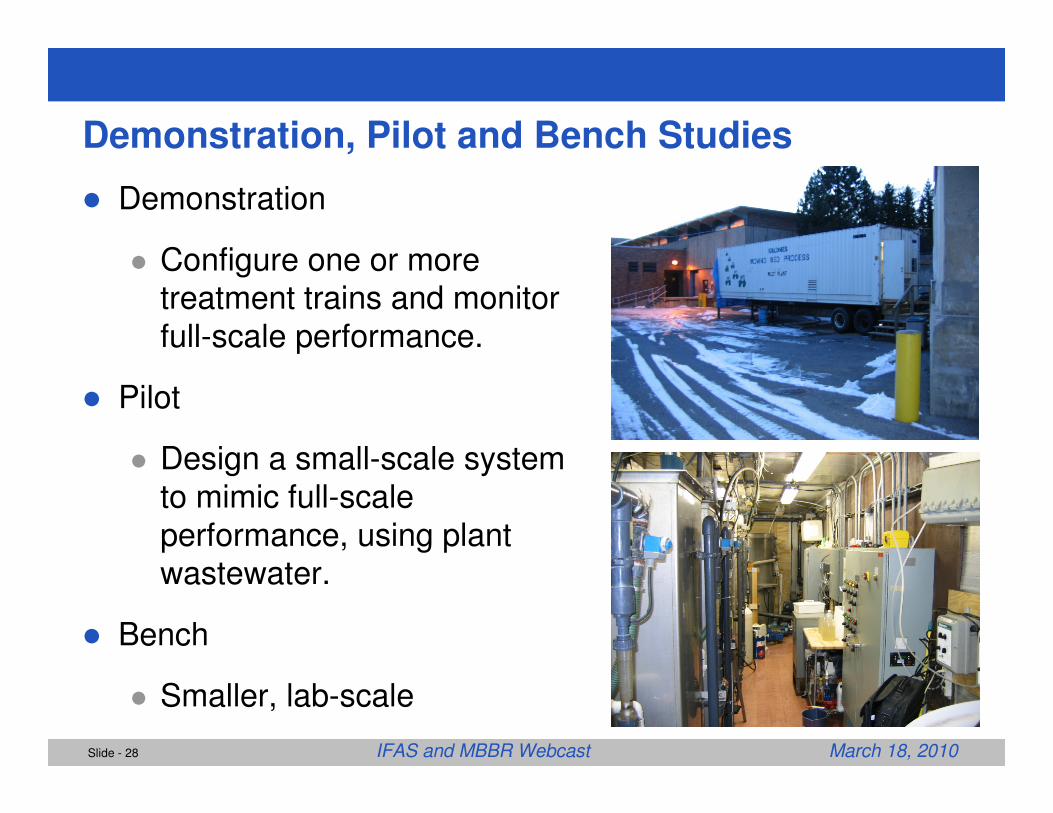
Demonstration, Pilot and Bench Studies
� Demonstration
� Configure one or more treatment trains and monitor full-scale performance.
� Pilot
� Design a small-scale system to mimic full-scale performance, using plant wastewater.
� Bench
� Smaller, lab-scale
Slide - 29 IFAS and MBBR Webcast March 18, 2010
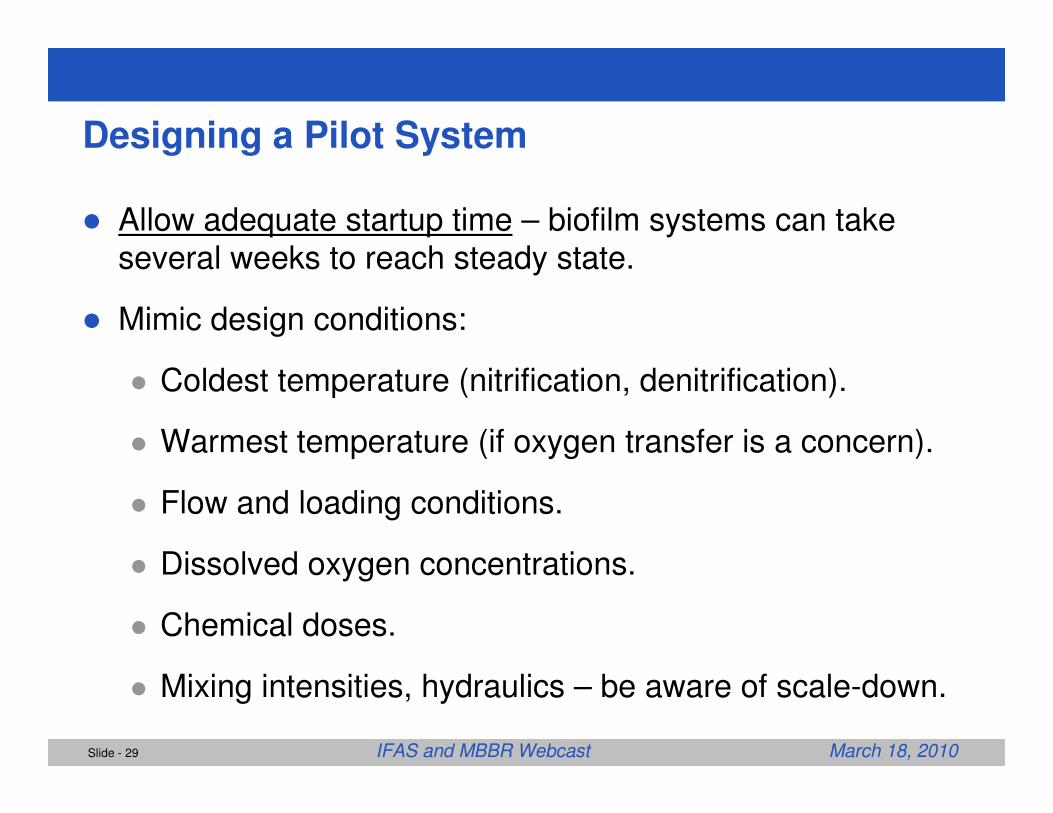
Designing a Pilot System
� Allow adequate startup time – biofilm systems can take several weeks to reach steady state.
� Mimic design conditions:
� Coldest temperature (nitrification, denitrification).
� Warmest temperature (if oxygen transfer is a concern).
� Flow and loading conditions.
� Dissolved oxygen concentrations.
� Chemical doses.
� Mixing intensities, hydraulics – be aware of scale-down.
Slide - 30 IFAS and MBBR Webcast March 18, 2010
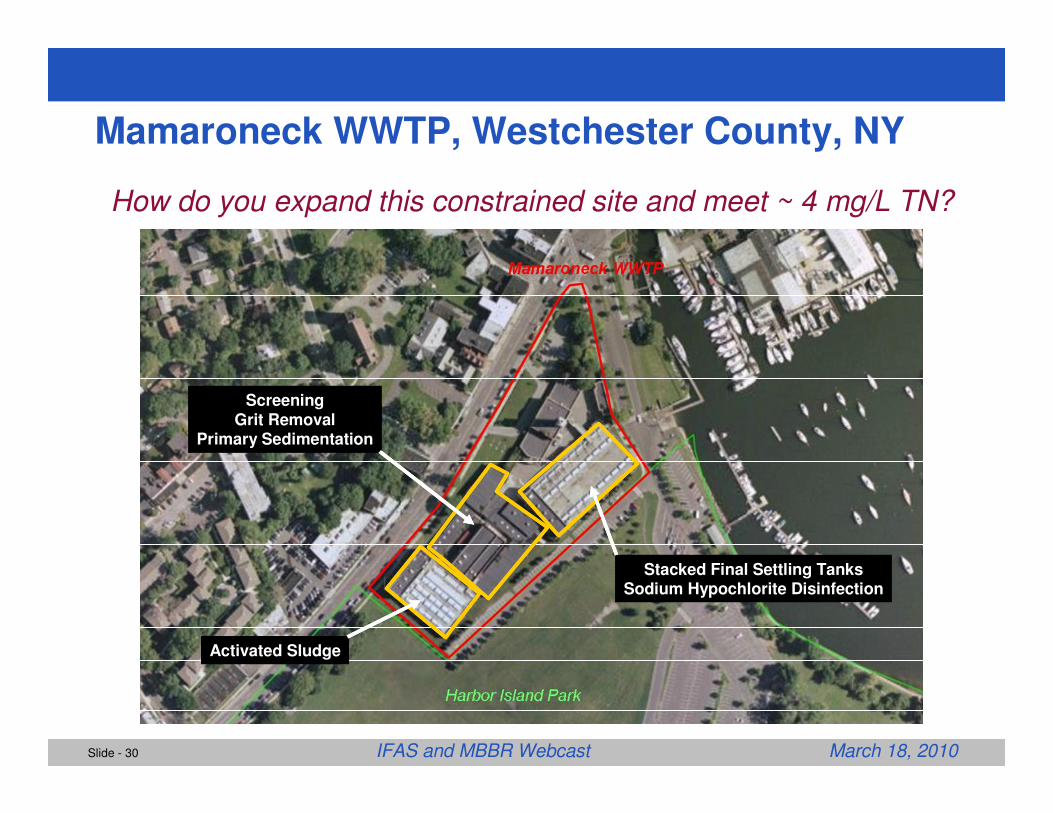
Mamaroneck WWTP, Westchester County, NY
ScreeningGrit Removal
Primary Sedimentation
ScreeningGrit Removal
Primary Sedimentation
Activated SludgeActivated Sludge
Stacked Final Settling TanksSodium Hypochlorite Disinfection
Stacked Final Settling TanksSodium Hypochlorite Disinfection
How do you expand this constrained site and meet ~ 4 mg/L TN?
Slide - 31 IFAS and MBBR Webcast March 18, 2010
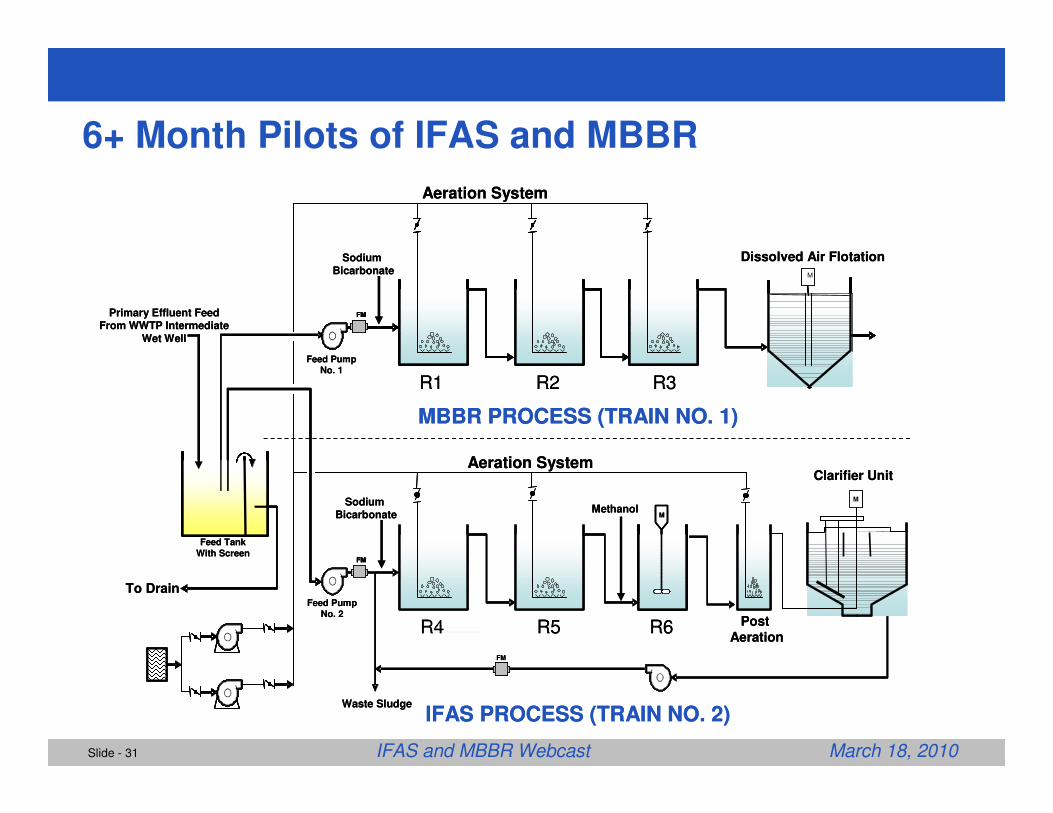
6+ Month Pilots of IFAS and MBBR
M
M
Aeration System
Feed PumpNo. 1
FM
Dissolved Air FlotationSodium Bicarbonate
Feed PumpNo. 2
FM
Post Aeration
Clarifier Unit
FM
Waste Sludge
MBBR PROCESS (TRAIN NO. 1)
IFAS PROCESS (TRAIN NO. 2)
Feed TankWith Screen
To Drain
Methanol
M
M
Aeration System
FM
FM
Primary Effluent FeedFrom WWTP Intermediate
Wet Well
Sodium Bicarbonate
R1 R2 R3
R4 R5 R6
MM
M
Aeration System
Feed PumpNo. 1
FM
Dissolved Air FlotationSodium Bicarbonate
Feed PumpNo. 2
FM
Post Aeration
Clarifier Unit
FM
Waste Sludge
MBBR PROCESS (TRAIN NO. 1)
IFAS PROCESS (TRAIN NO. 2)
Feed TankWith Screen
To Drain
Methanol
M
M
Aeration System
FM
FM
Primary Effluent FeedFrom WWTP Intermediate
Wet Well
Sodium Bicarbonate
R1 R2 R3
R4 R5 R6
Slide - 32 IFAS and MBBR Webcast March 18, 2010
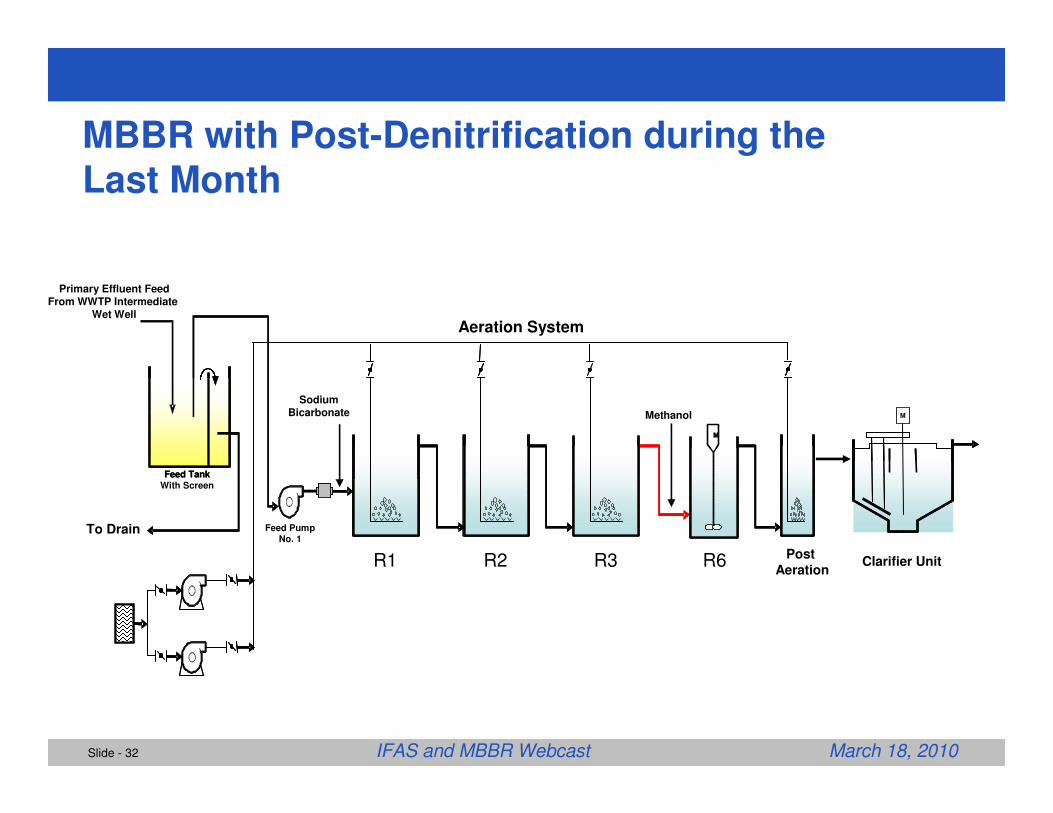
MBBR with Post-Denitrification during the Last Month
Feed PumpNo. 1
SodiumBicarbonate Methanol
M
Feed Tank
To Drain
Primary Effluent FeedFrom WWTP Intermediate
Wet Well
Aeration System
Clarifier UnitPost
Aeration
M
Feed TankWith Screen
R1 R2 R3 R6
M
Slide - 33 IFAS and MBBR Webcast March 18, 2010
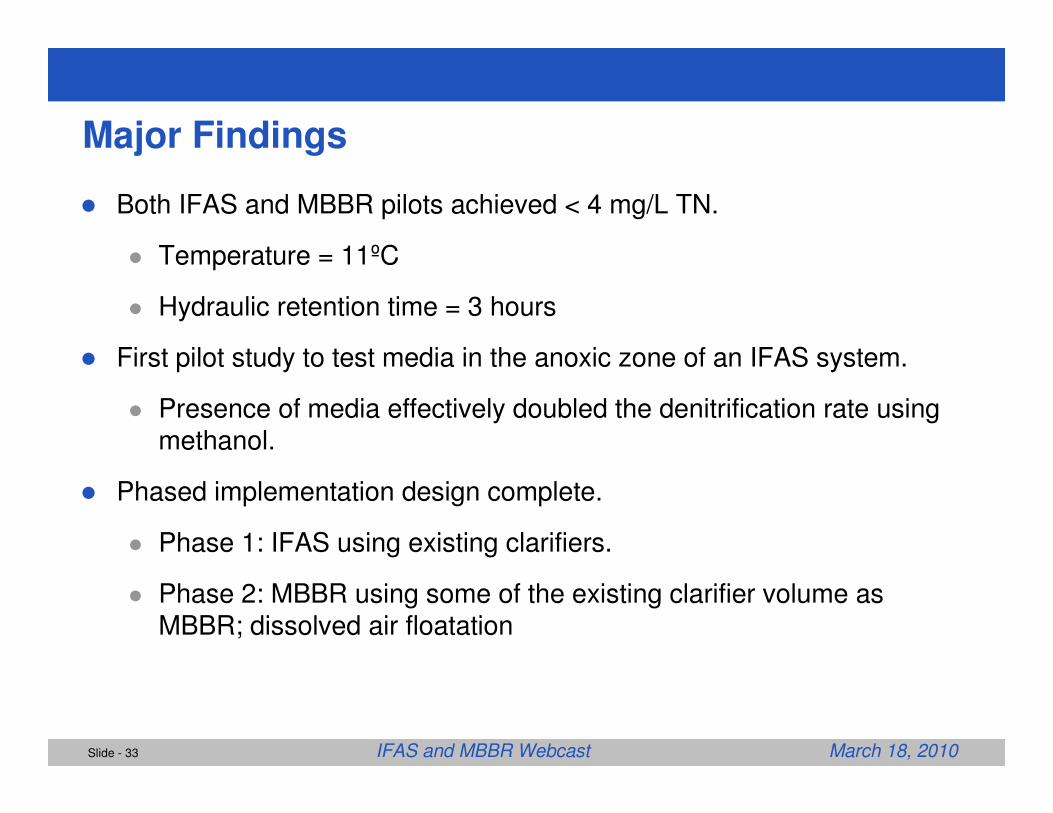
Major Findings
� Both IFAS and MBBR pilots achieved < 4 mg/L TN.
� Temperature = 11ºC
� Hydraulic retention time = 3 hours
� First pilot study to test media in the anoxic zone of an IFAS system.
� Presence of media effectively doubled the denitrification rate using methanol.
� Phased implementation design complete.
� Phase 1: IFAS using existing clarifiers.
� Phase 2: MBBR using some of the existing clarifier volume as MBBR; dissolved air floatation
Slide - 34 IFAS and MBBR Webcast March 18, 2010
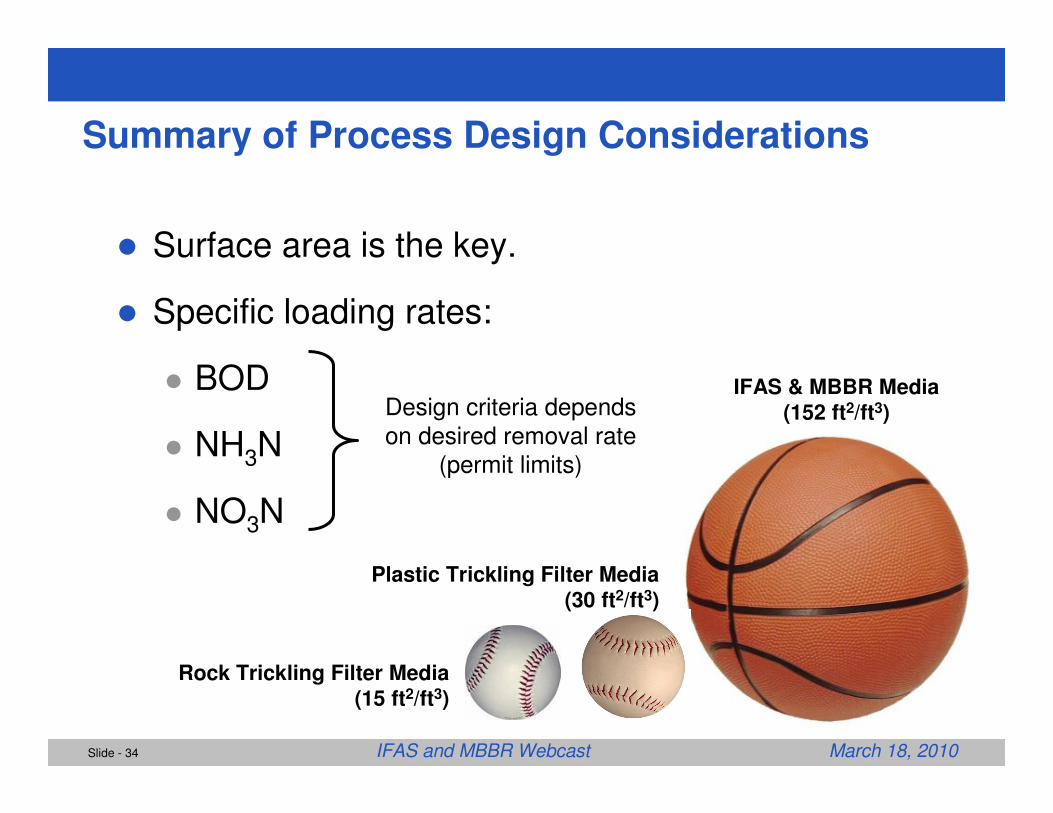
Summary of Process Design Considerations
� Surface area is the key.
� Specific loading rates:
� BOD
� NH3N
� NO3N
Rock Trickling Filter Media (15 ft2/ft3)
Plastic Trickling Filter Media (30 ft2/ft3)
IFAS & MBBR Media (152 ft2/ft3)Design criteria depends
on desired removal rate (permit limits)

BUILDING A WORLD OF DIFFERENCE®
Slide - 35 IFAS and MBBR Webcast March 18, 2010
Practical Design Considerations
Practical Design Considerations
Slide - 36 IFAS and MBBR Webcast March 18, 2010
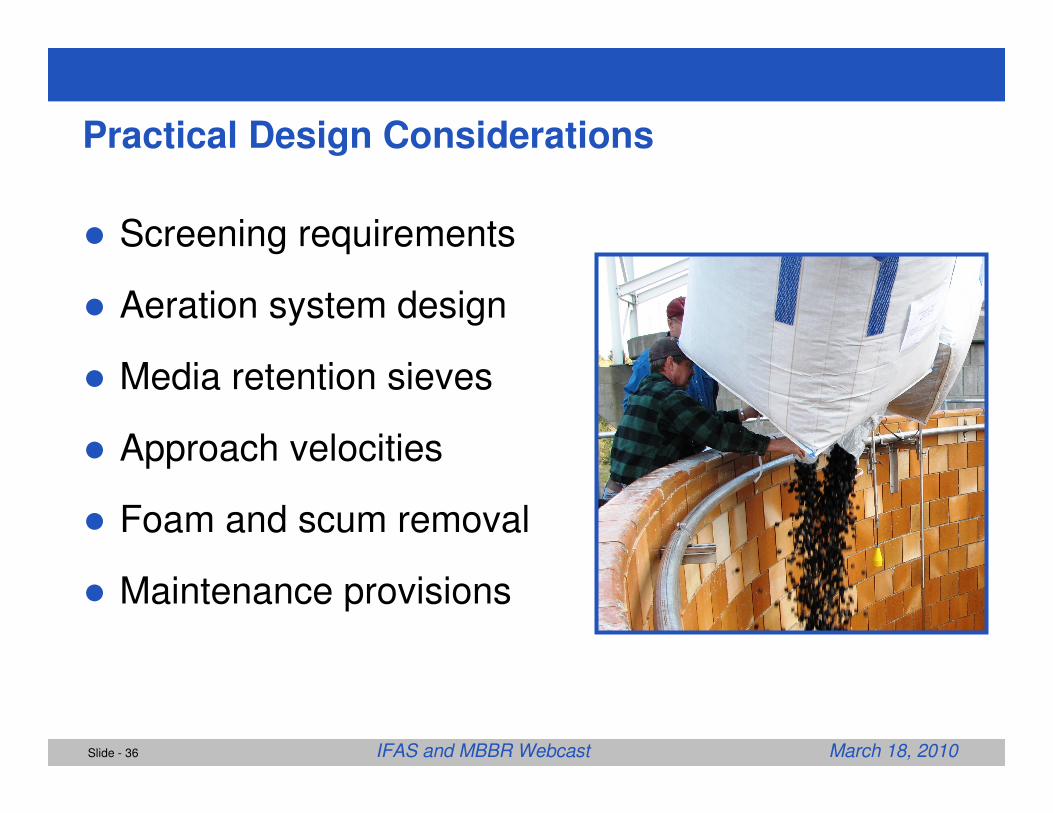
Practical Design Considerations
� Screening requirements
� Aeration system design
� Media retention sieves
� Approach velocities
� Foam and scum removal
� Maintenance provisions
Slide - 37 IFAS and MBBR Webcast March 18, 2010
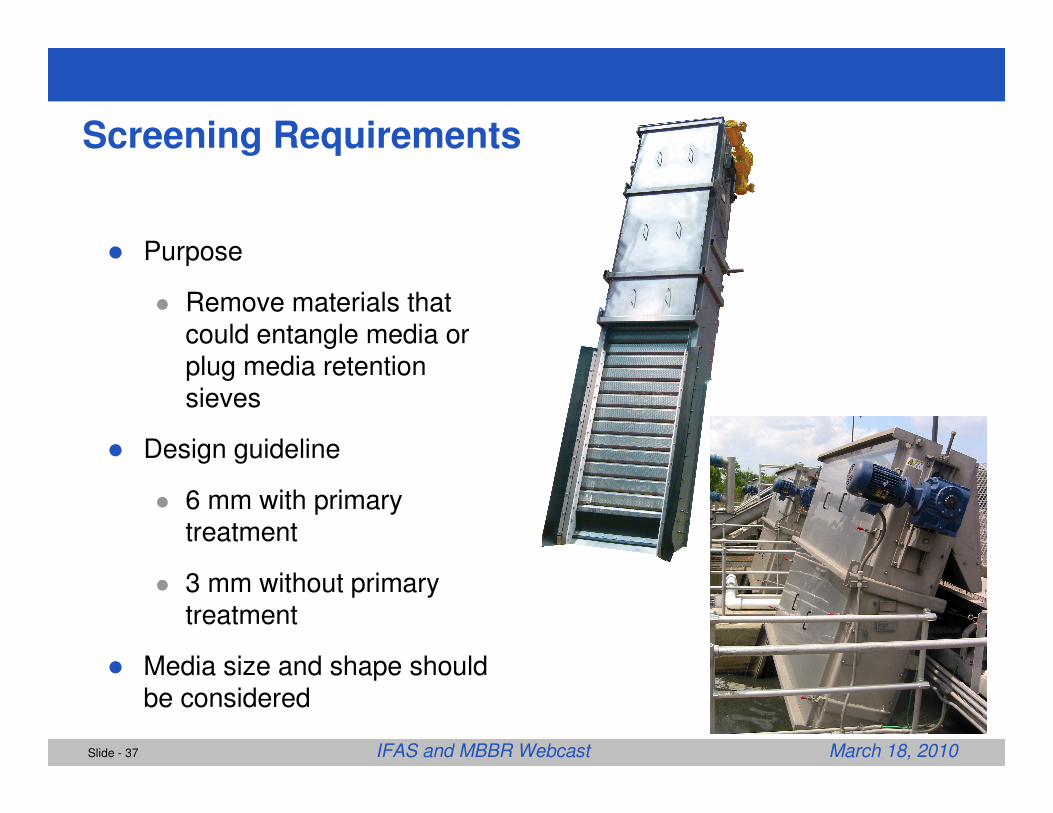
Screening Requirements
� Purpose
� Remove materials that could entangle media or plug media retention sieves
� Design guideline
� 6 mm with primary treatment
� 3 mm without primary treatment
� Media size and shape should be considered
Slide - 38 IFAS and MBBR Webcast March 18, 2010
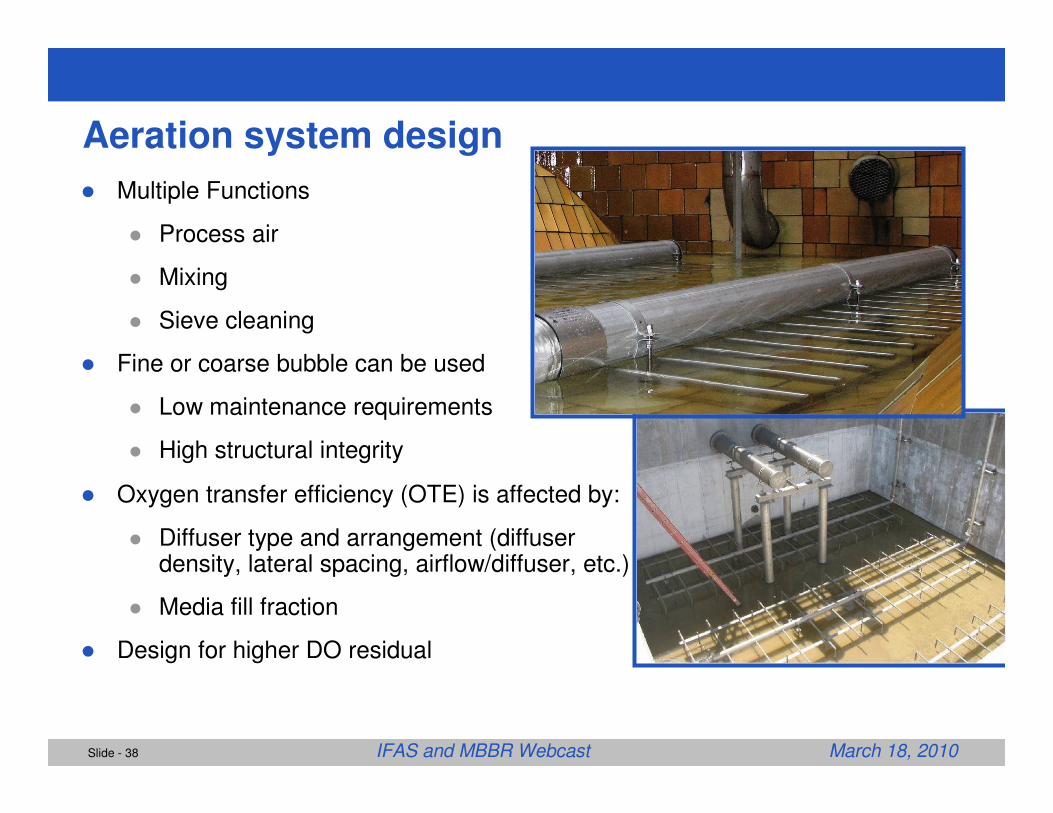
Aeration system design
� Multiple Functions
� Process air
� Mixing
� Sieve cleaning
� Fine or coarse bubble can be used
� Low maintenance requirements
� High structural integrity
� Oxygen transfer efficiency (OTE) is affected by:
� Diffuser type and arrangement (diffuser density, lateral spacing, airflow/diffuser, etc.)
� Media fill fraction
� Design for higher DO residual
Slide - 39 IFAS and MBBR Webcast March 18, 2010
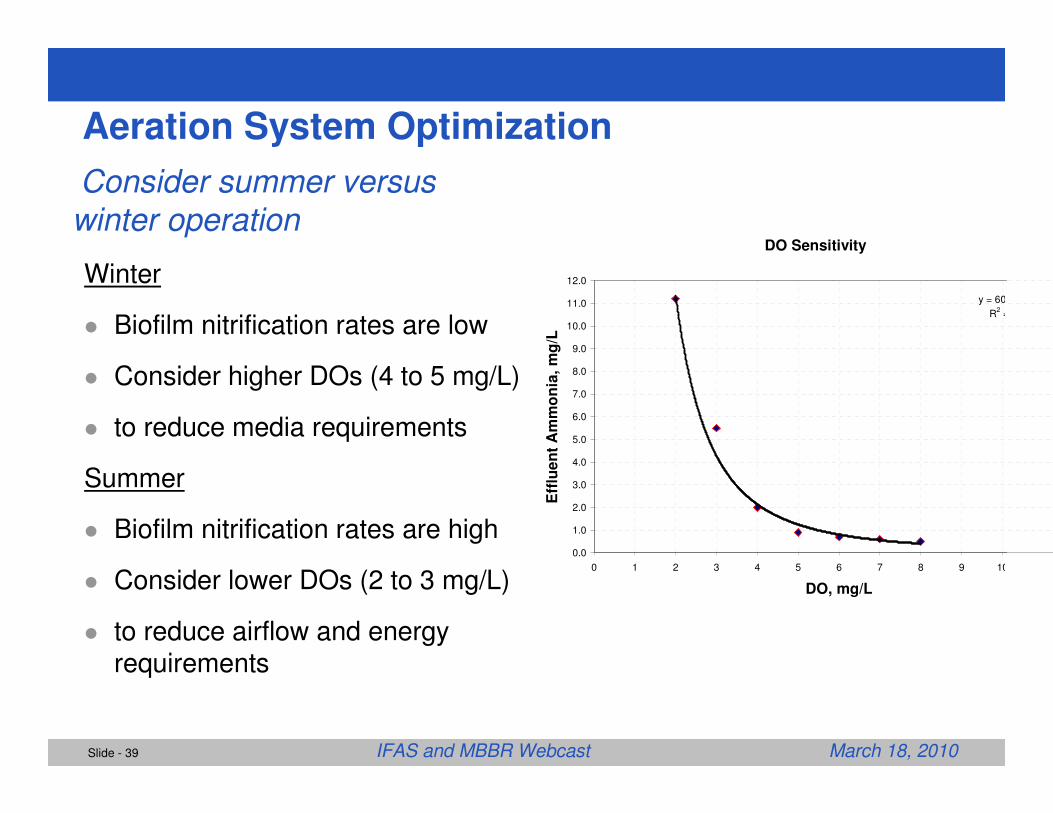
Aeration System Optimization
Consider summer versus
winter operation
Winter
� Biofilm nitrification rates are low
� Consider higher DOs (4 to 5 mg/L)
� to reduce media requirements
Summer
� Biofilm nitrification rates are high
� Consider lower DOs (2 to 3 mg/L)
� to reduce airflow and energy requirements
DO Sensitivity
y = 60.
R2 =
0.0
1.0
2.0
3.0
4.0
5.0
6.0
7.0
8.0
9.0
10.0
11.0
12.0
0 1 2 3 4 5 6 7 8 9 10
DO, mg/L
Eff
lue
nt
Am
mo
nia
, m
g/L
Slide - 40 IFAS and MBBR Webcast March 18, 2010
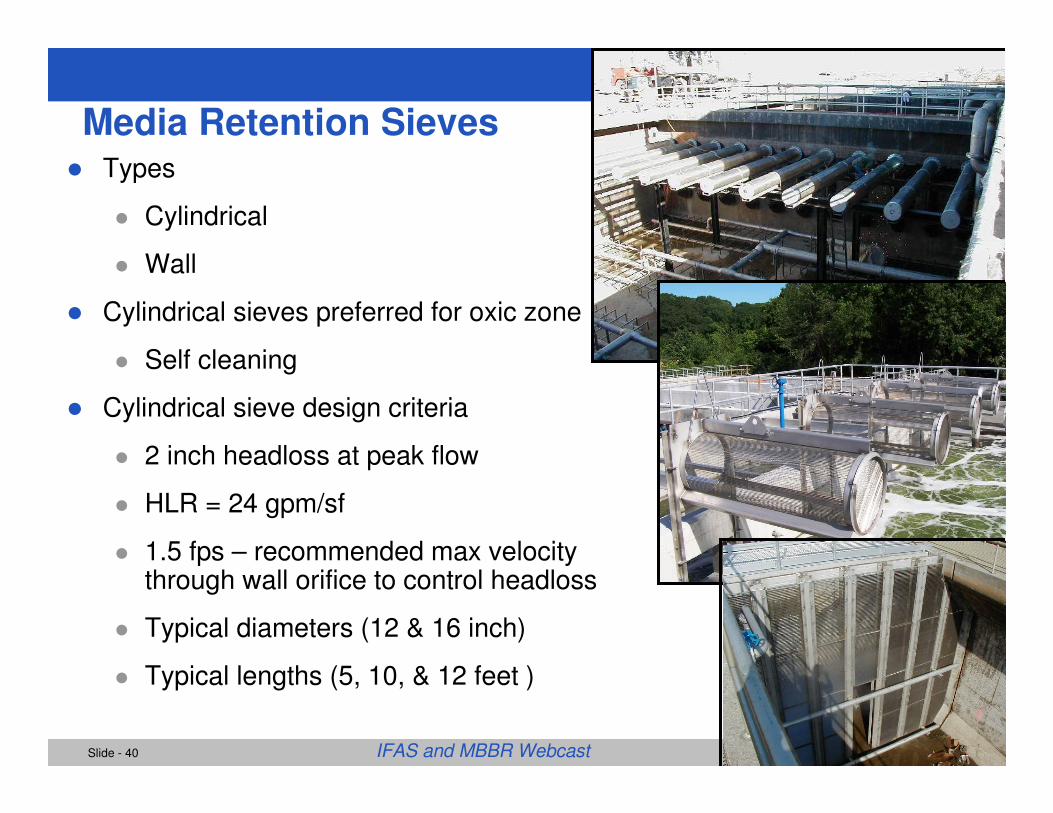
Media Retention Sieves� Types
� Cylindrical
� Wall
� Cylindrical sieves preferred for oxic zone
� Self cleaning
� Cylindrical sieve design criteria
� 2 inch headloss at peak flow
� HLR = 24 gpm/sf
� 1.5 fps – recommended max velocity through wall orifice to control headloss
� Typical diameters (12 & 16 inch)
� Typical lengths (5, 10, & 12 feet )
Slide - 41 IFAS and MBBR Webcast March 18, 2010
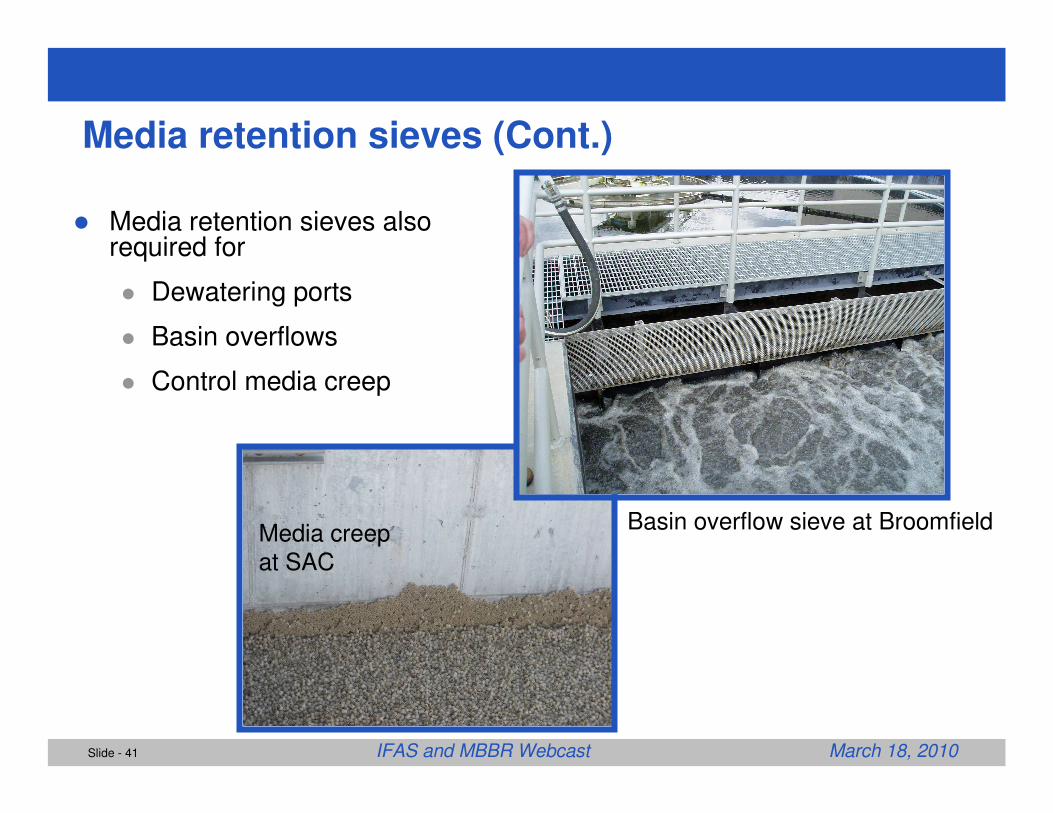
Media retention sieves (Cont.)
� Media retention sieves also required for
� Dewatering ports
� Basin overflows
� Control media creep
Basin overflow sieve at BroomfieldMedia creep at SAC
Slide - 42 IFAS and MBBR Webcast March 18, 2010
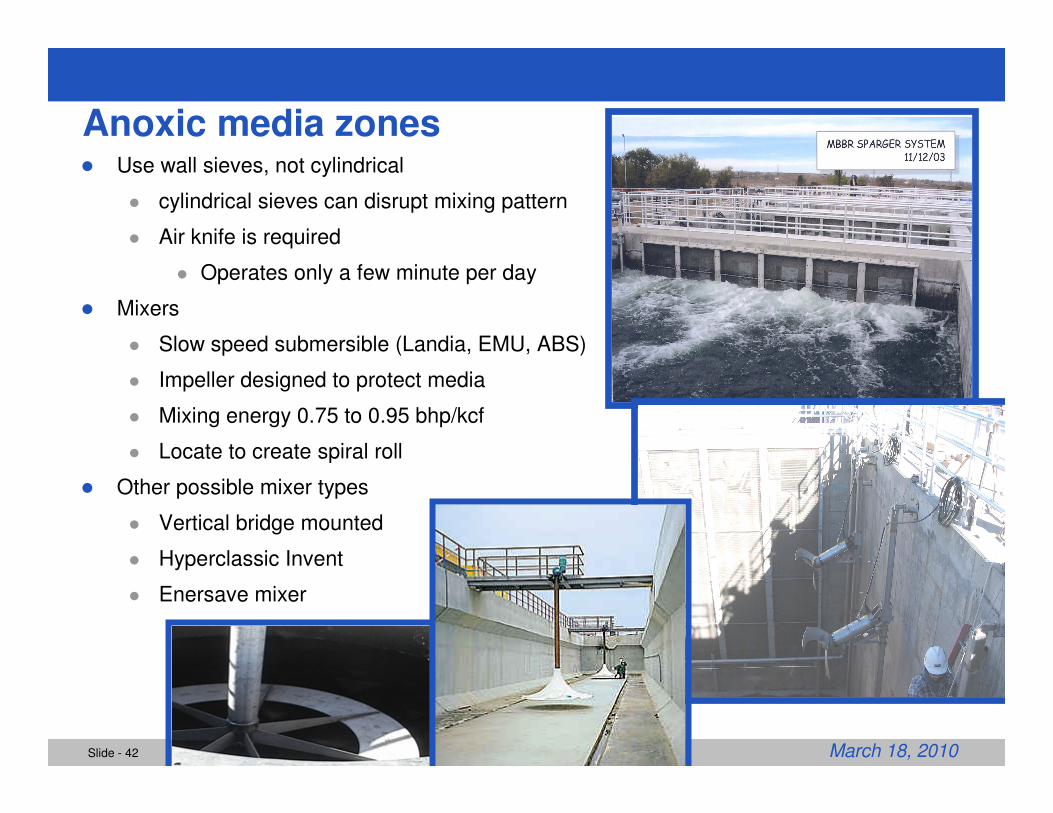
Anoxic media zones� Use wall sieves, not cylindrical
� cylindrical sieves can disrupt mixing pattern
� Air knife is required
� Operates only a few minute per day
� Mixers
� Slow speed submersible (Landia, EMU, ABS)
� Impeller designed to protect media
� Mixing energy 0.75 to 0.95 bhp/kcf
� Locate to create spiral roll
� Other possible mixer types
� Vertical bridge mounted
� Hyperclassic Invent
� Enersave mixer
Slide - 43 IFAS and MBBR Webcast March 18, 2010
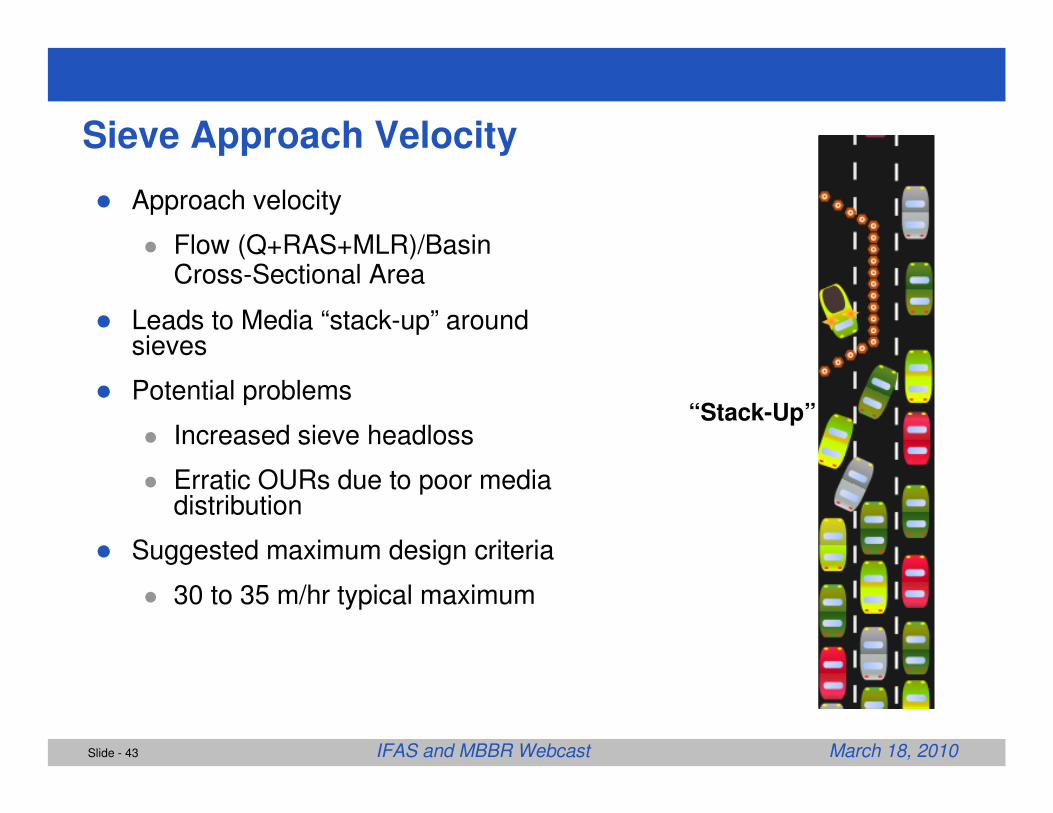
Sieve Approach Velocity
� Approach velocity
� Flow (Q+RAS+MLR)/Basin Cross-Sectional Area
� Leads to Media “stack-up” around sieves
� Potential problems
� Increased sieve headloss
� Erratic OURs due to poor media distribution
� Suggested maximum design criteria
� 30 to 35 m/hr typical maximum
“Stack-Up”
Slide - 44 IFAS and MBBR Webcast March 18, 2010
Strategies to Reduce Approach Velocity and Avoid Media Stack-Up
� Reduce basin length to width ratio
� < 4:1 if possible
� Increase mixing energy under sieves
� Reduce MLR during peak flows
� Use longer sieves, in multiple rows
� Include media return airlift pump
� Spiral roll aeration design
� More cells in series
Slide - 45 IFAS and MBBR Webcast March 18, 2010
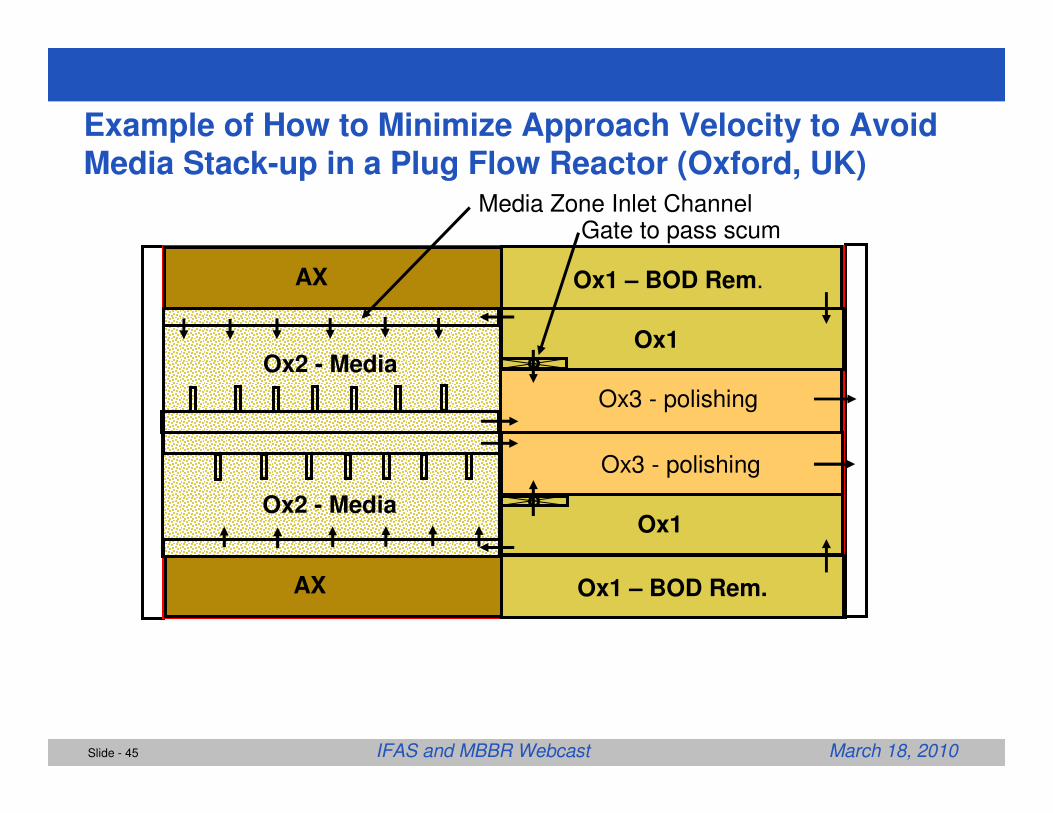
Example of How to Minimize Approach Velocity to Avoid Media Stack-up in a Plug Flow Reactor (Oxford, UK)
AX
AX
Ox1 – BOD Rem.
Ox1 – BOD Rem.
Ox1
Ox1
Gate to pass scum
Ox3 - polishing
Ox3 - polishing
Media Zone Inlet Channel
Ox2 - Media
Ox2 - Media
Slide - 46 IFAS and MBBR Webcast March 18, 2010
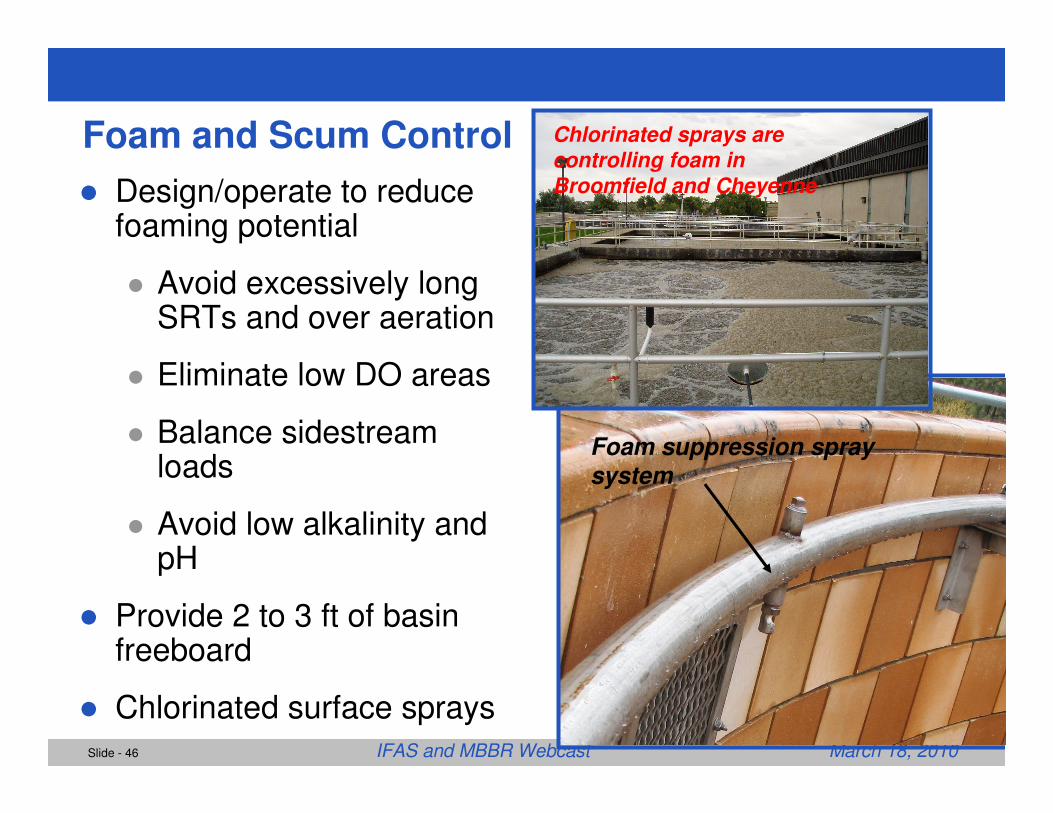
Foam and Scum Control
� Design/operate to reduce foaming potential
� Avoid excessively long SRTs and over aeration
� Eliminate low DO areas
� Balance sidestreamloads
� Avoid low alkalinity and pH
� Provide 2 to 3 ft of basin freeboard
� Chlorinated surface sprays
Chlorinated sprays are
controlling foam in
Broomfield and Cheyenne
Foam suppression spray
system
Slide - 47 IFAS and MBBR Webcast March 18, 2010
Maintenance Provisions
� Design hydraulics for one train out-of-service
� Media shuffle plan for taking basin off-line
� Media storage
� Media transfer pumps
� Biofilm integrity during storage?
� Odors during storage?
BUILDING A WORLD OF DIFFERENCE®
Slide - 48 IFAS and MBBR Webcast March 18, 2010
Applications of IFAS/MBBR in North
America
Applications of IFAS/MBBR in North
America
Slide - 49 IFAS and MBBR Webcast March 18, 2010October 10-14, 2009
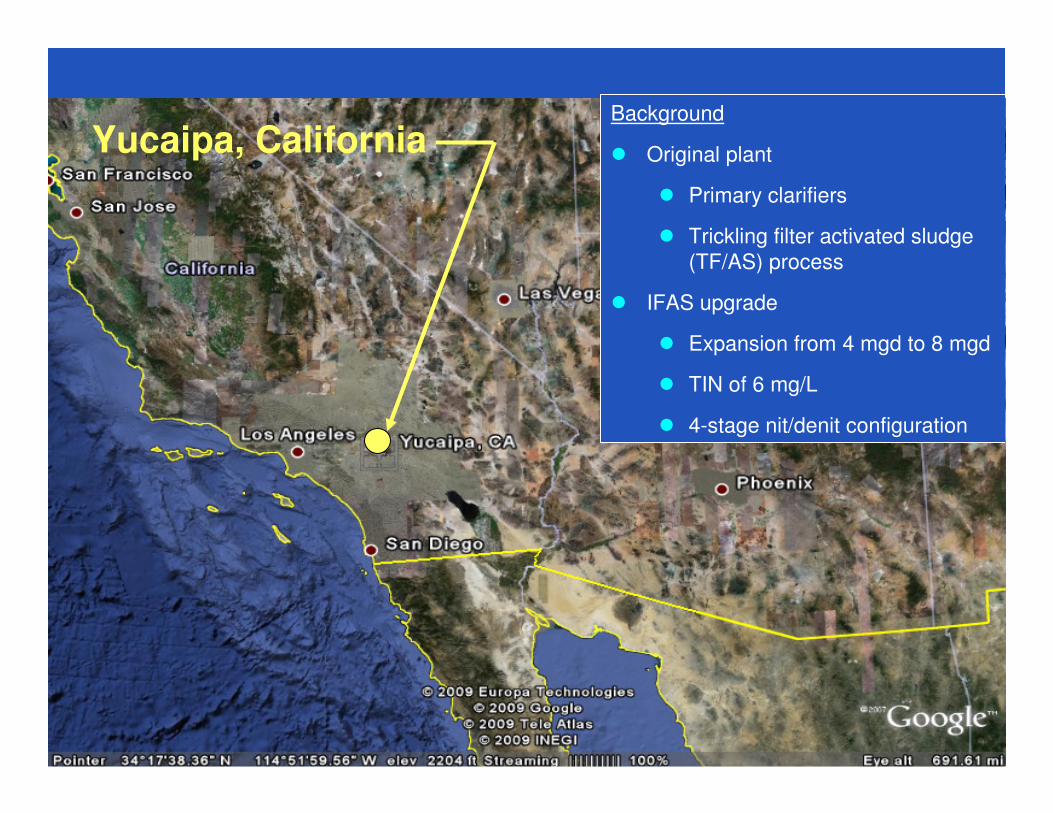
Background
� Original plant
� Primary clarifiers
� Trickling filter activated sludge (TF/AS) process
� IFAS upgrade
� Expansion from 4 mgd to 8 mgd
� TIN of 6 mg/L
� 4-stage nit/denit configuration
Yucaipa, California
Slide - 50 IFAS and MBBR Webcast March 18, 2010October 10-14, 2009
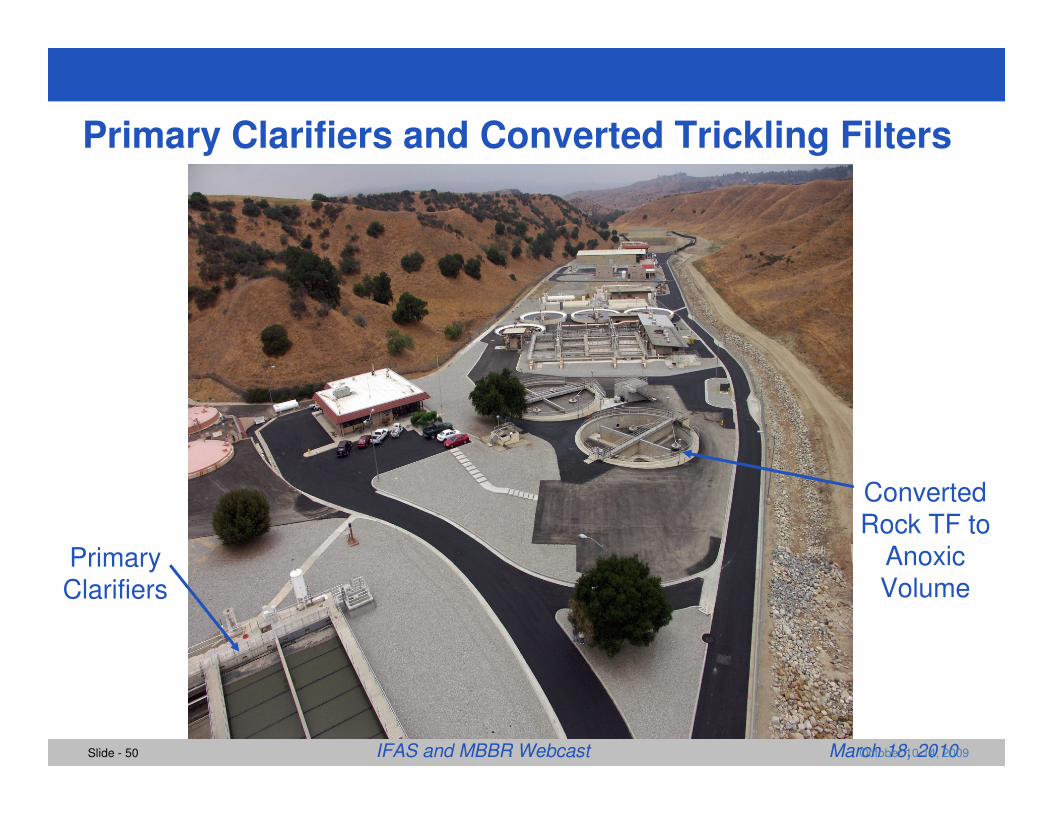
Primary Clarifiers and Converted Trickling Filters
Primary Clarifiers
Converted Rock TF to
Anoxic Volume
Slide - 51 IFAS and MBBR Webcast March 18, 2010October 10-14, 2009
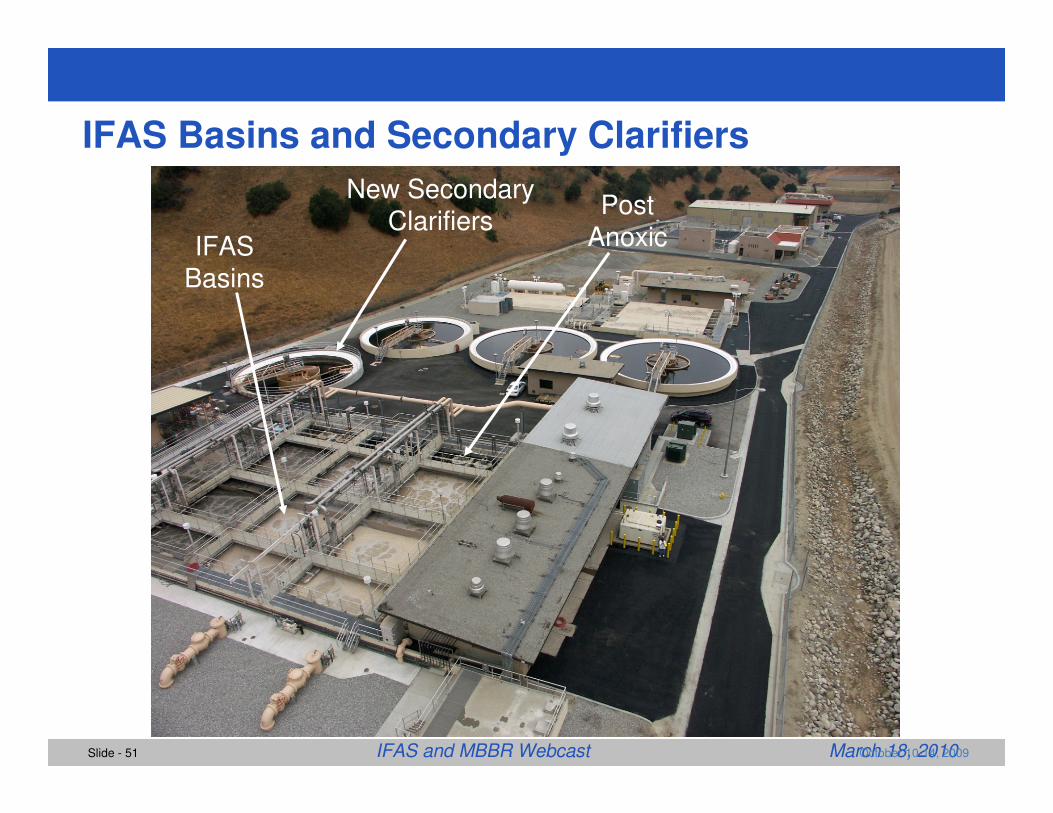
IFAS Basins and Secondary Clarifiers
IFAS Basins
New Secondary Clarifiers
Post Anoxic
Slide - 52 IFAS and MBBR Webcast March 18, 2010
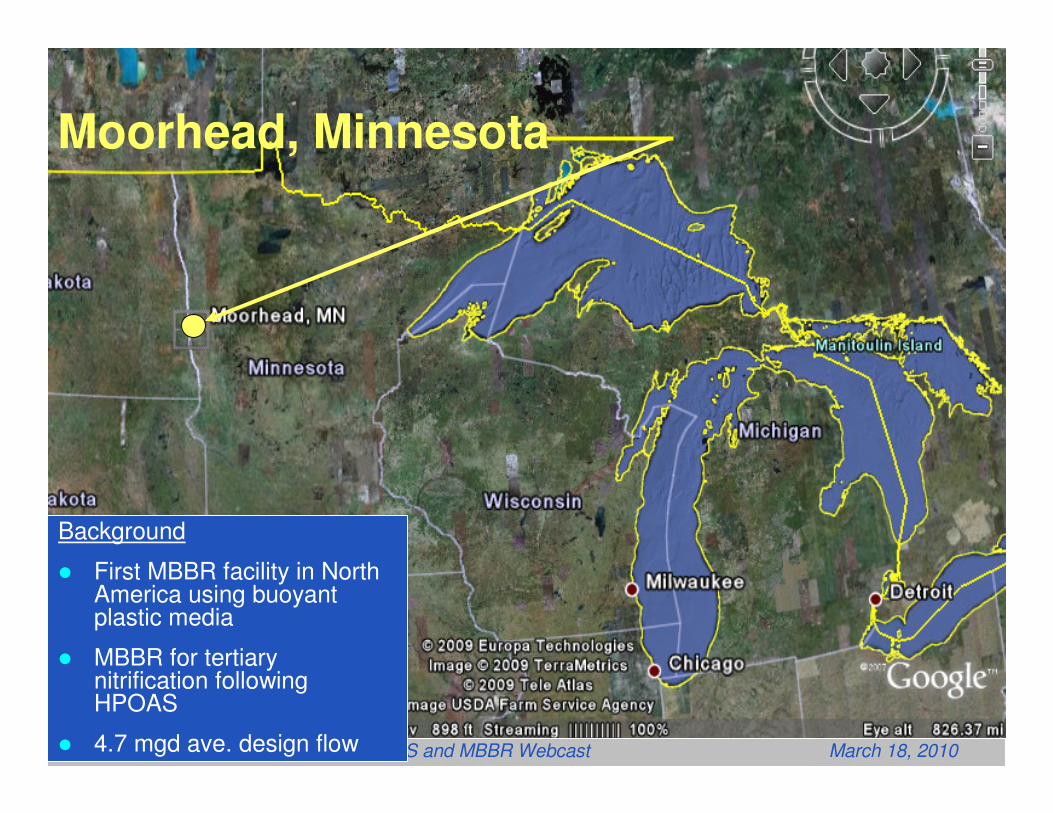
Background
� First MBBR facility in North America using buoyant plastic media
� MBBR for tertiary nitrification following HPOAS
� 4.7 mgd ave. design flow
Moorhead, Minnesota
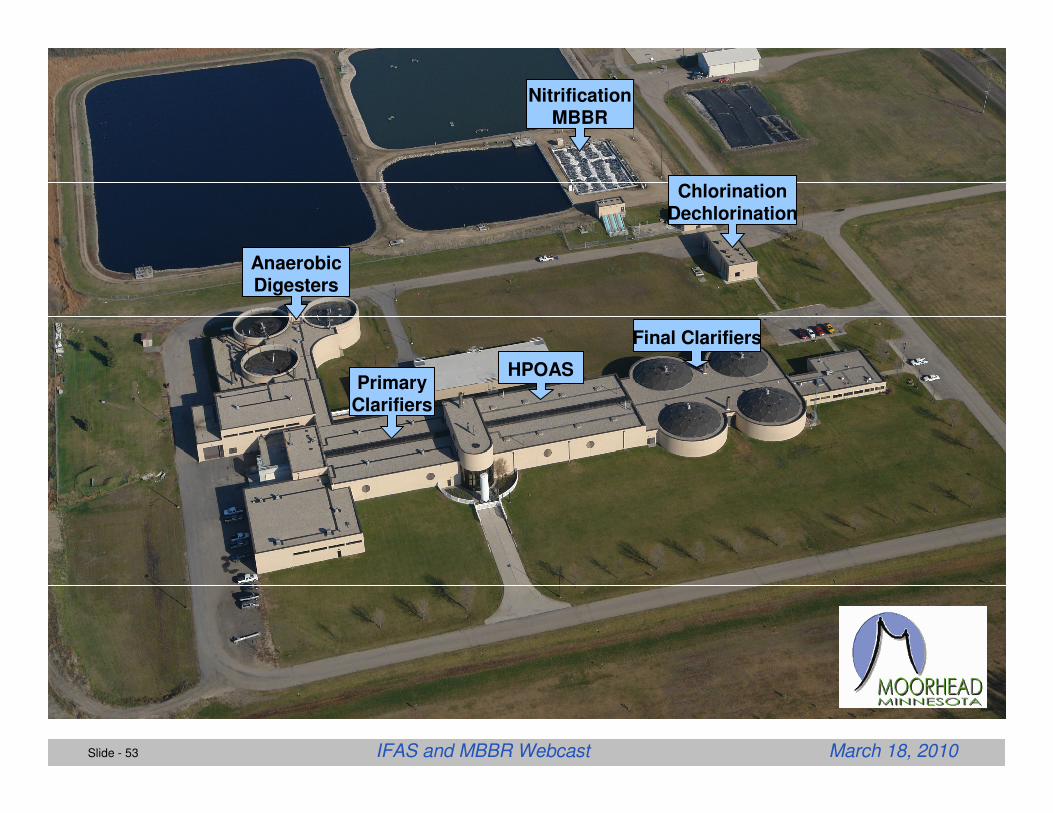
Slide - 53 IFAS and MBBR Webcast March 18, 2010
PrimaryClarifiers
Final Clarifiers
HPOAS
NitrificationMBBR
ChlorinationDechlorination
AnaerobicDigesters
Slide - 54 IFAS and MBBR Webcast March 18, 2010
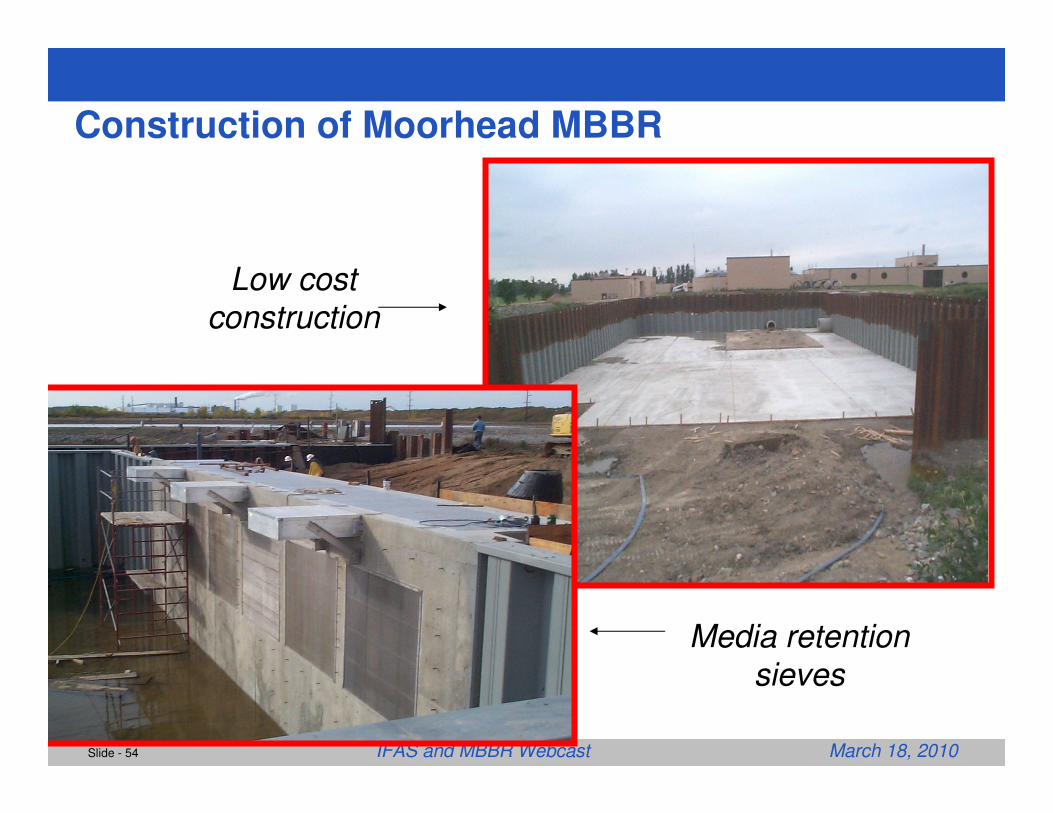
Construction of Moorhead MBBR
Low cost construction
Media retention
sieves
Slide - 55 IFAS and MBBR Webcast March 18, 2010
Headworks (Hydroxyl)
Slide - 56 IFAS and MBBR Webcast March 18, 2010
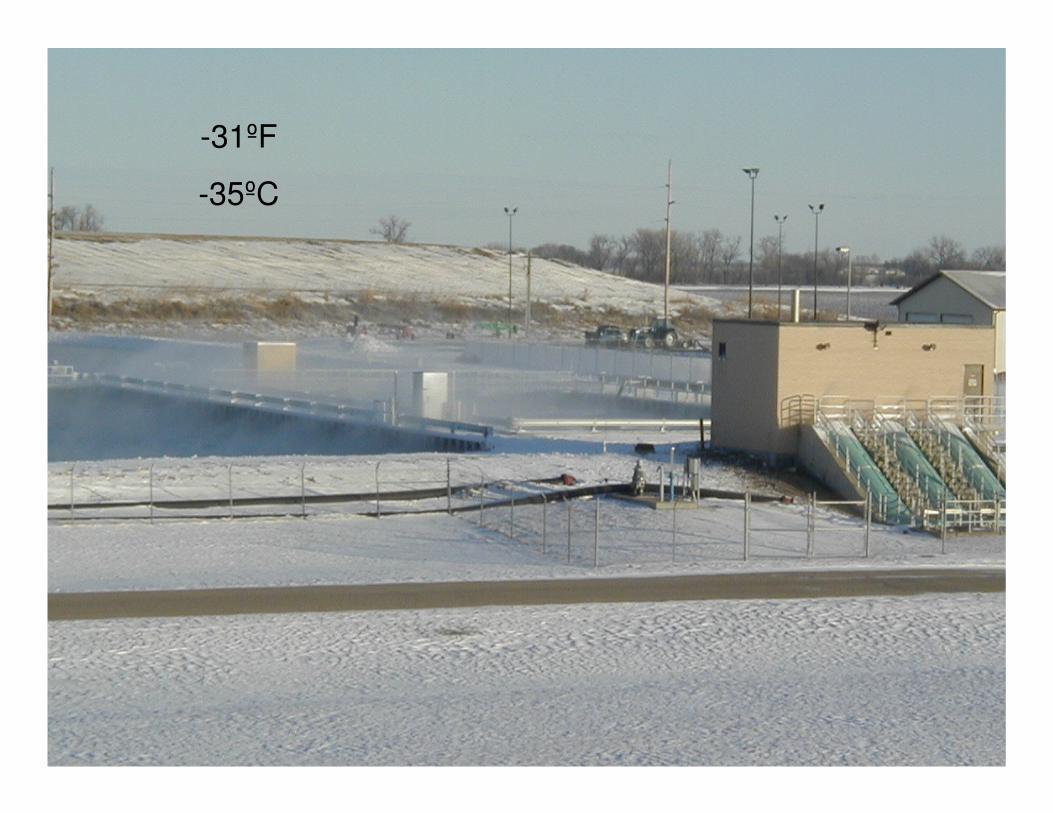
-31ºF
-35ºC
Slide - 57 IFAS and MBBR Webcast March 18, 2010
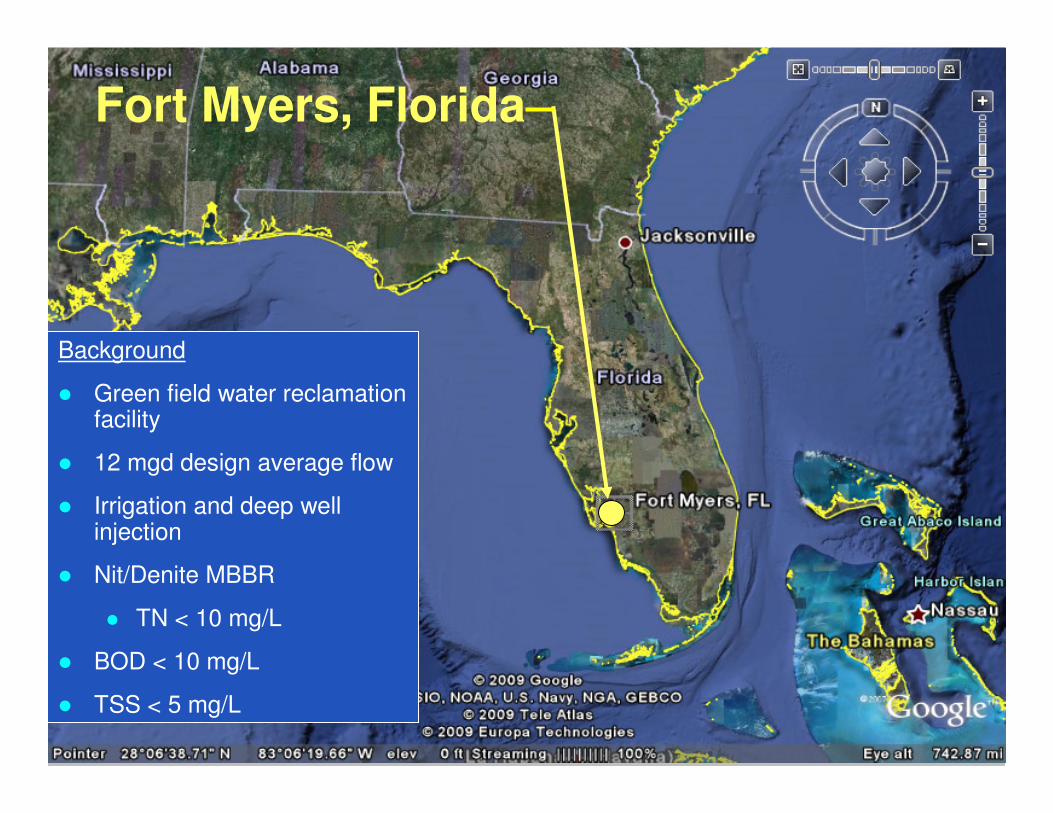
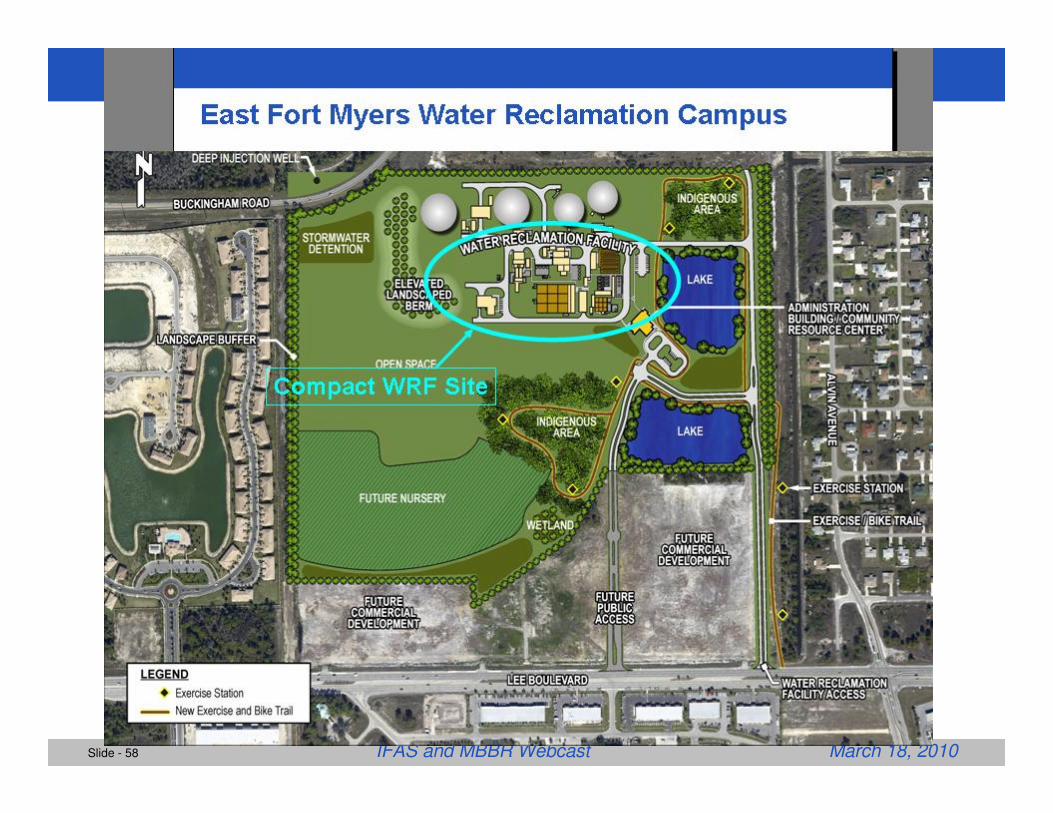
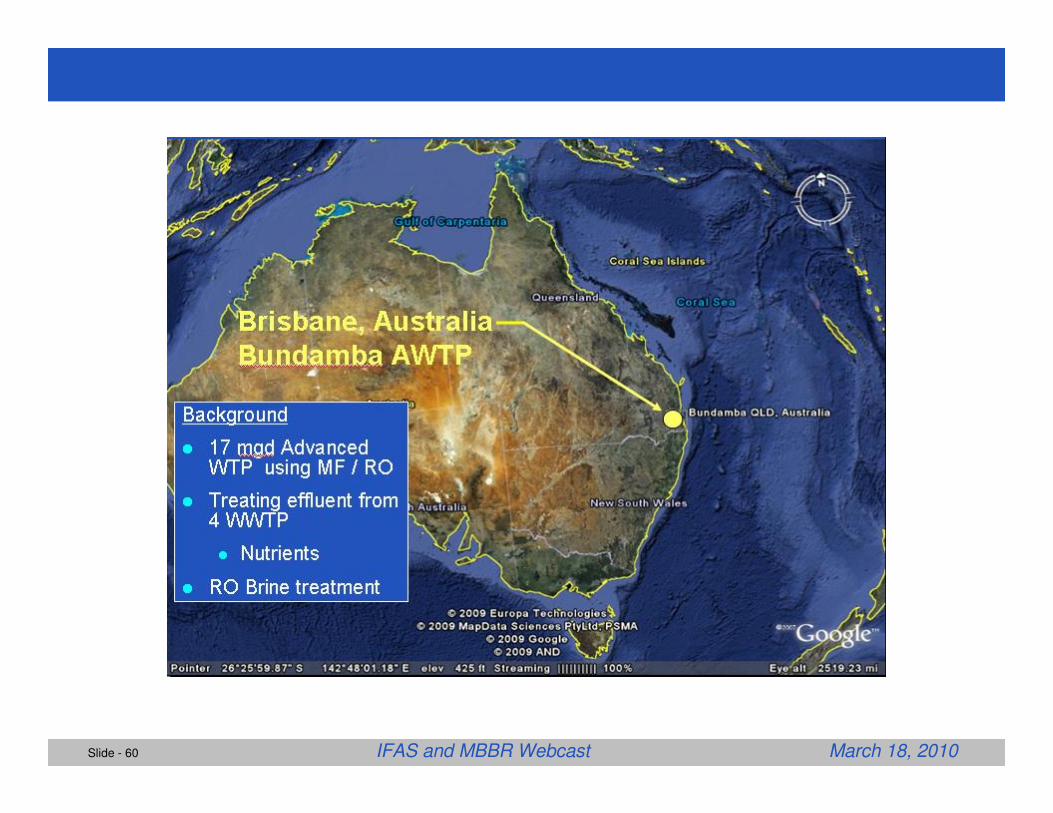
Background
� Green field water reclamation facility
� 12 mgd design average flow
� Irrigation and deep well injection
� Nit/Denite MBBR
� TN < 10 mg/L
� BOD < 10 mg/L
� TSS < 5 mg/L
Fort Myers, Florida
Slide - 58 IFAS and MBBR Webcast March 18, 2010
Slide - 59 IFAS and MBBR Webcast March 18, 2010
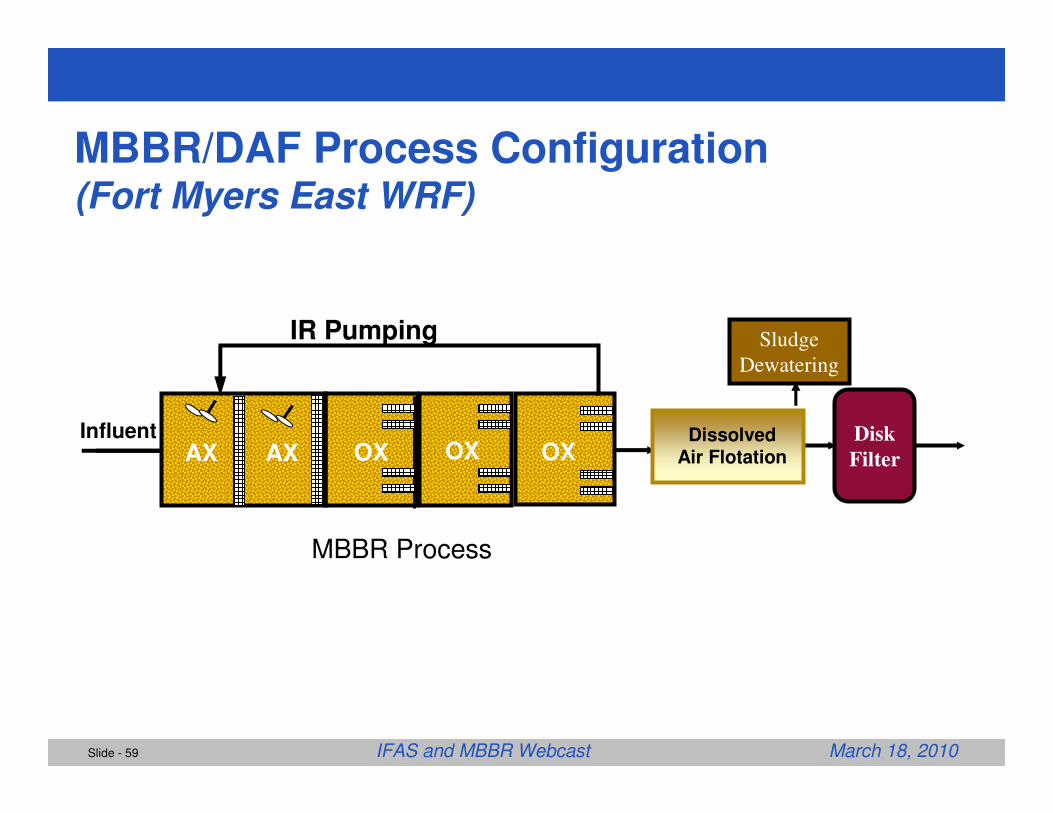
MBBR/DAF Process Configuration(Fort Myers East WRF)
Disk
Filter
Sludge
Dewatering
Dissolved Air Flotation
MBBR Process
OX OXAX AXInfluent
OX
IR Pumping
Slide - 60 IFAS and MBBR Webcast March 18, 2010
Slide - 61 IFAS and MBBR Webcast March 18, 2010
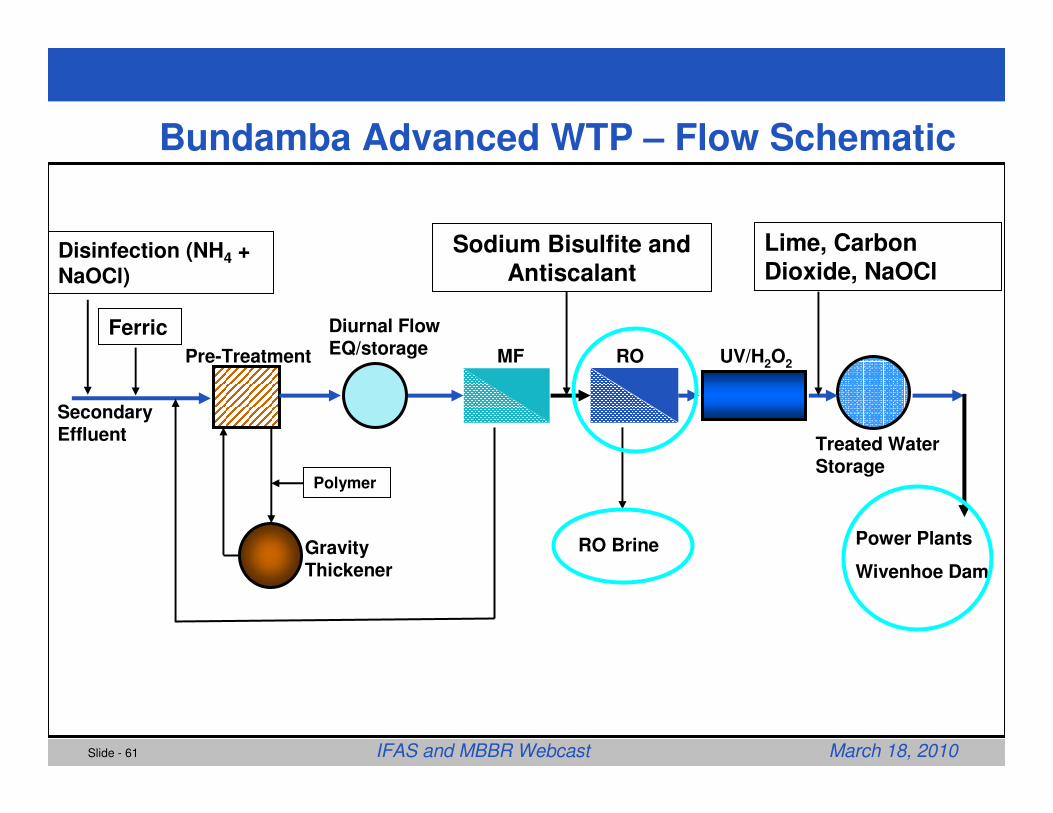
Secondary Effluent
Diurnal Flow EQ/storage MF ROPre-Treatment
Disinfection (NH4 + NaOCl)
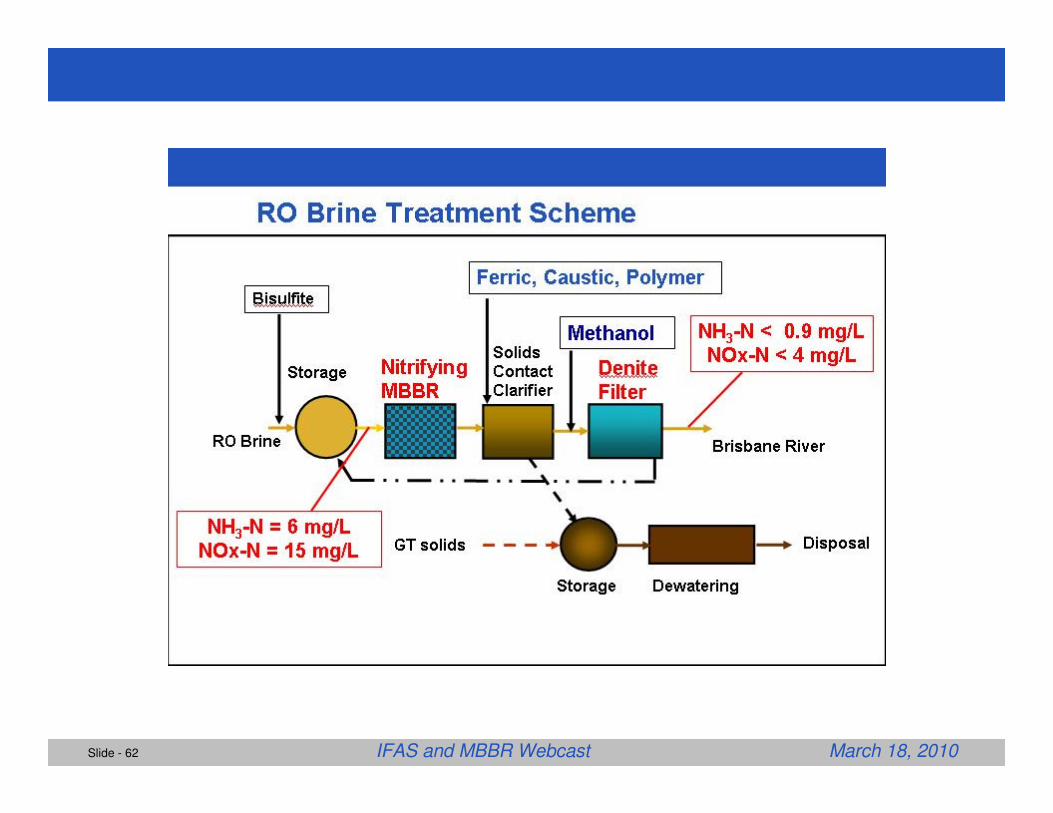
RO Brine
Ferric
Gravity Thickener
Polymer
Sodium Bisulfite and Antiscalant
Lime, Carbon Dioxide, NaOCl
UV/H2O2
Treated Water Storage
Bundamba Advanced WTP – Flow Schematic
Power Plants
Wivenhoe Dam
Slide - 62 IFAS and MBBR Webcast March 18, 2010
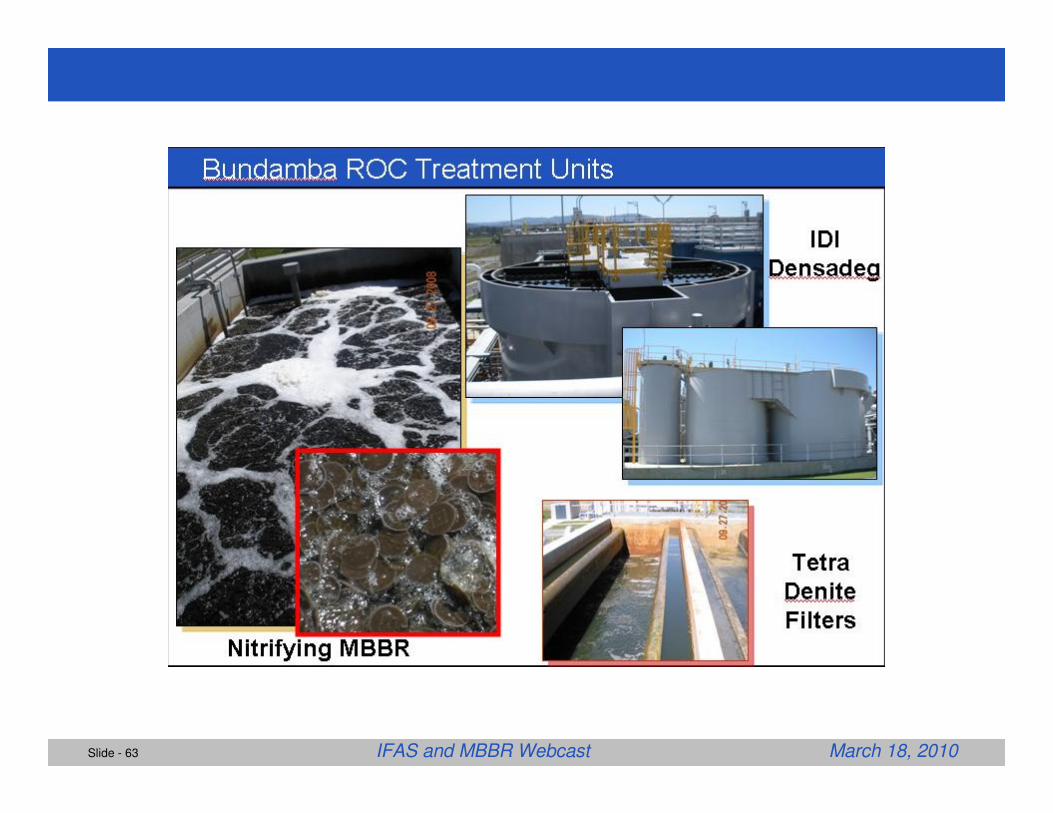
Slide - 63 IFAS and MBBR Webcast March 18, 2010
BUILDING A WORLD OF DIFFERENCE®
Slide - 64 IFAS and MBBR Webcast March 18, 2010
Questions and DiscussionQuestions and Discussion