Professional Assistance for Development Action … Assistance for Development Action (PRADAN)...
48
BASELINE SURVEY REPORT FOR THE PROJECT TITLED (Keonjhar, Mayurbhanj and Rayagada districts of Odisha) Professional Assistance for Development Action (PRADAN) Enhancing the Capability of Women in Integrating Farming System to Improve the Quality of their Lives in the Poverty Regions of Odisha’
Transcript of Professional Assistance for Development Action … Assistance for Development Action (PRADAN)...
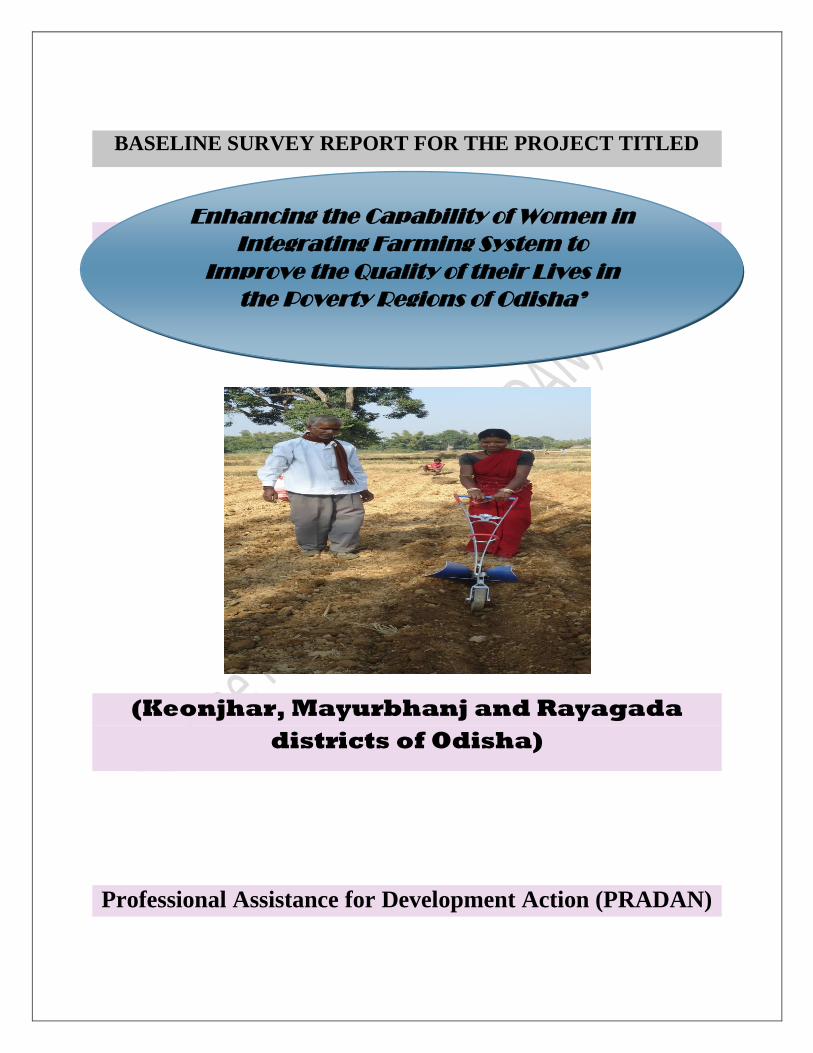
BASELINE SURVEY REPORT FOR THE PROJECT TITLED
(Keonjhar, Mayurbhanj and Rayagada
districts of Odisha)
Professional Assistance for Development Action (PRADAN)
Enhancing the Capability of Women in
Integrating Farming System to
Improve the Quality of their Lives in
the Poverty Regions of Odisha’

CONTENTS
Pages
List of Tables
List of Graphs
Abbreviations
Chapter-I Introduction
1-3
Chapter-II Data Analysis
4-37
Chapter-III Summary and Conclusion
38-39
Annexure
Interview Schedule (Jeevana
Jibika)
List of Tables
Table.1: Socio-Demographic Profile of the respondents
Table 2: Family having Homestead Land Patta
Table 3: House walls and Roofing
Figure 5: Category of Farmers
Table 4: Sanitation Facilities
Table 5: Food Sufficiency (in months)
Table 6: Family Cultivating in Forest Land
Table 7: Family Availed Forest Land Patta
Table 8: Family Benefited from MDM
Table 9: Anganwadi providing food/education for less than 6year child
Table 10: Benefit from Govt. Agriculture Programme
Table 11: Loan Particulars
Table.12: Main Problem of the family
Table 13: Land Details (in acres)
Table 14 : Total Income from agriculture
Table 15 Women farmer’s Participation in Gram Sabha
Table 16: Women farmer’s Participation in other institutional meeting
Table 17 Socio-Demographic Profile
Table 18: Economic Status
Table 19: Primary Occupation of Family
Table 20: Family Member Getting Pension
Table 21: If Family comes under any Insurance
Table 22: House walls and Roofing
Table 23: Housing Scheme Facility from Government
Table 24: Collection of Firewood
Table 25: Women’s Participation in Gram Sabha
Table 26: Participation in Other Institutional Meetings
Table 27: Family benefited from MDM
Table 28: Anganwadi providing food/education to children less than 6 yrs
Table 29: Benefit from Govt. Agriculture Programme
Table 30: Loan Particulars
Table 31: Sanitation Facilities
Table 32: Food Sufficiency (in months)
Table 33: Family Cultivating in Forest Land
Table 34: Family Applied for Patta
Table 35: Family Avaling Patta
Table 36 : Land Details
Table 37: Total Income from agriculture
Table 38: Socio-Demographic Profile
Table 39: Home Stead Patta
Table 40: Family Member Getting Pension
Table 41: If Family comes under any Insurance
Table 42: House walls and Roofing
Table 43: Housing Scheme Facility from Government
Table 44: Sources of Drinking Water
Table 45: Sanitation Facilities
Table 46: Women’s Participation in Gram Sabha
Table 47: Source of Firewood Collection
Table 48: Family Cultivating in forest land
Table 49: Family applied for Forest Land Patta
Table 50: Family availed Forest Land Patta
Table 51 Family getting benefit from Horticulture
Table 52: Family getting benefit from MDM
Table 53: Anganwadi providing food/education for less than 6 year old
Table 54: Loan Availed
Table 55: Loan Objective
Table 56: Jashipur Land Details
Table 57: Karanjia Land Details
List of Graphs
Figure 1: Economic Status of the respondents
Figure 2: Primary Occupation of Family
Figure 3: If Family comes under any Insurance
Figure 4: Housing Scheme Facility from Government
Figure 5: Category of Farmers
Figure 6: Sources of Drinking Water
Figure 7: Family Applied for Forest Land Patta
Figure 8: Family getting Benefit from Horticulture Dept
Figure 9: Loan Objective
Figure 10: Source of Loan
Figure 11: Home Stead Patta
Figure 12: Category of Farmers
Figure 13: Benefit from Horticulture
Figure-14 Loan Objective
Figure 15: Main Problem of Family
Figure 16: Source of Drinking water
Figure 17 : Economic Status of Family
Figure Table 18: Primary Occupation of Family
Figure 19 : Category of Farmers
Figure 20:Government benefit from Agriculture Programme
Figure 21: Food Sufficiency (in months)
Figure 22: Main problems of family
Figure 23: Income from Agriculture (in %)

Abbreviations
PRADAN: Professional Assistance for Development Action
APL- Above Poverty Line
BPL- Below Poverty Line
BKKY- Biju Krushak Kalyan Yojana
CRP- Community resource persons
IAY- Indira Awas Yojana
ICDS- Integrated Child Development Scheme
LIC- Life Insurance Corporation
HH- Household
MDM – Mid Day Meal
MKSP- Mahila Kisan Sashaktikaran Pariyojana
NRLM- National Rural Health Mission
OBC- Other Backward Caste
PLI- Postal Life Insurance
RSBY- Rashtriya Swasthya Bima Yojana
RSVY- Rashtriya Sam Vikas Yojana
SC- Schedule Caste
SHG- Self Help Group
ST- Schedule Tribe
1
Chapter I
Introduction
1.1. Background
PRADAN, as an organization, has strong presence in the undulating and hilly regio1ns across
central and eastern India. It has established its potential in promoting rural livelihoods in both
farm and non-farm sectors in India. With a long track record of innovations to develop rain-fed
farming in undulating and hilly regions, PRADAN has been at the forefront in advocating a
livelihoods focus in government policies and programs to develop land and water resources. It
pioneered the self-help group (SHG) model to organize poor women to access mainstream
financial services, has developed robust prototypes of rural enterprises suitable for poor
households in farm and non-farm sectors and successfully linked poor people to urban markets.
It primarily focused on:
Building and nurturing SHG based women’s groups and supporting associations like
clusters, federations.
Improving productivity potential of poor people’s farmlands based livelihoods by
developing land and water resources and improved production practices by
adoption of sustainable farming practices,
Facilitating market linkages and production support services,
Developing a pool of Community resource persons(CRP) for providing require services
in the community
Convergence with mainstream Institutions and other Government Programmes
In a step further to better the lives of the poor women in the poorest and remotest tribal
districts of Odisha, PRADAN took up the project entitled ‘Enhancing the Capability of
Women in Integrating Farming System to Improve the Quality of their Lives in the Poverty
Regions of Odisha’ conducted in the districts of Rayagada, Mayurbhanj and Keonjhar.

2
The main focus of the project was
large scale capacity building of
SHG members to facilitate
adoption of improved and
sustainable technologies and
practices to attain rapid growth in
farm and farm allied sectors
taking an INRM perspective and
enabling them to access markets
to sustain the economic gains.
The project aimed to assist 6000 rural women whose family’s primary occupation is farm-based.
Its main focus was to enhance the skills of women in sustainable agriculture, improve access to
input and output market and increase income from agriculture in the hands of women. The
project also aimed at building the confidence of women to use their resources meaningfully by
mobilizing support from the relevant institutions around them.
1.2 Research Methodology
About the Base Line Survey: An Introduction
The Base Line Survey was conducted in 4 blocks
(Rayagada-1, Mayurbhanj-2 and Keonjhar-1) of the
sample districts. The survey was an endeavor to analyze
the situation prior to an intervention, against which
progress can be assessed or comparisons made during
the span of the project. The project was conducted on
1050 households and about three-fourths of them were
tribal people and all of them below Rs100/day house
hold expenditure. The project was implemented through
existing women’s SHGs and their associative tiers.
It was assumed that by the end of the project period
6000 members of women SHGs use their household resources in improving their food sufficiency
and cash inflows, 60 % of these families would achieve year-long food sufficiency and cash
surplus of Rs. 15,000 per annum at the end of the project period i.e. 2012-15.
The following are the objectives of the base line study:
To capture the present demographic and socio-economic profile of the project area
To assess the existing livelihood pattern and identify various sustainable agricultural
practices in the project area
To figure out the coverage of Mahila Kissans under various social and economic security
schemes of the Government
3
To analyze the prevalence of other social issues and forms of gender based discrimination
that affects the decision making and empowerment of women in their community.
Methodology:
The study purposely selected the districts i.e. Rayagada, Maurbhanj and Keonjhar. A total
number of 1050 households were selected on a random basis. A booklet named jeevan jeevika
was framed looking at the NRLM circulated format. A pool of para-professionals was trained on
the details of conducting the interview s and the process of filling up the format. Latter on they
trained selective good women leaders who filled the interview schedule based on survey in these
three districts and tried to look into the field situation in the project areas. In-depth interviews
with women SHG members were carried out to identify the important parameters that really
shape the life and livelihood of the people. The entire survey work was carried out by the
selective women leaders and CRPs who were supervised and guided by the para-professionals
and PRADAN staffs. There has been multi-phase validation and cross validation of data.
The report has been divided into three chapters. The first chapter provides a brief background of
the project and PRADAN’s contribution in the study area. The second chapter includes the
overall outline of the study comprising of the objectives and the research methodology that has
been followed. The third and final chapter summarizes the findings.

4
Chapter II
Data Analysis
Kolnara Block, Rayagada
Rayagada is a mineral-
rich district in the southern
part of the state of Odisha
in India. The
city Rayagada is its
headquarters. The
population of this district
consists mainly of tribals.
The Kondhas or Kondh
form the majority of
population followed by
Souras. The District
occupies a total area of
7,584.7 km2. Rayagada is
divided into eleven blocks. The
district generates income mainly through agriculture based activities. Paddy, wheat, ragi, green
gram, black gram, groundnut, sweet potato and maize are the major crops grown in the area.
According to the 2011 census Rayagada district has a population of 961,959; This gives it a
This chapter throws light on the various findings of the field study that was collected
primarily from the respondents. The chapter has three subsections i.e. Rayagada, Keonjhar
and Mayurbhanj. It comprises of the graphical and tabular explanation of data.

5
23.4
51.1
17.0
8.5
Antodaya
BPL
APL
No
Economic Status
ranking of 454th in India (out of a total of 640).The district has a population density of 136
inhabitants per square kilometre (350/sq mi). Its population growth rate over the decade 2001-
2011 was 15.74%.Rayagada has a sex ratio of 1048 females for every 1000 males, and a literacy
rate of 50.88%. The district has a predominant tribal population of 57.52%. All the 11 blocks of
the district have been covered under tribal sub-plan with three micro projects in operation for the
pre-literate indigenous tribal communities. The topography of Rayagada gives a prefect platform
for the tribals in sustaining their ethno-cultural identity in the district. Forest area covers an extent
of 4785.36 km2 out of which 777.27 km² is reserved forest. The district has been the homeland of
various tribal communities with their sub-tribes, who are found in different levels of development
depending upon their assimilation with the mainstream or modern communities. In the ethno-
cultural map of Odisha, two tribes stand out quite prominently for their education backwardness
and continuing ethnic and cultural identity, the Kondhas and the Souras
The following is the analysis of the MKSP project area in Kolnara block of Rayagada district.
Table.1. Socio-Demographic Profile of the respondents
According to the above table, it
could be deduced that majority
(98.9) of the respondents in
Kolnara block belong to ST
community while only 1 farmer belonged to the OBC community. No SC farmer was found in
the sample of MKSP project area in the block.
Figure 1: Economic Status of the respondents
The above table indicates that
most of the respondents
(51.1%) in the MKSP area
belong to BPL families,
followed by Antodaya card
holders (23.4%), and APL
families (17%). It was also
Social category Numbers Percentage
ST 93 98.9
OBC 1 1.1
Total 94 100.0

6
56.4
9.6
28.7
2.1
3.2
0.0 10.0 20.0 30.0 40.0 50.0 60.0
Agriculture
Agr Labourer
Wage
Forest Produce Collection
Livestock
Primary Occupation of Family
67%
33%
Family Under Insurance
Yes
No
found that nearly 8.5% of the respondents didn’t have any card based facility from the
government (mostly belong to poor category)
Figure 2: Primary Occupation of Family
Agriculture is the primary
occupation of the family as
56.4% of them are engaged in
it. After agriculture, nearly
28.7% of the families are
found to be engaged in wage
related livelihood activities and
are followed by 9.65 families
who work as agriculture
labourers in other’s farm land. Though majority of the respondents belong to the tribal
communities, but only 2.1% are engaged in collecting forest produce and only 3.2% of the
respondents earn their living from livestock.
Table 2: Family having
Homestead Land Patta
Possessing Homestead Land
Patta is essential as it ensures
the person’s basic right on
the land that he/she is residing or cultivating on, and as reflected in the above table there are more
than 50% (51.1%) families who are not having a homestead patta.
Figure 3: If Family comes under any Insurance
Insurance plays a significant role in
cushioning in case of any mishap or economic
loss, and the data indicated that while 67% of
the respondents have some or other insurance
cover, the rest 33% don’t have the same. The
Family Patta Numbers Percentage
Yes 46 48.9
No 48 51.1
Total 94 100.0
7
23.4 0.0
76.6
Housing Scheme Facility from Govt
IAY
Mo kudia
No
1.1
9.6
36.2
48.9
1.1
3.2
Big
medium
Small
very Small
Marginal
Landless
Category of Farmers
insurance schemes include RSVYy, BKKY etc.
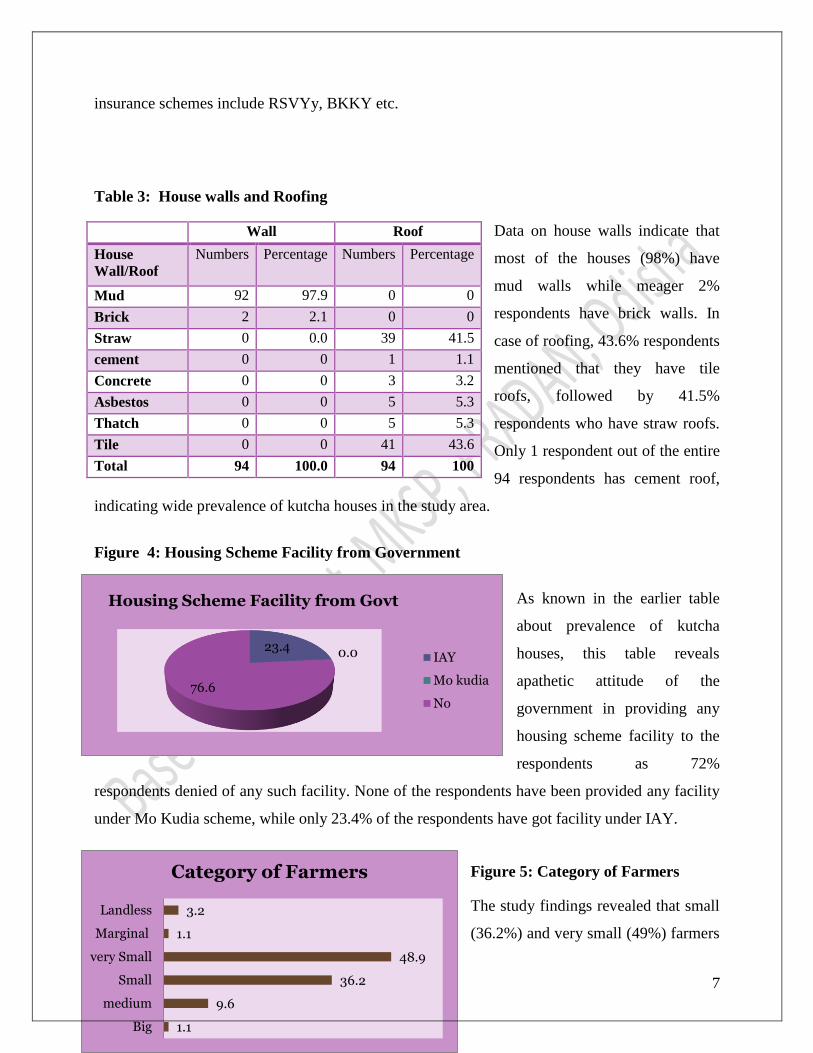
Table 3: House walls and Roofing
Data on house walls indicate that
most of the houses (98%) have
mud walls while meager 2%
respondents have brick walls. In
case of roofing, 43.6% respondents
mentioned that they have tile
roofs, followed by 41.5%
respondents who have straw roofs.
Only 1 respondent out of the entire
94 respondents has cement roof,
indicating wide prevalence of kutcha houses in the study area.
Figure 4: Housing Scheme Facility from Government
As known in the earlier table
about prevalence of kutcha
houses, this table reveals
apathetic attitude of the
government in providing any
housing scheme facility to the
respondents as 72%
respondents denied of any such facility. None of the respondents have been provided any facility
under Mo Kudia scheme, while only 23.4% of the respondents have got facility under IAY.
Figure 5: Category of Farmers
The study findings revealed that small
(36.2%) and very small (49%) farmers
Wall Roof
House
Wall/Roof
Numbers Percentage Numbers Percentage
Mud 92 97.9 0 0
Brick 2 2.1 0 0
Straw 0 0.0 39 41.5
cement 0 0 1 1.1
Concrete 0 0 3 3.2
Asbestos 0 0 5 5.3
Thatch 0 0 5 5.3
Tile 0 0 41 43.6
Total 94 100.0 94 100

8
88%
1% 9% 2%
Sources of Drinking Water
Handpump Pond
Spring/Handpump Supply/handpump
form nearly 85% of the total respondents implying that cultivated land is mostly between 1 to 2.5
acres. While there is just 1 big and marginal farmer each, 9.6% are medium and 3.2% landless
farmers. The statistics reveals prevalence of small land holdings that might not provide large
scale production. The study also found that there are women farmers who fell into the landless
category. Many women were cultivating in the encroached lands too.
Figure 6: Sources of Drinking Water
Access to safe and pure drinking
water is a basic human right, and data
indicates that hand pump is the source
of drinking water for 88.3% of the
respondents. While both spring and
hand pump quenches thirst of 8.5% of
respondents, supply water is
accessible to only 2 respondents out
of the total interviewed ones. This
indicates apathetic attitude of the government to provide safe supply water to most of the people
residing in the study area.
Table 4: Sanitation Facilities
Data reveals highly pathetic sanitation situation in the
studied area where nearly 99% of the respondents
defecate in the open while only 1 respondent affirmed of
defecating in a latrine. All these respondents are women
and defecating in the open is a threat to them that includes widespread disease, unhealthy
environment and also sexual harassment (in case they go alone or after sunset).
Table 5: Food Sufficiency (in months)
Data on food sufficiency reveals that 40.4% respondents
have suffiecient food to cater to their families needs from
4 to 7 months, while 33% families have the same for 8 to
12 months. However, nearly 26.6% respondents have
sufficent food only for three months, the rest of the year
Sanitation Numbers Percentage
Latrine 1 1.1
Outside 93 98.9
Total 94 100.0
Food
Sufficiency
(in months)
Numbers Percentage
(0-3) 25 26.6
(4-7) 38 40.4
(8-12) 31 33.0
Total 94 100.0

9
74%
26%
Family Applied for forest land patta
Yes
No
4.3
95.7
Family benfitted from Horticulture Dept
Yes
No
they have to employ other means and toil hard to meet the basic needs of their families.
Table 6: Family Cultivating in Forest Land
As per the table,
75.5% of the
respondents
mentioned that
their families are cultivating in the forest land while 24.5% denied in doing so. The latter includes
landless farmers who have to work in other’s land for survival.
Figure 7: Family Applied for Forest Land Patta
As the families are
cultivating in the forest
land, it is quite obvious
that nearly 74% of them
have applied for a forest
land patta that would
ensure in uninterrupted
cultivation as they would have ownership on that particular patch of land. Rest 26% families
denied applying for such patta.
Table 7: Family Availed Forest Land Patta
However, as per the table,
only 48% of the respondents
affirmed of having availed
forest land patta while the
rest 52% denied of getting the patta from the government. This indicates that availing a patta
from the government offices which has various channels is actually a herculean and delayed
procedure.
Figure 8: Family getting Benefit from Horticulture Dept
The table reveals an apathetic attitude of
the government‘s Horticulture department
in providing benefit to the respondents.
Family Cultivating in Forest
Land
Numbers Percentage
Yes 71 75.5
No 23 24.5
Total 94 100.0
Family Availed Forest
Land Patta
Numbers Percentage
Yes 45 47.9
No 49 52.1
Total 94 100.0
10
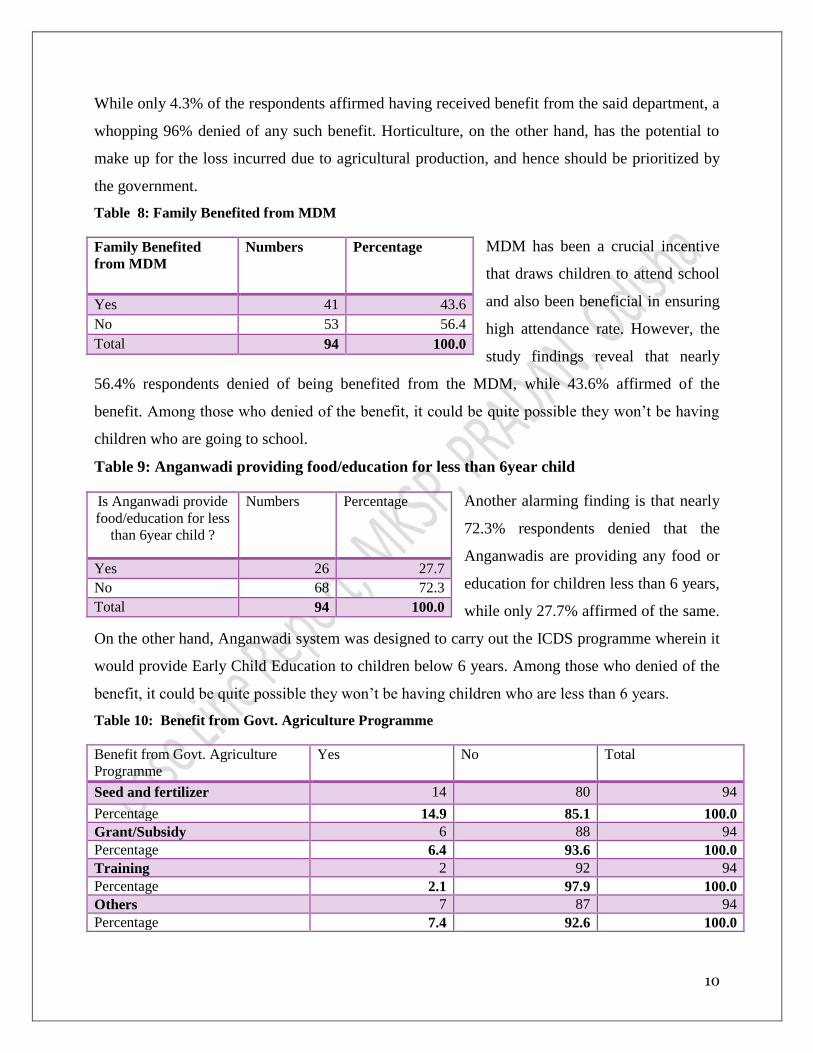
While only 4.3% of the respondents affirmed having received benefit from the said department, a
whopping 96% denied of any such benefit. Horticulture, on the other hand, has the potential to
make up for the loss incurred due to agricultural production, and hence should be prioritized by
the government.
Table 8: Family Benefited from MDM
MDM has been a crucial incentive
that draws children to attend school
and also been beneficial in ensuring
high attendance rate. However, the
study findings reveal that nearly
56.4% respondents denied of being benefited from the MDM, while 43.6% affirmed of the
benefit. Among those who denied of the benefit, it could be quite possible they won’t be having
children who are going to school.
Table 9: Anganwadi providing food/education for less than 6year child
Another alarming finding is that nearly
72.3% respondents denied that the
Anganwadis are providing any food or
education for children less than 6 years,
while only 27.7% affirmed of the same.
On the other hand, Anganwadi system was designed to carry out the ICDS programme wherein it
would provide Early Child Education to children below 6 years. Among those who denied of the
benefit, it could be quite possible they won’t be having children who are less than 6 years.
Table 10: Benefit from Govt. Agriculture Programme
Family Benefited
from MDM
Numbers Percentage
Yes 41 43.6
No 53 56.4
Total 94 100.0
Is Anganwadi provide
food/education for less
than 6year child ?
Numbers Percentage
Yes 26 27.7
No 68 72.3
Total 94 100.0
Benefit from Govt. Agriculture
Programme
Yes No Total
Seed and fertilizer 14 80 94
Percentage 14.9 85.1 100.0
Grant/Subsidy 6 88 94
Percentage 6.4 93.6 100.0
Training 2 92 94
Percentage 2.1 97.9 100.0
Others 7 87 94
Percentage 7.4 92.6 100.0
11
36.5
1.9
15.4
5.8
21.2
11.5
7.7
Agriculture
Education Expenses
Medical Expenses
Family Needs
House Construction
Purchasing Food
Marriage
The table reveals some startling incidences those points at the government’s lethargic attitude
towards providing any kind of benefit to the farmers in the MKSP study area. Training
component that plays an essential role in updating and upgrading the skills of the farmers to
adopt modern technologies has been provided to only 2% of the farmers. Similarly, grant/subsidy
that could help the farmer financially has been provided to only 6.4% of the investigated farmers.
Seeds and fertilizers have been provided to only 14% of the farmers while 7.4% of the farmers
have gained in the ‘others’ category.
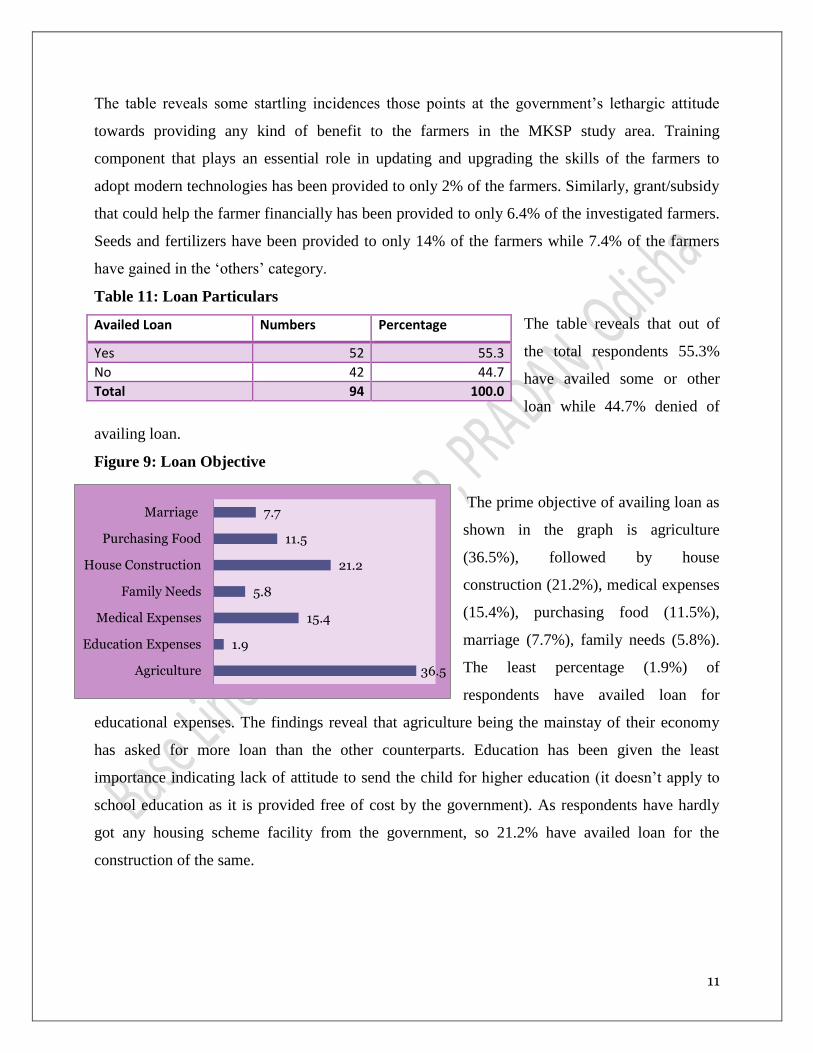
Table 11: Loan Particulars
The table reveals that out of
the total respondents 55.3%
have availed some or other
loan while 44.7% denied of
availing loan.
Figure 9: Loan Objective
The prime objective of availing loan as
shown in the graph is agriculture
(36.5%), followed by house
construction (21.2%), medical expenses
(15.4%), purchasing food (11.5%),
marriage (7.7%), family needs (5.8%).
The least percentage (1.9%) of
respondents have availed loan for
educational expenses. The findings reveal that agriculture being the mainstay of their economy
has asked for more loan than the other counterparts. Education has been given the least
importance indicating lack of attitude to send the child for higher education (it doesn’t apply to
school education as it is provided free of cost by the government). As respondents have hardly
got any housing scheme facility from the government, so 21.2% have availed loan for the
construction of the same.
Availed Loan Numbers Percentage
Yes 52 55.3
No 42 44.7
Total 94 100.0
12
9%10%
71%
10%
Source of Loan
Bank
Relative
SHG
Village Trader
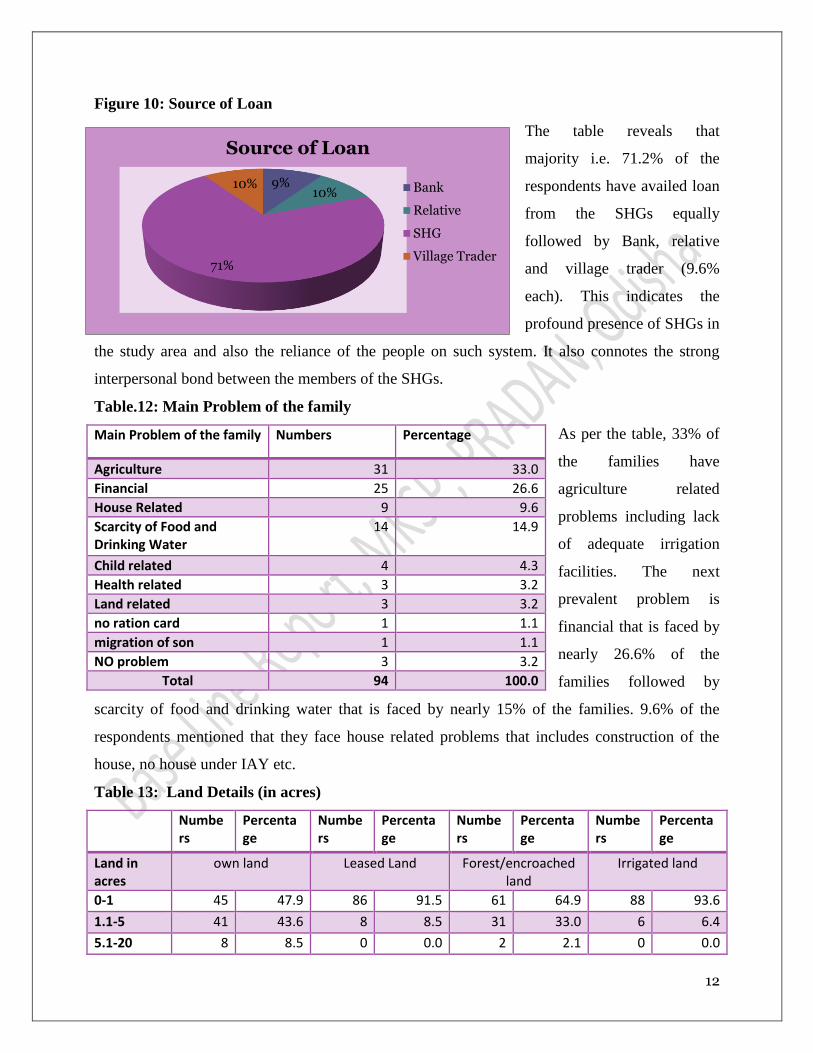
Figure 10: Source of Loan
The table reveals that
majority i.e. 71.2% of the
respondents have availed loan
from the SHGs equally
followed by Bank, relative
and village trader (9.6%
each). This indicates the
profound presence of SHGs in
the study area and also the reliance of the people on such system. It also connotes the strong
interpersonal bond between the members of the SHGs.
Table.12: Main Problem of the family
As per the table, 33% of
the families have
agriculture related
problems including lack
of adequate irrigation
facilities. The next
prevalent problem is
financial that is faced by
nearly 26.6% of the
families followed by
scarcity of food and drinking water that is faced by nearly 15% of the families. 9.6% of the
respondents mentioned that they face house related problems that includes construction of the
house, no house under IAY etc.
Table 13: Land Details (in acres)
Numbers
Percentage
Numbers
Percentage
Numbers
Percentage
Numbers
Percentage
Land in acres
own land Leased Land Forest/encroached land
Irrigated land
0-1 45 47.9 86 91.5 61 64.9 88 93.6
1.1-5 41 43.6 8 8.5 31 33.0 6 6.4
5.1-20 8 8.5 0 0.0 2 2.1 0 0.0
Main Problem of the family Numbers Percentage
Agriculture 31 33.0
Financial 25 26.6
House Related 9 9.6
Scarcity of Food and Drinking Water
14 14.9
Child related 4 4.3
Health related 3 3.2
Land related 3 3.2
no ration card 1 1.1
migration of son 1 1.1
NO problem 3 3.2
Total 94 100.0

13
Total 94 100.0 94 100.0 94 100.0 94 100.0
The table indicates nearly 48% of the land is between 0-1 acres indicating prevalence of marginal
land holdings. While nearly 43.6% of the land is small ranging from 1.1 to 5 acres, only 8.5% of
the land is in between 5.1 to 20 acres. In case of irrigated land, out of the 93.6% of land holdings
irrigated are the marginal holdings.
Table 14 : Total Income from agriculture
The table on total income from
agriculture indicates that nearly
72.3% of the respondents are
earning between Rs 1000 to Rs
5000 which doesn’t seem to be
adequate to meet the basic
requirements of survival. Therefore, it could be said that nearly 90.4 % HHs have less than
Rs5,000/- income from agriculture, hence, steps should be taken to make agriculture a profit
generating venture.
Table 15 Women farmer’s Participation in Gram Sabha
As per the table, 75.5% of the respondents
affirmed that they participate in Gram
Sabha meetings implying a sort of political
emancipation among these poor women
farmers. On the other hand, 24.5% denied any kind of participation in such meetings.
Table 16: Women farmer’s Participation in other institutional meeting
Though the earlier table
revealed that majority
attend Gram Sabha
meetings, but according to
this table nearly 75.5% of
the respondents denied
Total Income from agriculture (in Rupees)
Numbers Percentage
0-1000 17 18.1
1001-5000 68 72.3
5001 and 10,000 9 9.6
10,000 and above 0 0
Total 94 100.0
Family Participation
in Gram Sabha
Numbers Percentage
Yes 71 75.5
No 23 24.5
Total 94 100.0
Have the family
Participate in other
institutional meeting? (if
yes, mention)
Numbers Percentage
Panchayat Meeting 17 18.08
School Meeting 1 1.1
Others 5 5.3
No 71 75.5
Total 94 100.0
14
that any participation in any other institutional meeting. Barely 18.08% respondents affirmed
that they have attended Panchayat meetings, 1% has attended school meetings, and rest 5.3% has
attended other meetings. Out of many reasons of non-attendance, earning a livelihood may be a
prime reason that must be keeping the women too occupied to attend any such meeting.
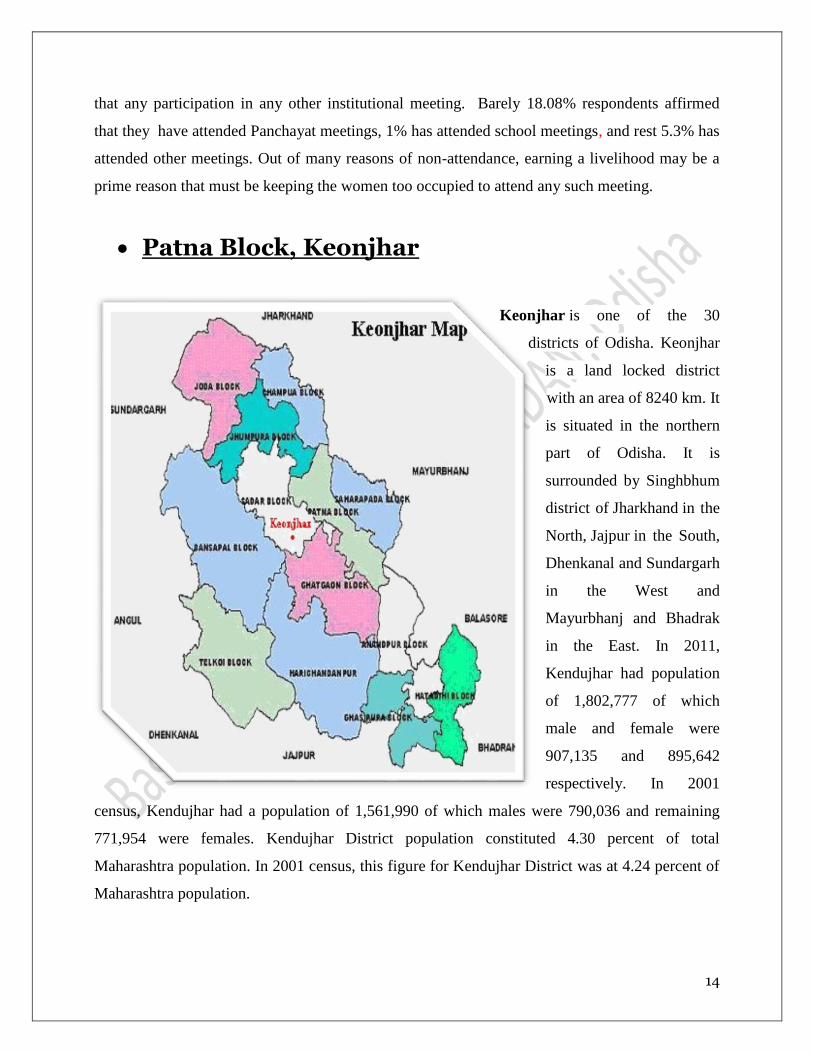
Patna Block, Keonjhar
Keonjhar is one of the 30
districts of Odisha. Keonjhar
is a land locked district
with an area of 8240 km. It
is situated in the northern
part of Odisha. It is
surrounded by Singhbhum
district of Jharkhand in the
North, Jajpur in the South,
Dhenkanal and Sundargarh
in the West and
Mayurbhanj and Bhadrak
in the East. In 2011,
Kendujhar had population
of 1,802,777 of which
male and female were
907,135 and 895,642
respectively. In 2001
census, Kendujhar had a population of 1,561,990 of which males were 790,036 and remaining
771,954 were females. Kendujhar District population constituted 4.30 percent of total
Maharashtra population. In 2001 census, this figure for Kendujhar District was at 4.24 percent of
Maharashtra population.
15
97.8
2.2
Homestead Patta
Yes
No
There was change of 15.42 percent in the population compared to population as per 2001. In the
previous census of India 2001, Kendujhar District recorded increase of 16.83 percent to its
population compared to 1991. The initial provisional data released by census India 2011, shows
that density of Kendujhar district for 2011 is 217 people per sq. km. In 2001, Kendujhar district
density was at 188 people per sq. km. Kendujhar district administers 8,303 square kilometers of
areas. Sex Ratio (Per 1000) 987 977 Child Sex Ratio (0-6 Age) 957 962 Average Literacy 69.00
59.24 Male Literacy 79.22 71.99 Female Literacy 58.70 46.22 Total Child Population (0-6 Age)
253,418 243,655 Male Population (0-6 Age) 129,494 124,210 Female Population (0-6 Age)
123,924 119,445 Literates 1,069,023 780,918 Male Literates 616,025 479,337 Female Literates
452,998 301,581 Child Proportion (0-6 Age) 14.06% 15.60% Boys Proportion (0-6 Age) 14.28%
15.72% Girls Proportion (0-6 Age) 13.84% 15.47%.
Table 17 Socio-Demographic Profile
The socio demographic
profile indicates that there are
73.9% ST respondents,
followed by 21.3% OBC
respondents, 4.8% SC
respondents. No respondent was found in the General category.
Table 18: Economic Status
As per the above table, there
are 86.8% respodnets who
are BPL card holders
followed by 10.7% APL
familes and a meagre 2.5% Antodaya card holders.
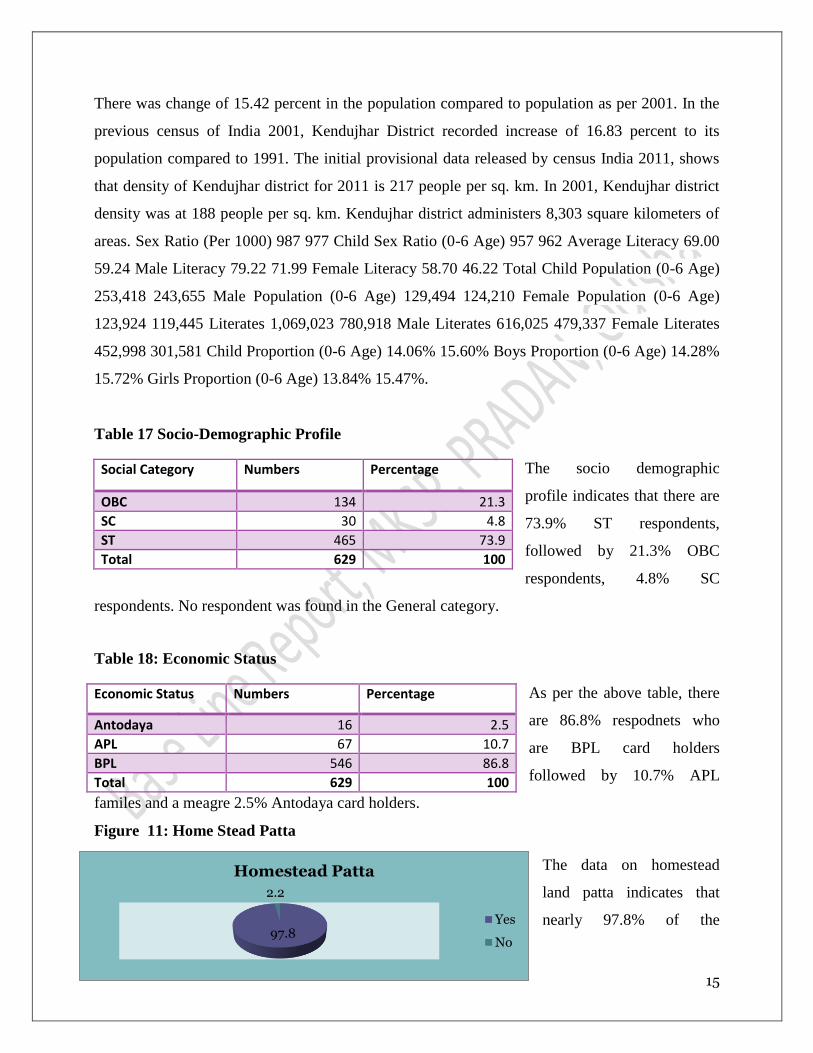
Figure 11: Home Stead Patta
The data on homestead
land patta indicates that
nearly 97.8% of the
Social Category Numbers Percentage
OBC 134 21.3
SC 30 4.8
ST 465 73.9
Total 629 100
Economic Status Numbers Percentage
Antodaya 16 2.5
APL 67 10.7
BPL 546 86.8
Total 629 100
16
respondents have the same while 2.2% of the respondents denied having a patta.
Table 19: Primary Occupation of Family
A whopping 98.1% of the
respondents are engaged in
agriculture and related activities,
while a meager 0.8% are engaged as
wage earners and 1.1. % are
government servants. This indicates a significant proportion of the population depending on
agriculture to earn a living.
Table 20: Family Member Getting Pension
The data indicates that only
30% of the respondents
affirmed that their family
members are getting
pension. Out of those who
are getting pension, the
highest numbers are the old
age people (78) followed by the widows (57), Madhubabu pensioners (16) and disable (10). The
data indicates more number of non-working dependant population for whom the government
pension acts as a support (though not adequate)
Table 21: If Family comes under any Insurance
As per the above table, the percentage of family
members under any insurance scheme is
significantly lower than those who are under
any such scheme. This indicates lack of
financial safety net in case the family suffers
any major loss like crop failure, indebtedness etc. similar situation has also been observed in
Primary Occupation Numbers Percentage
Agriculture 617 98.1
Govt. Job 7 1.1
Wage 5 0.8
Total 629 100.0
Pension Numbers Percentage
Yes 163 25.9
No 466 74.1
Total 629 100
Madhubabu Pension
Old age
Widow Disable Disable widow
Old age widow
16 78 57 10 1 1
Insurance Numbers Percentage
No 453 72.0
Yes 176 28.0
Total 629 100
17
1.6
54.7
43.7
Category of Farmers
Big
Small
Marginal
other study districts too. There are various types of insurance like LIC (133 respondents), Sahara
India (25), RSBY (1), Bank of India (6), PLI (8) etc.
Table 22: House walls and Roofing
The data on house structure in the
MKSP study area of Patna block
indicates that most of the houses are
kutcha houses. As per the data,
nearly 96.3% of the houses have
mud walls and 74% of the houses
have mud roofs, only 1.1% houses
have concrete roofs and 25% have straw roofs. This implies that majority of the respondents are
yet to receive any housing facility from the government. On the other hand, the governments
(both at centre and state) have launched housing schemes, whose actual reach to the beneficiary
still remains a distant dream.
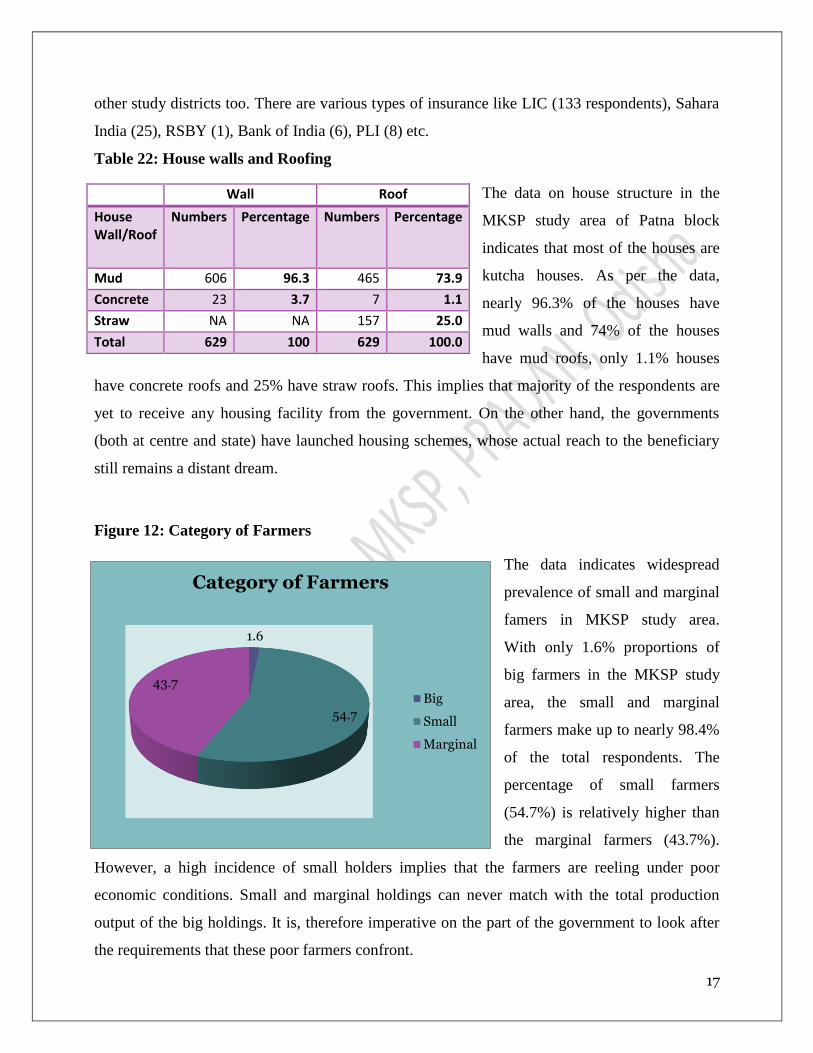
Figure 12: Category of Farmers
The data indicates widespread
prevalence of small and marginal
famers in MKSP study area.
With only 1.6% proportions of
big farmers in the MKSP study
area, the small and marginal
farmers make up to nearly 98.4%
of the total respondents. The
percentage of small farmers
(54.7%) is relatively higher than
the marginal farmers (43.7%).
However, a high incidence of small holders implies that the farmers are reeling under poor
economic conditions. Small and marginal holdings can never match with the total production
output of the big holdings. It is, therefore imperative on the part of the government to look after
the requirements that these poor farmers confront.
Wall Roof
House Wall/Roof
Numbers Percentage Numbers Percentage
Mud 606 96.3 465 73.9
Concrete 23 3.7 7 1.1
Straw NA NA 157 25.0
Total 629 100 629 100.0

18
Table 23: Housing Scheme Facility from Government
As has already been aforementioned that
there is high prevalence of kutcha houses
in MKSP study area, the above table
substantiates the fact. As per the figures,
nearly 91% of the respondents denied of
having received any housing scheme
facility from the government. Out of the rest, 9% and 1% have availed IAY and Mo Kudia
respectively. This shows the apathetic attitude of the government in providing housing facility to
its people and thus, denying basic right to proper shelter.
Table 24: Collection of Firewood
Forest acts as source of lifeline for the tribals who
are directly or indirectly dependant on forest and its
produce. The table indicates that majority (92.2%)
of the respondents are dependent on the forests for
collection of firewood, while 7% are dependent on
forests in other villages. Merely 0.8% f the
respondents are dependent on cow dung for fire. The data not only indicates the people’s
dependency on forests, but also reveals that the villagers are not that aware of the usefulness of
the biogas component. Villagers who venture onto other villages for firewood might be facing
confrontation and inter-village conflicts.
Table 25: Women’s Participation in Gram Sabha
Grassroot democracy needs to be
participatory, so that the voices from the
below can be given a right platform in the
front of the state. The above table shows that
nearly 79.3% of the respondents participate in
the Gram Sabha while the rest 20.7% denied doing so.
Housing Scheme Facility from Govt
Numbers Percentage
IAY 57 9.1
Mo Kudia 1 0.2
No 571 90.8
Total 629 100.0
Collection of Firewood
Numbers Percentage
Forest 580 92.2
Cow Dung 5 0.8
Other Village's Forest
44 7.0
Total 629 100.0
Participation in Gram Sabha
Numbers Percentage
Yes 499 79.3
No 130 20.7
Total 629 100

19
Table 26: Participation in Other Institutional Meetings
Apart from attending Gram Sabha, there are other
institutional meetings like school committee, Mahila
Samiti, VKS etc that take place in the study area. As per
the table, nearly 85.4% of the respondents denied
attending such meetings while only 14.6% affirmed of
attending the same. It could be possible that as women are
engaged grossly into income generating activities, they would be hardly getting enough time to
attend such meetings. Moreover, by not attending such meetings their awareness and
emancipation levels would be hitting low.
Table 27: Family benefited from MDM
The significance of MDM is well known as it
facilitates in attracting children to get
enrolled in the schools and also helps in
checking horrid dropout rates. However, as
per the study findings, 56.4% respondents
denied of any sort of benefit from the MDM scheme, while 43.6% respondents affirmed the
same. It could also be possible that those who denied of any benefit, won’t be having any school
going child.
Table 28: Anganwadi providing food/education to children less than 6 yrs
Another alarming finding is that nearly 71.3%
respondents denied that the Anganwadis are providing
any food or education for children less than 6 years,
while only 28.7% affirmed of the same. On the other
hand, Anganwadi system was designed to carry out the
Participation in Other Institutional Meetings
Numbers Percentage
Yes 92 14.6
No 537 85.4
Total 629 100
Family benefited from MDM
Numbers Percentage
Yes 274 43.6
No 355 56.4
Total 629 100
Anganwadi providing food/education to children less than 6 yrs
Numbers Percentage
Yes 179 28.7
No 445 71.3
Total 624 100
20
12.8
87.2
Yes
No
ICDS programme wherein it would provide Early Child Education to children below 6 years.
Among those who denied of the benefit, it could be quite possible they won’t be having children
who are less than 6 years.
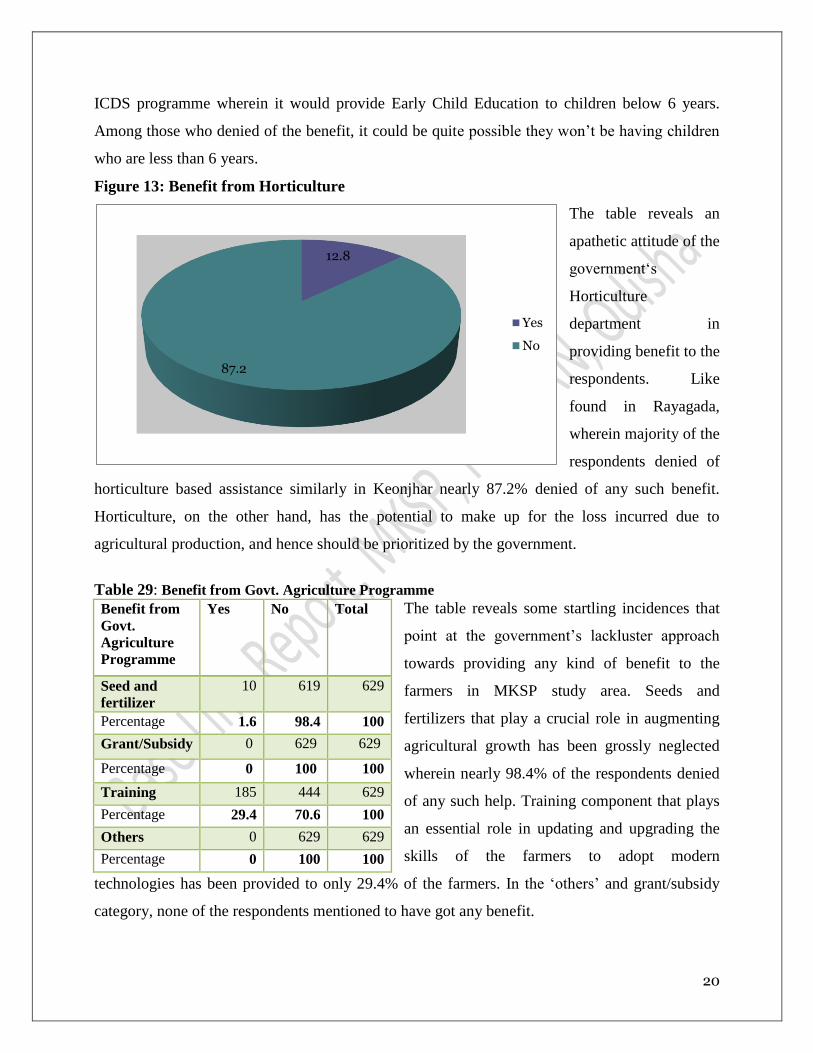
Figure 13: Benefit from Horticulture
The table reveals an
apathetic attitude of the
government‘s
Horticulture
department in
providing benefit to the
respondents. Like
found in Rayagada,
wherein majority of the
respondents denied of
horticulture based assistance similarly in Keonjhar nearly 87.2% denied of any such benefit.
Horticulture, on the other hand, has the potential to make up for the loss incurred due to
agricultural production, and hence should be prioritized by the government.
Table 29: Benefit from Govt. Agriculture Programme
The table reveals some startling incidences that
point at the government’s lackluster approach
towards providing any kind of benefit to the
farmers in MKSP study area. Seeds and
fertilizers that play a crucial role in augmenting
agricultural growth has been grossly neglected
wherein nearly 98.4% of the respondents denied
of any such help. Training component that plays
an essential role in updating and upgrading the
skills of the farmers to adopt modern
technologies has been provided to only 29.4% of the farmers. In the ‘others’ and grant/subsidy
category, none of the respondents mentioned to have got any benefit.
Benefit from
Govt.
Agriculture
Programme
Yes No Total
Seed and
fertilizer
10 619 629
Percentage 1.6 98.4 100
Grant/Subsidy 0 629 629
Percentage 0 100 100
Training 185 444 629
Percentage 29.4 70.6 100
Others 0 629 629
Percentage 0 100 100

21
91.8
2.9
5.0
0.3
Agriculture and Alliedactivities
House Constructionrelated
Family (Financial,Medical, Marriage)
Study
Figure-14 Loan Objective
1.9
48.6
3.0
0.2
16.2
14.3
2.7
2.9
4.0
5.7
0.2
0.2
0.2
Agriculture related
Drinking water
Electricity
Family
Financial
Firewood
Food
Health Related
House Construction
Toilet Facility
Road
Ration card
Instrument
Main problem of Family
Table 30: Loan Particulars
As per the table, the percentage of people who have availed
loan in the previous year is 54.1% as compared to 46%
respondents who denied of availing any loan. As per the
graph, the prime objective of the loan is related to
agriculture and allied activities, which seems obvious owing to prevalence of large proportion of
agriculture dependant
population and the
apathetic attitude of the
government to mitigate
the agriculture related
issues. Loan for house
construction is also low as
most of the respondent is
still staying in kutcha
houses that doesn’t require loan amount to be constructed. As obvious, the loan for higher studies
is almost negligible and only 5% of the respondents have availed loan for family related issues
that includes financial, medical and marriage components.
Figure 15: Main
Problem of Family
As per the graph,
drinking water
remains a major
challenge for 48.6% of
the respondents as
supply water is yet to
reach the MKSP study
area and other sources
of water often get
Availed Loan
Numbers Percentage
Yes 340 54.1
No 289 45.9
Total 629 100
22
2.4
0.6
61.5
35.3
0.2
Mountain
Stream
Tubewell
Well
Well & Pond
Source of Drinking Water
defunct and remain unrepaired. 16.2% of the respondents face financial problems while 14.3% of
the respondents mentioned about firewood problem, the latter problem is quite obvious as many
of the respondents were found to be going to other’s villages for collection of firewood. A mere
1.9% of the respondents are facing agriculture related problems which implies in absentia of any
substantial government aid, they are probably managing with their conventional cultivation
patterns. Though many respondents defecate outside but only 5.7% mentioned about the problem
of toilet facility. Only 4% of the respondents, though majority dwells in Kutcha houses,
mentioned house construction related challenges.
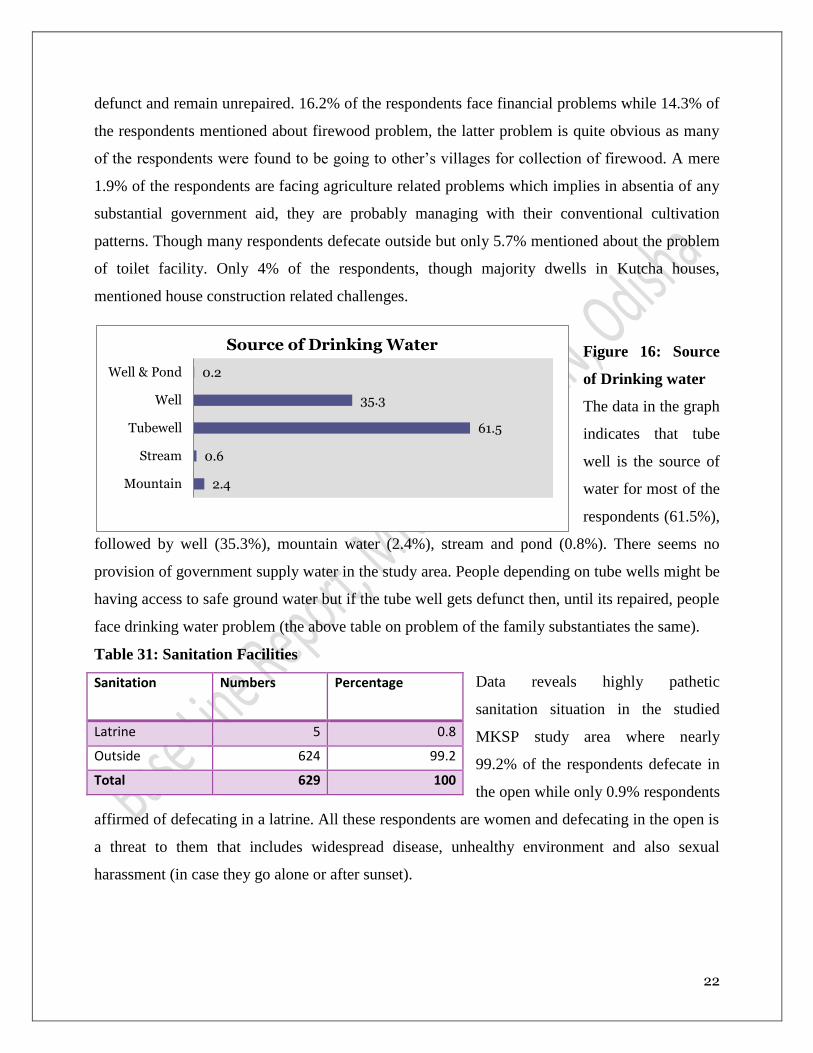
Figure 16: Source
of Drinking water
The data in the graph
indicates that tube
well is the source of
water for most of the
respondents (61.5%),
followed by well (35.3%), mountain water (2.4%), stream and pond (0.8%). There seems no
provision of government supply water in the study area. People depending on tube wells might be
having access to safe ground water but if the tube well gets defunct then, until its repaired, people
face drinking water problem (the above table on problem of the family substantiates the same).
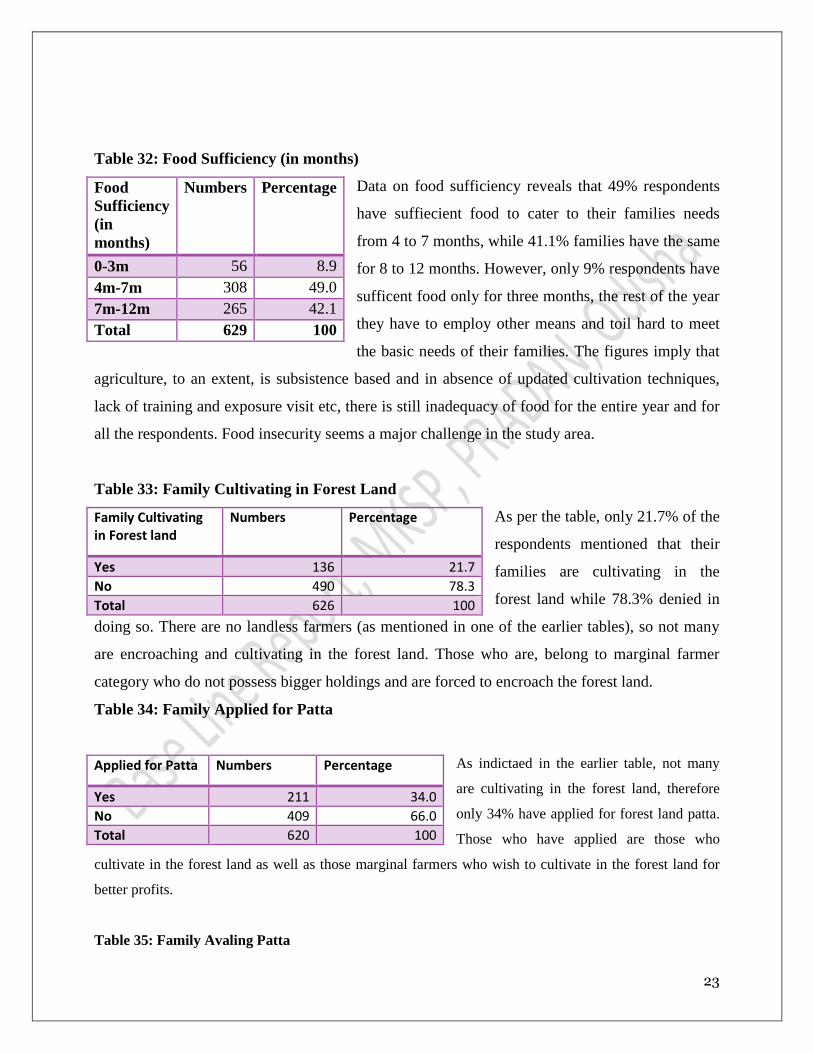
Table 31: Sanitation Facilities
Data reveals highly pathetic
sanitation situation in the studied
MKSP study area where nearly
99.2% of the respondents defecate in
the open while only 0.9% respondents
affirmed of defecating in a latrine. All these respondents are women and defecating in the open is
a threat to them that includes widespread disease, unhealthy environment and also sexual
harassment (in case they go alone or after sunset).
Sanitation Numbers Percentage
Latrine 5 0.8
Outside 624 99.2
Total 629 100
23
Table 32: Food Sufficiency (in months)
Data on food sufficiency reveals that 49% respondents
have suffiecient food to cater to their families needs
from 4 to 7 months, while 41.1% families have the same
for 8 to 12 months. However, only 9% respondents have
sufficent food only for three months, the rest of the year
they have to employ other means and toil hard to meet
the basic needs of their families. The figures imply that
agriculture, to an extent, is subsistence based and in absence of updated cultivation techniques,
lack of training and exposure visit etc, there is still inadequacy of food for the entire year and for
all the respondents. Food insecurity seems a major challenge in the study area.
Table 33: Family Cultivating in Forest Land
As per the table, only 21.7% of the
respondents mentioned that their
families are cultivating in the
forest land while 78.3% denied in
doing so. There are no landless farmers (as mentioned in one of the earlier tables), so not many
are encroaching and cultivating in the forest land. Those who are, belong to marginal farmer
category who do not possess bigger holdings and are forced to encroach the forest land.
Table 34: Family Applied for Patta
As indictaed in the earlier table, not many
are cultivating in the forest land, therefore
only 34% have applied for forest land patta.
Those who have applied are those who
cultivate in the forest land as well as those marginal farmers who wish to cultivate in the forest land for
better profits.
Table 35: Family Avaling Patta
Food
Sufficiency
(in
months)
Numbers Percentage
0-3m 56 8.9
4m-7m 308 49.0
7m-12m 265 42.1
Total 629 100
Family Cultivating in Forest land
Numbers Percentage
Yes 136 21.7
No 490 78.3
Total 626 100
Applied for Patta Numbers Percentage
Yes 211 34.0
No 409 66.0
Total 620 100

24
The percentage of respondents
who have availed the patta is
quite low at 12.4% while 87.6%
have denied availing the same. It
indicates the lethargic attitude of
the government mechanism in providing patta and that too with few of them as applicants. (as
shown in earlier table)
Table 36 : Land Details
The table
provides the
land details of
the respondents
in the
categories of
own, leased,
encroached/forest and irrigated land. As per the data, in the category of own land, 39% are
marginal, 60.3% are small and medium, while a meager 0.8% are big holdings. It indicates the
precedence of small and marginal farmers over the big farmers in the study area. In case of the
leased land, almost 98% of the land is between 0-1 acre indicating marginal holdings being
leased out. Similarly, 99.2% of the total land under the encroached/forest land and 98% of the
land under irrigated category are marginal too.
Table 37: Total Income from agriculture
The table on total income from
agriculture indicates that nearly
33.5% of the respondents are earning
between Rs 1001 to Rs 5000 which
doesn’t seem to be adequate to meet
the basic requirements of survival. In
the income group of Rs 5001- Rs 10,000 there are 37.7% of the respondents. Unlike other study
Family Availed Patta
Numbers Percentage
Yes 77 12.4
No 544 87.6
Total 621 100
Nu
mbe
rs
Percent
age
Numb
ers
Percent
age
Numb
ers
Percent
age
Numb
ers
Percent
age
Land in acres
own land Leased Land Forest/encroached land
Irrigated land
0-1 245 39.0 627 99.7 624 99.2 616 97.9
1.1-5 379 60.3 2 0.3 5 0.8 13 2.1
5 above
5 0.8 0 0.0 0 0.0 0 0.0
Total 629 100.0 629 100.0 629 100.0 629 100.0
Total Income from agriculture
Numbers Percentage
0-1000 30 4.8
1001-5000 211 33.5
5001-10000 237 37.7
10000 above 151 24.0
Total 629 100.0
25
areas, the percentage of respondents in the income group of Rs.10,000 and above is 24% which
implies that there are few respondents who are relatively well off than their counterparts.
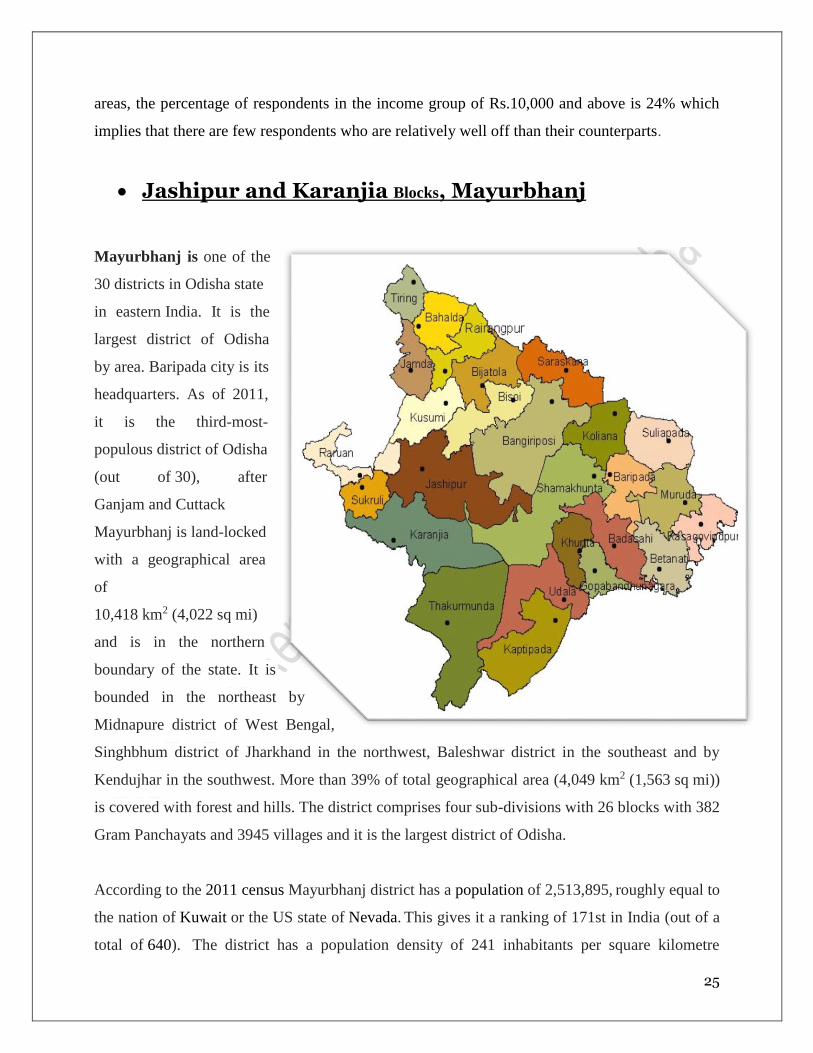
Jashipur and Karanjia Blocks, Mayurbhanj
Mayurbhanj is one of the
30 districts in Odisha state
in eastern India. It is the
largest district of Odisha
by area. Baripada city is its
headquarters. As of 2011,
it is the third-most-
populous district of Odisha
(out of 30), after
Ganjam and Cuttack
Mayurbhanj is land-locked
with a geographical area
of
10,418 km2 (4,022 sq mi)
and is in the northern
boundary of the state. It is
bounded in the northeast by
Midnapure district of West Bengal,
Singhbhum district of Jharkhand in the northwest, Baleshwar district in the southeast and by
Kendujhar in the southwest. More than 39% of total geographical area (4,049 km2 (1,563 sq mi))
is covered with forest and hills. The district comprises four sub-divisions with 26 blocks with 382
Gram Panchayats and 3945 villages and it is the largest district of Odisha.
According to the 2011 census Mayurbhanj district has a population of 2,513,895, roughly equal to
the nation of Kuwait or the US state of Nevada. This gives it a ranking of 171st in India (out of a
total of 640). The district has a population density of 241 inhabitants per square kilometre
26
8.1 6.0
35.5 32.5
56.561.5
Jashipur Karanjia
Antodaya APL BPL
(620/sq mi). Its population growth rate over the decade 2001-2011 was 13.06%.Mayurbhanj has
a sex ratio of 1006 females for every 1000 males and a literacy rate of 63.98%. The economy of
Mayurbhanj District is mostly dependent on agriculture. The agro climatic zone and the favorable
soil type induce the proper growth of agriculture. Paddy is the major cultivated crop, followed by
pulses and oilseeds. While there has been decrease in the coverage of Khariff paddy in high
lands, the area under pulses, oilseeds and other cereals has been showing an increasing trend due
to diversification of cropping patterns.
Table 38: Socio-Demographic Profile1
According to the above table, it could
be connoted that ST population
dominates in both Jashipur and
Karanjia MKSP study area with
80.6% and 79.2% respectively. OBC
population is 6.5% (Jashipur) and
12.5% (Karanjia) in both the MKSP
study area ahead of SC and General population. However, General population is relatively higher
at 11.3% in Jashipur as against its SC population (1.6%). However, in Karanjia the SC population
(7.9%) dominates over its General population (meager 0.4%).
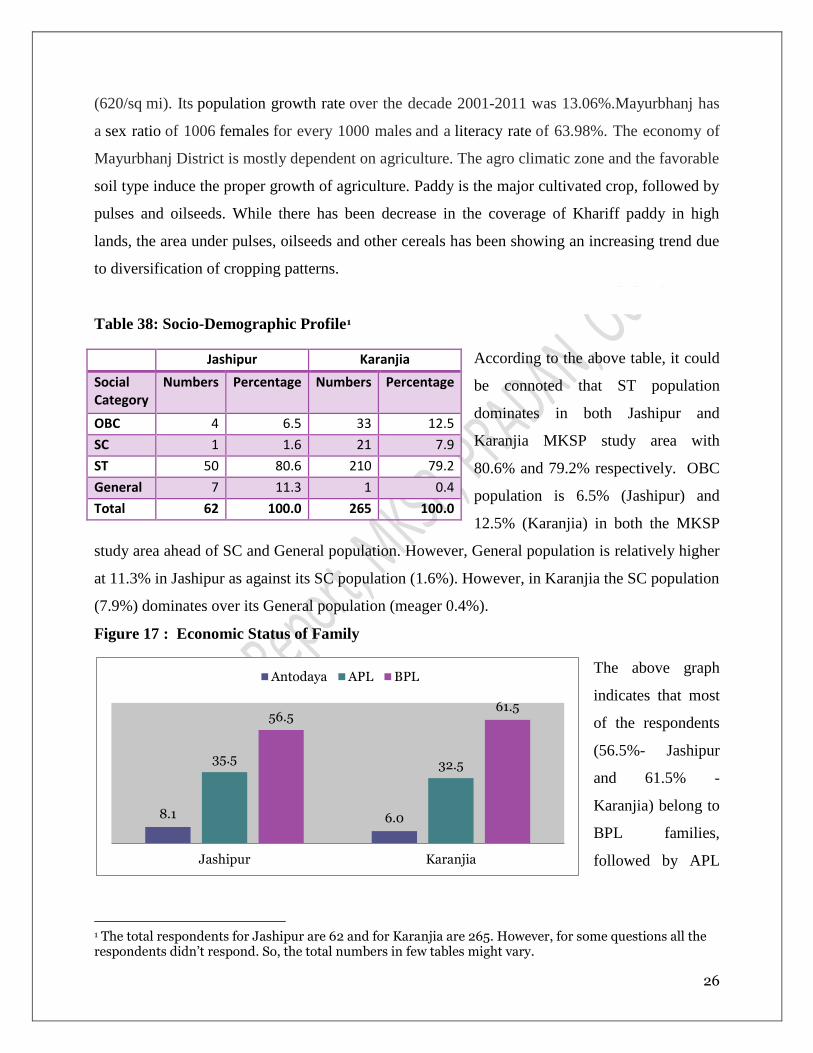
Figure 17 : Economic Status of Family
The above graph
indicates that most
of the respondents
(56.5%- Jashipur
and 61.5% -
Karanjia) belong to
BPL families,
followed by APL
1 The total respondents for Jashipur are 62 and for Karanjia are 265. However, for some questions all the respondents didn’t respond. So, the total numbers in few tables might vary.
Jashipur Karanjia
Social Category
Numbers Percentage Numbers Percentage
OBC 4 6.5 33 12.5
SC 1 1.6 21 7.9
ST 50 80.6 210 79.2
General 7 11.3 1 0.4
Total 62 100.0 265 100.0
27
62.9
8.1
17.7
11.3
81.1
0.4
0.4
18.1
Agriculture
Agriculture/NTFP/ Livestock
Agriculture/wage
Agriculture labour
Primary Occupation of Family (in%)
families (35.5%- Jashipur and 32.5%- Karanjia). In comparison to the other two categories,
Antodaya card holders were found to be low i.e.8.1% in Jashipur and 6% in Karanjia
Table 39: Home Stead Patta
Homestead Patta is available
with 72.6% families in
Jashipur and 78.1% families
in Karanjia MKSP study
area. However, there still are
a significant number of families in both the MKSP study area who are yet to have homestead land
patta.
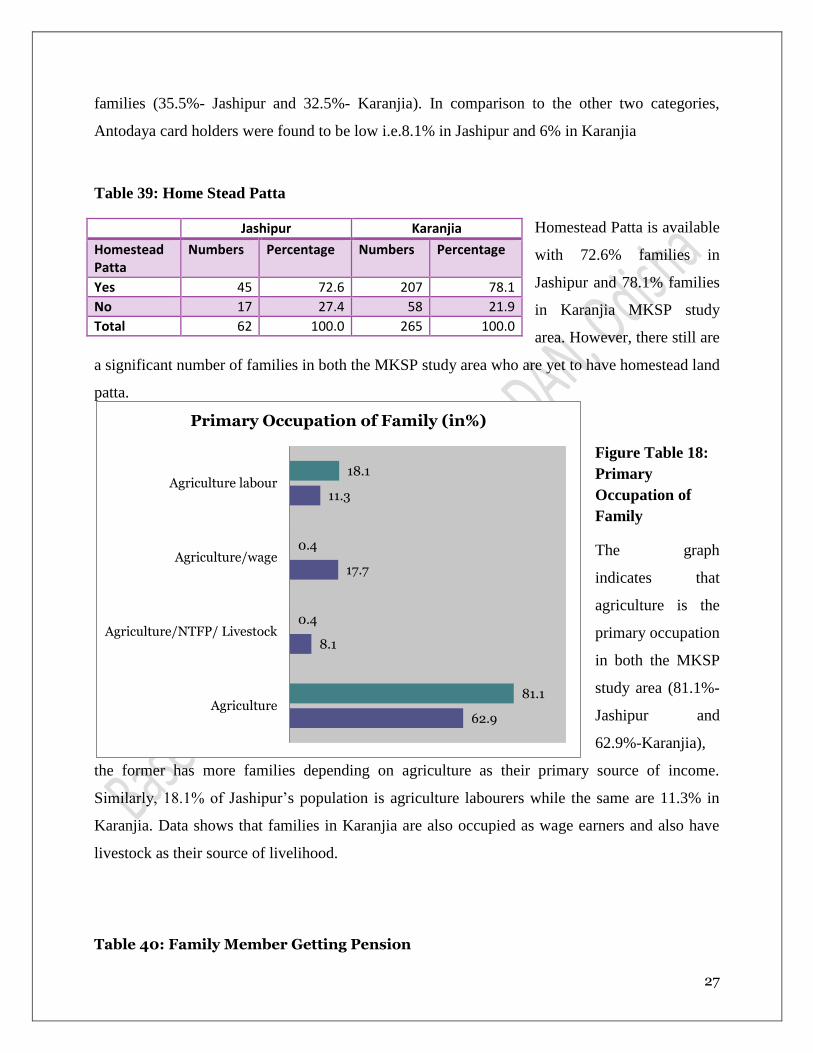
Figure Table 18:
Primary
Occupation of
Family
The graph
indicates that
agriculture is the
primary occupation
in both the MKSP
study area (81.1%-
Jashipur and
62.9%-Karanjia),
the former has more families depending on agriculture as their primary source of income.
Similarly, 18.1% of Jashipur’s population is agriculture labourers while the same are 11.3% in
Karanjia. Data shows that families in Karanjia are also occupied as wage earners and also have
livestock as their source of livelihood.
Table 40: Family Member Getting Pension
Jashipur Karanjia
Homestead Patta
Numbers Percentage Numbers Percentage
Yes 45 72.6 207 78.1
No 17 27.4 58 21.9
Total 62 100.0 265 100.0
28
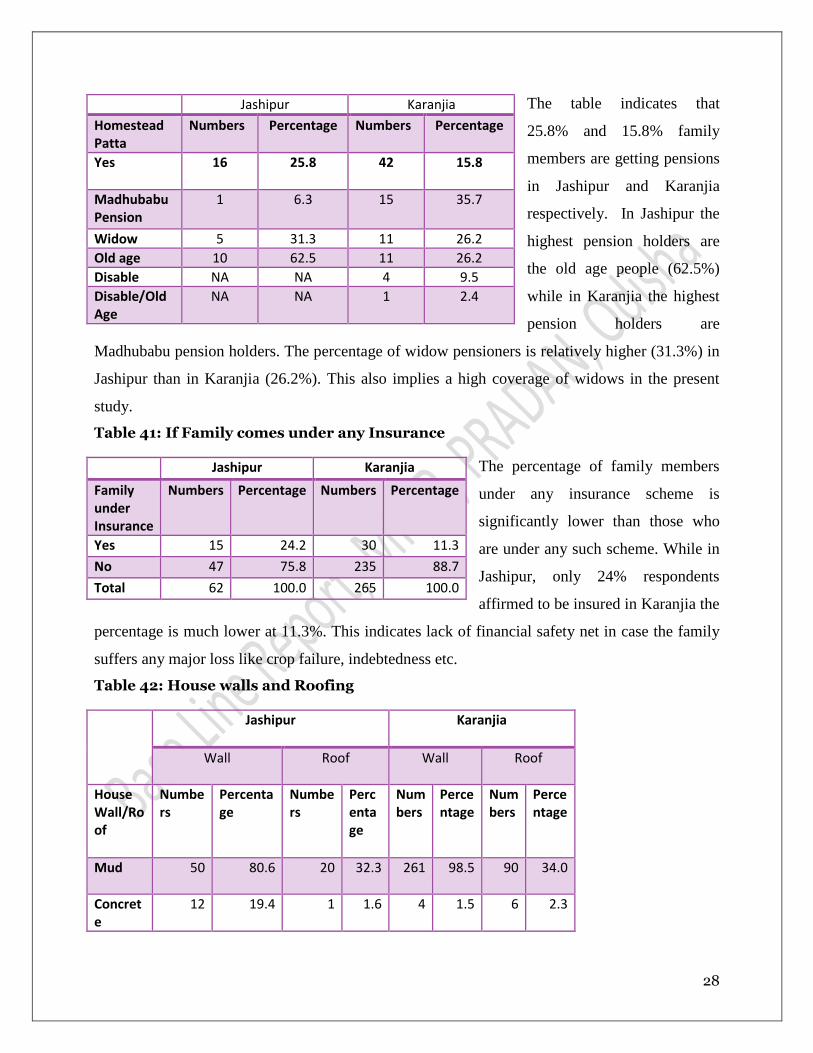
The table indicates that
25.8% and 15.8% family
members are getting pensions
in Jashipur and Karanjia
respectively. In Jashipur the
highest pension holders are
the old age people (62.5%)
while in Karanjia the highest
pension holders are
Madhubabu pension holders. The percentage of widow pensioners is relatively higher (31.3%) in
Jashipur than in Karanjia (26.2%). This also implies a high coverage of widows in the present
study.
Table 41: If Family comes under any Insurance
The percentage of family members
under any insurance scheme is
significantly lower than those who
are under any such scheme. While in
Jashipur, only 24% respondents
affirmed to be insured in Karanjia the
percentage is much lower at 11.3%. This indicates lack of financial safety net in case the family
suffers any major loss like crop failure, indebtedness etc.
Table 42: House walls and Roofing
Jashipur Karanjia
Homestead Patta
Numbers Percentage Numbers Percentage
Yes 16 25.8
42 15.8
Madhubabu Pension
1 6.3 15 35.7
Widow 5 31.3 11 26.2
Old age 10 62.5 11 26.2
Disable NA NA 4 9.5
Disable/Old Age
NA NA 1 2.4
Jashipur Karanjia
Family under Insurance
Numbers Percentage Numbers Percentage
Yes 15 24.2 30 11.3
No 47 75.8 235 88.7
Total 62 100.0 265 100.0
Jashipur Karanjia
Wall Roof Wall Roof
House Wall/Roof
Numbers
Percentage
Numbers
Percentage
Numbers
Percentage
Numbers
Percentage
Mud 50 80.6 20 32.3 261 98.5 90 34.0
Concrete
12 19.4 1 1.6 4 1.5 6 2.3
29
0.0
59.7
40.3
0.0
2.6
13.2
78.9
5.3
Big
Small
Marginal
landless
Category of Farmers
Karanjia Jashipur
The above table
indicates house
structure of the
respondents in both
the MKSP study
area. As per the data, majority of the walls (80.6%-Jashipur and 98.5%- Karanjia) are made of
mud. None of the walls in either of the MKSP study area are made in cement. Similarly, most of
the houses have straw roofs (64.5%-Jashipur and 53.2%-Karanjia), followed by mud roofs
(32.3%-Jashipur and 34%-Karanjia). This implies that majority of the respondents are residing in
kutcha houses and are yet to receive any housing facility from the government.
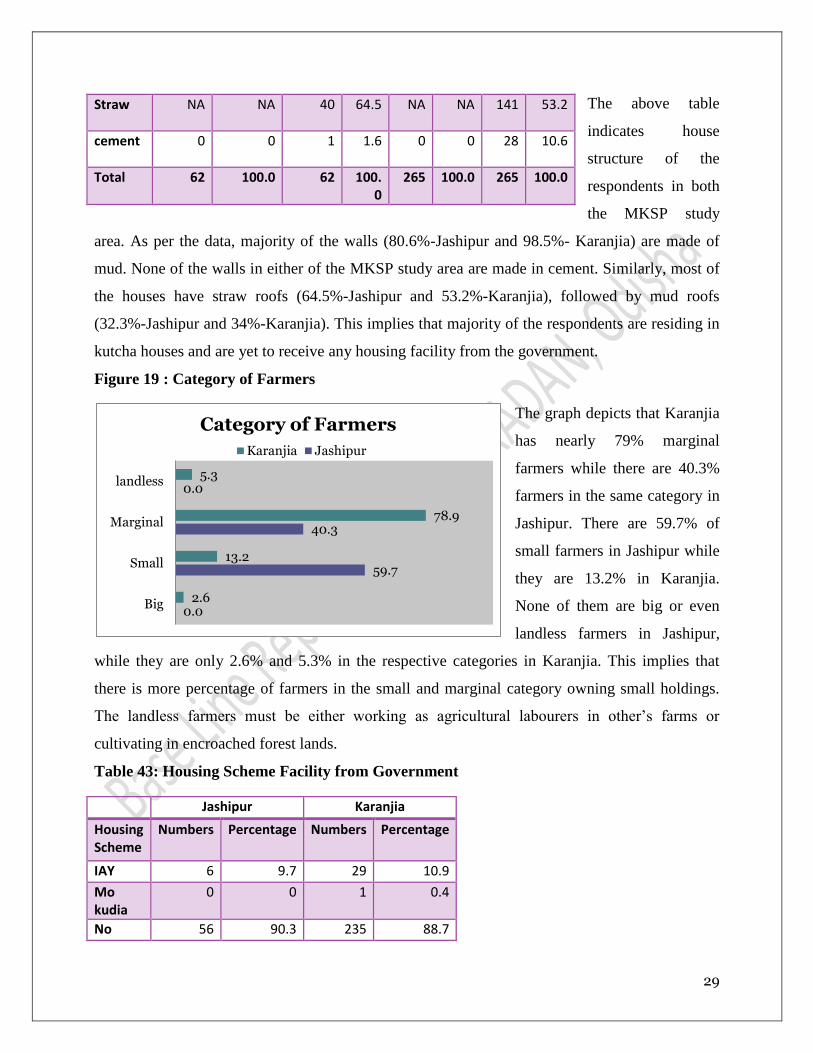
Figure 19 : Category of Farmers
The graph depicts that Karanjia
has nearly 79% marginal
farmers while there are 40.3%
farmers in the same category in
Jashipur. There are 59.7% of
small farmers in Jashipur while
they are 13.2% in Karanjia.
None of them are big or even
landless farmers in Jashipur,
while they are only 2.6% and 5.3% in the respective categories in Karanjia. This implies that
there is more percentage of farmers in the small and marginal category owning small holdings.
The landless farmers must be either working as agricultural labourers in other’s farms or
cultivating in encroached forest lands.
Table 43: Housing Scheme Facility from Government
Straw NA NA 40 64.5 NA NA 141 53.2
cement 0 0 1 1.6 0 0 28 10.6
Total 62 100.0 62 100.0
265 100.0 265 100.0
Jashipur Karanjia
Housing Scheme
Numbers Percentage Numbers Percentage
IAY 6 9.7 29 10.9
Mo kudia
0 0 1 0.4
No 56 90.3 235 88.7

30
Maximum incidence of kutcha houses
(as found earlier) is validated by the fact that majority of the respondents (90.3%-Jashipur and
88.7%-Karanjia) have not got any housing facility from the government. However, in Jashipur,
35.5% of the respondents affirmed of getting benefit under Mo Kudia scheme which possibly has
increased the percentage of concrete houses in the MKSP study area in comparison to Karanjia
(as shown in the earlier table). Only 10.9% and a meager 0.4% of the respondents have been
benefited under IAY and Mo Kudia respectively in Karanjia. This indicates lack of permeation of
government schemes into the remote areas for whom the schemes are actually targeted.
Table 44: Sources of Drinking Water
As per the figures in the table,
majority of the respondents i.e.
56.5% in Jashipur and 70% in
Karanjia, mentioned that tube well is
their source of drinking water. While
stream is the second most preferred
source of drinking water for 22.6%
respondents in Jashipur, it is the well
(19.4%) that is the second most preferred source of drinking water in Karanjia. There is no
government supy water in Jashipur, while is the same is meager 3.8% in Karanjia.
Table 45: Sanitation Facilities
Sanitation facilities are
utterly pathetic in both the
MKSP study area. While all
the respondents defecate
outside in Jashipur, the
percentage is equally high at
98.5 in Karanjia where the respondents mentioned about defecating outside.
Total 62 100.0 265 100.0
Jashipur Karanjia
Drinking Water
Numbers Percentage Numbers Percentage
Stream 14 22.6 6 2.3
Tube well
35 56.5 180 67.9
Waterfall 1 1.6 0 0.0
supply 0 0.0 10 3.8
Well 12 19.4 69 26.0
Total 62 77.4 265 100.0
Jashipur Karanjia
Sanitation Numbers Percentage Numbers Percentage
Outside 62 100.0 261 98.5
Latrine 0 0.0 4 1.5
Total 62 100.0 265 100.0
31
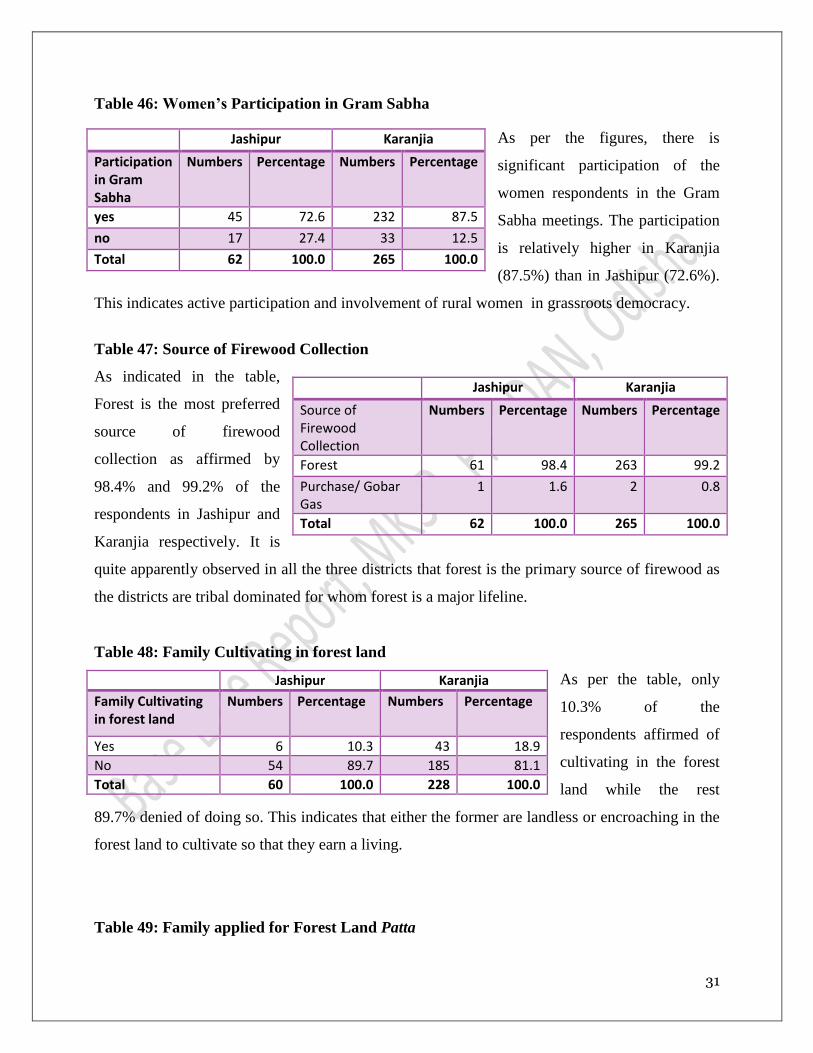
Table 46: Women’s Participation in Gram Sabha
As per the figures, there is
significant participation of the
women respondents in the Gram
Sabha meetings. The participation
is relatively higher in Karanjia
(87.5%) than in Jashipur (72.6%).
This indicates active participation and involvement of rural women in grassroots democracy.
Table 47: Source of Firewood Collection
As indicated in the table,
Forest is the most preferred
source of firewood
collection as affirmed by
98.4% and 99.2% of the
respondents in Jashipur and
Karanjia respectively. It is
quite apparently observed in all the three districts that forest is the primary source of firewood as
the districts are tribal dominated for whom forest is a major lifeline.
Table 48: Family Cultivating in forest land
As per the table, only
10.3% of the
respondents affirmed of
cultivating in the forest
land while the rest
89.7% denied of doing so. This indicates that either the former are landless or encroaching in the
forest land to cultivate so that they earn a living.
Table 49: Family applied for Forest Land Patta
Jashipur Karanjia
Participation in Gram Sabha
Numbers Percentage Numbers Percentage
yes 45 72.6 232 87.5
no 17 27.4 33 12.5
Total 62 100.0 265 100.0
Jashipur Karanjia
Source of Firewood Collection
Numbers Percentage Numbers Percentage
Forest 61 98.4 263 99.2
Purchase/ Gobar Gas
1 1.6 2 0.8
Total 62 100.0 265 100.0
Jashipur Karanjia
Family Cultivating in forest land
Numbers Percentage Numbers Percentage
Yes 6 10.3 43 18.9
No 54 89.7 185 81.1
Total 60 100.0 228 100.0
32
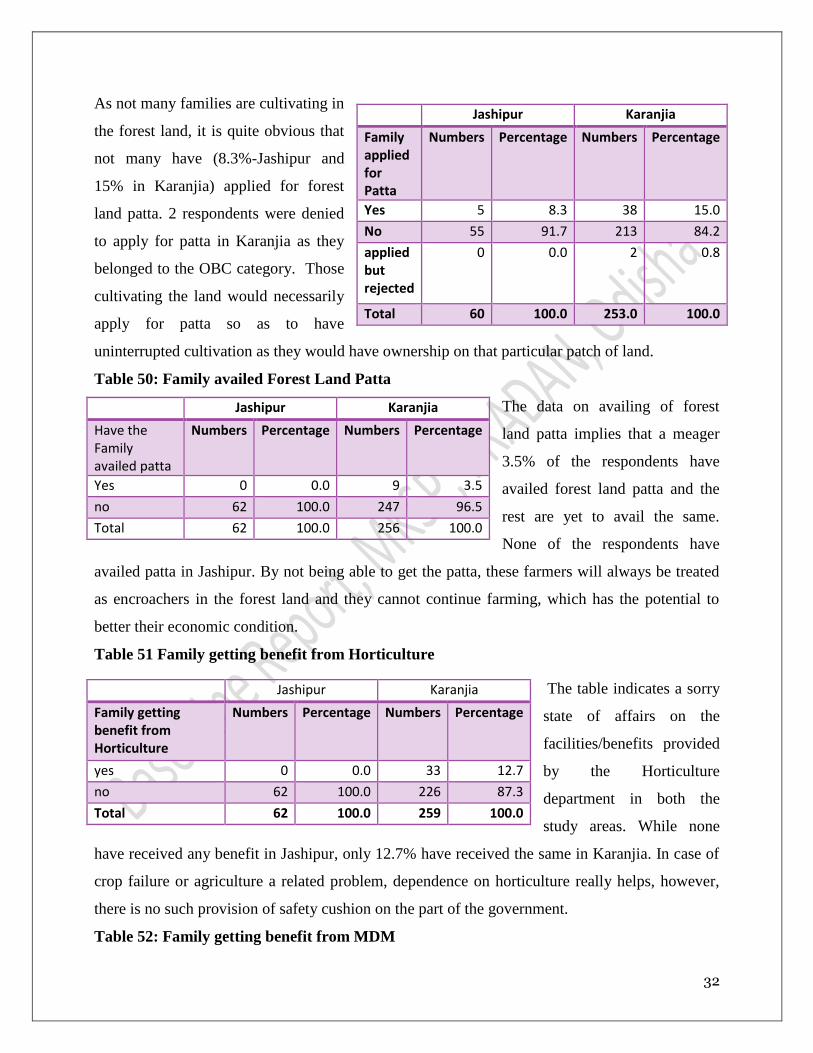
As not many families are cultivating in
the forest land, it is quite obvious that
not many have (8.3%-Jashipur and
15% in Karanjia) applied for forest
land patta. 2 respondents were denied
to apply for patta in Karanjia as they
belonged to the OBC category. Those
cultivating the land would necessarily
apply for patta so as to have
uninterrupted cultivation as they would have ownership on that particular patch of land.
Table 50: Family availed Forest Land Patta
The data on availing of forest
land patta implies that a meager
3.5% of the respondents have
availed forest land patta and the
rest are yet to avail the same.
None of the respondents have
availed patta in Jashipur. By not being able to get the patta, these farmers will always be treated
as encroachers in the forest land and they cannot continue farming, which has the potential to
better their economic condition.
Table 51 Family getting benefit from Horticulture
The table indicates a sorry
state of affairs on the
facilities/benefits provided
by the Horticulture
department in both the
study areas. While none
have received any benefit in Jashipur, only 12.7% have received the same in Karanjia. In case of
crop failure or agriculture a related problem, dependence on horticulture really helps, however,
there is no such provision of safety cushion on the part of the government.
Table 52: Family getting benefit from MDM
Jashipur Karanjia
Family applied for Patta
Numbers Percentage Numbers Percentage
Yes 5 8.3 38 15.0
No 55 91.7 213 84.2
applied but rejected
0 0.0 2 0.8
Total 60 100.0 253.0 100.0
Jashipur Karanjia
Have the Family availed patta
Numbers Percentage Numbers Percentage
Yes 0 0.0 9 3.5
no 62 100.0 247 96.5
Total 62 100.0 256 100.0
Jashipur Karanjia
Family getting benefit from Horticulture
Numbers Percentage Numbers Percentage
yes 0 0.0 33 12.7
no 62 100.0 226 87.3
Total 62 100.0 259 100.0
33
19.4
4.8
0
0
6.8
1.9
32.1
0
Seed and fertilizer
Grant/Subsidy
Training
Others
Govt benefit from Agriculture Programme
Karanjia (yes) (265) Jashipur (yes) (62)
Jashipur Karanjia
Family getting benefit from MDM
Numbers
Percentage Numbers Percentage
yes 25 40.3 137 52.7
no 30 59.7 123 47.3
Total 55 100.0 260 100.0
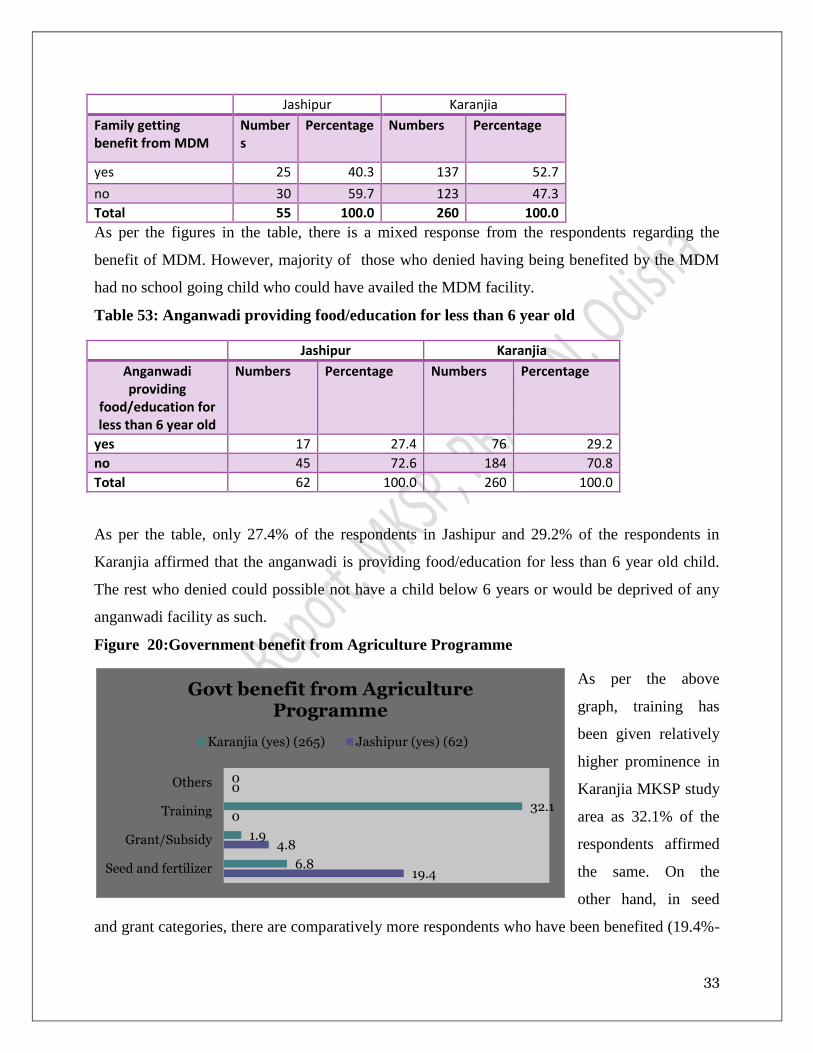
As per the figures in the table, there is a mixed response from the respondents regarding the
benefit of MDM. However, majority of those who denied having being benefited by the MDM
had no school going child who could have availed the MDM facility.
Table 53: Anganwadi providing food/education for less than 6 year old
Jashipur Karanjia
Anganwadi providing
food/education for less than 6 year old
Numbers Percentage Numbers Percentage
yes 17 27.4 76 29.2
no 45 72.6 184 70.8
Total 62 100.0 260 100.0
As per the table, only 27.4% of the respondents in Jashipur and 29.2% of the respondents in
Karanjia affirmed that the anganwadi is providing food/education for less than 6 year old child.
The rest who denied could possible not have a child below 6 years or would be deprived of any
anganwadi facility as such.
Figure 20:Government benefit from Agriculture Programme
As per the above
graph, training has
been given relatively
higher prominence in
Karanjia MKSP study
area as 32.1% of the
respondents affirmed
the same. On the
other hand, in seed
and grant categories, there are comparatively more respondents who have been benefited (19.4%-

34
Seed and Fertilizer and 4.8%- Grant/subsidy). However, an overall scenario depicts that not much
emphasis has been given by the government for the benefit of the farmers.
Table 54: Loan Availed
As per the figures in the table, 48.7%
respondents in Karanjia have availed
loan for some or other purpose as
against 33.9% respondents in Jashipur.
However, the prime reason for availing
loan in both the MKSP study area is
same i.e. agriculture related and allied
sectors. In comparison to Jashipur where 19% respondents have availed loan for business
Table 55: Loan Objective
purposes, there are merely 3.5%
respondents in Karanjia have
taken loan for business purpose.
Construction of house also
remains a major component for
availing loan as mentioned by
19% and 11.5% respondents in
Jashipur and Karanjia
respectively. There are nearly
13.3% respondents in Karanjia
who have availed loan for
personal matters like education,
marriage and other family
functions.
Jashipur Karanjia
Availed Loan
Numbers Percentage Numbers Percentage
yes 21 33.9 127 48.7
no 41 66.1 134 51.3
Total 62 100.0 261 100.0
Jashipur Karanjia
Loan Objective
Numbers Percentage Numbers Percentage
Agriculture and allied
11 52.4 66 58.4
Construction of house and loan repayment
4 19.0 13 11.5
Business 4 19.0 4 3.5
Medical related
2 9.5 15 13.3
Personal 0 0.0 15 13.3
Total 21 100.0 113 100.0

35
21.0
37.141.9
18.1
50.9
30.9
0m-3m 4m-7m 8m-12m
Food Sufficiency (in months)
Jashipur Karanjia
11.3
0.0
27.4
8.1
25.8 27.4
13.65.7
25.7
2.38.7
44.2
Ag
ricu
ltu
re a
nd
rela
ted
Do
mes
tic
Vio
len
ce
Am
en
itie
s(D
rin
kin
gw
atr
e,
elec
tric
ity
,sa
nit
ati
on
)
Hea
lth
Fo
od
In
secu
rity
Ho
use
, la
nd
&F
ina
nci
al
ma
tter
s
Main problems of familyJashipur Karanjia
Figure 21: Food Sufficiency (in months)
The data on food
sufficiency indicates that
majority (50.9%) of the
respondents in Karanjia
have food sufficiency in
between 4-7 months as it
is just the post-
harvesting season, while
in that months category
37.1% of the respondents
have food sufficiency.
However, in the other two month categories, relatively more percentage of the respondents has
food sufficiency as compared to Karanjia respondents. The lowest food sufficing is found in
Karanjia in 0-3 month category wherein only 18% of the respondents affirmed the same.
Figure 22: Main problems of family
The table provides data on main problems of the family in both the study MKSP study area.
Among all the matters, the highest (44.2%) problem is related to construction of house,
landlessness, unavailability of patta and inadequate financial sustainability in Karanjia MKSP

36
29.0
61.3
8.11.6
10.6
53.2
24.212.1
0-1
00
0
100
1-5
00
0
50
01-
100
00
100
00
ab
ov
e
Income from Agriculture (in%)
Jashipur Karanjia
study area Similarly, agriculture related problem in Karanjia (13.6%) is marginally higher than
Jashipur (11.3%). There is almost a similar concern among the respondents (27.4%-Jashipur and
25.7%-Karanjia) regarding the unavailability of safe drinking water, proper sanitation facilities
and electricity. Food insecurity as a problem was considered by 25.8% of the respondents in
Jashipur while in Karanjia the mentioned problem was relatively lower at 8.7%. Unlike other
districts, domestic violence was found among 5.75 of the respondents in Karanjia (marital
problems included alcoholism, financial issues etc.)
Figure 23: Income from Agriculture (in %)
As per the
table, among
all the income
categories,
income of the
respondents
form
agriculture is
highest in the category of Rs 1001-Rs5000, again percentage is relatively higher in Jashipur
(61.3%) than Karanjia (53.2%). However, income among the Karanjia respondents is higher in
the categories of Rs 5001-Rs 10000 (24.2% against 8.1%-Jashipur) and Rs.10000 and above
(12.1% as against 1.6%-Jashipur). The variation could be due to presence of big farmers having
bigger land holdings in Karanjia. In the category of Rs 0- Rs 1000, there are 29% and 10.6%
respondents in Jashipur and Karanjia respectively.
Table 56: Jashipur Land Details
Numbers
Percentage
Numbers
Percentage
Numbers
Percentage
Numbers
Percentage
Land in acres
own land Leased Land Forest/encroached land
Irrigated land
0 0 0 44 71.0 60 96.8 0 0.0
0.1-1 31 50 16 25.8 0 0.0 0 0

37
1.1-5 30 48.4 2 3.2 2 3.2 0 0
5.1-20 1 1.6 0 0 0 0 0 0
Total 62 100 62 100 62 100 0 0
As mentioned earlier, Jashipur has no landless farmers and hence, the percentage is 0 in the
category of own land (0 acres).There are 50% respondents who have land between 0.1-1% which
are generally marginal holdings. In the category of 1.1-5 acres there are 48.4% respondents and
1.6% respondents have more than 5 acres of land. It implies a significant presence of small and
marginal farmers in Jashipur. In the case of leasing of the land, 25.8% of leased land is less than
1 acres and 3.2% land falls between 1.105 acres. Surprisingly, there is no land than falls under the
‘irrigated land’ category. Only 3.2% land under 1.1-5 acres falls under encroached land category.
Table 57: Karanjia Land Details
Numbers
Percentage
Numbers
Percentage
Numbers
Percentage
Numbers
Percentage
Land in acres own land Leased Land Forest/encroached land
Irrigated land
0 15 5.7 233 87.9 252 95.1 256 96.6
0.1-1 83 31.3 29 10.9 13 4.9 9 3.4
1.1-5 160 60.4 3 1.1 0 0.0 0 0
5.1 and above 7 2.6 0 0 0 0 0 0
Total 265 100.0 265 100 265 100 265 100.0
As known earlier, there are 5.7% respondents who are landless farmers. There are 31%
respondents who have land between 0.1-1% which are generally marginal holdings. In the
category of 1.1-5 acres there are 60.4% respondents and 2.6% respondents have more than 5
acres of land. It implies a significant presence of small and marginal farmers in Karanjia. In the
case of leasing of the land, 25.8% of leased land is less than 1 acres and 3.2% land falls between
1.105 acres. Surprisingly, only 3.4 % land falls under the ‘irrigated land’ category. Only 4.92%
land under 1.1-5 acres falls under encroached land category.

38
Chapter III
Summary and Conclusion
The social category indicates that “Scheduled Tribes” are more predominant in all the
MKSP study areas under the sample blocks (Jashipur-79.2%, Karanjia-80.6%, 73.9%-
Patna and 98.9%-Kolnara)
Economic status wise distribution indicates that majority of the family belongs to BPL
households. (Jashipur- 56.5%, Karanjia-61.5%, 86.8%-Patna and 51.1%-Kolnara)
Distribution of Homestead Patta indicates except in Kolnara (48.9%-having patta), most
of the families affirmed than denied (Jashipur- 72.6%, Karanjia-78.1%, 97.8%-Patna)
Agriculture is the predominant source of livelihood and the prime source of occupation as
observed in all the MKSP study areas under the sample blocks. (Jashipur-81.1%,
Karanjia-62.9%, 98.1%-Patna and 56.4% -Kolnara)
Distribution of family under insurance indicates except Kolnara (67%-have insurance
cover) majority of the families don’t have any insurance cover (Jashipur-75.8%, Karanjia-
88.7%, 72%-Patna)
It was found that almost all the blocks have more percentage of kutcha houses.
Government has failed in providing any kind of housing scheme to the poor families in
the MKSP study areas under the sample blocks (Jashipur-90.3%, Karanjia-88.7%, 90.8%-
Patna and 76.6% -Kolnara)
Distribution of farmers’ category indicates prevalence of small and marginal farmers
(above 85%) over big farmers. Also landless farmers have been found in some instances.
It was found that only in Kolnara wherein more respondents are cultivating in forest land,
therein more of them have applied for forest patta (74.5%) than the non applicants
(25.5%). However, in other study areas the applicants for forest land patta are less as less
number of respondents’ dependant on forest land for cultivation.
However, the distribution of families on the basis of availing the patta from the
government is mostly very low as against those who have got the same. This indicates a
highly negligent attitude of the government in being a timely provider of patta.
39
Horticulture, as asset in case of crop failure and related issues, has been grossly
overlooked by the government. Barring very few families, majority of the respondents
denied any sort of horticulture related benefit. (100%-Jashipur, 83.7%-Karanjia, 87.2%-
Patna, 95.7%-Kolnara)
Participation of women in Gram Sabha meetings is more in almost all the study areas.
(72.6%-Jashipur, 87.5%-Karanjia, 79.3%-Patna, 75.5%-Kolnara)
The total income from agriculture is almost same for all the study areas falling within the
range of Rs.1001 to Rs.5000. However, there are slight variations i.e. in Patna block the
percentage of respondents in the income group of Rs.5000-Rs10, 000 is relatively highest.
Similarly, in Patna, there are 24% respondents who earn above Rs, 10000 while none in
Kolnara fall in that income bracket.
The main problems of the families vary from area to area. While Kolnara respondents
face agriculture related problems, for Patna block respondents it is drinking water,
Jashipur and Karanjia respondents face land and house related challenges.
Government benefit for agriculture programme in components like seed and fertilizers,
training, grant and subsidy has been highly negligible in all the study areas.
MDM and Anganwadi provision of food and education has been below 50% in the all the
study areas.
From the above findings, it could be concluded that the women farmers in the remotest areas of
the study districts are in sheer despair and agony. Agriculture, being the sole source of income, is
no more profit generating, let aside providing surplus over subsistence. Poverty is abject and
wide prevalent among the women farmers who get trapped in the vicious cycle of loan and debt.
Financial crisis brings a lot of distress and misery, often leading to absolute impoverishment. The
constant apathetic attitude of the government functionaries in providing timely and effective
assistance has failed to its utmost degree and the sufferers are none other than the women farmers
themselves. It is in this context that the baseline study aims to find out the existing gaps in
government aid and actual accessibility at the ground. The study was an endeavour to map out the
pervasive factors that confront the women farmers in escaping from the clutches of poverty. The
study would also be helpful in providing a roadmap for eradication of poverty from the rural-
tribal hinterlands of Odisha and provide a better life and livelihood opportunity for the poor
women farmers.

40
Annexure
Interview Schedule

41
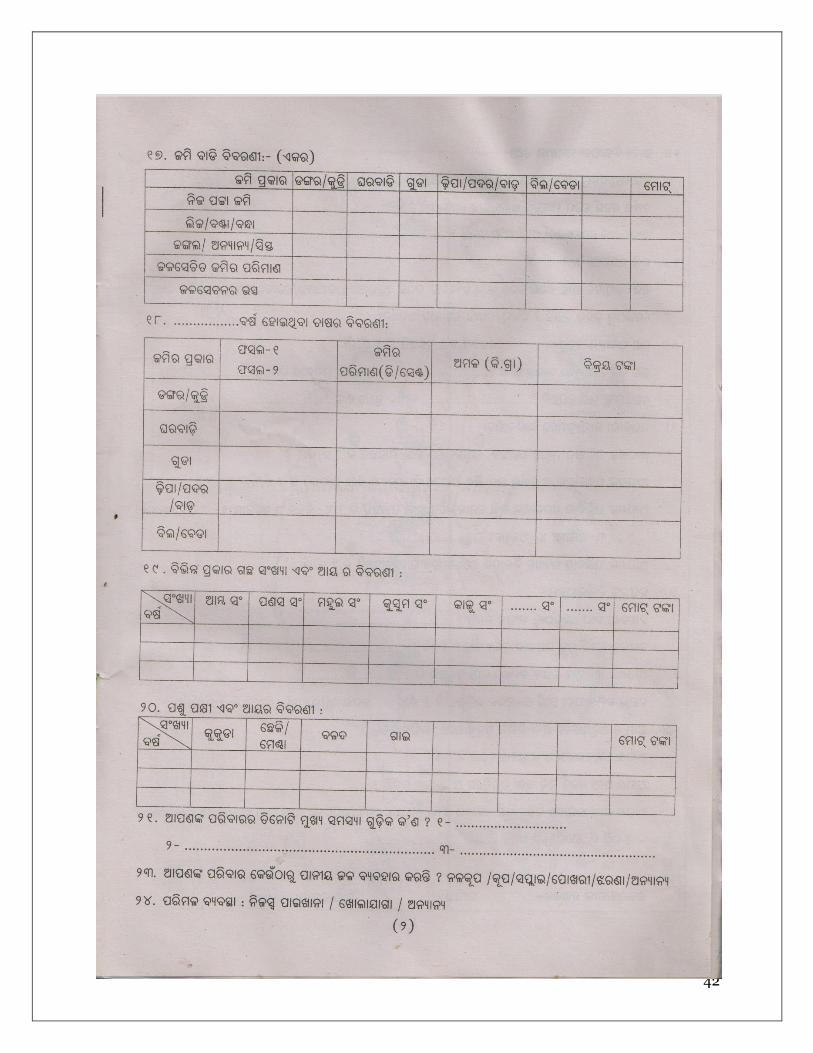
42
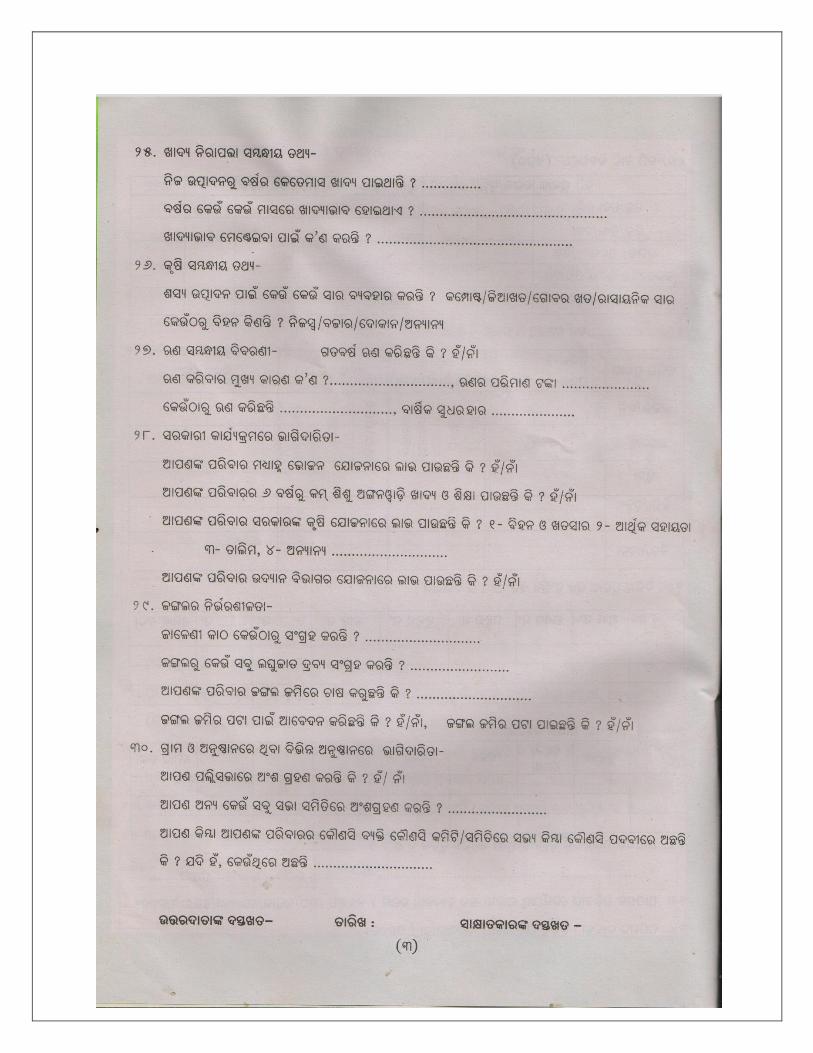
43