Proefschrift#8 DEF.indd 1 25-08-15 16:42 - EUR
187
Transcript of Proefschrift#8 DEF.indd 1 25-08-15 16:42 - EUR

Proefschrift#8_DEF.indd 1 25-08-15 16:42

Cover and layout: Jessie Sanders, www.jessiesanders.nlPrinted by: Proefschriftmaken.nl || Uitgeverij BOXPressThis research was sponsored by CTMM, project PCMM, project number 03O-203.Printing of this thesis is financially supported by: Department of Pathology of the Erasmus MC Rotterdam
Erasmus MC Rotterdam
©2015 Marije HooglandThe work of this thesis was conducted at the department of pathology of the Erasmus University Medical Center, Rotterdam, The Netherlands.
All rights reserved. No parts of this dissertation may be reproduced, stored in a retrieval system of any nature, or transmitted on any form by any means, electronic, mechanical, photocopying, recording or otherwise, including in a complete or partial transcription without permission of the author.
Proefschrift#8_DEF.indd 2 25-08-15 16:42

Discovery and Validation of Prognostic Tissue Markers in Clinical Prostate Cancer
Ontwikkeling en identificatie van prognostische markers in klinische prostaat kanker
Proefschriftter verkrijging van de graad van doctor aan de
Erasmus Universiteit Rotterdamop gezag van de
rector magnificusProf.dr. H.A.P. Pols
en volgens besluit van het College voor Promoties.De openbare verdediging zal plaatsvinden op
woensdag 28 oktober 2015 om 11:30 uurAgnes Marije Hooglandgeboren te Rotterdam
Proefschrift#8_DEF.indd 3 25-08-15 16:42

Discovery and Validation of Prognostic Tissue Markers in Clinical Prostate Cancer – © 2015, A.M. Hoogland
Promotiecommissie
Promotoren:Prof.dr.ir. G.W. Jenster
Prof.dr. F.J. van Kemenade
Overige leden:Prof.dr. P.M.J.J. BernsProf.dr. J.A. Schalken
Prof.dr. L. Incrocci
Copromotor:Dr. G.J.L.H van Leenders
Discovery and Validation of Prognostic Tissue Markers in Clinical Prostate Cancer – © 2015, A.M. Hoogland
Proefschrift#8_DEF.indd 4 25-08-15 16:42

Chapter 1General introduction and scope of the thesis: Prognostic Histopathological and Molecular Markers on Prostate Cancer Needle-Biopsies: a review.
Adapted from: Biomed Res Int. 2014
Chapter 2Cysteine-rich secretory protein 3 and β-microseminoprotein on prostate cancer needle biopsies do not have predictive value for subsequent prostatectomy outcome
BJU Int. 2011 Chapter 3
ERG immunohistochemistry is not predictive for PSA recurrence, local recurrence or overall survival after radical prostatectomy for prostate cancer.
Mod Pathol. 2012
Chapter 4Validation of stem cell markers in clinical prostate cancer: α6-Integrin is predictive for non-aggressive disease
Prostate. 2014
Chapter 5Gene-expression analysis of Gleason grade 3 prostate cancer glands embedded in low- and high-risk disease Submitted
Chapter 6General discussion
English SummaryNederlandse samenvatting List of publicationsCurriculum Vitae PhD Portfolio
7-35
37-59
61-81
83-105
107-153
155-169
171-174177-181182-183185186-187
Contents:
Contents
Proefschrift#8_DEF.indd 5 25-08-15 16:42

Discovery and Validation of Prognostic Tissue Markers in Clinical Prostate Cancer – © 2015, A.M. Hoogland
Proefschrift#8_DEF.indd 6 25-08-15 16:42

7
Chapter 1
Prognostic Histopathological and Molecular Markers on Prostate Cancer Needle-Biopsies: a review
A. Marije Hoogland*, Charlotte F. Kweldam*, Geert.J.L.H van Leenders*Shared first author
Department of Pathology, Erasmus Medical Center, Rotterdam, The Netherlands
Adapted from: Hoogland AM, Kweldam CF, van Leenders GJ. “Prognostic histopathological and molecular markers on prostate cancer
needle-biopsies: a review.”, Biomed Res Int. 2014
Chap
ter 1
Chapter 1: Prognostic Histopathological and Molecular Markers on Prostate Cancer Needle-Biopsies: a review
Proefschrift#8_DEF.indd 7 25-08-15 16:42
8 Discovery and Validation of Prognostic Tissue Markers in Clinical Prostate Cancer – © 2015, A.M. Hoogland
1. Introduction
Prostate cancer is the most common cancer in Western men. Although prostate cancer follows an aggressive course in a significant number of men, most tumors do not cause significant clinical symptoms. Therefore individual assessment of a tumor’s aggressive potential is crucial for clinical decision-making in men with prostate cancer.
In general, prostate cancer is diagnosed on needle-biopsies prompted by elevated serum Prostate Specific Antigen (PSA) levels, suspicious digital rectal examination or transrectal ultrasonography findings, and/ or clinical symptoms of urinary tract obstruction. In addition to elevated PSA levels and clinico-radiological signs of either local extension or metastasis, detailed histopathological characterization of prostate cancer at needle-biopsies predicts clinical tumor behavior and sustains therapeutic decision-making. In daily practice, the pathology report of prostate cancer includes the grade of differentiation according to the modified Gleason grading system, the number of biopsies infiltrated by prostate cancer and a quantitative assessment of the tumor volume per biopsy in either length in mm or percentage of tumor (Epstein, Allsbrook et al. 2005; Van der Kwast, Bubendorf et al. 2013). Implementation of novel histopathological and molecular markers is required for several reasons. While only half of the patients has a potentially life-threatening prostate cancer (Gleason score ≥7), 55-90% of patients with low-risk disease still undergo radical prostatectomy (Cooperberg, Broering et al. 2010). Active surveillance has become a widely used alternative for treatment after prostate cancer diagnosis. However, up to 33% of patients on active surveillance need therapeutic intervention after a median follow-up of 1.2-3.5 years (van As, Norman et al. 2008; van den Bergh, Roemeling et al. 2009; Soloway, Soloway et al. 2010; Cooperberg, Carroll et al. 2011; Tosoian, Trock et al. 2011). Therefore, better stratification of prostate cancer patients with respect to clinical decision-making is necessary, especially in the predominant group of low- to intermediate-risk prostate cancers.
Another reason to implement novel markers in prostate cancer diagnosis and clinical decision-making is the considerable inter-observer variability in Gleason grading among pathologists. This inter-observer variability is particularly of significance in the large group of low- to intermediate-risk prostate cancer, as it can influence therapeutic approaches (van den Bergh, Roemeling et al. 2009; McKenney, Simko et al. 2011; Egevad, Ahmad et al. 2013). Contemporary modified Gleason grading in needle-biopsies demands adding the most common and highest Gleason grade to the final Gleason score, regardless of the amount of ‘highest’ Gleason grade. In
Chap
ter 1
Proefschrift#8_DEF.indd 8 25-08-15 16:42

9
practice, when only a few atypical glands considered Gleason grade 4 are present together with a large volume of Gleason grade 3, the Gleason score is 7, and excludes patients from active surveillance in our institute. As considerable inter-observer variability exists between the distinction of Gleason grade 3 and 4, important treatment decisions depend too much on individual pathologist’s opinions. Thus, it is important to improve the reproducibility of Gleason grading by more objective parameters. In particular, molecular markers reflecting tumor biology could act as novel threshold in active surveillance or watchful waiting.
Finally, spatial heterogeneity of prostate cancer might lead to under- or, rarely, over-estimation of prostate cancer aggressive potential on diagnostic needle-biopsies. In general, prostate biopsies only sample 0.05% to 0.5% of the total prostate volume, which might result in under-sampling of the most significant area of prostate cancer tissue. In addition to improved image-guided needle-biopsy procedures, implementation of novel molecular markers might predict the presence of un-sampled significant areas in case molecular aberrations precede pathologically discernible patterns.
Last decade, much effort has been put in the identification of novel histopathological and molecular markers to further improve prediction of tumor behavior in prostate cancer patients. The vast majority of research has focused on correlation of novel markers with static clinico-pathologic parameters at radical prostatectomy such as Gleason score, pT-stage and surgical margin status, or biochemical recurrence after operation. However, in order to affect clinical decision-making, validation of respective markers in pre-treatment diagnostic needle-biopsies is essential. Here, we discuss established and promising histopathological and molecular tissue markers in diagnostic needle-biopsies.
Chap
ter 1
Chapter 1: Prognostic Histopathological and Molecular Markers on Prostate Cancer Needle-Biopsies: a review
Proefschrift#8_DEF.indd 9 25-08-15 16:42

10 Discovery and Validation of Prognostic Tissue Markers in Clinical Prostate Cancer – © 2015, A.M. Hoogland
2. Pathologic markers
2.1 Gleason gradingThe contemporary system for grading prostate cancer was developed by Donald F. Gleason in the 1960s (Gleason 1966). The Gleason grading system is solely based on the tumor’s architecture. The Gleason score equals the sum of the two most common Gleason grades in radical prostatectomy, and the sum of the most common and highest Gleason grades in needle-biopsies. Up to date, the Gleason score is a strong predictor for disease progression, and one of the most important parameters in therapeutic decision-making.
In 2005, the Gleason grading system was modified at the International Society of Urological Pathology (ISUP) conference (Epstein, Allsbrook et al. 2005). As a result, several tumor growth patterns classically considered as Gleason grade 3, were redefined as Gleason grade 4 (Epstein, Allsbrook et al. 2005). Shortly after, small cribriform and glomeruloid glands have been reconsidered Gleason grade 4 as well (Latour, Amin et al. 2008; Lotan and Epstein 2009; Epstein 2010). As a result of this stage migration, Gleason score 7 has become the most common assigned score on prostatic needle-biopsies (Helpap and Egevad 2006; Billis, Guimaraes et al. 2008; Zareba, Zhang et al. 2009). For instance, Helpap and Egevad showed in 368 needle-biopsy cases a significant change in distribution of modified Gleason score: Gleason score 2-4 decreased from 2.7 to 0%, Gleason score 5 decreased from 2.7 to 0%, Gleason score 6 decreased from 48 to 22%, but Gleason score 7 increased from 26 to 68% (Helpap and Egevad 2006). Generally, modified Gleason grading has improved the predictive value of grading prostate cancer.
2.1.1 Modified Gleason grading: up- and downgrading The overall concordance of Gleason score between prostate needle-biopsies and radical prostatectomies has improved from 58% in classic Gleason score to 72% in modified Gleason score (Helpap and Egevad 2006). Uemura et al. found a decrease in downgrading Gleason score in needle-biopsies in comparison to radical prostatectomy (15% versus 20%), although overall Gleason score concordance rates did not change significantly (Uemura, Hoshino et al. 2009). To date, the overall upgrading rate at radical prostatectomy using the modified Gleason score ranges between 26-50% (Moussa, Li et al. 2009; Moussa, Kattan et al. 2010; Visapaa, Hotakainen et al. 2010; Epstein, Feng et al. 2012). For instance, a large study containing 7643 radical prostatectomies with corresponding needle-biopsies demonstrated that 36% of cases (1841/5071) were upgraded from a needle-biopsy Gleason score 5-6 to a higher grade at radical prostatectomy (Epstein, Feng et al. 2012).
Chap
ter 1
Proefschrift#8_DEF.indd 10 25-08-15 16:42

11
In the same study 72% (1143/1577) had matching Gleason score 7 on biopsy and radical prostatectomy, and Gleason score 8 on biopsy showed a similar distribution for radical prostatectomy Gleason score 4+3=7, 8 and 9-10 (Epstein, Feng et al. 2012). In men with Gleason score 9-10 on needle-biopsy, 58% (69/119) had a similar Gleason score on radical prostatectomy (Epstein, Feng et al. 2012). Proposed predictors for upgrading are age, high pre-operative PSA, larger tumor percentage per core, number of positive cores, presence of perineural invasion, absence of inflammation and high prostate volume (Moussa, Li et al. 2009; Epstein, Feng et al. 2012). On the other hand, predictors for downgrading from any biopsy Gleason score to a lower Gleason score on radical prostatectomy were low pre-operative PSA, lower tumor percentage per core and larger prostate volume on radical prostatectomy (Moussa, Li et al. 2009; Epstein, Feng et al. 2012). Although these predictors for up- and downgrading all showed strong statistical significance, the effect on survival was still small. If in one biopsy session, multiple biopsies show differing Gleason scores, for instance Gleason score 4+3 in one biopsy and 3+3 in another biopsy, also referred to as presence of ComboGS, patients have lower odds of upgrading at time of radical prostatectomy and decreased risk of prostate cancer specific mortality (Whitson, Porten et al. 2013; Phillips, Aizer et al. 2014).
2.1.2 Modified Gleason grading: correlation with pathologic features at radical prostatectomyThe relationship between Gleason score on needle-biopsy and pathological stage on radical prostatectomy has improved since the implementation of the modified Gleason score (Billis, Guimaraes et al. 2008; Pierorazio, Ross et al. 2012). For instance, 4315/5205 men (83%) with Gleason score 6 on biopsy had organ-confined disease (pT2) at radical prostatectomy, while increasing Gleason score on biopsy was strongly associated with extra-prostatic extension (pT3a) and seminal vesicle invasion (pT3b) (Pierorazio, Ross et al. 2012). Although high pathologic stage is related to positive surgical margins at radical prostatectomy and biochemical recurrence, it should be mentioned that it is not associated with a uniformly poor prognosis (Busch, Hamborg et al. 2012; Meeks, Maschino et al. 2013; Forgues, Rozet et al. 2014).
Chap
ter 1
Chapter 1: Prognostic Histopathological and Molecular Markers on Prostate Cancer Needle-Biopsies: a review
Proefschrift#8_DEF.indd 11 25-08-15 16:42

12 Discovery and Validation of Prognostic Tissue Markers in Clinical Prostate Cancer – © 2015, A.M. Hoogland
2.1.3 Modified Gleason grading: predicting patient outcomeBillis et al. studied the impact of needle-biopsy Gleason score modification on biochemical recurrence free survival. Here, the modified Gleason score was a better predictor for biochemical recurrence than classic Gleason score (Billis, Guimaraes et al. 2008). Subsequently, the predictive value of the modified Gleason score has been validated in other large cohorts (Uemura, Hoshino et al. 2009; Pierorazio, Ross et al. 2012). Uemura et al. showed that the Gleason score was strongly associated with biochemical recurrence, only when the modified Gleason score was applied (Uemura, Hoshino et al. 2009). Furthermore, in a large study (n=7850) from the Johns Hopkins Hospital, Pierorazio et al. correlated biopsy Gleason score with biochemical recurrence. Here, 95% of the patients with needle-biopsy Gleason score 6 had no biochemical recurrence after 5 years of follow-up (Pierorazio, Ross et al. 2012). In men with Gleason score 3+4=7 and Gleason score 4+3=7 on needle-biopsy the 5 year biochemical recurrence free survival rates were 83% and 65%, respectively. Men with Gleason score 4+4=8 or 9-10 had the lowest 5 year biochemical recurrence free survival rates, 63% and 35% respectively. Tollefson et al. indicated that distant metastasis and disease-specific death are best estimated by a combination of Gleason score, perineural invasion and Ki-67 expression (Tollefson, Karnes et al. 2014).
Altogether, modified Gleason grading has generally improved the concordance between biopsy and radical prostatectomy Gleason score, associates better with pathologic parameters at radical prostatectomy, and is more predictive for biochemical recurrence as well as metastasis and disease-specific death.
2.2 Tumor quantificationCurrently, the number of positive core biopsies should routinely be mentioned in pathology reports. Additional measures of prostate cancer volume in needle-biopsies better predict disease outcome. Various parameters have been proposed as measure of tumor extent, e.g. tumor percentage in single biopsies, tumor length in single biopsies (mm) and number of negative biopsies. These quantitative assignments are required for most clinical nomograms. For instance, the Steyerberg nomogram incorporates number of positive biopsies, total cancer length (mm) and total ‘normal’ tissue length (mm) to predict indolent disease on radical prostatectomy (Steyerberg, Roobol et al. 2007). In addition, most active surveillance protocols are delimitated by the number of positive biopsies and/or a measure of tumor extent per biopsy (Dall’Era, Albertsen et al. 2012; van den Bergh, Ahmed et al. 2014).
Chap
ter 1
Proefschrift#8_DEF.indd 12 25-08-15 16:42
13
One well-studied example of tumor extent is the percentage of cancer in single biopsies, and many studies have confirmed its prognostic value in biopsies followed by radical prostatectomy (Linson, Lee et al. 2002; Freedland, Aronson et al. 2003; Freedland, Aronson et al. 2003; Nelson, Dunn et al. 2003; Vis, Roemeling et al. 2007; Epstein, Feng et al. 2012; Pierorazio, Ross et al. 2012), dose-escalated external beam radiotherapy (Vance, Stenmark et al. 2012), or by a combination with hormonal treatment (Williams, Buyyounouski et al. 2008). The location of positive biopsies can additionally be of therapeutic value, for instance for consideration of nerve-sparing surgery. The majority of these studies agree on the predictive value of tumor extent for endpoints such as biochemical recurrence (Linson, Lee et al. 2002; Nelson, Dunn et al. 2003; Freedland, Terris et al. 2004; Vis, Roemeling et al. 2007; Epstein, Feng et al. 2012; Pierorazio, Ross et al. 2012; Vance, Stenmark et al. 2012), metastasis (Nelson, Dunn et al. 2003; Vis, Roemeling et al. 2007; Vance, Stenmark et al. 2012) and disease-specific death (Nelson, Dunn et al. 2003; Vance, Stenmark et al. 2012). However, despite its statistical significance, the effect of tumor percentage in biopsies on survival is mostly small. Furthermore, all of the above mentioned publications used different methods to determine the percentage of cancer and different cut-off values. For instance, Vance et al. divided the percentage of cancer in single biopsies into four quartiles (<2.5%, <10%, <25% and ≥25%)(Vance, Stenmark et al. 2012), while Nelson et al. categorized it in to 0-10%, 11-59% and 60-100% (Nelson, Dunn et al. 2003).
Another frequently assessed measure on prostate biopsies is the percentage of positive biopsy cores, defined as the total number of positive cores divided by the total number of biopsy cores obtained. Studies evaluating its prognostic value have validated the independent predictive value for biochemical recurrence free survival (Huland, Hammerer et al. 1996; Ravery, Chastang et al. 2000; Linson, Lee et al. 2002; Williams, Buyyounouski et al. 2008). In 2011 Huang et al. analyzed needle-biopsies of 1056 patients treated with external beam radiotherapy and/or hormonal therapy (Huang, Vicini et al. 2012). Using a cut-off value of >50% positive biopsy cores they found that percentage of positive biopsy cores is a powerful and independent predictor for distant metastasis free and overall survival (Huang, Vicini et al. 2012). However, when the percentage of positive biopsy cores was adjusted for percentage of cancer in needle-biopsies in another study, it did not provide any additional superior risk stratification for biochemical recurrence, distant metastasis or disease-specific death (Vance, Stenmark et al. 2012).
Chap
ter 1
Chapter 1: Prognostic Histopathological and Molecular Markers on Prostate Cancer Needle-Biopsies: a review
Proefschrift#8_DEF.indd 13 25-08-15 16:42

14 Discovery and Validation of Prognostic Tissue Markers in Clinical Prostate Cancer – © 2015, A.M. Hoogland
While measuring tumor extent is generally straight-forward, minor controversies exist for instance for quantifying discontinuous prostate cancer foci in single biopsies. One could regard separate foci as being part of the same tumor and measure the distance between the outermost foci including intervening normal prostate tissue, or only measure malignant areas without intervening stroma. In this case, recent studies show that discontinuous foci of prostate cancer in needle-biopsies should be regarded and measured as one continuous lesion (Karram, Trock et al. 2011; Schultz, Maluf et al. 2013).
In short, tumor volume is an important parameter for disease extent, but there is no consensus yet on the best methodology for its assessment. It is clear that assignment of the number of positive biopsies requires identification of separate biopsy cores, even when they are fragmented due to technical procedures. This can be performed by including only one needle-biopsy per cassette, or marking multiple individual cores in one cassette for instance by inking. It is advised that no more than 3 biopsies should be included in one cassette, provided that measures are taken to prevent their curling and floating (Van der Kwast and Roobol 2013). The extent of cancer in individual cores is performed by actual measuring the tumor’s length with a ruler or by estimation of tumor percentage by eye-balling. Measuring tumor length is objective and exact, although more time-consuming. If estimation of percentage is applied in daily practice, one should take into account that detection of prostate cancer in short needle-biopsies due to suboptimal technical procedures can result in over-estimation of tumor percentage; for instance presence of 2 mm prostate cancer in a 5 mm biopsy results in a tumor percentage of 40%, which might erroneously exclude patients form active surveillance.
2.3 Perineural invasionThe significance of perineural invasion in prostate cancer biopsies remains questionable. In a systematic review Harnden et al. addressed important limitations of 21 studies on perineural invasion in biopsies followed by radical prostatectomy or radiation therapy (Harnden, Shelley et al. 2007). First, the presence of nerves in biopsies was not mandatory for patient inclusion. Second, the number of biopsy cores taken and the number of nerves present ranged widely. Third, pathologists were not obligated to routinely report on presence of perineural invasion; there were striking differences in the frequency of perineural invasion when biopsies were reviewed for study purpose. Interestingly, only 43% (18/42) of surveyed urologists think that presence of perineural invasion on prostate biopsy should influence treatment (Rubin, Bismar et al. 2004). Ten out of 18 surveyed urologists (56%) indicated that it helps planning nerve-sparing surgery. In contrast, nerve-
Chap
ter 1
Proefschrift#8_DEF.indd 14 25-08-15 16:42

15
sparing surgery was considered as a confounding factor in the studies mentioned by Harnden et al (Harnden, Shelley et al. 2007). However, despite limitations Harden et al. conclude that the weight of evidence in studies ascribing prognostic significance to perineural invasion appears to suggest that perineural invasion should influence clinical decision-making (Harnden, Shelley et al. 2007). For instance, Quinn et al. demonstrated in a large cohort (n=696) that perineural invasion was a significant predictor for outcome in a multivariable analysis (Quinn, Henshall et al. 2003). Delancey et al. demonstrate that perineural invasion on prostatic needle-biopsy is an independent predictor for biochemical recurrence, disease-specific survival and overall survival after radical prostatectomy (DeLancey, Wood et al. 2013).
2.4 Intraductal carcinoma: a high-risk lesionIntraductal carcinoma of the prostate is defined as a well-circumscribed lesion surrounded by an intact basal cell layer distended by overtly malignant-appearing epithelial populations (Pickup and Van der Kwast 2007) (Figure 1 A-B). Intraductal carcinoma forms a morphologic continuum with high-grade prostate intraepithelial neoplasia (PIN), which is the generally accepted precursor of prostate cancer. While PIN is recognized by the presence of cytologically malignant cells in pre-existent prostate glands of normal architecture, these glands should be enlarged in intraductal carcinoma. In contrast to PIN, which can be an isolated finding on prostate biopsy, intraductal carcinoma is associated in 90% of cases with invasive carcinoma, mostly of intermediate- or high-risk (Robinson and Epstein 2010). Up to date, three studies on intraductal carcinoma all demonstrated its independent predictive value for biochemical recurrence after radical prostatectomy, treatment failure and distant metastasis in biopsies (Cohen, Chan et al. 1998; Efstathiou, Abrahams et al. 2010; Van der Kwast, Al Daoud et al. 2012). Van der Kwast et al. showed that intraductal carcinoma on needle-biopsies prior to external beam radiotherapy with or without androgen deprivation therapy strongly predicted biochemical recurrence and early distant metastasis in a cohort of 118 intermediate- and 132 high-risk prostate cancer patients (Van der Kwast, Al Daoud et al. 2012).
2.5 Percentage Gleason grade 4 and 5A proposed adaption to the Gleason grading system by Vis et al. is the reporting of percentage of Gleason grade 4/ 5 in prostatic needle-biopsies (Vis, Roemeling et al. 2007). In this study, containing 281 patients, amount of high-grade cancer (length in mm, or percentage) in the core biopsy was an independent prognostic factor for biochemical recurrence and clinical relapse of prostate cancer (Vis, Roemeling et al. 2007). In addition, when biopsy Gleason score 7 cancers were subcategorized into 3+4 and 4+3 cancers, the amount of high-grade cancer was the strongest predictor
Chap
ter 1
Chapter 1: Prognostic Histopathological and Molecular Markers on Prostate Cancer Needle-Biopsies: a review
Proefschrift#8_DEF.indd 15 25-08-15 16:42

16 Discovery and Validation of Prognostic Tissue Markers in Clinical Prostate Cancer – © 2015, A.M. Hoogland
of biochemical recurrence free survival, whereas the Gleason grading system was rejected in the presence of high-grade components (Vis, Roemeling et al. 2007). So far, no other studies have yet validated the predictive value of this parameter on prostatic needle-biopsies.
2.6 Gleason grade 4 patterns: individual prognostic valueGleason grade 4 tumors represent a diverse group, containing at least 4 distinctive growth patterns: fused, cribriform, ill-defined and glomeruloid (Epstein, Allsbrook et al. 2005; Lotan and Epstein 2009; Epstein 2010). Recently, Dong et al. studied the prognostic value of these distinct Gleason grade 4 patterns and showed that cribriform growth, in particular, was strongly associated with biochemical recurrence and distant metastasis after radical prostatectomy (Dong, Yang et al. 2013) (Figure 1 C). Only one publication has yet demonstrated the adverse prognostic value of cribriform growth pattern in a biopsy series, with radiotherapy as treatment, and biochemical recurrence as clinical endpoint (Efstathiou, Abrahams et al. 2010).
2.7 Extra-prostatic extensionRarely, prostate cancer is infiltrating extra-prostatic fat tissue, seminal vesicle or ejaculatory ducts on needle-biopsies. Fat invasion by tumor on prostatic needle-biopsy is considered as extra-prostatic extension by 81% of surveyed pathologists from the European Network of Uropathology (Berney, Algaba et al. 2014). If present, these features should be mentioned in diagnostic needle-biopsies. Since signs of extra-prostatic extension are mostly seen in voluminous prostate cancer with high Gleason score, these patients could be less eligible for radical treatment.
2.8 Tumor-associated macrophages Solid tumors grow in a complex and dynamic stroma involving various cell types e.g. leukocytes, fibroblasts and endothelial cells. Tumor-associated macrophages are part of the tumor microenvironment and seem to influence solid tumor progression e.g. in colon, breast, ovarian cancer (Sica, Schioppa et al. 2006). Nonomura et al. were the first to study its prognostic relevance in prostate biopsies (Nonomura, Takayama et al. 2011). The presence of tumor-associated macrophages, as immunohistochemically identified by the CD68 antibody in a cohort of 71 prostate cancer patients treated with hormones, was associated with disease recurrence after hormonal therapy. Furthermore, tumor-associated macrophages count (>22 at 400x magnification), PSA level, Gleason score ≥7 and extra-capsular extension were independent predictors for biochemical recurrence free survival in multivariate analysis (Nonomura, Takayama et al. 2011). Studies on tumor-infiltrating lymphocytes in prostatic needle-biopsies have not yet been performed.
Chap
ter 1
Proefschrift#8_DEF.indd 16 25-08-15 16:42

17
2.9 Summary�� To date, Gleason grading on prostatic biopsy is the most important predictor
for biochemical recurrence, distant metastasis and cancer-specific mortality in prostate cancer.
�� Despite the modification in 2005 by the ISUP, Gleason score upgrading at radical prostatectomy still ranges between 26-50%.
�� Proposed predictors of upgrading are high pre-operative PSA, larger tumor percentage per biopsy core, number of positive cores and presence of perineural invasion.
�� Proposed predictors of downgrading are smaller tumor percentage per core and large prostate volume.
�� Differing Gleason scores on prostate needle biopsies could be a useful tool in decreasing the odds of upgrading.
�� Tumor quantification is an important prognostic factor and implemented in clinical nomograms of prostate cancer; there is, however, no consensus on the best methodology for its assessment. Furthermore, despite its fundamental role in clinical nomograms, the effect on survival is relatively small.
�� Presence of perineural invasion on needle-biopsies is an independent predictor for survival, and therefore a recommended parameter to add in standardized pathology reporting.
�� The amount of Gleason grade 4/ 5 in needle-biopsies seems to have prognostic value, however, needs to be validated in large cohorts with strong endpoints.
�� Cribriform growth and/or intraductal spread are promising histopathological markers in needle-biopsies.
�� The prognostic value of tumor-associated inflammation has recently been acknowledgment in multiple solid tumors, and needs to be further investigated in prostate cancer.
Chap
ter 1
Chapter 1: Prognostic Histopathological and Molecular Markers on Prostate Cancer Needle-Biopsies: a review
Proefschrift#8_DEF.indd 17 25-08-15 16:42

18 Discovery and Validation of Prognostic Tissue Markers in Clinical Prostate Cancer – © 2015, A.M. Hoogland
3. Molecular markers
3.1 Ki-67The Ki-67 protein is a cell proliferation marker, which is expressed in G1, S, G2 and M phases of the cell cycle being absent in resting (G0) cells. The Ki-67 labeling index as determined by the MIB-1 antibody is the best studied prostate cancer marker in needle-biopsies up to date (Vis, van Rhijn et al. 2002; Rubio, Ramos et al. 2005; Wolters, Vissers et al. 2009; Zellweger, Gunther et al. 2009; Tolonen, Tammela et al. 2011; Fisher, Yang et al. 2013). Ki-67 labeling index shows a strong correlation with Gleason score on diagnostic biopsies (Tolonen, Tammela et al. 2011; Fisher, Yang et al. 2013), on subsequent radical prostatectomy (Vis, van Rhijn et al. 2002; Wolters, Vissers et al. 2009; Zellweger, Gunther et al. 2009), or both (Rubio, Ramos et al. 2005). In a cohort of 91 patients, Rubio et al. found Ki-67 (cut-off value of 5% positive nuclei) on needle-biopsies to be a marker for disease-free survival after radical prostatectomy in univariate analysis (Rubio, Ramos et al. 2005). Zellweger and colleagues found that Ki-67 labeling index of ≥ 10% at biopsy cores in 279 patients independently predicted seminal vesicle invasion and Gleason score on subsequent radical prostatectomy (Zellweger, Gunther et al. 2009). In addition, they found that Ki-67 was the only independent marker for post-operative biochemical recurrence in a subgroup of low-volume (<7%) or low-grade (Gleason score < 7) prostate cancer at needle-biopsies. Tolonen et al. demonstrated that Ki-67 in 247 primarily endocrine-treated prostate cancer patients was associated with progression-free survival (Tolonen, Tammela et al. 2011). Ki-67 labeling ≥ 10% on 293 micro-arrayed needle-biopsies had independent predictive value for disease-specific death together with Gleason score and PSA (Fisher, Yang et al. 2013). Recently, Tollefson et al. calculated in a cohort of 451 prostate cancer needle-biopsies that every 1% increase in Ki-67 expression resulted in a 12% increased risk of cancer-specific death after radical prostatectomy (Tollefson, Karnes et al. 2014). Whereas these studies all show additional value of Ki-67 expression in needle-biopsies with aggressive disease features, two studies focused on the relation of Ki-67 labeling in needle-biopsies and presence of indolent disease on radical prostatectomy. In a well-defined screening cohort Vis et al. were not able to find a significant association of Ki-67 ≥ 10% with significant prostate cancer at radical prostatectomy in 81 patients (Vis, van Rhijn et al. 2002). Wolters et al. were also not able to find a significant association of high Ki-67 expression (>3%) with significant prostate cancer at radical prostatectomy in 86 patients (Wolters, Vissers et al. 2009). Taken together, enhanced Ki-67 labeling at needle-biopsy is associated with adverse clinico-pathologic features and disease-specific death in general prostate cancer populations.
Chap
ter 1
Proefschrift#8_DEF.indd 18 25-08-15 16:42

19
3.2 p27p27kip1 is a cyclin-dependent kinase (cdk) inhibitor. It inhibits cell cycle progression in G1 phase by preventing activation of cyclin E-cdk2 and cyclin D/-cdk4 complexes (Thomas, Schrage et al. 2000). Loss of p27 has been widely associated with progression of different tumor types, including breast, colorectal, and lung cancer (Thomas, Schrage et al. 2000). Generally, p27 expression in prostate cancer needle-biopsies correlates well with the p27 labeling in radical prostatectomy samples (Thomas, Schrage et al. 2000; Vis, van Rhijn et al. 2002). In prostate cancer, various groups have shown that loss of p27 expression was associated with more aggressive disease parameters. Thomas et al. demonstrated that low expression (<30%) of p27 in needle-biopsies correlated with higher Gleason score and pT-stage at radical prostatectomy (Thomas, Schrage et al. 2000). In this relatively small cohort of 44 patients, tumors with low p27 expression showed a trend towards shortened biochemical recurrence free survival after operation. Vis et al. showed that p27 expression in <50% together with Gleason score were the only significant parameters to predict clinically significant disease at radical prostatectomy in a screen-detected cohort of 81 prostate cancer patients (Vis, van Rhijn et al. 2002). In addition, we found that p27 in <90% in a low-risk prostate cancer cohort was an independent parameters of clinically significant prostate cancer in 86 radical prostatectomy samples (Wolters, Vissers et al. 2009). Therefore, loss of p27 is a marker of more aggressive prostate cancer, although the number of patients is limited and different standard cut-off levels have been used by various groups.
3.3 EZH2Enhancer of zeste homologue 2 (EZH2) belongs to the Polycomb-group proteins and is important in maintaining cell identity and regulation of the cell cycle (Sellers and Loda 2002; Varambally, Dhanasekaran et al. 2002). EZH2 has been reported to be of both prognostic and therapeutic value in different tumors, such as small cell lung carcinoma (Behrens, Solis et al. 2013), breast cancer (Deb, Thakur et al. 2013; Roh, Park et al. 2013), cervical carcinomas (Liu, Liu et al. 2014), urinary tract carcinoma (Hayashi, Morikawa et al. 2014) and lymphoma (Lee, Shin et al. 2014). Through gene expression profiling, EZH2 was found to be over-expressed in hormone-refractory metastatic prostate cancer (Varambally, Dhanasekaran et al. 2002). Over-expression of EZH2 in radical prostatectomy samples was associated with poor prognosis (Varambally, Dhanasekaran et al. 2002; van Leenders, Dukers et al. 2007; Laitinen, Martikainen et al. 2008; Hoogland, Verhoef et al. 2014). In a set of 86 needle-biopsies of screen-detected low-risk prostate cancer, EZH2 expression >1% was associated with clinically significant tumors on radical prostatectomy, defined as presence of extra-prostatic extension, Gleason grade 4/5 or tumor volume ≥0.5ml
Chap
ter 1
Chapter 1: Prognostic Histopathological and Molecular Markers on Prostate Cancer Needle-Biopsies: a review
Proefschrift#8_DEF.indd 19 25-08-15 16:42

20 Discovery and Validation of Prognostic Tissue Markers in Clinical Prostate Cancer – © 2015, A.M. Hoogland
(Wolters, Vissers et al. 2009). In the same study, no prognostic value was found for Polycomb-group protein BMI1. Tolonen et al. found independent predictive value for EZH2 (expression level of >15%) for progression-free survival in 247 hormone-treated biopsies (Tolonen, Tammela et al. 2011). While enhanced EZH2 expression in prostate cancer biopsies has independent prognostic value, there is no consensus yet on cut-off points in clinical practice.
3.4 TMPRSS2:ERGFusion of the androgen-dependent TMPRSS2 gene to ETS-transcription factor ERG (TMPRSS2:ERG) is one of the most common genetic alterations in prostate cancer occurring in 50%-70% of tumors (Tomlins, Rhodes et al. 2005). Many groups have analyzed the presence of TMPRSS2:ERG fusion or ERG protein expression in prostate cancer cohorts with variable outcome (Tomlins, Rhodes et al. 2005; Hessels and Schalken 2013; Hossain and Bostwick 2013; Shah 2013; Xu, Chevarie-Davis et al. 2014). Barros-Silva et al. used fluorescent in situ hybridization (FISH) to detect TMPRSS2-ERG rearrangement in a cohort of 200 biopsies and found an association with low PSA levels at diagnosis and low Gleason score (Barros-Silva, Ribeiro et al. 2011). In needle-biopsies immunohistochemical ERG detection can be used to discriminate prostate cancer from its mimickers, although the additional value to other markers such as p63, basal cell keratin 5 and AMACR is limited (Pavlakis, Stravodimos et al. 2010; Bjartell, Montironi et al. 2011; Boran, Kandirali et al. 2011; van Leenders, Boormans et al. 2011; Dabir, Ottosen et al. 2012; Shah 2013; Andrews and Humphrey 2014). In an active surveillance cohort of 265 men, Berg et al. found a strong correlated between ERG protein expression and disease-progression (Berg, Vainer et al. 2014). Likewise, Hagglof et al. showed a shorter survival of prostate cancer patients on watchful waiting when ERG was expressed (Hagglof, Hammarsten et al. 2014). They found a cumulative 2-year progression rate of 59% in the ERG-positive group versus 22% in the ERG-negative group. Finally, expression of ERG in high-grade PIN was associated with a higher chance of developing prostate cancer at subsequent biopsies (Park, Tomlins et al. 2010). ERG immunohistochemistry is an easy to perform methodology for detecting TMPRSS2:ERG fusion in prostate cancer. While the clinical relevance of TMPRSS2:ERG fusion on radical prostatectomy specimens is unresolved yet, most reports indicate that ERG expression on biopsy, in surveillance cohorts can select a subgroup with higher chance to progression.
Chap
ter 1
Proefschrift#8_DEF.indd 20 25-08-15 16:42
21
3.5 Neuro-endocrine differentiationIn many prostate cancers, scattered tumor cells show neuro-endocrine differentiation as demonstrated by antibodies to Chromogranine, Synaptophysine or Serotonine. After hormonal therapy, the relative number of neuro-endocrine cells is increased, putatively due to their androgen-independent nature (di Sant’Agnese 1992; Di Sant’Agnese and Cockett 1994; Abrahamsson 1999). Despite extensive studies on neuro-endocrine differentiation in relation to castration-resistance, this feature is rarely studied in pre-treatment biopsies. Krauss and colleagues have shown that Chromogranine A expression of >1% in prostate cancer biopsies is an independent predictor for distant metastasis and cause-specific survival after primary radiation therapy (Krauss, Hayek et al. 2011; Krauss, Amin et al. 2014).
3.6 c-MYCThe oncogene c-MYC located at 8q24 encodes a transcription factor involved in cell cycle progression, cell growth, proliferation, protein synthesis, mitochondrial function, stem cell renewal and DNA replication (Boxer and Dang 2001; Gurel, Iwata et al. 2008). c-MYC is amplified in approximately 70% of clinical prostate cancer (Ribeiro, Henrique et al. 2007; Barros-Silva, Ribeiro et al. 2011; Zafarana, Ishkanian et al. 2012). Ribeiro et al. found that patients with gain of MYC gene copy numbers in a group of 60 prostate cancer needle-biopsies using FISH were significantly at risk for disease-specific death (Ribeiro, Henrique et al. 2007). Bastacky et al. showed that amplification of c-MYC in needle-biopsies with high-grade PIN was predictive of finding prostate cancer in subsequent biopsies (Bastacky, Cieply et al. 2004). The potential predictive value of c-MYC was confirmed by Zafarana et al. in a cohort of 126 needle biopsies, where they found c-MYC gain alone to be prognostic for tumor recurrence after radiotherapy (Zafarana, Ishkanian et al. 2012). c-MYC gain combined with loss of PTEN further increased the predictive value for recurrence after radiotherapy.
Chap
ter 1
Chapter 1: Prognostic Histopathological and Molecular Markers on Prostate Cancer Needle-Biopsies: a review
Proefschrift#8_DEF.indd 21 25-08-15 16:42

22 Discovery and Validation of Prognostic Tissue Markers in Clinical Prostate Cancer – © 2015, A.M. Hoogland
3.7 PTENPhosphatase and tensin homologue (PTEN) is a tumor suppressor gene which is inactivated in many different tumors, including prostate cancer (Uzoh, Perks et al. 2009). On large cohorts of radical prostatectomy samples and Transurethral resection (TUR) samples, PTEN loss has been associated with bone metastases, resistance to radiotherapy and chemotherapy, progression to androgen-independent disease and disease recurrence after surgery (Uzoh, Perks et al. 2009; Cuzick, Yang et al. 2013). Zafarana et al. found that PTEN loss alone and in combination with c-MYC gain were independently associated with biochemical recurrence after radiation therapy in a group of 126 intermediate-risk prostate cancer biopsies (Zafarana, Ishkanian et al. 2012).
3.8 APCUsing quantitative methylation-specific PCR (QMSP) Henrique and colleagues showed that hypermethylation of APC, GSTP1 and RASSF1A in 83 prostate cancers at sextant needle-biopsies was associated with poor disease-specific survival (Henrique, Ribeiro et al. 2007). Besides clinical stage, hypermethylation of APC was independently predictive for decreased disease-free and disease-specific survival. Methylation of CCND2 and RARB2 in the same study did not have predictive value for disease outcome.
3.9 Molecular signaturesSubgroups with unique molecular, pathologic, clinical and therapy-sensitivity, as have been defined in breast cancer, have not been delineated in prostate cancer yet. Nevertheless, recently gene signatures have been put forth to predict prostate cancer behavior. Klein et al. demonstrated that a 17-gene assay was able to identify patients with high-grade and high-stage disease at radical prostatectomy in a cohort of 395 men with low- to intermediate-risk prostate cancer at biopsies (Klein, Cooperberg et al. 2014). In addition, Irshad et al. identified a 3-gene signature of FGFR1, PMP22 and CDKN1A, which could accurately predict the outcome of low Gleason score prostate cancer in different cohorts (Irshad, Bansal et al. 2013). For clinical implementation and validation this group applied immunohistochemistry for the respective proteins. In a limited matched cohort of 43 low-risk prostate cancer patients on active surveillance they were perfectly able to identify patients with failure upon active surveillance by reduced expression of these 3 proteins. Gene-based signatures therefore are a promising tool for risk stratification and might gain wider application if translation to easy-to-use procedures such as immunohistochemistry is available.
Chap
ter 1
Proefschrift#8_DEF.indd 22 25-08-15 16:42

23
3.10 Biopsy markers without prognostic valueWhile numerous markers have been shown to correlate with adverse clinico-pathologic parameters on radical prostatectomy, just a limited number of these has been investigated in pre-treatment needle-biopsies. Briefly, we also want to mention markers that have been investigated on biopsies but did not show additional value. In a group of 91 prostate cancer needle-biopsies, Bax, Bcl-2 and Cox-2 did not show independent predictive value for disease-free survival, although Cox-2 was predictive in univariate analysis (Rubio, Ramos et al. 2005). On a large cohort of 247 patients with primary endocrine treatment, Tolonen et al. demonstrated that minichromosome maintenance protein 7 (MCM7) was a significant albeit not independent marker for disease-progression (Tolonen, Tammela et al. 2011). We validated the prognostic value of Cystein-rich secretory protein 3 (CRISP-3) and β-Microseminoprotein (β-MSP) in a screening cohort of 174 men. We found that expression of these markers was correlated with Gleason score, tumor volume, and pT-stage and significant disease on subsequent radical prostatectomy samples, but were not able to predict recurrence (Hoogland, Dahlman et al. 2011).
3.12 Summary�� The cell proliferation marker Ki-67 (MIB-1) is the best studied
immunohistochemical marker in prostate with independent prognostic value in multiple studies.
�� Cyclin-dependent kinase inhibitor p27 and Polycomb-group protein EZH2 are both promising immunohistochemical markers for predicting disease-outcome.
�� The clinical significance of TMPRSS:ERG fusion or ERG protein over-expression is still controversial, although some studies demonstrate adverse prognostic value in active surveillance/ watchful waiting cohorts.
�� Amplification of c-MYC, PTEN loss and APC hypermethylation are promising markers for predicting disease-specific death, albeit only demonstrated in a small number of biopsy cohorts.
�� Identification of complex gene signatures offers novel promising platforms for predicting disease-outcome. Routine implementation in local pathology laboratories is currently not applicable.
Chap
ter 1
Chapter 1: Prognostic Histopathological and Molecular Markers on Prostate Cancer Needle-Biopsies: a review
Proefschrift#8_DEF.indd 23 25-08-15 16:42

24 Discovery and Validation of Prognostic Tissue Markers in Clinical Prostate Cancer – © 2015, A.M. Hoogland
Figure 1. A) intraductal carcinoma of the prostate (100x magnification).B) 34BE12 immunohistochemistry, demonstrating the presence of basal cells supportive for intraductal carcinoma (100x magnification). C) cribriform growth pattern of Gleason grade 4 adenocarcinoma (200x magnification).
Chap
ter 1
Proefschrift#8_DEF.indd 24 25-08-15 16:42

25
Scope of the thesis
Investigation of potential novel predictive markers in prostate cancer needle-biopsies is of importance to affect clinical decision-making and to be implemented in daily practice. A prerequisite in analyzing novel markers on needle-biopsies is the presence of well-characterized patient cohorts with clinical follow-up and availability of prostate cancer tissue for actual testing. Secondary and tertiary cancer centers often do not have original tissue blocks for further research on site. In addition, small foci of prostate cancer are often not present anymore in the remaining paraffin block. Incorporation of both detailed histopathological prostate cancer features and molecular markers can support optimal therapeutic decision-making in individual patients.
As described in chapter 1, comprehensive reporting of novel histopatho-logical parameters such as percentage Gleason grade 4/5, intraductal carcinoma and potentially Gleason grade 4 growth pattern, is a fast and cheap way to better estimate a prostate cancer’s future clinical behavior in daily practice. Various molecular markers such as Ki-67, p27, EZH2 and ERG immunohistochemistry improve pathologic diagnosis. The variability in patient cohorts, clinical endpoints, technical methodology and quantification, however, require prospective studies in well-characterized patient groups before implementation in daily practice is feasible. Identification of complex gene-signatures is a recent and promising tool in stratification of prostate cancer patients, though still costly and not easily applicable in daily practice.
Besides previously described prognostic markers, technologies such as laser capture microdissection, RNA sequencing and tissue microarrays, provided opportunities to discover novel biomarkers.
The scope of this thesis is to evaluate previously described and novel candidate prognostic markers on tissue samples for prostate cancer clinical behavior. Currently, a large number of prostate cancer prognostic (tissue-) markers are reported, which could enable a more accurate prediction of the tumor’s behavior. However, most of these markers have only been validated on radical prostatectomy samples from patients who were treated with surgery for their disease. To have a significant effect on the clinical decision-making process, it is essential to validate these promising markers on prostate needle-biopsies. Therefore, we analyzed two promising markers, cysteine-rich secretory protein 3 (CRISP-3) and β-microseminoprotein (β-MSP), in chapter 2 on a large cohort of prostate needle biopsies. Both markers
Chap
ter 1
Chapter 1: Prognostic Histopathological and Molecular Markers on Prostate Cancer Needle-Biopsies: a review
Proefschrift#8_DEF.indd 25 25-08-15 16:42

26 Discovery and Validation of Prognostic Tissue Markers in Clinical Prostate Cancer – © 2015, A.M. Hoogland
have an independent predictive value for biochemical recurrence after radical prostatectomy for prostate cancer. These markers can make a contribution to the clinical treatment decision-making process.
The prognostic relevance of expression of ERG, a product from the TMPRSS2-ERG fusion in prostate cancer, is reported in the medical literature with varying outcomes, partly due to the use of different techniques to detect ERG expression, such as fluorescence in-situ hybridization (FISH) or quantitative polymerase chain reaction (QPCR). Recently, an immunohistochemical antibody against the ERG protein was described. In chapter 3, we hypothesized that this immunohistochemical antibody provides a relatively easy and objective means to detect and score ERG protein expression and that ERG protein expression in prostate cancer predicts prostate cancer recurrence and progression after radical prostatectomy. We found no associations between ERG expression and Gleason score and ERG expression had no predictive value for tumor recurrence or mortality after radical prostatectomy.
EZH2, α2-Integrin, α6-Integrin, CD117, CD133 and OCT3/4 are known stem cell markers and are used to select for or indicate the presence of tumor stem cells. We hypothesized that if these markers will identify stem cells in clinical prostate cancer, they will be expressed in a low percentage of the tumor cells and their expression will increase with increasing tumor grade.
In chapter 4 we analyzed the expression of putative stem cell markers in a large set of clinical prostate cancer radical prostatectomy specimens and to correlate their expression with clinicopathologic parameters. The expression of α2-Integrin and EZH2 in a small fraction of tumor cells is in line with their putative limited expression as stem cell marker. α2-Integrin expression is associated with high serum PSA. EZH2 expression is associated with high Gleason score and with biochemical recurrence after radical prostatectomy. α6-integrin was not a unique stem cell marker in our patient cohort, however the strong statistically association of α6-Integrin with non-aggressive characteristics is striking.
Chap
ter 1
Proefschrift#8_DEF.indd 26 25-08-15 16:42

27
One of the essential drawbacks of biopsies is that needle biopsies only represent a small proportion of the entire prostate tumor. For low grade cancers in diagnostic biopsies, it is difficult to exclude the presence of higher Gleason grades in the tumor, missed by the biopsies. We hypothesized that Gleason grade 3 cancer cells are different when among other Gleason 3 ducts as compared to located next to Gleason grade 4 cancer cells. If so, we expect to find differentially expressed transcripts that could serve as biomarkers for low grade tumors that are surrounded by higher grade cancer. In chapter 5 we used laser capture microdissection and RNA sequencing to show that there are genes differentially expressed in prostate cancer glands with Gleason grade 3 in tumors with Gleason score 3+3=6, compared to Gleason grade 3 glands in tumors with Gleason score 3+4=7 or 4+3=7. These differentially expressed genes might provide tissue markers to predict potential aggressive behavior of low grade tumor glands in biopsies to better assess the best therapy for the patient.
In chapter 6, we evaluate all our findings and describe their relevance in the context of prognostic tissue biomarkers for prostate cancer and their clinical applications and potentials.
Chap
ter 1
Chapter 1: Prognostic Histopathological and Molecular Markers on Prostate Cancer Needle-Biopsies: a review
Proefschrift#8_DEF.indd 27 25-08-15 16:42

28 Discovery and Validation of Prognostic Tissue Markers in Clinical Prostate Cancer – © 2015, A.M. Hoogland
References1. Epstein, J.I., et al., The 2005 International Society of Urological Pathology (ISUP) Consensus
Conference on Gleason Grading of Prostatic Carcinoma. Am J Surg Pathol, 2005. 29(9): p. 1228-42.
2. Van der Kwast, T., et al., Guidelines on processing and reporting of prostate biopsies: the 2013 update of the pathology committee of the European Randomized Study of Screening for Prostate Cancer (ERSPC). Virchows Arch, 2013. 463(3): p. 367-77.
3. Cooperberg, M.R., J.M. Broering, and P.R. Carroll, Time trends and local variation in primary treatment of localized prostate cancer. J Clin Oncol, 2010. 28(7): p. 1117-23.
4. Cooperberg, M.R., P.R. Carroll, and L. Klotz, Active surveillance for prostate cancer: progress and promise. J Clin Oncol, 2011. 29(27): p. 3669-76.
5. Soloway, M.S., et al., Careful selection and close monitoring of low-risk prostate cancer patients on active surveillance minimizes the need for treatment. Eur Urol, 2010. 58(6): p. 831-5.
6. Tosoian, J.J., et al., Active surveillance program for prostate cancer: an update of the Johns Hopkins experience. J Clin Oncol, 2011. 29(16): p. 2185-90.
7. van As, N.J., et al., Predicting the probability of deferred radical treatment for localised prostate cancer managed by active surveillance. Eur Urol, 2008. 54(6): p. 1297-305.
8. van den Bergh, R.C., et al., Outcomes of men with screen-detected prostate cancer eligible for active surveillance who were managed expectantly. Eur Urol, 2009. 55(1): p. 1-8.
9. Egevad, L., et al., Standardization of Gleason grading among 337 European pathologists. Histopathology, 2013. 62(2): p. 247-56.
10. McKenney, J.K., et al., The potential impact of reproducibility of Gleason grading in men with early stage prostate cancer managed by active surveillance: a multi-institutional study. J Urol, 2011. 186(2): p. 465-9.
11. Gleason, D.F., Classification of prostatic carcinomas. Cancer Chemother Rep, 1966. 50(3): p. 125-8.
12. Epstein, J.I., An update of the Gleason grading system. J Urol, 2010. 183(2): p. 433-40.
13. Latour, M., et al., Grading of invasive cribriform carcinoma on prostate needle biopsy: an interobserver study among experts in genitourinary pathology. Am J Surg Pathol, 2008. 32(10): p. 1532-9.
14. Lotan, T.L. and J.I. Epstein, Gleason grading of prostatic adenocarcinoma with glomeruloid features on needle biopsy. Hum Pathol, 2009. 40(4): p. 471-7.
15. Billis, A., et al., The impact of the 2005 international society of urological pathology consensus conference on standard Gleason grading of prostatic carcinoma in needle biopsies. J Urol, 2008. 180(2): p. 548-52; discussion 552-3.
16. Helpap, B. and L. Egevad, The significance of modified Gleason grading of prostatic carcinoma in biopsy and radical prostatectomy specimens. Virchows Arch, 2006. 449(6): p. 622-7.
17. Zareba, P., et al., The impact of the 2005 International Society of Urological Pathology (ISUP) consensus on Gleason grading in contemporary practice. Histopathology, 2009. 55(4): p. 384-91.
Chap
ter 1
Proefschrift#8_DEF.indd 28 25-08-15 16:42

29
18. Uemura, H., et al., Usefulness of the 2005 International Society of Urologic Pathology Gleason grading system in prostate biopsy and radical prostatectomy specimens. BJU Int, 2009. 103(9): p. 1190-4.
19. Epstein, J.I., et al., Upgrading and downgrading of prostate cancer from biopsy to radical prostatectomy: incidence and predictive factors using the modified Gleason grading system and factoring in tertiary grades. Eur Urol, 2012. 61(5): p. 1019-24.
20. Moussa, A.S., et al., A nomogram for predicting upgrading in patients with low- and intermediate-grade prostate cancer in the era of extended prostate sampling. BJU Int, 2010. 105(3): p. 352-8.
21. Moussa, A.S., et al., Prostate biopsy clinical and pathological variables that predict significant grading changes in patients with intermediate and high grade prostate cancer. BJU Int, 2009. 103(1): p. 43-8.
22. Visapaa, H., et al., The proportion of free PSA and upgrading of biopsy Gleason score after radical prostatectomy. Urol Int, 2010. 84(4): p. 378-81.
23. Phillips, J.G., et al., The Effect of Differing Gleason Scores at Biopsy on the Odds of Upgrading and the Risk of Death From Prostate Cancer. Clin Genitourin Cancer, 2014.
24. Whitson, J.M., et al., Factors associated with downgrading in patients with high grade prostate cancer. Urol Oncol, 2013. 31(4): p. 442-7.
25. Pierorazio, P.M., et al., Preoperative characteristics of high-Gleason disease predictive of favourable pathological and clinical outcomes at radical prostatectomy. BJU Int, 2012. 110(8): p. 1122-8.
26. Busch, J., et al., Value of prostate specific antigen density and percent free prostate specific antigen for prostate cancer prognosis. J Urol, 2012. 188(6): p. 2165-70.
27. Forgues, A., et al., Oncologic outcomes after minimally invasive radical prostatectomy in patients with seminal vesicle invasion (pT3b) without adjuvant therapy. World J Urol, 2014. 32(2): p. 519-24.
28. Meeks, J.J., et al., Clinically significant prostate cancer is rarely missed by ablative procedures of the prostate in men with prostate specific antigen less than 4 ng/ml. J Urol, 2013. 189(1): p. 111-5.
29. Tollefson, M.K., et al., Prostate cancer Ki-67 (MIB-1) expression, perineural invasion, and gleason score as biopsy-based predictors of prostate cancer mortality: the Mayo model. Mayo Clin Proc, 2014. 89(3): p. 308-18.
30. Steyerberg, E.W., et al., Prediction of indolent prostate cancer: validation and updating of a prognostic nomogram. J Urol, 2007. 177(1): p. 107-12; discussion 112.
31. van den Bergh, R.C., et al., Novel Tools to Improve Patient Selection and Monitoring on Active Surveillance for Low-risk Prostate Cancer: A Systematic Review. Eur Urol, 2014. 65(6): p. 1023-1031.
32. Dall’Era, M.A., et al., Active surveillance for prostate cancer: a systematic review of the literature. Eur Urol, 2012. 62(6): p. 976-83.
33. Freedland, S.J., et al., The percentage of prostate needle biopsy cores with carcinoma from the more involved side of the biopsy as a predictor of prostate specific antigen recurrence after radical prostatectomy: results from the Shared Equal Access Regional Cancer Hospital (SEARCH) database. Cancer, 2003. 98(11): p. 2344-50.
Chap
ter 1
Chapter 1: Prognostic Histopathological and Molecular Markers on Prostate Cancer Needle-Biopsies: a review
Proefschrift#8_DEF.indd 29 25-08-15 16:42

30 Discovery and Validation of Prognostic Tissue Markers in Clinical Prostate Cancer – © 2015, A.M. Hoogland
34. Freedland, S.J., et al., Percent of prostate needle biopsy cores with cancer is significant independent predictor of prostate specific antigen recurrence following radical prostatectomy: results from SEARCH database. J Urol, 2003. 169(6): p. 2136-41.
35. Linson, P.W., et al., Percentage of core lengths involved with prostate cancer: does it add to the percentage of positive prostate biopsies in predicting postoperative prostate-specific antigen outcome for men with intermediate-risk prostate cancer? Urology, 2002. 59(5): p. 704-8.
36. Nelson, C.P., et al., Contemporary preoperative parameters predict cancer-free survival after radical prostatectomy: a tool to facilitate treatment decisions. Urol Oncol, 2003. 21(3): p. 213-8.
37. Vis, A.N., et al., Should we replace the Gleason score with the amount of high-grade prostate cancer? Eur Urol, 2007. 51(4): p. 931-9.
38. Vance, S.M., et al., Percentage of cancer volume in biopsy cores is prognostic for prostate cancer death and overall survival in patients treated with dose-escalated external beam radiotherapy. Int J Radiat Oncol Biol Phys, 2012. 83(3): p. 940-6.
39. Williams, S.G., et al., Percentage of biopsy cores positive for malignancy and biochemical failure following prostate cancer radiotherapy in 3,264 men: statistical significance without predictive performance. Int J Radiat Oncol Biol Phys, 2008. 70(4): p. 1169-75.
40. Freedland, S.J., et al., Preoperative model for predicting prostate specific antigen recurrence after radical prostatectomy using percent of biopsy tissue with cancer, biopsy Gleason grade and serum prostate specific antigen. J Urol, 2004. 171(6 Pt 1): p. 2215-20.
41. Huland, H., et al., Preoperative prediction of tumor heterogeneity and recurrence after radical prostatectomy for localized prostatic carcinoma with digital rectal, examination prostate specific antigen and the results of 6 systematic biopsies. J Urol, 1996. 155(4): p. 1344-7.
42. Ravery, V., et al., Percentage of cancer on biopsy cores accurately predicts extracapsular extension and biochemical relapse after radical prostatectomy for T1-T2 prostate cancer. Eur Urol, 2000. 37(4): p. 449-55.
43. Huang, J., et al., Percentage of positive biopsy cores: a better risk stratification model for prostate cancer? Int J Radiat Oncol Biol Phys, 2012. 83(4): p. 1141-8.
44. Karram, S., et al., Should intervening benign tissue be included in the measurement of discontinuous foci of cancer on prostate needle biopsy? Correlation with radical prostatectomy findings. Am J Surg Pathol, 2011. 35(9): p. 1351-5.
45. Schultz, L., et al., Discontinuous foci of cancer in a single core of prostatic biopsy: when it occurs and performance of quantification methods in a private-practice setting. Am J Surg Pathol, 2013. 37(12): p. 1831-6.
46. Van der Kwast, T.H. and M.J. Roobol, Defining the threshold for significant versus insignificant prostate cancer. Nat Rev Urol, 2013. 10(8): p. 473-82.
47. Harnden, P., et al., The prognostic significance of perineural invasion in prostatic cancer biopsies: a systematic review. Cancer, 2007. 109(1): p. 13-24.
48. Rubin, M.A., et al., Prostate needle biopsy reporting: how are the surgical members of the Society of Urologic Oncology using pathology reports to guide treatment of prostate cancer patients? Am J Surg Pathol, 2004. 28(7): p. 946-52.
49. Quinn, D.I., et al., Prognostic significance of preoperative factors in localized prostate carcinoma treated with radical prostatectomy: importance of percentage of biopsies that contain tumor and the presence of biopsy perineural invasion. Cancer, 2003. 97(8): p. 1884-93.
Chap
ter 1
Proefschrift#8_DEF.indd 30 25-08-15 16:42

31
50. DeLancey, J.O., et al., Evidence of perineural invasion on prostate biopsy specimen and survival after radical prostatectomy. Urology, 2013. 81(2): p. 354-7.
51. Pickup, M. and T.H. Van der Kwast, My approach to intraductal lesions of the prostate gland. J Clin Pathol, 2007. 60(8): p. 856-65.
52. Robinson, B.D. and J.I. Epstein, Intraductal carcinoma of the prostate without invasive carcinoma on needle biopsy: emphasis on radical prostatectomy findings. The Journal of urology, 2010. 184(4): p. 1328-1333.
53. Cohen, R.J., et al., Prediction of pathological stage and clinical outcome in prostate cancer: an improved pre-operative model incorporating biopsy-determined intraductal carcinoma. Br J Urol, 1998. 81(3): p. 413-8.
54. Efstathiou, E., et al., Morphologic characterization of preoperatively treated prostate cancer: toward a post-therapy histologic classification. Eur Urol, 2010. 57(6): p. 1030-8.
55. Van der Kwast, T., et al., Biopsy diagnosis of intraductal carcinoma is prognostic in intermediate and high risk prostate cancer patients treated by radiotherapy. Eur J Cancer, 2012. 48(9): p. 1318-25.
56. Epstein, J.I., Prostatic ductal adenocarcinoma: a mini review. Med Princ Pract, 2010. 19(1): p. 82-5.
57. Dong, F., et al., Architectural heterogeneity and cribriform pattern predict adverse clinical outcome for Gleason grade 4 prostatic adenocarcinoma. Am J Surg Pathol, 2013. 37(12): p. 1855-61.
58. Berney, D.M., et al., Variation in reporting of cancer extent and benign histology in prostate biopsies among European pathologists. Virchows Arch, 2014. 464(5): p. 583-7.
59. Sica, A., et al., Tumour-associated macrophages are a distinct M2 polarised population promoting tumour progression: potential targets of anti-cancer therapy. Eur J Cancer, 2006. 42(6): p. 717-27.
60. Nonomura, N., et al., Infiltration of tumour-associated macrophages in prostate biopsy specimens is predictive of disease progression after hormonal therapy for prostate cancer. BJU Int, 2011. 107(12): p. 1918-22.
61. Fisher, G., et al., Prognostic value of Ki-67 for prostate cancer death in a conservatively managed cohort. Br J Cancer, 2013. 108(2): p. 271-7.
62. Rubio, J., et al., Immunohistochemical expression of Ki-67 antigen, cox-2 and Bax/Bcl-2 in prostate cancer; prognostic value in biopsies and radical prostatectomy specimens. Eur Urol, 2005. 48(5): p. 745-51.
63. Tolonen, T.T., et al., Histopathological variables and biomarkers enhancer of zeste homologue 2, Ki-67 and minichromosome maintenance protein 7 as prognosticators in primarily endocrine-treated prostate cancer. BJU Int, 2011. 108(9): p. 1430-8.
64. Vis, A.N., et al., Value of tissue markers p27(kip1), MIB-1, and CD44s for the pre-operative prediction of tumour features in screen-detected prostate cancer. J Pathol, 2002. 197(2): p. 148-54.
65. Wolters, T., et al., The value of EZH2, p27(kip1), BMI-1 and MIB-1 on biopsy specimens with low-risk prostate cancer in selecting men with significant prostate cancer at prostatectomy. BJU Int, 2009.
66. Zellweger, T., et al., Tumour growth fraction measured by immunohistochemical staining of Ki67 is an independent prognostic factor in preoperative prostate biopsies with small-volume or low-grade prostate cancer. Int J Cancer, 2009. 124(9): p. 2116-23.
Chap
ter 1
Chapter 1: Prognostic Histopathological and Molecular Markers on Prostate Cancer Needle-Biopsies: a review
Proefschrift#8_DEF.indd 31 25-08-15 16:42

32 Discovery and Validation of Prognostic Tissue Markers in Clinical Prostate Cancer – © 2015, A.M. Hoogland
67. Thomas, G.V., et al., Preoperative prostate needle biopsy p27 correlates with subsequent radical prostatectomy p27, Gleason grade and pathological stage. J Urol, 2000. 164(6): p. 1987-91.
68. Sellers, W.R. and M. Loda, The EZH2 polycomb transcriptional repressor--a marker or mover of metastatic prostate cancer? Cancer Cell, 2002. 2(5): p. 349-50.
69. Varambally, S., et al., The polycomb group protein EZH2 is involved in progression of prostate cancer. Nature, 2002. 419(6907): p. 624-9.
70. Behrens, C., et al., EZH2 protein expression associates with the early pathogenesis, tumor progression, and prognosis of non-small cell lung carcinoma. Clin Cancer Res, 2013. 19(23): p. 6556-65.
71. Deb, G., V.S. Thakur, and S. Gupta, Multifaceted role of EZH2 in breast and prostate tumorigenesis: epigenetics and beyond. Epigenetics, 2013. 8(5): p. 464-76.
72. Roh, S., et al., EZH2 expression in invasive lobular carcinoma of the breast. World J Surg Oncol, 2013. 11: p. 299.
73. Liu, Y., et al., Increased EZH2 expression is associated with proliferation and progression of cervical cancer and indicates a poor prognosis. Int J Gynecol Pathol, 2014. 33(3): p. 218-24.
74. Hayashi, A., et al., Clinicopathological and prognostic significance of EZH2 expression in upper urinary tract carcinoma. Virchows Arch, 2014. 464(4): p. 463-71.
75. Lee, H.J., et al., Polycomb protein EZH2 expression in diffuse large B-cell lymphoma is associated with better prognosis in patients treated with rituximab, cyclophosphamide, doxorubicin, vincristine and prednisone. Leuk Lymphoma, 2014.
76. Hoogland, A.M., et al., Validation of stem cell markers in clinical prostate cancer: alpha6-integrin is predictive for non-aggressive disease. Prostate, 2014. 74(5): p. 488-96.
77. Laitinen, S., et al., EZH2, Ki-67 and MCM7 are prognostic markers in prostatectomy treated patients. Int J Cancer, 2008. 122(3): p. 595-602.
78. van Leenders, G.J., et al., Polycomb-group oncogenes EZH2, BMI1, and RING1 are overexpressed in prostate cancer with adverse pathologic and clinical features. Eur Urol, 2007. 52(2): p. 455-63.
79. Tomlins, S.A., et al., Recurrent fusion of TMPRSS2 and ETS transcription factor genes in prostate cancer. Science, 2005. 310(5748): p. 644-8.
80. Shah, R.B., Clinical applications of novel ERG immunohistochemistry in prostate cancer diagnosis and management. Adv Anat Pathol, 2013. 20(2): p. 117-24.
81. Hossain, D. and D.G. Bostwick, Significance of the TMPRSS2:ERG gene fusion in prostate cancer. BJU Int, 2013. 111(5): p. 834-5.
82. Hessels, D. and J.A. Schalken, Recurrent gene fusions in prostate cancer: their clinical implications and uses. Curr Urol Rep, 2013. 14(3): p. 214-22.
83. Xu, B., et al., The prognostic role of ERG immunopositivity in prostatic acinar adenocarcinoma: a study including 454 cases and review of the literature. Hum Pathol, 2014. 45(3): p. 488-97.
84. Barros-Silva, J.D., et al., Relative 8q gain predicts disease-specific survival irrespective of the TMPRSS2-ERG fusion status in diagnostic biopsies of prostate cancer. Genes Chromosomes Cancer, 2011. 50(8): p. 662-71.
85. Andrews, C. and P.A. Humphrey, Utility of ERG Versus AMACR Expression in Diagnosis of Minimal Adenocarcinoma of the Prostate in Needle Biopsy Tissue. Am J Surg Pathol, 2014.
Chap
ter 1
Proefschrift#8_DEF.indd 32 25-08-15 16:42

33
86. Bjartell, A., et al., Tumour markers in prostate cancer II: diagnostic and prognostic cellular biomarkers. Acta Oncol, 2011. 50 Suppl 1: p. 76-84.
87. Boran, C., et al., Reliability of the 34betaE12, keratin 5/6, p63, bcl-2, and AMACR in the diagnosis of prostate carcinoma. Urol Oncol, 2011. 29(6): p. 614-23.
88. Dabir, P.D., et al., Comparative analysis of three- and two-antibody cocktails to AMACR and basal cell markers for the immunohistochemical diagnosis of prostate carcinoma. Diagn Pathol, 2012. 7: p. 81.
89. Pavlakis, K., et al., Evaluation of routine application of P504S, 34betaE12 and p63 immunostaining on 250 prostate needle biopsy specimens. Int Urol Nephrol, 2010. 42(2): p. 325-30.
90. van Leenders, G.J., et al., Antibody EPR3864 is specific for ERG genomic fusions in prostate cancer: implications for pathological practice. Mod Pathol, 2011. 24(8): p. 1128-38.
91. Berg, K.D., et al., ERG Protein Expression in Diagnostic Specimens Is Associated with Increased Risk of Progression During Active Surveillance for Prostate Cancer. Eur Urol, 2014.
92. Hagglof, C., et al., TMPRSS2-ERG expression predicts prostate cancer survival and associates with stromal biomarkers. PLoS One, 2014. 9(2): p. e86824.
93. Park, K., et al., Antibody-based detection of ERG rearrangement-positive prostate cancer. Neoplasia, 2010. 12(7): p. 590-8.
94. Abrahamsson, P.A., Neuroendocrine cells in tumour growth of the prostate. Endocr Relat Cancer, 1999. 6(4): p. 503-19.
95. di Sant’Agnese, P.A., Neuroendocrine differentiation in carcinoma of the prostate. Diagnostic, prognostic, and therapeutic implications. Cancer, 1992. 70(1 Suppl): p. 254-68.
96. Di Sant’Agnese, P.A. and A.T. Cockett, The prostatic endocrine-paracrine (neuroendocrine) regulatory system and neuroendocrine differentiation in prostatic carcinoma: a review and future directions in basic research. J Urol, 1994. 152(5 Pt 2): p. 1927-31.
97. Krauss, D.J., et al., Chromogranin A staining as a prognostic variable in newly diagnosed Gleason score 7-10 prostate cancer treated with definitive radiotherapy. Prostate, 2014. 74(5): p. 520-7.
98. Krauss, D.J., et al., Prognostic significance of neuroendocrine differentiation in patients with Gleason score 8-10 prostate cancer treated with primary radiotherapy. Int J Radiat Oncol Biol Phys, 2011. 81(3): p. e119-25.
99. Boxer, L.M. and C.V. Dang, Translocations involving c-myc and c-myc function. Oncogene, 2001. 20(40): p. 5595-610.
100. Gurel, B., et al., Nuclear MYC protein overexpression is an early alteration in human prostate carcinogenesis. Mod Pathol, 2008. 21(9): p. 1156-67.
101. Ribeiro, F.R., et al., Relative copy number gain of MYC in diagnostic needle biopsies is an independent prognostic factor for prostate cancer patients. Eur Urol, 2007. 52(1): p. 116-25.
102. Zafarana, G., et al., Copy number alterations of c-MYC and PTEN are prognostic factors for relapse after prostate cancer radiotherapy. Cancer, 2012. 118(16): p. 4053-62.
103. Bastacky, S., et al., Use of interphase fluorescence in situ hybridization in prostate needle biopsy specimens with isolated high-grade prostatic intraepithelial neoplasia as a predictor of prostate adenocarcinoma on follow-up biopsy. Hum Pathol, 2004. 35(3): p. 281-9.
Chap
ter 1
Chapter 1: Prognostic Histopathological and Molecular Markers on Prostate Cancer Needle-Biopsies: a review
Proefschrift#8_DEF.indd 33 25-08-15 16:42

34 Discovery and Validation of Prognostic Tissue Markers in Clinical Prostate Cancer – © 2015, A.M. Hoogland
104. Uzoh, C.C., et al., PTEN-mediated pathways and their association with treatment-resistant prostate cancer. BJU Int, 2009. 104(4): p. 556-61.
105. Cuzick, J., et al., Prognostic value of PTEN loss in men with conservatively managed localised prostate cancer. Br J Cancer, 2013. 108(12): p. 2582-9.
106. Henrique, R., et al., High promoter methylation levels of APC predict poor prognosis in sextant biopsies from prostate cancer patients. Clin Cancer Res, 2007. 13(20): p. 6122-9.
107. Klein, E.A., et al., A 17-gene Assay to Predict Prostate Cancer Aggressiveness in the Context of Gleason Grade Heterogeneity, Tumor Multifocality, and Biopsy Undersampling. Eur Urol, 2014.
108. Irshad, S., et al., A molecular signature predictive of indolent prostate cancer. Sci Transl Med, 2013. 5(202): p. 202ra122.
109. Hoogland, A.M., et al., Cysteine-rich secretory protein 3 and beta-microseminoprotein on prostate cancer needle biopsies do not have predictive value for subsequent prostatectomy outcome. BJU Int, 2011. 108(8): p. 1356-62.
Chap
ter 1
Proefschrift#8_DEF.indd 34 25-08-15 16:42

35
Proefschrift#8_DEF.indd 35 25-08-15 16:42

36 Discovery and Validation of Prognostic Tissue Markers in Clinical Prostate Cancer – © 2015, A.M. Hoogland
Proefschrift#8_DEF.indd 36 25-08-15 16:42

37
Chapter 2:
Cysteine-rich secretory protein 3 and β-microseminoprotein on prostate cancer needle
biopsies do not have predictive value for subsequent prostatectomy outcome
A. Marije Hooglanda, Anna Dahlmanb, Kees J. Vissersa, Tineke Woltersc, Fritz H. Schröderc, Monique J. Roobolc, Anders S. Bjartellb, Geert J.L.H. van Leendersa
Department of Pathologya and Urologyc, Erasmus Medical Center, Rotterdam, The Netherlands; Department of Urologyb, Skåne University Hospital Malmö, Lund
University, Malmö, Sweden
Hoogland AM, Dahlman A, Vissers KJ, Wolters T, Schröder FH, Roobol MJ, Bjartell AS, van Leenders GJ. “Cysteine-rich secretory protein 3 and
β-microseminoprotein on prostate cancer needle biopsies do not have predictive value for subsequent prostatectomy outcome.”, BJU Int. 2011.108(8):1356-62.
Chap
ter 2
Chapter 2: Cysteine-rich secretory protein 3 and β-microseminoprotein on prostate cancer needle biopsies do not have predictive value for subsequent prostatectomy outcome
Proefschrift#8_DEF.indd 37 25-08-15 16:42

38 Discovery and Validation of Prognostic Tissue Markers in Clinical Prostate Cancer – © 2015, A.M. Hoogland
Abstract
Background and objective: Tissue expression of cysteine-rich secretory protein 3 (CRISP-3) and β-microseminoprotein (β-MSP) have an independent predictive value for biochemical recurrence after radical prostatectomy for prostate cancer.
It is not known whether CRISP-3 and β-MSP also have prognostic value in diagnostic prostate needle-biopsies. In the current study we have investigated expression levels and prognostic value of both markers in diagnostic biopsies, in order to evaluate their potential clinical implementation in a pre-operative setting.
Methods: A total of 174 participants of the European Randomized Study of Screening for Prostate Cancer (ERSPC), Rotterdam section, treated by radical prostatectomy for prostate cancer were included in this study. CRISP-3 and β-MSP immunohistochemistry was performed on corresponding diagnostic needle-biopsies. Outcome was correlated with clinico-pathologic parameters (PSA, number of positive biopsies; Gleason score, pT-stage and surgical margins at radical prostatectomy) and significant prostate cancer at radical prostatectomy (pT3/ 4, or Gleason score >6, or tumour volume ≥0.5 ml) in the total cohort (n=174) and in a subgroup with low-risk features at biopsy (PSA ≤10 ng/ml, cT ≤2, PSA density <0.20 ng/ml/g, Gleason score <7 and ≤2 positive biopsy cores; (n=87)).
Results: β-MSP and CRISP-3 expression in prostate cancer tissue was heterogeneous with variable staining intensities occurring in the same tissue specimen. While high expression of β-MSP significantly correlated with Gleason score <7 at radical prostatectomy, it was not a predictor for significant prostate cancer at radical prostatectomy neither in the total group (n=174; OR 0.319; 95%CI 0.060-1.695; p=0.180) nor in the low-risk group (n=87; OR 0.227; 95% CI 0.040-1.274; p=0.092). CRISP-3 expression was not related with clinico-pathologic parameters, and did not predict significant prostate cancer at radical prostatectomy in the total group (n=174; OR 1.056; 95% CI 0.438-2.545; p=0.904) or the low-risk group (n=87; OR 1.856; 95% CI 0.626-5.506; p=0.265).
Conclusions: Decreased β-MSP expression correlated with high Gleason score in subsequent radical prostatectomy tissue specimens supporting the view that β-MSP exerts a tumour-suppressive effect. We were not able to find a significant prognostic value of β-MSP or CRISP-3 in prostate needle-biopsies for significant prostate cancer at radical prostatectomy. Therefore, β-MSP or CRISP-3 do not seem to have additional value in therapeutic stratification of prostate cancer patients.
Chap
ter 2
Proefschrift#8_DEF.indd 38 25-08-15 16:42

39
Introduction
Prostate cancer is the most commonly diagnosed cancer in men in Western countries, accounting for 25% of new cases and approximately 9% of male cancer deaths in 2009 (Jemal, Siegel et al. 2009). The disease course of prostate cancer is highly variable with many tumours growing slowly and without apparent clinical symptoms, while others progress to life-threatening metastatic disease. For a large group of patients, it is difficult to determine the tumour’s aggressive potential by currently available diagnostic tools (Wolters, Vissers et al. 2009; Sorensen and Orntoft 2010), especially the patients with Gleason Score 3+3=6 at biopsy. Therefore, additional parameters are warranted to allow more accurate stratification of prostate cancer patients for conservative treatment, active surveillance or other watchful waiting strategies. During the last decade, several markers, like EZH2, p27kip-1, vimentin, e-cadherin, n-cadherin, Androgen Receptor (AR) and MIB-1 have been investigated for their prognostic value in prostate cancer (Kuczyk and Machtens 1999; Moul 1999; Freedland, deGregorio et al. 2003; Gravdal, Halvorsen et al. 2007; van Leenders, Dukers et al. 2007; Wu, Wang et al. 2007; Romics, Banfi et al. 2008; Wolters, Vissers et al. 2009; Zhang, Helfand et al. 2009; Donovan, Osman et al. 2010). Most of these markers were analysed using tissue specimens derived from radical prostatectomy, while subsequent validation on diagnostic needle-biopsies, which are more useful for therapeutic decision-making, rarely occurs. Using radical prostatectomy specimens, human cysteine-rich secretory protein 3 (CRISP-3) and β-microseminoprotein (β-MSP) have previously been linked to biochemical recurrence of prostate cancer, and β-MSP in particular has been reported as an independent predictive biomarker.
CRISP-3, also known as Specific Granule Protein of 28 kD (SGP28) was originally discovered in intracellular granules of neutrophilic granulocytes and is present in exocrine secretions from several other organs (Udby, Calafat et al. 2002; Udby, Bjartell et al. 2005; Udby, Lundwall et al. 2005; Bjartell, Johansson et al. 2006; Bjartell, Al-Ahmadie et al. 2007). While CRISP-3 function is not entirely elucidated yet, it may have a role in reproduction and innate immunity (Udby, Calafat et al. 2002; Udby, Bjartell et al. 2005; Bjartell, Johansson et al. 2006; Bjartell, Al-Ahmadie et al. 2007). Since CRISP-3 mRNA is over-expressed in moderately and poorly differentiated prostate cancer, relative to benign prostatic epithelium, it has gained interest as a diagnostic and prognostic marker in this malignancy (Kosari, Asmann et al. 2002).
Chap
ter 2
Chapter 2: Cysteine-rich secretory protein 3 and β-microseminoprotein on prostate cancer needle biopsies do not have predictive value for subsequent prostatectomy outcome
Proefschrift#8_DEF.indd 39 25-08-15 16:42

40 Discovery and Validation of Prognostic Tissue Markers in Clinical Prostate Cancer – © 2015, A.M. Hoogland
β-MSP, also known as Prostate Secretory Protein of 94 aminoacids (PSP94) is abundantly secreted by the prostate gland. Like CRISP-3, β-MSP is present in various body fluids, predominantly derived from mucin-producing tissues (Beke, Nuytten et al. 2007; Cooper and Foster 2009; Yeager, Deng et al. 2009; Whitaker, Warren et al. 2010). While β-MSP seems to play a role in inhibition of follicle stimulating hormone (FSH) and binding to the surface of spermatozoa, its exact function remains unknown (Whitaker, Warren et al. 2010). In seminal plasma β-MSP binds to CRISP-3 (Udby, Lundwall et al. 2005; Whitaker, Warren et al. 2010). Due to higher concentrations of β-MSP, almost all CRISP-3 is present in complex formation, while most β-MSP occurs in free form (Udby, Lundwall et al. 2005). In normal, hyperplastic and malignant prostate epithelium, β-MSP is found in the cytoplasm and at the apical surface of tumour cells (Girvan, Chang et al. 2005; Whitaker, Warren et al. 2010). Since β-MSP mRNA is down-regulated in prostatic intraepithelial neoplasia (PIN), loss of β-MSP might play a role in prostate carcinogenesis, and the gene encoding β-MSP (MSMB) may be a tumour suppressor gene (Yeager, Deng et al. 2009; Kote-Jarai, Leongamornlert et al. 2010; Whitaker, Warren et al. 2010). The frequent down-regulation of β-MSP in advanced prostate cancer can be a result of several factors. The MSMB gene is a target for methylation by the Polycomb group protein EZH2, which is a promising upcoming prognostic marker for prostate cancer (Sellers and Loda 2002; van Leenders, Dukers et al. 2007; Wolters, Vissers et al. 2009). Interestingly, MSMB expression also appears to be driven by androgens and thus expression may be decreased by androgen depriviation therapy, a common treatment of advanced prostate cancer (Dahlman, Edsjo et al. 2010).
Both CRISP-3 and β-MSP are reported to have prognostic value in prostate cancer patients. Expression of β-MSP often decreases in high-grade tumours, whereas CRISP-3 shows the opposite pattern (Udby, Bjartell et al. 2005; Bjartell, Johansson et al. 2006). Bjartell et al. found that both CRISP-3 and β-MSP are independent predictors of recurrence of prostate cancer after radical prostatectomy (Bjartell, Al-Ahmadie et al. 2007). It remains to be established whether these proteins aid in therapeutic decision-making at time of prostate cancer diagnosis. Therefore, the goal of this study is to investigate whether if CRISP-3 and β-MSP have prognostic value in diagnostic needle-biopsies.
Chap
ter 2
Proefschrift#8_DEF.indd 40 25-08-15 16:42

41
Material and Methods
Patient inclusionAll patients (n=174) included in this study were participants of the screening arm of the European Randomized Study of Screening for Prostate Cancer (ERSPC), Rotterdam section (Roobol, Kirkels et al. 2003). In this study, men aged between 55 and 74 years of age were invited for a screening visit every four years. Recruitment and randomization started December 1993 and ended December 1999. Up until May 1997 a serum PSA level of ≥4.0 ng/ml or an abnormal DRE and/or TRUS prompted a lateralized sextant prostate biopsy. As from May 1997 a biopsy was indicated by a PSA level of ≥3.0 ng/ml or an abnormal DRE and/or TRUS. Initially we selected 186 men with a Gleason score of 3+3=6 at diagnostic needle-biopsies, who underwent radical prostatectomy between 1993 and 2008 at the Erasmus Medical Centre, Rotterdam, The Netherlands. On review of the diagnostic needle-biopsies for study purposes by an urologic pathologist (GvL), 12 cases (6.5%) were excluded due to Gleason score upgrading, leaving 174 cases for further studies (Epstein 2010). We analyzed expression values in the total cohort as well as in the subgroup of patients with low-risk prostate cancer (n=87). Patients with low-risk prostate cancer are currently included in surveillance protocols. Immunohistochemical analysis in this subgroup was performed to investigate whether CRISP-3 and/or β-MSP could identify patients who might need active treatment. Low-risk prostate cancer was defined according to the inclusion criteria in the Prostate cancer Research International: Active Surveillance study (PRIAS), which are a PSA level of ≤10 ng/ml, clinical T stage ≤2, PSA density <0.20 ng/mL/g, Gleason score <7 and ≤2 positive biopsy cores (van den Bergh, Roemeling et al. 2007; Wolters, Vissers et al. 2009).
Diagnostic prostate biopsy cores and radical prostatectomy tissue specimens from all patients were processed according to standard protocols including formalin fixation, paraffin embedding, radical prostatectomy slicing at 4 mm intervals and staining with hematoxylin-eosin. Gleason score, extraprostatic extension, seminal vesicle invasion, surgical margins and tumour volume were recorded routinely as described previously (Schroder and Bangma 1997).
ImmunohistochemistryFor immunohistochemical analyses, the needle-core containing the largest amount of cancer was selected for immunohistochemical staining, performed at Lund University, Malmö, Sweden (AD) as reported previously (Bjartell, Johansson et al. 2006; Bjartell, Al-Ahmadie et al. 2007). Briefly, 4 µm slides were deparaffinised and heated for 20 min at 97°C in EnvisionFlex Target Retrieval Solution High pH (DAKO A/S, Glostrup,
Chap
ter 2
Chapter 2: Cysteine-rich secretory protein 3 and β-microseminoprotein on prostate cancer needle biopsies do not have predictive value for subsequent prostatectomy outcome
Proefschrift#8_DEF.indd 41 25-08-15 16:42
42 Discovery and Validation of Prognostic Tissue Markers in Clinical Prostate Cancer – © 2015, A.M. Hoogland
Denmark). Serial sections were stained with rabbit polyclonal anti-MSMB and anti-CRISP-3 antibodies using an AutostainerPlus staining machine (DAKO). Polyclonal rabbit anti-human CRISP-3 was a gift from Dr L. Udby (Udby, Lundwall et al. 2005), and polyclonal rabbit anti-human MSMB was a gift from Dr P. Fernlund (Abrahamsson, Andersson et al. 1989). Final antibody concentration for anti-MSMB was 0.3 µg/mL and for CRISP-3 3.5 µg/mL. The slides were processed by the EnVision Flex/HPR Rabbit/Mouse (code K5007, DAKO), with peroxidase-coupled secondary antibodies goat anti-rabbit and goat anti-mouse IgGs (DAKO). Finally, the sections were counterstained with Mayer’s hematoxylin solution.
Immunohistochemical quantificationFor both CRISP-3 and β-MSP, the cytoplasmic staining intensity and percentage of positive tumour cells were determined (Bjartell, Johansson et al. 2006; Bjartell, Al-Ahmadie et al. 2007). Staining intensity was given a value of 0 (negative), 1 (only visible at high magnification), 2 (visible at low magnification) or 3 (striking at low magnification). The percentage of positive tumour cells was semi-quantitatively determined at 5% multiples. All biopsy cores were scored by two investigators (MH, GvL) in a blinded setting. Consensus on expression value was reached in all cases in a combined session. Statistical analysisWe analyzed expression values in the total cohort as well as in the subgroup of patients with low-risk PC (n=87). For statistical analysis, we applied various cut-off values for combined intensity and expression extent of both markers. Since no standard cut-offs were determined yet, we initially applied the values from Bjartell et al (Bjartell, Al-Ahmadie et al. 2007). In this study on radical prostatectomy specimen, CRISP-3 was considered positive at an intensity of ≥1.5 in ≥80% of tumour cells; β-MSP was positive if staining intensity was ≥1 in ≥20% of cells (Bjartell, Al-Ahmadie et al. 2007). For CRISP-3 we finally used a different cut-off, which is an intensity ≥2 in ≥5% of tumour cells. If expression values fulfilled the above mentioned criteria, the staining was labelled ‘positive’.
The Chi-Square test was used to analyze the correlation between protein with single clinico-pathologic parameters (number of positive needle-biopsies, Gleason score at radical prostatectomy, extraprostatic extension and surgical margins). To determine whether either, or both, markers had a predictive value for subsequent significant disease at radical prostatectomy, we used logistic regression analysis. Multivariate analysis with stepwise backward exclusion included PSA at the time of diagnosis, age at time of diagnosis, prostate volume, number of positive biopsy cores and maximum tumour invasion. Variables were rejected at a p-value >0.05. All statistics were done using SPSS 17 (SPSS Inc., Chicago, USA).
Chap
ter 2
Proefschrift#8_DEF.indd 42 25-08-15 16:42
43
Results
The clinical and pathological information of the total study group (n=174) and the low-risk patient group (n=87), are described in table 1. CRISP-3At evaluation of CRISP-3 staining, 25 cases did not contain residual tumour in the biopsy-core, leaving 149 patients for final analyses. Generally, expression of CRISP-3 was extensive (>50% positive) in 54.4% (81/ 149) of all cases, while staining intensity was heterogeneous, even within the same tissue specimen. In 62.6% patients, tumour areas without CRISP-3 expression (score 0) were present, whereas intensity levels of 1, 2 and 3 occurred in 50.0%, 24.7% and 12.6%, respectively (Figure 1). Table 2 and 3 report the distribution of CRISP-3 expression in relation to PSA at time of diagnosis, number of positive biopsy cores, Gleason score, extraprostatic extension and surgical margins at radical prostatectomy for the entire group and subgroup of low-risk patients, respectively. There was no significant relation between CRISP-3 expression with any of these markers using a combined dichotomization at intensity ≥2 in ≥5% of tumour cells. Application of other cut-off values did not improve the current results.
ß-MSP Upon evaluation of β-MSP, 27 cases did not contain residual tumour, resulting in 147 patients for further analyses. As expected, β-MSP expression was high in normal tissue and generally lower in prostate cancer. β-MSP expression in tumour tissue was heterogeneous with variable levels of intensity occurring in the same slide. In the total group, 14.9% of tumours contained staining intensity 3, 50.0% had intensity 2, 70.7% intensity 1, and in 32.2% tumour areas without β-MSP expression (score 0) existed. (Figure 2). The expression of β-MSP in relation to clinico-pathologic parameters is depicted in table 2 and 3. In both the total (p=0.029) and low-risk (p=0.011) group low β-MSP expression correlated significantly with Gleason score ≥7 at subsequent radical prostatectomy, but not with other parameters.
Prognostic value of CRISP-3 and β-MSPIn univariate analysis of the total group, PSA at time of diagnosis (p=0.009), number of positive biopsy cores (p<0.001) and maximum prostate cancer invasion in the biopsy core (p<0.001) were all predictors for significant prostate cancer at radical prostatectomy (table 4). In multivariate analysis, all these parameters remained significant together with prostate volume (p=0.003). Neither CRISP-3 nor β-MSP expression had a predictive value for significant prostate cancer at radical prostatectomy (table 5).
Chap
ter 2
Chapter 2: Cysteine-rich secretory protein 3 and β-microseminoprotein on prostate cancer needle biopsies do not have predictive value for subsequent prostatectomy outcome
Proefschrift#8_DEF.indd 43 25-08-15 16:42
44 Discovery and Validation of Prognostic Tissue Markers in Clinical Prostate Cancer – © 2015, A.M. Hoogland
In addition, we analysed the prognostic value of CRISP-3 and β-MSP in a selected group of low-risk patients (at time of biopsy) defined as PSA ≤10 ng/ml, cT ≤2, PSA density <0.20 ng/ml/g, Gleason score <7 and ≤2 positive biopsy cores (n=87). In this cohort, the number of positive needle-biopsies (p=0.036) and maximum prostate cancer invasion (p=0.013) were the only predictive parameters for significant disease at radical prostatectomy in multivariate analysis (table 6). In the low-risk subgroup, CRISP-3 and β-MSP did not predict significant disease neither in uni- nor multivariate analysis (table 7).
Chap
ter 2
Proefschrift#8_DEF.indd 44 25-08-15 16:42

45
Discussion
It is important to make a better assessment of prostate cancer aggressiveness at the time of diagnosis to facilitate the choice for most appropriate treatment for individual patients. Because of widespread PSA screening, an increasing number of patients are diagnosed with prostate cancer in a preclinical stage. In the ERSPC, the screened group seem to have a more favourable outcome, compared to the Dutch population (de Vries, Postma et al. 2007; Schroder, Hugosson et al. 2009). It has however been estimated that even 50% of these screened patients are diagnosed with a clinically insignificant tumour, which would not have led to any symptoms when left undiscovered (Draisma, Boer et al. 2003). Currently, various studies are ongoing on active surveillance and watchful waiting of prostate cancer, although no consensus exists yet on the most appropriate inclusion criteria.
Various immunohistochemical and molecular markers have been put forth for better prediction of disease behaviour and therapeutic stratification. Generally, the predictive value of markers, such as EZH2, vimentin, e-cadherin, n-cadherin, β-MSP, CRISP-3 and AR, is first investigated on radical prostatectomy and related to biochemical or clinical recurrence (Girvan, Chang et al. 2005; Bjartell, Johansson et al. 2006; Bjartell, Al-Ahmadie et al. 2007; Gravdal, Halvorsen et al. 2007; van Leenders, Dukers et al. 2007; Zhang, Helfand et al. 2009). Conspicuously, only few markers have been validated in prostate needle-biopsies, which represent a clinically more relevant group for therapeutic decision-making, for example p27kip1, EZH2, MIB-1 and AR (Romics, Banfi et al. 2008; Donovan, Khan et al. 2009; Wolters, Vissers et al. 2009). A high expression of MIB-1 at radical prostatectomy has been associated with a high Gleason score, advanced stage, biochemical progression after treatment and prostate cancer related death, while a study on prostate needle-biopsy material could not confirm these associations (Moul 1999; Wolters, Vissers et al. 2009). Loss of p27kip1 expression in prostate cancer at radical prostatectomy has been associated with higher tumour grade and biochemical recurrence after treatment. Romics et al. reported a correlation between low p27kip1 expression on prostate needle-biopsies with significant prostate cancer at radical prostatectomy in a small group of patients (Romics, Banfi et al. 2008). Wolters et al. confirmed this relation on a larger group of patients with low-risk prostate cancer (Wolters, Vissers et al. 2009). In addition, our group found that high expression of the Polycomb-group protein EZH2 correlated with high Gleason score, extraprostatic extension and positive surgical margins on radical prostatectomy, and that its expression on needle-biopsies was predictive for significant prostate cancer at radical prostatectomy (van Leenders, Dukers et al. 2007).
Chap
ter 2
Chapter 2: Cysteine-rich secretory protein 3 and β-microseminoprotein on prostate cancer needle biopsies do not have predictive value for subsequent prostatectomy outcome
Proefschrift#8_DEF.indd 45 25-08-15 16:42

46 Discovery and Validation of Prognostic Tissue Markers in Clinical Prostate Cancer – © 2015, A.M. Hoogland
In the current study, we have investigated the value of CRISP-3 and β-MSP expression in prostate needle-biopsies (with Gleason score 3+3=6) from patients who subsequently underwent radical prostatectomy. Both CRISP-3 and β-MSP have an independent predictive value for recurrence after radical prostatectomy (Kosari, Asmann et al. 2002; Girvan, Chang et al. 2005; Reeves, Dulude et al. 2006; Bjartell, Al-Ahmadie et al. 2007). On needle-biopsies, a significant correlation existed between low β-MSP expression and subsequent high Gleason score at radical prostatectomy, which corresponds with earlier radical prostatectomy studies and which supports a tumour-suppressive effect of this protein (Bjartell, Johansson et al. 2006; Bjartell, Al-Ahmadie et al. 2007). However, there was no significant relation of both markers with other clinico-pathologic parameters. Likewise, neither CRISP-3 nor β-MSP had a predictive value for significant disease at radical prostatectomy in uni- and multivariate analysis, indicating they do not seem to add to existing parameters in the current group of Gleason score 6 needle-biopsies.
Some points have to be taken into account for the interpretation of these results. First, determination of optimal cut-off values in this and other studies is sensitive to inter-laboratory technical and inter-observer scoring variability. Interestingly, the cut-off value for β-MSP used by Bjartell et al. was independently confirmed as optimal in our study, indicating that they might also be applied in future studies (Bjartell, Johansson et al. 2006; Bjartell, Al-Ahmadie et al. 2007). While our optimal cut-off value for CRISP-3 was different from the one applied by Bjartell et al., we were not able to demonstrate a predictive value for either cut-off. Second, the current study is hampered by its retrospective nature, which also led to exclusion of patients due to the absence of residual tumour in some needle-biopsies. Finally, the number of patients with significant disease is relatively low in this cohort, and our approach of staining the biopsy core with maximal tumour burden only might not be fully representative for the tumour at radical prostatectomy.
ConclusionIn this study, we determined the predictive value of CRISP-3 and β-MSP on prostate needle-biopsies and correlated their expression with significant prostate cancer at radical prostatectomy. The present study did not support a role for CRISP-3 or β-MSP expression in diagnostic prostate needle-biopsies to improve therapeutic decision-making for prostate cancer.
Chap
ter 2
Proefschrift#8_DEF.indd 46 25-08-15 16:42

47
Acknowledgements
This research was made possible by a financial contribution from CTMM, project PCMM, project number 03O-203 and STW project number: 07048 and from European Union 6th Framework (P-Mark) (grant number LSHC-CT-2004-503011) Swedish Research Council (Medicine), Cancer en Research Foundation at University Hospital Malmö, Gunnar Nilsson Cancer Foundation.
We cordially thank technician Ms Elise Nilsson from Skåne University Hospital Malmö, Lund University, Sweden for working on the immunostainings and shipping of the slides used in this study; Dr. Lene Udby for providing the CRISP-3 antibody; and Dr Per Fernlund for the MSMB antibody.
Chap
ter 2
Chapter 2: Cysteine-rich secretory protein 3 and β-microseminoprotein on prostate cancer needle biopsies do not have predictive value for subsequent prostatectomy outcome
Proefschrift#8_DEF.indd 47 25-08-15 16:42

48 Discovery and Validation of Prognostic Tissue Markers in Clinical Prostate Cancer – © 2015, A.M. Hoogland
References1. Jemal A, Siegel R, Ward E, Hao Y, Xu J and Thun MJ (2009). Cancer statistics, 2009. CA Cancer J
Clin 59, 225-49.
2. Sorensen KD and Orntoft TF (2010). Discovery of prostate cancer biomarkers by microarray gene expression profiling. Expert Rev Mol Diagn 10, 49-64.
3. Wolters T, Vissers KJ, Bangma CH, Schroder FH and van Leenders GJ (2009). The value of EZH2, p27(kip1), BMI-1 and MIB-1 on biopsy specimens with low-risk prostate cancer in selecting men with significant prostate cancer at prostatectomy. BJU Int.
4. Donovan MJ, Osman I, Khan FM, et al. (2010). Androgen receptor expression is associated with prostate cancer-specific survival in castrate patients with metastatic disease. BJU Int 105, 462-7.
5. Freedland SJ, deGregorio F, Sacoolidge JC, et al. (2003). Preoperative p27 status is an independent predictor of prostate specific antigen failure following radical prostatectomy. J Urol 169, 1325-30.
6. Gravdal K, Halvorsen OJ, Haukaas SA and Akslen LA (2007). A switch from E-cadherin to N-cadherin expression indicates epithelial to mesenchymal transition and is of strong and independent importance for the progress of prostate cancer. Clin Cancer Res 13, 7003-11.
7. Kuczyk M and Machtens S (1999). Predictive value of decreased p27 Kip1 protein expression for the recurrence-free and long-term survival of prostate cancer patients. Prostate Cancer Prostatic Dis 2, S17.
8. Moul JW (1999). Angiogenesis, p53, bcl-2 and Ki-67 in the progression of prostate cancer after radical prostatectomy. Eur Urol 35, 399-407.
9. Romics I, Banfi G, Szekely E, Krenacs T and Szende B (2008). Expression of p21(waf1/cip1), p27 (kip1), p63 and androgen receptor in low and high Gleason score prostate cancer. Pathol Oncol Res 14, 307-11.
10. van Leenders GJ, Dukers D, Hessels D, et al. (2007). Polycomb-group oncogenes EZH2, BMI1, and RING1 are overexpressed in prostate cancer with adverse pathologic and clinical features. Eur Urol 52, 455-63.
11. Wu TT, Wang JS, Jiaan BP, et al. (2007). Role of p21(WAF1) and p27(KIP1) in predicting biochemical recurrence for organ-confined prostate adenocarcinoma. J Chin Med Assoc 70, 11-5.
12. Zhang Q, Helfand BT, Jang TL, et al. (2009). Nuclear factor-kappaB-mediated transforming growth factor-beta-induced expression of vimentin is an independent predictor of biochemical recurrence after radical prostatectomy. Clin Cancer Res 15, 3557-67.
13. Bjartell A, Johansson R, Björk T, et al. (2006). Immunohistochemical detection of cysteine-rich secretory protein 3 in tissue and in serum from men with cancer or benign enlargement of the prostate gland. The Prostate 66, 591-603.
14. Bjartell AS, Al-Ahmadie H, Serio AM, et al. (2007). Association of cysteine-rich secretory protein 3 and β-Microseminoprotein with outcome after radical prostatectomy. Clinical Cancer Research 13, 4130-38.
15. Udby L, Bjartell A, Malm J, et al. (2005). Characterization and localization of cysteine-rich secretory protein 3 (CRISP-3) in the human male reproductive tract. J Androl 26, 333-42.
Chap
ter 2
Proefschrift#8_DEF.indd 48 25-08-15 16:42
49
16. Udby L, Calafat J, Sorensen OE, Borregaard N and Kjeldsen L (2002). Identification of human cysteine-rich secretory protein 3 (CRISP-3) as a matrix protein in a subset of peroxidase-negative granules of neutrophils and in the granules of eosinophils. J Leukoc Biol 72, 462-9.
17. Udby L, Lundwall A, Johnsen AH, et al. (2005). beta-Microseminoprotein binds CRISP-3 in human seminal plasma. Biochem Biophys Res Commun 333, 555-61.
18. Kosari F, Asmann YW, Cheville JC and Vasmatzis G (2002). Cysteine-rich secretory protein-3: a potential biomarker for prostate cancer. Cancer Epidemiol Biomarkers Prev 11, 1419-26.
19. Beke L, Nuytten M, Van Eynde A, Beullens M and Bollen M (2007). The gene encoding the prostatic tumor suppressor PSP94 is a target for repression by the Polycomb group protein EZH2. Oncogene 26, 4590-5.
20. Cooper CS and Foster CS (2009). Concepts of epigenetics in prostate cancer development. Br J Cancer 100, 240-5.
21. Whitaker HC, Warren AY, Eeles R, Kote-Jarai Z and Neal DE (2010). The potential value of microseminoprotein-beta as a prostate cancer biomarker and therapeutic target. Prostate 70, 333-40.
22. Yeager M, Deng Z, Boland J, et al. (2009). Comprehensive resequence analysis of a 97 kb region of chromosome 10q11.2 containing the MSMB gene associated with prostate cancer. Hum Genet.
23. Girvan AR, Chang P, van Huizen I, et al. (2005). Increased intratumoral expression of prostate secretory protein of 94 amino acids predicts for worse disease recurrence and progression after radical prostatectomy in patients with prostate cancer. Urology 65, 719-23.
24. Kote-Jarai Z, Leongamornlert D, Tymrakiewicz M, et al. (2010). Mutation analysis of the MSMB gene in familial prostate cancer. Br J Cancer 102, 414-8.
25. Sellers WR and Loda M (2002). The EZH2 polycomb transcriptional repressor--a marker or mover of metastatic prostate cancer? Cancer Cell 2, 349-50.
26. Dahlman A, Edsjo A, Hallden C, et al. (2010). Effect of androgen deprivation therapy on the expression of prostate cancer biomarkers MSMB and MSMB-binding protein CRISP3. Prostate Cancer Prostatic Dis.
27. Roobol MJ, Kirkels WJ and Schroder FH (2003). Features and preliminary results of the Dutch centre of the ERSPC (Rotterdam, the Netherlands). BJU Int 92 Suppl 2, 48-54.
28. Epstein JI (2010). An update of the Gleason grading system. J Urol 183, 433-40.
29. van den Bergh RC, Roemeling S, Roobol MJ, Roobol W, Schroder FH and Bangma CH (2007). Prospective validation of active surveillance in prostate cancer: the PRIAS study. Eur Urol 52, 1560-3.
30. Schroder FH and Bangma CH (1997). The European Randomized Study of Screening for Prostate Cancer (ERSPC). Br J Urol 79 Suppl 1, 68-71.
31. Abrahamsson PA, Andersson C, Bjork T, et al. (1989). Radioimmunoassay of beta-microseminoprotein, a prostatic-secreted protein present in sera of both men and women. Clin Chem 35, 1497-503.
32. de Vries SH, Postma R, Raaijmakers R, et al. (2007). Overall and disease-specific survival of patients with screen-detected prostate cancer in the European randomized study of screening for prostate cancer, section Rotterdam. Eur Urol 51, 366-74; discussion 74.
33. Schroder FH, Hugosson J, Roobol M, et al. (2009). Screening and prostate-cancer mortality in a randomized European study. the New England Journal of Medicine 360, 1320-28.
Chap
ter 2
Chapter 2: Cysteine-rich secretory protein 3 and β-microseminoprotein on prostate cancer needle biopsies do not have predictive value for subsequent prostatectomy outcome
Proefschrift#8_DEF.indd 49 25-08-15 16:42

50 Discovery and Validation of Prognostic Tissue Markers in Clinical Prostate Cancer – © 2015, A.M. Hoogland
34. Draisma G, Boer R, Otto SJ, et al. (2003). Lead times and overdetection due to prostate-specific antigen screening: estimates from the European Randomized Study of Screening for Prostate Cancer. J Natl Cancer Inst 95, 868-78.
35. Donovan MJ, Khan FM, Fernandez G, et al. (2009). Personalized prediction of tumor response and cancer progression on prostate needle biopsy. J Urol 182, 125-32.
36. Reeves JR, Dulude H, Panchal C, Daigneault L and Ramnani DM (2006). Prognostic value of prostate secretory protein of 94 amino acids and its binding protein after radical prostatectomy. Clin Cancer Res 12, 6018-22.
Chap
ter 2
Proefschrift#8_DEF.indd 50 25-08-15 16:42

51
Table 1. Characteristics of patients in the total cohort (n=174) and the low-risk group (n=87).
Total Cohort (n=174)Mean (median; range) or n (%)
Low-risk group (n=87)Mean (median; range) or n (%)
Age at diagnosis (years) 63.4 (63.7; 55.2-71.6) 63.6 (63.8; 55.6-71.6)
PSA level at diagnosis (ng/ml) 5.6 (4.5; 0.8-43) 4.5 (4.2; 0.8-10.0)
≤10 ng/ml 159 (91.4 %) 87 (100%)
>10 ng/ml 15 (8.6 %) n.a.
Prostate volume (ml) 41.15 (35.30; 17.60-174.80) 42.76 (36.30; 17.60-144.70)
Clinical T-stage
T1c 85 (48.9 %) 45 (51.7%)
T2a 59 (33.8 %) 32 (36.8%)
T2b 12 (6.9 %) 6 (6.9%)
T2c 11 (6.3 %) 4 (4.6%)
T3/4 7 (4.1 %) n.a.
Number of positive biopsy cores
1 47 (27.0 %) 33 (37.9%)
2 64 (36.8 %) 54 (62.1%)
>2 63 (36.2 %) n.a.
Maximum tumour invasion
≤10% 22 (12.6%) 16 (18.4%)
>10-50% 110 (63.3%) 59 (67.9%)
>50% 41 (23.5%) 12 (13.7%)
Missing 1 (0.6%) 0
Pathological T-stage (RP)
T2a 38 (21.8 %) 22 (25.3%)
T2b 7 (4.0 %) 4 (4.6%)
T2c 99 (56.9 %) 52 (59.8%)
T3 20 (11.5 %) 5 (5.7%)
T4 10 (5.8 %) 4 (4.6%)
Gleason score (RP)
<7 127 (73.0 %) 71 (81.6%)
7 44 (25.3 %) 16 (18.4%)
>7 3 (1.7 %) 0
EPE
No 144 (82.8 %) 78 (89.7%)
Yes 30 (17.2 %) 9 (10.3%)
Chap
ter 2
Chapter 2: Cysteine-rich secretory protein 3 and β-microseminoprotein on prostate cancer needle biopsies do not have predictive value for subsequent prostatectomy outcome
Proefschrift#8_DEF.indd 51 25-08-15 16:42

52 Discovery and Validation of Prognostic Tissue Markers in Clinical Prostate Cancer – © 2015, A.M. Hoogland
Surgical margins
Negative 138 (79.3 %) 78 (89.7%)
Positive 36 (20.7 %) 9 (10.3%)
Tumour volume (ml) 0.846 (0.603; 0.003-5.040) 0.627 (0.478; 0.003-5.040)
Significant disease*
No 59 (33.9%) 42 (48.3%)
Yes 115 (66.1%) 45 (51.7%)
PSA = Prostate specific antigen; RP = Radical prostatectomy; EPE = Extra prostatic extension; n.a. = not applicable.
* Significant disease was defined as prostate cancer at RP with EPE, or Gleason score > 6, or tumour volume ≥0.5ml.
Chap
ter 2
Proefschrift#8_DEF.indd 52 25-08-15 16:42

53
Table 2. Expression of CRISP-3 and β-MSP in relation to PSA at time of diagnosis, number of positive biopsy cores, Gleason score, EPE and surgical margins at radical prostatectomy in the total group (n=174).
CRISP-3 β-MSP
Positive Negative p-value Positive negative p-value
PSA at diagnosis ≤10 ng/mL >10 ng/mL
48 (32.2%)3 (2.0%)
91 (61.1%)7 (4.7%)
0.770 125 (85.0%)9 (6.1%)
13 (8.9%)0 (0.0%)
0.335
Positive biopsies 1 2 >2
12 (8.0%)18 (12.1%)21 (14.1%)
26 (17.4%)36 (24.2%)36 (24.2%)
0.856 36 (24.5%)49 (33.3%)49 (33.3%)
2 (1.4%)6 (4.1%)5 (3.4%)
0.635
Gleason score (RP) ≤6 ≥7
34 (22.8%)17 (11.4%)
73 (49.0%)25 (16.8%)
0.314 100 (68.0%)34 (23.1%)
6 (4.1%)7 (4.8%)
0.029*
EPE No Yes
38 (25.5%)13 (8.7%)
83 (55.7%)15 (10.1%)
0.131 107 (72.8%)27 (18.3%)
12 (8.2%)1 (0.7%)
0.275
Surgical margins Positive Negative
8 (5.4%)43 (28.8%)
22 (14.8%)76 (51.0%)
0.329 29 (19.7%)105 (71.4%)
1 (0.7%)12 (8.2%)
0.233
PSA = Prostate specific antigen; RP = Radical prostatectomy; EPE = Extra prostatic extension.
* p<0.05
Chap
ter 2
Chapter 2: Cysteine-rich secretory protein 3 and β-microseminoprotein on prostate cancer needle biopsies do not have predictive value for subsequent prostatectomy outcome
Proefschrift#8_DEF.indd 53 25-08-15 16:42

54 Discovery and Validation of Prognostic Tissue Markers in Clinical Prostate Cancer – © 2015, A.M. Hoogland
Table 3. Expression of CRISP-3 and β-MSP in relation to PSA at time of diagnosis, number of positive biopsy cores, Gleason score, EPE and surgical margins at radical prostatectomy in the low-risk group (n=87).
CRISP-3 β-MSP
positive negative p-value positive negative p-value
PSA at diagnosis ≤10 ng/ml 26 (35.6%) 47 (64.4%) n.a. 66 (89.2%) 8 (10.8%) n.a.
Positive biopsies 1 2
10 (13.7%)16 (21.9%)
17 (23.3%)30 (41.1%)
0.846 25 (33.8%)41 (55.4%)
2 (2.7%)6 (8.1%)
0.475
Gleason score (RP) ≤6 ≥7
22 (30.1%)4 (5.5%)
38 (52.1%)9 (12.3%)
0.687 57 (77.0%)9 (12.2%)
4 (5.4%)4 (5.4%)
0.011*
EPE No Yes
22 (30.1%)4 (5.5%)
44 (60.3%)3 (4.1%)
0.211 59 (79.7%)7 (9.5%)
8 (10.8%)0 (0.0%)
0.333
Surgical margins Positive Negative
3 (4.1%)23 (31.5%)
3 (4.1%)44 (60.3%)
0.442 6 (8.1%)60 (81.1%)
0 (0.0%)8 (10.8%)
0.374
PSA = Prostate specific antigen; RP = Radical prostatectomy; EPE = Extra prostatic extension; n.a. = not applicable.
* p<0.05
Chap
ter 2
Proefschrift#8_DEF.indd 54 25-08-15 16:42

55
Table 4. Predictive value of the preoperative variables, excluding immunostaining scores for significant prostate cancer at radical prostatectomy in total group (n=174).
Univariate OR (95% CI); p-value Multivariate OR (95% CI); p-value
Age at time of diagnosis 1.003 (0.930-1.081); p=0.947 1.011 (0.922-1.110); p=0.811
PSA at time of diagnosis 1.186 (1.043-1.349); p=0.009 1.418 (1.186-1.697); p<0.001
Prostate volume 0.986 (0.970-1.002); p=0.079 0.967 (0.945-0.989); p=0.003
Number of positive cores 1.869 (1.324-2.639); p<0.001 1.859 (1.213-2.851); p=0.004
Maximum PROSTATE CANCER invasion 1.030 (1.013-1.048); p<0.001 1.023 (1.005-1.041); p=0.013
OR = odds ratioCI = confidence interval
Table 5. Predictive value of CRISP-3 and β-MSP for significant prostate cancer at radical prostatectomy in the total group (n=174).
Univariate OR (95%CI); p-value
Multivariate OR including 1 marker (95% CI); p-value
Multivariate OR including 2 markers (95% CI); p-value
CRISP-3 1.172 (0.613-2.651); p=0.515
1.056 (0.438-2.545); p=0.904
1.258 (0.508-3.119); p=0.620
β-MSP 0.326 (0.069-1.531); p=0.155
0.319 (0.060-1.695); p=0.180
0.334 (0.063-1.766); p=0.197
OR = odds ratioCI = confidence interval
Chap
ter 2
Chapter 2: Cysteine-rich secretory protein 3 and β-microseminoprotein on prostate cancer needle biopsies do not have predictive value for subsequent prostatectomy outcome
Proefschrift#8_DEF.indd 55 25-08-15 16:42

56 Discovery and Validation of Prognostic Tissue Markers in Clinical Prostate Cancer – © 2015, A.M. Hoogland
Table 6. Predictive value of the preoperative variables, excluding immunostaining scores for significant prostate cancer at radical prostatectomy in the low-risk group (n=87).
Univariate OR (95%CI); p-value Multivariate OR (95% CI); p-value
Age at time of diagnosis 1.058 (0.949-1.181); p=0.308 1.026 (0.902-1.168); p=0.696
PSA at time of diagnosis 1.140 (0.917-1.1417); p=0.239 1.114 (0.883-1.405); p=0.364
Prostate volume 0.993 (0.972-1.016); p=0.556 0.987 (0.958-1.017); p=0.398
Number of positive cores 2.238 (0.924-5.419); p=0.074 2.743 (1.067-7.055); p=0.036
Maximum PROSTATE CANCER invasion 1.028 (1.004-1.053); p=0.022 1.032 (1.007-1.058); p=0.013
OR = odds ratioCI = confidence interval
Chap
ter 2
Proefschrift#8_DEF.indd 56 25-08-15 16:42

57
Table 7. Predictive value of CRISP-3 and β-MSP for significant prostate cancer at radical prostatectomy the low-risk group (n=87).
Univariate OR (95%CI) Significance
Multivariate OR including 1 marker (95% CI); p-value
Multivariate OR including 2 markers (95% CI); p-value
CRISP-3 2.339 (0.868-6.305); p=0.093
1.856 (0.626-5.506); p=0.265
2.413 (0.819-7.114); p=0.110
β-MSP 0.295 (0.055-1.571); p=0.153
0.227 (0.040-1.274); p=0.092
0.241 (0.043-1.350); p=0.105
OR = odds ratioCI = confidence interval
Chap
ter 2
Chapter 2: Cysteine-rich secretory protein 3 and β-microseminoprotein on prostate cancer needle biopsies do not have predictive value for subsequent prostatectomy outcome
Proefschrift#8_DEF.indd 57 25-08-15 16:42

58 Discovery and Validation of Prognostic Tissue Markers in Clinical Prostate Cancer – © 2015, A.M. Hoogland
Figure 1. Expression of cysteine-rich secretory protein 3 in prostate cancer in prostate needle biopsies. A) Intensity 1 B) intensity 2 C) intensity 3 D) heterogenous intensities within the same tumour (original magnifications A–C, ×200; D, ×100)
Chap
ter 2
Proefschrift#8_DEF.indd 58 25-08-15 16:42
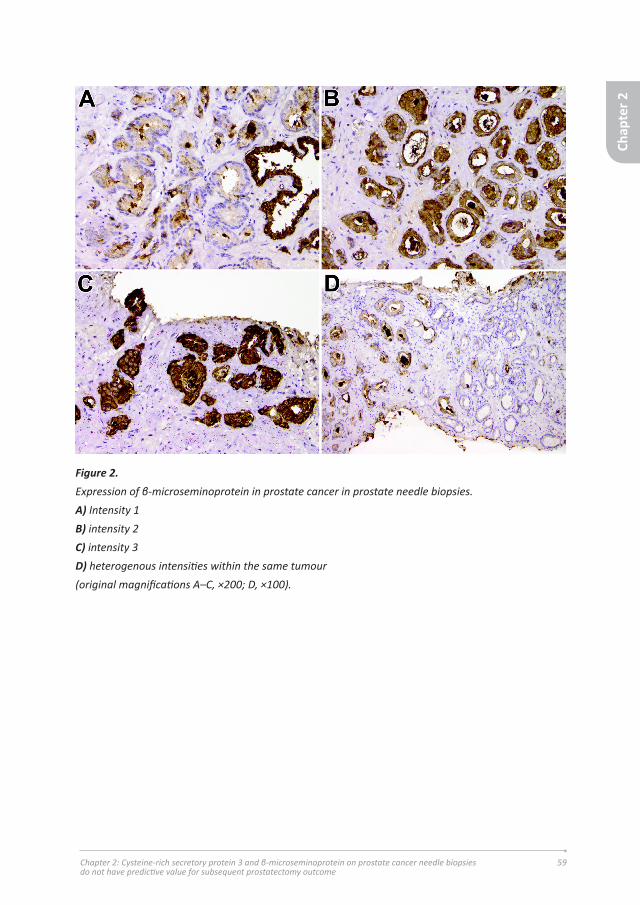
59
Figure 2. Expression of β-microseminoprotein in prostate cancer in prostate needle biopsies. A) Intensity 1 B) intensity 2 C) intensity 3 D) heterogenous intensities within the same tumour (original magnifications A–C, ×200; D, ×100).
Chap
ter 2
Chapter 2: Cysteine-rich secretory protein 3 and β-microseminoprotein on prostate cancer needle biopsies do not have predictive value for subsequent prostatectomy outcome
Proefschrift#8_DEF.indd 59 25-08-15 16:42

60 Discovery and Validation of Prognostic Tissue Markers in Clinical Prostate Cancer – © 2015, A.M. Hoogland
Proefschrift#8_DEF.indd 60 25-08-15 16:42

61
Chapter 3:
ERG immunohistochemistry is not predictive for PSA recurrence, local recurrence or overall survival after
radical prostatectomy for prostate cancer
A. Marije Hoogland1, Guido Jenster2, Wytske M. van Weerden2, Jan Trapman1, Theo van der Kwast3, Monique J. Roobol2, Fritz H. Schröder2, Mark F. Wildhagen2,
Geert J.L.H. van Leenders1
Departments of Pathology1 and Urology2, Erasmus Medical Center, Rotterdam, The Netherlands; Department of Pathology3, University Health Network, Toronto,
Canada
Hoogland AM, Jenster G, van Weerden WM, Trapman J, van der Kwast T, Roobol MJ, Schröder FH, Wildhagen MF, van Leenders GJ. “ERG immunohistochemistry is not predictive for PSA recurrence, local recurrence or overall survival after radical prostatectomy for prostate cancer.”, Mod Pathol. 2012. 25(3):471-9.
Chap
ter 3
Chapter 3: ERG immunohistochemistry is not predictive for PSA recurrence, local recurrence or overall survival after radical prostatectomy for prostate cancer
Proefschrift#8_DEF.indd 61 25-08-15 16:42

62 Discovery and Validation of Prognostic Tissue Markers in Clinical Prostate Cancer – © 2015, A.M. Hoogland
Abstract
In prostate cancer genomic rearrangements involving genes encoding ETS transcription factors are commonly present, with TMPRSS2-ERG gene fusion occurring in 40-70%. Studies on the predictive value of ERG rearrangement as detected by in-situ hybridization or PCR have resulted in varying outcomes. The objective of this study was to correlate immunohistochemical ERG protein expression with clinico-pathologic parameters at radical prostatectomy specimens, and to determine its predictive value for post-operative disease recurrence and progression in a prostate cancer screening cohort. Since androgen receptor is down-regulated by ERG in cell lines, we also compared expression of respective proteins.
We selected 481 participants from the European Randomized Study of Screening for Prostate Cancer treated by radical prostatectomy for prostate adenocarcinoma. A tissue microarray was constructed containing representative cores of all prostate cancer specimens as well as 22 xenografts and seven cell lines. Immunohistochemical expression of ERG and androgen receptor was correlated with Prostate Specific Antigen (PSA), Gleason score, pT-stage, surgical margins, biochemical recurrence, local recurrence, overall death and disease-specific death.
ERG expression was detected in 284 patients (65%). Expression occurred significantly more frequent in patients with PSA ≤ 10 ng/mL (p=0.024). There was no significant association between ERG and Gleason score, pT-stage or surgical margin status. PSA (p=0.011), Gleason score (p=0.003), pT-stage (p=0.001) and surgical margin status (p<0.001) all had independent value for post-operative biochemical recurrence, while positive surgical margin (p=0.021) was the only independent predictor for local recurrence. ERG protein expression did not have prognostic value for the clinical endpoints in uni- and multivariate analyses. A positive correlation existed between ERG and androgen receptor expression in single tissue cores (p<0.001).
In conclusion, immunohistochemical ERG expression has no predictive value for prostate cancer recurrence or progression after radical prostatectomy. Increasing ERG levels are associated with up-regulation of androgen receptor expression in clinical specimens.
Chap
ter 3
Proefschrift#8_DEF.indd 62 25-08-15 16:42

63
Introduction
Genomic rearrangement of androgen-regulated transmembrane protease, serine 2 (TMPRSS2) on 21q22.3 to v-ets erythroblastosis virus E26 oncogen homologue (ERG) on 21q22.2 is the most common genetic alteration in prostate cancer occurring in 40%-70% of tumors (Tomlins, Rhodes et al. 2005). Less frequently, SLC45A3 and NDRG1 can serve as ERG fusion partners, whereas fusions of other ETS family members ETV1, ETV4 and ETV5 to over ten different partner genes are found in approximately 10% of tumors(Helgeson, Tomlins et al. 2008; Tomlins, Laxman et al. 2008; Tomlins, Bjartell et al. 2009).
Various groups have investigated the prognostic relevance of TMPRSS2-ERG fusion in clinical prostate cancer with varying outcome. This discordance can be explained by diversity in patient cohorts, pathologic specimens, clinical endpoints and ERG fusion detection. ERG rearrangement has so far been analyzed using either fluorescence in-situ hybridization (FISH) or quantitative Polymerase chain reaction (QPCR). Advantageously to routine detection of ERG fusion, FISH can give qualitative information on the type of gene fusion, resulting either from translocation or deletion, which is reported to be of clinical relevance (Attard, Clark et al. 2008; Mehra, Tomlins et al. 2008; Albadine, Latour et al. 2009). Application of FISH, however, needs tissue dependent optimization and can suffer from difficulty in interpretation especially when only a few atypical glands are present. On the other hand, both quantitative and qualitative information on gene fusion can be obtained by QPCR. Hermans et al. demonstrated that TMPRSS2(exon 0)-ERG fusions were associated with less aggressive biological prostate cancer behavior (Hermans, Boormans et al. 2009). The disadvantage of QPCR for detection of ERG rearrangement however is its requirement of frozen tissue containing a high percentage of prostate cancer cells.
Recently, Park et al. described an ERG specific antibody EPR3864, which reactivity showed excellent correlation with ERG rearrangement as determined by FISH in prostate cancer paraffin-embedded tissues (Ma, Liang et al. 2011). Likewise, Van Leenders et al. found a strong correlation between ERG protein expression and TMPRSS2-ERG expression using QPCR(van Leenders, Aalders et al. 2001). Strong immunohistochemical staining was associated with high ERG transcript levels in radical prostatectomy specimens indicating that semi-quantitative ERG determination reflected molecular expression levels (van Leenders, Aalders et al. 2001). Therefore, ERG immunohistochemistry is a simple methodology strongly indicative for the presence of ERG rearrangement.
Chap
ter 3
Chapter 3: ERG immunohistochemistry is not predictive for PSA recurrence, local recurrence or overall survival after radical prostatectomy for prostate cancer
Proefschrift#8_DEF.indd 63 25-08-15 16:42

64 Discovery and Validation of Prognostic Tissue Markers in Clinical Prostate Cancer – © 2015, A.M. Hoogland
The androgen receptor pathway plays an important role in the development and maintenance of the normal prostate, as well as in prostate carcinogenesis (Richter, Srivastava et al. 2007; Balk and Knudsen 2008). Because many ETS fusion partners are androgen-regulated, ERG expression might be related to androgen receptor levels in prostate cancer (Richter, Srivastava et al. 2007; Balk and Knudsen 2008). On the other hand, it has been shown that ERG can down-regulate expression of androgen receptor and its target genes (Yu, Mani et al. 2010).
In the current study we investigated whether ERG protein expression has predictive value for prostate cancer recurrence and progression after radical prostatectomy in a well-defined screening cohort. In addition, we analyzed the relation between androgen receptor and ERG expression in clinical specimens.
Chap
ter 3
Proefschrift#8_DEF.indd 64 25-08-15 16:42

65
Material and Methods
Patient informationWe selected all men from the European Randomized Study of Screening for Prostate Cancer, Rotterdam section, who had undergone radical prostatectomy for prostate adenocarcinoma in Erasmus Medical Center between 1987 and 2010 (Roobol, Kirkels et al. 2003; Schroder, Hugosson et al. 2009). In the European Randomized Study of Screening for Prostate Cancer, men aged between 55 and 74 years were invited for a screening visit every four years. Recruitment and randomization started in December 1993 and ended December 1999. Up until May 1997 patients with a serum Prostate Specific Antigen (PSA) level of ≥4.0 ng/mL, an abnormal digital rectal examination and/or abnormal transrectal ultrasound underwent lateralized sextant prostate needle-biopsies. As from May 1997 a biopsy was indicated by a PSA level of ≥3.0 ng/mL or abnormal digital rectal examination and/or transrectal ultrasound.
Directly after surgery, radical prostatectomy specimens were transported on ice to the pathology department. After fixation in neutral-buffered formaldehyde, the radical prostatectomy specimens were routinely cut in 4-mm transverse slices with additional perpendicular slicing of the apex and basis to allow optimal evaluation of surgical margins, and totally embedded in paraffin. Hematoxylin/eosin (HE) slides were microscopically evaluated by two board-certified pathologists with expertise in urologic pathology (TvdK, GvL). At pathologic examination, tumor areas were encircled at the glass slides, and Gleason score, TNM stage and surgical margins were reported according to the international guidelines.
Clinical follow-up was recorded after each control at our outpatient clinic, and data were transmitted to the central study database. Post-operative biochemical recurrence was defined as an increase in serum PSA after two different measurements, at least three months apart. Suspicion on local recurrence was verified by a diagnostic needle-biopsy in each case. Death and death of disease was registered by the physician who last treated the patient. Use of samples for research purposes was approved by the Erasmus Medical Center Medical Ethics Committee according to the Medical Research Involving Human Subjects Act (MEC-2004-261).
Tissue Micro-Array (TMA) construction Histologic slides of all patients (n=509) were retrieved from the pathology archives together with corresponding paraffin blocks containing the largest tumor volume (with tumor of at least 0.5 cm in diameter per paraffin block). In 28 cases the tumor diameter was less than 0.5 cm which hampered sampling of three separate cores, or
Chap
ter 3
Chapter 3: ERG immunohistochemistry is not predictive for PSA recurrence, local recurrence or overall survival after radical prostatectomy for prostate cancer
Proefschrift#8_DEF.indd 65 25-08-15 16:42
66 Discovery and Validation of Prognostic Tissue Markers in Clinical Prostate Cancer – © 2015, A.M. Hoogland
no paraffin tissue was available, resulting in 481 patients to be included. In addition, the following control specimens were selected: normal prostate tissues (n=10) from cystoprostatectomies, urothelial cell carcinomas (n=5), invasive ductal mammary adenocarcinomas (n=5), palliative Transurethral Resection of the Prostate (TURP) containing hormone-refractory prostate cancer (n=10), prostate cancer lymph node metastases (n=10) and placenta (n=1). In addition, we included seven relevant human prostate cancer cell lines and 22 human prostate cancer xenografts with known ERG genomic fusion status (table 1)(Hermans, van Marion et al. 2006; Mertz, Setlur et al. 2007; Saramaki, Harjula et al. 2008). Cell lines were maintained in appropriate culture media. To facilitate inclusion of cell lines, confluent cell cultures were detached using EDTA, fixed in neutral-buffered formaldehyde, embedded in AGAR 2.5% (Sigma-Aldrich, St. Louis, USA), and subsequently in paraffin.
For TMA construction, three cylindrical cores (diameter 0.6 mm) were taken from representative areas in the paraffin block and transferred to recipient paraffin blocks (Beecher Microarryer, Beecher Instruments, Sun Prairie, USA). In total, nine TMA blocks were constructed each including 200 tissue and/or cell line cores.
ImmunohistochemistryTissue slides (5 μm) were mounted on aminoacetylsilane coated glass slides (Starfrost; Berlin, Germany), deparaffinised in xylene and dehydrated in ethanol. Endogenous peroxidase activity was blocked by 1% hydrogen peroxide in methanol for 20 min. Microwave (700 W) pretreatment in tris(hydroxymethyl)aminomethane-EDTA (pH 9.0) was performed for 15 min. The slides were incubated with rabbit monoclonal ERG antibody (clone EPR3864; 1:100; Epitomics, Burlingame, CA, USA) and mouse monoclonal anti-Androgen Receptor (clone F39.4; 1:200; Avris Antibodies, Herford, Germany) overnight at 4°C, followed by chromogenic visualization using the EnVision DAKO kit (DAKO, Glostrup, Denmark). After counterstaining with hematoxylin, slides were thoroughly washed, dehydrated, cleared in xylene and mounted in malinol (Chroma-Geselschaft, Körgen, Germany).
Immunohistochemical stainings for ERG and androgen receptor were visually examined as described previously(van Leenders, Aalders et al. 2001). The intensity of ERG and androgen receptor expression was scored as negative (0; no staining), weak (1+; only visible at high magnification), moderate (2+; visible at low magnification) and strong (3+; striking at low magnification). Nuclear reactivity of the antibody in endothelial cells (ERG) and in stromal cells (androgen receptor) was used as internal control for the staining procedure(Ma, Liang et al. 2011).
Chap
ter 3
Proefschrift#8_DEF.indd 66 25-08-15 16:42

67
In case of staining heterogeneity, the highest level was used for statistical analysis. All cores were scored by two investigators (MH, GvL) in a blinded setting. In a combined session consensus on expression value was reached in all cases.
StatisticsFor statistical analyses we defined a patient as ERG ‘positive’ if respective evaluable cores all demonstrated ERG protein expression. If all cores from a patient were negative, we labeled the case as ‘negative’. In case expression heterogeneity was present with both ERG positive and negative cancer cores taken from one radical prostatectomy, respective case was labeled ‘heterogeneous’. The heterogeneous cases were included in the group of ‘positive’ cases as well as studied as a separate group.
Statistical associations between expression of ERG (as categorical variable) and continuous clinico-pathologic parameters (age and PSA at time of diagnosis) were tested using Student’s t-test, and with categorical parameters (Gleason score, pT-stage, surgical margins) using Pearson’s Chi-square (X2) test. To determine whether ERG expression was predictive for biochemical recurrence, clinical recurrence, overall death or disease-specific death, we used uni- and multivariate Cox regression with stepwise backward entering of covariates. The proportionality assumption for ERG positive versus negative cases was visually assessed in Kaplan-Meier curves (not shown). To investigate the statistical association between ERG and androgen receptor expression in the same core, we used Pearson’s Chi-square (X2) test. A p-value <0.05 was considered significant. All statistics were performed using SPSS 17 (SPSS Inc., Chicago, USA).
Chap
ter 3
Chapter 3: ERG immunohistochemistry is not predictive for PSA recurrence, local recurrence or overall survival after radical prostatectomy for prostate cancer
Proefschrift#8_DEF.indd 67 25-08-15 16:42

68 Discovery and Validation of Prognostic Tissue Markers in Clinical Prostate Cancer – © 2015, A.M. Hoogland
Results
Patient characteristicsThe mean age of the prostatectomy patients was 64.76 years (range 55.4-75.1 years). The Gleason score was <7 in 265 (55%), 7 in 188 (39%) and >7 in 28 (6%) cases, respectively. In total 343 (71%) tumors were organ-confined (pT2) and 138 (29%) cases showed extra-prostatic expansion (pT3/4). Surgical margins were positive in 119 (25%) cases. The mean follow-up of our cohort was 107.3 months. The clinico-pathological characteristics are summarized in table 2.
ERG expressionIn 44 of the prostate cancer patients, no tumor was identified in any of the tissue cores. Immunohistochemical analysis of the remaining prostate cancer patients (n=437) demonstrated nuclear ERG expression in 239 cases (55%) and negative staining in 153 cases (35%). In 45 cases (10%) heterogeneous expression was observed, meaning that both areas with and without ERG expression were present within the same tumor. In all cases, endothelial cells were positive (1% 2+, 99% 3+) indicating that the immunohistochemical procedure was efficient and reliable. Different ERG and corresponding androgen receptor expression patterns are depicted in figure 1.
In 49 patients (10%) high-grade Prostate Intraepithelial Neoplasia (HG-PIN) was present in the tissue cores, of which 18 cases (37%) demonstrated ERG expression, 29 (59%) were negative and two (4%) heterogeneous. Normal prostate epithelial glands were negative in all cases, except in one (0%; intensity 2+).
Six of nine (67%) evaluable prostate cancer lymph node metastases showed ERG expression, while three were negative (33%); for one patient, no tumor was present in the three cores. In castration-resistant prostate cancer treated by palliative transurethral resection, ERG was uniformly expressed in four patients (40%), with heterogeneous expression in three (30%) and negative staining in three patients (30%).
To validate ERG immunohistochemistry we also included a large series of human prostate cancer cell lines and xenografts with known ERG fusion status in the TMA. Nuclear ERG protein expression was found in VCaP, which has a known TMPRSS2-ERG fusion(Hermans, van Marion et al. 2006), while other cell lines without ERG fusion were negative for ERG staining (table 1). From the 22 xenografts analyzed, VCaP, DuCaP, PC82, PC295 and PC310 showed uniform ERG expression, while the other
Chap
ter 3
Proefschrift#8_DEF.indd 68 25-08-15 16:42

69
17 were negative. As shown in table 1, ERG immunohistochemistry was concordant with TMPRSS2-ERG fusion status. The control tissues derived from urothelial cell carcinoma, breast adenocarcinoma and placenta were all negative for ERG.
Clinico-pathologic correlationsThe relation of ERG immunohistochemical expression and clinico-pathologic parameters is depicted in table 3. Expression of ERG occurred significantly more frequent in patients with PSA ≤10 ng/mL (p=0.024). There was no statistically significant relation between ERG immunohistochemistry and Gleason score, pT-stage or surgical margin status. PSA at time of diagnosis (p=0.011), Gleason score (p=0.003), pT-stage (p=0.001) and surgical margin status (p<0.001) all had independent predictive value for post-operative biochemical recurrence in multivariate analysis (table 4), while positive surgical margin (p=0.021) was the only independent predictor for local recurrence (table 5). ERG protein expression did neither have a prognostic value for biochemical nor local recurrence after radical prostatectomy in uni- and multivariate analysis. While age (p<0.001) and PSA (p=0.001) both were independently predictive for overall death, pathologic parameters and ERG immunohistochemistry were not (table 6). Serum PSA (p=0.022) was the only independent prognostic factor for disease-specific death with Gleason score (p=0.052) and surgical margin status (p=0.070) approaching significance (data not shown). The low number of events (n=9) however limits the power of this analysis. Since multiple endpoints were tested, p-values should be interpreted cautiously. If patients with heterogeneous expression (n=45) were analyzed as a separate group, we neither were able to find a significant correlation between ERG and follow-up parameters (data not shown).
Androgen receptor expressionTo compare androgen receptor and ERG expression, we investigated both proteins in the same tissue cores. Of the 969 evaluable cores, androgen receptor expression was weak (1+) in 96 (10%), moderate (2+) in 861 (89%) and strong (3+) in 78 (8%) cases. As depicted in figure 2, a positive correlation existed between the level of nuclear androgen receptor and ERG, with increased androgen receptor expression at higher ERG levels (p<0.001). The androgen receptor expression level of the ERG negative cases was not statistically different from cases with moderate (2+) ERG expression (p=0.32).
Chap
ter 3
Chapter 3: ERG immunohistochemistry is not predictive for PSA recurrence, local recurrence or overall survival after radical prostatectomy for prostate cancer
Proefschrift#8_DEF.indd 69 25-08-15 16:42

70 Discovery and Validation of Prognostic Tissue Markers in Clinical Prostate Cancer – © 2015, A.M. Hoogland
Discussion
Since its discovery in 2005, several groups have investigated the clinical significance of TMPRSS2-ERG fusion for prostate cancer behavior with variable outcome (Nam, Sugar et al. 2007; Nam, Sugar et al. 2007; Perner, Mosquera et al. 2007; Morris, Tomlins et al. 2008; Hermans, Boormans et al. 2009; Boormans, Hermans et al. 2010). This variability might be due to differences in study cohorts, clinical endpoints and methodologies for detecting gene fusion. For example, RT-PCR-detected TMPRSS2-ERG fusion was found in more than 70% of patients surgically treated by radical prostatectomy for prostate cancer (Clark, Merson et al. 2007). In other studies, TMPRSS2-ERG fusion detected by FISH was present in only 15% to 30% of prostate cancer diagnosed at transurethral resection for benign prostate hyperplasia (BPH) (Demichelis, Fall et al. 2007; Attard, Clark et al. 2008). While prostate cancer at diagnostic prostate needle-biopsies showed TMPRSS2-ERG fusion in 46% by FISH (Mosquera, Mehra et al. 2009), our group recently found nuclear ERG over-expression in 61% using immunohistochemistry (van Leenders, Aalders et al. 2001).
The description of a novel ERG antibody in 2010 highly facilitates detection of ERG genomic fusions in clinical specimens (Ma, Liang et al.). Nuclear staining by the EPR3864 antibody showed excellent concordance with the presence of TMPRSS2-ERG fusion detected by FISH or QPCR (van Leenders, Aalders et al. 2001; Ma, Liang et al. 2011). Although cross-reactivity of the EPR3864 antibody with ETS family member FLI-1 has been reported by the manufacturer, we demonstrated lack of FLI-1 expression in prostate cancer, indicating that the antibody actually detects ERG protein in this disease (van Leenders, Aalders et al.). In the current study we found concordance of nuclear ERG expression and TMPRSS2-ERG fusion in seven human prostate cancer cell lines and 22 xenografts, with exception of xenografts PC133, PC324 and PC339, which have breakpoint in intron 1 of TMPRSS2 (Hermans, van Marion et al. 2006; Mertz, Setlur et al. 2007; Saramaki, Harjula et al. 2008).
We identified ERG expression in 65% of prostate cancer patients treated by radical prostatectomy. The prevalence of ERG over-expression is well in line with our earlier study on ERG immunohistochemistry in 61% of prostate cancer diagnosed on needle-biopsies and earlier studies on TMPRSS2-ERG fusion in prostate cancer (van Leenders, Aalders et al. 2001). One-tenth of prostate cancer revealed heterogeneity of ERG expression between different tissues cores taken from the same tumor, which corresponds with other studies on genomic fusion heterogeneity in prostate cancer (van Leenders, Aalders et al. 2001; Zhang, Pavlovitz et al. 2010).
Chap
ter 3
Proefschrift#8_DEF.indd 70 25-08-15 16:42

71
Correlation of ERG immunohistochemistry with clinico-pathologic parameters in this population of 481 prostate cancer patients revealed that expression of ERG occurred significantly more frequent in patients with PSA ≤10 ng/mL (p=0.024). There was no statistically significant relation between ERG immunohistochemistry and age, Gleason score, pT-stage or surgical margin status. While an association of ERG fusion with low Gleason score was identified in other prostate cancer cohorts (Darnel, Lafargue et al. 2009; Fine, Gopalan et al. 2010), others did not (Rajput, Miller et al. 2007). Using logistic regression we did not find a statistically significant predictive value of immunohistochemical ERG expression on radical prostatectomy with subsequent biochemical or clinical recurrence, overall death or disease-specific death. Although predictive value of TMPRSS2-ERG fusion for biochemical recurrence and death has been reported by some studies (Perner, Demichelis et al. 2006; Attard, Clark et al. 2008; Mehra, Tomlins et al. 2008; Yoshimoto, Joshua et al. 2008), ERG fusion with deletion and duplication of the 5’-end (Edel and 2+Edel) has specifically been associated with worse outcome (Perner, Demichelis et al. 2006; Attard, Clark et al. 2008; Mehra, Tomlins et al. 2008; Yoshimoto, Joshua et al. 2008). Obviously, immunohistochemistry is not able to identify the genetic aberration leading to ERG over-expression. It remains to be elucidated whether TMPRSS2-ERG fusion by deletion or duplication is causally related to worse outcome, or merely reflect general genetic imbalance.
As transcription of the ERG fusion partner TMPRSS2 is regulated by androgen receptor, it is hypothesized that androgen receptor and ERG signalling are functionally related. Such a mechanism was proposed because androgen receptor signalling induced TOP2B-mediated double-strands DNA breaks with de novo TMPRSS2-ERG fusion in LAPC4 and LNCaP cells (Haffner, Aryee et al. 2010). On the other hand, ERG inhibits androgen receptor signalling by reducing receptor expression and activity, together with the induction of repressive epigenetic programs (Yu, Mani et al. 2010). In this study, we investigated the relationship between the ERG and androgen receptor pathways as reflected by the respective protein expression in clinical specimens. Our results showed that increased androgen receptor expression is significantly correlated with higher ERG levels in single cores. Moreover, androgen receptor expression levels in ERG negative cases were statistically similar to those in cases with moderate ERG expression. In order to avoid scoring artefacts, we used endothelial and stromal cells as internal controls for ERG and androgen receptor, respectively, in each case. The present findings suggest that there is no repressive effect of ERG signalling on androgen receptor expression in clinical specimens. The fact that androgen receptor expression in ERG negative cores was similar to its expression in moderate ERG positive cases furthermore reflects a more complex
Chap
ter 3
Chapter 3: ERG immunohistochemistry is not predictive for PSA recurrence, local recurrence or overall survival after radical prostatectomy for prostate cancer
Proefschrift#8_DEF.indd 71 25-08-15 16:42

72 Discovery and Validation of Prognostic Tissue Markers in Clinical Prostate Cancer – © 2015, A.M. Hoogland
relation of both important pathways.
This study including 481 patients is one of the largest study cohorts on ERG
prognostic value until now and included the well-defined European Randomized
Study of Screening for Prostate Cancer population. This screening study has shown
that PSA-based screening reduced the rate of death from prostate cancer (Schroder,
Hugosson et al. 2009). Part of the screening protocol is pathologic revision of all
radical prostatectomy specimens by a pathologist with expertise in urologic
pathology. In addition, the protocol ensures uniformity in tumor detection, and
monitoring of relevant clinical, pathologic and follow-up parameters.
While ERG immunohistochemistry is easy to perform and interpret, it does not
reveal qualitative information on the ERG genomic fusion. It cannot distinguish
whether fusion to TMPRSS2 or another fusion partner causes ERG over-expression
(Tomlins, Laxman et al. 2007; Esgueva, Demichelis et al. 2009; Ma, Liang et al.
2011). Likewise, with immunohistochemistry no distinction can be made between
genomic deletion, insertion or duplication leading to ERG over-expression. While
immunohistochemical analysis was performed by visual semi-quantitative scoring
by two independent researchers and not by automated imaging, we have previously
shown that semi-quantitative his scoring correlated with quantitative ERG mRNA
levels (Ma, Liang et al. 2011).
Conclusions
Immunohistochemical based ERG expression in a well-defined screening cohort
of 481 prostate cancer patients revealed no statistical relationship between
ERG expression and tumor recurrence or death. Therefore, we conclude that
immunohistochemical ERG expression does not have a role in the prognostic
stratification of prostate cancer patients after radical prostatectomy.
Chap
ter 3
Proefschrift#8_DEF.indd 72 25-08-15 16:42

73
Acknowledgements
This research was sponsored by CTMM, project PCMM, project number 03O-203.
Chap
ter 3
Chapter 3: ERG immunohistochemistry is not predictive for PSA recurrence, local recurrence or overall survival after radical prostatectomy for prostate cancer
Proefschrift#8_DEF.indd 73 25-08-15 16:42

74 Discovery and Validation of Prognostic Tissue Markers in Clinical Prostate Cancer – © 2015, A.M. Hoogland
References 1. Tomlins SA, Rhodes DR, Perner S, et al. Recurrent fusion of TMPRSS2 and ETS transcription
factor genes in prostate cancer. Science 2005; 310:644-8.
2. Helgeson BE, Tomlins SA, Shah N, et al. Characterization of TMPRSS2:ETV5 and SLC45A3:ETV5 gene fusions in prostate cancer. Cancer Res 2008; 68:73-80.
3. Tomlins SA, Bjartell A, Chinnaiyan AM, et al. ETS gene fusions in prostate cancer: from discovery to daily clinical practice. Eur Urol 2009; 56:275-86.
4. Tomlins SA, Laxman B, Varambally S, et al. Role of the TMPRSS2-ERG gene fusion in prostate cancer. Neoplasia 2008; 10:177-88.
5. Albadine R, Latour M, Toubaji A, et al. TMPRSS2-ERG gene fusion status in minute (minimal) prostatic adenocarcinoma. Mod Pathol 2009; 22:1415-22.
6. Attard G, Clark J, Ambroisine L, et al. Duplication of the fusion of TMPRSS2 to ERG sequences identifies fatal human prostate cancer. Oncogene 2008; 27:253-63.
7. Mehra R, Tomlins SA, Yu J, et al. Characterization of TMPRSS2-ETS gene aberrations in androgen-independent metastatic prostate cancer. Cancer Res 2008; 68:3584-90.
8. Hermans KG, Boormans JL, Gasi D, et al. Overexpression of prostate-specific TMPRSS2(exon 0)-ERG fusion transcripts corresponds with favorable prognosis of prostate cancer. Clin Cancer Res 2009; 15:6398-403.
9. Park K, Tomlins SA, Mudaliar KM, et al. Antibody-based detection of ERG rearrangement-positive prostate cancer. Neoplasia 2010; 12:590-8.
10. Geert J.L.H. van Leenders JLB, Cornelis J. Vissers, A. Marije Hoogland, Anke A.J.W.M. Bressers, Bungo Furusato, Jan Trapman. Antibody EPR3864 is specific for ERG genomic fusions in prostate cancer: implications for pathology practice. Mod Pathol 2011; In press.
11. Balk SP, Knudsen KE. AR, the cell cycle, and prostate cancer. Nucl Recept Signal 2008; 6:e001.
12. Richter E, Srivastava S, Dobi A. Androgen receptor and prostate cancer. Prostate Cancer Prostatic Dis 2007; 10:114-8.
13. Yu J, Mani RS, Cao Q, et al. An integrated network of androgen receptor, polycomb, and TMPRSS2-ERG gene fusions in prostate cancer progression. Cancer Cell 2010; 17:443-54.
14. Roobol MJ, Kirkels WJ, Schroder FH. Features and preliminary results of the Dutch centre of the ERSPC (Rotterdam, the Netherlands). BJU Int 2003; 92 Suppl 2:48-54.
15. Schroder FH, Hugosson J, Roobol M, et al. Screening and prostate-cancer mortality in a randomized European study. the New England Journal of Medicine 2009; 360:1320-8.
16. Hermans KG, van Marion R, van Dekken H, et al. TMPRSS2:ERG fusion by translocation or interstitial deletion is highly relevant in androgen-dependent prostate cancer, but is bypassed in late-stage androgen receptor-negative prostate cancer. Cancer Res 2006; 66:10658-63.
17. Mertz KD, Setlur SR, Dhanasekaran SM, et al. Molecular characterization of TMPRSS2-ERG gene fusion in the NCI-H660 prostate cancer cell line: a new perspective for an old model. Neoplasia 2007; 9:200-6.
18. Saramaki OR, Harjula AE, Martikainen PM, et al. TMPRSS2:ERG fusion identifies a subgroup of prostate cancers with a favorable prognosis. Clin Cancer Res 2008; 14:3395-400.
Chap
ter 3
Proefschrift#8_DEF.indd 74 25-08-15 16:42

75
19. Boormans JL, Hermans KG, Made AC, et al. Expression of the androgen-regulated fusion gene TMPRSS2-ERG does not predict response to endocrine treatment in hormone-naive, node-positive prostate cancer. Eur Urol 2010; 57:830-5.
20. Perner S, Mosquera JM, Demichelis F, et al. TMPRSS2-ERG fusion prostate cancer: an early molecular event associated with invasion. Am J Surg Pathol 2007; 31:882-8.
21. Nam RK, Sugar L, Yang W, et al. Expression of the TMPRSS2:ERG fusion gene predicts cancer recurrence after surgery for localised prostate cancer. Br J Cancer 2007; 97:1690-5.
22. Nam RK, Sugar L, Wang Z, et al. Expression of TMPRSS2:ERG gene fusion in prostate cancer cells is an important prognostic factor for cancer progression. Cancer Biol Ther 2007; 6:40-5.
23. Morris DS, Tomlins SA, Montie JE, Chinnaiyan AM. The discovery and application of gene fusions in prostate cancer. BJU Int 2008; 102:276-82.
24. Clark J, Merson S, Jhavar S, et al. Diversity of TMPRSS2-ERG fusion transcripts in the human prostate. Oncogene 2007; 26:2667-73.
25. Demichelis F, Fall K, Perner S, et al. TMPRSS2:ERG gene fusion associated with lethal prostate cancer in a watchful waiting cohort. Oncogene 2007; 26:4596-9.
26. Mosquera JM, Mehra R, Regan MM, et al. Prevalence of TMPRSS2-ERG fusion prostate cancer among men undergoing prostate biopsy in the United States. Clin Cancer Res 2009; 15:4706-11.
27. Zhang S, Pavlovitz B, Tull J, et al. Detection of TMPRSS2 gene deletions and translocations in carcinoma, intraepithelial neoplasia, and normal epithelium of the prostate by direct fluorescence in situ hybridization. Diagn Mol Pathol 2010; 19:151-6.
28. Darnel AD, Lafargue CJ, Vollmer RT, Corcos J, Bismar TA. TMPRSS2-ERG fusion is frequently observed in Gleason pattern 3 prostate cancer in a Canadian cohort. Cancer Biol Ther 2009; 8:125-30.
29. Fine SW, Gopalan A, Leversha MA, et al. TMPRSS2-ERG gene fusion is associated with low Gleason scores and not with high-grade morphological features. Mod Pathol 2010; 23:1325-33.
30. Rajput AB, Miller MA, De Luca A, et al. Frequency of the TMPRSS2:ERG gene fusion is increased in moderate to poorly differentiated prostate cancers. J Clin Pathol 2007; 60:1238-43.
31. Perner S, Demichelis F, Beroukhim R, et al. TMPRSS2:ERG fusion-associated deletions provide insight into the heterogeneity of prostate cancer. Cancer Res 2006; 66:8337-41.
32. Yoshimoto M, Joshua AM, Cunha IW, et al. Absence of TMPRSS2:ERG fusions and PTEN losses in prostate cancer is associated with a favorable outcome. Mod Pathol 2008; 21:1451-60.
33. Haffner MC, Aryee MJ, Toubaji A, et al. Androgen-induced TOP2B-mediated double-strand breaks and prostate cancer gene rearrangements. Nat Genet 2010; 42:668-75.
34. Esgueva R, Demichelis F, Rubin MA. TMPRSS2-ERG gene fusions are infrequent in prostatic ductal adenocarcinomas. Mod Pathol 2009; 22:1398-9; author reply 9-40.
35. Tomlins SA, Laxman B, Dhanasekaran SM, et al. Distinct classes of chromosomal rearrangements create oncogenic ETS gene fusions in prostate cancer. Nature 2007; 448:595-9.
Chap
ter 3
Chapter 3: ERG immunohistochemistry is not predictive for PSA recurrence, local recurrence or overall survival after radical prostatectomy for prostate cancer
Proefschrift#8_DEF.indd 75 25-08-15 16:42

76 Discovery and Validation of Prognostic Tissue Markers in Clinical Prostate Cancer – © 2015, A.M. Hoogland
Table 1. Prostate cancer xenografts (n=22) and cell lines (n=7) included in the tissue micro-array, together with molecular ETS-fusion status and immunohistochemical expression of ERG and androgen receptor (AR). Negative (-) ETS fusion status indicates that no fusion of ETS transcription factors has been identified.
Source ETS fusion status Immunohistochemistry
ERG AR
Xenograft
DuCaP TMPRSS2:ERG Ê Ê
LAPC4 – – Ê
LnCaP ETV1 translocation – Ê
PC82 TMPRSS2:ERG Ê Ê
PC133 TMPRSS2:ERG* – –
PC135 – – –
PC295 TMPRSS2:ERG Ê Ê
PC310 TMPRSS2:ERG Ê Ê
PC324 TMPRSS2:ERG* – –
PC339 TMPRSS2:ERG* – –
PC346B – – Ê
PC374 TMPRSS2:ETV1 – Ê
VCaP TMPRSS2:ERG Ê Ê
Cell line
Du145N – – –
LAPC4 – – Ê
LNCaP ETV1 translocation – Ê
PC3 – – –
PC346C – – Ê
VCaP TMPRSS2:ERG Ê Ê
22RV1 – – Ê
* TMPRSS2: ERG fusion with breakpoint in TMPRSS2 intron 1, with no known ERG expression.
Chap
ter 3
Proefschrift#8_DEF.indd 76 25-08-15 16:42

77
Table 2. Clinico-pathologic and follow-up information of prostate cancer patients treated by radical prostatectomy.
Clinico-pathologic parameter Mean (median; range) or n (%)
Age (years) 64.76 (65.4; 55.4-75.1)
PSA level (ng/mL) Total 7.23 (5.2; 0.3-125.2)
≤10 ng/mL 418 (87%)
>10 ng/mL 62 (13%)
Unknown 1 (0%)
Follow-up (months) 107.3 (112.2; 0.00-203.8)
Gleason score <7 265 (55%)
7 188 (39%)
3+4 153 (32%)
4+3 35 (7%)
>7 28 (6%)
pT-stage (TNM 2002) T2 343 (71%)
T3a 93 (19%)
T3b 17 (4%)
T4 28 (6%)
Lymph node metastasis Yes 1 (0%)
No 480 (100%)
Surgical margins Positive 119 (25%)
Negative 362 (75%)
Biochemical recurrence Yes 110 (23%)
No 371 (77%)
Local recurrence Yes 21 (4%)
No 460 (96%)
Overall death Yes 81 (17%)
No 399 (83%)
Unknown 1 (0%)
Death from prostate cancer Yes 9 (11%)
No 57 (70%)
Unknown 15 (19%)
Chap
ter 3
Chapter 3: ERG immunohistochemistry is not predictive for PSA recurrence, local recurrence or overall survival after radical prostatectomy for prostate cancer
Proefschrift#8_DEF.indd 77 25-08-15 16:42

78 Discovery and Validation of Prognostic Tissue Markers in Clinical Prostate Cancer – © 2015, A.M. Hoogland
Table 3. Correlation of immunohistochemical ERG expression with clinico-pathologic parameters at radical prostatectomy.
Parameter ERG expression p-value
Negative Positive
Age (years) (mean;range) 64.4 (63.7-65.1) 64.5 (64.0-65.0) 0.824
PSA level ≤10 ng/ml 125 (82%) 253 (89%)0.024>10 ng/ml 28 (18%) 30 (11%)
Gleason score <7 72 (47%) 164 (58%)
0.0697 66 (43%) 107 (38%)
3+4 54 (35%) 88 (31%)
4+3 12 (8%) 19 (7%)
>7 15 (10%) 13 (4%)
pT-stage pT2 115 (75%) 191 (67%)0.185pT3a 22 (14%) 65 (23%)
pT3b 7 (5%) 10 (4%)
pT4 9 (6%) 18 (6%)
Surgical margin Positive 39 (26%) 72 (25%)0.975Negative 114 (74%) 212 (75%)
Table 4. Predictive value of ERG expression for post-operative biochemical recurrence.
Parameter Univariate analysis Multivariate analysis
HR (95% CI) p-value HR (95% CI) p-value
Age 1.06 (1.01-1.10) 0.018 1.03 (0.98-1.09) 0.204
PSA 1.03 (1.02-1.04) <0.001 1.01 (1.00-1.03) 0.011
Gleason score 2.03 (1.65-2.51) <0.001 1.45 (1.13-1.85) 0.003
pT-stage 1.81 (1.55-2.13) <0.001 1.39 (1.14-1.70) 0.001
Surgical margin 3.10 (2.13-4.51) <0.001 2.23 (1.46-3.42) <0.001
ERG expression 1.12 (0.74-1.71) 0.584 1.18 (0.77-1.81) 0.452
HR = Hazard ratioCI = Confidence IntervalPSA = Prostate Specific Antigen
Chap
ter 3
Proefschrift#8_DEF.indd 78 25-08-15 16:42

79
Table 5. Predictive value of ERG expression for post-operative local recurrence.
Parameter Univariate analysis Multivariate analysis
HR (95% CI) p-value HR (95% CI) p-value
Age 0.96 (0.87-1.06) 0.446 0.92 (0.83-1.02) 0.108
PSA 1.03 (1.01-1.05) 0.002 1.02 (1.00-1.04) 0.138
Gleason score 1.76 (1.10-2.81) 0.019 1.42 (0.84-2.39) 0.188
pT-stage 1.56 (1.07-2.26) 0.021 1.05 (0.64-1.71) 0.853
Surgical margin 4.18 (1.76-9.93) 0.001 3.24 (1.19-8.81) 0.021
ERG expression 0.88 (0.35-2.23) 0.782 0.93 (0.36-2.39) 0.872
HR = Hazard ratioCI = Confidence IntervalPSA = Prostate Specific Antigen
Table 6. Predictive value of ERG expression for overall death.
Parameter Univariate analysis Multivariate analysis
HR (95% CI) p-value HR (95% CI) p-value
Age 1.11 (1.05-1.17) <0.001 1.13 (1.06-1.20) <0.001
PSA 1.02 (1.00-1.03) 0.017 1.03 (1.01-1.04) 0.001
Gleason score 1.13 (0.87-1.48) 0.349 1.09 (0.81-1.46) 0.587
pT-stage 0.99 (0.78-1.27) 0.951 0.76 (0.55-1.03) 0.080
Surgical margin 1.21 (0.75-1.94) 0.440 1.14 (0.68-1.91) 0.630
ERG expression 1.33 (0.80-2.23) 0.272 1.51 (0.89-2.57) 0.125
HR = Hazard ratioCI = Confidence IntervalPSA = Prostate Specific Antigen
Chap
ter 3
Chapter 3: ERG immunohistochemistry is not predictive for PSA recurrence, local recurrence or overall survival after radical prostatectomy for prostate cancer
Proefschrift#8_DEF.indd 79 25-08-15 16:42

80 Discovery and Validation of Prognostic Tissue Markers in Clinical Prostate Cancer – © 2015, A.M. Hoogland
Figure 1. Left column; Expression of ERG in Prostate cancer, right column; Expression of AR in corresponding tissue cores. A) ERG intensity 3+ B) AR intensity 2+ C) ERG intensity 1+ D) AR intensity 2+ E) ERG intensity - F) AR intensity 2+
In A, C and E, endothelial cells with intensity 3+ are internal controls. Original magnifications x400.
Chap
ter 3
Proefschrift#8_DEF.indd 80 25-08-15 16:42

81
Figure 2. Cumulative bar chart showing the associations of nuclear ERG and androgen receptor expression. For androgen receptor, weak (1+) expression is depicted in white, moderate (2+) expression in gray and strong (3+) expression in black.
0%
20%
40%
60%
80%
100%
Negative 1+ 2+ 3+
ERG expression
Subd
ivis
ion
of A
R ex
pres
sion
Chap
ter 3
Chapter 3: ERG immunohistochemistry is not predictive for PSA recurrence, local recurrence or overall survival after radical prostatectomy for prostate cancer
Proefschrift#8_DEF.indd 81 25-08-15 16:42

82 Discovery and Validation of Prognostic Tissue Markers in Clinical Prostate Cancer – © 2015, A.M. Hoogland
Proefschrift#8_DEF.indd 82 25-08-15 16:42

83
Chapter 4
Validation of stem cell markers in clinical prostate cancer: α6-Integrin is predictive for non-aggressive
disease
A. Marije Hoogland MD1, Esther I. Verhoef BASc1, Monique J. Roobol MSc, PhD2, Fritz H. Schröder MD, Professor, PhD2, Mark F. Wildhagen PhD2, Theo H. van
der Kwast MD, Professor, PhD3, Guido Jenster Professor, PhD2, Geert J.L.H. van Leenders MD, PhD1
Dept. of Pathology1 and Urology2, Erasmus Medical Center, Rotterdam, The Netherlands and 3Dept. of Pathology, University Health Network, Toronto, Canada.
Hoogland AM, Verhoef EI, Roobol MJ, Schröder FH, Wildhagen MF, van der Kwast TH, Jenster G, van Leenders GJ. “Validation of stem cell markers in clinical
prostate cancer: α6-integrin is predictive for non-aggressive disease.”, Prostate. 2014. 74(5):488-96.
Chap
ter 4
Chapter 4: Validation of stem cell markers in clinical prostate cancer: α6-Integrin is predictive for non-aggressive disease
Proefschrift#8_DEF.indd 83 25-08-15 16:42

84 Discovery and Validation of Prognostic Tissue Markers in Clinical Prostate Cancer – © 2015, A.M. Hoogland
Abstract
IntroductionStem cells are postulated to mediate prostate cancer progression, and encompass a small tumor cell fraction. Various proteins (α2-integrin, α6-integrin, CD117, CD133, EZH2, OCT3/4) are associated with a prostate cancer stem cell phenotype in cell lines and xenografts. Objective was to investigate expression of stem cell markers in clinical prostate cancer in relation to outcome.
MethodsWe validated immunohistochemical expression of markers on 481 prostate cancer patients and correlated expression with clinicopathologic parameters.
ResultsSporadic expression of α2-integrin was present in a fraction of tumor cells (<5%) in 94.7% of tumors and associated with PSA>10 ng/ml(p=0.04). α6-integrin expression (<5%) occurred in 28.4% patients, while ≥5% α6-integrin expression was associated with PSA≤10 ng/ml(p=0.01), Gleason score <7(p<0.01) and pT2-disease(p=0.02). α6-integrin was predictive for biochemical recurrence(p<0.01), independent predictive for local recurrence (p=0.03) and disease specific death(p=0.03). EZH2 expression was generally low with 2.6% of tumors showing ≥1% positive cells. EZH2 was associated with Gleason score ≥7(p=0.01) and biochemical recurrence(p=0.01). We did not identify expression of CD117, CD133 and OCT3/4 in prostate cancer samples.
DiscussionIn conclusion, expression of α2-integrin and EZH2 in a small fraction of prostate cancer cells is supportive for their role as stem cell marker. Although α6-integrin was not a unique stem cell marker, it was independently predictive for prostate cancer biochemical and local recurrence, and disease specific death. The validity of CD117, CD133 and OCT3/4 as prostate cancer stem cell marker is questionable since these proteins were not expressed in clinical prostate cancer.
Chap
ter 4
Proefschrift#8_DEF.indd 84 25-08-15 16:42

85
Introduction
Human prostate cancer consists of at least three different cell populations. The luminal exocrine epithelial cell is the predominant cell type in prostate cancer, while scattered neuro-endocrine cells are present in most tumors. Although basal cells are lacking, a luminal cell population has been characterized by co-expression of luminal exocrine and basal markers in prostate cancer (Verhagen, Ramaekers et al. 1992; van Leenders, Aalders et al. 2001). This intermediate cell population is characterized by expression of basal cell Keratin 5 (K5) together with luminal cell Keratin 18 (K18). Because the number of intermediate cells is increased in androgen-deprived and hormone-refractory prostate cancer, intermediate cells are considered to be independent of androgens for their survival (van Leenders, Aalders et al. 2001). Intermediate cell populations have been postulated to harbor stem cells of prostate cancer, which mediate tumor expansion and hormone-refractory disease progression (De Marzo, Meeker et al. 2003; van Leenders and Schalken 2003).
Magnetic- and Fluorescence-Activated Cell Sorting using labeled antibodies targeting various membranous markers are generally used to isolate subpopulations of cells with putative stem cell properties, and study their biological properties in vitro and in rodents. Epithelial cells immunophenotypically characterized as α2-integrin+/CD133+, CD44+/CD24- and Lin-/Sca-1+/CD133+/CD44+/CD117+ have high proliferative activity, potential for multi-directional differentiation and efficient tumor-forming capacity, supporting their putative role as stem cells (Collins, Berry et al. 2005; Patrawala, Calhoun et al. 2006; Patrawala, Calhoun-Davis et al. 2007; Hurt, Kawasaki et al. 2008; Leong, Wang et al. 2008; Vander Griend, Karthaus et al. 2008). Most studies on stem cells in prostate cancer are performed using cell populations isolated from cell line models and xenografts (Hurt, Kawasaki et al. 2008; Leong, Wang et al. 2008; Van Slambrouck, Jenkins et al. 2009; Karanikolas, Figueiredo et al. 2010; Pfeiffer and Schalken 2010; Ma, Liang et al. 2011; van Leenders, Sookhlall et al. 2011; Kong, Heath et al. 2012). Other groups have isolated specific cell populations from clinical prostate specimens using short term cultures (Collins, Habib et al. 2001; Richardson, Robson et al. 2004; Collins, Berry et al. 2005). Little is known on the actual expression of stem cell-related markers in clinical prostate cancer specimens and their association with clinicopathologic parameters. The aim of this study was to analyze the expression of putative stem cell markers in a large set of clinical prostate cancer specimens and to correlate their expression with clinicopathologic parameters.
Chap
ter 4
Chapter 4: Validation of stem cell markers in clinical prostate cancer: α6-Integrin is predictive for non-aggressive disease
Proefschrift#8_DEF.indd 85 25-08-15 16:42

86 Discovery and Validation of Prognostic Tissue Markers in Clinical Prostate Cancer – © 2015, A.M. Hoogland
Material and methods
Clinical specimensA total of 481 patients diagnosed with prostate cancer in the scope of the European Randomized Study of Screening for Prostate Cancer (ERSPC), Rotterdam section, were included in this study. All patients had undergone radical prostatectomy for their disease without previous radiation or hormonal therapy, in Erasmus Medical Center between 1987 and 2010 (Roobol, Kirkels et al. 2003; Schroder, Hugosson et al. 2009). All radical prostatectomies had been entirely embedded for histopathological diagnosis and were evaluated by a certified pathologist with expertise in urogenital pathology (GvL, TvdK), who determined the Gleason score, pT-stage (WHO 2004) and surgical margins. Clinical follow-up was recorded after each control visit at our outpatient clinic, and data were transmitted to the central study database. Post-operative biochemical recurrence was defined as an increase in serum PSA after two different measurements, at least three months apart. Suspicion of local recurrence was verified by a diagnostic needle-biopsy in each case. Death and death of disease was registered by the physician who last treated the patient (Roobol, Kirkels et al. 2003; Schroder, Hugosson et al. 2009). As described previously, a Tissue Micro-Array was constructed including three representative cylindrical cores (diameter 0.6 mm) of each radical prostatectomy (Beecher Microarryer, Beecher Instruments, Sun Prairie, USA) (Hoogland, Jenster et al. 2012). Use of tissue samples in this study was approved by the Erasmus Medical Center Medical Ethics Committee (MEC-2011-295) according to the Medical Research Involving Human Subjects Act and written informed consent was obtained from all participants in the ERSPC.
ImmunohistochemistryTissue slides (5 μm) were mounted on aminoacetylsilane coated glass slides (Starfrost; Berlin, Germany), deparaffinised in xylene and dehydrated in ethanol. Endogenous peroxidase activity was blocked by 1% hydrogen peroxide in methanol for 20 min. Microwave (700 W) pretreatment in TRIS (hydroxymethyl)aminomethane-EDTA (pH 9.0) was performed for 15 min. The slides were incubated with primary antibodies targeting α2-integrin (1:100; clone sc-74466; Santa Cruz, Heidelberg, Germany), α6-integrin (1:100; clone sc-10730; Santa Cruz, Heidelberg, Germany), CD117 (1:25; clone A4502; DAKO, Heverlee, Belgium), CD133 (1:100; clone AC133; Macs Miltenyi Biotec, Auburn, CA, USA), OCT3/4 (1:350; clone sc-5279; Santa Cruz, Heidelberg, Germany) and EZH2 (1:200; BD Biosciences, Franklin Lakes, NJ, USA) followed by chromogenic visualization using the EnVision DAKO kit (DAKO, Glostrup, Denmark). After counterstaining with hematoxylin, slides were thoroughly washed, dehydrated, cleared in xylene and mounted in malinol (Chroma-Geselschaft, Körgen, Germany).
Chap
ter 4
Proefschrift#8_DEF.indd 86 25-08-15 16:42

87
Antibody expression was scored by two investigators (MH, GvL) in a blinded setting. In a combined session, consensus on expression value was reached in all cases. Subcellular location, percentage of positive tumor cells as determined by manually counting positive and total tumor cells, and cytoplasmatic staining intensity were determined. Staining intensity was scored as negative (0; no staining), weak (1+; only visible at high magnification), moderate (2+; visible at low magnification) and strong (3+; striking at low magnification). If there was heterogeneous expression, the strongest intensity was used for further analyses.
StatisticsFor each immunohistochemical parameter, the average of the tissue microarray cores was calculated per patient. Based on the hypothesis that stem cells only represent a small fraction of total tumor cells, and on marker-specific expression variance, we used cut-offs of 5% (α2-integrin, α6-integrin) or 1% (EZH2). Statistical associations between marker expression and continuous clinicopathologic parameters (age and PSA at time of diagnosis) were analyzed using Student’s t-test, and with categorical parameters (Gleason score, pT-stage and surgical margins) using Pearson’s Chi-square (X2) test. To determine whether expression was predictive for biochemical recurrence, local recurrence or death, we used uni- and multivariate Cox regression with stepwise backward entering of covariates. A two-sided p-value <0.05 was considered significant. All statistics were performed using SPSS 20 (SPSS Inc., Chicago, USA).
Chap
ter 4
Chapter 4: Validation of stem cell markers in clinical prostate cancer: α6-Integrin is predictive for non-aggressive disease
Proefschrift#8_DEF.indd 87 25-08-15 16:42

88 Discovery and Validation of Prognostic Tissue Markers in Clinical Prostate Cancer – © 2015, A.M. Hoogland
Results
Patient characteristicsThe mean age of the patients undergoing radical prostatectomy was 64.8 years (range 55.4-75.1 years). Mean PSA at time of diagnosis was 7.2 ng/ml (range 0.3-125.2 ng/ml). The pathological Gleason score was <7 in 265 (55%), 7 in 188 (39%) and >7 in 28 (6%) cases, respectively. In total 343 (71%) tumors were organ-confined (pT2) and 138 (29%) cases showed extra-prostatic expansion (pT3/4). Surgical margins were positive in 119 (25%) cases. The mean follow-up of our cohort was 113.3 months. The clinicopathological characteristics are summarized in table I.
Immunohistochemical expressionMembranous α2-integrin expression occurred in a small subpopulation of prostate cancer cells (<5%) in 94.7% (397/419) of the radical prostatectomies (Figure 1A), with more abundant expression (≥5%) in 5.3% (22/419) (Figure 1B).
Membranous α6-integrin expression in <5% of tumor cells was found in 28.4% (114/401) (Figure 1C); more than focal (≥5%) membranous α6-integrin expression was found in 71.6% (287/401) patients (Figure 1D). Cytoplasmatic α6-integrin expression occurred in 96.4% of the patients, with expression intensity of 1+ in 507%, 2+ in 41.5 percent and intensity 3+ in 4.0% of the patients. Nuclear expression of the Polycomb-protein EZH2 (Enhancer of Zeste Homolog 2) was generally rare with absence in 58.3% (249/427) prostate cancers, expression <1% in 39.1% (167/427) (Figure 1E) and expression ≥ 1% in 2.6% (11/427) of patients (Figure 1F). We were not able to detect any expression of CD133 (PROM1) in prostate cancer. CD133 was however, expressed at the apical membrane of luminal epithelium particularly in atrophic glands (Figure 1G and 1H). We did not find any membranous expression of CD117 (c-KIT) or nuclear expression of OCT3/4 (Octamer-binding transcription factor 3 and 4) in prostate cancer specimens, while mast cells and seminoma served as internal and external positive controls, respectively.
Clinicopathologic correlationsExpression of α2-integrin occurred significantly less frequently in patients with PSA ≤10 ng/ml (p=0.04). EZH2 expression in ≥1% of tumor cells was associated with Gleason score ≥7 (p=0.01). Interestingly, α6-integrin expression was significantly higher in patients with PSA ≤10 ng/ml (p=0.01), Gleason score <7 (p<0.01) and organ-confined (pT2) prostate cancer (p=0.02). Table II. No relevant correlations were found between cytoplasmatic α6-integrin staining intensity and clinicopathologic parameters (data not shown).
Chap
ter 4
Proefschrift#8_DEF.indd 88 25-08-15 16:42

89
EZH2 was predictive for biochemical recurrence (HR 2.94 (1.36-6.37); p=0.01) in univariate analysis, but not in multivariate analysis. α2-integrin did not have independent predictive value for biochemical recurrence (p=0.25) or local recurrence (p=0.93). Absence of α6-integrin was predictive for biochemical recurrence (HR 0.50 (0.34-0.75); p<0.01) in univariate analysis and local recurrence (HR 0.35 (0.14-0.91); p=0.03) in uni- and multivariate analyses; absence of α6-integrin was predictive for disease specific death after radical prostatectomy in multivariate analysis (HR 0.22 (0.06-0.85); p=0.03). Table III, IV, V and VI.
Chap
ter 4
Chapter 4: Validation of stem cell markers in clinical prostate cancer: α6-Integrin is predictive for non-aggressive disease
Proefschrift#8_DEF.indd 89 25-08-15 16:42
90 Discovery and Validation of Prognostic Tissue Markers in Clinical Prostate Cancer – © 2015, A.M. Hoogland
Discussion
In 2005, Collins et al. demonstrated for the first time that a CD44+/α2β1high/CD133+ cell population isolated from human prostate cancer had self-renewal capacity and potency for multi-directional differentiation after short-term culture (Collins, Berry et al. 2005). Various groups confirmed that CD44 and α2β1-integrin expressing cells isolated from xenografts or cell lines had tumor-initiating and invasive properties, while the supplementary role of CD133 remains controversial (Hurt, Kawasaki et al. 2008; Vander Griend, Karthaus et al. 2008; Pfeiffer and Schalken 2010). In addition, CD117, α6-integrin and OCT3/4 expressing subpopulations have been associated with normal and malignant prostate epithelial stem cells (Leong, Wang et al. 2008; Mulholland, Xin et al. 2009). Although the phenotype, biological and molecular characteristics of putative cancer stem cells is focus of interest, little is known on their actual occurrence in clinical prostate cancer.
Prostate cancer stem cells generally embody a small epithelial population in cell isolation studies, usually representing less than 5% of the total tumor. In our immunohistochemical study, we found that α2-integrin and EZH2 were the only two markers which individually fulfilled this quantitative criterion in radical prostatectomy specimens, being expressed in <5% of tumor cells in 94.7% and in <1% of cells in 97.4%, respectively. To our surprise, membranous CD133 and CD117 which both have been used for stem cell isolation, and nuclear OCT3/4 considered relevant for prostate cancer stem cell signaling in cell lines (Collins, Habib et al. 2001; Richardson, Robson et al. 2004; Leong, Wang et al. 2008), were not detectable in our extensive clinical prostate cancer cohort. The fact that CD133 was sporadically expressed at the apical cell membrane of non-malignant luminal epithelium and in atrophic lesions particularly, demonstrates that our immunohistochemical staining methodology was reliable. Variable expression of CD133 has been reported in human prostate cancer tissues. Eaton et al. found punctuate and membranous expression of CD133 in <4% of prostate cancer cells in approximately 50% of bone metastasis and in <1% of cells in radical prostatectomy samples (Eaton, Colombel et al. 2010). Miki et al. showed an inverse correlation between cytoplasmic CD133 and nuclear Androgen receptor expression (Miki, Furusato et al. 2007). Others have not been able to demonstrate any CD133 expression in prostate cancer using four different antibodies including AC133 (Missol-Kolka, Karbanova et al. 2011; Yamamoto, Masters et al. 2012). CD133 protein is a membrane-protein associated with apical cytoplasmic protrusions such as microvilli and stereocilia (Weigmann, Corbeil et al. 1997). Products of the Prominin-1 gene are modified by both alternative splicing and glycolysation (Fargeas, Joester et al. 2004; Vander Griend,
Chap
ter 4
Proefschrift#8_DEF.indd 90 25-08-15 16:42

91
Karthaus et al. 2008). The AC133 antibody, which is generally used for isolation of tumor-initiating cells, recognizes a carbohydrate-specific epitope on an extracellular domain of CD133 (Bidlingmaier, Zhu et al. 2008). We found that CD133 is expressed in subpopulations of luminal secretory cells in the normal prostate and is enriched at the apical membrane of atrophic luminal epithelium, which is in concordance with the findings of Missol-Kolka and colleagues (Missol-Kolka, Karbanova et al. 2011). These atrophic lesions, also termed ‘proliferative inflammatory atrophy’ (PIA) are enriched for intermediate cells and have been proposed to encompass target cells for malignant transformation in the prostate (De Marzo, Marchi et al. 1999; van Leenders, Gage et al. 2003). It is therefore of importance to validate whether cell isolation studies targeting the AC133 epitope in normal prostate epithelium are actually describing the biological potential of luminal intermediate cells.
CD117 has been proposed as prostate cancer stem cell marker together with OCT3/4 in cell lines or xenografts (Leong, Wang et al. 2008; Ma, Liang et al. 2011). Di Lorenzo et al. found CD117 expression, using a polyclonal rabbit antibody against CD117 in 28% of prostate cancer patients treated by radical prostatectomy followed by adjuvant hormonal therapy (Di Lorenzo, Autorino et al. 2004). Increase of CD117 expression in prostate cancer bone metastasis as compared to primary tumors was found by others, using an antibody against the c-terminal of human CD117 (Wiesner, Nabha et al. 2008). We were not able to confirm these findings in our study, in which we did not find any CD117 expression in a large set of radical prostatectomies without treatment. The CD117 staining procedure used in the current study had been optimized for sensitive and specific identification of gastro-intestinal stromal tumors (GIST). After thorough investigation of seven different CD117 antibodies, clone A4502, as was used in our study, was demonstrated to have the highest sensitivity and specificity without any stromal background (Went, Dirnhofer et al. 2004). Data on OCT3/4 immunohistochemistry in human prostate cancer are conflicting with some groups reporting nuclear expression in up to 77%, while others and we were not able to detect any expression (Monsef, Soller et al. 2009; Bae, Su et al. 2010; Ugolkov, Eisengart et al. 2011). These conflicting outcomes are putatively caused by the presence of various OCT3/4 pseudogenes and splice variants together with false-positive antibody staining as has been demonstrated by others and our group (Rijlaarsdam, van Herk et al. 2011).
Chap
ter 4
Chapter 4: Validation of stem cell markers in clinical prostate cancer: α6-Integrin is predictive for non-aggressive disease
Proefschrift#8_DEF.indd 91 25-08-15 16:42

92 Discovery and Validation of Prognostic Tissue Markers in Clinical Prostate Cancer – © 2015, A.M. Hoogland
α6-integrin is a laminin receptor, expressed at the membrane of epithelial cells. It plays an important role in cell to cell communication and cell motility (Colombel, Eaton et al. 2012). Schmelz et al. correlated immunohistochemical α6-integrin expression in prostate needle-biopsies with pathologic parameters of subsequent radical prostatectomy (Schmelz, Cress et al. 2002). They reported α6-integrin expression in 70% of the samples with increased integrin expression correlating with low Gleason score, which corresponds with our findings. Colombel et al. correlated bone metastasis-free survival with immunohistochemical α2-integrin and α6-integrin expression (Colombel, Eaton et al. 2012). They found >5% α6-integrin positive tumor cells in 53.2% of their samples. These samples however were selected with Gleason scores of ≥7 and the presence of bone metastasis, and are difficult to compare to our samples. The abundant expression of α6-integrin in clinical prostate cancer indeed indicates that α6-integrin is present in a much larger cell population than stem cells only. It is striking that α6-integrin expression is statistically strongly associated with non-aggressive tumor features, such as serum PSA ≤ 10 ng/ml, Gleason score < 7 and pT2 stage. High α6-integrin expression even has a predictive value for biochemical recurrence as well as independent predictive value for local recurrence and disease specific death. This contrasts with the association of α2-integrin with higher serum PSA values and of EZH2 with high Gleason score. Although the definition of the cell populations expressing α6-integrin is not clear yet, α6-integrin is a promising marker for non-aggressive clinical prostate cancer.
Although we analyzed expression of six putative stem cell markers in clinical prostate cancer, our current study did not include all available candidate markers. For instance, CD44 and BMI-1 have been associated with prostate cancer stem cells in several studies (Hurt, Kawasaki et al. 2008; Guzman-Ramirez, Voller et al. 2009; Lukacs, Memarzadeh et al. 2010). Previously, others and we have demonstrated that both markers are expressed in a large number of prostate cancer cells (Noordzij, van Steenbrugge et al. 1997; Aaltomaa, Lipponen et al. 2000; van Leenders, Dukers et al. 2007). Based on these studies, both CD44 and BMI-1 seem to be present in much broader cell populations than stem cells only. While the cut-off values of 1% and 5%, as applied in this study are somewhat arbitrary, they have, been determined prospectively, since the same values have been used in previous studies (van Leenders, Dukers et al. 2007; Wolters, Vissers et al. 2009; Colombel, Eaton et al. 2012).
Chap
ter 4
Proefschrift#8_DEF.indd 92 25-08-15 16:42

93
In conclusion, we systematically analyzed the expression pattern of putative stem cell markers in a large set of clinical prostate cancer. The low expression frequency of α2-integrin and EZH2 in prostate cancer is in line with their putative role of prostate cancer stem cell marker. No expression of postulated stem cell markers CD117, CD133 and OCT3/4 was identified in clinical prostate cancer specimens. While expression of α6-integrin is not limited to putative stem cells, it is a promising predictive marker for patients with reduced rate of recurrence and of disease specific death after radical prostatectomy, making α6-integrin a promising marker for non-aggressive clinical prostate cancer.
Chap
ter 4
Chapter 4: Validation of stem cell markers in clinical prostate cancer: α6-Integrin is predictive for non-aggressive disease
Proefschrift#8_DEF.indd 93 25-08-15 16:42

94 Discovery and Validation of Prognostic Tissue Markers in Clinical Prostate Cancer – © 2015, A.M. Hoogland
Acknowledgements
We kindly thank Lisette de Vogel for her support in the immunohistochemical staining process of α2-integrin, α6-integrin, CD117, CD133 and OCT3/4. We kindly thank Frank van de Panne for his graphic support.
This research was sponsored by CTMM, project PCMM, project number 03O-203.
Chap
ter 4
Proefschrift#8_DEF.indd 94 25-08-15 16:42

95
References1. van Leenders GJ, Aalders TW, Hulsbergen-van de Kaa CA, Ruiter DJ, Schalken JA. Expression of
basal cell keratins in human prostate cancer metastases and cell lines. The Journal of pathology 2001;195(5):563-570.
2. Verhagen AP, Ramaekers FC, Aalders TW, Schaafsma HE, Debruyne FM, Schalken JA. Colocalization of basal and luminal cell-type cytokeratins in human prostate cancer. Cancer Res 1992;52(22):6182-6187.
3. De Marzo AM, Meeker AK, Zha S, Luo J, Nakayama M, Platz EA, Isaacs WB, Nelson WG. Human prostate cancer precursors and pathobiology. Urology 2003;62(5 Suppl 1):55-62.
4. van Leenders GJ, Schalken JA. Epithelial cell differentiation in the human prostate epithelium: implications for the pathogenesis and therapy of prostate cancer. Critical reviews in oncology/hematology 2003;46 Suppl:S3-10.
5. Collins AT, Berry PA, Hyde C, Stower MJ, Maitland NJ. Prospective identification of tumorigenic prostate cancer stem cells. Cancer Res 2005;65(23):10946-10951.
6. Hurt EM, Kawasaki BT, Klarmann GJ, Thomas SB, Farrar WL. CD44+ CD24(-) prostate cells are early cancer progenitor/stem cells that provide a model for patients with poor prognosis. Br J Cancer 2008;98(4):756-765.
7. Leong KG, Wang BE, Johnson L, Gao WQ. Generation of a prostate from a single adult stem cell. Nature 2008;456(7223):804-808.
8. Patrawala L, Calhoun T, Schneider-Broussard R, Li H, Bhatia B, Tang S, Reilly JG, Chandra D, Zhou J, Claypool K, Coghlan L, Tang DG. Highly purified CD44+ prostate cancer cells from xenograft human tumors are enriched in tumorigenic and metastatic progenitor cells. Oncogene 2006;25(12):1696-1708.
9. Patrawala L, Calhoun-Davis T, Schneider-Broussard R, Tang DG. Hierarchical organization of prostate cancer cells in xenograft tumors: the CD44+alpha2beta1+ cell population is enriched in tumor-initiating cells. Cancer Res 2007;67(14):6796-6805.
10. Vander Griend DJ, Karthaus WL, Dalrymple S, Meeker A, DeMarzo AM, Isaacs JT. The role of CD133 in normal human prostate stem cells and malignant cancer-initiating cells. Cancer Res 2008;68(23):9703-9711.
11. Karanikolas BD, Figueiredo ML, Wu L. Comprehensive evaluation of the role of EZH2 in the growth, invasion, and aggression of a panel of prostate cancer cell lines. Prostate 2010.
12. Kong D, Heath E, Chen W, Cher ML, Powell I, Heilbrun L, Li Y, Ali S, Sethi S, Hassan O, Hwang C, Gupta N, Chitale D, Sakr WA, Menon M, Sarkar FH. Loss of let-7 up-regulates EZH2 in prostate cancer consistent with the acquisition of cancer stem cell signatures that are attenuated by BR-DIM. PLoS One 2012;7(3):e33729.
13. Ma Y, Liang D, Liu J, Axcrona K, Kvalheim G, Stokke T, Nesland JM, Suo Z. Prostate cancer cell lines under hypoxia exhibit greater stem-like properties. PLoS One 2011;6(12):e29170.
14. Pfeiffer MJ, Schalken JA. Stem cell characteristics in prostate cancer cell lines. Eur Urol 2010;57(2):246-254.
15. van Leenders GJ, Sookhlall R, Teubel WJ, de Ridder CM, Reneman S, Sacchetti A, Vissers KJ, van Weerden W, Jenster G. Activation of c-MET induces a stem-like phenotype in human prostate cancer. PLoS One 2011;6(11):e26753.
16. Van Slambrouck S, Jenkins AR, Romero AE, Steelant WF. Reorganization of the integrin alpha2 subunit controls cell adhesion and cancer cell invasion in prostate cancer. International journal of oncology 2009;34(6):1717-1726.
Chap
ter 4
Chapter 4: Validation of stem cell markers in clinical prostate cancer: α6-Integrin is predictive for non-aggressive disease
Proefschrift#8_DEF.indd 95 25-08-15 16:42

96 Discovery and Validation of Prognostic Tissue Markers in Clinical Prostate Cancer – © 2015, A.M. Hoogland
Chap
ter 4
17. Collins AT, Habib FK, Maitland NJ, Neal DE. Identification and isolation of human prostate epithelial stem cells based on alpha(2)beta(1)-integrin expression. Journal of cell science 2001;114(Pt 21):3865-3872.
18. Richardson GD, Robson CN, Lang SH, Neal DE, Maitland NJ, Collins AT. CD133, a novel marker for human prostatic epithelial stem cells. Journal of cell science 2004;117(Pt 16):3539-3545.
19. Roobol MJ, Kirkels WJ, Schroder FH. Features and preliminary results of the Dutch centre of the ERSPC (Rotterdam, the Netherlands). BJU Int 2003;92 Suppl 2:48-54.
20. Schroder FH, Hugosson J, Roobol M, Tammela TLJ, Ciatto S, Nelen V, Kwiatkowski M, Lujan M, Lilja H, Zappa M, Denis LJ, Recker F, Berenguer A, Maattanen L, Bangma CH, Aus G, Villers A, Rebillard X, Kwast THvd, Blijenberg BG, Moss SM, Koning HJd, Auvinen A. Screening and prostate-cancer mortality in a randomized European study. the New England Journal of Medicine 2009;360:1320-1328.
21. Hoogland AM, Jenster G, van Weerden WM, Trapman J, van der Kwast T, Roobol MJ, Schroder FH, Wildhagen MF, van Leenders GJ. ERG immunohistochemistry is not predictive for PSA recurrence, local recurrence or overall survival after radical prostatectomy for prostate cancer. Mod Pathol 2012;25(3):471-479.
22. Mulholland DJ, Xin L, Morim A, Lawson D, Witte O, Wu H. Lin-Sca-1+CD49fhigh stem/progenitors are tumor-initiating cells in the Pten-null prostate cancer model. Cancer Res 2009;69(22):8555-8562.
23. Eaton CL, Colombel M, van der Pluijm G, Cecchini M, Wetterwald A, Lippitt J, Rehman I, Hamdy F, Thalman G. Evaluation of the frequency of putative prostate cancer stem cells in primary and metastatic prostate cancer. Prostate 2010;70(8):875-882.
24. Miki J, Furusato B, Li H, Gu Y, Takahashi H, Egawa S, Sesterhenn IA, McLeod DG, Srivastava S, Rhim JS. Identification of putative stem cell markers, CD133 and CXCR4, in hTERT-immortalized primary nonmalignant and malignant tumor-derived human prostate epithelial cell lines and in prostate cancer specimens. Cancer Res 2007;67(7):3153-3161.
25. Missol-Kolka E, Karbanova J, Janich P, Haase M, Fargeas CA, Huttner WB, Corbeil D. Prominin-1 (CD133) is not restricted to stem cells located in the basal compartment of murine and human prostate. Prostate 2011;71(3):254-267.
26. Yamamoto H, Masters JR, Dasgupta P, Chandra A, Popert R, Freeman A, Ahmed A. CD49f Is an Efficient Marker of Monolayer- and Spheroid Colony-Forming Cells of the Benign and Malignant Human Prostate. PLoS One 2012;7(10):e46979.
27. Weigmann A, Corbeil D, Hellwig A, Huttner WB. Prominin, a novel microvilli-specific polytopic membrane protein of the apical surface of epithelial cells, is targeted to plasmalemmal protrusions of non-epithelial cells. Proc Natl Acad Sci U S A 1997;94(23):12425-12430.
28. Fargeas CA, Joester A, Missol-Kolka E, Hellwig A, Huttner WB, Corbeil D. Identification of novel Prominin-1/CD133 splice variants with alternative C-termini and their expression in epididymis and testis. Journal of cell science 2004;117(Pt 18):4301-4311.
29. Bidlingmaier S, Zhu X, Liu B. The utility and limitations of glycosylated human CD133 epitopes in defining cancer stem cells. J Mol Med (Berl) 2008;86(9):1025-1032.
30. De Marzo AM, Marchi VL, Epstein JI, Nelson WG. Proliferative inflammatory atrophy of the prostate: implications for prostatic carcinogenesis. Am J Pathol 1999;155(6):1985-1992.
31. van Leenders GJ, Gage WR, Hicks JL, van Balken B, Aalders TW, Schalken JA, De Marzo AM. Intermediate cells in human prostate epithelium are enriched in proliferative inflammatory atrophy. Am J Pathol 2003;162(5):1529-1537.
Proefschrift#8_DEF.indd 96 25-08-15 16:42

97
32. Di Lorenzo G, Autorino R, D’Armiento FP, Mignogna C, De Laurentiis M, De Sio M, D’Armiento M, Damiano R, Vecchio G, De Placido S. Expression of proto-oncogene c-kit in high risk prostate cancer. European journal of surgical oncology : the journal of the European Society of Surgical Oncology and the British Association of Surgical Oncology 2004;30(9):987-992.
33. Wiesner C, Nabha SM, Dos Santos EB, Yamamoto H, Meng H, Melchior SW, Bittinger F, Thuroff JW, Vessella RL, Cher ML, Bonfil RD. C-kit and its ligand stem cell factor: potential contribution to prostate cancer bone metastasis. Neoplasia 2008;10(9):996-1003.
34. Went PT, Dirnhofer S, Bundi M, Mirlacher M, Schraml P, Mangialaio S, Dimitrijevic S, Kononen J, Lugli A, Simon R, Sauter G. Prevalence of KIT expression in human tumors. J Clin Oncol 2004;22(22):4514-4522.
35. Bae KM, Su Z, Frye C, McClellan S, Allan RW, Andrejewski JT, Kelley V, Jorgensen M, Steindler DA, Vieweg J, Siemann DW. Expression of pluripotent stem cell reprogramming factors by prostate tumor initiating cells. J Urol 2010;183(5):2045-2053.
36. Monsef N, Soller M, Isaksson M, Abrahamsson PA, Panagopoulos I. The expression of pluripotency marker Oct 3/4 in prostate cancer and benign prostate hyperplasia. Prostate 2009;69(9):909-916.
37. Ugolkov AV, Eisengart LJ, Luan C, Yang XJ. Expression analysis of putative stem cell markers in human benign and malignant prostate. Prostate 2011;71(1):18-25.
38. Rijlaarsdam MA, van Herk HA, Gillis AJ, Stoop H, Jenster G, Martens J, van Leenders GJ, Dinjens W, Hoogland AM, Timmermans M, Looijenga LH. Specific detection of OCT3/4 isoform A/B/B1 expression in solid (germ cell) tumours and cell lines: confirmation of OCT3/4 specificity for germ cell tumours. Br J Cancer 2011;105(6):854-863.
39. Colombel M, Eaton CL, Hamdy F, Ricci E, van der Pluijm G, Cecchini M, Mege-Lechevallier F, Clezardin P, Thalmann G. Increased expression of putative cancer stem cell markers in primary prostate cancer is associated with progression of bone metastases. Prostate 2012;72(7):713-720.
40. Schmelz M, Cress AE, Scott KM, Burger F, Cui H, Sallam K, McDaniel KM, Dalkin BL, Nagle RB. Different phenotypes in human prostate cancer: alpha6 or alpha3 integrin in cell-extracellular adhesion sites. Neoplasia 2002;4(3):243-254.
41. Guzman-Ramirez N, Voller M, Wetterwald A, Germann M, Cross NA, Rentsch CA, Schalken J, Thalmann GN, Cecchini MG. In vitro propagation and characterization of neoplastic stem/progenitor-like cells from human prostate cancer tissue. Prostate 2009;69(15):1683-1693.
42. Lukacs RU, Memarzadeh S, Wu H, Witte ON. Bmi-1 is a crucial regulator of prostate stem cell self-renewal and malignant transformation. Cell stem cell 2010;7(6):682-693.
43. Aaltomaa S, Lipponen P, Viitanen J, Kankkunen JP, Ala-Opas M, Kosma VM. Prognostic value of CD44 standard, variant isoforms 3 and 6 and -catenin expression in local prostate cancer treated by radical prostatectomy. Eur Urol 2000;38(5):555-562.
44. Noordzij MA, van Steenbrugge GJ, Verkaik NS, Schroder FH, van der Kwast TH. The prognostic value of CD44 isoforms in prostate cancer patients treated by radical prostatectomy. Clin Cancer Res 1997;3(5):805-815.
45. van Leenders GJ, Dukers D, Hessels D, van den Kieboom SW, Hulsbergen CA, Witjes JA, Otte AP, Meijer CJ, Raaphorst FM. Polycomb-group oncogenes EZH2, BMI1, and RING1 are overexpressed in prostate cancer with adverse pathologic and clinical features. Eur Urol 2007;52(2):455-463.
46. Wolters T, Vissers KJ, Bangma CH, Schroder FH, van Leenders GJ. The value of EZH2, p27(kip1), BMI-1 and MIB-1 on biopsy specimens with low-risk prostate cancer in selecting men with significant prostate cancer at prostatectomy. BJU Int 2009.
Chap
ter 4
Chapter 4: Validation of stem cell markers in clinical prostate cancer: α6-Integrin is predictive for non-aggressive disease
Proefschrift#8_DEF.indd 97 25-08-15 16:42

98 Discovery and Validation of Prognostic Tissue Markers in Clinical Prostate Cancer – © 2015, A.M. Hoogland
Figure 1
Chap
ter 4
Proefschrift#8_DEF.indd 98 25-08-15 16:42

99
Figure 1
Immunohistochemical expression of stem cell markers in prostate cancer.
A) α2-integrin expression in <5% of tumor cells (arrows);
B) α2-integrin expression in >5% of tumor cells (arrows); basal epithelium in normal glands serve
as internal positive control;
C) α6-integrin expression in <5% of tumor cells (arrow);
D) α6-integrin expression in >5% of tumor cells;
E) EZH2 expression in <1% of tumor cells (arrow);
F) EZH2 expression in >1% of tumor cells;
G) CD133 expression at the apical membrane of atrophic epithelial glands (arrowheads);
H) Absence of CD133 expression in prostate cancer (arrow) with apical expression in atrophic glands
serving as internal positive control (arrowheads). Original magnifications x400.
Chap
ter 4
Chapter 4: Validation of stem cell markers in clinical prostate cancer: α6-Integrin is predictive for non-aggressive disease
Proefschrift#8_DEF.indd 99 25-08-15 16:42

100 Discovery and Validation of Prognostic Tissue Markers in Clinical Prostate Cancer – © 2015, A.M. Hoogland
Table I Clinicopathologic characteristics and follow-up of patients treated by radical prostatectomy for prostate cancer.
Clinicopathologic parameter Mean (range) or n (%)
Age at RP (years) 64.76 (55.4-75.1)
PSA level at diagnosis (ng/ml) 7.23 (0.3-125.2)
≤10 ng/mL 418 (86.9%)
>10 ng/mL 62 (12.9%)
Missing 1 (0.2%)
Gleason score (RP)
<7 265 (55.1%)
7 188 (39.1%)
3+4=7 153 (31.8%)
4+3=7 35 (7.3%)
>7 28 (5.8%)
Pathological T-stage (TNM 2004)
T2 343 (71.4%)
T3a/b 110 (22.8%)
T4 28 (5.8%)
Lymph nodes (RP)
Positive 1 (0.2%)
Negative 480 (99.8%)
Surgical margins
PositiveNegative
119 (24.7%)362 (75.3%)
Biochemical recurrence
Positive 119 (24.7%)
Negative 362 (75.3%)
Local recurrence
Positive 21 (4.4%)
Negative 460 (95.6%)
Death
Positive 112 (23.3%)
Negative 368 (76.5%)
Missing 1 (0.2%)
Death from PCa
Positive 12 (10.7%)
Negative 74 (66.1%)
Unknown 26 (23.2%)
Follow-up time (months) 113.3 (0.00-203.8)
Chap
ter 4
PSA = Prostate specific antigen RP = Radical prostatectomy PCa = Prostate cancer
Proefschrift#8_DEF.indd 100 25-08-15 16:42

101
Table II Correlation of stem cell markers with clinical prostate cancer characteristics.
Expression α2-integrin < 5% ≥ 5% Total p-value
PSA at diagnosis
≤10 ng/ml 348 (83%) 16 (4%) 364 (87%) 0.04
>10 ng/ml 48 (12%) 6 (1%) 54 (13%)
Total 396 (95%) 22 (5%) 418
Gleason score
<7 213 (51%) 14 (3%) 227 (54%) 0.49
7 158 (38%) 6 (1%) 164 (39%)
>7 26 (6%) 2 (1%) 28 (7%)
Total 397 (95%) 22 (5%) 419
pT-stage
pT2 279 (67%) 14 (3%) 293 (70%) 0.77
pT3a/b 93 (22%) 6 (1%) 99 (24%)
pT4 25 (6%) 2 (1%) 27 (6%)
Total 397 (95%) 22 (5%) 419
Expression α2-integrin < 5% ≥ 5% Total p-value
PSA at diagnosis
≤10 ng/ml 90 (22 %) 258 (65 %) 348 (87 %) 0.01
>10 ng/ml 23 (6 %) 29 (7 %) 52 (13 %)
Total 113 (28 %) 287 (72 %) 400*
Gleason score
<7 46 (11 %) 170 (42 %) 216 (53 %) <0.01
7 51 (13 %) 106 (27 %) 157 (40 %)
>7 17 (4 %) 11 (3 %) 28 (7 %)
Total 114 (28 %) 287 (72 %) 401
pT-stage
pT2 67 (17%) 209 (52%) 276 (69%) 0.02
pT3a/b 38 (9%) 62 (16%) 100 (25%)
pT4 9 (2%) 16 (4%) 25 (6%)
Total 114 (28%) 287 (72%) 401
Chap
ter 4
Chapter 4: Validation of stem cell markers in clinical prostate cancer: α6-Integrin is predictive for non-aggressive disease
Proefschrift#8_DEF.indd 101 25-08-15 16:42

102 Discovery and Validation of Prognostic Tissue Markers in Clinical Prostate Cancer – © 2015, A.M. Hoogland
Expression α2-integrin < 5% ≥ 5% Total p-value
PSA at diagnosis
≤10 ng/ml 360 (85%) 9 (2%) 369 (87%) 0.75
>10 ng/ml 56 (13%) 1 (0%) 57 (13%)
Total 416 (98%) 10 (2%) 426*
Gleason score
<7 229 (54%) 1 (0 %) 230 (54%) 0.01
7 160 (38%) 9 (2 %) 169 (40%)
>7 27 (6%) 1 (0 %) 28 (6%)
Total 416 (98%) 11 (2 %) 427
pT-stage
pT2 296 (70%) 5 (1%) 301 (71%) 0.10
pT3a/b 96 (22%) 4 (1%) 100 (23%)
pT4 24 (6%) 2 (0%) 26 (6%)
Total 416 (98%) 11 (2%) 427
* The variability of total cases evaluated is due to the sporadic absence of some cores in separately cut Tissue Micro-Arrays. One PSA value was missing for statistical analysis. PSA = Prostate specific antigen RP = Radical prostatectomy
Chap
ter 4
Proefschrift#8_DEF.indd 102 25-08-15 16:42

103
Table III Predictive value of stem cell marker expression for biochemical recurrence after radical prostatectomy.
Parameter Univariate analysis Multivariate analysis
HR (95% CI) p-value HR (95% CI) p-value
Age 1.05 (1.00-1.09) 0.04 1.03 (0.98-1.07) 0.21
PSA 3.51 (2.34-5.26) <0.01 1.79 (1.13-2.84) 0.03
Gleason score 2.47 (1.89-3.26) <0.01 1.82 (1.34-2.46) <0.01
pT-stage 1.72 (1.46-2.02) <0.01 1.25 (1.03-1.52) 0.03
Surgical margin 3.29 (2.29-4.71) <0.01 2.33 (1.59-3.41) <0.01
α2-integrin 0.69 (0.25-1.89) 0.48 0.55 (0.19-1.55) 0.25
α6-integrin 0.50 (0.34-0.75) <0.01 0.68 (0.45-1.04) 0.07
EZH2 2.94 (1.36-6.37) 0.01 1.89 (0.82-4.37) 0.14
HR = Hazard ratioCI = Confidence IntervalPSA = Prostate Specific Antigen
Table IV Predictive value of stem cell marker expression for local recurrence after radical prostatectomy.
Parameter Univariate analysis Multivariate analysisw
HR (95% CI) p-value HR (95% CI) p-value
Age 0.96 (0.87-1.05) 0.36 0.92 (0.84-1.02) 0.13
PSA 2.28 (0.83-6.22) 0.11 0.96 (0.30-3.10) 0.95
Gleason score 2.55 (1.35-4.82) <0.01 2.08 (1.07-4.05) 0.03
pT-stage 1.60 (1.10-2.35) 0.02 1.21 (0.78-1.87) 0.39
Surgical margin 4.10 (1.73-9.75) <0.01 3.27 (1.34-7.95) 0.01
α2-integrin 0.95 (0.13-7.08) 0.96 0.92 (0.12-6.92) 0.93
α6-integrin 0.35 (0.14-0.87) 0.02 0.35 (0.14-0.91) 0.03
EZH2 1.79 (0.24-13.35) 0.57 0.96 (0.12-7.65) 0.97
HR = Hazard ratioCI = Confidence IntervalPSA = Prostate Specific Antigen
Chap
ter 4
Chapter 4: Validation of stem cell markers in clinical prostate cancer: α6-Integrin is predictive for non-aggressive disease
Proefschrift#8_DEF.indd 103 25-08-15 16:42

104 Discovery and Validation of Prognostic Tissue Markers in Clinical Prostate Cancer – © 2015, A.M. Hoogland
Table V Predictive value of stem cell marker expression for overall death after radical prostatectomy.
Parameter Univariate analysis Multivariate analysis
HR (95% CI) p-value HR (95% CI) p-value
Age 1.10 (1.05-1.15) <0.01 1.10 (1.06-1.16) <0.01
PSA 1.23 (0.73-2.06) 0.44 1.22 (0.70-2.12) 0.48
Gleason score 1.29 (0.950-1.760) 0.10 1.21 (0.86-1.70) 0.28
pT-stage 0.98 (0.76-1.22) 0.84 0.88 (0.70-1.12) 0.30
Surgical margin 1.09 (0.72-1.64) 0.68 1.06 (0.70-1.63) 0.80
α2-integrin 1.05 (0.43-2.60) 0.91 1.14 (0.45-2.90) 0.78
α6-integrin 0.67 (0.43-1.02) 0.06 0.74 (0.48-1.14) 0.17
EZH2 0.83 (0.30-2.29) 0.72 0.57 (0.18-1.83) 0.34HR = Hazard ratioCI = Confidence Interval PSA = Prostate Specific Antigen
Table VI Predictive value of stem cell marker expression for disease specific death after radical prostatectomy.
Parameter Univariate analysis Multivariate analysis
HR (95% CI) p-value HR (95% CI) p-value
Age 0.96 (0.84-1.10) 0.55 0.95 (0.81-1.11) 0.49
PSA 3.32 (0.97-11.41) 0.06 2.81 (0.81-9.83) 0.11
Gleason score 4.12 (1.42-11.977) 0.01 5.70 (1.82-17.82) <0.01
pT-stage 1.88 (1.20-2.94) 0.01 1.56 (0.94-2.60) 0.09
Surgical margin 0.61 (0.18-2.11) 0.44 0.32 (0.08-1.29) 0.11
α2-integrin 3.00 (0.66-13.73) 0.16 1.36 (0.23-8.03) 0.74
α6-integrin 0.29 (0.07-1.01) 0.05 0.22 (0.06-0.85) 0.03
EZH2 2.73 (0.59-12.71) 0.20 0.87 (0.06-13.19) 0.92
HR = Hazard ratioCI = Confidence Interval PSA = Prostate Specific Antigen
Chap
ter 4
Proefschrift#8_DEF.indd 104 25-08-15 16:42

105
Chap
ter 4
Chapter 4: Validation of stem cell markers in clinical prostate cancer: α6-Integrin is predictive for non-aggressive disease
Proefschrift#8_DEF.indd 105 25-08-15 16:42

106 Discovery and Validation of Prognostic Tissue Markers in Clinical Prostate Cancer – © 2015, A.M. Hoogland
Proefschrift#8_DEF.indd 106 25-08-15 16:42

107
Chapter 5
Gene-expression analysis of Gleason grade 3 tumor glands embedded in low- and high-risk prostate cancer
A. Marije Hoogland1, René Böttcher2, 3, Esther Verhoef1, Guido Jenster2 and Geert J.L.H. van Leenders1
Departments of Pathology1 and Urology2, Erasmus Medical Center, Rotterdam, The Netherlands. Department of Bioinformatics3, University of Applied Sciences
Wildau, Wildau, Germany
Submitted Chap
ter 5
Chapter 5: Gene-expression analysis of Gleason grade 3 tumor glands embedded in low- and high-risk prostate cancer
Proefschrift#8_DEF.indd 107 25-08-15 16:42

108 Discovery and Validation of Prognostic Tissue Markers in Clinical Prostate Cancer – © 2015, A.M. Hoogland
Abstract
Prostate cancer is a heterogeneous disease ranging from incidentally detected asymptomatic lesions to life-threatening metastatic tumors. Prostate cancer Gleason score on diagnostic biopsies plays a pivotal role in therapeutic decision-making. A caveat in current Gleason grading on biopsies is sampling artifact, leading to tumor under-grading in a significant number of patients. In order to select patients at risk for tumor under-grading, we compared gene-expression profiles of Gleason grade 3 tumor glands embedded in low-risk Gleason score 3+3=6 and high-risk Gleason score 4+3=7 prostate cancer.
For identification of differentially expressed genes in Gleason grade 3 tumor glands, we applied laser capture microdissection, RNA amplification and RNA-sequencing. We analyzed gene-expression profiles of Gleason grade 3 adjacent to Gleason grade 3 (Gleason score 3+3=6; N=9) as compared to Gleason grade 3 adjacent to Gleason grade 4 prostate cancer (Gleason score 4+3=7; N=9). After RNA expression value analysis, genes were selected for further evaluation using immunohistochemistry on prostate cancer specimens (N=481).
For all samples a sufficient yield of RNA could be isolated to build a reliable RNA-sequence databank. A total of 13,373 genes were annotated, and after biostatistical analysis, 501 genes were up-regulated and 421 down-regulated in Gleason grade 3 being part of Gleason score 4+3=7 prostate cancer. We selected helicase, lymphoid specific (HELLS; 2 fold; p=0.006), zinc finger of the cerebellum (ZIC) 2 (8 fold; p=1.3E-05) and ZIC5 (17 fold; p=8.4E-07) genes, which were all up-regulated in Gleason grade 3 embedded in Gleason score 4+3=7 prostate cancer for further validation.
HELLS and ZIC5 protein expression was correlated with Gleason score ≥7 prostate cancer in our radical prostatectomy cohort. HELLS was independently predictive for biochemical recurrence after radical prostatectomy. Protein expression of ZIC2 was neither associated with Gleason score nor with outcome in our validation set.
In conclusion, RNA sequencing after laser capture microdissection identified genes differentially expressed in Gleason grade 3 tumor glands embedded in low- and high-risk prostate cancer. Enhanced expression of HELLS and ZIC5 in Gleason score ≥7 prostate cancer was validated on protein level. Therefore, HELLS and ZIC5 are novel potential biomarkers for assessment of disease behavior in clinical prostate cancer.
Chap
ter 5
Proefschrift#8_DEF.indd 108 25-08-15 16:42

109
Introduction
With approximately 260,000 deaths per year worldwide, prostate cancer is a leading cause of cancer morbidity and mortality (Ferlay, Soerjomataram et al. 2015; Malvezzi, Bertuccio et al. 2015; Siegel, Miller et al. 2015). Prostate cancer demonstrates a highly variable disease course with many patients having asymptomatic disease. Pathologic grading of prostate cancer according to the Gleason grading system (Epstein 2010) is an important parameter for therapeutic decision-making (Humphrey 2004). The Gleason grading system has been used since the 1960s and is entirely based on tumor growth patterns. Increasing Gleason score is strongly associated with histopathological and clinical endpoints, including pathologic stage, metastatic disease and survival (Humphrey 2004). Nevertheless, the prediction of tumor behavior and inherent optimal treatment modalities of low- and intermediate-risk prostate cancer (Gleason score 6-7) patients are uncertain (Cohen, Chan et al. 1998; Quinn, Henshall et al. 2003; Bangma, Roemeling et al. 2007; van As, Norman et al. 2008; Moussa, Li et al. 2009; Wolters, Vissers et al. 2009; Hegarty, Beirne et al. 2010; Klotz, Zhang et al. 2010; Soloway, Soloway et al. 2010; Sorensen and Orntoft 2010; Cheng, Montironi et al. 2012; Huang, Vicini et al. 2012; Klotz 2013; Loeb, Bjurlin et al. 2014).
While Gleason score 6 prostate cancer demonstrates an indolent disease in many patients, 55-90% of the patients with a low-risk tumor still undergo radical prostatectomy (Cooperberg, Broering et al. 2010). A widely used alternative to surgery is active surveillance. Up to 33% of patients on active surveillance, however, will eventually undergo therapeutic intervention after a median follow-up of 1-4 years (van As, Norman et al. 2008; van den Bergh, Roemeling et al. 2009; Soloway, Soloway et al. 2010; Cooperberg, Carroll et al. 2011; Tosoian, Trock et al. 2011). Therefore, more accurate stratification of low-risk prostate cancer patients is needed. Gleason grading on diagnostic biopsies is moderately representative for the entire tumor grade after radical prostatectomy predominantly due to sampling artifacts. Up to 38% of the patients with Gleason score 6 prostate cancer on biopsy will reveal Gleason score ≥7 after surgery (Divrik, Eroglu et al. 2007; Epstein 2010). To optimize treatment decisions, it is essential to identify patients at chance for tumor under-grading at diagnosis.
Gleason score 7 prostate cancer is composed of a mixture of regular tumor glands (Gleason grade 3) and aberrant glandular tumor structures (Gleason grade 4). Due to tumor heterogeneity, diagnostic biopsies might only sample the Gleason grade 3 tumor areas leaving clinically relevant Gleason grade 4 patterns undiscovered.
Chap
ter 5
Chapter 5: Gene-expression analysis of Gleason grade 3 tumor glands embedded in low- and high-risk prostate cancer
Proefschrift#8_DEF.indd 109 25-08-15 16:42

110 Discovery and Validation of Prognostic Tissue Markers in Clinical Prostate Cancer – © 2015, A.M. Hoogland
We hypothesize that Gleason grade 3 tumor glands adjacent to Gleason grade 4 prostate cancer show different molecular expression profiles than Gleason grade 3 tumor glands in a purely glandular tumor (Gleason score 3+3=6). The aim of this study was to identify genes that are differentially expressed in Gleason grade 3 tumor glands embedded either in Gleason score 3+3=6 or in Gleason score 4+3=7 prostate cancer using laser capture microdissection and subsequent RNA sequencing.
Chap
ter 5
Proefschrift#8_DEF.indd 110 25-08-15 16:42

111
Material and Methods
Patient selectionWe selected 18 radical prostatectomy samples of men who had been operated for prostate cancer in Erasmus Medical Center between 2005 and 2011. Directly after surgery, the prostate was transported on ice to the pathology department where a transverse tissue slide was frozen in liquid nitrogen for research purposes. The remaining prostate was injected with neutral-buffered formalin (4%) to allow for fast and equal fixation, and processed for routine pathologic diagnosis. For this study, we selected nine patients with low-risk Gleason score 3+3=6 prostate cancer and nine patients with Gleason score 4+3=7, which is considered an aggressive disease. Selection was based on availability of tissues and estimated tumor percentage in the frozen tissue. Reference hematoxylin/ eosin (HE) staining was performed on the frozen tissue samples to verify the Gleason grade and estimate the tumor’s percentage. The use of tissue samples for scientific reasons was approved by institutional board review (MEC-2011-295, MEC-2011-296). Samples were used according to the “Code for Proper Secondary Use of Human Tissue in The Netherlands” as developed by the Dutch Federation of Medical Scientific Societies (FMWV, version 2002, update 2011).
Laser Capture MicrodissectionFor laser capture microdissection, we cut ten 10µm thick tissue sections from the frozen tumor slices. After every 10µm thick slide, a 5µm thick slide was made for HE reference evaluation. Each section was mounted on glass slide (MembraneSlide, 1.0mm PEN-membrane covered; Zeiss Micro-Imaging GmbH, Munich, Germany) and air-dried for 10 minutes. All glass slides had been treated with UV-light for 30 minutes. After drying, each glass was individually packed in tinfoil and stored at -80ºC for further use. All materials and the cryostate had been cleaned with 70% ethanol prior to tissue handling.
For laser capture microdissection, each slide was individually taken out of -80°C storage, unwrapped and immersed in RNAlater Solution (Stabilization Solution; Ambion, UK). Slides were stained with Mayer’s Hematoxylin for 30 seconds and dehydrated in a 50%-100% ethanol/MilliQ H2O gradient. Slides were air-dried and dissected at the PALM laser capture microdissection microscope (PALM Axio Observer A1, Zeiss Micro-Imaging, Munich, Germany) for a maximum of 60 minutes at room temperature. Individual tumor glands with Gleason grade 3 were carefully selected and dissected, to prevent contamination with surrounding normal stromal tissue or other tumor grade components. Dissected elements were automatically
Chap
ter 5
Chapter 5: Gene-expression analysis of Gleason grade 3 tumor glands embedded in low- and high-risk prostate cancer
Proefschrift#8_DEF.indd 111 25-08-15 16:42

112 Discovery and Validation of Prognostic Tissue Markers in Clinical Prostate Cancer – © 2015, A.M. Hoogland
catapulted into the lid of a 500µl eppendorf (AdhesiveCap opaque; Zeiss Micro-Imaging, Munich, Germany). 65µl RLT+ buffer (from Qiagen AllPrep DNA/RNA Micro Kit; Qiagen,Venlo, The Netherlands) was added and samples were stored at -80ºC until further use.
RNA isolationAfter dissection and storing, the ten individually dissected samples from each patient were pooled resulting in 9 samples with Gleason grade 3 tumor glands derived from Gleason score 3+3=6 prostate cancer and 9 Gleason grade 3 samples derived from Gleason score 4+3=7 prostate cancer. The total amount of RLT+ buffer after pooling was complemented to 650µl. For RNA isolation the Qiagen AllPrep micro kit was used (Qiagen AllPrep DNA/RNA Micro Kit; Qiagen,Venlo, The Netherlands) according to the manufacturer’s guidelines. RNA quality and quantity was measured using the Nanodrop Spectrophotometer (Model ND-1000, NanoDrop Technologies, Wilmington, USA) and Bioalalyzer Nanochip or Picochip (RNA 6000 Nano/Pico Kit, Agilent Technologies, Waldbronn, Germany). The average RNA amount harvested for the Gleason score 3+3=6 group was 80.5 ng (2.9-240.0ng) with RNA Integrity Number (RIN) values between 1.0 and 7.0. For the Gleason grade 3 samples derived from Gleason score 4+3=7 prostate cancer, the average RNA amount was 35.4ng (10.3-76.7ng) with RIN values between 1.0 and 5.2.
RNA sequencingRNA amplification and sequencing was performed by AROS (AROS Applied Biotechnology A/S, Aarhus, Denmark). Amplification was performed using NuGEN’s Ovation RNA-seq v2 System to generate double stranded cDNA. A control sample (10ng of human reference RNA) was included. All samples produced similar amounts of double stranded cDNA (measured with the Qubit BR dsDNA kit). 1.2µg of the dsDNA was used as input for the DNA TruSeq library prep to produce the library.
Data workflow All RNA sequence data were aligned to pre-indexed human reference genome (hg19, available via the bowtie2 homepage including annotation) using TopHat version 2.0.4 (Kim, Pertea et al. 2013). To increase accuracy, reads were aligned against the indexed transcriptome prior to alignment to the genome via setting “--transcriptome-index”. Other specified TopHat2 settings were “--b2-very-sensitive --report-secondary-alignments --read-realign-edit-dist 1--mate-inner-dist 200 --mate-std-dev 50 ”. RNA expression levels were quantified via HTSeq-count (http://www-huber.embl.de/users/anders/HTSeq, version 0.5.4p1) using the UCSC hg19 annotation provided by the TopHat2 developers. Subsequently, we used edgeR
Chap
ter 5
Proefschrift#8_DEF.indd 112 25-08-15 16:42

113
(version 3.0.4) to investigate differentially expressed genes between our different conditions (Robinson, McCarthy et al. 2010). For internal validation purposes, we additionally performed RNA-seq analysis using CLC Genomics Workbench version 5.1 (Qiagen, Venlo, The Netherlands). We followed the outlined RNA-seq analysis pipeline and used hg19 as reference genome. All TopHat2 alignments were performed on the High Performance Cloud (https://www.surfsara.nl/systems/hpc-cloud). Downstream analyses as well as the CLC Genomics Workbench were run on a Dell Precision with two Intel Xeon, 8 Hexacores and 128 GB RAM shared by Windows 7 64-bit and a Linux Mint 12 64-bit virtual machine (VirtualBox v. 4.2.6). To verify whether expression value differences after RNA amplification and sequencing were in line with original expression values, we performed quantitative PCR for ZIC2 (HS00600854_m1), ZIC5 (HS00741567_m1) and MYT1 (HS01027966_m1) in the stock solutions, which all showed comparable RNA read counts.
Clinical specimensFor validation purposes, we used tissue microarrays containing samples of 481 radical prostatectomy specimens in triplicate, as described previously (Hoogland, Jenster et al. 2012; Duijvesz, Burnum-Johnson et al. 2013; Hoogland, Verhoef et al. 2014). All patients had been diagnosed with prostate cancer in the scope of the European Randomized Study of Screening for Prostate Cancer (ERSPC), Rotterdam section between 1987 and 2010 (Roobol, Kirkels et al. 2003; Schroder, Hugosson et al. 2009). At histopathological diagnosis of the totally embedded radical prostatectomies, Gleason score, pT-stage (WHO 2004) and surgical margins were recorded by a pathologist with expertise in urologic pathology. Clinical follow-up was recorded after each control at our outpatient clinic and data were transmitted to the central study database. Post-operative biochemical recurrence was defined as an increase in serum Prostate Specific Antigen (PSA) after two different measurements, at least three months apart. Use of samples for research purposes was approved by the Erasmus Medical Center Medical Ethics Committee (MEC-2011-295) according to the Medical Research Involving Human Subjects Act (MEC-2004-261).
ImmunohistochemistryTissue slides (5μm) were mounted on aminoacetylsilane coated glass slides (Starfrost; Berlin, Germany), deparaffinised in xylene and rehydrated in ethanol. Endogenous peroxidase activity was blocked by 1% hydrogen peroxide in methanol for 20 minutes. Microwave (700W) pretreatment in tris(hydroxymethyl)-aminomethane-EDTA (pH 9.0) was performed for 15 minutes. The slides were incubated with primary antibody targeting HELLS (1:500, clone H4, sc46665, Santa Cruz, Germany), ZIC2 (1:1000, ab15392, Merck Millipore, Amsterdam, The Netherlands) and ZIC5
Chap
ter 5
Chapter 5: Gene-expression analysis of Gleason grade 3 tumor glands embedded in low- and high-risk prostate cancer
Proefschrift#8_DEF.indd 113 25-08-15 16:42

114 Discovery and Validation of Prognostic Tissue Markers in Clinical Prostate Cancer – © 2015, A.M. Hoogland
(1:100; ab115566, Abcam, Cambridge, UK) followed by chromogenic visualization using the EnVision DAKO kit (DAKO, Glostrup, Denmark). Positive and negative control tissues were selected based on the manufacturer’s product sheets and the available information based on www.proteinatlas.org (the human protein atlas). After counterstaining with hematoxylin, slides were thoroughly washed, dehydrated, cleared in xylene and mounted in malinol (Chroma-Geselschaft, Körgen, Germany). Antibody expression was scored by one investigator (MH) in a blinded setting. Cellular location, percentage of positive tumor cells and staining intensity were determined for all antibodies. Staining intensity was scored as negative (0; no staining), weak (1+; only visible at high magnification), moderate (2+; visible at low magnification) and strong (3+; striking at low magnification).
StatisticsFor each immunohistochemical parameter, the average of the tissue microarray scores was calculated per patient. Statistical associations between marker expression and continuous clinicopathologic parameters (age and PSA at time of diagnosis) were analyzed using Student’s t-test, and with categorical parameters (Gleason score, pT-stage and surgical margins) using Pearson’s Chi-square (Χ2) test. To determine whether expression was predictive for biochemical recurrence, we used uni- and multivariate Cox regression with stepwise backward entering of covariates. A two-sided p-value <0.05 was considered significant. All statistics were performed using SPSS 20 (SPSS; Chicago, USA).Results
Gene-expression analysisFor each sample, RNA-sequencing reads of 101 nt were generated in paired-end fashion, which yielded 27–130 million sequencing reads per sample. Mapping rates between samples were comparable (58.6–73.2% of total reads mapped, of which 63.2–89.8% were mapped uniquely to the genome) and in total, between 2.4 and 19 million reads could be uniquely assigned to RefSeq genes and were subsequently used for quantification. At a logCPM cut-off ≥1, 8133 out of the total 23.373 annotated genes were detected. The workflow of the RNA sequence data was performed both on the CLC workbench, as well as TopHat and RefSeq, leading to approximately 80% of overlap in genes.
With regard to the limited number of samples, we determined the genes that were up-regulated in Gleason grade 3 derived from Gleason score 4+3=7 prostate cancer as compared to Gleason grade 3 glands from Gleason score 3+3=6 tumors with a 2log fold change >1.0 and p<0.05). A total of 501 genes were over-expressed in Gleason
Chap
ter 5
Proefschrift#8_DEF.indd 114 25-08-15 16:42

115
grade 3 tumor glands being part of a Gleason score 4+3=7 as compared to Gleason score 3+3=6 prostate cancer and 421 genes were down-regulated (Supplementary Table 1 and 2). We selected the genes helicase, lymphoid specific (HELLS), and zinc finger of the cerebellum (ZIC) family members 2 and 5 for further validation. Selection was based on known association with cancer, commercial availability of antibodies, nuclear location and novelty in prostate cancer. ZIC5 mRNA was up-regulated 17 fold (p=8.4E-07), ZIC2 8 fold (p=1.3E-05) and HELLS 2 fold (p=0.006) in Gleason grade 3 tumor glands derived from Gleason score 4+3=7 as compared to Gleason score 3+3=6 prostate cancer.
Immunohistochemical expressionExpression of HELLS was observed in the nuclei of lymphocytes (positive control tissue) and was not expressed in placental tissues (negative control). No immunohistochemical expression of HELLS was observed in the nuclei of luminal or basal cells in benign prostate glands. Nuclear expression of HELLS was observed in 162 out of 421 patients (39%), with the percentage of positive tumor nuclei varying between 0.2% and 9.3% (Figure 1, A and B). A total of 64 out of 421 patients (15%) showed HELLS expression in ≥1% of tumor cells. HELLS expression of ≥1% was significantly associated with Gleason score (p<0.001; Table 1); 23 out of the 221 patients with Gleason score <7 (10%) expressed HELLS as compared to 29 out of the 172 with Gleason score 7 (17%) and 12 out of 28 patients with Gleason score >7 (43%). In addition, HELLS was independently predictive for biochemical recurrence (HR 2.3; CI 1.5-3.6; p<0.001) after radical prostatectomy adjusted for including age, PSA, Gleason score, pT-stage and surgical margin status in multivariate analysis (Table 2). HELLS was neither associated with PSA (p=0.71) or pT-stage (p=0.07).
The ZIC2 staining pattern demonstrated both cytoplasmatic and nuclear expression in most cases. As positive control, tubular epithelium in human kidney was used, and placenta tissue was used as negative control. In normal prostate glands, ZIC2 expression was observed in basal cells, as well as in luminal cells. In our cohort, 315 cases could be scored for ZIC2 expression; cytoplasmatic expression was seen with weak intensity in 197 (63%) and moderate intensity in 19 (6%) patients. Nuclear staining intensity varied from negative in 130 (41%), weak expression in 109 (35%), moderate expression in 69 (22%) and strong expression in 7 (2%) patients (Figure 1, C and D). ZIC2 protein expression (Table 1) was not associated with PSA (p=0.66), Gleason score (p=0.18) or pT-stage (p=0.77). ZIC2 did not have predictive value for biochemical recurrence after radical prostatectomy.
Chap
ter 5
Chapter 5: Gene-expression analysis of Gleason grade 3 tumor glands embedded in low- and high-risk prostate cancer
Proefschrift#8_DEF.indd 115 25-08-15 16:42

116 Discovery and Validation of Prognostic Tissue Markers in Clinical Prostate Cancer – © 2015, A.M. Hoogland
For ZIC5, basal cells in normal prostate glands were used as positive control tissue, whereas placental tissue provided negative control. Overall ZIC5 staining intensity was low. Of the 414 evaluable cases, 147 (36%) demonstrated nuclear expression of ZIC5. In 119 (29%) patients expression was weak, in 26 (6%) patients expression was moderate and in 2 (0.4%) strong. One-hundred patients (24%) showed nuclear ZIC5 expression in <1% of the tumor cells, 32 patients (8%) expressed ZIC5 in 1-5% of the tumor cells and 15 patients (4%) expressed ZIC5 in >5% of the tumor cells (Figure 1, E and F). Using a cut-off of ≥1%, expression of ZIC5 was associated with Gleason Score (p<0.001; Table 1); 61 out of 222 patients with Gleason score <7 (28%) showed ZIC5 expression as compared to 58 out of 146 with Gleason score 7 (43%) and 16 out of 28 with Gleason score >7 (57%). There was no significant associated of ZIC5 expression and PSA (p=0.13) or pT-stage (p=0.25). ZIC5 expression has no predictive value for biochemical recurrence after operation (Table 2).
Since HELLS is known to be involved in regulation of DNA methylation as well as histone modification, we analysed the relation of HELLS with Polycomb histone methyltransferase protein EZH2 (Xi, Zhu et al. 2007). Previously, we had shown that EZH2 expression in ≥1% of tumor cells was associated with high Gleason score and biochemical recurrence (van Leenders, Dukers et al. 2007; Hoogland, Verhoef et al. 2014). As we had determined EZH2 protein expression on the similar cohort, we analysed the expression of HELLS and EZH2 in similar tumor areas (Hoogland, Verhoef et al. 2014).
Using a cut-off of 1% for both HELLS and EZH2, we found a strong association between both proteins in the same patients (p=0.004) and individual tissue-microarray punch cores (p=0.03).
Acknowledgements
This research was sponsored by CTMM; project PCMM, project number 03O-203. We kindly thank the Tissue Bank from Erasmus MC for storing, providing and assistance with the frozen prostate tissue samples and the assistance and maintenance of the PALM Laser Capture Microscope. We kindly thank Anieta Sieuwerts for her help and advice concerning the isolation and quality testing of RNA. We kindly thank Jessie Sanders (http://www.jessiesanders.nl/) and Esther Verhoef for editing figure 1
Chap
ter 5
Proefschrift#8_DEF.indd 116 25-08-15 16:42

117
Discussion
A major challenge in prostate cancer management is the decision on the optimal therapeutic approach in low- and intermediate-risk patients. The ERSPC has shown that prostate cancer screening can results in 20% risk reduction in disease-specific mortality, however, at the cost of significant overtreatment (Schroder, Hugosson et al. 2009). On the other hand, 40% of low-risk prostate cancer patients under surveillance were switched to deferred treatment after a median of 7.5 years (Bul, van den Bergh et al. 2012). These results clearly demonstrate that better risk stratification is needed for low- to intermediate-risk prostate cancer patients. Current therapeutic stratification of prostate cancer patients predominantly relies on serum PSA level, biopsy Gleason score and number of positive biopsies. Systematic biopsies might however, not be representative for the entire tumor and can lead to discordance of Gleason score at diagnostic biopsy and radical prostatectomy. Fine and Epstein demonstrated that 20% patients with Gleason score 6 at biopsy were up-graded to Gleason score 7 (18.7%) or 8-10 (1.3%) at radical prostatectomy (Fine and Epstein 2008). Helpap and Egevad found concordance between Gleason score 6 prostate cancer at biopsies and radical prostatectomies in only 28% (Helpap and Egevad 2006). The risk of up-grading is influenced by prostate volume, total number of biopsies taken, number of positive biopsies and biopsy tumor extent (Kassouf, Nakanishi et al. 2007; Capitanio, Karakiewicz et al. 2009; Sarici, Telli et al. 2014). The objective of the current study was to identify differentially expressed genes in glandular Gleason grade 3 being part of low-risk Gleason score 3+3=6 and of intermediate-risk Gleason score 4+3=7 prostate cancer.
For this purpose, we isolated Gleason grade 3 tumor glands from a total of 18 patients using laser capture microdissection and analyzed gene-expression values after RNA sequencing. Since the number of samples in both groups were small (total N=18), we determined the genes with a 2log-fold chance >1 and p<0.05, resulting in 501 genes over-expressed and 421 genes down-regulated in Gleason grade 3 component of Gleason score 3+3=6 as compared to Gleason score 4+3=7 prostate cancer. The differentially expressed gene-list contained various genes previously reported to be differentially expressed in low- and intermediate/ high-grade prostate cancer such as HOXC6, MAGEC2, HERPUD1 and SATB1 (Hendriksen, Dits et al. 2006; von Boehmer, Keller et al. 2011; Mao, Yang et al. 2013; Leyten, Hessels et al. 2015). From the differentially expressed genes, we selected ZIC2, ZIC5 and HELLS for further validation on protein level in an independent cohort of 481 radical prostatectomy samples. Of these three genes, HELLS and ZIC5 protein
Chap
ter 5
Chapter 5: Gene-expression analysis of Gleason grade 3 tumor glands embedded in low- and high-risk prostate cancer
Proefschrift#8_DEF.indd 117 25-08-15 16:42

118 Discovery and Validation of Prognostic Tissue Markers in Clinical Prostate Cancer – © 2015, A.M. Hoogland
expression was strongly associated with Gleason score ≥7 prostate cancer, while we were not able to confirm this relation on protein level for ZIC2. In addition, HELLS was an independent predictive marker for biochemical recurrence after radical prostatectomy.
The zinc finger of the cerebellum (ZIC) family of genes encompasses five human homologues ZIC1-5 (Ali, Bellchambers et al. 2012). The family members are all transcription factors which have predominantly been implicated in neuro-ectodermal development (Aruga 2004). ZIC family members are able to inhibit TCF4/β-Catenin and interact with GLI signaling (Mizugishi, Aruga et al. 2001; Pourebrahim, Houtmeyers et al. 2011). In addition, ZIC family members are involved in various human solid tumors. ZIC1, -2 and -5 are over-expressed in meningiomas, while ZIC4 is expressed in medulloblastomas (Aruga, Nozaki et al. 2010). Expression of ZIC2 is associated with survival in oral squamous carcinoma (Sakuma, Kasamatsu et al. 2010). Methylation of ZIC4 in pTa bladder cancer is predictive for progression to muscle-invasive (≥pT2) disease (Kandimalla, van Tilborg et al. 2012). Promotor methylation of ZIC1 is associated with gastric cancer (Wang, Jin et al. 2009). Interestingly, we found that ZIC1, ZIC2, ZIC4 and ZIC5 were all up-regulated in Gleason grade 3 constituting Gleason score 4+3=7 prostate cancer on RNA level. While ZIC5 was associated with high Gleason score on protein level, we were not able to demonstrate this for ZIC2 which might be due to translational discrepancy.
The helicase, lymphoid specific (HELLS) gene also known as lymphoid-specific helicase (LSH) is known to activate E2F-transcription factors in G1/S-transition, and recruit DNA repair and chromatin-remodeling proteins (Mjelle, Hegre et al. 2015). HELLS has been implicated in the progression in non-small cell lung carcinoma and squamous cell carcinoma in the head and neck region (Yano, Ouchida et al. 2004; Waseem, Ali et al. 2010; Janus, Laborde et al. 2011). Von Eyss et al. found that HELLS expression was associated with Gleason score ≥4+3=7 tumors in 47 prostate cancer biopsies, which is in line with our study (von Eyss, Maaskola et al. 2012). During development, HELLS is involved in silencing of HOX genes by recruitment of DNA methyltransferases and Polycomb-repressive complex members among which EZH2 (Xi, Zhu et al. 2007). Interestingly, EZH2 demonstrates similar expression patterns in prostate cancer as HELLS with expression in a minority of tumor cells. Using a cut-off of ≥1% in radical prostatectomy specimens, we found that EZH2 was associated with high-grade prostate cancer and biochemical recurrence (van Leenders, Dukers et al. 2007; Hoogland, Verhoef et al. 2014). EZH2 expression in <1% of tumor cells in prostate cancer biopsies was predictive for indolent disease at radical prostatectomy (Wolters, Vissers et al. 2009). Although we did not perform immunofluorescent co-
Chap
ter 5
Proefschrift#8_DEF.indd 118 25-08-15 16:42

119
Chap
ter 5
Chapter 5: Gene-expression analysis of Gleason grade 3 tumor glands embedded in low- and high-risk prostate cancer
expression studies, we found a statistical correlation of HELLS and EZH2 expression within the same patients and individual tissue microarray cores, suggesting a link of both DNA- and histone- methylation pathways within prostate cancer patients as has previously been shown in in vitro models (Xi, Zhu et al. 2007).
In this study, we have analyzed gene-expression profiles in Gleason grade 3 in low- and high-grade prostate cancer using laser capture microdissection, RNA amplification and sequencing. Hereby, we demonstrate the feasibility of this methodology for in-depth analysis of specific cellular tissue compartments. Our validation of a selected panel of genes by QPCR and the differential expression of various known genes such as HOXC6 and HERPUD1 supports the validity of this methodology. Using this approach, we are able to identify genes of interest that might have been undetected due to background signal when conventional whole tissue slide profiling is applied.
A caveat of the current study is the relatively low number of samples in both cohorts, which hampered robust biostatistical analysis. Therefore, we set less stringent discriminatory criteria for comparing both study groups and selected a panel of genes for further validation. While our purpose is to validate genes such as HELLS and ZIC5 immunohistochemically on diagnostic Gleason score 3+3=6 biopsies to select patients with actual intermediate/high-risk disease, biopsy validation was not included in the current study. Since retrospective biopsy studies are hampered by the fact that a significant number of biopsies will not have representative tissue available anymore, we are currently analyzing the predictive value of HELLS and ZIC5 in a prospective biopsy study.
In conclusion, we demonstrated that combining laser capture microdissection, RNA amplification and sequencing resulted in reliable molecular profiling of specific tissue compartments. We found that in particular ZIC family members are over-expressed in Gleason grade 3 tumor glands associated with intermediate-risk disease. ZIC5 and HELLS were associated with Gleason score ≥7 prostate cancer, while HELLS was independently predictive for post-operative biochemical recurrence.
Proefschrift#8_DEF.indd 119 25-08-15 16:42

120 Discovery and Validation of Prognostic Tissue Markers in Clinical Prostate Cancer – © 2015, A.M. Hoogland
Chap
ter 5
AcknowledgementsThis research was sponsored by CTMM; project PCMM, project number 03O-203. We kindly thank the Tissue Bank from Erasmus MC for storing, providing and assis-tance with the frozen prostate tissue samples and the assistance and maintenance of the PALM Laser Capture Microscope. We kindly thank Anieta Sieuwerts for her help and advice concerning the isolation and quality testing of RNA. We kindly thank Jessie Sanders (www.jessiesanders.nl/) and Esther Verhoef for editing figure 1
Proefschrift#8_DEF.indd 120 25-08-15 16:42

121
Chap
ter 5
References1. Ferlay, J., et al., Cancer incidence and mortality worldwide: sources, methods and major
patterns in GLOBOCAN 2012. Int J Cancer, 2015. 136(5): p. E359-86.
2. Malvezzi, M., et al., European cancer mortality predictions for the year 2015: does lung cancer have the highest death rate in EU women? Ann Oncol, 2015. 26(4): p. 779-86.
3. Siegel, R.L., K.D. Miller, and A. Jemal, Cancer statistics, 2015. CA Cancer J Clin, 2015. 65(1): p. 5-29.
4. Epstein, J.I., An update of the Gleason grading system. J Urol, 2010. 183(2): p. 433-40.
5. Humphrey, P.A., Gleason grading and prognostic factors in carcinoma of the prostate. Mod Pathol, 2004. 17(3): p. 292-306.
6. Cheng, L., et al., Staging of prostate cancer. Histopathology, 2012. 60(1): p. 87-117.
7. Hegarty, J., et al., Radical prostatectomy versus watchful waiting for prostate cancer. Cochrane Database Syst Rev, 2010(11): p. CD006590.
8. Klotz, L., et al., Clinical results of long-term follow-up of a large, active surveillance cohort with localized prostate cancer. J Clin Oncol, 2010. 28(1): p. 126-31.
9. Loeb, S., et al., Overdiagnosis and Overtreatment of Prostate Cancer. European Urology, 2014. 65(6): p. 1046-1055.
10. van As, N.J., et al., Predicting the probability of deferred radical treatment for localised prostate cancer managed by active surveillance. Eur Urol, 2008. 54(6): p. 1297-305.
11. Soloway, M.S., et al., Careful selection and close monitoring of low-risk prostate cancer patients on active surveillance minimizes the need for treatment. Eur Urol, 2010. 58(6): p. 831-5.
12. Huang, J., et al., Percentage of positive biopsy cores: a better risk stratification model for prostate cancer? Int J Radiat Oncol Biol Phys, 2012. 83(4): p. 1141-8.
13. Cohen, R.J., et al., Prediction of pathological stage and clinical outcome in prostate cancer: an improved pre-operative model incorporating biopsy-determined intraductal carcinoma. Br J Urol, 1998. 81(3): p. 413-8.
14. Quinn, D.I., et al., Prognostic significance of preoperative factors in localized prostate carcinoma treated with radical prostatectomy: importance of percentage of biopsies that contain tumor and the presence of biopsy perineural invasion. Cancer, 2003. 97(8): p. 1884-93.
15. Moussa, A.S., et al., Prostate biopsy clinical and pathological variables that predict significant grading changes in patients with intermediate and high grade prostate cancer. BJU Int, 2009. 103(1): p. 43-8.
16. Klotz, L., Prostate cancer overdiagnosis and overtreatment. Curr Opin Endocrinol Diabetes Obes, 2013. 20(3): p. 204-9.
17. Bangma, C.H., S. Roemeling, and F.H. Schroder, Overdiagnosis and overtreatment of early detected prostate cancer. World J Urol, 2007. 25(1): p. 3-9.
18. Sorensen, K.D. and T.F. Orntoft, Discovery of prostate cancer biomarkers by microarray gene expression profiling. Expert Rev Mol Diagn, 2010. 10(1): p. 49-64.
19. Wolters, T. et al., The value of EZH2, p27(kip1), BMI-1 and MIB-1 on biopsy specimens with low-risk prostate cancer in selecting men with significant prostate cancer at prostatectomy. BJU Int, 2009.
Chapter 5: Gene-expression analysis of Gleason grade 3 tumor glands embedded in low- and high-risk prostate cancer
Proefschrift#8_DEF.indd 121 25-08-15 16:42

122 Discovery and Validation of Prognostic Tissue Markers in Clinical Prostate Cancer – © 2015, A.M. Hoogland
Chap
ter 5
20. Cooperberg, M.R., J.M. Broering, and P.R. Carroll, Time trends and local variation in primary treatment of localized prostate cancer. J Clin Oncol, 2010. 28(7): p. 1117-23.
21. Cooperberg, M.R., P.R. Carroll, and L. Klotz, Active surveillance for prostate cancer: progress and promise. J Clin Oncol, 2011. 29(27): p. 3669-76.
22. Tosoian, J.J., et al., Active surveillance program for prostate cancer: an update of the Johns Hopkins experience. J Clin Oncol, 2011. 29(16): p. 2185-90.
23. van den Bergh, R.C., et al., Outcomes of men with screen-detected prostate cancer eligible for active surveillance who were managed expectantly. Eur Urol, 2009. 55(1): p. 1-8.
24. Divrik, R.T., et al., Increasing the number of biopsies increases the concordance of Gleason scores of needle biopsies and prostatectomy specimens. Urol Oncol, 2007. 25(5): p. 376-82.
25. Kim, D., et al., TopHat2: accurate alignment of transcriptomes in the presence of insertions, deletions and gene fusions. Genome Biol, 2013. 14(4): p. R36.
26. Robinson, M.D., D.J. McCarthy, and G.K. Smyth, edgeR: a Bioconductor package for differential expression analysis of digital gene expression data. Bioinformatics, 2010. 26(1): p. 139-40.
27. Duijvesz, D., et al., Proteomic profiling of exosomes leads to the identification of novel biomarkers for prostate cancer. PLoS One, 2013. 8(12): p. e82589.
28. Hoogland, A.M., et al., ERG immunohistochemistry is not predictive for PSA recurrence, local recurrence or overall survival after radical prostatectomy for prostate cancer. Mod Pathol, 2012. 25(3): p. 471-9.
29. Hoogland, A.M., et al., Validation of stem cell markers in clinical prostate cancer: alpha6-integrin is predictive for non-aggressive disease. Prostate, 2014. 74(5): p. 488-96.
30. Roobol, M.J., W.J. Kirkels, and F.H. Schroder, Features and preliminary results of the Dutch centre of the ERSPC (Rotterdam, the Netherlands). BJU Int, 2003. 92 Suppl 2: p. 48-54.
31. Schroder, F.H., et al., Screening and prostate-cancer mortality in a randomized European study. the New England Journal of Medicine, 2009. 360: p. 1320-1328.
32. Xi, S., et al., Lsh controls Hox gene silencing during development. Proc Natl Acad Sci U S A, 2007. 104(36): p. 14366-71.
33. van Leenders, G.J., et al., Polycomb-group oncogenes EZH2, BMI1, and RING1 are overexpressed in prostate cancer with adverse pathologic and clinical features. Eur Urol, 2007. 52(2): p. 455-63.
34. Bul, M., et al., Outcomes of initially expectantly managed patients with low or intermediate risk screen-detected localized prostate cancer. BJU Int, 2012. 110(11): p. 1672-7.
35. Fine, S.W. and J.I. Epstein, A contemporary study correlating prostate needle biopsy and radical prostatectomy Gleason score. J Urol, 2008. 179(4): p. 1335-8; discussion 1338-9.
36. Helpap, B. and L. Egevad, The significance of modified Gleason grading of prostatic carcinoma in biopsy and radical prostatectomy specimens. Virchows Arch, 2006. 449(6): p. 622-7.
37. Capitanio, U., et al., Biopsy core number represents one of foremost predictors of clinically significant gleason sum upgrading in patients with low-risk prostate cancer. Urology, 2009. 73(5): p. 1087-91.
38. Kassouf, W., et al., Effect of prostate volume on tumor grade in patients undergoing radical prostatectomy in the era of extended prostatic biopsies. J Urol, 2007. 178(1): p. 111-4.
Proefschrift#8_DEF.indd 122 25-08-15 16:42

123
Chap
ter 5
39. Sarici, H., et al., Predictors of Gleason score upgrading in patients with prostate biopsy Gleason score </=6. Can Urol Assoc J, 2014. 8(5-6): p. E342-6.
40. Hendriksen, P.J., et al., Evolution of the androgen receptor pathway during progression of prostate cancer. Cancer Res, 2006. 66(10): p. 5012-20.
41. Leyten, G.H., et al., Identification of a Candidate Gene Panel for the Early Diagnosis of Prostate Cancer. Clin Cancer Res, 2015.
42. Mao, L., et al., SATB1 is overexpressed in metastatic prostate cancer and promotes prostate cancer cell growth and invasion. J Transl Med, 2013. 11: p. 111.
43. von Boehmer, L., et al., MAGE-C2/CT10 protein expression is an independent predictor of recurrence in prostate cancer. PLoS One, 2011. 6(7): p. e21366.
44. Ali, R.G., H.M. Bellchambers, and R.M. Arkell, Zinc fingers of the cerebellum (Zic): transcription factors and co-factors. Int J Biochem Cell Biol, 2012. 44(11): p. 2065-8.
45. Aruga, J., The role of Zic genes in neural development. Mol Cell Neurosci, 2004. 26(2): p. 205-21.
46. Mizugishi, K., et al., Molecular properties of Zic proteins as transcriptional regulators and their relationship to GLI proteins. J Biol Chem, 2001. 276(3): p. 2180-8.
47. Pourebrahim, R., et al., Transcription factor Zic2 inhibits Wnt/beta-catenin protein signaling. J Biol Chem, 2011. 286(43): p. 37732-40.
48. Aruga, J., et al., Expression of ZIC family genes in meningiomas and other brain tumors. BMC Cancer, 2010. 10: p. 79.
49. Sakuma, K., et al., Expression status of Zic family member 2 as a prognostic marker for oral squamous cell carcinoma. J Cancer Res Clin Oncol, 2010. 136(4): p. 553-9.
50. Kandimalla, R., et al., Genome-wide analysis of CpG island methylation in bladder cancer identified TBX2, TBX3, GATA2, and ZIC4 as pTa-specific prognostic markers. Eur Urol, 2012. 61(6): p. 1245-56.
51. Wang, L.J., et al., ZIC1 is downregulated through promoter hypermethylation in gastric cancer. Biochem Biophys Res Commun, 2009. 379(4): p. 959-63.
52. Mjelle, R., et al., Cell cycle regulation of human DNA repair and chromatin remodeling genes. DNA Repair (Amst), 2015. 30: p. 53-67.
53. Janus, J.R., et al., Linking expression of FOXM1, CEP55 and HELLS to tumorigenesis in oropharyngeal squamous cell carcinoma. Laryngoscope, 2011. 121(12): p. 2598-603.
54. Waseem, A., et al., Downstream targets of FOXM1: CEP55 and HELLS are cancer progression markers of head and neck squamous cell carcinoma. Oral Oncol, 2010. 46(7): p. 536-42.
55. Yano, M., et al., Tumor-specific exon creation of the HELLS/SMARCA6 gene in non-small cell lung cancer. Int J Cancer, 2004. 112(1): p. 8-13.
56. von Eyss, B., et al., The SNF2-like helicase HELLS mediates E2F3-dependent transcription and cellular transformation. EMBO J, 2012. 31(4): p. 972-85.
Chapter 5: Gene-expression analysis of Gleason grade 3 tumor glands embedded in low- and high-risk prostate cancer
Proefschrift#8_DEF.indd 123 25-08-15 16:42

124 Discovery and Validation of Prognostic Tissue Markers in Clinical Prostate Cancer – © 2015, A.M. Hoogland
Chap
ter 5
Table 1. Biomarker correlation of HELLS, ZIC2 and ZIC5 with clinicopathologic parameters. For HELLS and ZIC5 a cut-off of 1% was applied, for ZIC2 a cut-off of 50%.
HELLS
Negative Positive Total p-value
PSA at diagnosis≤10 ng/ml>10 ng/mlTotal
312 (74.3%)44 (10.5%)356 (84.8%)
55 (13.1%)9 (2.1%)64 (15.2%)
367 (87.4%)53 (12.6%)420
0.71
Gleason score<77>7Total
198 (47.0%)143 (34.0%)16 (3.8%)357 (84.8%)
23 (5.5%)29 (6.8%)12 (2.9%)64 (15.2%)
221 (52.5%)172 (40.8%)28 (6.7%)421
< 0.001
pT-stagepT2pT3a/bpT4Total
257 (61.1%)81 (19.2%)19 (4.5%)357 (84.8%)
37 (8.8%)21 (5.0%)6 (1.4%)64 (15.2%)
294 (69.9%)102 (24.2%)25 (5.9%)421
0.07
ZIC2
Negative Positive Total p-value
PSA at diagnosis≤10 ng/ml>10 ng/mlTotal
176 (52.9%)32 (9.6%)208 (62.5%)
108 (32.4%)17 (5.1%)125 (37.5%)
284 (85.3%)49 (14.7%)333
0.66
Gleason score<77>7Total
98 (29.5%)88 (26.4%)22 (6.6%)208 (62.5%)
61 (18.3%)58 (17.4%)6 (1.8%)125 (37.5%)
159 (47.8%)146 (43.8%)28 (8.4%)333
0.18
pT-stagepT2pT3a/bpT4Total
136 (40.9%)58 (17.4%)14 (4.2%)208 (62.5%)
83 (24.9%)36 (10.8%)6 (1.8%)125 (37.5%)
219 (65.8%)94 (28.2%)20 (6.0%)333
0.77
ZIC5
Negative Positive Total p-value
PSA at diagnosis≤10 ng/ml>10 ng/mlTotal
237 (57.4%)30 (7.3%)267 (64.7%)
122 (29.5%)24 (5.8%)146 (35.3%)
359 (86.9%)54 (13.1%)413
0.13
Gleason score<77>7Total
161 (38.9%)94 (22.7%)12 (2.9%)267 (64.5%)
61 (14.7%)70 (16.9%)16 (3.9%)147 (35.5%)
222 (53.6%)164 (39.6%)28 (6.8%)414
< 0.001
pT-stagepT2pT3a/bpT4Total
193 (46.6%)58 (14.0%)16 (3.9%)267 (64.5%)
95 (23.0%)42 (10.1%)10 (2.4%)147 (35.5)
288 (69.6%)100 (24.1%)26 (6.3%)414
0.25
Proefschrift#8_DEF.indd 124 25-08-15 16:42

125
Chap
ter 5
Table 2. Predictive value of HELLS, ZIC2 and ZIC5 for biochemical recurrence after radical prostatectomy.
Parameter Univariate analysis Multivariate analysis
HR (95% CI) p-value HR (95% CI) p-value
Age 1.0 (1.0-1.09) 0.04 1.0 (1.0-1.1) 0.21
PSA 3.5 (2.3-5.3) <0.01 1.8 (1.1-2.8) 0.03
Gleason score 2.5 (1.9-3.3) <0.01 1.8 (1.3-2.5) <0.01
pT-stage 1.7 (1.5-2.0) <0.01 1.3 (1.0-1.5) 0.03
Surgical margin 3.3 (2.3-4.7) <0.01 2.3 (1.6-3.4) <0.01
HELLS 2.6 (1.7-4.0) <0.01 2.3 (1.5-3.6) <0.01
ZIC2 1.1 (0.7-1.7) 0.69 1.4 (0.9-2.2) 0.11
ZIC5 1.3 (0.9-1.9) 0.15 0.9 (0.6-1.3) 0.61
HR = Hazard ratioCI = Confidence IntervalPSA = Prostate Specific Antigen
Chapter 5: Gene-expression analysis of Gleason grade 3 tumor glands embedded in low- and high-risk prostate cancer
Proefschrift#8_DEF.indd 125 25-08-15 16:42

126 Discovery and Validation of Prognostic Tissue Markers in Clinical Prostate Cancer – © 2015, A.M. Hoogland
Chap
ter 5
Figure 1
Proefschrift#8_DEF.indd 126 25-08-15 16:42

127
Chap
ter 5
Figure 1. Immunohistochemical expression of HELLS (A and B), ZIC2 (C and D) and ZIC5 (E and F) in prostate cancer. HELLS is positive in a small subpopulation of tumor cells (arrowheads). ZIC2 is negative (C) or moderately positive in a high percentage of cells with both cytoplasmatic and nuclear expression (D). ZIC5 shows sporadic nuclear expression in E and moderate expression in scattered cells (F). Original magnifications, 400x.
Chapter 5: Gene-expression analysis of Gleason grade 3 tumor glands embedded in low- and high-risk prostate cancer
Proefschrift#8_DEF.indd 127 25-08-15 16:42

128 Discovery and Validation of Prognostic Tissue Markers in Clinical Prostate Cancer – © 2015, A.M. Hoogland
Chap
ter 5
Supplementary Table 1.
List of genes over-expressed in Gleason grade 3 tumor glands being part of a Gleason score 4+3=7 as compared to Gleason score 3+3=6.
logFC values represent 2log fold changes of RNA expression value of Gleason grade 3 in Gleason score 6 prostate cancer divided by its expression value in Gleason score 4+3=7 prostate cancer. Negative values represent up-regulation of genes in Gleason score 4+3=7 prostate cancer.
logCPM values represent 2log counts per million mapped reads.
logFC logCPM PValue
GLYATL3 -9,36 -1,72 0,00
CDC20B -8,71 -2,86 0,00
ZIC1 -8,53 -3,48 0,00
COX7B2 -8,11 -3,01 0,00
HORMAD2 -8,07 -4,04 0,00
ENTHD1 -7,95 -4,03 0,00
FEZF2 -7,62 -4,74 0,00
IBSP -7,39 -4,95 0,01
DYTN -7,39 -4,68 0,00
MAGEC2 -7,36 -4,69 0,00
OR8A1 -7,16 -4,17 0,00
SLC17A4 -7,16 -3,74 0,00
NXPH1 -7,12 -5,02 0,00
PDIA2 -7,03 -4,78 0,00
PNLIPRP3 -6,98 -4,17 0,00
ZIC4 -6,88 -5,05 0,01
CYP1A2 -6,88 -4,23 0,00
OR8D1 -6,78 -4,47 0,00
HOXC13 -6,47 -4,68 0,00
CREG2 -6,46 -0,56 0,00
CHODL-AS1 -6,40 -4,77 0,01
OR52N2 -6,40 -5,10 0,00
DMP1 -6,33 -5,91 0,04
LILRA4 -6,25 -5,74 0,01
MUC6 -6,25 1,69 0,00
PTX4 -6,23 -2,38 0,00
AFP -6,17 -5,24 0,01
CCDC144NL -6,17 -5,67 0,01
TAG -6,17 -5,16 0,01
CEACAM7 -5,99 -5,49 0,01
Proefschrift#8_DEF.indd 128 25-08-15 16:42

129
Chap
ter 5
SPATA21 -5,99 -5,47 0,00
KCNH7 -5,98 -0,12 0,00
ANKUB1 -5,89 -6,08 0,04
PADI3 -5,89 -5,43 0,02
MUC21 -5,89 -5,60 0,01
ANKRD30A -5,89 -1,77 0,00
KLRC2 -5,79 -6,23 0,04
H1FNT -5,79 -6,07 0,03
PLA2G4B -5,79 -5,85 0,02
MAGEC1 -5,79 -5,71 0,02
PPP1R42 -5,79 -5,77 0,01
DIRAS2 -5,77 -3,18 0,00
FGF20 -5,68 -6,27 0,05
OR8G5 -5,68 -5,55 0,02
TPTE -5,68 -5,55 0,02
GCM1 -5,68 -5,85 0,02
RGS6 -5,68 -5,31 0,01
KCNV1 -5,55 -5,68 0,02
SSX1 -5,55 -5,68 0,02
INSL3 -5,55 -6,19 0,02
RPRML -5,55 -5,66 0,01
CNPY1 -5,42 -5,83 0,03
IL36RN -5,42 -6,01 0,03
BARX1 -5,42 -5,65 0,02
LHX2 -5,42 -5,96 0,01
MAGEA8 -5,32 -3,54 0,00
HNF1A-AS1 -5,27 -6,09 0,05
DCAF4L2 -5,27 -5,99 0,04
DHH -5,27 -6,06 0,03
INSL6 -5,27 -5,69 0,03
ABRA -5,27 -5,94 0,01
TNNI3 -5,10 -6,18 0,05
CHRM4 -5,10 -6,64 0,04
TRPC3 -5,10 -6,55 0,04
KRT73 -5,10 -6,16 0,04
TDO2 -5,10 -1,44 0,00
NETO1 -5,02 -2,70 0,00
PPP3R2 -5,02 -2,73 0,00
Chapter 5: Gene-expression analysis of Gleason grade 3 tumor glands embedded in low- and high-risk prostate cancer
Proefschrift#8_DEF.indd 129 25-08-15 16:42

130 Discovery and Validation of Prognostic Tissue Markers in Clinical Prostate Cancer – © 2015, A.M. Hoogland
Chap
ter 5
CFHR4 -4,92 -6,54 0,05
IL9R -4,92 -6,33 0,04
FAM92B -4,92 -6,68 0,03
IFNG -4,92 -6,64 0,02
TUBA4B -4,80 -4,78 0,01
WDR72 -4,78 -2,60 0,00
TRDN -4,78 -2,27 0,00
PRRG3 -4,70 -6,16 0,03
GRIK4 -4,66 -4,41 0,01
LY6D -4,58 -1,75 0,00
SLC4A8 -4,49 -3,19 0,00
HSPA6 -4,46 -1,21 0,00
CNTNAP5 -4,45 -5,14 0,01
CYP1A1 -4,45 -4,42 0,00
LRRIQ4 -4,39 -5,32 0,03
PROK2 -4,39 -4,21 0,00
ACCN1 -4,38 -4,59 0,00
MYT1 -4,31 -4,33 0,00
METTL7B -4,28 -3,31 0,00
ZNF804B -4,26 -3,53 0,00
OLFM4 -4,25 4,36 0,00
OMD -4,23 1,41 0,00
TDRD9 -4,19 -3,40 0,01
KLK14 -4,13 -2,40 0,00
SLC18A3 -4,13 -5,55 0,04
TULP2 -4,08 -2,96 0,00
ZIC5 -4,08 -1,00 0,00
ATP12A -4,05 -5,46 0,02
LINC00307 -3,98 -5,02 0,01
GABRA2 -3,98 -5,33 0,00
TTC29 -3,96 -4,82 0,00
HAVCR1 -3,90 -5,02 0,01
SLC13A1 -3,81 -4,95 0,01
ACSM5 -3,81 -5,28 0,00
POU5F1P4 -3,80 -2,14 0,01
XIRP1 -3,77 -4,69 0,00
HAO1 -3,70 -1,96 0,00
PHOSPHO1 -3,62 -5,40 0,03
Proefschrift#8_DEF.indd 130 25-08-15 16:42

131
Chap
ter 5
HOXB7 -3,54 -4,46 0,01
SLC6A17 -3,50 -1,07 0,00
PON1 -3,49 0,43 0,00
KRTAP13-2 -3,48 -0,42 0,01
SLC6A15 -3,42 -1,73 0,00
RHCG -3,38 -4,20 0,01
CA1 -3,38 -4,08 0,02
EFNA2 -3,36 -3,90 0,00
DLEU7 -3,35 -4,29 0,03
KRT2 -3,34 -4,42 0,00
IGSF21 -3,32 -0,02 0,01
SLC6A20 -3,28 -5,27 0,02
FAM176A -3,28 -4,80 0,00
CXCL9 -3,25 1,72 0,00
DSCAM-AS1 -3,22 -0,86 0,00
HIST1H2AB -3,14 -6,05 0,04
CDHR4 -3,13 -5,15 0,05
HOXB9 -3,12 -2,48 0,01
PLAT -3,12 2,65 0,00
FGF12 -3,11 0,59 0,00
HCN4 -3,07 -4,97 0,01
MKRN3 -3,06 -3,18 0,01
KRT13 -3,06 0,95 0,01
NBEAP1 -3,06 0,82 0,00
KIAA1239 -3,06 -4,56 0,05
DNAH3 -3,05 -3,15 0,01
ZIC2 -3,05 -0,64 0,00
SCML4 -3,02 -4,32 0,01
UNC5A -3,00 0,91 0,00
DDC -2,98 -2,65 0,00
TMEM63C -2,97 -2,26 0,03
HOGA1 -2,97 -5,28 0,01
FOXN4 -2,96 -3,50 0,04
PCDHB3 -2,96 1,18 0,00
ZNF536 -2,94 -3,29 0,00
GRIN3A -2,92 2,08 0,00
CXCR2 -2,88 -5,35 0,02
SLC22A14 -2,88 -5,21 0,02
Chapter 5: Gene-expression analysis of Gleason grade 3 tumor glands embedded in low- and high-risk prostate cancer
Proefschrift#8_DEF.indd 131 25-08-15 16:42

132 Discovery and Validation of Prognostic Tissue Markers in Clinical Prostate Cancer – © 2015, A.M. Hoogland
Chap
ter 5
FOXS1 -2,85 -4,44 0,01
TMPRSS4 -2,84 -1,80 0,01
TNNT1 -2,83 -4,43 0,01
CXCL6 -2,82 -3,61 0,00
SLPI -2,82 -0,54 0,00
ST6GALNAC5 -2,80 -0,56 0,00
SLC22A10 -2,79 -2,13 0,00
IL12RB1 -2,78 -4,38 0,04
BMX -2,78 -4,59 0,01
B3GALT5 -2,77 -3,97 0,03
GPR158 -2,76 0,70 0,00
NMNAT2 -2,76 -0,30 0,00
DCLK1 -2,76 0,76 0,00
HOXC4 -2,72 -0,44 0,00
SI -2,68 2,37 0,00
CA4 -2,68 -3,83 0,01
WNT10B -2,67 -5,59 0,01
NLGN4X -2,65 0,14 0,04
KRT4 -2,63 -1,89 0,02
VWA7 -2,61 -3,10 0,00
PAX1 -2,60 -3,47 0,04
CES3 -2,59 -1,37 0,00
UTS2D -2,58 -2,13 0,02
DHRS2 -2,57 -3,62 0,00
TEKT1 -2,57 -4,93 0,03
HAL -2,56 -5,82 0,03
ZBBX -2,54 -3,52 0,03
UGT8 -2,53 -3,78 0,00
UPB1 -2,52 -4,56 0,01
EEF1A2 -2,52 0,02 0,00
CGA -2,52 -2,92 0,04
MMP13 -2,51 -3,46 0,03
SIGLEC1 -2,51 -2,60 0,00
CAPN14 -2,50 -3,55 0,00
SPON2 -2,47 5,98 0,00
DUOX2 -2,47 -0,66 0,01
SCG5 -2,46 -2,50 0,04
PTGFR -2,45 -1,85 0,00
Proefschrift#8_DEF.indd 132 25-08-15 16:42

133
Chap
ter 5
CORT -2,44 -4,97 0,02
COL12A1 -2,43 7,01 0,00
CCDC141 -2,39 1,38 0,00
CCL4 -2,38 -2,42 0,00
TMPRSS11A -2,36 -3,94 0,04
TSPO2 -2,35 -5,47 0,05
NPPC -2,35 -2,81 0,00
TLR8 -2,32 -4,18 0,02
MUC4 -2,31 1,14 0,00
SHCBP1 -2,31 -3,33 0,00
CCL3 -2,30 -2,22 0,01
AK5 -2,28 1,24 0,00
SLC16A6 -2,26 -2,00 0,01
HOXD-AS1 -2,25 -0,85 0,01
GRM7 -2,25 -3,17 0,02
TLE6 -2,25 -5,27 0,04
RORB -2,24 0,33 0,00
ALB -2,23 -1,93 0,00
CDT1 -2,23 -2,14 0,03
NTNG1 -2,23 0,84 0,00
E2F2 -2,23 -2,55 0,00
E2F7 -2,22 -1,81 0,00
COL11A1 -2,22 -4,89 0,04
FOXJ1 -2,21 -2,03 0,01
CLCA4 -2,21 -2,30 0,02
SERPINA4 -2,20 -4,39 0,01
RS1 -2,19 -4,80 0,05
XIRP2 -2,18 -3,96 0,03
FBXL16 -2,17 -1,76 0,00
ZMYND10 -2,17 -2,58 0,01
SEMA3D -2,16 1,87 0,00
KCNJ10 -2,16 -0,29 0,00
IL11 -2,15 -5,83 0,04
MUC13 -2,15 1,07 0,00
TPPP3 -2,14 -1,97 0,02
GCNT3 -2,14 -2,99 0,02
GMNC -2,13 1,36 0,02
UCA1 -2,13 -4,78 0,05
Chapter 5: Gene-expression analysis of Gleason grade 3 tumor glands embedded in low- and high-risk prostate cancer
Proefschrift#8_DEF.indd 133 25-08-15 16:42

134 Discovery and Validation of Prognostic Tissue Markers in Clinical Prostate Cancer – © 2015, A.M. Hoogland
Chap
ter 5
SLC38A4 -2,12 0,59 0,00
GDF11 -2,10 1,45 0,00
LANCL3 -2,09 -2,59 0,01
COCH -2,08 -1,05 0,01
ATP8A2 -2,08 1,42 0,01
SSTR1 -2,07 -0,05 0,02
PKHD1 -2,07 -0,12 0,01
LGALS2 -2,07 -4,75 0,02
NRP1 -2,06 2,74 0,00
TMED6 -2,03 -1,31 0,00
CCDC78 -2,02 -3,40 0,00
GRPR -2,01 0,82 0,00
CDH10 -2,01 -0,56 0,00
BANK1 -2,01 3,61 0,00
LRRTM4 -2,00 -3,09 0,02
HNF1A -2,00 -2,40 0,00
KRT20 -2,00 -2,87 0,01
MOGAT2 -2,00 -3,56 0,02
DLGAP5 -1,99 -1,13 0,00
ODZ1 -1,99 5,10 0,00
PPFIA2 -1,98 1,05 0,02
RDH5 -1,98 -4,58 0,02
KYNU -1,97 -3,85 0,01
MCOLN3 -1,97 -1,23 0,02
LMX1B -1,96 -1,74 0,00
NKG7 -1,96 -3,49 0,04
PYHIN1 -1,96 -3,37 0,01
OLR1 -1,95 -1,11 0,00
SDS -1,95 -2,23 0,03
CCDC83 -1,95 -2,65 0,04
CSMD1 -1,95 -1,56 0,01
KLHL6 -1,93 -2,48 0,00
HOXC6 -1,93 0,93 0,00
SPATC1 -1,92 -4,40 0,00
PLK1 -1,92 -1,31 0,00
PIRT -1,91 -3,47 0,03
COL11A2 -1,91 -3,68 0,02
MED12L -1,90 1,50 0,00
Proefschrift#8_DEF.indd 134 25-08-15 16:42

135
Chap
ter 5
PCDHA10 -1,89 -1,00 0,01
TREM2 -1,88 -2,58 0,01
RND1 -1,87 -1,16 0,00
RAB39A -1,87 -2,06 0,00
E2F8 -1,87 -2,38 0,00
PMS2P5 -1,86 -5,24 0,05
MADCAM1 -1,86 -4,85 0,02
MAOB -1,86 1,19 0,03
CLSPN -1,85 -1,62 0,00
GJA3 -1,85 -2,34 0,02
CEP55 -1,84 -1,77 0,01
NUF2 -1,84 -2,91 0,03
HAGHL -1,83 -3,10 0,05
CELSR3 -1,83 -0,40 0,00
FOXL2 -1,83 -2,77 0,02
HS6ST2 -1,81 -1,06 0,03
APOE -1,81 0,89 0,00
RFX6 -1,80 -2,28 0,05
NAT8L -1,80 -2,22 0,01
CADPS -1,79 -0,21 0,01
MOB4 -1,79 -4,17 0,02
MT1DP -1,79 -4,09 0,01
PTPRZ1 -1,79 -0,68 0,00
IL1RAPL1 -1,79 -0,54 0,01
PLTP -1,78 2,00 0,01
PSMC3IP -1,77 -2,48 0,00
DUSP8 -1,77 0,23 0,00
GAPT -1,77 -3,85 0,02
OSM -1,76 -5,23 0,03
GSG2 -1,74 -2,30 0,01
PBK -1,74 -2,93 0,04
CCDC19 -1,73 -3,02 0,04
ULBP1 -1,73 -4,24 0,04
LINC00173 -1,73 -4,05 0,03
MYBL2 -1,73 -1,57 0,00
ONECUT2 -1,73 1,72 0,00
ASF1B -1,72 -1,75 0,01
HS3ST1 -1,72 0,76 0,01
Chapter 5: Gene-expression analysis of Gleason grade 3 tumor glands embedded in low- and high-risk prostate cancerChapter 5: Gene-expression analysis of Gleason grade 3 tumor glands embedded in low- and high-risk prostate cancer
Proefschrift#8_DEF.indd 135 25-08-15 16:42

136 Discovery and Validation of Prognostic Tissue Markers in Clinical Prostate Cancer – © 2015, A.M. Hoogland
Chap
ter 5
TMEM59L -1,72 -2,77 0,03
RASAL3 -1,72 -2,79 0,00
ANKRD29 -1,71 -0,61 0,02
ESPL1 -1,71 -1,58 0,02
NEK2 -1,70 -2,25 0,02
FAM171B -1,69 0,68 0,01
MND1 -1,69 -3,42 0,00
OSTalpha -1,69 -0,84 0,03
GPRC5A -1,69 3,39 0,03
GFI1 -1,68 -1,93 0,02
IL1RN -1,67 -1,17 0,03
LINGO3 -1,67 -4,49 0,04
TNFSF8 -1,66 -2,19 0,00
JAG1 -1,66 3,04 0,00
APOC1 -1,66 0,62 0,01
CD22 -1,66 -2,63 0,01
GALNT13 -1,66 -1,80 0,04
SUSD2 -1,65 -0,69 0,00
CXCL11 -1,65 0,05 0,02
KIF18B -1,65 -2,16 0,02
POLQ -1,64 -2,18 0,01
PLA2G16 -1,63 0,63 0,01
GPR171 -1,62 -2,26 0,01
GABRP -1,62 0,06 0,04
FOLH1 -1,61 4,67 0,00
MSR1 -1,61 0,38 0,00
BIRC5 -1,61 -1,20 0,01
MKI67 -1,61 2,64 0,00
ADAMTS3 -1,60 1,62 0,00
PTTG1 -1,60 -1,30 0,01
CD163 -1,60 -0,91 0,00
PHKG1 -1,58 -4,16 0,03
MUC1 -1,58 -0,08 0,01
NPY -1,58 7,45 0,02
HAVCR2 -1,57 -1,90 0,01
AURKB -1,57 -3,00 0,01
KCNJ12 -1,56 -2,67 0,03
LPPR4 -1,56 -2,17 0,01
Proefschrift#8_DEF.indd 136 25-08-15 16:42

137
Chap
ter 5
CYP4Z2P -1,55 -4,33 0,03
HMMR -1,54 -0,05 0,00
VSIG4 -1,54 -1,78 0,00
TPX2 -1,53 0,57 0,00
EGR1 -1,53 6,27 0,00
DIAPH3 -1,53 -0,98 0,04
UFSP1 -1,53 -3,26 0,01
AGT -1,52 -2,08 0,04
ITM2A -1,52 -0,01 0,03
GTSE1 -1,52 -2,01 0,05
MCTP1 -1,51 -0,47 0,01
HEY2 -1,51 -0,40 0,01
PRR7 -1,51 -2,81 0,04
CN5H6.4 -1,50 -5,13 0,04
WNT5A -1,49 2,32 0,02
DPH3P1 -1,48 -4,35 0,05
DPF1 -1,48 -4,29 0,03
EXO1 -1,47 -2,38 0,01
PTPRT -1,47 2,06 0,00
STON2 -1,47 1,74 0,00
SIGLEC9 -1,46 -3,47 0,03
REEP1 -1,45 -0,80 0,01
PEAR1 -1,45 -1,81 0,01
ITGBL1 -1,45 -0,98 0,01
CDC45 -1,45 -2,89 0,01
MELK -1,44 -0,97 0,01
NCAPG -1,44 -1,04 0,03
CDK5R1 -1,44 -0,65 0,04
FKBP10 -1,43 1,18 0,03
P2RX5-TAX1BP3 -1,43 -3,43 0,04
RSPH4A -1,43 -1,30 0,01
KIF20A -1,43 -0,51 0,02
TOP2A -1,42 1,90 0,00
PPP2R2C -1,42 0,59 0,00
ZNF296 -1,42 -3,07 0,04
PTK6 -1,41 -2,78 0,02
DPY19L2 -1,41 0,32 0,02
WDR66 -1,41 -1,65 0,01
Chapter 5: Gene-expression analysis of Gleason grade 3 tumor glands embedded in low- and high-risk prostate cancer
Proefschrift#8_DEF.indd 137 25-08-15 16:42

138 Discovery and Validation of Prognostic Tissue Markers in Clinical Prostate Cancer – © 2015, A.M. Hoogland
Chap
ter 5
CERS1 -1,41 -2,45 0,02
A1BG-AS1 -1,41 -4,50 0,03
SPAG5 -1,40 -0,79 0,00
FLJ35946 -1,39 0,74 0,03
DTL -1,39 -0,91 0,01
RYR2 -1,39 2,38 0,01
UMODL1 -1,39 -4,19 0,03
BUB1 -1,38 -0,60 0,01
MS4A7 -1,37 -0,71 0,00
LMNB1 -1,37 0,00 0,00
CDCA3 -1,37 -1,94 0,01
UBE2C -1,36 -1,40 0,03
FLJ23867 -1,36 -0,38 0,03
DNASE2B -1,34 1,47 0,04
PLEK -1,33 -1,47 0,05
MAP2 -1,33 4,60 0,01
BICC1 -1,33 1,67 0,01
SLC22A31 -1,33 -3,85 0,04
CDKN2D -1,32 -1,38 0,02
F5 -1,32 3,82 0,03
SLC6A1 -1,32 -4,36 0,04
SEMA3G -1,32 -1,86 0,03
KIF23 -1,32 -0,71 0,01
MAP6D1 -1,32 0,08 0,04
PDE3A -1,31 1,97 0,00
AATK -1,31 -2,67 0,01
CDK1 -1,31 -1,69 0,02
GNB1L -1,30 -3,25 0,02
AURKA -1,30 -1,64 0,05
ZNF467 -1,30 -1,07 0,00
CCDC108 -1,29 -2,16 0,01
CIT -1,29 -0,35 0,01
SNCA -1,29 0,78 0,00
ZP1 -1,29 -1,08 0,02
MXD3 -1,29 -2,95 0,05
PITPNM1 -1,28 -0,48 0,00
LAG3 -1,28 -1,25 0,01
CENPF -1,28 1,58 0,01
Proefschrift#8_DEF.indd 138 25-08-15 16:42

139
Chap
ter 5
DISP2 -1,28 -1,58 0,02
IER5 -1,28 -1,94 0,03
VAX2 -1,28 -3,69 0,03
GPR179 -1,28 -3,11 0,02
ANO2 -1,26 -2,47 0,04
SLA -1,26 -0,98 0,00
FAM111B -1,26 -0,19 0,03
FAM55C -1,26 -0,04 0,00
MLF1IP -1,26 -0,04 0,00
AKAP12 -1,25 4,00 0,00
TERC -1,25 0,41 0,01
TMEFF2 -1,24 6,82 0,00
CXCL12 -1,24 2,07 0,00
EPPK1 -1,24 1,01 0,02
MTUS2 -1,24 0,16 0,00
SEC16B -1,23 -1,71 0,01
RTN1 -1,22 2,69 0,02
SLC10A5 -1,22 0,94 0,03
SPG20 -1,22 2,66 0,00
ASPM -1,22 0,21 0,01
DRAM1 -1,21 0,31 0,01
HSPA1B -1,20 2,95 0,01
KIF2C -1,20 -2,47 0,04
RGS2 -1,20 3,13 0,02
FAM110B -1,20 1,34 0,00
CASC5 -1,19 -0,19 0,02
ODC1 -1,19 6,68 0,01
RGS11 -1,19 0,09 0,00
GAS2L3 -1,18 -1,37 0,03
CYTH3 -1,18 2,17 0,01
EME1 -1,18 -2,86 0,02
FRY -1,18 1,21 0,00
RAB3IL1 -1,18 -1,82 0,01
PCSK1N -1,18 -0,37 0,01
PACSIN1 -1,17 -1,56 0,00
SKA3 -1,16 -1,05 0,03
PLCE1 -1,15 0,42 0,01
MDK -1,14 2,95 0,00
Chapter 5: Gene-expression analysis of Gleason grade 3 tumor glands embedded in low- and high-risk prostate cancer
Proefschrift#8_DEF.indd 139 25-08-15 16:42

140 Discovery and Validation of Prognostic Tissue Markers in Clinical Prostate Cancer – © 2015, A.M. Hoogland
Chap
ter 5
RELN -1,14 2,35 0,01
GMNN -1,12 -0,37 0,02
MAPK8IP2 -1,12 -0,36 0,04
TACC3 -1,12 -0,92 0,03
CSF2RA -1,11 -3,07 0,04
SKA1 -1,11 -1,59 0,02
CD68 -1,11 0,99 0,02
RASSF2 -1,10 0,57 0,02
CDR2 -1,10 2,77 0,04
GGH -1,10 -1,00 0,04
BAMBI -1,10 0,75 0,00
BARX2 -1,10 0,04 0,01
PLD1 -1,10 -0,37 0,01
IRF5 -1,10 -1,87 0,01
ADM -1,09 0,29 0,04
SP6 -1,09 -2,97 0,03
TMEM204 -1,09 -0,59 0,02
TK1 -1,09 -0,09 0,01
ARSG -1,08 -0,32 0,03
IFI30 -1,08 1,92 0,02
SLCO2B1 -1,08 0,01 0,00
SASH3 -1,08 -1,69 0,05
MMP11 -1,07 -2,46 0,01
E2F1 -1,07 -1,78 0,03
APOD -1,06 5,60 0,05
WDR62 -1,06 -2,21 0,04
CPNE7 -1,05 -1,02 0,04
KIAA1683 -1,05 0,40 0,02
CMKLR1 -1,05 -0,88 0,04
ANKRD19P -1,05 -2,40 0,04
PHLDA2 -1,04 -0,53 0,02
HELLS -1,04 -0,47 0,01
GAL3ST4 -1,04 -0,84 0,02
FSD1L -1,03 -0,07 0,01
CDON -1,03 2,00 0,00
ARL9 -1,03 -2,83 0,04
BCMO1 -1,03 -2,55 0,04
CD86 -1,03 -2,60 0,02
Proefschrift#8_DEF.indd 140 25-08-15 16:42

141
Chap
ter 5
FCGR2A -1,02 0,34 0,00
CDKL3 -1,02 -2,41 0,05
CENPE -1,02 -0,19 0,03
PRR11 -1,02 -0,67 0,02
MAPK4 -1,02 1,83 0,02
MAD2L1 -1,02 -1,79 0,02
RHBDL1 -1,02 -3,51 0,04
RANBP3L -1,01 2,40 0,00
LPGAT1 -1,01 3,68 0,00
ERRFI1 -1,01 3,84 0,01
FBP2 -1,01 -1,66 0,05
SLC4A3 -1,01 -0,51 0,01
FGFRL1 -1,01 3,90 0,00
CDCA5 -1,01 -1,26 0,00
CRNDE -1,00 -0,14 0,03
Chapter 5: Gene-expression analysis of Gleason grade 3 tumor glands embedded in low- and high-risk prostate cancer
Proefschrift#8_DEF.indd 141 25-08-15 16:42

142 Discovery and Validation of Prognostic Tissue Markers in Clinical Prostate Cancer – © 2015, A.M. Hoogland
Chap
ter 5
Supplementary table 2. List of genes over-expressed in Gleason grade 3 tumor glands being part of a Gleason score 3+3=6 as compared to Gleason score 4+3=7
logFC logCPM PValue
SST 8,51 -3,54 0,00
VIP 8,28 -3,76 0,00
SEMG1 7,92 -4,10 0,00
INSL5 7,59 -2,74 0,00
KIF25 7,53 -4,43 0,00
OR2T10 7,04 -4,93 0,01
ARSF 6,65 -5,21 0,01
SLC6A2 6,60 -5,20 0,01
FLJ46361 6,48 -4,99 0,00
PLA2G3 6,48 -5,46 0,01
MYH6 6,13 -4,98 0,01
GFI1B 6,05 -5,19 0,01
S100A5 5,96 -5,47 0,01
KLHL4 5,87 -5,90 0,01
SPZ1 5,87 -5,99 0,03
G6PC2 5,77 -5,49 0,00
KRT81 5,77 -5,79 0,01
GRM8 5,77 -5,79 0,01
WFIKKN2 5,77 -5,80 0,01
NHLRC4 5,77 -6,09 0,03
CARTPT 5,72 -3,29 0,00
FOXI1 5,67 -5,69 0,02
BCORP1 5,66 -3,87 0,00
OR1B1 5,56 -5,86 0,02
TWIST2 5,56 -6,10 0,02
HSD52 5,56 -5,96 0,03
CCDC164 5,56 -6,21 0,03
OR5P2 5,56 -6,22 0,04
PLA2G2F 5,43 -6,35 0,04
SLC25A31 5,43 -6,17 0,05
ORM1 5,43 3,05 0,00
NPY2R 5,39 -2,67 0,00
PGCP1 5,30 -6,02 0,02
Proefschrift#8_DEF.indd 142 25-08-15 16:42

143
Chap
ter 5
CSDAP1 5,30 -6,06 0,03
BTNL2 5,30 -6,42 0,04
KCNB2 5,30 -6,47 0,04
OR2T8 5,15 -6,53 0,05
AGPAT4-IT1 5,15 -6,33 0,05
KCNK7 4,99 -6,63 0,05
COL9A1 4,93 0,42 0,00
HCG4 4,83 -4,17 0,00
TMCC2 4,80 -6,53 0,04
OR52E2 4,80 -6,40 0,05
OR7D2 4,75 -4,08 0,00
FRMPD4 4,69 -0,56 0,00
SLC35D3 4,62 -4,17 0,00
PAH 4,56 0,99 0,01
GPR116 4,51 2,59 0,00
STAC2 4,48 -4,24 0,01
MYL1 4,42 -3,64 0,03
FOLR1 4,39 -4,82 0,00
MPZ 4,39 -4,93 0,00
GABRG2 4,37 -4,32 0,02
NTF4 4,34 -5,14 0,02
VAT1L 4,34 -5,19 0,03
HCG23 4,23 -4,92 0,00
KCNK2 4,23 -5,13 0,01
DACH2 4,22 -1,31 0,00
PCDH17 4,21 3,28 0,00
GPR62 4,17 -5,26 0,02
GABRQ 4,17 -5,08 0,04
CPNE6 4,10 -4,09 0,00
UCN3 4,07 -3,91 0,01
IQSEC3 4,04 -5,12 0,01
KPNA7 3,98 -5,29 0,01
KCNH4 3,98 -5,48 0,04
CXorf57 3,93 -4,45 0,00
LINC00158 3,92 -1,47 0,00
SEMA5B 3,86 -1,62 0,00
NLRP14 3,84 -5,40 0,01
SLC2A5 3,80 -0,09 0,00
Chapter 5: Gene-expression analysis of Gleason grade 3 tumor glands embedded in low- and high-risk prostate cancer
Proefschrift#8_DEF.indd 143 25-08-15 16:42

144 Discovery and Validation of Prognostic Tissue Markers in Clinical Prostate Cancer – © 2015, A.M. Hoogland
Chap
ter 5
PTCHD3 3,76 -4,58 0,04
UPK1A 3,73 -1,10 0,01
HGF 3,73 0,47 0,00
FCRL3 3,71 -4,12 0,01
CYP27A1 3,70 1,85 0,00
HECW1 3,61 -0,01 0,00
DPYS 3,57 -1,13 0,00
ASCL2 3,54 -5,00 0,02
PAX8 3,53 -2,43 0,00
COL2A1 3,53 3,19 0,00
SLC7A10 3,50 -5,19 0,03
TAF7L 3,50 -5,69 0,04
KANK4 3,49 -3,30 0,00
KRT222 3,48 -4,74 0,03
PRDM8 3,48 0,68 0,00
KCNE3 3,46 -1,36 0,00
DEFB1 3,44 -4,21 0,00
KCNS1 3,38 -2,87 0,01
CD33 3,36 -4,40 0,00
CD177 3,36 3,31 0,00
CCK 3,35 -0,77 0,02
DRD1 3,33 -2,95 0,01
AP1B1P1 3,32 -2,83 0,00
PROK1 3,32 -1,57 0,00
OVCH2 3,28 -3,96 0,04
ORM2 3,27 1,12 0,01
TPTE2P1 3,26 -4,00 0,01
CIDEC 3,25 -4,78 0,01
FBXO17 3,25 -1,65 0,00
HOXD9 3,24 -3,40 0,00
TMEM132D 3,14 -1,61 0,01
CXCL5 3,13 -3,20 0,02
NRG2 3,13 -4,48 0,02
NAALADL1 3,10 -3,87 0,00
HOXD10 3,07 -3,52 0,02
OR2W5 3,06 -5,68 0,05
ZNF664-FAM101A 3,06 -5,09 0,02
TDRD12 2,98 -5,54 0,05
Proefschrift#8_DEF.indd 144 25-08-15 16:42

145
Chap
ter 5
COL19A1 2,93 -6,08 0,05
CCDC8 2,92 -3,31 0,04
RNF112 2,92 -3,52 0,00
SLC38A3 2,91 -5,26 0,04
SOX2 2,90 -1,45 0,00
LRRN4 2,88 -2,71 0,00
SFTPA2 2,87 5,06 0,00
SLC22A1 2,85 -3,36 0,00
BCAT1 2,84 -0,19 0,00
GPX7 2,84 -1,05 0,00
NRG1 2,82 -1,73 0,00
CHODL 2,82 -3,66 0,00
ZNF503-AS1 2,82 -2,25 0,00
CYP3A43 2,78 -3,75 0,04
ZNF804A 2,78 -4,36 0,01
JPH2 2,78 -2,54 0,00
PMP2 2,76 -2,29 0,00
PCYT1B 2,76 -3,87 0,02
FAM106A 2,72 -4,57 0,02
EFHD1 2,72 -0,34 0,01
NEFH 2,71 5,48 0,01
THEG5 2,71 -1,70 0,00
SLC16A5 2,66 -0,87 0,00
FLRT3 2,66 1,18 0,00
MBOAT4 2,65 -5,51 0,05
OR2C3 2,64 0,60 0,00
PIK3C2G 2,59 -3,20 0,02
OR1L8 2,59 -4,32 0,00
ATCAY 2,57 -4,37 0,04
COL17A1 2,56 0,18 0,00
SLC12A3 2,53 -3,94 0,01
APOB 2,53 -4,49 0,03
FABP4 2,53 -3,46 0,01
FAM83B 2,52 -1,07 0,00
VSNL1 2,52 -1,89 0,02
P2RX2 2,51 -3,68 0,00
GAP43 2,51 -4,59 0,01
PTPRN 2,51 -4,37 0,04
Chapter 5: Gene-expression analysis of Gleason grade 3 tumor glands embedded in low- and high-risk prostate cancer
Proefschrift#8_DEF.indd 145 25-08-15 16:42

146 Discovery and Validation of Prognostic Tissue Markers in Clinical Prostate Cancer – © 2015, A.M. Hoogland
Chap
ter 5
KCNQ5 2,51 -1,84 0,01
LINC00202 2,50 -3,24 0,02
DMKN 2,49 -2,23 0,00
SULT1C2P1 2,47 -1,20 0,01
CD28 2,46 -0,05 0,00
RND2 2,46 -3,32 0,00
NUDT9P1 2,45 -5,15 0,02
HOXD11 2,44 -1,75 0,04
BPIFB2 2,40 1,72 0,00
SGCA 2,39 -4,21 0,01
ACTC1 2,39 -2,66 0,02
HIF3A 2,38 -2,26 0,02
ZNF208 2,38 -2,89 0,00
TRIM9 2,37 -5,20 0,02
CTF1 2,35 -2,20 0,01
DKK3 2,34 1,53 0,00
SYTL5 2,33 -1,30 0,00
AJAP1 2,32 -4,21 0,01
BMPER 2,30 -3,16 0,01
CRIP3 2,29 -5,36 0,05
VSIG2 2,27 1,91 0,02
DIRAS3 2,25 -3,16 0,03
LURAP1 2,24 -4,17 0,03
LINC00327 2,23 -1,84 0,00
USP44 2,22 -3,19 0,01
KRT5 2,22 1,44 0,03
ACSS3 2,20 -0,34 0,00
MCF2 2,20 -5,00 0,04
SLC22A3 2,18 4,43 0,00
KCNMB1 2,18 -0,12 0,00
KRT17 2,18 -0,09 0,04
TLR4 2,17 2,47 0,00
CYS1 2,17 -3,08 0,05
IL3RA 2,17 -3,96 0,02
CPLX3 2,16 1,98 0,02
ADH4 2,16 -3,15 0,00
CYP2C8 2,16 -4,33 0,03
SLC5A8 2,16 -2,59 0,01
Proefschrift#8_DEF.indd 146 25-08-15 16:42

147
Chap
ter 5
CCR6 2,16 -4,33 0,03
LRP2 2,15 -2,54 0,03
RBFOX3 2,15 -2,07 0,01
SRD5A2 2,14 -0,85 0,00
PCDH7 2,14 1,02 0,00
ANKRD20A8P 2,13 -3,36 0,02
DLK2 2,12 -1,79 0,02
ABCC9 2,10 1,21 0,01
TAS2R10 2,09 -4,79 0,02
POF1B 2,09 0,34 0,02
CDH6 2,09 -1,80 0,05
RNF157 2,09 2,61 0,00
ANO5 2,08 -1,17 0,01
ZNF215 2,08 -1,72 0,05
SNCAIP 2,08 -2,37 0,02
PAK3 2,07 -1,79 0,02
ZNF90 2,07 -2,70 0,03
OR2L13 2,07 -4,07 0,02
GPX3 2,07 3,03 0,00
ATP1A2 2,06 -1,27 0,00
ADRA1A 2,06 -2,85 0,02
ZNF781 2,05 -3,87 0,02
SLC14A1 2,05 2,37 0,02
RDH16 2,05 -0,04 0,04
TP63 2,05 1,02 0,05
SOX30 2,04 -3,48 0,02
KIAA1210 2,03 0,53 0,01
CYP26B1 2,02 -2,65 0,02
NTRK3 2,02 -1,57 0,00
ACOT11 2,00 -2,82 0,02
AXDND1 2,00 -3,04 0,00
PDPN 1,97 -1,50 0,00
PPP4R1L 1,96 -2,35 0,02
NKD2 1,95 -4,39 0,02
CCDC81 1,95 -3,07 0,01
CELF4 1,94 -2,66 0,01
ZNF257 1,94 -2,18 0,03
BMP7 1,93 0,09 0,03
Chapter 5: Gene-expression analysis of Gleason grade 3 tumor glands embedded in low- and high-risk prostate cancer
Proefschrift#8_DEF.indd 147 25-08-15 16:42

148 Discovery and Validation of Prognostic Tissue Markers in Clinical Prostate Cancer – © 2015, A.M. Hoogland
Chap
ter 5
FAM3D 1,92 0,02 0,00
CNGA4 1,90 -4,41 0,05
NDNF 1,89 0,55 0,01
SIX2 1,88 -3,62 0,03
ATP6V0D2 1,88 -3,32 0,03
SMOC1 1,88 -2,04 0,03
LAMP5 1,87 -0,47 0,04
MPP2 1,86 -3,30 0,04
ACTG2 1,85 4,76 0,00
MACROD2-AS1 1,84 -3,31 0,02
WISP2 1,84 -4,52 0,01
ZNF711 1,83 -0,81 0,01
BCL2L15 1,83 -1,85 0,04
HSPB8 1,82 -0,30 0,01
RNF165 1,82 -1,85 0,04
CHRDL1 1,82 1,27 0,00
PTN 1,81 4,46 0,00
ASB5 1,81 -0,09 0,01
DNM1 1,80 -2,78 0,05
ZNF454 1,80 -1,21 0,01
CDH3 1,80 1,34 0,00
SLITRK5 1,77 -1,26 0,01
VIT 1,77 -3,57 0,03
GTF2IRD2B 1,77 -4,10 0,01
SOCS1 1,76 -1,17 0,05
DCHS1 1,75 2,85 0,00
ZNF300P1 1,75 -1,49 0,03
CDCA7 1,73 -0,39 0,00
LAYN 1,72 -2,41 0,04
SRPX 1,71 -1,71 0,01
SULT4A1 1,71 -4,84 0,03
PGM5 1,71 1,02 0,00
WFDC1 1,70 -1,71 0,04
MYL9 1,70 3,16 0,00
LSAMP 1,69 2,80 0,04
ISL1 1,69 -1,73 0,01
ADAMTS5 1,69 -2,29 0,02
SLC5A4 1,68 0,73 0,00
Proefschrift#8_DEF.indd 148 25-08-15 16:42

149
Chap
ter 5
TMEM35 1,68 -3,03 0,03
MET 1,68 0,50 0,02
HCAR1 1,67 1,20 0,00
MYOCD 1,65 -0,02 0,01
LGI4 1,65 -3,23 0,02
RIN3 1,65 -0,40 0,02
GRIK5 1,64 -2,86 0,02
PKD2L2 1,64 -3,61 0,01
TBX5 1,64 -2,71 0,05
PDZRN4 1,63 -1,60 0,01
RFPL2 1,63 0,71 0,00
RAPGEF4 1,62 2,65 0,00
PCP4 1,61 0,82 0,01
HCAR3 1,60 -4,32 0,03
SERPINF1 1,60 0,73 0,00
PHYHIPL 1,60 -1,34 0,02
P2RX1 1,59 -3,26 0,05
SPEG 1,58 -2,18 0,03
NRK 1,58 -1,74 0,01
IL5RA 1,58 0,77 0,00
FAM86B1 1,57 -2,56 0,02
PTGIS 1,57 -0,10 0,00
IGFBP6 1,56 -0,74 0,00
SERTAD4 1,56 -1,53 0,03
SLC16A7 1,56 -2,84 0,02
ST6GALNAC4 1,56 -3,54 0,04
IL33 1,56 -0,89 0,03
KCNU1 1,55 -3,20 0,02
FERMT1 1,55 2,19 0,00
MAGI2-AS3 1,54 -1,34 0,04
TGFB1I1 1,53 -0,37 0,03
GCG 1,53 -1,42 0,03
PLCL2 1,53 -2,85 0,05
PLIN2 1,53 1,96 0,00
KLRG1 1,53 -2,37 0,04
PZP 1,53 -2,66 0,02
CYP3A5 1,53 1,06 0,03
WIF1 1,52 -3,16 0,02
Chapter 5: Gene-expression analysis of Gleason grade 3 tumor glands embedded in low- and high-risk prostate cancer
Proefschrift#8_DEF.indd 149 25-08-15 16:42

150 Discovery and Validation of Prognostic Tissue Markers in Clinical Prostate Cancer – © 2015, A.M. Hoogland
Chap
ter 5
ABCA6 1,52 -1,06 0,00
ACTA2 1,52 4,38 0,00
ID4 1,52 -0,40 0,01
GALNT14 1,51 -3,17 0,04
FAM133B 1,51 -3,66 0,03
ADH6 1,50 -1,83 0,00
FUT9 1,48 -1,57 0,02
NINL 1,48 0,33 0,01
CNN1 1,48 1,75 0,01
PHACTR1 1,48 -2,21 0,01
MAGI2 1,48 1,31 0,01
RAB9B 1,48 -1,85 0,01
FGF7 1,48 -1,02 0,03
EFEMP1 1,47 0,66 0,00
FLNA 1,47 3,94 0,00
FAT3 1,47 0,32 0,01
SYT6 1,46 -0,04 0,00
FMO4 1,46 -0,65 0,03
MYOF 1,45 3,40 0,01
FLG2 1,45 -3,48 0,02
UCHL1 1,45 -1,17 0,04
BOC 1,45 1,33 0,01
ZNF843 1,44 -3,92 0,03
MAML2 1,44 2,98 0,01
ACSM3 1,44 3,04 0,00
PTGDS 1,43 1,54 0,00
KLHL10 1,43 -4,72 0,05
FREM2 1,42 -0,21 0,01
SP140L 1,42 -0,74 0,04
FAIM2 1,42 -1,55 0,01
COL25A1 1,41 0,62 0,00
CCL2 1,41 1,91 0,03
TPM2 1,40 3,31 0,00
TSC22D1-AS1 1,40 -3,07 0,03
LDB3 1,39 -0,79 0,03
NOV 1,39 2,47 0,00
MYH11 1,39 5,90 0,00
IGFBP5 1,38 4,34 0,03
Proefschrift#8_DEF.indd 150 25-08-15 16:42

151
Chap
ter 5
CYP1B1 1,38 5,20 0,00
ADPRHL1 1,37 0,55 0,03
FLNC 1,37 1,24 0,00
SEMA7A 1,36 -3,38 0,04
NT5E 1,36 -1,23 0,02
PRH2 1,36 -1,76 0,01
PRKY 1,34 0,36 0,00
ZNF185 1,34 1,28 0,00
MYOM1 1,34 -1,61 0,01
POU5F2 1,33 -3,20 0,03
ZNF774 1,33 -1,03 0,01
SCNN1A 1,33 3,05 0,01
FLJ10661 1,32 -3,61 0,05
NCKAP5 1,31 2,26 0,00
NUDT18 1,30 -2,31 0,03
MSRB3 1,29 0,97 0,01
TAGLN 1,29 3,19 0,00
LEPREL2 1,29 -1,66 0,01
PTRF 1,29 2,53 0,04
CNN3 1,29 4,08 0,00
NRCAM 1,29 2,16 0,02
ZNF469 1,29 -1,79 0,02
ESR2 1,28 -3,21 0,01
RPA4 1,28 -3,66 0,05
MRVI1 1,28 0,83 0,02
MARVELD1 1,27 0,15 0,01
NHS 1,27 -0,06 0,01
HOTTIP 1,27 1,28 0,02
ID2 1,27 2,12 0,03
CSPG4 1,27 -0,83 0,02
CDH26 1,26 2,58 0,00
PATE4 1,26 -1,73 0,01
LMOD1 1,26 1,89 0,02
MCAM 1,26 -1,19 0,04
ZNF578 1,26 -0,14 0,01
CCDC3 1,25 -1,14 0,04
ZNF655 1,24 3,07 0,00
RND3 1,24 0,50 0,04
Chapter 5: Gene-expression analysis of Gleason grade 3 tumor glands embedded in low- and high-risk prostate cancer
Proefschrift#8_DEF.indd 151 25-08-15 16:42
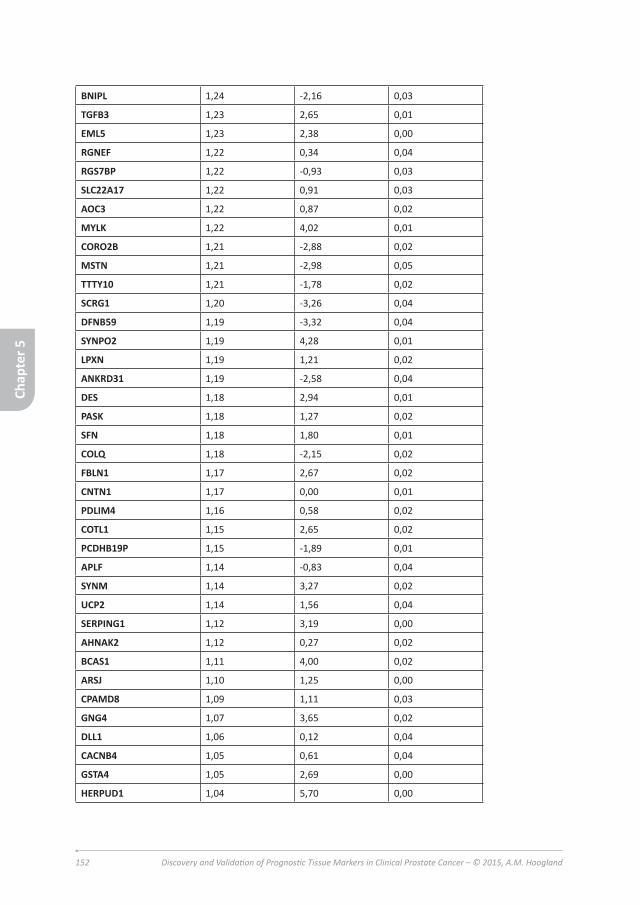
152 Discovery and Validation of Prognostic Tissue Markers in Clinical Prostate Cancer – © 2015, A.M. Hoogland
BNIPL 1,24 -2,16 0,03
TGFB3 1,23 2,65 0,01
EML5 1,23 2,38 0,00
RGNEF 1,22 0,34 0,04
RGS7BP 1,22 -0,93 0,03
SLC22A17 1,22 0,91 0,03
AOC3 1,22 0,87 0,02
MYLK 1,22 4,02 0,01
CORO2B 1,21 -2,88 0,02
MSTN 1,21 -2,98 0,05
TTTY10 1,21 -1,78 0,02
SCRG1 1,20 -3,26 0,04
DFNB59 1,19 -3,32 0,04
SYNPO2 1,19 4,28 0,01
LPXN 1,19 1,21 0,02
ANKRD31 1,19 -2,58 0,04
DES 1,18 2,94 0,01
PASK 1,18 1,27 0,02
SFN 1,18 1,80 0,01
COLQ 1,18 -2,15 0,02
FBLN1 1,17 2,67 0,02
CNTN1 1,17 0,00 0,01
PDLIM4 1,16 0,58 0,02
COTL1 1,15 2,65 0,02
PCDHB19P 1,15 -1,89 0,01
APLF 1,14 -0,83 0,04
SYNM 1,14 3,27 0,02
UCP2 1,14 1,56 0,04
SERPING1 1,12 3,19 0,00
AHNAK2 1,12 0,27 0,02
BCAS1 1,11 4,00 0,02
ARSJ 1,10 1,25 0,00
CPAMD8 1,09 1,11 0,03
GNG4 1,07 3,65 0,02
DLL1 1,06 0,12 0,04
CACNB4 1,05 0,61 0,04
GSTA4 1,05 2,69 0,00
HERPUD1 1,04 5,70 0,00
Chap
ter 5
Proefschrift#8_DEF.indd 152 25-08-15 16:42

153
LEF1 1,04 1,24 0,01
FAT4 1,04 0,43 0,04
NPAS2 1,03 3,97 0,00
CHL1 1,03 2,44 0,05
SPARCL1 1,03 3,94 0,02
TMEM200A 1,03 -0,74 0,01
TNS1 1,02 4,43 0,03
MXRA7 1,01 1,97 0,02
Chap
ter 5
Chapter 5: Gene-expression analysis of Gleason grade 3 tumor glands embedded in low- and high-risk prostate cancer
Proefschrift#8_DEF.indd 153 25-08-15 16:42

154 Discovery and Validation of Prognostic Tissue Markers in Clinical Prostate Cancer – © 2015, A.M. Hoogland
Proefschrift#8_DEF.indd 154 25-08-15 16:42

155
Chap
ter 6
Chapter 6
General discussion
Chapter 6: General discussion
Proefschrift#8_DEF.indd 155 25-08-15 16:42

156 Discovery and Validation of Prognostic Tissue Markers in Clinical Prostate Cancer – © 2015, A.M. Hoogland
Chap
ter 6
Background
For decades, prostate cancer is the leading cause of death in Western men (Siegel, Miller et al. 2015). Over the last 10 years, cancer incidence rates (adjusted for age), have declined (Edwards, Noone et al. 2014). In the United States, the number of cancer survivors continues to grow, due to early detection and better treatment (DeSantis, Lin et al. 2014). In 1991, the European Randomized Study of Screening for Prostate Cancer (ERSPC) started with randomizing men aged between 50-74 years, to a screening or no intervention (control) group. After a mean period of 13 years of follow-up, the ERSPC could confirm a 27% rate ratio reduction in prostate cancer mortality, due to PSA measurements in the screening-group compared to the control group (Schroder, Hugosson et al. 2014). In spite of these promising results, population based screening is not yet in place. A significant disadvantage of screening is the considerable risk of diagnosing indolent prostate cancers that would never have led to symptoms and associated overtreatment of men.
In the Netherlands, cancer clinical practice guidelines are set up by the “Integraal Kankercentrum Nederland” (IKNL) and available at www.oncoline.nl. In summary, for prostate cancer the primary diagnostic tools advised are serum Prostate Specific Antigen (PSA), and urine PCA3 in case clinical suspicion is still present after one or two rounds of negative biopsies. With an elevated serum-PSA (>10ng/mL), chances of having prostate cancer are relatively high (Armbruster 1993; Freedland, Sutter et al. 2003; Bjartell 2007). For example, with a low serum PSA (<2ng/mL), the chance of detecting adenocarcinoma in the prostate biopsy is 7.1%, whereas a serum PSA of >10ng/mL gives a chance of 56.6% of finding adenocarcinoma in the prostate biopsy (Draisma, Boer et al. 2003; de Vries, Postma et al. 2007; Postma, Schroder et al. 2007; Roemeling, Roobol et al. 2007). Urine PCA3 can be used to predict the outcome of subsequent prostate needle biopsies, however the ideal cut-off value needs to be distinguished (Salagierski, Sosnowski et al. 2012; Schroder, Venderbos et al. 2014).
Based on pathologic biopsy Gleason score and serum PSA, patients are divided into low-, intermediate- and high-risk groups (table 1) (Borden, Wright et al. 2007; Divrik, Eroglu et al. 2007; Billis, Guimaraes et al. 2008; Greene, Albertsen et al. 2009; Cheng, Montironi et al. 2012; van Vugt, Kranse et al. 2012). Detailed histopathological characterization of prostate cancer on diagnostic biopsies is predictive for its clinical behavior and supports therapeutic decision-making. In daily practice, the pathology report of prostate cancer includes the grade of differentiation according to the modified Gleason grading system (Epstein 2010), the number of biopsies
Proefschrift#8_DEF.indd 156 25-08-15 16:42

157
Chap
ter 6
infiltrated by prostate cancer and a quantitative assessment of the tumor volume per biopsy in either length in mm or percentage of tumor (Epstein, Allsbrook et al. 2005; Van der Kwast, Bubendorf et al. 2013). For patients with localized cancer, in the low-risk group active surveillance is a serious option, otherwise three curative interventions are currently used in the Netherlands: radical prostatectomy, external beam radiation therapy or brachytherapy. Survival statistics for these three treatment options are roughly the same (Alicikus, Yamada et al. 2011; Ahmed, Cathcart et al. 2012). The patient has a strong voice in his therapy (Hall, Boyd et al. 2003). While surveillance is an acceptable option for patients with low-risk prostate cancer and therapeutic interference is mandatory for high-risk tumors, the optimal clinical approach to intermediate-risk prostate cancer patients is not established yet (Hegarty, Beirne et al. 2010).
Clinical relevance of tissue markersThe urge for novel prognostic histopathological and molecular markers is prompted for several reasons. While less than half of prostate cancer patients has a potentially life-threatening cancer (Gleason score ≥7), more than half of the low-risk patients still undergoes radical prostatectomy (Cooperberg, Broering et al. 2010). Active surveillance has become a widely used alternative for invasive treatment after diagnosis. However, up to one-third of the patients on active surveillance undergoes therapeutic intervention after a median follow-up of 1.2-3.5 years (van As, Norman et al. 2008; van den Bergh, Roemeling et al. 2009; Soloway, Soloway et al. 2010; Cooperberg, Carroll et al. 2011; Tosoian, Trock et al. 2011). Better stratification of prostate cancer patients with respect to clinical decision-making is necessary, especially in the large group of low- to intermediate-risk prostate cancers (Hoogland, Kweldam et al. 2014).
Another reason to validate and actually implement new markers is the considerable inter-observer variability in Gleason grading among pathologists (Wakely, Baxendine-Jones et al. 1998; Pelzer and Horninger 2008; Fajardo, Miyamoto et al. 2011). This inter-observer variability is particularly of significance in the large group of low- to intermediate-risk cancers, as it can influence therapeutic approaches (van den Bergh, Roemeling et al. 2009; McKenney, Simko et al. 2011; Egevad, Ahmad et al. 2013). The modified Gleason grading in needle-biopsies demands adding the most common and highest Gleason grade to the final Gleason score, regardless of the amount of ‘highest’ Gleason grade. In practice, when only a few atypical glands considered Gleason grade 4 are present together with a large volume of Gleason grade 3, the Gleason score is 7. Once the total Gleason score is 7 or higher, patients are excluded from active surveillance in our institute (Hoogland, Kweldam et al.
Chapter 6: General discussion
Proefschrift#8_DEF.indd 157 25-08-15 16:42

158 Discovery and Validation of Prognostic Tissue Markers in Clinical Prostate Cancer – © 2015, A.M. Hoogland
Chap
ter 6
2014). As considerable inter-observer variability exists between the Gleason grade 3 and 4 (especially when only small amounts of this grade are present in the biopsy tissue), important treatment decisions depend too much on subjective pathologist’s opinions. Thus, improvement of the reproducibility of Gleason grading by more objective parameters is needed. In particular, molecular markers reflecting tumor biology could act as novel threshold in active surveillance or curative treatment.
Finally, heterogeneity of prostate cancer might lead to under- or, over-estimation of prostate cancer aggressive potential on diagnostic needle-biopsies. Diagnostic biopsies represent <1% of the entire prostate volume so that sampling artifact might lead to under- or less frequently over-grading of the real prostate cancer Gleason score. Fine and Epstein demonstrated that 223/1117 (20%) patients with Gleason score 6 at needle-biopsy were up-graded to Gleason score 7 (18.7%) or 8-10 (1.3%) at radical prostatectomy (Fine and Epstein 2008). Helpap and Egevad found concordance between Gleason score 6 prostate cancers at biopsies and radical prostatectomy specimens in only 28% (Helpap and Egevad 2006). Besides sampling artifact, moderate inter-observer agreement exists for Gleason grading at biopsies (Rodriguez-Urrego, Cronin et al. 2011; Thomsen, Marcussen et al. 2015). Marker identification in biopsy tissue samples, urine or serum could indicate whether unsampled high-grade areas are present within the prostate. On the other hand, recent improvement in MRI-guided biopsies could partially overcome biopsy sampling errors.
Image-guided prostate biopsiesAn upcoming technique to overcome biopsy sampling errors is the use of image-guided targeted prostate biopsy (Brown, Elbuluk et al. 2015). Brown et al. state that the problem of both overdiagnosis of low-grade tumors and underdiagnosis of high-grade tumors can be solved using image-guided targeted biopsies. Several approaches have been explored by different groups (Schoots, Roobol et al. 2014; Brown, Elbuluk et al. 2015; Schoots, Petrides et al. 2015), including in-bore MRI-guided, cognitive fusion and MRI / transrectal ultrasound fusion-guided biopsy. Currently the golden standard is transrectal ultrasound, to visualize the prostate and the potential area to take the biopsies. However the low contrast between normal prostate tissue and cancer area reduces the ability to identify the correct areas to take the biopsies from, resulting in less accurate biopsies. In-bore MRI guided biopsies are taken under direct MRI imaging, which has very promising results although is difficult to perform, with the patient actually inside the MRI during the biopsy procedure, and is a very expensive technique. Cognitive fusion is based on estimations of the operator, to take biopsies using ultrasound
Proefschrift#8_DEF.indd 158 25-08-15 16:42

159
Chap
ter 6
guidance after observing MRI images from the tumor. This technique suffers from strong operator-dependence, limiting universal application (Schoots, Roobol et al. 2014; Schoots, Petrides et al. 2015). When MRI images are fused with ultrasound, it is possible to take biopsies using ultrasound, however with MRI guidance with better contrast between benign and malignant prostate tissue. Many different studies have shown improvement in biopsy outcome, using MRI / ultrasound fused technique. In conclusion, in-bore MRI guided biopsies might give the best and most representative biopsy results, is not an easy to perform and an expansive technique. However combining MRI images with ultrasound also gives more representative biopsy results, with less under- or overstaging of the tumor and can result in needing less biopsy cores to give a better diagnosis (Brown, Elbuluk et al. 2015). Schoots et al. performed a meta-analysis and systematic review to compare prostate needle biopsies guided with ultrasound and with MRI (Schoots, Roobol et al. 2014). They concluded that MRI guided biopsies and ultrasound guided biopsies did not differ in the overall detection of prostate cancer (sensitivity 0.85 for MRI guided biopsies versus 0.81 for ultrasound guided biopsies). MRI guided biopsies, however, had a higher rate of detecting a significant tumor (sensitivity 0.91 for MRI guided biopsies versus 0.76 for ultrasound guided biopsies) and a lower detection rate for insignificant tumors as compared to ultrasound guided biopsies (sensitivity 0.44 for MRI guided biopsies versus 0.83 for ultrasound guided biopsies). Schoots et al. pointed at the heterogeneity they found in the results between different studies. This heterogeneity might be due to different patient selections, MRI techniques used and/or radiologists’ experience.
Discovery and validation of tissue markersThe objective of this thesis was to investigate and validate the additive value of tissue biomarkers in prognostic stratification of prostate cancer patients. This aim was formulated in the scope of the Prostate Cancer Molecular Medicine project (http://www.pcmmproject.org/). In general, tissue biomarker studies are according to the following sequence: 1) discovery of potentially predictive biomarker in clinical prostate cancer samples, 2) validation of predictive value in an independent radical prostatectomy cohort, 3) retrospective analysis of the biomarker in diagnostic biopsies with clinical follow-up, and 4) prospective analysis in diagnostic biopsies prior to treatment. The time-frame from discovery to retrospective validation mostly encompasses several years, while most potential markers have never been tested in a biopsy cohort at all. In this thesis, we aimed at identification of novel biomarkers, independent validation of potential on a radical prostatectomy cohort and investigation of a limited set of markers in diagnostic needle-biopsies.
Chapter 6: General discussion
Proefschrift#8_DEF.indd 159 25-08-15 16:42

160 Discovery and Validation of Prognostic Tissue Markers in Clinical Prostate Cancer – © 2015, A.M. Hoogland
Chap
ter 6
Discovery and validation on radical prostatectomy cohortsIn order to overcome sampling artifact and stratification of low Gleason score (<7), we set out to identify biomarkers that could identify patients with aggressive Gleason score 6 prostate cancer. For this purpose, we performed laser capture micro dissection (LCM) and RNA sequencing of Gleason grade 3 prostate cancer glands derived from pure Gleason score 6 patients as compared to Gleason grade 3 prostate cancer glands derived from Gleason score 7 (4+3) patients. After thorough bio-statistical analysis, we selected helicase lymphoid specific (HELLS) and zinc finger of the cerebellum (ZIC) proteins 2 and 5 for further validation on protein level in a radical prostatectomy cohort of 481 prostate cancer patients diagnosed in the scope of the ERSPC screening study. Immunohistochemical HELLS expression was significantly correlated with Gleason score ≥7 and was independently predictive for biochemical recurrence after operation in multivariate analysis. ZIC5 expression was significantly associated with Gleason score ≥7. Immunohistochemical expression of ZIC2 did not show an association with Gleason score, PSA level, pT-stage or biochemical recurrence.
In the same radical prostatectomy cohort, we also analyzed the predictive value of the immunohistochemical expression level of several other potentially promising proteins. The first description of a reliable antibody targeting ERG protein (Park, Tomlins et al. 2010), which is over-expressed resulting from TMPRSS2:ERG fusion in up to 70% of prostate cancer patients, prompted us to study its relation with clinic-pathologic parameters and follow-up in our cohort. The outcome of earlier studies on the prognostic value of TMPRSS2:ERG fusion was variable and contradictory due to the use of different detection methodology, patient populations and end-points. In our large number of screen-detected prostate cancer patients we found expression of ERG protein in 284 patients (65%); ERG expression did not correlate with any clinicopathologic parameter and was not associated with biochemical or local recurrence. Based on this study, ERG immunohistochemistry which is fast and easy-to-score does not have additive value for risk-stratification of prostate cancer patients (Hoogland, Jenster et al. 2012).
Since our long-term interest in prostate cancer stem cells, we also analyzed the expression of putative stem cell markers α2-integrin, α6-integrin, CD133, CD117, OCT3/4 and EZH2 in our ERSPC radical prostatectomy specimens (Hoogland, Verhoef et al. 2014). Our first goal was to determine to what extent putative stem cell markers originally investigated in cell line and rodent models, were expressed in clinical prostate cancer. In addition, we examined the relation of individual putative stem cell markers with clinicopathologic parameters. Low and scattered expression
Proefschrift#8_DEF.indd 160 25-08-15 16:42

161
Chap
ter 6
of α2-integrin in prostate cancer was in line with its putative role as stem cell marker. Sporadic expression of α2-integrin was present in a fraction of tumor cells (<5%) in 95% of tumors and associated with PSA>10ng/mL (p=0.04). α6-integrin expression (<5%) occurred in 28% patients, while ≥5% α6-integrin expression was associated with PSA≤10ng/mL (p=0.01), Gleason score <7(p<0.01) and pT2-disease (p=0.02). EZH2 expression was generally low with 3% of tumors showing ≥1% positive cells. EZH2 was associated with Gleason score ≥7 (p=0.01) and biochemical recurrence (p=0.01) as had also be found in other cohorts (Varambally, Dhanasekaran et al. 2002; Saramaki, Tammela et al. 2006; van Leenders, Dukers et al. 2007). While CD133, CD117 and OCT3/4 had been postulated to represent promising prostate cancer stem cell marker based on in vitro studies (Collins, Habib et al. 2001; Richardson, Robson et al. 2004; Leong, Wang et al. 2008; Ma, Liang et al. 2011), we were not able to identify any expression of these markers in clinical prostate cancer cells raising the question on its actual clinical relevance. In contrast, α6-integrin which is enriched in normal rodent prostate epithelial stem cells was expressed in a large subpopulation of prostate cancer cells. Furthermore, its expression was independently predictive for biochemical recurrence (p<0.01), local recurrence (p=0.03) and disease specific death (p=0.03). The widespread expression of α6-integrin and its association with less aggressive tumor features, however, indicated it as a marker for differentiated cells rather than immature stem cells.
Based on these studies, we identified HELLS, ZIC5 and α6-integrin as novel prognostic markers for prostate cancer. While expression of HELLS and ZIC5 correlate with aggressive tumor features, α6-integrin is a marker for non-aggressive disease.
Retrospective biopsy validationThe vast majority of prognostic prostate cancer tissue markers has been identified and validated on radical prostatectomy cohorts. While of interest, implementation of biomarker analysis in daily clinical practice is unlikely since definitive treatment had already been performed. In most cases, urologists will routinely examine PSA levels after operation and act on stable rise of PSA regardless of additional risk prediction of biomarkers. To add to clinical practice tissue markers should have predictive value on diagnostic prostate biopsies and refine therapeutic decision-making. The fact that only relative few markers have been tested on biopsy, is due to the lack of common availability of these tissues. In the second chapter of this thesis, we have validated two promising tissue markers CRISP-3 and β-MSP (Bjartell, Johansson et al. 2006; Bjartell, Al-Ahmadie et al. 2007) in a retrospective cohort of diagnostic biopsies (Hoogland, Dahlman et al. 2011). Expression of the markers in the biopsies was correlated with clinicopathological parameters (PSA;
Chapter 6: General discussion
Proefschrift#8_DEF.indd 161 25-08-15 16:42

162 Discovery and Validation of Prognostic Tissue Markers in Clinical Prostate Cancer – © 2015, A.M. Hoogland
Chap
ter 6
number of positive biopsies; Gleason score; pT-stage; surgical margins at radical prostatectomy) and significant prostate cancer at radical prostatectomy (pT-stage 3/4, or Gleason score >6, or tumor volume ≥0.5mL) in the total cohort (n=174) and in a subgroup with low-risk features at biopsy (PSA ≤10ng/ml, cT-stage ≤2, PSA density <0.20ng/mL/g, Gleason score <7 and ≤2 positive biopsy cores; n=87). We found both of them not to have prognostic value on prostate cancer behavior when used on biopsies. The discrepancy of predictive value in radical prostatectomy and diagnostic biopsies is probably caused by the fact that biopsies are moderately representative of the entire tumor due to tumor heterogeneity and multifocality, while biomarker research in radical prostatectomy generally includes samples of the most representative area. On the other hand, differences in tissue handling and fixation could influence antibody sensitivity and specificity. Finally, technological differences in immunohistochemical staining, quantification, cut-off levels and endpoints all affect multicenter comparison of study results.
Prospective biopsy validationThe highest confidence level of tissue biomarker analysis is reached by prospective testing in de diagnostic biopsy cohort. An important additional advantage in such a cohort is that small tumor lesions which might be lost upon retrospective re-cutting of the paraffin block, can still be included in a prospective study. According to international guidelines unstained levels of diagnostic biopsies should be cut in case immunohistochemical analyses are mandatory. Instead of discarding these levels after a diagnosis has been established, these levels can be used for additional prospective prognostic marker analysis. Since 2010 we are collecting these additional biopsy levels in patients with limited low- to intermediate-risk prostate (Gleason score <7 (3+4) in <4 biopsies). Currently, we are testing known promising tissue markers Ki-67, p27, EZH2, Vimentin, E-cadherin and N-cadherin (Moul 1999; Thomas, Schrage et al. 2000; Sellers and Loda 2002; Varambally, Dhanasekaran et al. 2002; Vis, van Rhijn et al. 2002; Freedland, de Gregorio et al. 2003; Freedland, deGregorio et al. 2003; Rubio, Ramos et al. 2005; Gravdal, Halvorsen et al. 2007; van Leenders, Dukers et al. 2007; Wu, Wang et al. 2007; Laitinen, Martikainen et al. 2008; Romics, Banfi et al. 2008; Roy, Singh et al. 2008; Wolters, Vissers et al. 2009; Zellweger, Gunther et al. 2009; Zhang, Helfand et al. 2009; Karanikolas, Figueiredo et al. 2010; Fisher, Yang et al. 2013; Yang and Yu 2013; Tollefson, Karnes et al. 2014) as well as the potential markers HELLS, ZIC5 and α6-integrin as found in this thesis. At time of writing this thesis, so far we have stained 571 biopsies of 335 prostate cancer patients. After prostate cancer diagnosis, patients are generally either included in an active surveillance or watchful waiting cohort, or are actively treated by radical prostatectomy or radiation therapy. While the presence of different
Proefschrift#8_DEF.indd 162 25-08-15 16:42

163
Chap
ter 6
endpoint adds value to the tissue marker analysis, overall accrual is inherently lower. We expect that by the end of 2015 the proportion of patients in this biopsy cohort who underwent either a radical prostatectomy or a transurethral resection of the prostate will be large enough to make statistics reliable with an appropriate number of patients.
Chapter 6: General discussion
Proefschrift#8_DEF.indd 163 25-08-15 16:42

164 Discovery and Validation of Prognostic Tissue Markers in Clinical Prostate Cancer – © 2015, A.M. Hoogland
Chap
ter 6
References1. Siegel, R.L., K.D. Miller, and A. Jemal, Cancer statistics, 2015. CA Cancer J Clin, 2015. 65(1): p.
5-29.
2. Edwards, B.K., et al., Annual Report to the Nation on the status of cancer, 1975-2010, featuring prevalence of comorbidity and impact on survival among persons with lung, colorectal, breast, or prostate cancer. Cancer, 2014. 120(9): p. 1290-314.
3. DeSantis, C.E., et al., Cancer treatment and survivorship statistics, 2014. CA Cancer J Clin, 2014. 64(4): p. 252-71.
4. Schroder, F.H., et al., Screening and prostate cancer mortality: results of the European Randomised Study of Screening for Prostate Cancer (ERSPC) at 13 years of follow-up. Lancet, 2014. 384(9959): p. 2027-35.
5. Armbruster, D.A., Prostate-specific antigen: biochemistry, analytical methods, and clinical application. Clin Chem, 1993. 39(2): p. 181-95.
6. Bjartell, A., PSA and prostate cancer screening: The challange of the new millenium. European Urology, 2007. 52: p. 1284-1286.
7. Freedland, S.J., et al., Defining the ideal cutpoint for determining PSA recurrence after radical prostatectomy. Prostate-specific antigen. Urology, 2003. 61(2): p. 365-9.
8. de Vries, S.H., et al., Overall and disease-specific survival of patients with screen-detected prostate cancer in the European randomized study of screening for prostate cancer, section Rotterdam. Eur Urol, 2007. 51(2): p. 366-74; discussion 374.
9. Draisma, G., et al., Lead times and overdetection due to prostate-specific antigen screening: estimates from the European Randomized Study of Screening for Prostate Cancer. J Natl Cancer Inst, 2003. 95(12): p. 868-78.
10. Postma, R., et al., Cancer detection and cancer characteristics in the European Randomized Study of Screening for Prostate Cancer (ERSPC)--Section Rotterdam. A comparison of two rounds of screening. Eur Urol, 2007. 52(1): p. 89-97.
11. Roemeling, S., et al., Active surveillance for prostate cancers detected in three subsequent rounds of a screening trial: characteristics, PSA doubling times, and outcome. Eur Urol, 2007. 51(5): p. 1244-50; discussion 1251.
12. Salagierski, M., M. Sosnowski, and J.A. Schalken, How accurate is our prediction of biopsy outcome? PCA3-based nomograms in personalized diagnosis of prostate cancer. Cent European J Urol, 2012. 65(3): p. 110-2.
13. Schroder, F.H., et al., Prostate cancer antigen 3: diagnostic outcomes in men presenting with urinary prostate cancer antigen 3 scores >/=100. Urology, 2014. 83(3): p. 613-6.
14. Billis, A., et al., The impact of the 2005 international society of urological pathology consensus conference on standard Gleason grading of prostatic carcinoma in needle biopsies. J Urol, 2008. 180(2): p. 548-52; discussion 552-3.
15. Borden, L.S., Jr., et al., An abnormal digital rectal examination is an independent predictor of Gleason > or =7 prostate cancer in men undergoing initial prostate biopsy: a prospective study of 790 men. BJU Int, 2007. 99(3): p. 559-63.
16. Cheng, L., et al., Staging of prostate cancer. Histopathology, 2012. 60(1): p. 87-117.
17. Divrik, R.T., et al., Increasing the number of biopsies increases the concordance of Gleason scores of needle biopsies and prostatectomy specimens. Urol Oncol, 2007. 25(5): p. 376-82.
Proefschrift#8_DEF.indd 164 25-08-15 16:42

165
Chap
ter 6
18. Greene, K.L., et al., Prostate specific antigen best practice statement: 2009 update. J Urol, 2009. 182(5): p. 2232-41.
19. van Vugt, H.A., et al., Prospective validation of a risk calculator which calculates the probability of a positive prostate biopsy in a contemporary clinical cohort. Eur J Cancer, 2012. 48(12): p. 1809-15.
20. Epstein, J.I., An update of the Gleason grading system. J Urol, 2010. 183(2): p. 433-40.
21. Epstein, J.I., et al., The 2005 International Society of Urological Pathology (ISUP) Consensus Conference on Gleason Grading of Prostatic Carcinoma. Am J Surg Pathol, 2005. 29(9): p. 1228-42.
22. Van der Kwast, T., et al., Guidelines on processing and reporting of prostate biopsies: the 2013 update of the pathology committee of the European Randomized Study of Screening for Prostate Cancer (ERSPC). Virchows Arch, 2013. 463(3): p. 367-77.
23. Ahmed, H.U., et al., Focal salvage therapy for localized prostate cancer recurrence after external beam radiotherapy: a pilot study. Cancer, 2012. 118(17): p. 4148-55.
24. Alicikus, Z.A., et al., Ten-year outcomes of high-dose, intensity-modulated radiotherapy for localized prostate cancer. Cancer, 2011. 117(7): p. 1429-37.
25. Hall, J.D., et al., Why patients choose prostatectomy or brachytherapy for localized prostate cancer: results of a descriptive survey. Urology, 2003. 61(2): p. 402-7.
26. Hegarty, J., et al., Radical prostatectomy versus watchful waiting for prostate cancer. Cochrane Database Syst Rev, 2010(11): p. CD006590.
27. Cooperberg, M.R., J.M. Broering, and P.R. Carroll, Time trends and local variation in primary treatment of localized prostate cancer. J Clin Oncol, 2010. 28(7): p. 1117-23.
28. Cooperberg, M.R., P.R. Carroll, and L. Klotz, Active surveillance for prostate cancer: progress and promise. J Clin Oncol, 2011. 29(27): p. 3669-76.
29. Soloway, M.S., et al., Careful selection and close monitoring of low-risk prostate cancer patients on active surveillance minimizes the need for treatment. Eur Urol, 2010. 58(6): p. 831-5.
30. Tosoian, J.J., et al., Active surveillance program for prostate cancer: an update of the Johns Hopkins experience. J Clin Oncol, 2011. 29(16): p. 2185-90.
31. van As, N.J., et al., Predicting the probability of deferred radical treatment for localised prostate cancer managed by active surveillance. Eur Urol, 2008. 54(6): p. 1297-305.
32. van den Bergh, R.C., et al., Outcomes of men with screen-detected prostate cancer eligible for active surveillance who were managed expectantly. Eur Urol, 2009. 55(1): p. 1-8.
33. Hoogland, A.M., C.F. Kweldam, and G.J. van Leenders, Prognostic Histopathological and Molecular Markers on Prostate Cancer Needle-Biopsies: A Review. Biomed Res Int, 2014. 2014: p. 341324.
34. Fajardo, D.A., et al., Identification of Gleason pattern 5 on prostatic needle core biopsy: frequency of underdiagnosis and relation to morphology. Am J Surg Pathol, 2011. 35(11): p. 1706-11.
35. Pelzer, A.E. and W. Horninger, How should PSA screening efforts be focused to prevent underdiagnosis and overdiagnosis of prostate cancer? Nat Clin Pract Urol, 2008. 5(4): p. 172-3.
36. Wakely, S.L., et al., Aberrant diagnoses by individual surgical pathologists. Am J Surg Pathol, 1998. 22(1): p. 77-82.
Chapter 6: General discussion
Proefschrift#8_DEF.indd 165 25-08-15 16:42

166 Discovery and Validation of Prognostic Tissue Markers in Clinical Prostate Cancer – © 2015, A.M. Hoogland
Chap
ter 6
37. Egevad, L., et al., Standardization of Gleason grading among 337 European pathologists. Histopathology, 2013. 62(2): p. 247-56.
38. McKenney, J.K., et al., The potential impact of reproducibility of Gleason grading in men with early stage prostate cancer managed by active surveillance: a multi-institutional study. J Urol, 2011. 186(2): p. 465-9.
39. Fine, S.W. and J.I. Epstein, A contemporary study correlating prostate needle biopsy and radical prostatectomy Gleason score. J Urol, 2008. 179(4): p. 1335-8; discussion 1338-9.
40. Helpap, B. and L. Egevad, The significance of modified Gleason grading of prostatic carcinoma in biopsy and radical prostatectomy specimens. Virchows Arch, 2006. 449(6): p. 622-7.
41. Rodriguez-Urrego, P.A., et al., Interobserver and intraobserver reproducibility in digital and routine microscopic assessment of prostate needle biopsies. Hum Pathol, 2011. 42(1): p. 68-74.
42. Thomsen, F.B., et al., Repeated biopsies in patients with prostate cancer on active surveillance: clinical implications of interobserver variation in histopathological assessment. BJU Int, 2015. 115(4): p. 599-605.
43. Brown, A.M., et al., Recent advances in image-guided targeted prostate biopsy. Abdom Imaging, 2015.
44. Schoots, I.G., et al., Magnetic Resonance Imaging in Active Surveillance of Prostate Cancer: A Systematic Review. Eur Urol, 2015. 67(4): p. 627-636.
45. Schoots, I.G., et al., Magnetic Resonance Imaging-targeted Biopsy May Enhance the Diagnostic Accuracy of Significant Prostate Cancer Detection Compared to Standard Transrectal Ultrasound-guided Biopsy: A Systematic Review and Meta-analysis. Eur Urol, 2014.
46. Park, K., et al., Antibody-based detection of ERG rearrangement-positive prostate cancer. Neoplasia, 2010. 12(7): p. 590-8.
47. Hoogland, A.M., et al., ERG immunohistochemistry is not predictive for PSA recurrence, local recurrence or overall survival after radical prostatectomy for prostate cancer. Mod Pathol, 2012. 25(3): p. 471-9.
48. Hoogland, A.M., et al., Validation of stem cell markers in clinical prostate cancer: alpha6-integrin is predictive for non-aggressive disease. Prostate, 2014. 74(5): p. 488-96.
49. Saramaki, O.R., et al., The gene for polycomb group protein enhancer of zeste homolog 2 (EZH2) is amplified in late-stage prostate cancer. Genes Chromosomes Cancer, 2006. 45(7): p. 639-45.
50. van Leenders, G.J., et al., Polycomb-group oncogenes EZH2, BMI1, and RING1 are overexpressed in prostate cancer with adverse pathologic and clinical features. Eur Urol, 2007. 52(2): p. 455-63.
51. Varambally, S., et al., The polycomb group protein EZH2 is involved in progression of prostate cancer. Nature, 2002. 419(6907): p. 624-9.
52. Collins, A.T., et al., Identification and isolation of human prostate epithelial stem cells based on alpha(2)beta(1)-integrin expression. J Cell Sci, 2001. 114(Pt 21): p. 3865-72.
53. Leong, K.G., et al., Generation of a prostate from a single adult stem cell. Nature, 2008. 456(7223): p. 804-8.
54. Ma, Y., et al., Prostate cancer cell lines under hypoxia exhibit greater stem-like properties. PLoS One, 2011. 6(12): p. e29170.
Proefschrift#8_DEF.indd 166 25-08-15 16:42

167
Chap
ter 6
55. Richardson, G.D., et al., CD133, a novel marker for human prostatic epithelial stem cells. J Cell Sci, 2004. 117(Pt 16): p. 3539-45.
56. Bjartell, A., et al., Immunohistochemical detection of cysteine-rich secretory protein 3 in tissue and in serum from men with cancer or benign enlargement of the prostate gland. The Prostate, 2006. 66: p. 591-603.
57. Bjartell, A.S., et al., Association of cysteine-rich secretory protein 3 and β-Microseminoprotein with outcome after radical prostatectomy. Clinical Cancer Research, 2007. 13(14): p. 4130-4138.
58. Hoogland, A.M., et al., Cysteine-rich secretory protein 3 and beta-microseminoprotein on prostate cancer needle biopsies do not have predictive value for subsequent prostatectomy outcome. BJU Int, 2011. 108(8): p. 1356-62.
59. Fisher, G., et al., Prognostic value of Ki-67 for prostate cancer death in a conservatively managed cohort. Br J Cancer, 2013. 108(2): p. 271-7.
60. Freedland, S.J., et al., Predicting biochemical recurrence after radical prostatectomy for patients with organ-confined disease using p27 expression. Urology, 2003. 61(6): p. 1187-92.
61. Freedland, S.J., et al., Preoperative p27 status is an independent predictor of prostate specific antigen failure following radical prostatectomy. J Urol, 2003. 169(4): p. 1325-30.
62. Gravdal, K., et al., A switch from E-cadherin to N-cadherin expression indicates epithelial to mesenchymal transition and is of strong and independent importance for the progress of prostate cancer. Clin Cancer Res, 2007. 13(23): p. 7003-11.
63. Karanikolas, B.D., M.L. Figueiredo, and L. Wu, Comprehensive evaluation of the role of EZH2 in the growth, invasion, and aggression of a panel of prostate cancer cell lines. Prostate, 2010.
64. Laitinen, S., et al., EZH2, Ki-67 and MCM7 are prognostic markers in prostatectomy treated patients. Int J Cancer, 2008. 122(3): p. 595-602.
65. Moul, J.W., Angiogenesis, p53, bcl-2 and Ki-67 in the progression of prostate cancer after radical prostatectomy. Eur Urol, 1999. 35(5-6): p. 399-407.
66. Romics, I., et al., Expression of p21(waf1/cip1), p27 (kip1), p63 and androgen receptor in low and high Gleason score prostate cancer. Pathol Oncol Res, 2008. 14(3): p. 307-11.
67. Roy, S., et al., Downregulation of both p21/Cip1 and p27/Kip1 produces a more aggressive prostate cancer phenotype. Cell Cycle, 2008. 7(12): p. 1828-35.
68. Rubio, J., et al., Immunohistochemical expression of Ki-67 antigen, cox-2 and Bax/Bcl-2 in prostate cancer; prognostic value in biopsies and radical prostatectomy specimens. Eur Urol, 2005. 48(5): p. 745-51.
69. Sellers, W.R. and M. Loda, The EZH2 polycomb transcriptional repressor--a marker or mover of metastatic prostate cancer? Cancer Cell, 2002. 2(5): p. 349-50.
70. Thomas, G.V., et al., Preoperative prostate needle biopsy p27 correlates with subsequent radical prostatectomy p27, Gleason grade and pathological stage. J Urol, 2000. 164(6): p. 1987-91.
71. Tollefson, M.K., et al., Prostate cancer Ki-67 (MIB-1) expression, perineural invasion, and gleason score as biopsy-based predictors of prostate cancer mortality: the Mayo model. Mayo Clin Proc, 2014. 89(3): p. 308-18.
72. Vis, A.N., et al., Value of tissue markers p27(kip1), MIB-1, and CD44s for the pre-operative prediction of tumour features in screen-detected prostate cancer. J Pathol, 2002. 197(2): p. 148-54.
Chapter 6: General discussion
Proefschrift#8_DEF.indd 167 25-08-15 16:42

168 Discovery and Validation of Prognostic Tissue Markers in Clinical Prostate Cancer – © 2015, A.M. Hoogland
73. Wolters, T., et al., The value of EZH2, p27(kip1), BMI-1 and MIB-1 on biopsy specimens with low-risk prostate cancer in selecting men with significant prostate cancer at prostatectomy. BJU Int, 2009.
74. Wu, T.T., et al., Role of p21(WAF1) and p27(KIP1) in predicting biochemical recurrence for organ-confined prostate adenocarcinoma. J Chin Med Assoc, 2007. 70(1): p. 11-5.
75. Yang, Y.A. and J. Yu, EZH2, an epigenetic driver of prostate cancer. Protein Cell, 2013. 4(5): p. 331-41.
76. Zellweger, T., et al., Tumour growth fraction measured by immunohistochemical staining of Ki67 is an independent prognostic factor in preoperative prostate biopsies with small-volume or low-grade prostate cancer. Int J Cancer, 2009. 124(9): p. 2116-23.
77. Zhang, Q., B. T. Helfand, et al. (2009). “Nuclear factor-kappaB-mediated transforming growth factor-beta-induced expression of vimentin is an independent predictor of biochemical recurrence after radical prostatectomy.” Clin Cancer Res 15(10): 3557-3567.
78. Zhang, S., B. Pavlovitz, et al. (2010). “Detection of TMPRSS2 gene deletions and translocations in carcinoma, intraepithelial neoplasia, and normal epithelium of the prostate by direct fluorescence in situ hybridization.” Diagn Mol Pathol 19(3): 151-156.
Chap
ter 6
Proefschrift#8_DEF.indd 168 25-08-15 16:42

169
Table 1, prostate cancer risk groups
Low-risk Intermediate-risk High-risk
Serum PSA <10 ng/mL 10-20 ng/mL >20 ng/mL
T-stage -T1c (tumor found in biopsy)-T2a (tumor palpated in DRE, present in one half or less than half of one lobe)
-T2b (tumor in more than half of one lobe, but not in both)-T2c (tumor in both lobes, but within prostate capsule)
T3 (tumor extents through the prostate capsule)
Gleason Score on biopsy
<7 7 >7
Exceptions If two of the above criteria are met, patient moves to high-risk
One of the above criteria is enough for high-risk.
Legends: PSA = Prostate Specific Antigen. T-stage = clinical tumor stage. DRE = Digital Rectal Examination.
Chap
ter 6
Chapter 6: General discussion
Proefschrift#8_DEF.indd 169 25-08-15 16:42

170 Discovery and Validation of Prognostic Tissue Markers in Clinical Prostate Cancer – © 2015, A.M. Hoogland
Proefschrift#8_DEF.indd 170 25-08-15 16:42

171
Summary
Prostate cancer is a diverse disease in many ways: in clinical presentation, in histomorphological tumor growth-patterns and in survival statistics for patients. Therefore it is of importance to be able to individually evaluate a tumor’s aggressive potential in the clinical treatment decision-making process. Currently a large number of prostate cancer prognostic (tissue-) markers are described in the medical literature, which enable a more accurate prediction of the tumor’s behavior. Most of these markers have been validated on patients who were treated with surgery for their disease with radical prostatectomy. To have a significant effect on the clinical decision-making process, it is essential to validate these promising markers on prostate needle-biopsies.
The first chapter discusses the current standards in the diagnostic and clinical process in prostate cancer and summarized potential tissue markers. Gleason score is currently the most important predictor of biochemical recurrence, distant metastases and tumor-specific mortality. In 2005 is Gleason grading system has been updated by ISUP (International Society of Urological Pathology). In 26-50% of the radical prostatectomy specimens however there is still an upgrading in Gleason score, compared to the Gleason score in the previous biopsy. Besides Gleason score and the number of biopsy-cores containing tumor, combined with tumor percentage in those biopsy-cores, there are several tissue markers which might be of use in predicting tumor behavior. Proliferation marker Ki67 (MIB-1) is currently the most extensively studied immunohistochemical marker. It has an independent predicting value for disease free survival, biochemical recurrence and disease specific mortality. It also has a strong predictive value for Gleason score in the radical prostatectomy following the biopsy on which the Ki67 was scored. This marker has been tested on several patient cohorts, including diagnostic needle-biopsies. Cyclin-dependent kinase inhibitor p27 and Polycomb-group protein EZH2 are both promising immunohistochemical markers for predicting disease progression and the potential aggressive behavior of prostate cancer. The clinical relevance of TMPRSS:ERG fusion or ERG protein over-expression is still controversial, although some studies show unfavorable prognostic values in active surveillance/ watchful waiting cohorts. c-MYC amplification, PTEN loss and APC hypermethylation are also promising molecular markers for predicting disease-specific mortality although these markers are currently validated in small needle-biopsy cohorts.
Sum
mar
y
Summary
Proefschrift#8_DEF.indd 171 25-08-15 16:42

172 Discovery and Validation of Prognostic Tissue Markers in Clinical Prostate Cancer – © 2015, A.M. Hoogland
The scope of this thesis was to discover and test potential tissue markers which can make a contribution to the clinical treatment decision-making process for the individual prostate cancer patient. To achieve this, I have used the most state of the art research techniques such as laser capture microdissection and RNA sequencing. Newly discovered potential tissue markers were tested on a large cohort of patient samples.
In the second chapter two immunohistochemical markers are tested, which are both described in the medical literature as prognostic markers for prostate cancer after surgery. These markers are Cysteine-rich secretory protein 3 (CRISP-3) and β-microseminoprotein (β-MSP). Both markers are tested on large cohorts of radical prostatectomy specimens, by several research groups. Expression of β-MSP decreases in high-grade tumors, whereas CRISP-3 increases in high-grade tumors. In addition, both markers are described as independent predictors of tumor recurrence after surgery. We have tested these markers on a large cohort of diagnostic prostate needle-biopsies to analyze their ability to predict the significance of prostate cancer in the radical prostatectomy specimen of the same patient. On biopsies, both CRISP-3 and β-MSP did not have predictive value for pathological and clinical outcome after radical prostatectomy. These tissue markers therefore do not seem to have an additional value in the clinical decision-making process for prostate cancer patients.
In chapter 3 the predictive value of ERG protein expression is tested in a cohort of 481 prostate cancer patients who were diagnosed in the scope of the ERSPC (European Randomized Study of Screening for Prostate Cancer). Using the surgical specimens from these patients, we have constructed a tissue microarray (TMA) in which all patients were included in threefold, to preempt possible heterogeneous expression of a marker, or variations in tumor growth pattern. The TMA enabled us to test tissue markers in a relatively short period of time, on a large number of patients. In chapter 1 the role of ERG protein expression in prostate cancer has already been discussed. We have tested the correlation immunohistochemical ERG expression on this patient cohort and general cancer characteristic: serum Prostate Specific Antigen (PSA), clinical tumor stage, Gleason score, biochemical recurrence, local recurrence and death after radical prostatectomy. ERG expression was seen in 65% of our patient cohort, which is in line with other publications. More ERG expression was seen in patients with an elevated serum PSA. There was no association between ERG expression and Gleason score of tumor stage. In addition ERG expression had no predictive value for tumor recurrence or mortality after radical prostatectomy. Therefore immunohistochemical ERG expression is not predictive for tumor behavior after radical prostatectomy.
Sum
mar
y
Proefschrift#8_DEF.indd 172 25-08-15 16:42
173
Prostate cancer consists of different cell types, of which the mature androgen-dependent, PSA-producing cell is the most abundant. In addition, several models have shown a small sub-population of tumor cells with a more aggressive behavior compared to the most abundant, mature cells. These so-called tumor stem cells have the potential to divide, to form new tumors and to mature into different daughter-cell types. The role of tumor stem cells in the actual biological behavior of prostate cancer in patients however is unsure.
In chapter 4 the immunohistochemical expression patterns in prostate cancer of several stem cell markers is tested and their potential clinical relevance in sought out. In the medical literature the markers α2-Integrin, α6-Integrin, CD117, CD133, EZH2 and OCT3/4 are discussed as stem cell markers in several prostate cancer studies. On the same patient cohort of 481 radical prostatectomy specimens used in chapter 3, these markers were tested and correlated with clinico-pathologic parameters. If we presume the number of tumor stem cells to be limited (<5%) in prostate cancer, the expression of α2-Integrin and EZH2 in a small fraction of tumor cells is in line with their putative limited expression as stem cell marker. α2-Integrin expression is associated with high serum PSA. EZH2 expression is associated with high Gleason score and with biochemical recurrence after radical prostatectomy. α6-integrin was not an unique stem cell marker in our patient cohort. We found extensive expression (>5% of positive tumor cells within the same patient) of α6-Integrin in >70% of the patients. Striking is the strong statistical association of α6-Integrin with non-aggressive characteristics such as low serum PSA, Gleason score of <7 and low tumor stage. In addition α6-Integrin was independently predictive for lack of prostate cancer biochemical and local recurrence, and tumor-specific mortality. The validity of CD117, CD133 and OCT3/4 as prostate cancer stem cell marker was questionable since these proteins were not expressed in clinical prostate cancer.
In chapter 5 we analyzed the differences in RNA expression values between glandular Gleason grade 3 growth pattern being part of low- and high-grade prostate cancer. We isolated Gleason grade 3 tumor glands from Gleason score 6 prostate cancer and from 7 tumors, which are considered to be potentially aggressive tumors. RNA expression patterns were analyzed using RNA sequencing, a technique which became available during this project. From the list of potential marker-candidates, we validated the protein expression in the same patient cohort used in chapters 3 and 4. We found that enhanced HELLS and ZIC5 protein expression was associated with higher Gleason score, which was in line with the elevated RNA expression values in our discovery set. In addition HELLS was an independent predictor for biochemical as well as local recurrence of prostate cancer after surgery.
Sum
mar
y
Summary
Proefschrift#8_DEF.indd 173 25-08-15 16:42
174 Discovery and Validation of Prognostic Tissue Markers in Clinical Prostate Cancer – © 2015, A.M. Hoogland
In conclusion, tissue markers can support current clinical decision-making in prostate cancer patients. In this thesis a large number of potential markers have been tested for their predictive values for prostate cancer patients after surgery. Based on the results of this thesis, we are currently prospectively studying the additional value of α6-Integrin, HELLS and ZIC5 on diagnostic prostate needle-biopsies.
Sum
mar
y
Proefschrift#8_DEF.indd 174 25-08-15 16:42

175Summary
Proefschrift#8_DEF.indd 175 25-08-15 16:42

176 Discovery and Validation of Prognostic Tissue Markers in Clinical Prostate Cancer – © 2015, A.M. Hoogland
Proefschrift#8_DEF.indd 176 25-08-15 16:42

177
Samenvatting
Prostaatkanker is divers in verschillende facetten: in klinische presentatie, in histomorfologische tumor groeipatronen en in overlevingsstatistieken voor patiënten. Derhalve is individuele evaluatie van het potentiële agressieve gedrag van een tumor cruciaal voor de klinische besluitvorming rondom de behandeling van mannen met prostaatkanker. Op dit moment wordt in de medische literatuur een groot aantal (weefsel-) markers voor prostaatkanker beschreven die het klinisch gedrag van de tumor beter kunnen voorspellen. De meeste markers zijn onderzocht in patiënten die operatief behandeld werden voor hun ziekte met radicale prostatectomie. Om een significant effect te kunnen bewerkstelligen op de therapeutische beslissing is het echter belangrijk dat de markers ook getest worden op diagnostische prostaat naaldbiopten.
In het eerste hoofdstuk wordt besproken wat op dit moment de gang van zaken is in het diagnostisch (pathologisch) en therapeutisch beslis-proces van prostaatkanker patiënten, welke potentiële markers in de medische literatuur beschreven zijn en in hoeverre deze markers wel of niet toegepast (kunnen) worden in de klinische praktijk. Bij het graderen van prostaatkanker op naaldbiopten, is op dit moment de Gleason score de meest belangrijke voorspeller van een biochemisch recidief, afstandsmetastasen en tumorspecifieke mortaliteit. In 2005 is het Gleason score systeem door ISUP (International Society of Urological Pathology) aangepast. In 26-50% van de radicale prostatectomie specimen is er echter nog opwaardering van de Gleason score ten opzichte van de Gleason score in het voorafgaande biopt. Naast de Gleason score en het aantal biopten waar tumor in zit, gecombineerd met het percentage tumor in die biopten, bestaan verschillende weefselmarkers die kunnen helpen met het voorspellen van het toekomstig gedrag van een tumor. Proliferatiemarker Ki67 (MIB-1) is op dit moment de meest uitgebreid onderzochte immunohistochemische marker met een onafhankelijk voorspellende waarde voor ziektevrije overleving, biochemisch recidief, tumorspecifieke mortaliteit en ook als sterke voorspeller van de Gleason score in de radicale prostatectomie volgend op het biopt waarop Ki67 uitgevoerd is. Deze marker is getest op verscheidene patiënt cohorten, waaronder diagnostische biopten. Cyclin-dependent kinase remmer p27 en Polycomb-groep eiwit EZH2 zijn beide veelbelovende immunohistochemische markers voor het voorspellen van het ziekteverloop en het potentiële agressieve gedrag van prostaatkanker. De klinische relevantie van TMPRSS:ERG fusie of ERG eiwit over-expressie is op dit moment nog controversieel, alhoewel verschillende studies een ongunstige prognostische waarde van ERG eiwit over-expressie in active surveillance/ watchful waiting cohorten aantonen. Amplificatie van c-MYC,
Sam
enva
tting
Samenvatting
Proefschrift#8_DEF.indd 177 25-08-15 16:42

178 Discovery and Validation of Prognostic Tissue Markers in Clinical Prostate Cancer – © 2015, A.M. Hoogland
verlies van PTEN en APC hypermethylatie zijn eveneens veelbelovende moleculaire markers voor het voorspellen van ziektespecifieke mortaliteit, vooralsnog zijn deze markers echter gevalideerd in enkele kleine biopt-cohorten.
Het doel van mijn PhD onderzoek is het ontdekken en onderzoeken van potentiele weefselmarkers die een bijdrage kunnen leveren in het beslistraject rondom het behandelplan voor de individuele prostaat kanker patiënt. Daarvoor heb ik onder andere gebruik gemaakt van de meest state of the art onderzoekstechnieken zoals laser capture microdissectie en RNA sequencing. Nieuw ontdekte, mogelijke weefselmarkers worden onderzocht op een groot cohort van patiënt samples.
In het tweede hoofdstuk worden twee immunohistochemische markers getest die in de medische literatuur beschreven zijn als prognostische markers voor prostaatkanker na operatie. Het betreft Cysteine-rich secretory protein 3 (CRISP-3) en β-microseminoprotein (β-MSP). Deze markers zijn beide door verschillende onderzoeksgroepen op grote cohorten radicale prostatectomie specimen getest. β-MSP expressie neemt af in meer hooggradige tumoren, terwijl de expressie van CRISP-3 juist toeneemt in hooggradige tumoren. Daarnaast worden beide markers beschreven als onafhankelijke voorspellers van recidief van prostaatkanker na radicale prostatectomie. Wij hebben deze markers getest op een cohort van diagnostische prostaat naaldbiopten om te analyseren of zij ook in staat zijn de ernst van prostaatkanker te voorspellen in de navolgende radicale prostatectomie. Beide markers toonden geen voorspellende waarde in de naaldbiopten voor de ernst van prostaatkanker in de totale prostaat van diezelfde patiënt. Deze markers lijken derhalve geen toegevoegde waarde te hebben in de klinische besluitvorming voor prostaatkanker patiënten.
In hoofdstuk 3 wordt de voorspellende waarde van ERG eiwit expressie onderzocht op een cohort van 481 radicale prostatectomie specimen van prostaatkanker patiënten die in het kader van de ERSPC (European Randomized Study of Screening for Prostate Cancer) gediagnosticeerd zijn. Van de specimen van deze patiënten, gecombineerd met 7 prostaatkanker cellijnen en 22 prostaatkanker muismodellen hebben wij een tissue microarray (TMA) samengesteld, waarin alle patiënten in drievoud voorkomen, om daarmee eventuele heterogene expressie van een marker of wisselend groeipatroon van de tumor beter in beeld te krijgen. De TMA maakte het mogelijk in relatief korte tijd weefselmarkers te onderzoeken op een groot aantal patiënten. In hoofdstuk 1 is de rol van ERG eiwit expressie in prostaat kanker al besproken. Wij hebben in dit patiënten cohort de correlatie tussen de immunohistochemische expressie van ERG en algemene tumorkenmerken
Sam
enva
tting
Proefschrift#8_DEF.indd 178 25-08-15 16:42

179
onderzocht: serum Prostaat Specifiek Antigen (PSA), klinisch tumor stadium, Gleason score, biochemisch tumor recidief, lokaal tumor recidief alsook overlijden na de radicale prostatectomie. ERG expressie werd gezien in 65% van ons patiënten cohort, wat overeenkomt met andere publicaties. Er werd meer ERG expressie gezien bij patiënten met een verhoogd serum PSA. Er werd echter geen associatie gezien tussen ERG expressie en Gleason score of tumor stadium. Daarnaast heeft ERG expressie geen voorspellende waarde heeft voor tumor recidief of mortaliteit na radicale prostatectomie. Derhalve lijkt immunohistochemische ERG expressie geen rol te hebben in het klinisch besluitvormingproces van prostaat kanker patiënten na radicale prostatectomie.
Prostaatkanker bestaat uit verschillende celtypen, waarvan de meest voorkomende de uitgerijpte androgeen-afhankelijk, PSA-producerende cel is. Daarnaast is in verschillende modellen aangetoond, dat een kleine populatie kankercellen een veel agressiever gedrag vertoont dan de meest voorkomende uitgerijpte cellen. Deze zogenaamde tumorstamcellen hebben een groot potentieel om te delen, nieuwe tumoren te vormen en uit te rijpen naar verschillende dochterceltypen. De rol van tumorstamcellen in het werkelijk biologische gedrag van prostaatkanker bij patiënten blijft echter onzeker.
In hoofdstuk 4 is voor een aantal immunohistochemische markers voor stamcellen uitgezocht wat het expressiepatroon in prostaatkanker is en wat deze markers mogelijk kunnen betekenen in de klinische setting. In de literatuur worden de markers α2-Integrine, α6-Integrine, CD117, CD133, EZH2 en OCT3/4 geopperd als mogelijke stamcelmarkers in verschillende prostaatkanker onderzoeken. Op hetzelfde patiënten cohort van 481 radicale prostatectomie specimen als dat gebruikt is in hoofdstuk 3, zijn al deze markers onderzocht en gecorreleerd met klinisch-pathologische kenmerken. Als we aannemen dat tumor stamcellen maar beperkt voorkomen (<5%) in prostaatkanker, kwam alleen de spaarzame expressie van α2-Integrine en EZH2 overeen met het verwachte patroon van een stamcelmarker. α2-Integrine is geassocieerd met een hoog serum PSA. EZH2 expressie is geassocieerd met een hoge Gleason score en met biochemisch recidief na radicale prostatectomie. α6-Integrine blijkt in onze patiëntengroep geen unieke stamcelmarker te zijn. Wij vonden uitgebreide expressie (>5% positieve tumorcellen binnen één patiënt) van α6-Integrine in >70% van de patiënten. Opvallend is wel dat α6-Integrine een statistisch sterke associatie heeft met niet-agressieve tumorkenmerken zoals een laag serum PSA, een Gleason score van <7 en laag tumorstadium. Daarnaast heeft α6-Integrine een onafhankelijk voorspellende waarde voor het uitblijven van biochemische en lokale recidieven van prostaatkanker, alsook tumorspecifieke
Sam
enva
tting
Samenvatting
Proefschrift#8_DEF.indd 179 25-08-15 16:42

180 Discovery and Validation of Prognostic Tissue Markers in Clinical Prostate Cancer – © 2015, A.M. Hoogland
mortaliteit na radicale prostatectomie. CD117, CD133 en OCT3/4 tonen totaal geen eiwit expressie in de prostaatkanker specimen van ons cohort en lijken derhalve ongeschikt als stamcelmarkers in prostaatkanker.
Hoofdstuk 5 is een onderzoeksproject dat gedurende het uitwerken en publiceren van alle voorgaande hoofdstukken een belangrijk onderdeel van het totale onderzoekstraject geweest is. In dit project onderzoeken wij verschillen in de moleculaire achtergrond (onder andere op RNA niveau) van verschillende groeipatronen van prostaatkanker. Op deze manier willen wij uiteindelijk weefselmarkers vinden die op het diagnostisch prostaat biopt waarin een laaggradige tumor zit kunnen voorspellen of deze tumor bij deze patiënt echt een laaggradige tumor zal blijven en dus relatief onschuldig is, of dat deze tumor de potentie heeft om uit te groeien tot een hooggradige, tumor die wellicht meer agressieve behandeling behoeft. Met behulp van laser capture microdissectie is uit ingevroren prostaattumoren materiaal geïsoleerd van Gleason groeipatroon 3 (laaggradig groeipatroon) uit een zuivere Gleason score 3+3=6 tumor, hetgeen beschouwd wordt als een laaggradige tumor, en Gleason groeipatroon 3, dat gelegen is naast Gleason graad 4 (hooggradig groeipatroon) in tumoren met Gleason score 3+4=7 of 4+3=7, welke beschouwd worden als hooggradige en mogelijk agressieve tumoren. Wij hebben gekeken naar RNA expressie verschillen tussen deze twee verschillende groeipatronen met nieuwe RNA sequencing technieken, welke tijdens dit project beschikbaar kwamen. Van de potentiële marker-kandidaten die uit deze lijst naar voren gekomen zijn, werd de eiwit-expressie onderzocht in hetzelfde patiënten cohort als dat gebruikt is in de hoofdstukken 3 en 4. De conclusies zijn dat HELLS en ZIC5 correleren met agressieve tumorkenmerken, waarbij meer expressie van HELLS en ZIC5 gezien wordt bij hogere Gleason score. Daarnaast is HELLS onafhankelijk voorspellend voor zowel biochemisch als lokaal recidief van prostaatkanker na radicale prostatectomie en is HELLS univariaat voorspellend voor algemene mortaliteit als ook tumorspecifieke mortaliteit na operatie. Dit maakt HELLS en ZIC5 potentiële markers zijn die, gecombineerd met bijvoorbeeld α6-Integrine op prostaat naaldbiopten een panel kunnen vormen waarmee de besluitvorming over de behandeling ondersteund kan worden. Dit laatste onderzoek loopt op dit moment al in de vorm van een prospectieve studie op prostaat naaldbiopten. De resultaten hiervan zullen de komende jaren bekend worden.
Sam
enva
tting
Proefschrift#8_DEF.indd 180 25-08-15 16:42

181
Publ
icati
ons
Samenvatting
Samengevat, kunnen weefselmarkers een toegevoegde waarde hebben bij de therapeutische beslissing van individuele patiënten. Helaas worden de meeste potentiële markers niet getest op hun toegevoegde waarde in therapeutische beslisvorming, zodat onbekend is of zij werkelijk bij kunnen dragen aan betere zorg voor prostaatkanker patiënten. In dit promotie-traject zijn een groot aantal potentiële markers onderzocht op hun voorspellende waarde voor prostaatkanker patiënten na operatie. We hebben aangetoond dat CRISP3 en β-MSP geen toegevoegde waarde lijken te hebben op diagnostische biopten. Drie nieuw ontdekte weefselmarkers voor tumorgedrag na operatie, α6-Integrine, HELLS en ZIC5 onderzoeken wij nu voor hun toegevoegde waarde in de therapie-keuze voor patiënten op diagnostische prostaatnaaldbiopten op biopten die nu dagelijks worden afgenomen.
Proefschrift#8_DEF.indd 181 25-08-15 16:42
182 Discovery and Validation of Prognostic Tissue Markers in Clinical Prostate Cancer – © 2015, A.M. Hoogland
Publ
icati
ons
List of publications
1 Hoogland A.M., Dahlman A., Vissers K.J., Wolters T., Schröder F.H., Roobol M.J., Bjartell A.S., van Leenders G.J.. “Cysteine-rich secretory protein 3 and β-microseminoprotein on prostate cancer needle biopsies do not have predictive value for subsequent prostatectomy outcome.”, BJU Int. 2011. 108(8):1356-62.
2 van Leenders G.J., Boormans J.L., Vissers C.J., Hoogland A.M., Bressers A.A., Furusato B., Trapman J.. “Antibody EPR3864 is specific for ERG genomic fusions in prostate cancer: implications for pathological practice.”, Mod Pathol. 2011. 24(8):1128-38.
3 Rijlaarsdam M.A., van Herk H.A., Gillis A.J., Stoop H., Jenster G., Martens J., van Leenders G.J., Dinjens W., Hoogland A.M., Timmermans M., Looijenga L.H.. “Specific detection of OCT3/4 isoform A/B/B1 expression in solid (germ cell) tumours and cell lines: confirmation of OCT3/4 specificity for germ cell tumours.”, Br J Cancer. 2011. 105(6):854-63.
4 Hoogland A.M., Jenster G., van Weerden W.M., Trapman J., van der Kwast T., Roobol M.J., Schröder F.H., Wildhagen M.F., van Leenders G.J.. “ERG immunohistochemistry is not predictive for PSA recurrence, local recurrence or overall survival after radical prostatectomy for prostate cancer.”, Mod Pathol. 2012. 25(3):471-9.
5 Ibeawuchi C., Schmidt H., Voss R., Titze U., Abbas M., Neumann J., Eltze E., Hoogland A.M., Jenster G., Brandt B., Semjonow A.. “Genome-wide investigation of multifocal and unifocal prostate cancer-are they genetically different?”, Int J Mol Sci. 2013. 14(6):11816-29.
6 Hoogland A.M., Verhoef E.I., Roobol M.J., Schröder F.H., Wildhagen M.F., van der Kwast T.H., Jenster G., van Leenders G.J.. “Validation of stem cell markers in clinical prostate cancer: α6-integrin is predictive for non-aggressive disease.”, Prostate. 2014. 74(5):488-96.
7 Duijvesz D., Burnum-Johnson K.E., Gritsenko M.A., Hoogland A.M., Vredenbregt-van den Berg M.S., Willemsen R., Luider T., Paša-Tolić L., Jenster G.. “Proteomic profiling of exosomes leads to the identification of novel biomarkers for prostate cancer.”, PLoS One. 2013. 8(12).
Proefschrift#8_DEF.indd 182 25-08-15 16:42

183
Publ
icati
ons
List of publications
8 Hoogland A.M., Kweldam C.F., van Leenders G.J.. “Prognostic histopathological and molecular markers on prostate cancer needle-biopsies: a review.”, Biomed Res Int. 2014.
9 Ghotra V.P., He S., van der Horst G., Nijhoff S., de Bont H., Lekkerkerker A., Janssen R., Jenster G., van Leenders G.J., Hoogland A.M., Verhoef E.I., Baranski Z., Xiong J., van de Water B., van der Pluijm G., Snaar-Jagalska B.E., Danen E.H.. “SYK is a candidate kinase target for the treatment of advanced prostate cancer.”, Cancer Res. 2015. 75(1):230-40.
10 Ibeawuchi C,. Schmidt H., Voss R., Titze U., Abbas M., Neumann J., Eltze E., Hoogland A.M., Jenster G., Brandt B., Semjonow A.. “Exploring prostate cancer genome reveals simultaneous losses of PTEN, FAS and PAPSS2 in patients with PSA recurrence after radical prostatectomy.”, Int J Mol Sci. 2015. 16(2):3856-69.
11 Böttcher R., Hoogland A.M., Dits N., Verhoef E.I., Kweldam C., Waranecki P., Bangma C.H., van Leenders G.J., Jenster G.. “Novel long non-coding RNAs are specific diagnostic and prognostic markers for prostate cancer.”, Oncotarget. 2015. 6(6):4036-50.
12 Martin Puhr, Julia Hoefer, Andrea Eigentler, Dimo Dietrich, Geert Van Leenders, Barbara Uhl, Agnes Hoogland, Florian Handle, Bettina Schlick, Hannes Neuwirt, Verena Sailer, Glen Kristiansen, Helmut Klocker, and Zoran Culig. “PIAS1 is a determinant of poor survival and acts as a positive feedback regulator of AR signaling through enhanced AR stabilization in prostate cancer.”, Oncogene 2015, accepted
Proefschrift#8_DEF.indd 183 25-08-15 16:42

184 Discovery and Validation of Prognostic Tissue Markers in Clinical Prostate Cancer – © 2015, A.M. Hoogland
Proefschrift#8_DEF.indd 184 25-08-15 16:42

185
Curriculum Vitae
Marije Hoogland werd op 15 juni 1982 geboren te Rotterdam. Na het behalen van het atheneum aan het Koningin Wilhelmina College te Culemborg (1994-2000) werd zij zowel decentraal als centraal uitgeloot voor Diergeneeskunde te Utrecht en is een jaar Biologie te Utrecht gaan studeren (2000-2001). Toen zij dat jaar weer uitgeloot werd voor Diergeneeskunde, is zij gedurende drie jaar Diergeneeskunde te Gent, België gaan studeren. Aan het eind van het tweede jaar Diergeneeskunde in Gent lootte zij mee voor Geneeskunde, waar zij in de na-loting toegelaten werd en gedurende 1 jaar gecombineerd Geneeskunde in Leiden en Diergeneeskunde in Gent heeft gestudeerd. Het behalen van de propedeuse Geneeskunde ging vlot, waarna de overstap gemaakt is naar Geneeskunde in Leiden. Vanwege een uitgebreide basis kennis van anatomie en histologie opgedaan in de voorgaande jaren, kon er direct in het eerste jaar van Geneeskunde gestart worden met een bijbaantje als student-assistent op verscheidene anatomie en histologie practica voor mede-eerste jaars en later ook voor oudere jaars studenten.
Nadat in 2009 Geneeskunde is afgerond, is Marije gestart met haar promotie-onderzoek bij Arno van Leenders aan het Josephine Nefkens Instituut, Erasmus MC te Rotterdam. Op 1 januari 2014 liep de officiële onderzoeksperiode af en is zij gestart met haar opleiding tot Klinisch Patholoog, eveneens aan het Erasmus MC, waar de specialisatie naar verwachting per 1 januari 2018 afgerond zal zijn.
CV
Curriculum Vitae
Proefschrift#8_DEF.indd 185 25-08-15 16:42

186 Discovery and Validation of Prognostic Tissue Markers in Clinical Prostate Cancer – © 2015, A.M. Hoogland
PhD Portfolio
Summary of PhD training and teaching
Name PhD student: A.M. Hoogland PhD period: 01-02-2010 / 01-07-2014
Erasmus MC Department: Pathology Promotor(s): G.W. Jenster en F.J. van Kemenade
Research School: Molecular Medicine, Erasmus MC Supervisor: G.J.L.H. van Leenders
1. PhD training
Year Workload (ECTS)
General courses
Biomedical English Writing Course for MSc-students and PhDsStatistics (Basic introduction course on SPSS)Statistics (The Basic Course on ‘R’)BROK (‘Basiscursus Regelgeving Klinisch Onderzoek’)Course Biomedical Research TechniquesBasic and Translational OncologyCourse Molecular MedicineNext-Generation Sequencing Training: CLC bio II
2010/20112010201020102010201020112011
2 0.5 11 1 1.5 1.55
Specific courses (e.g. Research school, Medical Training)
Moleculaire Pathologie cursus aan het VUMC 2012 5
Seminars and workshops
14th Molecular Medicine Day - 4th March 2010Affymetrix Medical Genomics Research seminarResearch management for PhD students and PostdocsThe Ensembl Workshop15th Molecular Medicine Day – February 03, 2011IPA Webinar, Data Upload and AnalysisIPA Webinar, Search and Explore
2010201020102010201120122012
0.30.150.75 0.250.30.10.1
PhD
portf
olio
Proefschrift#8_DEF.indd 186 25-08-15 16:42

187
Presentations – Poster Presentations
Pathologendagen 201015th Molecular Medicine DayEAU in ViennaPathologendagen 2011, 2 posters (1x best poster award)ESUR in InnsbruckCTMM Annual Meeting Utrecht (award nominee)EAU in Paris, (best poster award)Pathologendagen 2012AUA in Atlanta, 2 postersCTMM Annual Meeting UtrechtESUR in StrasbourgPCMM Annual Meeting, AmsterdamBiomarker discovery: Driving Technologies, London. 2 posters (best poster award)Pathologendagen 2013, 2 posters +elevator pitch
2010201120112011201120112012201220122012201220122012
2013
1111111111111
1
Oral presentations
PCMM Annual Meeting 2010, 1 oral presentaionJenster labmeeting and JNI labmeetingCTMM Annual Meeting Utrecht (award nominee)EAU in Paris 2012Biomarker discovery: Driving Technologies, London.)
20102010-2014201120122012
15111
(Inter)national conferences
Pathologendagen 2010-2015 ESUR in VilniusEAU in Vienna (See presentations)ESUR in Innsbruck (See presentations)EAU in Paris (See presentations)AUA in Atlanta, USAESUR in Strasbourg (See presentaions)Biomarker Discovery Meeting London (See presentations)
2010-20152010201120112012 201220122013
02222221
Other
Photoshop CS3 Workshop for phd-students and other researchers 2010 0.25
2. Teaching
Year Workload (ECTS)
Supervising practicals and excursions, Tutoring
Multipel VO-teaching sessions according to the agenda for every trainee Pathology. 1 or 2 weeks per year.
2011-2015 8
Other
Chinyere Ibeawuchi, Multifocality projectKimberley Kolijn, starting up PhD/RNA/LCM work
20122012
24
PhD
portf
olio
PhD Portfolio
Proefschrift#8_DEF.indd 187 25-08-15 16:42