Productivity or Employment: Is it a choice? Andrea De Michelis Federal Reserve Board Marcello...
31
Productivity or Employment: Is it a choice? Andrea De Michelis Federal Reserve Board Marcello Estevão International Monetary Fund Beth Anne Wilson Federal Reserve Board January 4, 2013
-
Upload
skyla-woodland -
Category
Documents
-
view
214 -
download
1
Transcript of Productivity or Employment: Is it a choice? Andrea De Michelis Federal Reserve Board Marcello...

Productivity or Employment: Is it a choice?
Andrea De Michelis Federal Reserve Board
Marcello EstevãoInternational Monetary Fund
Beth Anne WilsonFederal Reserve Board
January 4, 2013

The views in this presentation are solely the responsibility of the
authors and should not be interpreted as reflecting the views of the International Monetary Fund or
the Board of Governors of the Federal Reserve System or of any other
person associated with the Federal Reserve System.

3
Background
In general, economic theory assumes that TFP growth follows an exogenous process.
Low TFP growth is seen as worrisome, as many associate it with poor economic performance.
In reality, not a one-to-one relation between TFP and output growth key motivation for this paper: TFP growth may be a “choice” variable.

4
Take the case of Canada: TFP growth has been
particularly low.
-1
0
1
2
3
4
-1
0
1
2
3
4
1960 1970 1980 1990 2000
G-7 Countries*: Growth in Total Factor Productivity(percent)
Canada
Average G-7
Range of TFP Growth Observed in the G-7
* Data start in 1961 for the United States, 1962 for Germany and Italy, 1963 for Canada, 1970 for Japan, and 1971 for France and United Kingdom. German data prior to1987 is for West Germany. Source: Organisation for Economic Co-Operation and Development

5
In contrast, employment growth
has been quite strong.
-6
-3
0
3
6
9
-6
-3
0
3
6
9
1950 1960 1970 1980 1990 2000
G-7 Countries*: Employment Growth(percent)
Range of employmentgrowth rates observed
in the G-7
Canada
Average G-7
* Data for Canada, Italy, Japan, and United Kingdom start in 1960. German data prior to 1987 are for West Germany.Source: The Conference Board Total Economy Database, January 2010.

6
Same with hours of work.
-10
-5
0
5
10
-10
-5
0
5
10
1950 1960 1970 1980 1990 2000
G-7 Countries*: Total Hours Worked(percent change)
CanadaAverage G-7
Range of Growthin Hours Worked
Observed in the G-7
* Data for Canada, Italy, Japan, and the United Kingdom start in 1960. Data for Germany prior to 1987 are for West Germany.Source: The Conference Board Total Economy Database, January 2010.

7
As a result, Canadian GDP growth has outperformed the G7 average.
-7
0
7
14
-7
0
7
14
1950 1960 1970 1980 1990 2000
G-7 Countries*: Real GDP** Growth(percent)
Canada
Average G-7
Range of growthrates observed in the G-7
* German data prior to 1987 are for West Germany. ** Converted to constant 1990 dollars using Geary-Khamis PPP weights.Source: The Conference Board Total Economy Database, January 2010.
8
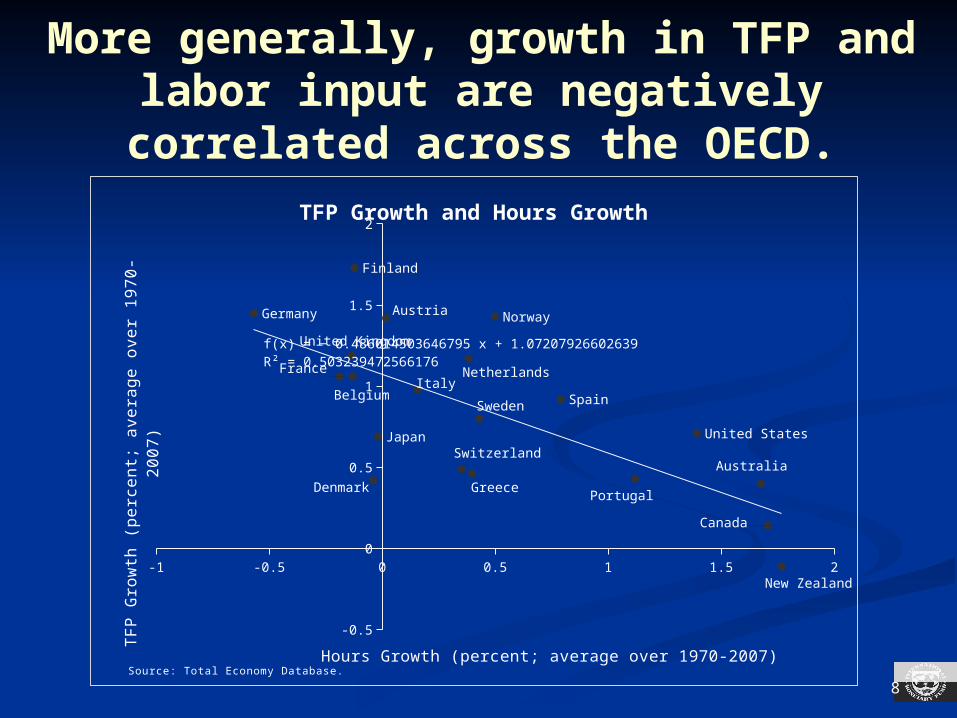
More generally, growth in TFP and labor input are negatively
correlated across the OECD.
-1 -0.5 0 0.5 1 1.5 2
-0.5
0
0.5
1
1.5
2
Australia
Austria
Belgium
Canada
Denmark
Finland
France
Germany
Greece
Italy
Japan
Netherlands
New Zealand
Norway
Portugal
SpainSweden
Switzerland
United Kingdom
United States
f(x) = − 0.486014503646795 x + 1.07207926602639R² = 0.503239472566177
TFP Growth and Hours Growth
Hours Growth (percent; average over 1970-2007)
TF
P G
row
th (
perc
ent;
aver
age
over
197
0-20
07)
Source: Total Economy Database.

9
Data: Labor Input and TFP The Conference Board Total Econom
y Database: total economy annual data, main 20 OECD countries, 1970-2007
World/EU KLEMS: annual data, 14 OECD countries, 10 sectors, various sample ranges, but 1980-2007 available for most countries of interest
EU AMECO: total economy annual data, European and other G-7 countries, 1960-2013(no hours data, used only for robustness analysis)

10
Other Data
Sources for tax data McDaniel (2007): payroll, income, and
consumption taxes, 15 OECD countries, 1950/70-2007
Sources for population data United Nations The Conference Board Total Economy D
atabase

11
Negative correlation of TFP and hours growth is robust, holding across datasets and
labor inputs...Database TED KLEMS† TED KLEMS†Labor Input Employment Employment Hours Hours
Constant 1.35*** 0.86*** 1.07*** 0.74***(0.17) (0.18) (0.10) -0.12
Coefficient -0.53*** -0.36* -0.49*** -0.37**(0.15) (0.17) (0.11) (-0.09)
Observations 20 14 20 14Adjusted R2 0.36 0.21 0.48 0.33†KLEMS data spans the time period 1980-2007.Standard errors in parentheses. *** p<0.01, ** p<0.05, * p<0.1
12
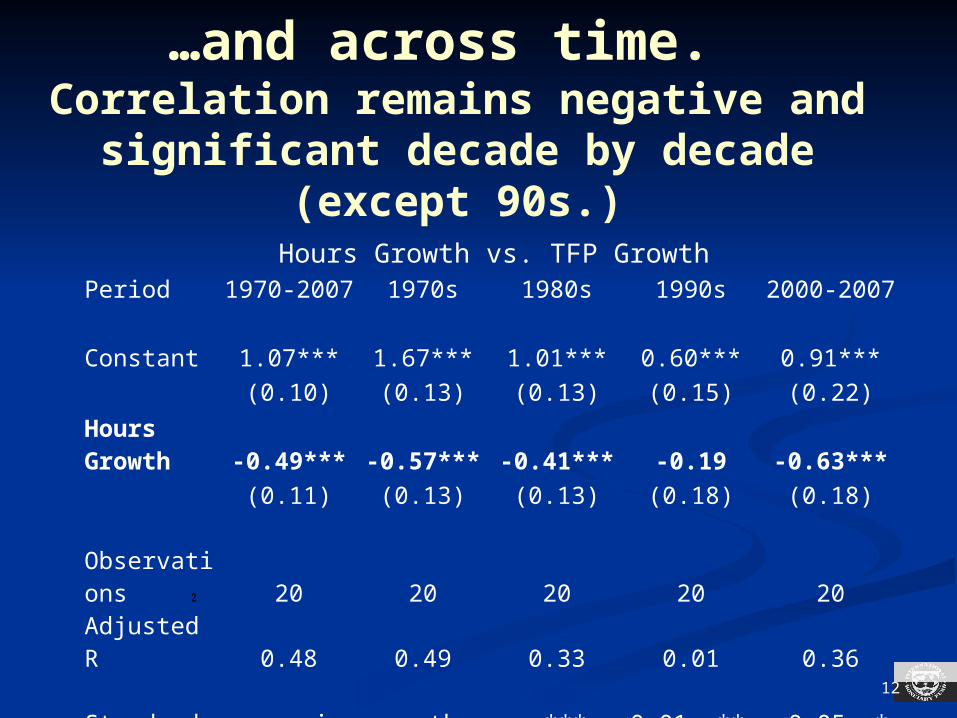
…and across time. Correlation remains negative and
significant decade by decade (except 90s.)
Hours Growth vs. TFP GrowthPeriod 1970-2007 1970s 1980s 1990s 2000-2007
Constant 1.07*** 1.67*** 1.01*** 0.60*** 0.91***
(0.10) (0.13) (0.13) (0.15) (0.22)
Hours Growth -0.49*** -0.57*** -0.41*** -0.19 -0.63***
(0.11) (0.13) (0.13) (0.18) (0.18)
Observations 20 20 20 20 20
Adjusted R 0.48 0.49 0.33 0.01 0.36
Standard errors in parentheses. *** p<0.01, ** p<0.05, * p<0.1
𝟐

13
-1.5 -1.0 -0.5 0.0 0.5 1.0 1.5 2.0 2.5-1.5
-1.0
-0.5
0.0
0.5
1.0
1.5
2.0
2.5
AUS
AUT
BEL
CAN
DNK
FIN
FRA
DEU
GRC
ITA
JPN
NLD
NZL
NOR
PRT
ESP
SWESWZ
GBR
USA
1970-2007
Above average TFPBelow average Hours
Below average TFPBelow average Hours
Above average TFPAbove average Hours
Below average TFPAbove average Hours
Average TFP Growth = 0.84
Average Hours Growth = 0.47
Dotted lines represent averages over 1970-2007.
Countries relative relationship between TFP and H growth
fairly stable.

14
-2.0 -1.5 -1.0 -0.5 0.0 0.5 1.0 1.5 2.0 2.5 3.0-2.0
-1.5
-1.0
-0.5
0.0
0.5
1.0
1.5
2.0
2.5
3.0
AUS
AUT
BEL
CAN
DNK
FINFRADEU
GRC
ITA
JPN
NLD
NLZ
NOR
PRT
ESP
SWE
SWZ
GBR
USA
1970s
Hours Growth (percent)
TFP
Gro
wth
(per
cent
)But, some drift toward lower
TFP/ stronger hours growth in Europe.
(1970s and 1980s)
Dotted lines represent the averages over 1970-2007 on all charts.
-2.0 -1.5 -1.0 -0.5 0.0 0.5 1.0 1.5 2.0 2.5 3.0-2.0
-1.5
-1.0
-0.5
0.0
0.5
1.0
1.5
2.0
2.5
3.0
AUS
AUT
BEL
CAN
DNK
FINFRA
DEU
GRC
ITA
JPNNLD
NLZ
NOR
PRT
ESP
SWE
SWZ
GBR
USA
1980s
Hours Growth (percent)
TFP
Gro
wth
(per
cent
)

15
1990s and 2000-2007
Dotted lines represent the averages over 1970-2007 on all charts.
-2.0 -1.5 -1.0 -0.5 0.0 0.5 1.0 1.5 2.0 2.5 3.0-2.0
-1.5
-1.0
-0.5
0.0
0.5
1.0
1.5
2.0
2.5
3.0
AUS
AUT
BEL
CAN
DNK
FIN
FRA
DEU
GRC
ITA
JPN
NLD
NLZ
NOR
PRT
ESP
SWE
SWZ
GBR USA
1990s
Hours Growth (percent)
TFP
Gro
wth
(per
cent
)
-2.0 -1.5 -1.0 -0.5 0.0 0.5 1.0 1.5 2.0 2.5 3.0-2.0
-1.5
-1.0
-0.5
0.0
0.5
1.0
1.5
2.0
2.5
3.0
AUS
AUT
BELCANDNK
FIN
FRA
DEU
GRC
ITA
JPN NLD
NLZ
NOR
PRT
SWE
SWZGBR
USA
2000-2007
Hours Growth (percent)
TFP
Gro
wth
(per
cent
)

16
Correlation of growth in TFP and hours varies by sector
(OECD 14)Industry Coefficient Constant Observations Adjusted R
Hotels and Restaurants -0.60** (0.26) 0.28 (0.49) 14 0.25
Manufacturing -0.46 (0.35) 1.19** (0.49) 14 0.05
Total Economy -0.37** (0.14) 0.74*** (0.12) 14 0.33
Other Services -0.35* (0.19) 0.11 (0.30) 14 0.15
Wholesale and Retail -0.33 (0.48) 1.31*** (0.40) 14 -0.04
Financial Services -0.23* (0.12) 0.39 (0.41) 14 0.18
Electricity -0.23 (0.26) 0.81** (0.30) 14 -0.02Agriculture, Forestry, and
Fishing -0.21 (0.31) 2.77*** (0.81) 14 -0.04
Construction -0.15 (0.19) 0.24 (0.25) 14 -0.03
Mining and Quarrying -0.13 (0.28) 0.43 (1.04) 14 -0.06
Transportation -0.11 (0.37) 1.37*** (0.42) 14 -0.08
Standard errors in parentheses. *** p<0.01, ** p<0.05, * p<0.1
Source: World KLEMS, EU KLEMS.
2
17
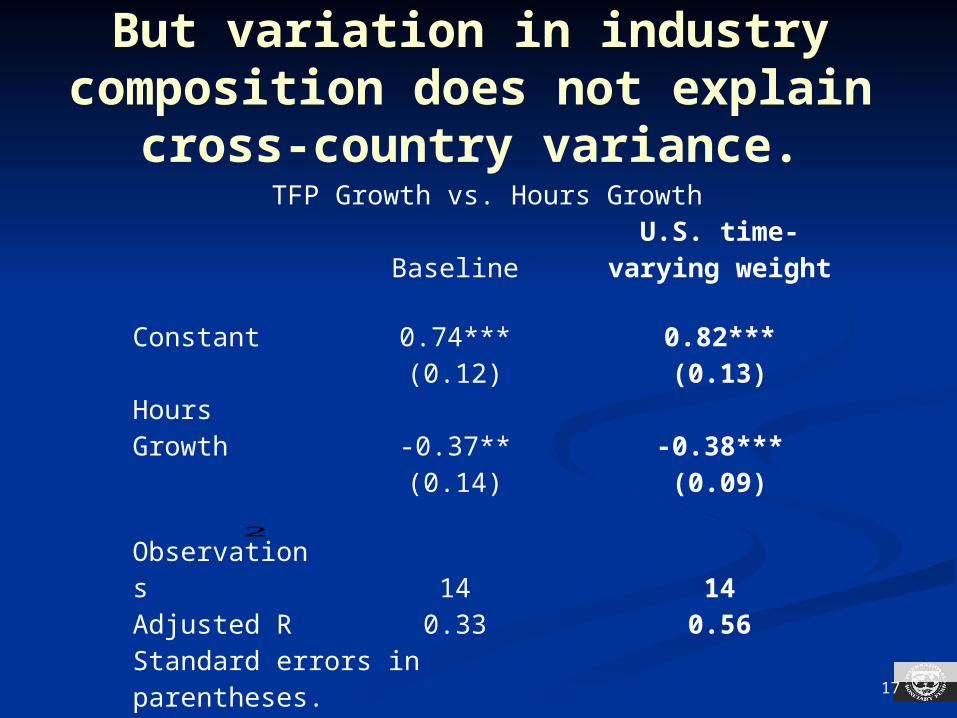
But variation in industry composition does not explain
cross-country variance.
2
TFP Growth vs. Hours Growth
BaselineU.S. time-varying
weight
Constant 0.74*** 0.82***(0.12) (0.13)
Hours Growth -0.37** -0.38***(0.14) (0.09)
Observations 14 14Adjusted R 0.33 0.56
Standard errors in parentheses.*** p<0.01, ** p<0.05, * p<0.1Sources: EU KLEMS, World KLEMS and authors’ calculations.

18
What could explain this negative correlation?
• Measurement error? Probably not. Measurement issues with TFP more relevant at cyclical frequencies.
Result does not depend on the database used (TED, World/EU KLEMS)
Country mix of TFP and hours growth is relatively stable over time.
Result holds within industry/country pair.
• TFP as a choice variable: Given the availability of labor inputs, TFP growth is “chosen”.

19
Causality: hypothesis • Factor endowment not only affects the choice of capital or labor-intensive technologies but also how much to invest in techniques and processes that boost TFP.
• Given that productivity innovations are costly, countries with abundant labor supply may “choose” less productivity growth.
• Test: Is there a causality going from labor supply shocks to TFP growth?

Causality: strategy
20
• Find variables that affect TFP growth only through the decision of hiring labor.• Use these variables as instruments in regressions linking TFP growth to hours growth.• Good candidates:
Tax wedge: differences in taxes influence labor supply and introduce a gap between MRS and MPL (Prescott, 2004, and Ohanian et al., 2007).
Population growth: availability of labor input.

21
Causality: IV regressions using tax wedge and population growth
Step 1- Dependent variable -- Hours GrowthConstant -2.42** -0.55***
(1.00) (0.16)Average Tax Wedge 4.52**
(1.60)Population Growth 1.80***
(0.24)Step 2- Dependent variable -- TFP Growth
Constant 1.22*** 1.07***(0.11) (0.11)
Predicted Hours Growth -0.71*** -0.47***
(0.19) (0.15)Observations 15 20Standard errors in parentheses. *** p<0.01, ** p<0.05, * p<0.1
Time period spans 1970-2007.Sources: Total Economy Database, McDaniel tax data.
22
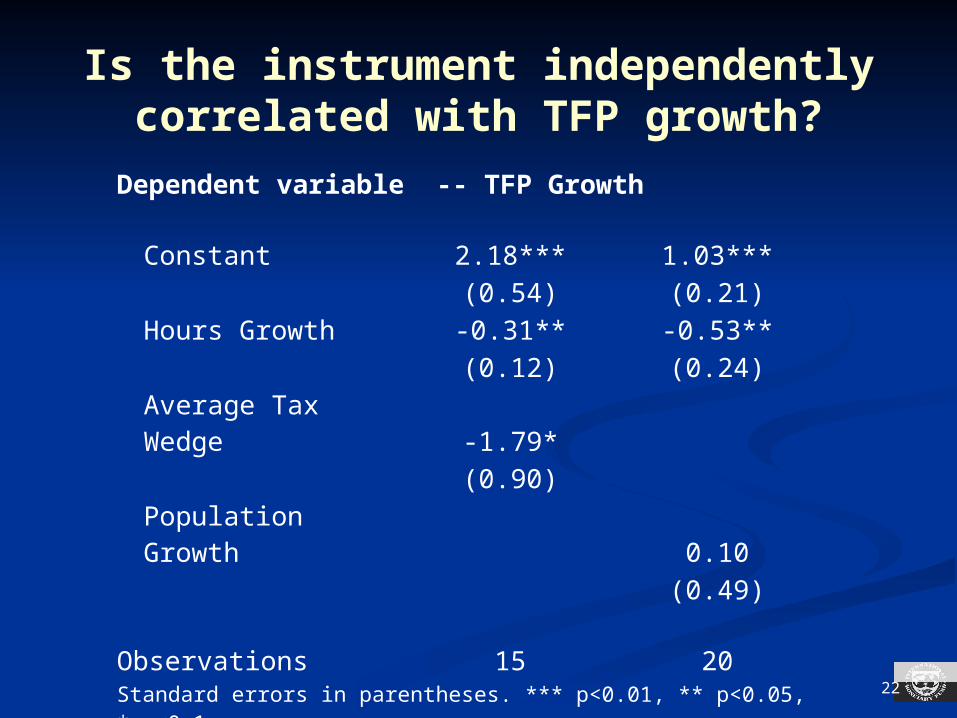
Is the instrument independently correlated with TFP growth?
Dependent variable -- TFP Growth
Constant 2.18*** 1.03***(0.54) (0.21)
Hours Growth -0.31** -0.53**(0.12) (0.24)
Average Tax Wedge -1.79*(0.90)
Population Growth 0.10(0.49)
Observations 15 20Standard errors in parentheses. *** p<0.01, ** p<0.05, * p<0.1
Time period spans 1970-2007.
Sources: Total Economy Database, McDaniel tax data.
23
Conclusions
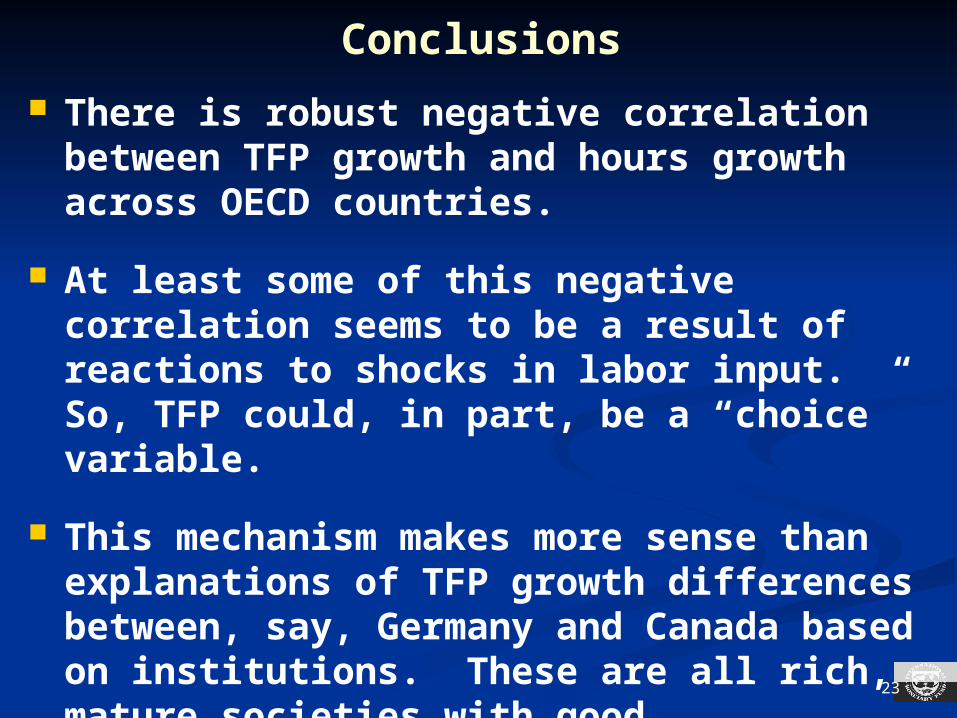
There is robust negative correlation between TFP growth and hours growth across OECD countries.
At least some of this negative correlation seems to be a result of reactions to shocks in labor input. So, TFP could, in part, be a “choice” variable.
This mechanism makes more sense than explanations of TFP growth differences between, say, Germany and Canada based on institutions. These are all rich, mature societies with good institutions.
The endogeneity of TFP could also help explain longer-run developments in Europe and Canada.
24
Conclusions
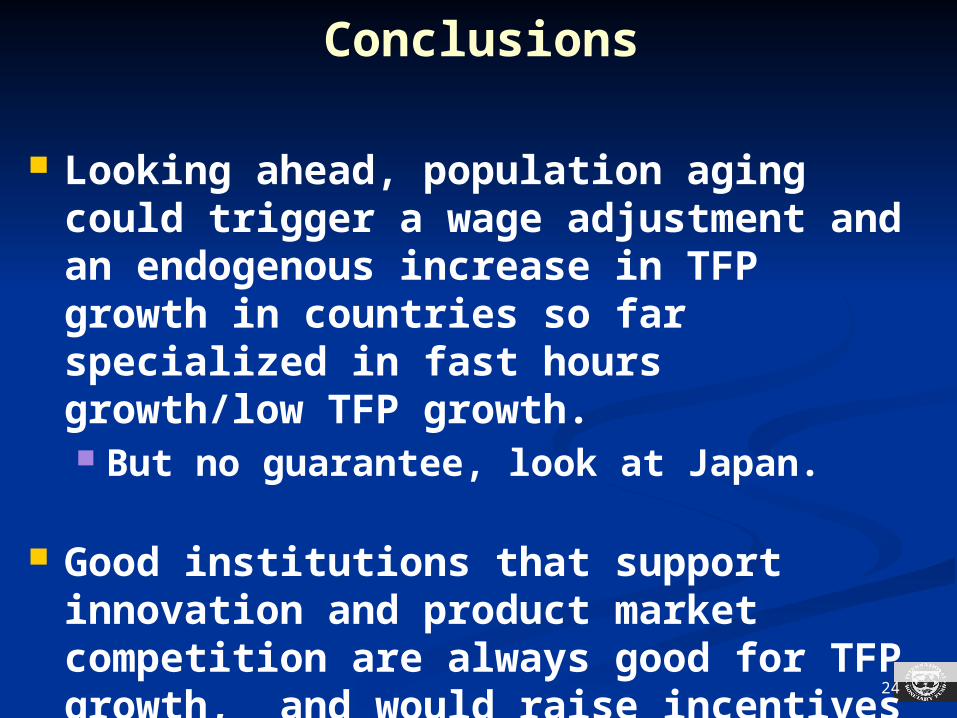
Looking ahead, population aging could trigger a wage adjustment and an endogenous increase in TFP growth in countries so far specialized in fast hours growth/low TFP growth. But no guarantee, look at Japan.
Good institutions that support innovation and product market competition are always good for TFP growth, and would raise incentives to be more productive and ease transition.

25
Thanks!

26
-7
0
7
14
-7
0
7
14
1950 1960 1970 1980 1990 2000
G-7 Countries*: Real GDP** Growth(percent)
Canada France
Germany Italy
United Kingdom United States
Japan
* German data prior to 1987 are for West Germany. ** Converted to constant 1990 dollars using Geary-Khamis PPP weights.Source: The Conference Board Total Economy Database, January 2010.

27
TFP Growth vs. Hours Growth by Sector (G7)
Industry Coefficient Constant Observations Adjusted R
Hotels and Restaurants -0.99** (0.27) 1.07* (0.50) 7 0.67
Other Services -0.72 (0.36) 0.72 (0.50) 7 0.33
Manufacturing -0.48*** (0.12) 1.12*** (0.19) 7 0.73
Wholesale and Retail -0.49 (0.48) 1.74*** (0.39) 7 0.01
Total Economy -0.47** (0.15) 0.78*** (0.11) 7 0.59
Electricity -0.42 (0.44) 0.41 (0.47) 7 -0.02
Construction -0.35 (0.38) 0.02 (0.43) 7 -0.03
Mining and Quarrying -0.18 (0.24) -1.20 (0.96) 7 -0.08
Agriculture, Forestry, Fishing -0.17 (0.66) 3.06 (1.86) 7 -0.19
Transportation 0.16 (0.69) 0.98 (0.79) 7 -0.19
Financial Services -0.16 (0.19) 0.075 (0.60) 7 -0.06
Standard errors in parentheses. *** p<0.01, ** p<0.05, * p<0.1
Source: World KLEMS, EU KLEMS.
2

28
Results: Using Tax Wedge as an Instrument for HoursStep 1 Regression
Hours Growth vs. Average Tax Wedge† by PeriodDecades 1970-2007 1970s 1980s 1990s 2000-2007 Constant -2.42** -4.21** -2.88* -1.61 -0.23 (1.00) (1.82) (1.35) (1.19) (1.33)Average Tax Wedge 4.52** 6.15** 5.51** 3.23 1.82 (1.60) (2.69) (2.14) (1.96) (2.21) Observations 15 15 15 15 15Adjusted R 0.33 0.23 0.29 0.11 -0.02
† Equal to (1- tax rate on labor income)/(1 + tax rate on consumption expenditures)
Step 2 Regression
TFP Growth vs. Predicted Hours Growth by PeriodDecades 1970-2007 1970s 1980s 1990s 2000-2007 Constant 1.22*** 1.73*** 1.08*** 0.75*** 1.46 (0.11) (0.16) (0.20) (0.17) (0.84)Predicted Hours Growth -0.71*** -0.83*** -0.37 -0.73* -1.13 (0.19) (0.27) (0.26) (0.37) (0.97) Observations 15 15 15 15 15Adjusted R 0.49 0.37 0.07 0.17 0.09
2
2

29
TFP Growth vs. Hours Growth and Average Tax WedgePeriods 1970-2007 1970s 1980s 1990s 2000-2007
Constant 2.18*** 3.55*** 0.63 1.69* 1.59*
(0.54) (1.09) (0.67) (0.79) (0.79)
Hours Growth -0.31** -0.40** -0.53*** -0.14 -0.56***
(0.12) (0.14) (0.12) (0.17) (0.17)
Average Tax Wedge -1.79* -2.66 0.86 -1.89 -1.03
(0.90) (1.60) (1.11) (1.34) (1.35)
Observations
15 15 15 15 15
Adjusted R 0.64 0.60 0.63 0.14 0.46
Standard errors in parentheses. *** p<0.01, ** p<0.05, * p<0.1
2
30
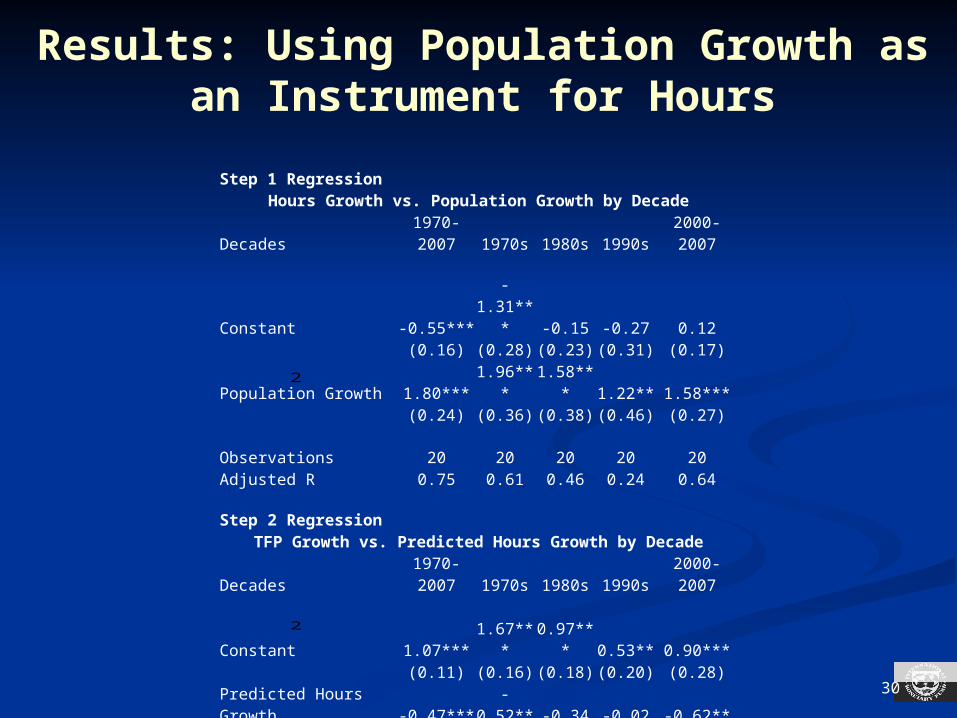
Step 1 RegressionHours Growth vs. Population Growth by Decade
Decades 1970-2007 1970s 1980s 1990s 2000-2007
Constant -0.55*** -1.31*** -0.15 -0.27 0.12(0.16) (0.28) (0.23) (0.31) (0.17)
Population Growth 1.80*** 1.96*** 1.58*** 1.22** 1.58***(0.24) (0.36) (0.38) (0.46) (0.27)
Observations 20 20 20 20 20Adjusted R 0.75 0.61 0.46 0.24 0.64
Step 2 RegressionTFP Growth vs. Predicted Hours Growth by Decade
Decades 1970-2007 1970s 1980s 1990s 2000-2007 Constant 1.07*** 1.67*** 0.97*** 0.53** 0.90***
(0.11) (0.16) (0.18) (0.20) (0.28)Predicted Hours Growth -0.47*** -0.52** -0.34 -0.02 -0.62**
(0.15) (0.20) (0.21) (0.34) (0.25)
Observations 20 20 20 20 20Adjusted R 0.33 0.24 0.07 -0.06 0.21
2
2
Results: Using Population Growth as an Instrument for Hours

31
TFP Growth vs. Hours Growth and Population Growth
Decade 1970-2007 1970s 1980s 1990s 2000-2007
Constant 1.03*** 1.52*** 0.94*** 0.47 0.90***
(0.21) (0.39) (0.18) (0.28) (0.24)
Hours Growth -0.53** -0.63*** -0.48** -0.25 -0.65*
(0.24) (0.22) (0.18) (0.21) (0.33)
Population Growth 0.10 0.22 0.22 0.28 0.04
(0.49) (0.54) (0.41) (0.48) (0.63)
Observations
20 20 20 20 20
Adjusted R 0.45 0.46 0.31 -0.03 0.32
Standard errors in parentheses. *** p<0.01, ** p<0.05, * p<0.1
2