Productivity is The Most Important Determinant of Living Standard of Group, Nation, Planet
35
Please stay tuned for today’s webinar The presentation will begin at 2:00 p.m. ET Before the event starts: • If you are unable to hear music at this time, please make sure your computer speakers are on and that your system has not been muted. • Please disable any pop-up blocking software. • If you experience technical problems, please click the “Help” button below. A Closer Look at Unit Cost and Labor's Role in Driving Productivity
-
Upload
ivy-lee -
Category
Engineering
-
view
372 -
download
3
Transcript of Productivity is The Most Important Determinant of Living Standard of Group, Nation, Planet

Please stay tuned for today’s webinar
The presentation will begin at 2:00 p.m. ET Before the event starts:
• If you are unable to hear music at this time, please make sure your computer speakers are on and that your system has not been muted.
• Please disable any pop-up blocking software. • If you experience technical problems, please click the “Help” button below.
A Closer Look at Unit Cost and Labor's Role in Driving Productivity

December 8, 2015
A Closer Look at Unit Cost and Labor's Role in Driving Productivity

Housekeeping items
• Questions • Please ask questions! • Use the Ask a question box on your screen • Don’t wait until the end – send them throughout the presentation
• Watch it again later • You will receive an email when a recording of today’s session is available • It will also be posted on the IndustryWeek.com website

Ask a question
On your screen at startup
Adjust slides
Volume control
Speaker info
The widget bar
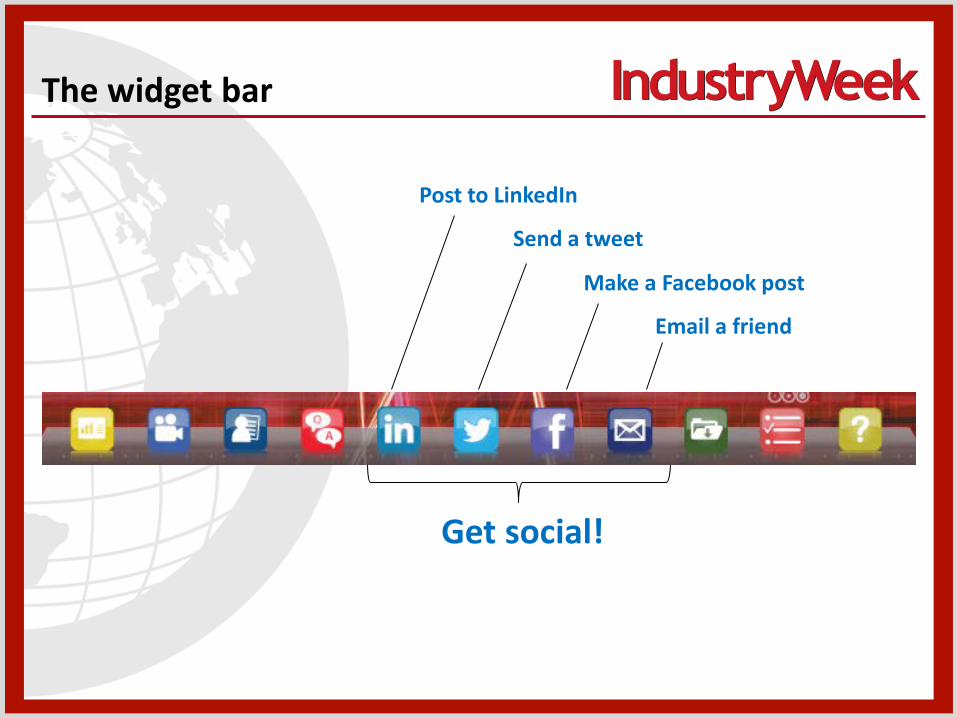
Email a friend
Send a tweet
Make a Facebook post
Post to LinkedIn
Get social!
The widget bar
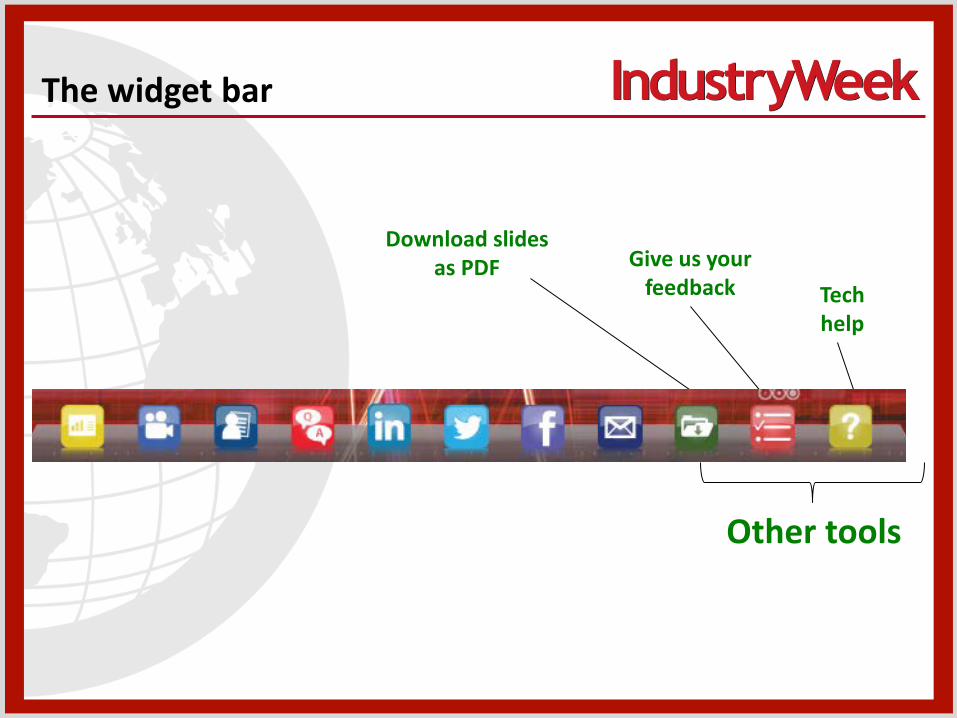
Give us your feedback
Download slides as PDF
Other tools
Tech help
The widget bar
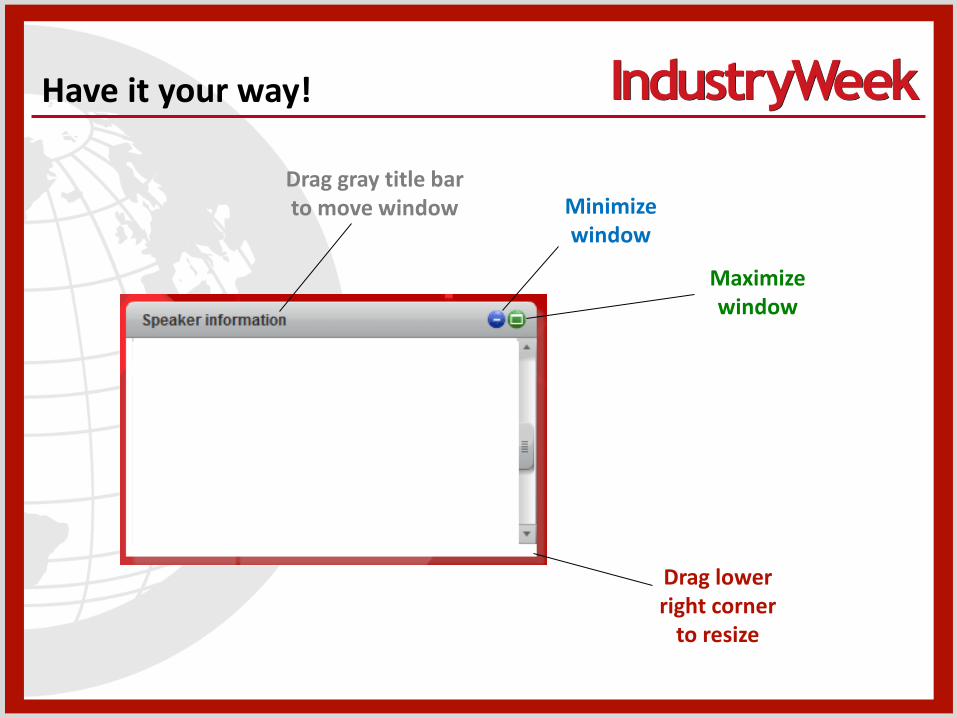
Maximize window
Minimize window
Drag lower right corner
to resize
Drag gray title bar to move window
Have it your way!

If you have issues with the audio or the slides stop advancing, press the F5 key to refresh your webinar window.
The F5 key

1 © KRONOS INCORPORATED December 7, 2015 © KRONOS INCORPORATED December 7, 2015
Webinar: A Closer Look at Unit Cost and Labor’s Role in Driving Productivity
8 December 2015 Charlie DeWitt – VP Business Development

2 © KRONOS INCORPORATED December 7, 2015
Today’s story
• Labor productivity: The macroeconomic elixir – The key to growth – Drives consumption and creates a stable society – Provides a global competitive economic shield
• Understanding labor productivity at the microeconomic level: Unit Cost – Direct cost – Indirect cost – Units
• What you can do – Look at labor differently – Read Lean Labor – Talk with us

3 © KRONOS INCORPORATED December 7, 2015
Productivity is the most important determinant of standard of living of a group of people, a nation or a planet1
Bill Conerly, Forbes, May 19, 2015 Conference Board Competitive Brief 2015
• Sustainable Middle Class • Global Competitiveness

4 © KRONOS INCORPORATED December 7, 2015
Some global perspective
The United States has the highest productivity in the world at 66 US$ per hour
Productivity is the shield against low cost labor
competition

5 © KRONOS INCORPORATED December 7, 2015
A macroeconomic view of labor productivity and unit cost
Labor Wage Rate
Labor Productivity
Unit Labor Cost
$
Labor Hour
GDP or Output or Units
Labor Hour
Labor Wage Rate
Labor Productivity
$
Unit

6 © KRONOS INCORPORATED December 7, 2015
When it comes to labor there are two approaches and four options for driving profitability and growth
• Approach #1: Reduce labor costs – Choice #1: Chase low labor cost regions
– Choice #2: Hold down labor rates
• Approach #2: Improve labor productivity – Choice #3: Plant and Equipment
– Choice #4: Workforce Management
Unsustainable
Unwise or Impossible
Expensive & Inflexible
Competitive Advantage
7 © KRONOS INCORPORATED December 7, 2015
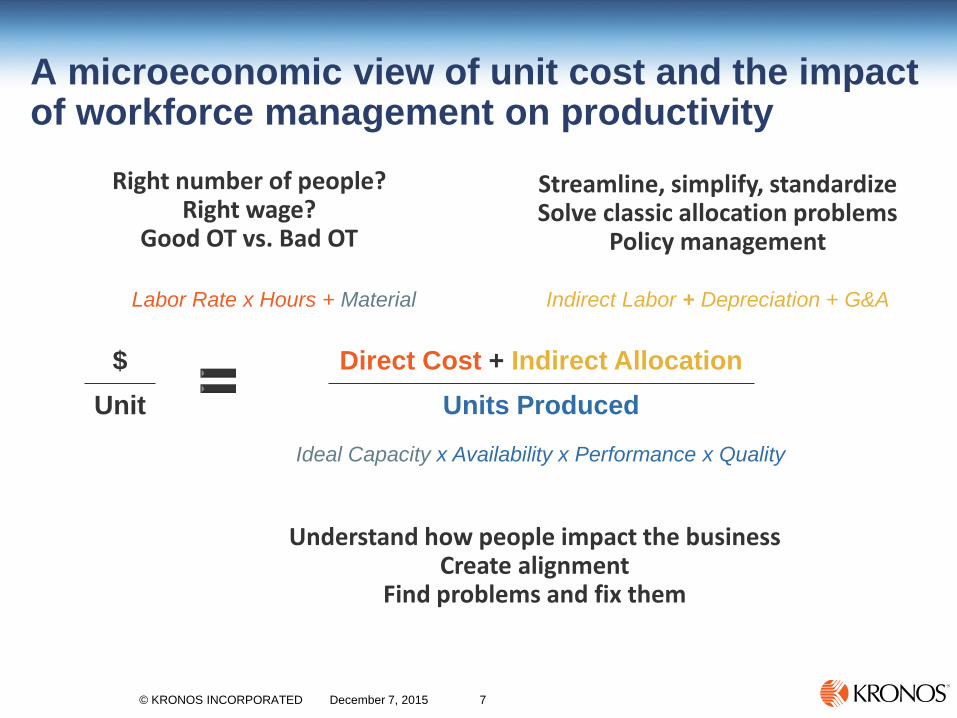
A microeconomic view of unit cost and the impact of workforce management on productivity
$ Unit
Direct Cost + Indirect Allocation Units Produced
Labor Rate x Hours + Material Indirect Labor + Depreciation + G&A
Ideal Capacity x Availability x Performance x Quality
Right number of people? Right wage?
Good OT vs. Bad OT
Streamline, simplify, standardize Solve classic allocation problems
Policy management
Understand how people impact the business Create alignment
Find problems and fix them
8 © KRONOS INCORPORATED December 7, 2015
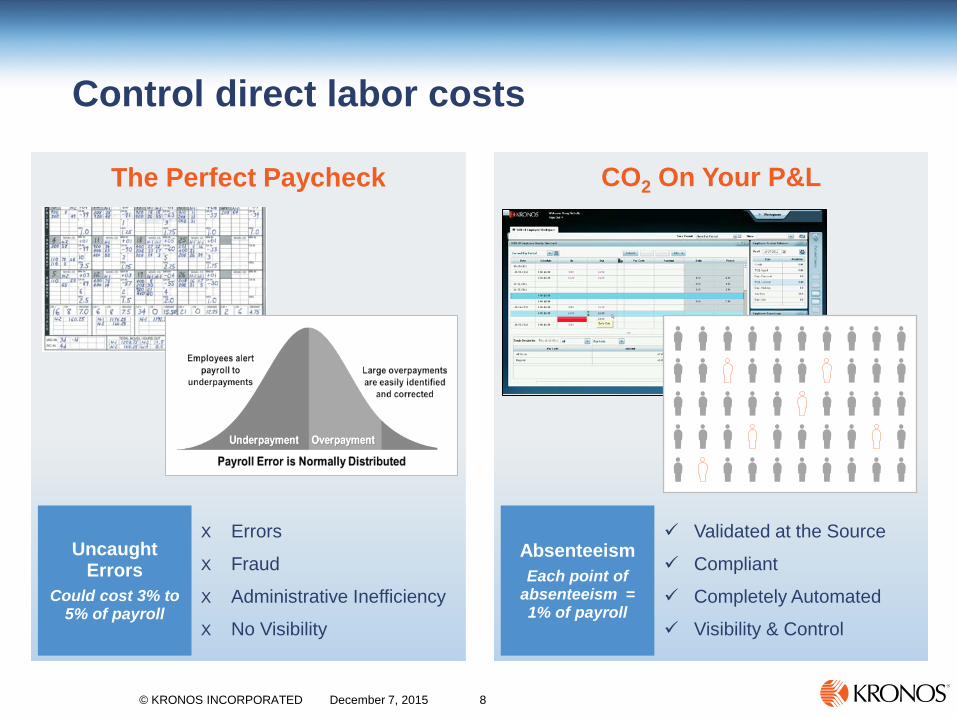
Control direct labor costs
The Perfect Paycheck CO2 On Your P&L
Х Errors
Х Fraud
Х Administrative Inefficiency
Х No Visibility
Validated at the Source
Compliant
Completely Automated
Visibility & Control
Absenteeism Each point of
absenteeism = 1% of payroll
Uncaught Errors
Could cost 3% to 5% of payroll

9 © KRONOS INCORPORATED December 7, 2015
Strategic HR: A long term plan for the right number and mix of people
• Full time – Min/max hours – Wage rate & benefits – Productivity – OT options
• Part time/Contract – Min/max hours – Wage rates – Productivity loss – Cost of acquiring/letting go
• Factors – Absenteeism – Turnover – Attrition
Benefits: • Simple analysis • Counter-intuitive insights • Clear definitions • Clear expectations • What if policy analysis • Confidence going forward
0%
50%
100%
150%
200%
1 5 9 13 17 21 25 29 33 37 41 45 49 53 57 61 65
Volu
me
Week
Strategic FT/PT Plan: MTO Environment
OT
Contract
PT
FT
Demand

10 © KRONOS INCORPORATED December 7, 2015
The difference between good overtime and bad overtime
• Multi-national electronics component manufacturer
• Significant multi-location China operations

11 © KRONOS INCORPORATED December 7, 2015
Old Way New Way
= 8 Hours Job # 1
Job # 2
Job # 3
Job # 4
• Wait time • Training • Breaks • Late INs • Early OUTs • Absence • Unallocated • Administrative
Direct Labor Indirect Labor
Х No information about individuals
Х No tools for staffing
Х No insight into individual productivity
Insight into labor productivity
Alerts to problems / bottlenecks
Detailed labor costing
Better staffing decisions
“Who came to work?” “Who / What is impacting the bottom-line?”
Understand how labor impacts your business
12 © KRONOS INCORPORATED December 7, 2015
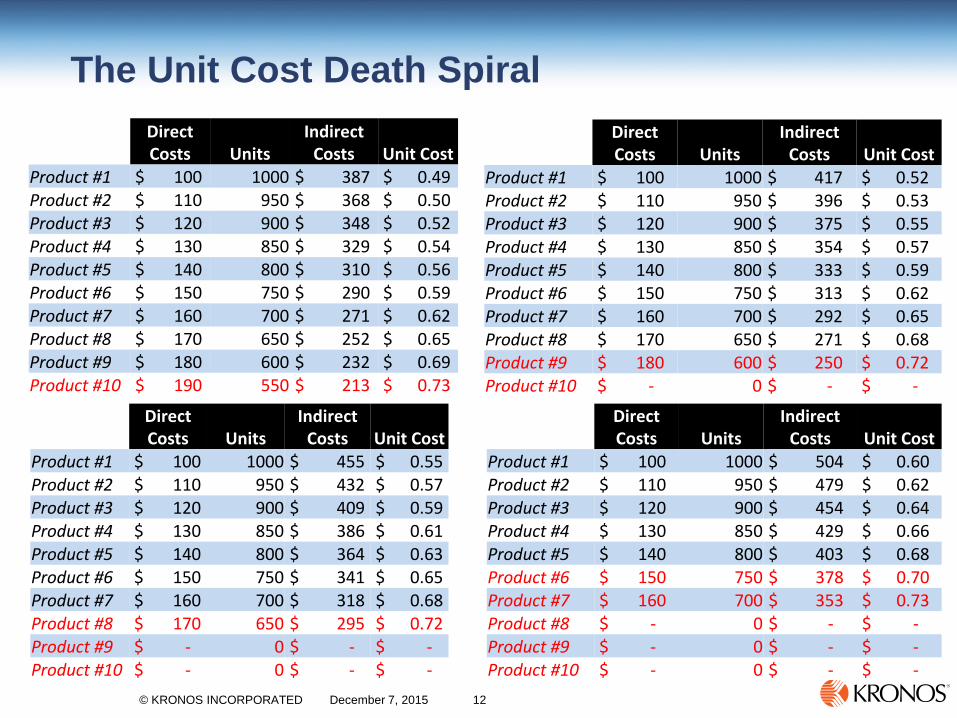
The Unit Cost Death Spiral Direct Costs Units
Indirect Costs Unit Cost
Product #1 $ 100 1000 $ 387 $ 0.49 Product #2 $ 110 950 $ 368 $ 0.50 Product #3 $ 120 900 $ 348 $ 0.52 Product #4 $ 130 850 $ 329 $ 0.54 Product #5 $ 140 800 $ 310 $ 0.56 Product #6 $ 150 750 $ 290 $ 0.59 Product #7 $ 160 700 $ 271 $ 0.62 Product #8 $ 170 650 $ 252 $ 0.65 Product #9 $ 180 600 $ 232 $ 0.69 Product #10 $ 190 550 $ 213 $ 0.73
Direct Costs Units
Indirect Costs Unit Cost
Product #1 $ 100 1000 $ 417 $ 0.52 Product #2 $ 110 950 $ 396 $ 0.53 Product #3 $ 120 900 $ 375 $ 0.55 Product #4 $ 130 850 $ 354 $ 0.57 Product #5 $ 140 800 $ 333 $ 0.59 Product #6 $ 150 750 $ 313 $ 0.62 Product #7 $ 160 700 $ 292 $ 0.65 Product #8 $ 170 650 $ 271 $ 0.68 Product #9 $ 180 600 $ 250 $ 0.72 Product #10 $ - 0 $ - $ -
Direct Costs Units
Indirect Costs Unit Cost
Product #1 $ 100 1000 $ 455 $ 0.55 Product #2 $ 110 950 $ 432 $ 0.57 Product #3 $ 120 900 $ 409 $ 0.59 Product #4 $ 130 850 $ 386 $ 0.61 Product #5 $ 140 800 $ 364 $ 0.63 Product #6 $ 150 750 $ 341 $ 0.65 Product #7 $ 160 700 $ 318 $ 0.68 Product #8 $ 170 650 $ 295 $ 0.72 Product #9 $ - 0 $ - $ - Product #10 $ - 0 $ - $ -
Direct Costs Units
Indirect Costs Unit Cost
Product #1 $ 100 1000 $ 504 $ 0.60 Product #2 $ 110 950 $ 479 $ 0.62 Product #3 $ 120 900 $ 454 $ 0.64 Product #4 $ 130 850 $ 429 $ 0.66 Product #5 $ 140 800 $ 403 $ 0.68 Product #6 $ 150 750 $ 378 $ 0.70 Product #7 $ 160 700 $ 353 $ 0.73 Product #8 $ - 0 $ - $ - Product #9 $ - 0 $ - $ - Product #10 $ - 0 $ - $ -
13 © KRONOS INCORPORATED December 7, 2015
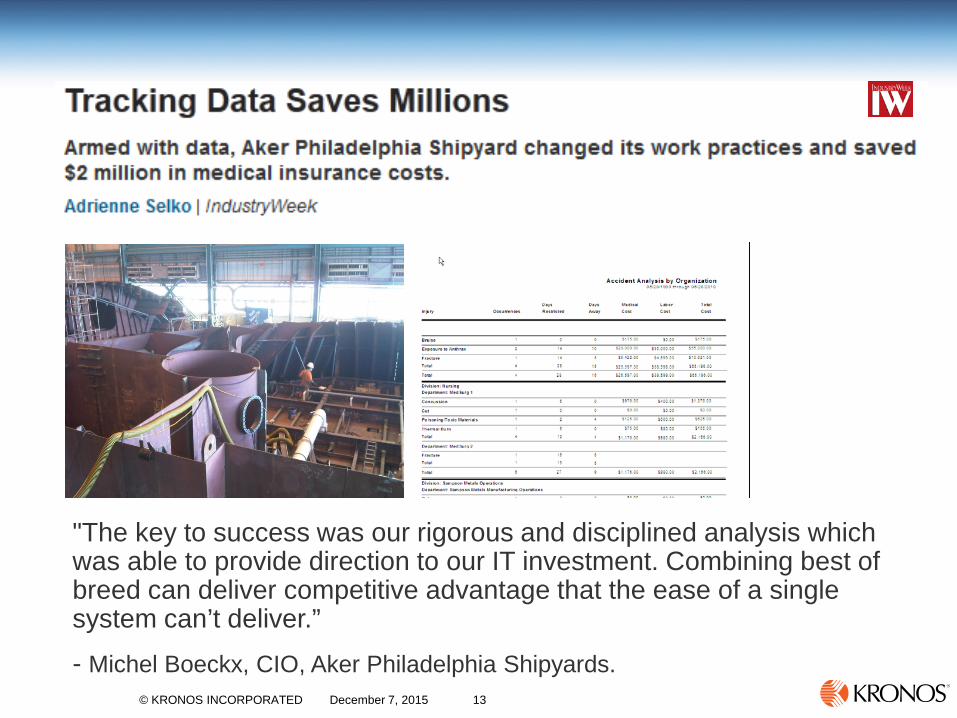
"The key to success was our rigorous and disciplined analysis which was able to provide direction to our IT investment. Combining best of breed can deliver competitive advantage that the ease of a single system can’t deliver.”
- Michel Boeckx, CIO, Aker Philadelphia Shipyards.

14 © KRONOS INCORPORATED December 7, 2015
It is now possible to “see” The cost of data collection has plummeted and the ability to analyze it expanded
Equipment Availability What equipment?
Scheduled time
Run time
Materials Type of material?
Cost
Amount
Equipment Performance What equipment?
Standard rate
Actual rate achieved
Quality Which work order?
Total units produced
Good units produced
Before
8 hours? Doing what?
Data in Silos Poor integration
Labor not tracked Direct vs. Indirect
Productivity & Impact
1,000s of Work Orders Millions of data elements
15 © KRONOS INCORPORATED December 7, 2015
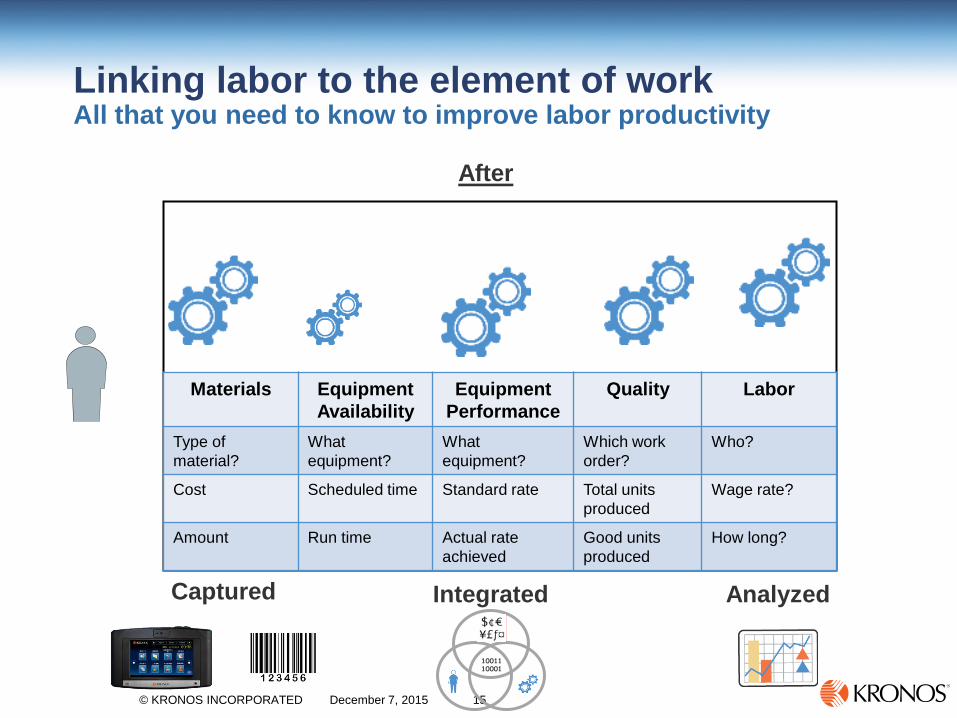
Linking labor to the element of work All that you need to know to improve labor productivity
After
Captured Integrated Analyzed
Materials Equipment Availability
Equipment Performance
Quality Labor
Type of material?
What equipment?
What equipment?
Which work order?
Who?
Cost Scheduled time Standard rate Total units produced
Wage rate?
Amount Run time Actual rate achieved
Good units produced
How long?
10011 10001
16 © KRONOS INCORPORATED December 7, 2015
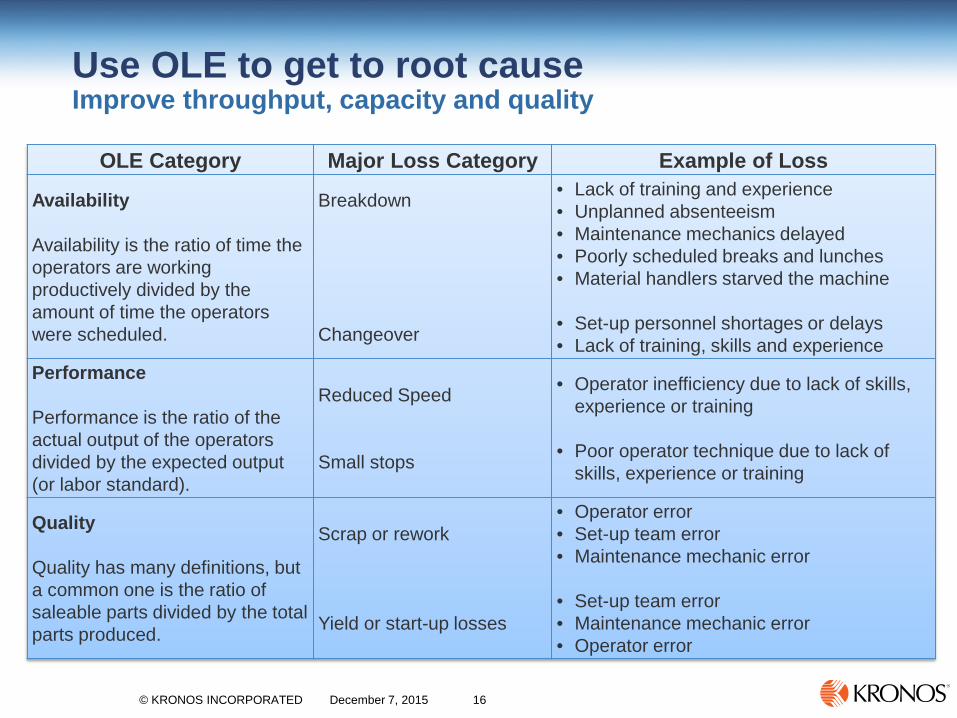
Use OLE to get to root cause Improve throughput, capacity and quality
OLE Category Major Loss Category Example of Loss
Availability Availability is the ratio of time the operators are working productively divided by the amount of time the operators were scheduled.
Breakdown Changeover
• Lack of training and experience • Unplanned absenteeism • Maintenance mechanics delayed • Poorly scheduled breaks and lunches • Material handlers starved the machine
• Set-up personnel shortages or delays • Lack of training, skills and experience
Performance Performance is the ratio of the actual output of the operators divided by the expected output (or labor standard).
Reduced Speed Small stops
• Operator inefficiency due to lack of skills, experience or training
• Poor operator technique due to lack of skills, experience or training
Quality Quality has many definitions, but a common one is the ratio of saleable parts divided by the total parts produced.
Scrap or rework Yield or start-up losses
• Operator error • Set-up team error • Maintenance mechanic error
• Set-up team error • Maintenance mechanic error • Operator error

17 © KRONOS INCORPORATED December 7, 2015
Manage floating bottlenecks in the moment
• Uncovered capacity equal to 50 extra people
• No change on the floor = continued delivery of differentiated service
• Fueled 15% year over year growth of the company
Results Achieved
Major US based electronics components
distributor
18 © KRONOS INCORPORATED December 7, 2015
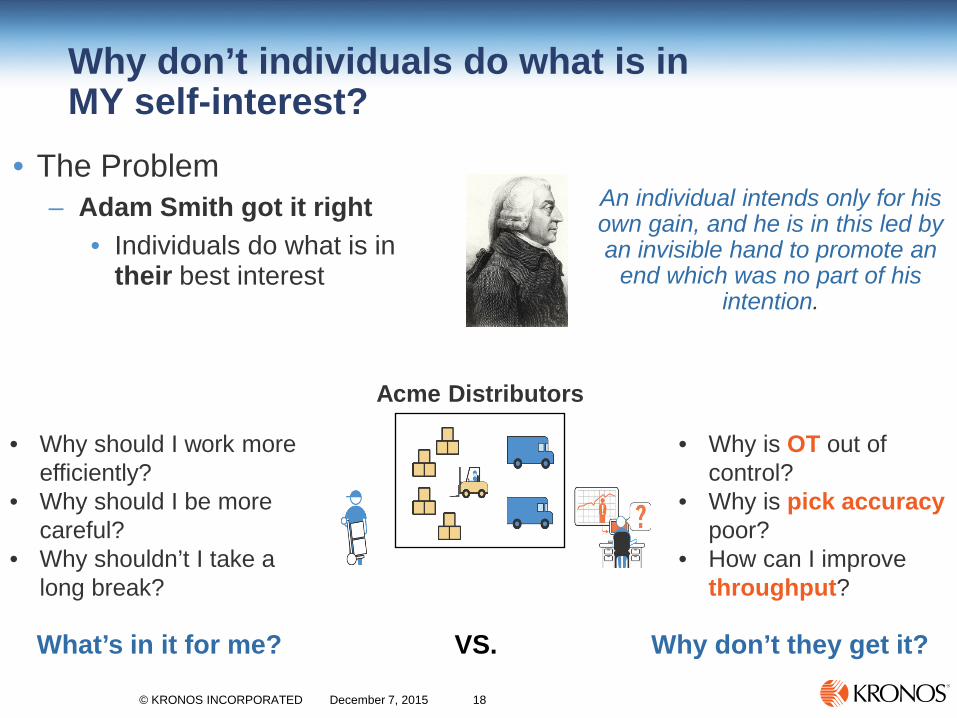
Why don’t individuals do what is in MY self-interest?
• The Problem – Adam Smith got it right
• Individuals do what is in their best interest
An individual intends only for his own gain, and he is in this led by an invisible hand to promote an
end which was no part of his intention.
Acme Distributors
• Why should I work more efficiently?
• Why should I be more careful?
• Why shouldn’t I take a long break?
• Why is OT out of control?
• Why is pick accuracy poor?
• How can I improve throughput?
What’s in it for me? Why don’t they get it? VS.

19 © KRONOS INCORPORATED December 7, 2015
Mythical(?) alignment solutions
• What if the individual benefited when their work contributed to the company’s success? – Profit-sharing: Difficult due to “free-rider” and uncontrollables – MBO: Difficult due to subjective nature – Punishment: Get more flies with honey than vinegar – Incentive pay: Too hard to do… too much granular data needed
Acme Distributors

20 © KRONOS INCORPORATED December 7, 2015
What if you could align what INDIVIDUALS do to the interests of the business?
Acme Distributors
Worker Benefit Incentive Pay Option Company Benefit Make more money than they would by picking up casual OT
Pay individuals based on orders they process per day
• Improved throughput • Reduced OT
Safer, more efficient drivers make significantly more money
Pay drivers based on performance against delivery standards
• Increased deliveries per day • Reduced safety incidents
Careful workers make significantly more money
Pay individuals for their pick accuracy
• Reduce rework costs • Improved customer sat
Verifiable performance at the individual level is required to align individual’s interest with the company’s interest

21 © KRONOS INCORPORATED December 7, 2015
Example
• Wholesale food distributor
• Multiple incentive pay plans – Pick accuracy
– Driver delivery
– Orders processed
• 10% productivity improvement
• Doubled case volume throughput
Individuals can possibly add $10 per hour to their pay, but in return there are higher expectations from those people

22 © KRONOS INCORPORATED December 7, 2015
Many other examples
• Labor cost variance
• Order to cash in field service operations
• Preventative maintenance through labor tracking
• True product costing

23 © KRONOS INCORPORATED December 7, 2015
What can you do next?
• Think about how your people impact all aspects of your business – Use your imagination. Endless
opportunity.
• Read Lean Labor – An approachable overview of
specific ways you can think about labor differently and do something about it
• Contact Kronos – Business Assessment – Labor Data Exploration

24 © KRONOS INCORPORATED December 7, 2015
Q&A
25 © KRONOS INCORPORATED December 7, 2015
THANK YOU
Kronos is the global leader in delivering workforce management solutions in the cloud. Tens of thousands of organizations in more
than 100 countries — including more than half of the Fortune 1000® — use Kronos to control labor costs, minimize compliance
risk, and improve workforce productivity. Learn more about Kronos industry-specific time and attendance, scheduling, absence
management, HR and payroll, hiring, and labor analytics applications at www.kronos.com.
Kronos: Workforce Innovation That Works™.
For more information contact your Kronos representative,
call (800) 225-1561 or visit www.kronos.com.

Question and Answer Session • Use the Ask a question box at the left of your screen
• We want your feedback! Please take the survey located on the
bottom left corner of your screen
Plug into IW’s Manufacturing Social Synergy Swap success stories, ask questions and get answers, network with peers,
and get the inside scoop on what’s happening in your industry. http://www.industryweek.com/Twitter http://www.industryweek.com/Facebook
http://www.industryweek.com/LinkedIn

Please Stand By…