PRODUCTIVITY IN THE SERVICES SECTOR - … · Productivity in the Services Sector By ... exist among...
26
PRODUCTIVITY IN THE SERVICES SECTOR Jack E. Triplett and Barry P. Bosworth Brookings Institution 1775 Massachusetts Ave, NW Washington, D.C. 20036 email: [email protected] Prepared for: American Economic Association January 7-9, 2000 Boston, Mass. Session on Productivity in Services January 9, 8:00 a.m.
Transcript of PRODUCTIVITY IN THE SERVICES SECTOR - … · Productivity in the Services Sector By ... exist among...

PRODUCTIVITY IN THE SERVICES SECTOR
Jack E. Triplett and Barry P. Bosworth
Brookings Institution
1775 Massachusetts Ave, NW
Washington, D.C. 20036
email: [email protected]
Prepared for:
American Economic AssociationJanuary 7-9, 2000Boston, Mass.
Session onProductivity in ServicesJanuary 9, 8:00 a.m.

2
revised: 1/05/00Productivity in the Services Sector
ByJack Triplett and Barry Bosworth
Brookings Institution
I. Overview and introduction
From 1949 to 1973, the Bureau of Labor Statistics (BLS) estimates that U.S. non-farmmultifactor productivity grew at 1.9% per year. After 1973, multifactor productivity grew only 0.2% peryear (table 1). Despite a 20-year intensive research effort to find the cause, no convincing explanation ofthe post-1973 productivity slowdown exists.
Whatever the ultimate cause, circumstantial evidence suggests that services industries play someimportant role in the slowdown. In the first place, the aggregate numbers indicate that the productivityslowdown is greater in the non-goods producing portions of the economy. While no official estimate ofproductivity in services is published by the BLS, nonfarm multifactor productivity slowed by 1.7percentage points (from 1.9% per year to 0.2%), and manufacturing productivity fell by 0.6 percentagepoints (from 1.5% per year to 0.9%). Because manufacturing accounts for about 22% of non-farmbusiness, this implies a 2 percentage point slowdown in the non-manufacturing sector.1
If the data are right, one might infer, as did Baumol (1967) many years ago, that productivityimprovements in services are harder to achieve than in goods producing industries. If so, the shift of theeconomy toward a larger share of services implies a reduction in the national rate of productivityimprovement.
But this view of manufacturing and services is undoubtedly too simple. Substantial disparitiesexist among productivity growth rates within the manufacturing sector and also within the non-manufacturing sector. It simply is not true that all individual services industries have productivity growthrates that are lower than all individual manufacturing industries, or even below the average formanufacturing industries.
But more importantly, perhaps, the data may not be right. One popular hypothesis about theproductivity slowdown is that it is a product of mismeasurement. According to this hypothesis, themismeasurement of output contributes to the productivity slowdown because an increasing portion ofoutput is not captured in the basic statistics.
Again, circumstantial evidence points to the services industries. Griliches (1994) pointed out thatsome of the services industries whose productivity growth rates in the 1947-1973 era were as high orhigher than productivity growth in manufacturing industries had, since 1973, much lower productivityimprovements. Additionally, the productivity slowdown has been particularly intense in servicesindustries where output is hard to measure--health services, for example, have the greatest laborproductivity slowdown of any industry in table 2, and both banking and health services have largemultifactor productivity slowdowns (see table 3). This points again to possible mismeasurement.
1 The nonfarm multifactor productivity numbers are due for revision in the near future, to incorporate the revisionsto GDP that were released in October, 1999. This will undoubtedly raise the non-goods estimate but not themanufacturing productivity estimate, because the productivity numbers published by the BLS for the nonfarm andmanufacturing sectors are based on different data and underlying output concepts.

3
Another puzzle involves computers. The 1992 capital flow table shows the purchases, byindustry, of computer equipment (Bonds and Aylor, 1998). The five industries that are the largestpurchases of computers are all services--in order, financial services, wholesale trade, business services,insurance, and communications. Those five services industries account for more than 50 per cent of USinvestment in computers. Within these industries computers have created new forms of service outputthat may not be fully captured in the statistics. An example is the growth of ATM machines in banks thatreduce the time spent waiting in line for teller transactions, make the transactions available on weekends,and have, with computer-assisted verification systems for credit card purchases, virtually eliminated theneed to carry traveler’s checks on foreign travel to many countries. Prior to the 1999 revisions to GDP,ATM usage was not reflected in the measure of banking output in the national accounts.
In all of these services industries, conceptual and empirical problems in measuring output andprices are notorious: For example, an economic consulting firm is part of the business services industry.How do we measure the output of an economic consulting firm? How would we construct a price indexfor economic consulting? And how would we compute the productivity of economists? The science ofeconomics is no closer to developing methods for measuring the output of economists’ own activitiesthan it is for measuring the output of banks, law firms, and insurance agents. All of these services posesdifficult problems for constructing price indexes and real output measures and therefore for measuringproductivity.
This paper gives a progress report of a project we are conducting, with collaborators, on servicesector output and productivity. Its major message is that there is no central theme to the problem ofservices measurement. Each industry we have examined contains unique problems. If quality change is,as Shapiro and Wilcox (1996) put it, the “house-to-house fighting” of price indexes, measuring serviceoutput requires, at least, a hedgerow-by-hedgerow assault.
In the next section, we present some measures of the growth in labor and multifactor productivitywithin the services industries in a form that is consistent with the published measures for the aggregateeconomy. This allows us to document the wide dispersion of productivity growth rates across industriesand the pervasiveness of the post-1973 slowdown. Section III summarizes recent research on individualsectors that have been subjects of Brookings workshops on measurement issues in services industries.
II. Available Data
Reviewing trends in service sector productivity and measurement issues requires a decisionbetween two alternative databases that can be used for productivity analysis. Other researchers in thisfield face the same choice.
On the one hand are the aggregate, sector, and industry estimates published by BLS, which coverboth labor productivity and multifactor productivity. As a general statement, we believe that the BLSproductivity figures, where available, are the best current sources of U.S. productivity trend information.
However, the BLS industry labor productivity estimates do not cover all industries at present,although an expansion is underway that will eliminate most of the lacunae. An aggregate services sectorproductivity number—which we need for this review—is not available from BLS, though it is possible toinfer one (see table 1). It is difficult to combine published manufacturing and nonmanufacturing industryproductivity estimates to reach the published aggregates, such as the nonfarm business labor productivitynumber (Gullickson and Harper, 1999, show aggregation with “Domar” weights). These are liabilities ifone’s objective is to compare industry labor and multifactor productivity trends with aggregate and sectorlabor and multifactor productivity trends.

4
A second alternative is to make use of the gross product originating (GPO) by industry datapublished by the Bureau of Economic Analysis (BEA). The GPO data are consistent with nationalaccounts, and with the estimate of nonfarm business output. Using BEA gross product data to computeproductivity yields estimates that are consistent across industries, can be aggregated to sector andeconomywide totals, and are consistent between labor productivity and multifactor productivity concepts.
Set against these advantages, however, is the fact that GPO and other BEA data are not exactlywhat we want for computing industry productivity measures.2 For its productivity measures, BLS startsfrom gross output per industry and adjusts for intraindustry sales. GPO is value added and value addeddeducts, additionally, inputs purchased from other industries. (Value added is used in national accounts inorder to obtain an unduplicated total for GDP.) The BLS output measure is preferable for industryproductivity purposes. The BEA series on full-time equivalent employees by industry, which we use, isconverted into employment hours by BLS, and nonemployee hours are added; then, an adjustment ismade for labor quality. Because these adjustments are larger for the earlier post-war period than for thelast decade, our measure of labor input produces a larger productivity slowdown than the BLS labor inputmeasure (see the first two lines of table 2). Finally, the BLS produces capital input by industry byfollowing the Jorgenson (1989) principles for producing capital services and capital rental prices. TheBLS capital input measure is conceptually superior to the use of BEA net capital stock by industry, whichwe employ in the calculations for table 3.
In table 4 we calculate the effect of the alternative output concepts, which turns out to mattermore for some of the services industries we discuss than for manufacturing. In subsequent work, we willcarry out similar comparisons for labor input and capital input choices.
Thus, the choice is between comprehensive and consistently compiled industry data from BEA ordata that are more fragmentary and less consistent, but more appropriate for productivity analysis, fromBLS. Ultimately, our decision to use GPO data and BEA capital and labor measures was motivated bythe desire to have a comprehensive data set for all industries, one for which consistent labor andmultifactor productivity measures could be derived. We also needed a dataset from which we could splittrends at the 1973 onset of the productivity slowdown. A complimentary study of the productivityslowdown that begins with BLS data is Gullickson and Harper (1999). Their study covers 1947-77, and1977-92. These are not optimal years for analyzing the productivity slowdown, which began in 1973, not1977.
Data on Gross Product Originating (GPO) by industry as published by the Bureau of EconomicAnalysis (BEA) provide a means of examining the role of the service industries within a framework thatis in principle consistent with the aggregate economy-wide productivity estimates for nonfarm business.The data are published at the level of 65 private-sector industries; and with the 1996 revisions(Yuskavage, 1996), estimates are available for gross output (shipments), gross product (value-added) andits components, and intermediate inputs beginning in 1977.3 Because the estimates are tied into the 5-year benchmark input-output tables, they are consistent with the national accounts aggregates. Themeasures of real gross output and real gross product (value added) incorporate the chain Fisher indexesused for the national accounts. For most industries, real product is derived by separately deflating inputsand outputs, ‘double deflation’.
2 We should note that BEA does not explicitly produce productivity data, and so the following remarks are notmeant as criticism of BEA statistics for their own purposes.3 The data on gross product and its components in current prices extends back to 1947.

5
However, the GPO series have not yet incorporated the revisions to GDP that were released by BEAin October, 1999. Some of these revisions are substantial. For example, when BLS incorporated theminto revised estimates of non-farm labor productivity, the post-1973 growth rate was raised by 0.4percentage points per year (from 1.1 percent to 1.5 percent—see table 2). When these GDP revisions areeventually incorporated into the GPO series, they will also cause revisions to the industry multifactorproductivity rates. The data in this paper reflect pre-October data for GDP, except where noted.
We have used an older data set to extend the estimates for the real value of gross product back to1960 in order to have a rough perspective on the contribution of the service industries to the post-1973productivity slowdown.
A. Labor Productivity
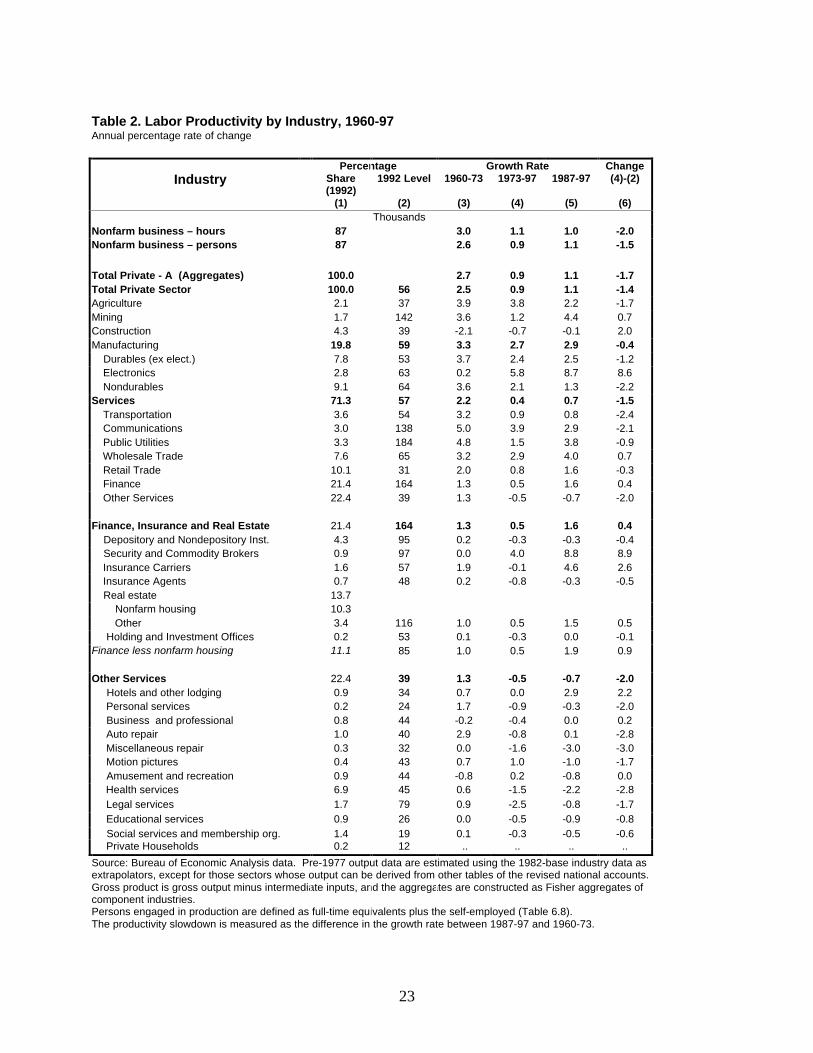
Estimates of gross product per worker are constructed using the BEA’s data on persons engaged inproduction.4 We did not incorporate hours worked into the analysis, but variations in hours appear to besignificant only in the 1960s. The resulting measures of labor productivity are summarized in table 2.
The level of output per worker, shown in column 2, varies widely by industry, but the average for thebroad definition of services is nearly identical to that for manufacturing ($57,000 and $59,000,respectively). Labor productivity is particularly high in the capital-intensive sectors of communications,public utilities and FIRE (finance, insurance, and real estate--but the real estate number is affected by theinclusion of owner-occupied housing, which has no labor input). The notion of low productivity service-sector jobs is accurate only for retail trade and the miscellaneous collection of other services.
Growth rates of labor productivity are reported in columns (3)-(6), where we distinguish betweenthe pre- and post-1973 experiences. We also show the average growth of the last decade. For a numberof industries, post-1987 productivity growth is considerably faster than shown in the 1973-97 data.
For comparison purposes, the first two rows of table 2 show the aggregate series for the nonfarmbusiness sector. The first row shows the nonfarm productivity rate previously published by the Bureau ofLabor Statistics(BLS).5 For the pre-1977 period, the rates are the published version, from the major sectordetail of the national accounts (version A) and Fisher indexes of gross product for the private-sectoraggregate from our constructed estimates of the underlying industry detail (version B). The discrepancyof 0.2 percentage points over the 1960-73 period is indicative of the error introduced by our use of the olddata to extend the output estimates back before 1977.
The industry detail reveals a very pervasive pattern of slowing productivity growth after 1973(column 3 versus column 4). Within the goods-producing industries, the rate of growth in laborproductivity continues to be quite rapid for agriculture and there has been a strong recovery in miningover the `1987-97 period. Although labor productivity change in construction is negative over the full 37years, the post-1973 experience actually represents an improvement over the prior period. While theslowdown is often said to have come to an end for manufacturing, the recovery is largely the result of a
4 Person engaged in production are defined as full-time equivalent employees plus the self-employed. Employees onpart-time schedules are included as a fraction of a full-time employee on the basis of weekly hours. Unpaid familyworkers are excluded.
5 As shown in table 1, the 1.1 previously published BLS labor productivity rate in table 2 has now been revised to1.5. Additionally, the estimate of 0.9 in table 2 shows the effect of using employment, instead of hours.

6
rapidly expanding electronics industry.6 Excluding electronics, durable and nondurable manufacturingboth still show a deceleration of productivity gains. It is particularly large for nondurables and it hascontinued to deteriorate in the most recent period.
The productivity slowdown is more pronounced in the broadly-defined service sector whichincludes a very heterogeneous mix of industries. For the service sector as a whole, the post-1973 laborslowdown is 1.8 percentage points, measured from the whole period (2.2 minus 0.4), and 1.5 percentagepoints, using only the last decade’s data.7
Within the transportation industries, deregulation was followed by substantial productivity gainsfor railroads, as was anticipated; but the gains from deregulation seem small or nonexistent for truckingand airlines. The high reported rate of productivity improvement for communications (2.9 percent for1987-97) actually represents a slowing relative to the 1960-73 period; but there are questions about theextent to which the price indexes incorporate new technologies.
Wholesale trade is an exception in showing an acceleration of productivity growth in the lastdecade. It is also one of those industries that has made an extensive investment in computers. However,the quality of the data is affected by a blurring of the distinction between manufacturer’s distributionactivities and wholesalers and the backward integration of retailers into wholesaling. Moreover, the oldU.S. SIC system contained a definition of wholesale trade that caused many retailing establishments inoffice supplies, hardware, and other retailing activities to be classified as wholesalers, which complicatesthe interpretation of the wholesale trade productivity numbers.
The retail trade sector is reported to have a modest slowdown. But the statistical methodologymay not fully capture the effects of continuing changes in store formats. and, as noted, the old SIC systemcaused many of the most technically dynamic retailers incorrectly to be included in the data for wholesaletrade.
Finance, insurance and real estate (FIRE) and the category “other services” include many of theindustries where the problems of defining and measuring real output are most severe. For several of theseindustries, annual rates of change in labor productivity are actually negative.8 In industries representingabout 13 percent of GDP, the estimates of real output growth are based on changes in employment.Recent research also has suggested that there are major problems with the price indexes used to deriveoutput of medical care.9 Productivity growth has accelerated substantially within finance, but that isprimarily due to the large output gains recorded for security brokers during the recent stock market boom.The conceptual basis of the output measures for banking and insurance continues to be an area of
6 The importance of computer manufacture in the post-1994 improvement in productivity growth is emphasized byGordon (1999a). Because of data limitations, his definition of electronics is a broad one that includes all of SIC 36and 38 machinery manufacturing industries. This aggregate’s productivity growth for the pre-1973 period is notproperly interpreted as electronics productivity, partly because much more of it was non-electronic in those days,and partly because the part that was electronic was not as well measured.
7 This 1.8 point slowdown, calculated directly from the industry data, can be compared with the estimatedslowdown (by backing off the manufacturing estimate from the total) of 2.0 percentage points, in table 1.8 Banking, insurance agents (and carriers before 1987), personal services, business services (before 1987), andrepair, health, legal, and educational services. The negative rates of growth in labor productivity for many serviceindustries were emphasized in Sliffman and Corrado (1996).
9 The methodology used to compute gross output and product by industry is reported in Yuskavage (1996), and anoverview of the problems with medical care prices is provided in Berndt et al (1998).

7
substantial debate. Labor productivity is recorded as declining in large portions of other services,including health services.
In summary, the distribution of labor productivity gains by industry and the pattern of the post-1973 slowdown is consistent only in broad terms with a focus on mismeasurement of output in the serviceindustries. The slowdown has not disappeared in the manufacturing sector, though that sector is ofsharply diminished importance in a service-dominated economy. The decline in productivity growth inthe early 1970s also seems too abrupt to attribute to a deterioration in the quality of the data.
Within services, the patterns of change are quite disparate and different industries raise differenttypes of potential problems. Furthermore, evidence of a slowdown in productivity growth is quitepervasive across industries, rather than being focused exclusively on industries with difficultmeasurement problems. For example, it is not clear why auto repair, with negative post-1973productivity, should be mismeasured (Levy, 1999). Yet, while some of the negative values forproductivity change might be explained as the consequence of shifts in the composition of output, theirfrequency in the service sectors is suggestive of an understatement of real output growth.
B. Multifactor Productivity.
BEA publishes estimates of the stock of plant and equipment by industry which we have used tocompute crude measures of multifactor productivity (MFP) at the level of individual industries.10 Thoseestimates are shown in table 3.
Since the capital inputs generally grow faster than employment, the growth of MFP is usuallyless than that for labor productivity. Further, because the growth of capital slowed sharply relative tolabor inputs after 1973, the post-1973 slowdown in private-sector MFP is only about half as large as thatfor labor productivity. At the level of the total private sector, the MFP growth rate slowed by 0.8percentage points between 1987-97 and 1960-73, compared to 1.5 points for labor productivity. Thecontribution of increased capital per worker is particularly large in communications, wholesale trade, andfinancial institutions. After deducting the contribution of increased capital per worker, nearly half of theindustries had negative rates of change in MFP over the 1973-97 period, and most of those are in financeand other services. The gains in labor productivity are larger than those for MFP only in transportation,business services, entertainment, and social services.
The estimates of MFP shown in table 3 use gross product (equivalent to value added) as themeasure of output. The BLS studies of productivity generally focus on gross output at the industry level,and define multi-factor productivity within a framework that allows for three inputs: capital, labor andinputs purchased from other industries. A recent study by Gullickson and Harper used that framework toexamine the trends in industry productivity over the 1947-92 period.11 While they use a more refinedmethodology and focus on different subperiods, the results are broadly similar in finding negativeproductivity trends for construction, finance and many of the industries included in other services. 10 Thus, we are using the net stock of fixed capital as a proxy for the index of capital inputs. The theoreticallyappropriate measure is the productive stock, which yields the flow of capital services, as emphasized by Jorgenson(1989). The distinction between the net, or wealth, capital stock and the productive capital stock is discussed inTriplett (1996). Capital and labor are combined with a Tornqvist index using the share of labor compensation inGDP after adjusting for the self-employed.
11 Gullickson and Harper (1999). The BLS definition of gross output differs from that of the BEA by excludingintra-industry shipments. In addition, the Gullickson-Harper estimates of multi-factor productivity use a moreelaborate measure of the capital input that includes land and inventories, and the labor input is based on hoursworked, with an adjustment for labor quality.

8
The BEA data set includes measures of gross output only for the 1977-97 period; as shown incolumn 2 of table 4, the distinction between gross output and gross product is important for severalindustries – particularly public utilities, insurance, and health services. While the choice of the outputconcept has a large effect on labor productivity, it is less significant for MFP because purchased materialsare included as an input in the calculation of the later. If the analysis is limited to those industries forwhich both output concepts are available, the aggregate growth of gross output exceeds that of grossproduct by about 0.1 percentage points, but reliance on the gross output concept would significantly raisethe growth of labor productivity in the service sector and lower it for the goods-producing industries.
Our use of BEA net capital stocks by industry introduces potential problems among servicesindustry productivity estimates, especially those industries that are heavy users of computers (which haveshort service lives). We will explore the implications of this step in a revision.
C. Intermediate Products and Aggregate Productivity
Finally, it is important to note that conclusions about potential bias in the estimates of industryproductivity may not carry through to the aggregate economy. The output of some industries is largelyconsumed as an input by others. Thus, an understatement of productivity growth in one industry may beoffset by an overstatement for those industries which use its output.
For example, the real output of business and other services is extrapolated on the basis ofemployment, producing an assumed zero rate of growth in labor productivity. Yet, as shown in column(3) of table 4, 80 percent of the industry’s output is delivered to other industries. Thus, any errors inmeasuring business services output lead to compensating effects on the inputs and productivity ofindustries that use business services. Improved measures of real output for business services would haveonly a minor impact on the estimates of economy-wide productivity growth.
On the other hand, employment is also used to project the output of the banking industry, butnearly two-thirds of its output goes to final demand. The recent revision to the measure of banking inGDP will have an effect on economy-wide GDP. An even more extreme example is provided bymedical care services where nearly all of the output is directed to final demand.
Gullickson and Harper used input-output analysis to adjust for the proportion of an industry’soutput that is an input to others for those industries with negative productivity trends.12 They concludedthat the inter-industry effects would reduce the economy-wide impact of a change in the industryproductivity by about one-third.
III. Individual Services Sectors
As noted in the introduction, there is no overall theme to measurement problems in servicesindustries. Each appears to be a special case, with specific measurement problems unique to the uniquecharacteristics of services industry output. Each industry problem requires a specific solution, an attackdesigned uniquely for the special problems posed by the nature of the industry’s output. This section
12 Gullickson and Harper (1999), p. 58-59.

9
reviews some of the problems and the state of the statistics in topics that have been addressed in the seriesof Brookings Workshops on Measuring Prices and Output of Services Industries.13
Business Services
Business services include a diverse set of activities, such as professional and consulting services(other than legal and financial), advertising, data processing and building maintenance. As noted above,about 80 percent of the output of the business services industry is purchased by other domestic firms. The20 percent that goes to final demand is sold to government and overseas.
The gross product originating (GPO) of the business services sector has more than doubled as ashare of GDP over the past quarter century to about 5 percent. It is also one of the fastest-growing exportsectors. Yet until recently we had no measures of real output of the industry, or of real exports, and GPOis projected on the basis of employment data (Yuskavage, 1996).
In many cases, measuring the output of business services involves an effort to determine whoshould receive credit for the productivity gains recorded by the users of business services. When theoutput of business services is projected on the basis of employment or the use of other inputs, allproductivity gains are assigned to the purchaser of the service. If the provider of the service is creditedwith some productivity gain, it comes at the expense of measured productivity gains in the purchasingindustry. Thus, to the extent that business services are intermediate products, they have no implicationfor the measurement of economy-wide productivity, only its distribution. On the other hand,understanding why the economy is making more use of business services, and why they contribute sostrongly to U.S. export performance, demands better measures of output, so improving the measurementof business services is important for other reasons, even if not for measuring aggregate productivitygrowth.
Since 1995, the BLS has expanded the Producer Price Index to measure the prices or fees forsome components of business services. It now publishes indexes for accounting, legal, advertisingagency, and engineering services. In each of these cases, the BLS asks respondents to re-price at periodicintervals a bundle of services that was observed in the period where pricing was initiated. This is anapplication of what is known, internationally, as “model” pricing, a methodology that was first developedby Statistics Canada for pricing construction. The BLS methods and results were described in Gerduk(1999) and Swick (1999).
Model pricing amounts to collecting a hypothetical price for a defined bundle of services. TheBLS does ask respondents to take account of market conditions, and they make some adjustments forquality change. However, respondents may simply mark up the individual inputs that go into the bundleof services. The new PPI indexes appear similar to the pattern of change in average hourly earnings.
The problems are even more severe in other areas of business services, such as businessconsultants, because it is difficult to define the firms’ activities in a way that leads to clear measures oftheir output. A few attempts have been made to collect from business services providers informationabout what they contribute to the output of their customers. Examples are Nachum (1999), who surveyeda group of European management consulting firms, and Gordon (1999b), who collected information fromU.S. consultants. The results are interesting, but have not so far yielded any breakthroughs on the mostdifficult of the problems. In some cases, management consultants are used to validate decisions alreadymade by management, as a tool to assure broader employee cooperation in a major corporate change, forexample; even if this use of the consultant improves the productivity of the purchasing firm, extracting an
13 Agendas for the workshops, and some of the papers, are accessible at: www.brook.edu\es\research\rs7.htm.

10
estimate of the consultant’s effect from surveys—either of the seller or the buyer of the service—is not apromising approach.
Because business services are so diverse, measuring them requires an industry-by-industryapproach, and painstaking resolutions of unique problems that are found in individual industries.
Retail Trade
For effective measurement of real output and thus productivity in the retail trade sector, severalconceptual problems must be resolved. Much of the industry’s innovation is reflected in shifts in thedistribution of sales among stores with different formats and changes among product lines within stores.Yet, these shifts are explicitly ruled out in the construction of the major price indexes which focus on aspecific product in a specific store. The shift of sales from department stores to lower-priced discountoutlets, for example, is treated as a reduction in quality (and therefore output), not a reduction in price.Nor is there any estimate of the value of increased product variety. Additionally, the old SIC system maybe one of the mismeasurement culprits, because some retail establishments with high productivity may beincorrectly classified in the wholesale trade industry, as noted in a previous section.
At present, two statistical agency programs provide measures of real output in retailing. TheBLS produces indexes of output and output per labor hour at the level of three and four-digit SIC codes.BEA publishes a measure of Gross Product Originating (GPO) at the level of total retail trade andmeasures of gross output for more detailed sub-groups within the retail category. The BLS employs aconsistent methodology for all of its industry productivity work of using a concept of gross output that isequivalent to shipments or sales, not value added; and the indexes are Tornqvist aggregations of output atthe lowest available level of detail.14 The BEA, on the other hand, uses a measure of the gross margin –sales minus cost of goods sold -- as its basic concept of gross output in the retail sector. The twoestimates are more nearly similar that might be expected, however, because BEA assumes that the marginis a fixed percentage of sales at the lowest level of detail.
Generally, the output measure for an industry is what the industry sells. A shoe store sells shoes,which is the way the BLS measures retail output. The problems with the BLS approach are wellrepresented by the example of computers. Because of manufacturers’ improvements in computationalspeed and capacity, the real value of computer store sales has grown spectacularly, over 25 percent peryear since the mid 1980s. Much of that growth is in the increased quality per machine. The computerstores, however, are basically selling boxes; and while the number sold has increased, it has not grown atanywhere near the increase in the output of computer manufactures. An index that combines the increasein computer quality with growth in the number of machines bears little relationship to the actual activitiesof the computer store (even though it is the appropriate way to measure the output of the computerproducer).
There are several suggested lines of research to deal with these problems. One option wouldinvolve the construction of input price indexes, as for manufacturing, so that a measure of the real valueof the gross margin could be obtained by double deflation. However, many analysts doubt that indexes ofsufficient accuracy could be developed to obtain, in effect, the real value of the margin as the residual ofchanges in two large numbers.
Alternatively, it might be possible to develop price indexes that could be used to deflate thegross margin directly. For example, one approach would identify characteristics of stores that account for
14Kunze and Jablonski (1998).

11
variation in the gross margins, and construct an hedonic index based on changes in those characteristics ortheir prices. The BLS is currently conducting a research program that asks individual retailers for thereplacement cost of goods sold as well as the retail price. At the same time, they propose to obtaininformation on the store characteristics, such as number of SKUs, square footage, storage area, andwhether the store is a discount, gourmet, warehouse, or combination outlet. This will provide a data setthat will allow for the exploration of the sources of variation in retail margins.
Output and productivity in retail trade have been greatly affected in the past by cost-shifting fromthe store to the customer—self-service retail trade, for example. The evidence is overwhelming that thechanges are positively perceived by consumers. But part of the cost shifting ought to be deducted fromretail productivity, and increasing services to customers should be added (Oi, 1992; 1998).
E-commerce
One widely cited estimate (Whinston et al, 1999) puts the volume of e-commerce at $301 billion,with a growth rate of 173 per cent per year. What are the issues for measuring productivity that come outof the growth of e-commerce?
First, it helps to understand what are not issues for measuring productivity. The estimate of $301billion cannot be interpreted as the net contribution of e-commerce to GDP. Only about $101 billion ofthe total represents final e-commerce sales (Whinston et al, 1999). The other two-thirds represent high-tech investment by e-commerce firms and purchases of other inputs, such as software and web sitehosting services. These inputs would be netted out of any GDP estimate, so the $301 billion doublecounts in the traditional national accounting sense. Although it is of some use to know the total volumeof transactions that are associated with e-commerce, the total volume of transactions does not give ameasure of unduplicated output, which traditionally is calculated by value added.
Even some of the $101 billion of e-commerce sales are not net additions to GDP. In the case ofcomputers and software (by far the largest category of e-commerce sales at present), only the e-commercemargin properly is included in GDP, not the total e-commerce transaction, because manufacturers’ salesof computers and software are counted in the manufacturing industries.
Although the growth rates of e-commerce are impressive, its size is still miniscule, evencompared to catalog sales. There is no evidence that GDP or aggregate productivity is currently missingvery much because of e-commerce.
Moreover, unlike the situation with service sector statistics in the past, the Census Bureau hasalready mounted survey activity to determine how many retail sales take place over the Internet(Mesenbourg, 1999). It appears likely that e-commerce sales will be smoothly integrated into existingretail sales information before they get very large. Accordingly, the macro implications of e-commerceare not very important, and, actually, not very interesting.
The more important questions are: What does e-commerce do to the productivity of firms thatadopt it? How does it affect internal business processes, and therefore productivity? What are the effectsof displacement on other, competing, industries? And what does it do to competition and the structure ofexisting industries? Unfortunately, data to study those questions will be harder to obtain.
Some of those questions concern inputs to production. The U.S. statistical system has historicallybeen weak in providing information about detailed input usage, and this is especially true for inputs ofhigh-tech equipment, software, and services. That means there is little benchmark information to

12
determine the changes that will be wrought by e-commerce. Essentially, there is no good picture ofbusiness processes and input usage in U.S. statistics before the advent of e-commerce.
Many final sales over the Internet, and many business-to-business Internet sales as well, aresubstitutions for more traditional kinds of retailing, not only against traditional “brick and mortar” stores,but more specifically mail order catalogs. How readily do people substitute Internet transactions for oldertypes of transactions?
Papers by Brynjolfsson, Smith, and Bailey (1999) and by Goolsbee (1999) suggest that Internetbuyers are, first, quite sensitive to price differences, but quite sensitive as well to various nonpriceelements, such as advertising, trust, delivery times, and so forth. Indeed, there seem to be two competingforces, which have been described as an “arms war” between business and consumers. On the one hand,it has often been suggested that the Internet makes it easier for consumers to search for prices, whichshould reduce the amount of price dispersion in markets. On the other hand, businesses use the Internet toincrease product differentiation and tailor products to individual buyers, thereby increasing the amount ofprice dispersion. Studies (Brynjolfsson et al, 1999) have found that when consumers learn about nonpriceaspects of the transaction, they turn out to be more sensitive to the nonprice aspects than to the pricedispersion. The studies also find a large amount of price dispersion on the internet, which is consistentwith the finding that nonprice aspects of the transaction, including advertising, are very important toInternet sales. The widely-publicized notion of a frictionless Internet economy, with no advantages withrespect to seller’s size, is not supported by current research.
As another issue, some of the changes wrought by e-commerce cross the traditional “productionboundary” used in national accounts. For example, a book bought from a conventional bookstore impliesthat the consumer incurs travel costs and time costs to go to the bookstore to make the purchase. Thosecosts are not now counted in the acquisition price of the book. A book purchased over the Internet,however, incurs handling and shipping costs that are included in the price of the book. Conversely, somepeople like shopping or like to browse in bookstores, which cannot be done over the Internet. Looked atthis way, these services are part of the value created by traditional retailing, and the Internet providesfewer retailing services. If our statistics simply compare the price of the book in the two settings we willomit the value of retailing services (which are not explicitly priced) to the ultimate buyer, and miscount aswell costs to the buyer that are non-market in the one case (travel costs to the store) but are explicit andcharged for in the other (shipping and handling for e-commerce sales).
These problems are no different from other kinds of retailing shifts. There is serious concern thatwe already mismeasure output in the retailing sector because implicitly-priced store services are notdirectly accounted for (see the section on retail trade). So in this sense, e-commerce does not raise newissues, but it may raise them in new and particularly intractable forms.
Finally, there are interactions between e-commerce and other economic changes. Declines incommunication costs, and perhaps to a lesser degree, in transportation costs, are a major force behind thegrowth in e-commerce. We may not be measuring the decline in the costs of communication well. Thegrowth of e-commerce may just be a response to other economic innovations that are more fundamental,and e-commerce may not be the major technological change in itself.
A closely related matter is the decline in prices for Internet service providers. Work is underwayon this in both the U.S. (in a Brookings sponsored project) and Canada. But because Internet servicecontracts are increasingly being bundled into the purchase price for computers, or else Internet service isbeing paid for by advertising, obtaining price indexes and real output measures for Internet serviceproviders is likely to pose difficulties that have not yet been addressed.

13
Insurance
Labor productivity for insurance carriers dropped precipitously after 1973, and turned negative,as did multifactor productivity. (The 1973-97 productivity growth rates are –0.1 for labor productivityand –2.3 for multifactor productivity—see tables 1 and 2). Negative productivity growth rates are alwayssuspect, but they are especially so in the case of insurance, because this industry is among the largestpurchasers of computer equipment. The use of computers for claims and premium processing is obvious.
After 1987, however, the insurance carriers industry shows very rapid rates of productivitygrowth, 4.6 per cent for labor productivity and 2.1 per cent for multifactor productivity, perhaps becauseinvestment in IT equipment has borne fruit. As a result, recent productivity growth in the insurancecarriers industry exceed its pre-1973 rates.15
Despite the insurance industry’s recent impressive productivity growth, there are reasons tobelieve that its output may still be mismeasured, and that the industry’s true productivity growth may bestronger than the available current data show. We conclude that a major unresolved problem inmeasuring the output of insurance is the measurement and valuation of risk. The management of risk iswhat insurance companies sell. Anecdotal evidence suggests that insurance companies have greatlyimproved their ability to manage and control for risk. Because there is no explicit adjustment for risk inpresent price and real output measures, we suspect that output levels and output growth are bothunderstated.
A major difficulty in focusing on what seems to us the real question—that is, measuring andvaluing risk—is that insurance has been the topic of one of those long-standing national accounts disputesthat seemingly are never resolved. There are a number of interlocking issues, partly real issues and partly,we feel, confusions, which were discussed extensively in the April, 1998 Brookings workshop onmeasuring insurance.
Two major issues are: (1) Should the current price measure of insurance output be the insurancecompany’s revenue from premiums or, instead, its premiums minus claims paid out? (2) However thefirst question is resolved, should the insurance company be treated as operating in two lines of business,namely, (a) selling insurance and (b) investing reserves? 16
(1) The current price (nominal) output measure---premiums versus premiums minusclaims. This output definition controversy corresponds to two different conceptual models about theinsurance company’s production process.
The premiums minus claims view is equivalent to a risk-pooling model where the insurancecompany is merely a facilitator and administrator. The policyholders create a pool for sharing risk,essentially operating as a cooperative, and the members of the cooperative pay a service fee to theinsurance company for administering the pooling scheme. The price of insurance in this model is the
15 The gains are not shared by the insurance agents industry. This industry will not be considered further inthe present discussion.
16 A third issue is also debated: If the answer to question (2) is positive, should the investment part of theinsurance company’s output be imputed back to insurance purchasers in the form of imputed increases in thequantity of insurance? The latter question amounts to asking whether there is a difference between insurancecompany output in industry productivity measures and insurance product information in, for example, the consumerprice index. Because this last issue is important for measuring CPIs and for measuring real consumption, but not forindustry productivity measures, it is not included in the present paper.

14
service fee for administering the plan. The rationale for this approach to insurance is presented by Hill(1998) and it is the view that is incorporated into the Systems of National Accounts, or SNA(Commission of the European Communities et al, 1993).
In the risk-pooling model of insurance, the insurance company’s productivity could rise if itbecomes more efficient at processing premiums and claims. But if the premium falls because theinsurance company finds ways to identify more risky business (and either rejects it, or prices it to matchits greater risk) or if it finds ways to eliminate inflated or fraudulent claims, the effects would beeliminated from the insurance margin, and hence from the insurance industry productivity measure.
In the alternative view the insurance company assumes the risk. The policyholder buys theservice of protection of assets or income from loss. The output is the insurance premium times thequantity of risk assumed. The price charged for assuming risk is p = P/R, where p is the price ofinsurance, P is the premium charged, and R is a measure of risk assumed (Bradford and Logue, 1998).Under this model, the price of insurance reflects both efficiencies in processing premiums and claims andefficiencies in matching and administering risk, so both sets of factors influence insurance industryproductivity.
A major implementation problem with the risk-pooling insurance model (the national accountsconvention for insurance) arises out of the fact that the insurance business does not function the way thismodel suggests. Although there are insurance companies with the word mutual in their names, there isvery little evidence that they act as cooperatives on behalf of the policyholders. In the April, 1998Brookings workshop one participant remarked that he had sat on the board of directors for a majorinsurance company, but nothing he ever heard there suggested that the company thought it was acting onbehalf of the policyholders. One of us had a similar conversation with an executive in a large Europeaninsurance company. Because insurance companies do not operate as if they were providingadministrative services to policyholders, no price or fee corresponding to the risk-pooling model ofinsurance can be found. Eurostat, in work leading up to its Harmonized Indexes of Consumer Prices(HICP), found that insurance companies could not provide a price that corresponded to the risk-poolingconcept (Astin, 1999). Thus, even if a risk-pooling model of insurance were the only one that wascompatible with national accounting conventions, it cannot be implemented, in terms of estimating realoutput from consistently defined measures of current-price output and of prices.
The risk-assuming model of insurance, which yields the gross insurance premium as a measure ofcurrent dollar output of insurance, yields a much larger gross output for the insurance industry than doesthe premiums minus claims view. Sherwood (1999) in his table 2, shows that the smaller definition runsfrom one-third to one-fifth of the larger one (data are for casualty insurance). This must have implicationsfor international comparisons of productivity. However, it is not exactly clear whether the two conceptsof insurance yield different rates of productivity growth in the U.S. economy. Although Sherwood (1999)calculates that the effect of the alternatives on total nonfarm business sector output is small, he does notexplicitly calculate the effect on insurance industry productivity and does not reach definitiveconclusions.
(2) Insurance company investment earnings: There is a growing consensus that the investmentearnings of insurance companies should be added into their industry output. Because of moral hazard,insurance companies collect premiums in advance of claims liabilities. The surpluses are invested.Evidence strongly suggests that competition among insurance companies leads to the distribution ofinsurance industry investment earnings back to the policyholders in the form of reduced premiums, and itis commonly observed that casualty insurance companies do not cover the full cost of their claims fromtheir premiums earnings. Treating an insurance company as producing a joint product (insurance policiesand investment activity) is not a conceptual step very far beyond the current treatment of other industries

15
that have jointly-produced products. Whether national accountants should also treat the insurancepolicyholder as earning the insurance company’s investment income in the form of more insurance (thetreatment prescribed in the SNA) is not central to the question of computing industry productivitymeasures. (For the record, we do not think this national accounts approach yields a sensible measure ofreal consumption or of the price of insurance in the CPI.)
If the insurance industry has used computers merely to process more efficiently premiums,premium notices, and claims services, the effects are probably captured in the existing productivitynumbers. This use of computers implies substitution of capital for labor and the existing insuranceproductivity numbers (4.6 per cent increase in labor productivity and 2.1 per cent increase in multifactorproductivity since 1987) are consistent with substantial capital-labor substitution in this industry. On theother hand, if computers combined with innovations in risk management make it possible for insurancecompanies to be more efficient in assessing and valuing risk, then it is not at all certain that thesetechnological improvements are incorporated into existing statistics.
The Bureau of Labor Statistics, in its producer price index and productivity measurementprograms, has begun to measure the output of the insurance industry with a gross premiums plusinvestment income approach (Sherwood, 1999; Dohm and Eggleston, 1998). This is a step forward.Incorporating more explicit measures of risk, and valuation of improvements in insurance companies’ability to manage risk, is the next step toward improving the output measurement of insurance. 17
Banking
Like insurance, the measurement of banking output in national accounts has been the subject of along-standing controversy that impedes progress. In the NIPA, as in the SNA, current-price bankingoutput is defined as the spread between borrowers’ and depositors’ interest rates, plus fees for servicesthat are explicitly priced. The issues in measuring banking output were the subject of a Brookingsworkshop in November, 1998.
Subsequently, BEA introduced a change in its extrapolator for real banking output in the October,1999 GDP revisions. This extrapolator is effectively the measure of banking output that has long beenused by the BLS for its banking labor productivity measures. It includes counts of various bankingprocesses, such as checks cashed and number of ATM transactions. Because we have not yet been able toexamine the effects of the BEA change on banking industry output growth, we have deferred discussionof banking productivity for this paper.
For the record, we think the BEA change is an improvement, but that more work on bankingoutput measurement, both conceptual and empirical, is needed.
Medical care.
17 Some additional national accounting concerns are present. First, problems arise because the Bureau of
Economic Analysis (BEA) does not have a separate capital account. The insurance premium, and not premiumsminus claims, is the cost to current production for keeping the capital stock whole against unforeseen losses.Second, double-counting is of concern to BEA because it wants to use the output of the car repair industry, minus amore or less arbitrary adjustment for repairs to business cars, as a measure in Personal Consumption Expenditures.Finally, insurance claims are not always spent to replace the item of capital equipment that was lost (emphasized byHill, 1998).

16
It has become commonplace that medical care inflation outstrips the overall inflation rate. Forexample, between 1985 and 1995, the medical care component of the CPI rose 6.5% per year, when theoverall CPI rose only 3.6 per cent.
Until fairly recently, deflators for medical care output have been based almost exclusively on themedical care components of the CPI. Many economists believe that the CPI medical price indexesoverstated inflation in medical care.18 If so, productivity growth in medical care is understated.Significantly, measured productivity in the health care industry has been negative. From 1973-97, healthcare industry productivity declined by 2.6 % per year, and from 1987-97 by 1.8 % per year.
In 1992, BLS introduced new price indexes for health care in its Producer Price Index (PPI)program. These new indexes introduced a new methodology for measuring the price of medical care.Rather than pricing the cost of a day in the hospital, as did the historical CPI, the BLS now draws aprobability sample of treatments for medical conditions. For example, for the PPI price index for mentalhealth care treatment in a hospital the probability selection might be “major depression.” The BLS thencollects the monthly change in costs for treating that identical medical condition (see Berndt et al, 1998,and Catron and Murphy, 1996, for more information on BLS procedures). The new medical care PPIindexes are great improvements on the previously-available CPI medical price information (see theassessment in Berndt et al, 1998). Overall, the new PPI indexes present a picture of lower medical careinflation, compared to CPI measures, for the period where the two overlap (Catron and Murphy, 1996).BLS subsequently introduced similar methodology into the CPI (Cardenas, 1996).
However, even with the new PPI methodology it has been difficult for BLS to find data to adjustfor changes in the efficacy of treatment. Although there is some controversy on how far statisticalagencies should go in building measures of treatment efficacy into price and output measures, we doubt ifanyone seriously disagrees that the price index should be “adjusted” or corrected in some fashion forimprovements in medical efficacy. Because medical economists generally believe that progress has beenmade in medical technology--better prognoses, less time spent in the hospital for any given condition, lesspainful and onerous conditions during treatment, and so forth--they believe that inadequate adjustment forchanges in medical technology creates upward biases in price indexes for medical care.
There is less universal agreement, however, on the basis for adjustment. In the PPI, the BLSlooks for information on the change in costs that are associated with improvements in medical efficacy.Some economists would go considerable further, and ask for information about the medical outcome andthe value to the patient of changes in medical outcomes. Research on cataract surgery by Shapiro andWilcox (1996) serves to illustrate the issues.
At one time, cataract surgery involved a lengthy hospital stay, a week or ten days in intensivecare. Now, it is mostly an outpatient procedure, often performed in a doctor’s office or clinic. Putanother way, the number of days in the hospital has dropped from 10 or more to zero. If one were to ask,in the usual “cost-based” formulation, how much more costly was the improved procedure, the answer isnegative. If the price index were based, as the CPI was formerly, on the cost of a day in the hospital,there is no reasonable way to “adjust” the price index for the value of an improvement that reduced thenumber of days to zero.
But from the patient’s point of view, the modern operation is surely better. The operation oncerequired that the patient be immobilized for a lengthy period. Given the choice between immobilization
18 A comprehensive discussion of price indexes for medical care is Berndt et al (1998). See also Triplett andBerndt, 1999.

17
and the far less unpleasant recovery period associated with the modern operation, patients wouldundoubtedly be willing to pay more for the modern operation. Not only is it less costly in terms of whatis paid for (hospital care, for example), it is also far less unpleasant for the patient. The operation also hasfewer adverse side-effects, does not require wearing thick corrective lenses, and is in many other waysimproved from the patient’s point of view.
A medical outcome measure would take into account all the ways in which the improvement incataract surgery was beneficial to the patient. But some of those improvements discussed in the previousparagraph go outside the traditional “market boundary” of national accounts. The patient might well bewilling to pay for the improved technology, but in fact the technology comes to him (or to his insurancecompany) for less monetary cost or expenditure of market resources than the old treatment cost.
But should these improvements be credited to the productivity of the medical care industry, or toits output in national accounts? Or should improvements that are not explicitly paid for, and for whichthe value of a transaction cannot be directly inferred, be ruled out of national accounts (or out of nationalhealth accounts) on the grounds that they fall outside the market boundary that has been traditional formeasuring GDP?
For example, the time spent in recovery from cataract surgery is part of the cost to the patient—even leaving aside the disutility of immobilization—but this time cost is not traditionally considered innational accounts, nor is the value of the reduction in time in recovery from surgery, or the reduceddisutility of reduced time spent immobilized, directly valued. The time cost of the patient, the greaterutility to the patient of less unpleasant treatments, and the value to the patient of reductions in unwantedside effects are all elements that would go into a measure of medical outcomes (see Gold et al, 1996). Butshould they go into an economic accounting for medical care? That remains somewhat controversialamong economists.19 Many of these issues were discussed in the conference papers contained in Triplett(1999a).
Stating the problem this way underscores the difficulties that statistical agencies face inproducing price indexes for medical care. Calculating the change in costs for treating an episode of anillness requires not only the traditional statistical agency skills in gathering prices, but also a great deal ofmedical knowledge about changes in the efficacy of medical treatments (knowledge which, in manycases, is scientifically uncertain, or in contention). It also requires knowledge about patient valuations ofchanges in treatments, particularly when treatments change in dimensions that involve the patient’s time,tolerance for pain, and valuation of the disutility of side effects, or of the onerous implications oftreatments (such as, for example, a frequent treatment regimen for a pharmaceutical).
Additionally, some changes in medical treatment cause shifts in expenditures among PPI indexcategories; the PPI methodology contains no obvious way to take these cost savings into account. As anexample, consider increased use of drugs that permit treatment of mental conditions on an outpatientbasis, rather than in a mental hospital. Substitution of drugs (and clinical visits) for hospital care willreduce the cost of treatment, but this cost reduction will be reflected inadequately in the PPI because thePPI holds the weights for the various expenditure categories (hospitals, doctors offices, pharmaceuticals,and so forth) constant.
New research price indexes for medical treatments that adjust for changes in the effectiveness ofmedical treatments are Cutler et al (1996, 1999), Frank, Berndt and Busch (1998; forthcoming) and, asalready noted, Shapiro and Wilcox (1996). These new price indexes confirm that the historical CPI
19 We leave aside here problems with measuring medical outcomes, which are formidable. The question is whatone wants to do with medical outcomes measures, if perfected or improved.

18
medical care component was upward biased as a deflator for medical care industry output, as doescomparison of the new PPI indexes with movements of the CPI. How much do medical care productivitymeasures that use the historical CPI as output deflators understate the amount of productivity growth inmedical care?
To provide an evaluation of the bias in existing measures, Triplett (1999b) “backcasts” anestimate for a mental health care price index. One part of the backcast is an estimate formed by matching,for the period following 1992, PPI and CPI components and using the differences in trends as anadjustment factor for the CPI for the earlier period. He weights these indexes according to costs fortreatment of mental health and makes an additional correction based on the research of Frank, Berndt, andBusch (forthcoming). The adjusted mental health care price index shows essentially no medical inflationduring the 1985-95 interval (table 5).
He then uses the adjusted price index to estimate the growth in the quantity of per capita mentalhealth care services (or real expenditure growth).20 For the 1985-95 period, the unadjusted real outputgrowth rate is negative, at about - 1.5 percent per year, which is very roughly consistent with the negative1987-97 productivity trend for health care, shown in table 3, of - 2.6 per cent annually. Adjusted, realoutput growth is substantially positive, at about 6.6 per cent for 1985-95, or nearly 8 percentage pointshigher than the unadjusted estimates (table 5). The implications for medical care productivity areobvious.
Mental health may not be representative of the rest of medical care. Improved price indexes forother diseases might not make so much difference to output trends as in the case of mental health.However, the heart attack price index of Cutler et al, 1996, or the cataract surgery price index in Shapiroand Wilcox (1996) suggest that revisions to real expenditure trends for these disease categories might besimilar to the revisions for mental health.
As an exercise, however, Triplett (1999b) assumes that the correction applied to the mental healthprice and output measures applies to the entire medical care sector. This would raise medical careproductivity from -2.6 per cent per year in table 3 to 5.6 per cent per year. This is clearly a major impact.
It is important to emphasize limitations of this backcast. It is unlikely that the backcast is exactlyvalid, but neither is the historical CPI. Improvement of productivity in medical care seems more likelythan the deterioration that present measures of medical care output show.
20 Treatments for mental disorders account for over eight per cent of total U.S. health care expenditures, about atenth (9.5%) of all allocable U.S. personal health care expenditures and just over one per cent of gross domesticproduct (GDP).

19
References
Astin, John. 1999. Presentation to the Brookings Workshop on Measuring the Price and Output ofInsurance, April, 1998.
Baumol, William J. 1967. “Macroeconomics of Unbalanced Growth: The Anatomy of Urban Crises.”American Economic Review 57(): 415-26, June.
Berndt, Ernst R., David M. Cutler, Richard G. Frank, Zvi Griliches, Joseph P. Newhouse, and Jack E.Triplett. 1998. “Price Indexes for Medical Care Goods and Services: An Overview of MeasurementIssues.” National Bureau of Economics Working Paper W6817, November.
Bonds, Belinda and Tim Aylor. 1998. “Investment in New Structures and Equipment in 1992 by UsingIndustries.” Survey of Current Business 78 (12), December.
Bradford, David F. and Kyle D. Logue. 1998. “The Effects of Tax Changes on Property-CasualtyInsurance Prices.” In David F. Bradford, ed. The Economics of Property-Casualty Insurance. Chicago:University of Chicago Press.
Brynjolfsson, Eric, Michael D. Smith, and Joseph Bailey. 1999. “Understanding Digital Markets: Reviewand Assessment.” Paper presented at the Brookings Workshop on E-Commerce, September 24.
Cardenas, Elaine M. 1996. “Revision of the CPI Hospital Services Component.” Monthly Labor Review119(12): 40-48, December.
Catron, Brian and Bonnie Murphy. 1996. “Hospital Price Inflation: What Does the New PPI Tell Us?”Monthly Labor Review 120(7): 24-31, July.
Commission of the European Communities, International Monetary Fund, Organisation for Economic Co-operation and Development, United Nations, and World Bank. 1993. System of National Accounts 1993.Office for Official Publications of the European Communities Catalogue number CA-81-93-002-EN-C,International Monetary Fund Publication Stock No. SNA-EA, Organisation for Economic Co-operationand Development OECD Code 30 94 01 1, United Nations publication Sales No. E.94.XVII.4, WorldBank Stock Number 31512.
Cutler, David M., Mark B. McClellan, and Joseph P. Newhouse. 1999. “The Costs and Benefits ofIntensive Treatment for Cardiovascular Disease.” In Measuring the Prices of Medical Treatments editedby Jack E. Triplett: 34-71. Washington D.C.: The Brookings Institution Press.
Cutler, David M., Mark B. McClellan, Joseph P. Newhouse, and Dahlia Remler. 1996. “Are MedicalPrices Declining? Evidence from Heart Attach Treatments.” Quarterly Journal of Economics 113(4):991-1024, November.
Dohm, Arlene, and Deanna Eggleston. 1998. “Producer Price Indexes for Property/Casualty and LifeInsurance.” Paper presented to the Brookings Workshop on Measuring the Price and Output of Insurance,April, 1998.
Frank, Richard G., Ernst R. Berndt, and Susan Busch. Forthcoming. “Price Indexes for the Treatment ofDepression.” In Ernst Berndt and David Cutler, eds. Medical Care Output and Productivity. NationalBureau of Economic Research, Studies in Income and Wealth 59: Chicago: University of Chicago Press.

20
Frank, Richard G., Ernst Berndt, and Susan H. Busch. 1998. “Price Indexes for Acute Phase Treatment ofDepression.” National Bureau of Economic Research Working Paper 6799 (November).
Gerduk, Irwin. 1999. “New PPI Indexes for Accounting, Legal, and Advertising Services.” Paperpresented at Brookings Workshop on Measuring the Output of Business Services, May 14, 1999.
Gold, Marthe R., Joanna E. Siegel, Louise B. Russell, and Milton C. Weinstein. 1996. Cost-Effectivenessin Health and Medicine. New York: Oxford University Press.
Goolsbee, Austan. 1999. “In a World without Borders: The Impact of Taxes on Internet Commerce.”Paper presented at the Brookings Workshop on Measuring the Output of Business Services, May 14,1999.
Gordon, Robert. 1999a. “Has the New Economy Rendered the Productivity Slowdown Obsolete?”Presentation at CBO Panel of Economic Advisors, June 2, 1992 (revised, 14/6/99)
Gordon, Robert. 1999b. “Management Consulting Firms: Some Approaches to Output Measurement.”Paper presented at the Brookings Workshop on Measuring the Output of Business Services, May 14,1999.
Griliches, Zvi. 1994. “Productivity, R&D, and the Data Constraint.” American Economic Review 84(1):1-23, March.
Gullickson, William and Michael Harper. 1999. “Possible Measurement Bias in Aggregate ProductivityGrowth,” Monthly Labor Review (February), pp. 47-67
Hill, Peter. 1998. “Insurance in the SNA.” Paper presented at the Brookings Workshop on Measuring thePrice and Output of Insurance, April, 1998.
Jorgenson, Dale W. 1989. “Capital as a Factor of Production.” In Dale W. Jorgenson and Ralph Landau,eds., Technology and Capital Formation. Cambridge, Mass. The MIT Press.
Kunze, Kent and Mary Jablonski. 1998. “Productivity in Service-Producing Industries.” Paperpresented at the Brookings Workshop on New Government Datasets, June, 1998.
Levy, Frank. 1999. “Some Initial Results on Productivity in Car Dealerships and Auto Repair.” Paperpresented at the Brookings Workshop on Measuring the Output of Business Services, May 14, 1999.
Mesenbourg, Thomas. 1999. “Measuring Electronic Business.” Paper presented at the BrookingsWorkshop on Measuring the Output of Business Services, May 14, 1999.
Nachum, Lilac. 1999. “Measurement of Productivity in Swedish Management Consulting Firms.” Paperpresented at the Brookings Workshop on Measuring the Output of Business Services, May 14, 1999.
Oi, Walter. 1992. “Productivity in the Distributive Trades: The Shopper and the Economies of MassedReserves.” In Zvi Griliches, ed. Output Measurement in the Service Sectors. University of ChicagoPress for the National Bureau of Economic Research.
Oi, Walter. 1998. “Adapting the Retail Format to a Changing Economy.” Paper presented at theBrookings Workshop on Measuring the Output of Retail Trade, September 18, 1998.

21
Shapiro, Matthew P. and David W. Wilcox. 1996. “Mismeasurement in the Consumer Price Index: AnEvaluation.” NBER Macroeconomics Annual 11: 93-142.
Sherwood, Mark K. 1999. “Output of the Property and Casualty Insurance Industry.” Paper presented atthe Brookings Workshop on Measuring the Price and Output of Insurance, April, 1998. Now publishedin: Canadian Journal of Economics 32(2), April, 1999.
Sliffman, Larry and Carol Corrado. 1996. “Decomposition of Productivity and Unit Costs,” OccasionalStaff Studies, OSS-1, Washington DC: Board of Governors of the Federal Reserve.
Swick, Roslyn. 1999. Paper presented at the Brookings Workshop on Measuring the Output of BusinessServices, May 14, 1999.
Triplett, Jack E. (editor). 1999a. Measuring the Prices of Medical Treatments. Washington D.C.: TheBrookings Institution Press.
Triplett, Jack E. 1999b. “What’s Different about Health: Human Repair and Car Repair in NationalAccounts and in National Health Accounts.” The Brookings Institution. Scholars. Jack E. Triplett.http://www.brook.edu/scholars/JTRIPLETT.htm. Forthcoming in Ernst Berndt and David Cutler, eds.Medical Care Output and Productivity. National Bureau of Economic Research, Studies in Income andWealth 59: Chicago: University of Chicago Press.
Triplett, Jack E. 1996. “Depreciation in Production Analysis and in Income and Wealth Accounts:Resolution of an Old Debate.” Economic Inquiry (34: January): 93-115.
U.S. Department of Labor, Bureau of Labor Statistics. 1999a. Major sector productivity and costs index.http://146.142.4.24/cgi-bin/dsrv?pr. Accessed November 23, 1999.
U.S. Department of Labor, Bureau of Labor Statistics. 1999b. Major sector multifactor productivityindex. http://146.142.4.24/cgi-bin/dsrv?mp. Accessed November 23, 1999.
Whinston, Andrew, Anitesh Barua, Jon Pinnell, and Jay Shutter. 1999. “Measuring the InternetEconomy.” Paper presented at the Brookings Workshop on Measuring the Output of Business Services,May 14.
Yuskavage, Robert E. 1996. “Improved Estimates of Gross Product by Industry, 1959-94,” Survey ofCurrent Business (August) pp. 133-55.

22
Table 1
U.S. Labor and Multifactor Productivity, Average Annual Rates of Change,1949-96 and Selected Subperiods
Non-Farm Business ManufacturingEstimated
Non-ManufacturingOutput per Hour1949-73 2.8 2.6 3.01973-96 1.5 r 2.7 1.0 r
1973-79 1.3 r 2.1 1.0 r
1979-96 1.5 r 2.9 1.1 r
Non-Farm Business ManufacturingEstimated
Non-ManufacturingMultifactor Productivity1949-73 1.9 1.5 2.11973-96 0.2 0.8 0.0 1973-79 0.4 - 0.6 0.8 1979-96 0.1 1.3 - 0.3
r indicates that numbers incorporate the revised October, 1999 GDP data.
sources: output per hour: U.S. Department of Labor, Bureau of Labor Statistics, 1999a; multifactorproductivity: U.S. Department of Labor, Bureau of Labor Statistics, 1999b.
23
Table 2. Labor Productivity by Industry, 1960-97Annual percentage rate of change
Percentage Growth Rate ChangeIndustry Share
(1992)1992 Level 1960-73 1973-97 1987-97 (4)-(2)
(1) (2) (3) (4) (5) (6)Thousands
Nonfarm business – hours 87 3.0 1.1 1.0 -2.0Nonfarm business – persons 87 2.6 0.9 1.1 -1.5
Total Private - A (Aggregates) 100.0 2.7 0.9 1.1 -1.7Total Private Sector 100.0 56 2.5 0.9 1.1 -1.4Agriculture 2.1 37 3.9 3.8 2.2 -1.7Mining 1.7 142 3.6 1.2 4.4 0.7Construction 4.3 39 -2.1 -0.7 -0.1 2.0Manufacturing 19.8 59 3.3 2.7 2.9 -0.4 Durables (ex elect.) 7.8 53 3.7 2.4 2.5 -1.2 Electronics 2.8 63 0.2 5.8 8.7 8.6 Nondurables 9.1 64 3.6 2.1 1.3 -2.2Services 71.3 57 2.2 0.4 0.7 -1.5 Transportation 3.6 54 3.2 0.9 0.8 -2.4 Communications 3.0 138 5.0 3.9 2.9 -2.1 Public Utilities 3.3 184 4.8 1.5 3.8 -0.9 Wholesale Trade 7.6 65 3.2 2.9 4.0 0.7 Retail Trade 10.1 31 2.0 0.8 1.6 -0.3 Finance 21.4 164 1.3 0.5 1.6 0.4 Other Services 22.4 39 1.3 -0.5 -0.7 -2.0
Finance, Insurance and Real Estate 21.4 164 1.3 0.5 1.6 0.4 Depository and Nondepository Inst. 4.3 95 0.2 -0.3 -0.3 -0.4 Security and Commodity Brokers 0.9 97 0.0 4.0 8.8 8.9 Insurance Carriers 1.6 57 1.9 -0.1 4.6 2.6 Insurance Agents 0.7 48 0.2 -0.8 -0.3 -0.5 Real estate 13.7 Nonfarm housing 10.3 Other 3.4 116 1.0 0.5 1.5 0.5 Holding and Investment Offices 0.2 53 0.1 -0.3 0.0 -0.1Finance less nonfarm housing 11.1 85 1.0 0.5 1.9 0.9
Other Services 22.4 39 1.3 -0.5 -0.7 -2.0 Hotels and other lodging 0.9 34 0.7 0.0 2.9 2.2 Personal services 0.2 24 1.7 -0.9 -0.3 -2.0 Business and professional 0.8 44 -0.2 -0.4 0.0 0.2 Auto repair 1.0 40 2.9 -0.8 0.1 -2.8 Miscellaneous repair 0.3 32 0.0 -1.6 -3.0 -3.0 Motion pictures 0.4 43 0.7 1.0 -1.0 -1.7 Amusement and recreation 0.9 44 -0.8 0.2 -0.8 0.0 Health services 6.9 45 0.6 -1.5 -2.2 -2.8 Legal services 1.7 79 0.9 -2.5 -0.8 -1.7 Educational services 0.9 26 0.0 -0.5 -0.9 -0.8 Social services and membership org. 1.4 19 0.1 -0.3 -0.5 -0.6 Private Households 0.2 12 .. .. .. ..
Source: Bureau of Economic Analysis data. Pre-1977 output data are estimated using the 1982-base industry data asextrapolators, except for those sectors whose output can be derived from other tables of the revised national accounts.Gross product is gross output minus intermediate inputs, and the aggregates are constructed as Fisher aggregates ofcomponent industries.Persons engaged in production are defined as full-time equivalents plus the self-employed (Table 6.8).The productivity slowdown is measured as the difference in the growth rate between 1987-97 and 1960-73.

24
Table 3. Multifactor Productivity by Industry, 1960-97Annual percentage rate of change
Percentage Growth Rate ChangeIndustry Share (1992) 1960-73 1973-97 1987-97 (4)-(2)
(1) (2) (3) (4) (5)
Total Private Sector 100.0 1.7 0.5 0.9 -0.8Agriculture 2.1 0.4 3.5 2.7 2.2Mining 1.7 1.4 -0.2 4.0 2.5Construction 4.3 -2.4 -0.5 0.1 2.5Manufacturing 19.8 2.5 2.0 2.4 -0.1 Durables (ex elect.) 7.8 3.1 2.0 2.4 -0.6 Electronics 2.8 -0.9 4.6 7.3 8.2 Nondurables 9.1 2.6 1.2 0.5 -2.0Services 71.3 1.6 0.2 0.5 -1.1 Transportation 3.6 3.3 1.3 1.4 -1.9 Communications 3.0 2.7 1.8 1.4 -1.3 Public Utilities 3.3 3.1 0.4 2.4 -0.7 Wholesale Trade 7.6 0.4 1.0 2.7 2.3 Retail Trade 10.1 1.2 0.4 1.0 -0.2 Finance 21.4 -0.6 -0.9 -0.5 0.1 Other Services 22.4 0.3 -0.6 -0.8 -1.2
Finance, Insurance and Real Estate 21.4 -0.6 -0.9 -0.5 0.1 Depository and Nondepository Inst. 4.3 -1.4 -3.2 -3.7 -2.3 Security and Commodity Brokers 0.9 -0.6 3.6 9.0 9.5 Insurance Carriers 1.6 0.6 -2.3 2.1 1.5 Insurance Agents 0.7 -0.9 -0.7 0.0 0.9 Real estate 13.7 .. .. .. .. Nonfarm housing 10.3 .. .. .. .. Other 3.4 -0.7 0.1 0.4 1.1 Holding and Investment Offices 0.2 -3.5 -0.9 2.2 5.6Finance less nonfarm housing 11.1 -0.9 -0.9 -0.3 0.6
Other Services 22.4 0.3 -0.6 -0.8 -1.2 Hotels and other lodging 0.9 0.3 -0.1 2.6 2.3 Personal services 0.2 0.7 -0.8 -0.4 -1.1 Business and professional 0.8 -1.3 0.0 -0.2 1.1 Auto repair 1.0 1.5 -1.3 -1.0 -2.6 Miscellaneous repair 0.3 -0.1 -1.7 -3.2 -3.1 Motion pictures 0.4 -0.2 0.5 -1.6 -1.4 Amusement and recreation 0.9 -0.7 0.9 0.0 0.7 Health services 6.9 -0.3 -1.8 -2.6 -2.3 Legal services 1.7 0.5 -2.6 -1.0 -1.5 Educational services 0.9 0.0 -0.4 -0.9 -0.9 Social services and membership org. 1.4 0.1 -0.3 -0.6 -0.8 Private Households 0.2 .. .. .. ..Source: table 2 plus capital stock data of the Bureau of Economic Analysis and authors' estimatesas described in the text.

25
Table 4. Output Versus Product and the Proportion of Output Directed to Final Demand
Gross Output/Product FinalProduct Ratio Demand
Industry Percentage Annual Percent Share MethodologyShare (1992) Change (percent)
(1) (2) (3) (4)
Total Private Sector 100.0 .. .. ..Agriculture 2.1 -2.1 21.0 ddMining 1.7 -1.5 4.2 ddConstruction 4.3 -0.6 76.5 ddManufacturing 19.8 -0.4 51.4 dd Durables (ex elect.) 7.8 -0.2 51.6 dd Electronics 2.8 0.0 58.9 dd Nondurables 9.1 -0.5 49.2 ddServices 71.3 .. 63.9 .. Transportation 3.6 .. 43.9 dd Communications 3.0 .. 54.0 dd Public Utilities 3.3 0.6 45.2 dd Wholesale Trade 7.6 -2.8 49.0 dd Retail Trade 10.1 -1.0 89.9 dd Finance 21.4 0.0 64.4 .. Other Services 22.4 .. 64.7 ..
..Finance, Insurance and Real Estate 21.4 .. 64.4 Depository and Nondepository Inst. 4.3 .. 63.0 x Security and Commodity Brokers 0.9 2.3 41.7 dd Insurance Carriers 1.6 1.4 83.7 dd Insurance Agents 0.7 -0.5 0.4 dd Real estate 13.7 .. .. Nonfarm housing 10.3 .. .. Other 3.4 .. 41.0 dd Holding and Investment Offices 0.2 .. 41.7 xFinance less nonfarm housing 11.1 .. 50.6
..Other Services 22.4 .. 64.7 Hotels and other lodging 0.9 0.9 53.7 dd Personal services 0.2 0.9 74.4 dd Business and professional 0.8 .. 20.7 x Auto repair 1.0 1.0 57.4 dd Miscellaneous repair 0.3 3.0 74.4 dd Motion pictures 0.4 1.5 66.0 dd Amusement and recreation 0.9 .. 66.0 dd Health services 6.9 1.9 97.6 dd Legal services 1.7 1.1 29.3 dd Educational services 0.9 .. 92.8 dd Social services and membership org. 1.4 .. 92.8 x Private Households 0.2 .. 92.4 ddFor the methodology, dd represents double-deflation, and x represents extrapolation with employment orwage deflation

26
Table 5
Growth Rates, Expenditures and Prices, Mental Health Treatments, 1972-95
Price indexes(percent increase) Real expenditure growth
Annualexpendituregrowth rates Unadjusted Adjusted Unadjusted Adjusted
1985-90 7.06 8.78 -1.11 -1.54 8.311990-95 4.94 6.47 -0.04 -1.37 5.02
1985-95 6.00 7.62 -0.58 -1.46 6.66
source: Triplett, 1999b