Estimating industry-level multifactor productivity for the ... · 1 Estimating industry-level...
58
1 Estimating industry-level multifactor productivity for the market-sector industries in Australia: methods and experimental results Simon Zheng * Analytical Services Branch Australian Bureau of Statistics Email: [email protected] October 2004 * This is a revised version of the paper presented at the Asia Pacific Productivity Conference, 14-16 July 2004, Brisbane, Australia. The views expressed in the paper are those of the author and do not necessarily reflect those of the Australian Bureau of Statistics. Where quoted or used, they should be attributed to the author. I would like to thank Bert Balk (Erasmus University and Statistics Netherlands), Steve Dowrick (Australian National University), Kevin Fox (University of New South Wales) and Tarek Harchaoui (Statistics Canada) for their constructive and insightful comments. I am grateful to Shiji Zhao, Carl Obst, Ian Bobbin, Charles Aspden, Ken Tallis and other members of the project board for the helpful comments, guidance and encouragement. I would also like to thank Leon Ting, Rick Brunton, Peter Hawkes and Derek Burnell of the National Accounts Branch for providing the data as well as the information about the issues associated with the sources and construction of the data used for this project. Needless to say, any errors and omissions are the responsibility of the author.
Transcript of Estimating industry-level multifactor productivity for the ... · 1 Estimating industry-level...

1
Estimating industry-level multifactor productivity for the market-sector industries in Australia:
methods and experimental results
Simon Zheng*
Analytical Services Branch Australian Bureau of Statistics
Email: [email protected]
October 2004
* This is a revised version of the paper presented at the Asia Pacific Productivity Conference, 14-16 July 2004, Brisbane, Australia. The views expressed in the paper are those of the author and do not necessarily reflect those of the Australian Bureau of Statistics. Where quoted or used, they should be attributed to the author. I would like to thank Bert Balk (Erasmus University and Statistics Netherlands), Steve Dowrick (Australian National University), Kevin Fox (University of New South Wales) and Tarek Harchaoui (Statistics Canada) for their constructive and insightful comments. I am grateful to Shiji Zhao, Carl Obst, Ian Bobbin, Charles Aspden, Ken Tallis and other members of the project board for the helpful comments, guidance and encouragement. I would also like to thank Leon Ting, Rick Brunton, Peter Hawkes and Derek Burnell of the National Accounts Branch for providing the data as well as the information about the issues associated with the sources and construction of the data used for this project. Needless to say, any errors and omissions are the responsibility of the author.

2
Abstract To meet users� demand, the Australian Bureau of Statistics (ABS) has embarked on a project of estimating industry-level multifactor productivity (MFP). This paper discusses the methodological choices, data construction and measurement issues involved in the estimation. We present the experimental estimates of MFP based on both gross output and value added for the 12 market-sector industries in Australia. Several related issues, which are important for the assessment and interpretation of the industry-level MFP estimates, are also discussed. They include the open versus closed economy MFP measures; the difference between the aggregate and industry-level approaches to the estimation of aggregate MFP; and the assumption underlying the Domar aggregation formula. We show that the Domar aggregation formula in its original form can be derived without using the restrictive assumption of equal prices for primary inputs across industries.

3
Table of contents Abstract .......................................................................................................................2 1. Introduction .........................................................................................................4 2. Concepts and methods......................................................................................6
2.1 Growth accounting and the aggregate MFP index...............................................7 An alternative aggregate MFP index .....................................................................9
2.2 Issues of index numbers.....................................................................................10 2.3 Developments and applications .........................................................................11 2.4 Input-output based approach..............................................................................12 2.5 Industry-level MFP measures ............................................................................14 2.6 Links between aggregate and industry-level MFP measures.............................17
3. Data and measurement issues......................................................................19 3.1 Output and intermediate inputs ..........................................................................19 3.2 Capital input.......................................................................................................21 3.3 Labour input.......................................................................................................23 3.4 Factor incomes ...................................................................................................24
4. Experimental results .......................................................................................27 5. Consistency in aggregation ...........................................................................35 6. The open versus the closed economy MFP index..................................38 7. Conclusions.........................................................................................................40 Appendix A: Comparing the components of industry-level and aggregate MFP indices..........................................................................................................................41
A1. Output measures................................................................................................41 A2. Capital services .................................................................................................43 A3. Labour input......................................................................................................44 A4. Concluding comments.......................................................................................45
Appendix B: The relationship between industry-level and aggregate approaches: an augmented Domar aggregation formula ............................................................46
B1. Aggregate production and productivity.............................................................47 B2. Industry-level production and productivity.......................................................48 B3. A decomposition of value added growth...........................................................49 B4. Domar aggregation formula in its original form ...............................................50 B5. An augmented Domar aggregation formula......................................................51
References................................................................................................................54
4
1. Introduction Productivity is one of the driving forces behind economic growth, and in the long run it also determines a country�s living standards and economic well being. Productivity statistics are therefore important indicators for policy makers, economic commentators, researchers and others who are interested in the issues of productivity and economic growth. The Australian Bureau of Statistics (ABS) publishes a variety of productivity measures in the Australian System of National Accounts (ASNA) (ABS Cat. No. 5204.0). The most comprehensive measure at present is the index of multifactor productivity (MFP) for the aggregate market-sector1. There are no official estimates of MFP dissected by industry; and the only available industry-level productivity estimates are based on labour productivity, which is a partial measure and unsatisfactory in a number of ways. Thus, a project was initiated by the ABS to estimate industry-level MFP in Australia for the purposes of statistical production. It intends to build on the results of the recent integration between the Australian national accounts and its input-output system. It also aims to expand the ABS productivity program to be in line with a few other leading international statistical agencies, such as the U.S. Bureau of Labour Statistics and Statistics Canada, that have a comprehensive productivity program covering both business sector and its constituent industries (Baldwin and Harchaoui 2004). This paper discusses several issues resulting from this project. Our emphasis is placed on the methodological choices, data construction and measurement issues associated with the estimation. We present the experimental estimates of MFP based on both gross output and value added for the 12 market-sector industries in Australia. The plausibility of these estimates is also assessed. Several related issues, which previously have not attracted much attention in the applied work on MFP, are also investigated. They include the open versus the closed economy MFP measures; the difference between the aggregate and industry-level approaches to the estimation of aggregate MFP; and the assumption underlying the Domar aggregation formula. These issues are found to be important in our work, since they will influence the result of our assessment of the experimental estimates and alter their magnitude and interpretations. From the perspective of statistical production, two approaches to estimating industry-level MFP are considered in the paper: the input-output based approach, which was developed by Statistics Canada (Durand 1996, Cas and Rymes 1991), and the one recently recommended by the OECD Productivity Manual (OECD 2001). The latter approach is closely related to the well-known framework developed by Jorgenson, Gollop and Fraumeni (1987), and is also a bottom-up, non-parametric approach based on production economics. After considering the current ABS data environment, our estimation of industry-level MFP follows the OECD approach and, hence, is able to facilitate international comparison. Using this approach, both gross output and value added based MFP indices are derived. 1 The market-sector in Australia consists of the following 12 industries: Agriculture, forestry and fishing, Mining, Manufacturing, Electricity gas and water, Construction, Wholesale, Retail, Accommodation, cafes and restaurants, Transport and storage, Communication, Finance and insurance, and Cultural and recreational.
5
Since aggregate market-sector MFP indices can also be derived from the industry-level estimates, aggregation provides a way of assessing the plausibility of the experimental industry-level MFP estimates. This is undertaken based on the results from a comparison between the MFP estimates aggregated from the industry-level results and those currently published by the ABS. It is noted, however, that the aggregate MFP estimates derived from the two approaches will not be identical, according to an aggregation relation derived by Jorgenson, Gollop and Fraumeni (1987), which augments the Domar aggregation formula (Domar 1961, Hulten 1978). A directly related issue is the assumption underlying the Domar aggregation formula. Aulin-Ahmavaara (2003) and Jorgenson, Gollop and Fraumeni (1987) state that the Domar aggregation formula in its original form requires the assumption that all the industries pay the same prices for their capital and labour inputs. However, in the paper we show that the original Domar aggregation formula can be derived without using this assumption. We also present open economy MFP estimates for the aggregate market-sector based on an approach suggested by Gollop (1983, 1987). There are several other approaches dealing with the issues of MFP measurement under the open economy, for example, Diewert and Morrison (1986), Fox and Kohli (1998), Kohli (1990, 2003), Durand (1996) and Cas and Rymes (1991); some of which are not in agreement with the approach proposed by Gollop (1983, 1987). However, the direct application of the other approaches within the framework of the non-parametric MFP estimation employed in this paper may not be as straightforward as the method suggested by Gollop (1983, 1987). It seems that a generally accepted solution to the open economy issue has yet to crystallise. This may be the topic for future work. The paper is organised as follows. The next section introduces the concepts and methods commonly used in MFP estimation. We discuss both aggregate and industry level approaches based on production economics. We also discuss some issues related to the choice of the index number formula. As an extension, MFP estimation based on the input-output system is also briefly discussed. The analysis of the links between aggregate and industry-level measures is included in Section 2. Section 3 focuses on the data and measurement issues. It discusses the issues of data treatment and construction for the estimation of industry-level MFP in the ABS data environment. Each of the components used for deriving the MFP index is considered in detail. The experimental MFP estimates for the 12 market-sector industries are presented in Section 4. By applying the appropriate aggregation rule, the industry-level MFP estimates are aggregated to the market-sector level, and the latter are then compared with the MFP estimates currently published by the ABS, which are derived using an aggregate approach. This is the way we assess the plausibility of the experimental industry-level MFP results. It also raises several issues of consistency in aggregation, which is a topic for Section 5. In Section 5, we present an augmented Domar aggregation formula derived by Jorgenson, Gollop and Fraumeni (1987) and discuss its implications for the
6
understanding of the difference between aggregate and industry-level approaches to the estimation of aggregate MFP. Section 6 presents the open economy MFP growth estimates for the aggregate market-sector based on the approach by Gollop (1983, 1987). The last section summarises the findings and concludes. 2. Concepts and methods Productivity is generally defined as the ratio of a volume measure of output to a volume measure of input. The single-factor (or partial) measure of productivity includes only one type of input, for example, the labour or capital input corresponds to the labour or capital productivity measures. When it includes all types of inputs used in the production, the corresponding productivity measure is called multifactor productivity (MFP) (also known as total factor productivity, TFP). This definition of productivity is quite simple. However, the measurement of productivity is not straightforward. There are various complex issues involved in the measurement of output, input and other components used for deriving the MFP estimates. In fact, the reliability of an aggregate MFP measure for the whole economy is determined by how well the aggregate output, capital and labour, and factor incomes are measured; these aggregates in turn depend on almost every aspect of the national accounts. Moreover, there are various frameworks under which the MFP measure can be obtained. The same productivity measure under different approaches often uses different assumptions, and thus will give rise to different interpretations. Therefore, there are two closely related issues involved in MFP estimation � the measurement issue and the issue of applying the appropriate method. Oulton and O�Mahony (1994) essentially express the same view as ours on the measurement of MFP:
��that measurement matters: at every stage of an MFP calculation, empirical and conceptual issues must be faced. Alterative decisions by the researcher can have profound effects on the resulting estimates. That is why it is important to follow a consistent methodology.� Oulton and O�Mahony (1994, pp. 3)
This section focuses on the methodological issues. Before embarking on this task, a few words on the interpretation of MFP estimates are worth mentioning at the outset. In general, the MFP measure is intended to capture the change in productive efficiency. Under a production function framework, MFP growth can be solely attributable to technological progress. This may be one of the reasons why in many applied work involving MFP, the terms �technological progress� and �MFP change� have been used interchangeably without making explicit distinctions between the two concepts. It can be shown, however, that the estimated MFP growth could reflect the

7
combined effects of technological change, economies of scale, efficiency change, variations in capacity utilisation and measurement errors2. 2.1 Growth accounting and the aggregate MFP index There is a close relationship between MFP measure and the economic theory of production. The growth accounting framework set out by Solow (1957) provides a derivation of the MFP measure based on an aggregate production function. This production function includes only one (aggregate) output and two types of aggregate inputs, capital and labour, with technology as an additional variable shifting over time. More specifically, the aggregate value added production function with the Hicks neutral technological change can be represented as
( , , ) ( ) ( )V F K L t A t f K,L= = (1) where V is the real aggregate value added and K and L are physical capital and labour inputs respectively, t denotes time and A(t) is a technology parameter measuring the factor-neutral shift (also called Hicks-neutral or disembodied technological change) in the production function3. Under the growth accounting framework, output growth under equation (1) is decomposed into the contributions of the growth in inputs and the growth in MFP by differentiating totally with respect to time. This yields the following expression,
� � �K L VV K Lη η τ= + + (2)
where KF KK F
η ∂=∂
and LF LL F
η ∂=∂
are elasticities of output with respect to capital
and labour; ln� d XXdt
= denotes the growth rate under continuous-time for any
2 For a detailed discussion on the interpretation of MFP and other productivity measures at aggregate and industry levels, see OECD (2001). See also Balk (2003b) for the link between the MFP/TFP measure and profitability, and particularly, for the meaning of productivity change at the individual firm level, as well as the potential uses of the MFP/TFP measure as instruments for monitoring and benchmarking firm performance. The methodology used to estimate the ABS� aggregate MFP is discussed in Aspden (1990). See Hulten (2001) for a short biographical account of the development of MFP/TFP measures. 3 A more general case based on the existence of an aggregate production possibility frontier can also be used to derive the index of technological progress (e.g. Hulten 1978). The approach using aggregate production function is the most popular one for deriving the aggregate MFP measure. However, it is quite restrictive, since the existence of an aggregate production function implies that all industries have the same production function, up to a multiplicative factor (Jorgenson, Gollop and Fraumeni 1987). This also raises an issue of consistency in industry-level MFP aggregation, which will be discussed in detail in Section 5. Note also that MFP indices derived from the production function could also serve as useful measures of productivity growth when technological change is of a more general nature, and not necessarily Hicks-neutral.

8
variables (in equation (2) X = V, K, L); and ln �V
F At
τ ∂= =
∂, denoting the Hicks
neutral (or disembodied) technological change, also representing the index of MFP growth based on value added measure of output4. The expression in equation (2) indicates that the growth rate of real value added can be attributed to the growth rates of physical capital and labour, both weighted by the respective output elasticities, and also to the growth rate of the Hicks neutral technology index. MFP growth within this theoretical framework is therefore a direct measure of the Hicks-neutral technological progress. Looking at it differently, under the growth accounting framework technological progress or productivity change is captured by a residual, that is, the growth of output which is not due to the growth of inputs. Note that the output elasticities are not directly observable. However, when the production process is further assumed to have the properties of constant returns to scale and competitive equilibrium in both output and input markets, equation (2) can now be written as, � � �
V K LV s K s Lτ = − − (3)
where K KV
rKsp V
η≡ = and L LV
wLsp V
η≡ = , r, w and Vp are the aggregate returns to
capital, labour and the price of real value added respectively. Thus, the factor income shares are equal to the respective output elasticities. This is the result of the assumption of competitive equilibrium in both output and input markets. It implies that price is equal to marginal cost and each input is paid the value of its marginal product. Also, 1K Ls s+ = due to the assumption of constant returns to scale. The last two terms on the right hand side of equation (3) form a Divisia index of total input growth. Considering any two discrete points of time, , 1t t − , equation (3) under a discrete approximation then becomes
[ ] [ ] [ ]ln ( ) ln ( 1) ln ( ) ln ( 1) ln ( ) ln ( 1)V K LV t V t s K t K t s L t L tτ = − − − − − − − − (4)
where
[ ] [ ]1 1( ) ( 1) , ( ) ( 1)2 2K K K L L Ls s t s t s s t s t≡ + − ≡ + − .
The combination of capital and labour in the above equation is a Tornqvist index which is a discrete approximation to the Divisia index in equation (3). With the 4 The Hicks neutral technological change occurs if the competitive economy maintains the existing capital-labour ratio for a given factor prices in response to the arrival of new production technologies. Given the real factor price for capital, the technological change is Harrod-neutral if the capital-output ratio remains constant in response to the innovation (Gomulka, 1990). MFP growth is often interpreted as the Hicks neutral technological change, while the concept of Harrod-neutral technological progress is more frequently used in theoretical models of economic growth.

9
available data on volume measures of value added and inputs as well as the data on factor income shares at any two points of time, the rate growth in MFP can be readily estimated using equation (4). This method of estimating MFP is known as the non-parametric technique under the growth accounting framework.
An alternative aggregate MFP index The aggregate MFP index of equation (3) uses real value added as the measure of output. It has been suggested in the literature (for example, Hulten 1978, Domar 1961, Gollop 1987) that the aggregate deliveries to final demand is an equally valid measure of aggregate output. It measures goods destined for final demand that are the ultimate objective of economic production. The value of aggregate deliveries to final demand exceeds the value of aggregate value added by an amount equal to the value of imported intermediate inputs5. Thus, the aggregate MFP can be derived in a similar way as that based on value added using the volume measure of aggregate deliveries to final demand and the corresponding measures of inputs. It yields the following aggregate MFP index based on deliveries to final demand,
! "� � imFD
FD FD FD
p IMrK wLFD K L IMp FD p FD p FD
τ
= − − −
(5)
where FD stands for aggregate deliveries to final demand; IM is the aggregate imported intermediate inputs; PFD and Pim are the aggregate prices for deliveries to final demand and imported intermediate inputs respectively; ! ln /FD d FD dt= and " ln /IM d IM dt= . As can be seen, the imported intermediate inputs are treated as the additional primary inputs symmetric to both capital and labour in the above MFP index. Clearly, this formulation of MFP will result in different estimates from those derived from equation (3) in terms of the magnitude. More importantly, it also has its own unique interpretation. According to Gollop (1983, 1987), this MFP index adjusts for the productivity growth under the open economy, while the conventional MFP index as that in equation (3) makes no such distinctions, thus the latter is only appropriate for a closed economy. In a closed economy, deliveries to final demand is equal to value added, and IM = 0, since all intermediate inputs are produced domestically and there are no imports. Thus, the above index will be identical to the index in equation (3), the aggregate MFP index based on value added. The distinction between the open and closed economy MFP indices will be further discussed in Section 6.
5 The aggregate measure of delivery to final demand is not to be confused with the concept of final demand which relates to the expenditure side of GDP; i.e. GDP(E)≡Final Demand � Total imports (including both imported intermediate inputs and imported final products). For the measure of delivery to final demand, it has the following accounting identity: Deliveries to Final Demand≡GVA (gross value added) + Imported intermediate inputs.

10
2.2 Issues of index numbers As mentioned at the beginning, MFP is defined as the ratio of volume measure of output over the volume measure of input. At some level of aggregation, these volume measures have to be derived from the index numbers. Thus, without using the production function and the associated assumptions, the MFP estimates can also be derived solely based on the index numbers. However, there are numerous different index number formulae available when constructing the volume output and input measures. The early index number literature tends to focus on the axiomatic (or test) approach to the choice of the index number formula. Since the 1970s, the emphasis of the index number literature has shifted to the use of economic theory as a basis for the choice of index numbers. In a path-breaking paper, Diewert (1976) showed how economic theory, in particular, production functions, could also be used to provide a basis for determining which index number formulae are appropriate and least restrictive. This is the economic-theoretic approach to index numbers. Clearly, the measurement of the ratio of output over input does not require any parametric estimation. Thus, the index number approach to MFP estimation is also called the �non-parametric approach�. This name , however, has been used to describe the technique of MFP estimation based on equations (1) to (4). Confusingly, the latter technique is also called the index number approach by some researchers, presumably since the volume measures of output and inputs have to be derived with the use of index numbers. Adding to this confusion is the fact that other non-parametric methods � for example, data envelopment analysis (DEA) � can also be used to derive productivity indices. To clarify this terminological confusion, this paper uses the term �the non-parametric technique under the growth accounting� to refer to the MFP index derived from equations (1) to (4). Indeed, this is our preferred approach to the MFP estimation because of its non-parametric nature as well as economic interpretation. As mentioned before, many different index number formulae can be used to derive the volume input and output measures. The Tornqvist index is considered to be exact for the translog function, and to be superlative, since the translog function is a flexible functional form, that is, it provides a second-order approximation to any arbitrary function. The Fisher index is exact for a quadratic function and thus is also superlative (Diewert 1976). Empirically, when a chained index is employed, the spread between the estimates constructed using the different index formulae, e.g. the Paasche and Laspeyres indices, is reduced. Nonetheless, Diewert (1992) concludes that there are strong economic justifications for using the Tornqvist or Fisher indices in productivity analysis. Based on these results, both the Tornqvist and Fisher quantity indices are preferred volume measures for the measurement of output and inputs in the application of equation (4). However, when applied to the actual data, there is little difference between the results from using the two index number formulae � they are often identical up to two decimal points. Despite the fact that the Fisher index can be used, in the empirical literature on productivity measurement the MFP index in equation (4) is sometimes referred to as the Tornqvist index of MFP growth. Perhaps, it particularly refers to the Tornqvist index as a discrete approximation to the Divisia

11
index for combining capital and labour in the MFP formulation of equation (3), rather than to the specific index formulae used for deriving the volume measures. 2.3 Developments and applications The empirical methodology using the non-parametric approach to MFP estimation under the growth accounting has been further developed and refined over the years. The major methodological innovations under this approach include the quality adjustment of labour input and the adjustment for capital utilization, for example, in the work by Jorgenson and Griliches (1967), and extension of the aggregate framework to the industry or sectoral levels e.g. Jorgenson, Gollop and Fraumeni (1987). The industry-level productivity measure proposed by the latter group of authors is also known as the KLEMS MFP (OECD 2001), since it is derived from a production function based on gross output and including all types of inputs which are generally classified into capital (K), labour (L), energy (E), material (M) and services (S). The dataset specially designed for deriving this type of MFP measure is called the KLEMS database. Another strand of development within this approach is to consider the case where the technological progress is not of the Hicks neutral form; rather, it is embodied in capital. Although this is a somewhat theoretical issue (Hercowitz 1998), its potential impact on the MFP estimates derived from the non-parametric approach under the growth accounting has been noted and discussed in Jorgenson (1964) and Hulten (1973, 1974). Recent progress on this issue has been made by Hulten (1992a), Gordon (1990), Greenwood, Hercowitz and Krusell (1997) and Greenwood and Boyan (2001). In terms of empirical applications, the non-parametric approach under the growth accounting framework has been used extensively to analyze the issues such as productivity slowdown in the 1970s and early 1980s � the �productivity paradox�. It has continued to appear in the work on economic growth and productivity till this day, particularly with the rising interest in the assessment of the impact of information and communications technology (ICT) on the recent productivity surge (e.g. Jorgenson 2003, 2001, Schreyer 2000, Oliner and Sichel 2000). Since the 1980s, several national statistical offices in OECD countries have been using the non-parametric technique under the growth accounting framework to regularly publish the annual MFP estimates for the aggregate economy or at the industry level. Together with the labour and capital productivity estimates, they form the complete set of productivity accounts. The ABS publishes annual estimates of labour, capital and MFP for the market-sector, and annual labour productivity indexes for each industry division within the market-sector. As noted before, the MFP index can also be estimated by other methods, some of which do away with the need for imposing the two simplifying assumptions � constant returns to scale and competitive equilibrium which are necessary under the non-parametric growth accounting approach. For example, econometric techniques can be applied to estimate the parameters of a production function with some specific
12
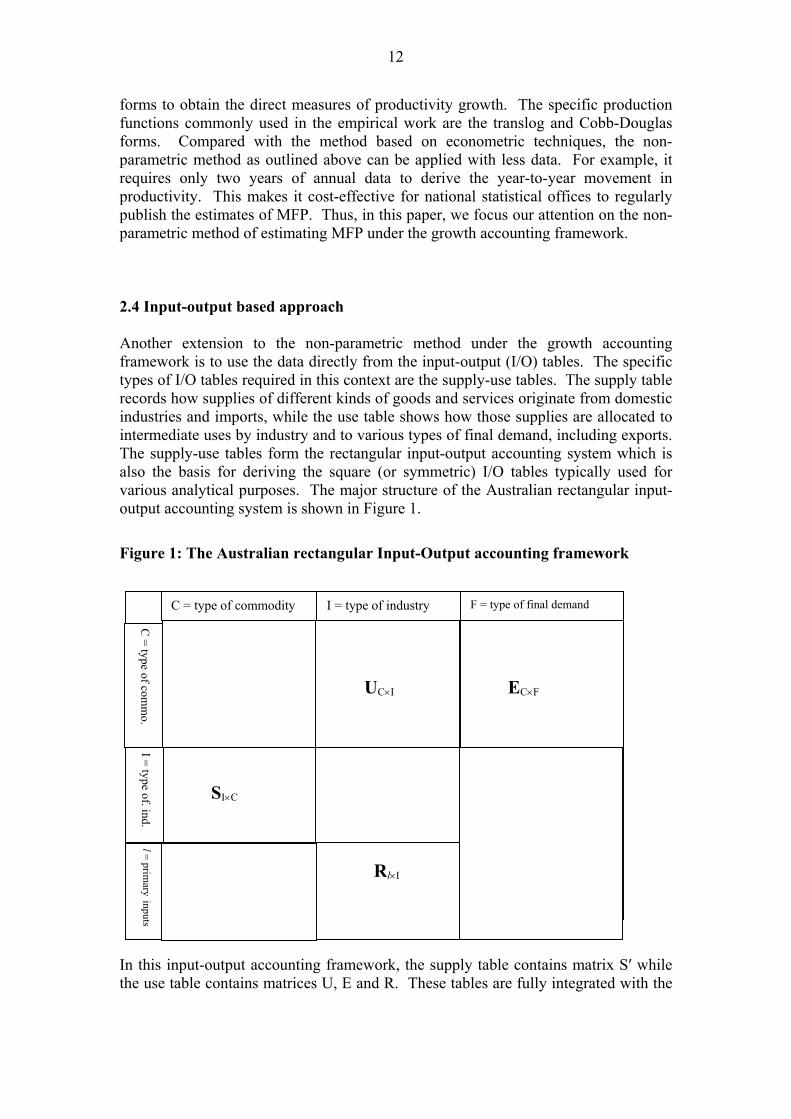
forms to obtain the direct measures of productivity growth. The specific production functions commonly used in the empirical work are the translog and Cobb-Douglas forms. Compared with the method based on econometric techniques, the non-parametric method as outlined above can be applied with less data. For example, it requires only two years of annual data to derive the year-to-year movement in productivity. This makes it cost-effective for national statistical offices to regularly publish the estimates of MFP. Thus, in this paper, we focus our attention on the non-parametric method of estimating MFP under the growth accounting framework. 2.4 Input-output based approach Another extension to the non-parametric method under the growth accounting framework is to use the data directly from the input-output (I/O) tables. The specific types of I/O tables required in this context are the supply-use tables. The supply table records how supplies of different kinds of goods and services originate from domestic industries and imports, while the use table shows how those supplies are allocated to intermediate uses by industry and to various types of final demand, including exports. The supply-use tables form the rectangular input-output accounting system which is also the basis for deriving the square (or symmetric) I/O tables typically used for various analytical purposes. The major structure of the Australian rectangular input-output accounting system is shown in Figure 1.
Figure 1: The Australian rectangular Input-Output accounting framework
In this input-output accounting framework, the supply table contains matrix S′ while the use table contains matrices U, E and R. These tables are fully integrated with the
UC×I
SI×C
I = type of industry C = type of commodity
C = type of com
mo.
I = type of. ind.
EC×F
F = type of final demand
Rl×I
l = primary
inputs

13
Australian national accounts. For estimating MFP using the I/O based approach, both current and constant prices supply-use tables are required. The I/O based approach to MFP estimation has been developed and adopted by Statistics Canada for its productivity accounts (Cas and Rymes 1991, and Durand 1993, 1996)6. From the perspective of national statistical offices, this is an important development, since the I/O based approach provides a unified framework under which aggregate as well as various classes of industry-level MFP measure can be derived consistently7. These classes of industry-level MFP measure capture the different levels of integration among the industries. The notion of integration is traditionally a useful concept of describing the interconnectedness among different production units in a production system typically depicted by the I/O framework. It is formalised by Pasinetti (1981) in the analysis of the economic system. Under this system, all production processes are considered as vertically integrated, in the sense that all their inputs are reduced to inputs of labour and to services from capital stock. It turns out that this notion of vertical integration is also particularly useful in the interpretation of the relationships between the different classes of industry-level productivity indices under the I/O based approach to MFP. In a dynamic I/O system, one class of the industry-level MFP indices is capable of dealing explicitly with one special characteristic of capital, that is, its reproducibility (Durand 1996). The reproducibility of capital is an important theoretical and empirical issue that had triggered many years of debate and research in the economics profession. Indeed, this notion of capital was the initial impetus to the work by Rymes (1972) who developed a �new� MFP measure under the consideration of the economic system to refute the MFP concept derived from the Hicks neutral technological progress. This �new� measure of MFP is dubbed the Harrod-Robinson-Read (HRR) measure of MFP by Rymes (1983). As Hulten (1992b) notes, however, that the Hicksian and the HRR concepts of technological change are complements, not competitors. Indeed, the latter measure has been empirically implemented using US and Canadian data. Nonetheless, this notion of capital and the related productivity measure have not caught much attention of mainstream economists. Despite this, the estimates of various classes of industry-level MFP under the I/O based approach are expected to generate some new interpretations and insights to enrich our understanding of productivity dynamics among the industries in the economy. In addition, this approach will be particularly useful if full integration between the I/O system and the national accounts is established. It can ensure consistency among different classes and levels of productivity estimates. Thus, the I/O based approach was our initial choice of the methodology to be used to estimate industry-level MFP. In our early exploratory work with this method, we
6 For the details of this method, see Durand (1993, 1996). For a summary of this method and the corresponding productivity indices, see Zheng et al. (2002). 7 The productivity index specific to a particular commodity aggregate can also be derived under this approach. For details see Durand (1993, 1996).
14
found that one additional, yet critical requirement for successfully applying this approach is to have fully balanced supply and use tables available also in constant prices. However, the constant prices supply-use tables currently complied by the ABS do not meet this requirement8. This had caused the compositional distortions at the detailed commodity level and resulted in some implausible estimates of MFP at both industry and aggregate levels from our early exploratory work. Unfortunately, the fully balanced constant prices supply-uses tables are costly to compile, but they have great impact on the quality of the MFP estimates derived from the I/O based approach. As a result, we had to abandon this approach in our estimation of industry-level MFP. 2.5 Industry-level MFP measures At the industry level or other lower levels of aggregation, MFP can be estimated with different measures of outputs and inputs. This is a salient feature of the I/O based approach as discussed previously. It can also be incorporated into the approach based on the production functions without relying on the supply-uses tables where there are detailed flows of commodities among industries. Different measures of outputs and inputs essentially reflect different representations of the same production process in a particular industry. One such representation is a measure of gross output together with intermediate inputs (both imported and domestically produced) and primary inputs (i.e. capital and labour). For the ith industry, the gross output based production function can be represented as
( , , , )i i i i iG H M K L t= (6) Another representation uses value-added as a measure of output and includes the two types of primary input. The production function based on value added is ( , , )i i i iV F K L t= (7) where G denotes the volume of gross output, M, the volume of intermediate inputs including both the imported and domestically produced, and the superscript i indicates the industry associated with these variables. The existence of the industry-level value-added functions iV implies that industry-level production of gross output is characterised by value-added separability (Jorgenson, Gollop & Fraumeni 1987) 9:
8 For a particular commodity in constant price, its total supply may not be equal to its total use in the constant prices supply-uses tables currently compiled by the ABS. This problem is mainly due to the lack of adequate deflators at the detailed commodity level as well as the shortage of accurate information about the flows of various commodities in constant prices among the use and supply industries. However, for many industry-level statistics based on the supply-use tables, e.g. the gross output, intermediate inputs and valued added by industry in constant prices, they are balanced at the industry-level. For the measurement of these statistics and other aggregate estimates, such as GDP, they are without commodity dimensions, thus balancing at commodity level is not essential. 9 Under the framework developed by Balk (2003a and 2003b), this assumption of separability is not necessary for the existence of a value-added function.

15
[ , ( , , )]i i i i i iG H M F K L t= (8)
The productivity measures corresponding to equations (6) and (7) are called (industry-level) gross output MFP and value-added MFP indices. Denoting respectively by i
Gτ and i
Vτ , they can be derived using equations (6) and (7) under the assumptions of constant returns to scale and competitive equilibrium as before, and are shown in the following,
� � � �i i i i i i i iG M K LG s M s K s Lτ = − − −# # # (9)
� � �i i i i i i
V K LV s K s Lτ = − − (10) 10
where i i
i xx i i
G
p xsp G
=# , , ,or x K L M= . Note that the factor income shares is% and is are
labelled differently in the above equations due to different measures of output used in the denominator. The Tornqvist versions of equations (9) and (10) are as follows:
ln ( ) ln ( 1) ln ( ) ln ( 1)
ln ( ) ln ( 1) ln ( ) ln ( 1)
i i i i i iG M
i i i i i iK L
G t G t s M t M t
s K t K t s L t L t
τ = − − − − − − − − − − −
#
# # (11)
ln ( ) ln ( 1) ln ( ) ln ( 1)
ln ( ) ln ( 1)
i i i i i iV K
i i iL
V t V t s K t K t
s L t L t
τ = − − − − − − − −
(12)
where
1 ( ) ( 1) , ( , , )21 ( ) ( 1) , ( , ) 2
i i ij j j
i i iq q q
s s t s t j K L M
s s t s t q K L
≡ + − =
≡ + − =
# # #
Based on economic theory, the gross output MFP growth index is intended to measure the Hicks neutral technological progress in an industry, whereas the value-added MFP growth index reflects the industry�s capacity to translate technological change into income and into the contribution to final demand. Thus, the two productivity indices
10 The gross output and value-added MFP measures can also be derived solely from the accounting relationships and the index number theory, without requiring any economic theory. For this derivation under a rigorous approach, see, for example, Balk (2003a). Balk (2003a) also derives the conditions under which the two MFP indices are path-independent. Path-independence implies that the productivity index between two points in time depends only on the realisation of input and output variables at these two points in time, and not on the specific �path� that links the two observations.

16
are not identical measures of technological change, but they complement each other to reflect an industry�s productivity performance11. There have been debates over whether gross output or value added, or some other measures are more appropriate in measuring output and thus the corresponding productivity at the sector/industry level. Although ample reasons have been provided by both sides of the arguments, in this paper we adopt the view advocated by the OECD (OECD 2001) that both measures, and indeed some other measures are all valid under their particular constructs, and they complement each other to help our understanding of different aspects of an industry�s production and productivity performance. From the perspectives of a national statistical agency, a relevant productivity program is expected to provide a variety of productivity measures to meet different analytical needs. These different measures may also be used to ascertain the quality of the data. If for a particular industry, the gross output and value added based MFP measures tell a different story, then one may suspect some quality issues with the underlying data. It turns out that there is a direct relation between the gross output and valued-added MFP measures (Bruno 1978). For a particular industry, the gross output MFP growth index is equal to the value added MFP growth index multiplied by a factor, which is equal to the ratio of nominal value of the industry�s value added to its gross output:
i ii iVG Vi i
G
p Vp G
τ τ
=
(13)
Since the multiplying factor is smaller than one, the gross output MFP growth index is systematically smaller than its value added counterpart in absolute value. This difference in magnitude between the two productivity indices does not constitute a bias, but reflects the difference in interpretation as mentioned above12. This relationship between the two MFP measures can be clearly observed in the experimental estimates of MFP which will be presented in Section 4. It must be noted, however, that at the industry level, the value-added MFP measure is more sensitive to �outsourcing� than its gross output counterpart. Heuristically, this can be illustrated in the following example using the relationship in equation (13). However, for a fuller illustration using the input-output data and some specific, real world cases, see OECD (2001, pp. 26-29).
11 Here the Hicks neutrality is defined as the form of technological change augmenting both intermediate and primary inputs used in production. Balk (2003a) uses the term �Hicks input neutrality� to refer to this particular form of technological change. The type of technological progress augmenting only the primary inputs is labelled as the �Hicks value added neutrality�, which corresponds to the technological concept associated with equation (7). In this sense, both gross output and value added based MFP are valid measures of technological change; they reflect different aspects of the same phenomenon, but they are not identical and thus given different interpretations, as those in the main text. 12 For a formal derivation of this relationship, see Gollop (1979). See also Balk (2003a), for a derivation of this relationship under a framework that does not rely on the production functions.

17
Suppose that technological progress in the car manufacturing industry has maintained a constant rate for a certain period of time (i.e. i
Gτ is constant over the period). For some reasons, however, many car manufacturers in the industry now start importing the car parts previously produced by the workers within the industry. Thus, less people are employed in the car industry now. Assuming that the value of the industry�s total numbers of car sold (the value of gross output) stays the same as in the previous period, while the total value of the inputs used in the car manufacturing industry is also assumed to be constant � the reductions in payrolls for the workers of producing the car parts are now transferred to the increased cost of intermediate inputs (imported car parts). Thus, there is a decrease in value added in the car manufacturing industry in the current period. In terms of equation (13), i
Vτ , the value added based MFP growth for the car manufacturing industry will be greater than in the previous period. However, this is not due to a technological breakthrough that occurred in the industry; it is only because the effect of reallocation of inputs � �outsourcing�, i.e. the
ratio of nominal value of the industry�s gross output to its value added i iGi iV
p Gp V
is
now greater than in the previous period. 2.6 Links between aggregate and industry-level MFP measures Given the two measures of industry-level MFP indices presented above, the question now is how to obtain a consistent measure of MFP at the aggregate level. The aggregation establishes a link between different levels of the economy. It can be used to answer questions such as the contribution of individual industries to overall productivity growth and also be used to validate the consistency of the industry-level and the aggregate MFP estimates. For the value-added MFP growth index, it seems natural to use each industry�s current price share in total value-added as weights for aggregation, since the current price industry-level value-added sums to aggregate value-added. That is,
i i
iVV Vi i
i V
p Vp V
τ τ
′ =
∑ ∑ (14)
It must be noted, however, that the economy-wide MFP growth estimates derived from the industry-level aggregation as shown in the above equation will not generally be equal to the MFP growth estimates based on the aggregate approach as presented in equation (3) (i.e. V Vτ τ′ ≠ ). This point will be discussed further in the following as well as in Appendix B. It is worth repeating that the value-added MFP measure could be interpreted as an industry�s capacity to contribute to economy-wide productivity and final demand (see also footnote 11). The link between aggregate and industry-level MFP measure based on gross output is not obvious, since the gross output MFP index includes intermediate inputs in both its output and input measures. Domar (1961) showed that the measure of industry-level

18
MFP growth based on gross output can be correctly aggregated to the economy-wide level using the weights which are equal to the nominal values of each industry�s gross output to aggregate valued-added. This is shown in the following equation:
i i
iGV Gi i
i V
p Gp V
τ τ
′ =
∑ ∑ (15)13
This aggregation rule is known as Domar aggregation and was formally derived by Hulten (1978). It has been argued that this form of the Domar aggregation formula requires the assumption that all the industries pay the same prices for their capital and labour inputs (Aulin-Ahmavaara 2003 and Jorgenson, Gollop and Fraumeni 1987). Without using this and other restrictive assumptions concerning the outputs and inputs, Jorgenson, Gollop and Fraumeni (1987) derived an augmented Domar aggregation formula which includes terms that capture the contributions of reallocations of sectoral value added and the primary factor inputs to aggregate productivity growth. However, Appendix B shows that Domar aggregation in its original form as presented in equation (15) can still be derived without the assumption of equal primary input prices across industries. Nonetheless, the augmented Domar aggregation formula of Jorgenson, Gollop and Fraumeni (1987) provides a systematic way to explain the differences between the aggregate MFP estimates derived from the aggregate and industry-level approaches. As will be seen in Section 5, understanding and explaining these differences form an important part of our exercise of validating the experimental industry-level MFP estimates presented in Section 4. Notice that the weights in equation (15) sum to more than one, implying that aggregate MFP growth will exceed the weighted average of the productivity growth of its component industries when the industry-level MFP is measured based on gross output. The weights are called the Domar weights because of this characteristic. The intuitive justification for the Domar weights is that an industry contributes not only directly to aggregate MFP growth by efficiently producing its final product, but also indirectly through helping to lower costs elsewhere in the economy when other industries purchase its product as intermediate input. From the input-output based MFP methodology, the gross output MFP measure is interpreted as a non-integrated (or integrated at establishment level) measure, whereas the MFP index based on value-added is a fully integrated measure. At the level of aggregate economy, all industries are fully integrated. For the value added industry-level MFP, which is a fully integrated productivity index, performing aggregation alone is sufficient to derive the aggregate MFP index. To aggregate gross output industry-level MFP measure, however, one has to perform both aggregation as well as integration. Thus, the Domar weights are also called aggregation-integration weights because they are used to perform these dual functions (Durand 1993, 1996). This interpretation under the I/O based approach may provide further intuitive justification for our understanding of the uniqueness of the Domar weights.
13 If one accepts that there is a distinction between the MFP formulations under the open and the closed economy settings, and if one also follows the approach to this issue by Gollop (1987), then equation (15) should be modified by replacing value added with deliveries to final demand in the weights. This modified version of the Domar aggregation formula is also used in OECD (2001). The issue of the open versus the closed economy MFP will be further discussed in Section 6.

19
There are many analytical implications of the Domar aggregation rule. For example, one common perception is that the aggregate MFP growth will be reduced if the shares of the low productivity industries (e.g. the services industries) are increasing in the economy (Baumol 1967). Oulton (2001) shows that this is true only if the industry-level productivity is measured by the value-added MFP index. On the contrary, the aggregate MFP growth will rise if resources are shifting to industries producing intermediate inputs (e.g. the services industries), however low the MFP growth rates are in those industries, provided that they are measured by the gross output MFP index and are positive. 3. Data and measurement issues To estimate the industry-level MFP indices of equations (11) and (12), we will need data on volume measures of output, primary and intermediate inputs. We will also use data on industry-level factor incomes. Diewert (2000) commented on the difficulties and various measurement problems associated with industry-level MFP estimation. Some of these issues will be addressed in this section. Note that we reply on the data currently available in the ABS to derive the industry-level MFP estimates. Needless to say, any future improvement in the quality and measurement of these data will have a direct impact on the industry-level MFP estimates. Note also that the MFP estimation in our work is only applied to the twelve market-sector industries. A full list of the market-sector industries can be found in any one of the results tables in the following section (see also footnote 2). The industries are defined at the Division (one digit) level of the Australian and New Zealand Standard Industrial Classification (ANZSIC). They exclude the following non-market-sector industries: Property and business services, Government administration and defence, Education, Health and community services and Personal and other services, owing to the difficulty of estimating volume measures of output for those industries. 3.1 Output and intermediate inputs The gross outputs for each market-sector industry in both constant and current prices are obtained from the ABS supply-use tables which contain both market and non-market-sector industries and more than one hundred commodity groups14. Since 1994-95, the ABS has been compiling annual supply-use tables in both current and constant prices. Thus, industry-level gross output MFP growth can be estimated from that period.
14 For many of the industries in the ABS supply-use tables, they are classified at lower than the Division level. The industries and particularly the commodity groups have been further refined in the latest ABS supply-use tables.

20
Gross value-added (GVA) is used as the output measure for the MFP index based on value-added. The series for industry-level gross value-added is much longer than that for the gross output, although for years prior to 1994-95 the estimates were derived without using the supply-use framework. We will present the estimates of industry-level MFP index based on value added since 1990 in the next section. Both gross output and gross value-added in current prices include the cost of depreciation. This ensures a consistent treatment of capital input as a flow of capital services (see the following sub-section), which also includes a depreciation component. In the Australian supply-use framework, the current price gross output and gross value-added are valued at basic prices. They exclude taxes payable and any transport charges paid separately by the producer, but include subsidies receivable, as a consequence of production or sale. This valuation of output is consistent with the recommendation by the System of National Accounts 93 (SNA 93) and the OECD Productivity Manual (OECD 2001, pp 76-80). Because the basic price is intended to measure the amount actually retained by the producer, it is the price most relevant to the decision-making regarding outputs and therefore is most appropriate for valuing output in productivity analysis. The volume measures of gross output and intermediate inputs in the supply-use tables are derived from aggregation of supply and use commodities at constant prices. The supply and use commodities at constant prices are estimated by deflating the nominal value of each commodity by the corresponding output and input price indices. Thus, the corresponding volume measure of gross value-added is based on the procedure of double-deflation. Specifically, this method can be illustrated as follows. We write the current price gross value-added for industry i at time t, as
( ) ( ) ( ) ( ) ( ) ( )i i iV i G i M ip t V t p t G t p t M t= − (16)
The notations are as defined before. Note that nominal gross output ( ) ( )
iG ip t G t and nominal gross value added ( ) ( )
iV ip t V t are both valued at basic prices, whereas nominal intermediate input ( ) ( )
iM ip t M t is valued at purchasers prices. Purchasers prices include net taxes on products and transport charges and trade margin paid by the purchaser. They are the prices relevant for purchasing decisions. Again, this is the valuation recommended by SNA93 and the OECD productivity manual (OECD 2001) and used in the Australian supply-use system. Now deflate nominal gross output ( ) ( )
iG ip t G t , by the price index of two consecutive periods for gross output ( ) / ( 1)
i iG Gp t p t − ; and the current price intermediate input ( ) ( )
iM ip t M t by the price index for intermediate input ( ) / ( 1)i iM Mp t p t − . The result is
double-deflated gross value-added in constant (time, 1t − ) prices:
( 1) ( ) ( 1) ( ) ( 1) ( )i i iV i G i M ip t V t p t G t p t M t− = − − − (17)15
15 This is the procedure of double-deflation in a more narrow sense, where the volume measure of value-added is obtained by subtracting a constant-price value of intermediate inputs from a constant-price value of gross output.. This is only possible with Laspeyres quantity indices. The volume index of value-added can also be derived from the Tornqvist version of double-deflation, where geometric

21
Indeed, this relationship is strictly maintained by the volume measures (valued at the previous year�s prices) obtained from the Australian annual constant price supply-use tables. The chain volume measures of gross value-added for each of the market-sector industries currently published by the ABS are based on this method of estimation. 3.2 Capital input In productivity analysis, the appropriate measure of capital input is capital services. They reflect the amount of �service� each asset provides during a period. The services provided by each asset in a period are directly proportional to the asset�s productive capital stock in the period. Since the flows of capital services are not directly observable, they are derived by aggregating the productive capital stock of each asset type using the Tornqvist index and the user cost or rental price as weights. This method of deriving the estimates of capital services is used by the ABS and the Bureau of Labour Statistics (BLS) of the U.S.. Specifically, for industry i, Kki stands for the productive capital stock of asset type k, rki for the rental price or user cost for the same asset, the Tornqvist index of capital services for industry i is as follows
, 11
kitt t kii t
k ki
KKK
ω−
−
=
∏ (18)
where 10.5( )t t
ki ki kiω ω ω −= + and /t t t t tki ki ki ki ki
kr K r Kω = ∑ .
The productive capital stock reflects the productive capacity of capital and is thus appropriate to measure the quantity of capital services in production. Productive capital stock for a particular, homogenous asset is constructed with the perpetual inventory (PIM) method and it consists of cumulating past investment flows. Weights are attached to each vintage investment to reflect the decline in productive efficiency and the retirement of investment cohorts:
,0
tTt kiki ki ki t
ki
IK h Fp
ττ τ
ττ
−
−
=
∑ (19)
kihτ is an age-efficiency profile taking the value between unity when an asset is new
and zero when it has lost its entire productive efficiency. Thus, the age-efficiency profile reflects the loss in productive efficiency as an asset ages. kiFτ is a retirement function that traces the share of assets of age τ that are still in service. It also takes the value between unit when an asset is new and zero when it reaches its maximum service life at time T. t
kiI is the nominal investment expenditure on asset type k at
weights expressed in current prices are used. For details of this Tornqvist index formula, see OECD 2001, pp 103.

22
time t. ,0tkip is the investment price index for type k asset that is new (age zero) in the
ith industry. Thus, ,0/t tki kiI p is the real investment of asset type k at time t.
The ABS uses the normalised hyperbolic age-efficiency profile and a symmetric retirement function in its estimation of the productive capital stock for each asset. This approach follows that by the BLS of the U.S.. Another often-used form for the age-efficiency profile is geometric, and it has been used by other statistical agencies and particularly popular among academic researchers. (See, for example, Hall and Jorgenson 1967, Jorgenson et. al. 1987 and Jorgenson and Griliches 1967.) The geometric age-efficiency profile facilitates analytical tractability, because it implies the same shape for the corresponding age-price profile. Also, some econometric studies (for example, Hulten and Wykoff 1981) have found some support for the use of geometric economic depreciation. The hyperbolic age-efficiency profile used by both the ABS and BLS implies a slow decline in efficiency in early years of the asset�s service life and faster towards the end; while the corresponding age-price profile shows the opposite. Thus, this form of age-efficiency profile makes intuitive sense. In addition, there is no strong evidence against using the hyperbolic assumption. The ABS distinguishes six types of machinery, other building and structure, three types of intangible assets, livestock, inventories and land. The six major types of machinery include computers and peripherals; electrical and electronic equipment; industrial machinery and equipment; road vehicles; other transport equipment; and other plant and equipment. The three types of intangible assets are mineral exploration, computer software and artistic originals. Aggregation across assets types in each industry is based on the Tornqvist index formula in which the weights are based on the user cost as shown in equation (18). The ABS augments the usual user cost formulation to incorporate the effects of corporate income taxes, tax depreciation allowances, investment tax credits and indirect taxes,
( )t t t t t t t tki ki ki i ik ik ki ir T p i d g p x= + − + (20)
where t
kiT is the income tax parameter which allows for the variation of income tax allowances according to different industries, asset types and variance in allowances and corporate profit tax rate over time; t
ii is the nominal internal rate of return;
( )1 /t t t tik ki ki kig p p p−= − captures capital gain or loss due to the revaluation of the asset; tikd is the rate of depreciation; t
ix captures the effective average non-income tax rate on production. The nominal internal rate of return t
ii used in the user cost formulation above is solved endogenously following the well-known approach by Hall and Jorgenson (1967) where capital income is derived residually as the difference between gross value added and labour compensation. The depreciation rate t
ikd is derived from dividing the real deprecation (consumption of fixed capital in constant price) by real
23
net (wealth) capital stock. Instead of using the age-efficiency function as for the estimation of productive capital stock, the age-price function (profile) is required to derive the net capital stock. This function can be derived using the age-efficiency profile and the retirement pattern as well as a real discount rate. The ABS chooses a real discount rate of 4 per cent, the same as that used by the BLS. This rate approximates the average real 10 year Australian bond rate. The estimates of the Tornqvist index of capital services are available for both the individual market-sector industries and the market-sector as a whole. The ABS also publishes the estimates of gross capital stock and net capital stock16. Since the net capital stock is a measure of wealth, the aggregation across assets types is carried out using market prices as weights as compared with the user cost weights used in the aggregation of productive capital stock. The major weakness of the estimates of capital services arises from the uncertain quality of the data and various assumptions used in their construction, such as mean asset lives and asset life distributions. Like the capital input estimates published by other national statistical agencies, the ABS� capital services and net capital stock estimates are also not adjusted for the rate of capital utilisation. Since the utilisation of capital (and labour) is not adequately captured in the input estimates, swings in demand and output are picked up by the residual productivity measure. This is one of the reasons that caution must be exercised in use and interpretation of MFP estimates. However, the pro-cyclical effects of MFP estimates can be mitigated by examining MFP growth between peak-to-peak or trough-to-trough points of business cycle. The drawback of this approach is that it reduces the timeliness of the information on productivity growth. Not adequately adjusting for the rate of inputs utilisation also reduces the comparability of MFP estimates across counties and industries when their business cycles are not synchronised. 3.3 Labour input The indices of hours worked by industry are used for the measure of labour input in the estimation of industry-level MFP. They are derived as the product of employment and average hours worked in the individual industries. Using the index of hours worked provides a better measure of labour input than using employment, since hours worked capture changes in overtime worked, standard weekly hours, leave taken, and changes in the proportion of part-time employment. However, the estimates of labour input based on hours worked do not capture the differences in skills, education, health and professional experiences as a result of different contribution of different types of labour. This is the issue of quality adjustment for labour input, which will be discussed in the following.
16 The gross capital stock is a special case of the productive capital stock where assets are treated as new until they are retired (sometimes called �one-hoss-shay�). The net or wealth capital stock is the current market valuation of an industry�s or an economy�s productive capital. For a detailed discussion on the method of capital measurement in Australia, see Chapter 16, ABS (2000).

24
At present, the aggregate market-sector MFP estimates use the annual hours worked index. The annual hours worked are derived by subtracting the estimates of non-market-sector hours worked from the estimates for the whole economy (all industries). The corresponding index of the annual hours worked is equivalent to a quantity index of the fixed-weight Laspeyres type;
11 1
ttt iit t
i i
LL wL L
−− −
=
∑ (21)
where Li stands for the hours worked in industry i, and 1 1 1/t t t
i i ii
w L L− − −= ∑ .
Thus, the aggregate market-sector MFP estimates do not adjust for the quality differences in labour inputs. However, the quality change of labour input at the market-sector level can be partially adjusted by aggregating the industry-level hours worked and using each industry�s share in total labour compensation as the aggregation weights. Specifically, the following aggregation formula for the growth rate of aggregate hours worked can be used,
1 1
iwtti
t ti i
LLL L− −
=
∑ (22)
where 10.5( )t t
i i iw w w −= + and /i ii L i L i
iw p L p L= ∑ is the industry�s share in total
labour compensation in the market-sector. The quality of aggregate labour input is partially adjusted, since these weights will be comparatively large for industries that pay above-average wages and relatively small for industries with below-average wages, assuming that above-average wages reflect above-average skills of the work force in the industry. Alternatively, the quality of labour inputs can be adjusted according to different characteristics of the labour involved in the production. Following the method used by the U.S. Bureau of Labour Statistics (BLS), the ABS has produced experimental quality adjusted labour inputs (QALI) for the aggregate market-sector (Reilly and Milne 2000). The experimental QALI takes account of the effects of the differences in educational attainment and the length of workforce experience on the contribution of hours worked to aggregate labour input. The QALI based MFP estimates for the aggregate market-sector are also available from the ABS. However, at the industry-level, this way of adjusting the quality of labour inputs is not possible due to insufficient industry-level data. 3.4 Factor incomes Estimates of factor incomes are required to derive the shares used in the productivity indices, as shown in equations (9) and (10). The share of intermediate inputs in gross output can be directly obtained by the current price measures of gross output and intermediate inputs in the supply-use tables. This is, however, not the case for capital

25
and labour, because there are various other expenditure/income items in the current price measure of gross value-added (GVA). As an accounting identity, gross value added at basic prices consists of the following components: 1) Compensation of employees (W); 2) Other taxes less subsidies (other net taxes) on production and imports (T); 3) Gross operating surplus (GOS); 4) Gross mixed income (GMI). Further, Compensation of employees (W) ≡ Wages and salaries + Employers' social
contributions Thus, we can write
GVA W GOS MI T≡ + + + (23) In most work on MFP/TFP estimation, the measures of factor income are often used to directly derive the relevant factor income shares. The ABS publishes the estimates of total factor income by industries, where the total factor income is defined as compensation of employees plus gross operating surplus and gross mixed income. Thus, total factor income is different from gross value added because it excludes other net taxes on production and imports (T in equation (23)). In our current work, however, we use the adjusted factor incomes to derive the shares by allocating the net taxes on production and imports appropriately to capital and labour, thus preserving the above accounting identity for gross value-added17. To derive the adjusted factor incomes, we fist consider the components of gross mixed income (GMI). This is the income that accrues to unincorporated enterprises owned by members of households, i.e. to self-employed persons. It consists of two major components, wages, salaries and supplements of unincorporated enterprises, and GOS of unincorporated enterprises, both of which are available by industry from the ABS. Accordingly, the former is attributed to GMIL, the labour part of the gross mixed income, and the latter to GMIK, the capital part of the gross mixed income, and GMI ≡ GMIK + GMIL. Thus, it follows that GMIK and GOS are naturally the capital part of gross value added while GMIL and W are the labour part. This leaves T, the other net taxes on production and imports, the only component that needs to be further allocated. At the aggregate market-sector level, the ABS allocates the net taxes on production and imports to capital and labour according to the specific natures of these taxes. For example, pay roll taxes and fringe benefit taxes are related to labour, and taxes on vehicles and building structures are specific to capital. At the industry-level, however, the detailed tax information is not complete. Thus, in what follows we 17 As pointed out by OECD (2001), the alternative approach of using factor cost definition of value-added can avoid the often-arbitrary apportionment of other net taxes on production to labour and capital. But it foregoes full consistency between the accounting framework and productivity measures. Note also that in both approaches, net taxes are not treated as a separate cost factor in production.

26
allocate the industry-level net taxes on production and imports proportionally, a method recommended by the OECD (OECD 2001). Denoting tL the share of the net taxes attributable to labour in net taxes and )(1 Lt− the share of the net taxes attributable to capital, proportional allocation implies that
LL
W GMItGOS GMI W
+=
+ + (24)
The adjusted labour income is therefore ( )L LW GMI t T+ + ⋅ while the adjusted capital income is [ (1 ) ]K LGOS GMI t T+ + − ⋅ . The corresponding share of labour income in gross value added is given by
L LL
W GMI t TsW GOS GMI T
+ + ⋅=
+ + + (25)
The share of capital income in gross value added is given by
(1 )K LK
GOS GMI t TsW GOS GMI T
+ + − ⋅=
+ + + (26)
The shares of capital and labour incomes in gross output can be derived accordingly using the adjusted capital and labour incomes. It turns out that using the proportional allocation method has resulted in almost identical aggregate capital and labour income shares to those derived from the detailed net taxes information. This is shown in Table 1. Table 1: Shares of aggregate labour income in gross value added (GVA) in the market-sector Derived from the
proportional allocation method
Based on the detailed net taxes information
1990-91 0.603 0.604 1991-92 0.602 0.602 1992-93 0.597 0.596 1993-94 0.590 0.588 1994-95 0.588 0.587 1995-96 0.590 0.589 1996-97 0.596 0.596 1997-98 0.598 0.598 1998-99 0.594 0.594 1999-2000 0.589 0.589 2000-01 0.583 0.582 Source: The estimates in the second column are derived by the author and those in the third column are used to derive the MFP estimates published in ABS Cat. 5204.0, 2001-02.

27
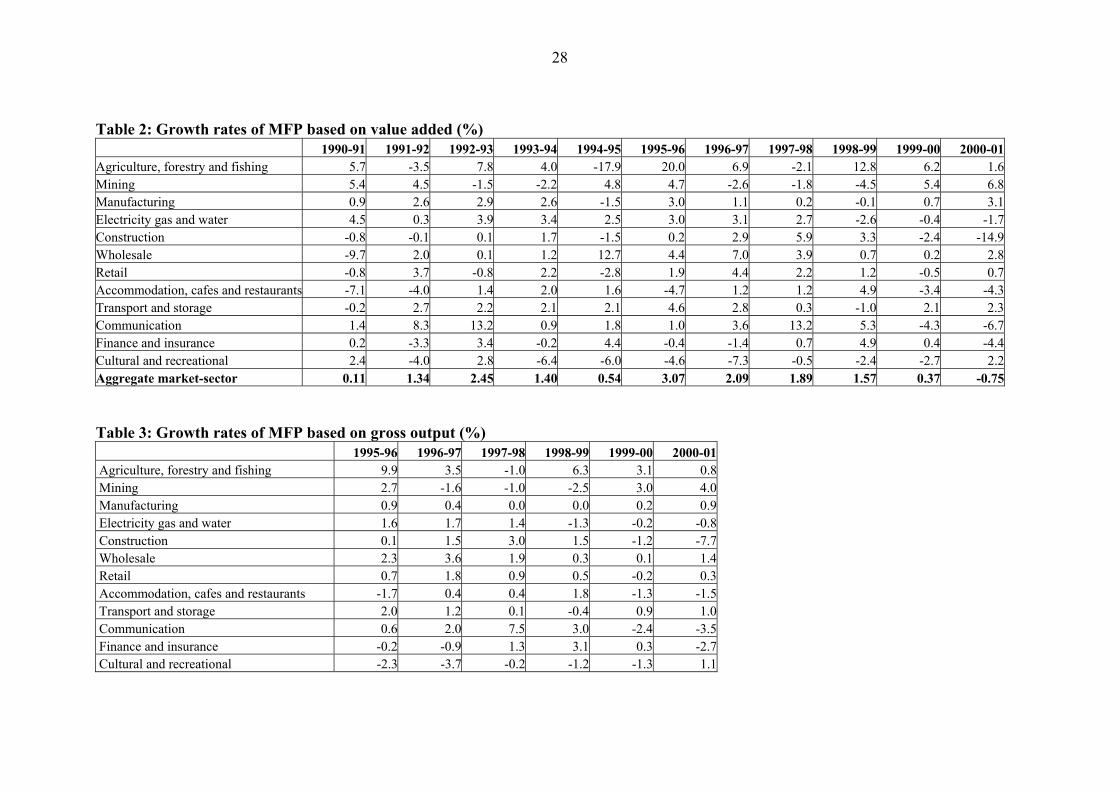
4. Experimental results Using the methods discussed in the previous two sections, particularly equations (11) and (12), we have derived the estimates of industry-level MFP based on both gross output and value-added. The results expressed in rates of percentage change are reported in Tables 2 and 3 as well as presented in Figure 2. Note that since consistent data for gross output and intermediate inputs are available from 1994/95, a comparison between the value- added and the gross output industry MFP growth estimates is possible only from that period. The relationship between the two MFP measures as shown in equation (13) can be observed in these estimates.
28
Table 2: Growth rates of MFP based on value added (%) 1990-91 1991-92 1992-93 1993-94 1994-95 1995-96 1996-97 1997-98 1998-99 1999-00 2000-01Agriculture, forestry and fishing 5.7 -3.5 7.8 4.0 -17.9 20.0 6.9 -2.1 12.8 6.2 1.6Mining 5.4 4.5 -1.5 -2.2 4.8 4.7 -2.6 -1.8 -4.5 5.4 6.8Manufacturing 0.9 2.6 2.9 2.6 -1.5 3.0 1.1 0.2 -0.1 0.7 3.1Electricity gas and water 4.5 0.3 3.9 3.4 2.5 3.0 3.1 2.7 -2.6 -0.4 -1.7Construction -0.8 -0.1 0.1 1.7 -1.5 0.2 2.9 5.9 3.3 -2.4 -14.9Wholesale -9.7 2.0 0.1 1.2 12.7 4.4 7.0 3.9 0.7 0.2 2.8Retail -0.8 3.7 -0.8 2.2 -2.8 1.9 4.4 2.2 1.2 -0.5 0.7Accommodation, cafes and restaurants -7.1 -4.0 1.4 2.0 1.6 -4.7 1.2 1.2 4.9 -3.4 -4.3Transport and storage -0.2 2.7 2.2 2.1 2.1 4.6 2.8 0.3 -1.0 2.1 2.3Communication 1.4 8.3 13.2 0.9 1.8 1.0 3.6 13.2 5.3 -4.3 -6.7Finance and insurance 0.2 -3.3 3.4 -0.2 4.4 -0.4 -1.4 0.7 4.9 0.4 -4.4Cultural and recreational 2.4 -4.0 2.8 -6.4 -6.0 -4.6 -7.3 -0.5 -2.4 -2.7 2.2Aggregate market-sector 0.11 1.34 2.45 1.40 0.54 3.07 2.09 1.89 1.57 0.37 -0.75 Table 3: Growth rates of MFP based on gross output (%) 1995-96 1996-97 1997-98 1998-99 1999-00 2000-01 Agriculture, forestry and fishing 9.9 3.5 -1.0 6.3 3.1 0.8 Mining 2.7 -1.6 -1.0 -2.5 3.0 4.0 Manufacturing 0.9 0.4 0.0 0.0 0.2 0.9 Electricity gas and water 1.6 1.7 1.4 -1.3 -0.2 -0.8 Construction 0.1 1.5 3.0 1.5 -1.2 -7.7 Wholesale 2.3 3.6 1.9 0.3 0.1 1.4 Retail 0.7 1.8 0.9 0.5 -0.2 0.3 Accommodation, cafes and restaurants -1.7 0.4 0.4 1.8 -1.3 -1.5 Transport and storage 2.0 1.2 0.1 -0.4 0.9 1.0 Communication 0.6 2.0 7.5 3.0 -2.4 -3.5 Finance and insurance -0.2 -0.9 1.3 3.1 0.3 -2.7 Cultural and recreational -2.3 -3.7 -0.2 -1.2 -1.3 1.1

29
Figure 2: Experimental estimates of industry-level MFP growth
GO MFP growth
VA MFP growth
1990-91 5.71991-92 -3.51992-93 7.81993-94 4.01994-95 -17.91995-96 9. 9 20.01996-97 3. 5 6.91997-98 - 1. 0 -2.11998-99 6. 3 12.81999-00 3. 1 6.22000-01 0. 8 1.6
AgricultureMFP growth: Agriculture
-18-13
-8-327
121722
1990-91
1991-92
1992-93
1993-94
1994-95
1995-96
1996-97
1997-98
1998-99
1999-00
2000-01
GO MFP growth VA MFP growth
%
MFP growth: Mining
-6-4-202468
1990-91
1991-92
1992-93
1993-94
1994-95
1995-96
1996-97
1997-98
1998-99
1999-00
2000-01
GO MFP growth VA MFP growth
%
MFP growth: manufacturing
-2
-1
0
1
2
3
4
1990-91
1991-92
1992-93
1993-94
1994-95
1995-96
1996-97
1997-98
1998-99
1999-00
2000-01
GO MFP growth VA MFP growth
%
MFP growth: electricity gas & water
-3-2-1012345
1990-91
1991-92
1992-93
1993-94
1994-95
1995-96
1996-97
1997-98
1998-99
1999-00
2000-01
GO MFP growth VA MFP growth
%
GO MFP growth
VA MFP growth
1990-91 5.41991-92 4.51992-93 -1.51993-94 -2.21994-95 4.81995-96 2.7 4.71996-97 -1.6 -2.61997-98 -1.0 -1.81998-99 -2.5 -4.51999-00 3.0 5.42000-01 4.0 6.8
Mining
GO MFP growth
VA MFP growth
1990-91 0.91991-92 2.61992-93 2.91993-94 2.61994-95 -1.51995-96 0.9 3.01996-97 0.4 1.11997-98 0.0 0.21998-99 0.0 -0.11999-00 0.2 0.72000-01 0.9 3.1
Manufacturing
GO MFP growth VA MFP growth
1990-91 4.51991-92 0.31992-93 3.91993-94 3.41994-95 2.51995-96 1. 6 3.01996-97 1. 7 3.11997-98 1. 4 2.71998-99 - 1. 3 -2.61999-00 - 0. 2 -0.42000-01 - 0. 8 -1.7
Electricity gas and water

30
MFP growth: Construction
-15-12
-9-6-3036
1990-91
1991-92
1992-93
1993-94
1994-95
1995-96
1996-97
1997-98
1998-99
1999-00
2000-01
GO MFP growth VA MFP growth
%
GO MFP growth
VA MFP growth
1990-91 -9.71991-92 2.01992-93 0.11993-94 1.21994-95 12.71995-96 2. 3 4.41996-97 3. 6 7.01997-98 1. 9 3.91998-99 0. 3 0.71999-00 0. 1 0.22000-01 1. 4 2.8
WholesaleMFP growth: Wholesale
-10-7-4-1258
1114
1990-91
1991-92
1992-93
1993-94
1994-95
1995-96
1996-97
1997-98
1998-99
1999-00
2000-01
GO MFP growth VA MFP growth
%
MFP growth: Retail
-4-3-2-1012345
1990-91
1991-92
1992-93
1993-94
1994-95
1995-96
1996-97
1997-98
1998-99
1999-00
2000-01
GO MFP growth VA MFP growth
%GO MFP growth
VA MFP growth
1990-91 -0.81991-92 3.71992-93 -0.81993-94 2.21994-95 -2.81995-96 0. 7 1.91996-97 1. 8 4.41997-98 0. 9 2.21998-99 0. 5 1.21999-00 - 0. 2 -0.52000-01 0. 3 0.7
Retail
MFP growth: Accommodation, cafes & restaurant
-8
-6
-4
-2
0
2
4
6
1990-91
1991-92
1992-93
1993-94
1994-95
1995-96
1996-97
1997-98
1998-99
1999-00
2000-01
GO MFP growth VA MFP growth
%
GO MFP growth VA MFP growth
1990-91 -0.81991-92 -0.11992-93 0.11993-94 1.71994-95 -1.51995-96 0. 1 0.21996-97 1. 5 2.91997-98 3. 0 5.91998-99 1. 5 3.31999-00 - 1. 2 -2.42000-01 - 7. 7 -14.9
Construction
GO MFP growth VA MFP growth
1990-91 -7.11991-92 -4.01992-93 1.41993-94 2.01994-95 1.61995-96 - 1. 7 -4.71996-97 0. 4 1.21997-98 0. 4 1.21998-99 1. 8 4.91999-00 - 1. 3 -3.42000-01 - 1. 5 -4.3
Accommodation, cafes & restaurant

31
GO MFP growth VA MFP growth
1990-91 -0.21991-92 2.71992-93 2.21993-94 2.11994-95 2.11995-96 2. 0 4.61996-97 1. 2 2.81997-98 0. 1 0.31998-99 - 0. 4 -1.01999-00 0. 9 2.12000-01 1. 0 2.3
Transport and storageMFP growth: Transport & storage
-2
-10
1
2
34
5
1990-91
1991-92
1992-93
1993-94
1994-95
1995-96
1996-97
1997-98
1998-99
1999-00
2000-01
GO MFP growth VA MFP growth
%
GO MFP growth VA MFP growth
1990-91 1.41991-92 8.31992-93 13.21993-94 0.91994-95 1.81995-96 0. 6 1.01996-97 2. 0 3.61997-98 7. 5 13.21998-99 3. 0 5.31999-00 - 2. 4 -4.32000-01 - 3. 5 -6.7
CommunicationMFP growth: Communication
-10
-5
0
5
10
15
1990-91
1991-92
1992-93
1993-94
1994-95
1995-96
1996-97
1997-98
1998-99
1999-00
2000-01
GO MFP growth VA MFP growth
%
GO MFP growth VA MFP growth
1990-91 0.21991-92 -3.31992-93 3.41993-94 -0.21994-95 4.41995-96 - 0. 2 -0.41996-97 - 0. 9 -1.41997-98 1. 3 0.71998-99 3. 1 4.91999-00 0. 3 0.42000-01 - 2. 7 -4.4
Finance and insurance MFP growth: Finance & insurance
-6
-4
-2
0
2
4
6
1990-91
1991-92
1992-93
1993-94
1994-95
1995-96
1996-97
1997-98
1998-99
1999-00
2000-01
GO MFP growth VA MFP growth
%
GO MFP growth VA MFP growth
1990-91 2.41991-92 -4.01992-93 2.81993-94 -6.41994-95 -6.01995-96 - 2. 3 -4.61996-97 - 3. 7 -7.31997-98 - 0. 2 -0.51998-99 - 1. 2 -2.41999-00 - 1. 3 -2.72000-01 1. 1 2.2
Cultural and recreationalMFP growth: Cultural & recreational
-8
-6
-4
-2
0
2
4
1990-91
1991-92
1992-93
1993-94
1994-95
1995-96
1996-97
1997-98
1998-99
1999-00
2000-01
GO MFP growth VA MFP growth
%

32
Under the growth accounting framework, it is also customary to quantify how much output growth is due to productivity change and how much is due to growth in individual inputs. At the industry-level, this can be done separately for each industry using either gross output or value added based MFP, while noting the difference between the inputs and outputs associated with the two measures. As discussed previously, the industry-level results can be aggregated to the market-sector level by applying the aggregation rules of either equation (14) or equation (15), depending on whether it is gross output or value-added based MFP measure. We apply equation (14) to our value-added MFP estimates. One useful application associated with this aggregation is to measure the industry�s contribution to the annual aggregate market-sector MFP growth. The individual industry�s percentage points contribution to the aggregate market-sector MFP growth are shown in Table 4 in the following page. As can be seen from the MFP results and those in Table 4, during the 1990s the market-sector industries have shown varied rates of productivity growth. They have also had varied levels of contribution to the aggregate market-sector MFP growth. This is reflected by the fact that each industry has made both positive and negative contributions to the aggregate market-sector MFP growth during the eleven year period. Since MFP change is pro-cyclical, it is more appropriate to compare the MFP estimates between growth cycles. However, this is not carried out in this paper because of the short time span of the experimental series. Given the rich information contained in the industry-level MFP estimates, we can investigate the relationships between the MFP growth and the growth in gross output or value added across time and within or across industries, and validate many empirical regularities found in the production and productivity statistics. Issues like whether capital deepening or the growth in MFP is the main contributing factor to the growth in output per hour worked can also be analysed at the industry level by using the data and results from our estimation. However, we have not attempted these exercises here.

33
Table 4: Percentage points contributions to the aggregate market-sector MFP growth 1990-91 1991-92 1992-93 1993-94 1994-95 1995-96 1996-97 1997-98 1998-99 1999-00 2000-01Agriculture, forestry and fishing 0.39 -0.20 0.45 0.24 -1.02 1.14 0.40 -0.12 0.70 0.35 0.09Mining 0.43 0.37 -0.12 -0.17 0.37 0.37 -0.21 -0.14 -0.34 0.40 0.57Manufacturing 0.21 0.57 0.63 0.58 -0.33 0.67 0.25 0.04 -0.03 0.14 0.62Electricity gas and water 0.24 0.01 0.22 0.18 0.13 0.14 0.14 0.12 -0.11 -0.02 -0.07Construction -0.08 -0.01 0.01 0.16 -0.15 0.02 0.28 0.59 0.33 -0.26 -1.51Wholesale -0.92 0.19 0.01 0.11 1.18 0.41 0.65 0.36 0.06 0.02 0.26Retail -0.07 0.33 -0.08 0.20 -0.26 0.17 0.42 0.21 0.12 -0.05 0.07Accommodation, cafes and restaurants -0.22 -0.13 0.04 0.06 0.05 -0.17 0.04 0.04 0.19 -0.14 -0.17Transport and storage -0.02 0.26 0.21 0.19 0.20 0.43 0.26 0.03 -0.09 0.19 0.20Communication 0.06 0.39 0.64 0.04 0.09 0.05 0.19 0.70 0.29 -0.23 -0.35Finance and insurance 0.02 -0.34 0.37 -0.02 0.47 -0.04 -0.14 0.07 0.52 0.04 -0.52Cultural and recreational 0.06 -0.10 0.08 -0.18 -0.17 -0.14 -0.21 -0.02 -0.07 -0.08 0.07Aggregate market-sector 0.11 1.34 2.45 1.40 0.54 3.07 2.09 1.89 1.57 0.37 -0.75

34
As these MFP estimates are experimental, it is necessary to assess their quality and plausibility. Bearing in mind the various assumptions and weakness underlying the component series used for the MFP estimation, there are several ways to make such an assessment. One is to compare them directly with those from other studies. However, there are only a limited number of published studies attempting to estimate the industry-level MFP growth for the market-sector industries in Australia. The Australian Productivity Commission has published numerous papers covering issues of industry-level productivity. The estimates used to derive the industry-level MFP in these papers are based on some unpublished ABS data (e.g. Productivity Commission 1999, Cobbold and Kulys 2003). Other researchers have also derived their own MFP estimates for the Australian market-sector industries (eg. Simon and Wardrop 2002). However, these studies have different objectives and the MFP estimates in their work are often presented graphically and in some summary measures averaging across the period which dose not coincide with that in our study. More importantly, the methods and the data treatment issues associated with the industry-level MFP estimation in these studies are not clearly specified. In some studies, these issues are only mentioned with a few lines of description in a footnote or in an appendix, while the emphasis is placed on discussing the implications and extension of the industry-level MFP results. Clearly, this is not the approach taken in this paper. Our attention is mainly focused on an appropriate choice of the methodology for MFP estimation and the corresponding data and measurement issues. Thus, a direct, same period comparison of our estimates with the results from these studies will not be attempted. Instead, in the next section we will present the results of a comparison between the aggregate MFP estimates derived from the industry-level results and those directly obtained from the aggregate approach. This comparison is used as a way of assessing the plausibility of the experimental industry-level MFP estimates, while at the same time, also addressing several issues of consistency in aggregation and the difference between the industry-level and aggregate approaches18. As will be seen in the next section, this difference has both theoretical and practical implications.
18 Note that although we use the word �assess� to describe one of the purposes of this comparison exercise, we do not claim that the aggregate MFP estimates based on aggregate approach are the �correct� ones against which the same estimates derived from industry-level approach should be judged. Indeed, it has been argued in the literature that purely on methodological ground, the bottom-up approaches seem superior to a mere aggregate approach (see, e.g. Jorgenson, Gollop and Fraumeni 1987). However, in the actual application, one must take account of the data and measurement issues involved; if the available industry-level data are of less quality than the aggregate data, applying the industry-level approach will of course produce the aggregate MFP estimates of less quality than using aggregate approach directly (See Diewert 2000 for further comments on the difficulties and measurement problems associated with industry-level MFP estimation). It is precisely because of this practical consideration that our exercise of comparison is carried out.

35
5. Consistency in aggregation In the previous section, we presented the aggregate MFP estimates for the market-sector as a whole in Table 4. These estimates are derived from the industry-level results by applying the aggregation formula of equation (14) (summing over the market industries). Note that the ABS has been publishing the aggregate market-sector MFP estimates in the Australian System of National Accounts (ABS Cat. 5204) since the early 1990s. However, they are based on the aggregate approach as outlined in the derivation of the aggregate MFP index in equations (3) or (4) (See Aspden 1990 for details on this aggregate approach used by the ABS). The aggregate MFP estimates derived from the two approaches should not be too different; otherwise it may indicate some problems with the experimental estimates of industry-level MFP, because the aggregate data used in the aggregate MFP estimation have been known to be of better quality than some of the data at the lower levels of aggregation. This is the basis on which we assess the plausibility of our experimental estimates. Figure 3 shows the results of the comparison between the MFP estimates derived from the two approaches. Figure 3: A comparison of the aggregate market-sector MFP growth estimates
A comparison of the aggregate market-sector MFP growth estimates
-1.5-1.0-0.50.00.51.01.52.02.53.03.5
1990-91
1991-92
1992-93
1993-94
1994-95
1995-96
1996-97
1997-98
1998-99
1999-00
2000-01
Estimates based on the industry-level approachEstimates from 5204.0 (01-02)
%
As can be seen, the estimates based on the industry-level approach are quite close to those from the aggregate approach used in the publication, with the largest difference being less than one percentage point in 1992-93. Given the fact that a direct comparison of MFP estimates at the industry-level is not possible for the reasons outlined above, the result from this exercise seems to validate the plausibility of our industry-level MFP estimates. However, the question of what explains and causes these differences, however small, between the two sets of aggregate MFP estimates still remains.

36
One obvious way of identifying the causes for the difference is to examine each component of the MFP indexes used in the two approaches. The results from this exercise are reported in Appendix A. The main conclusions from this exercise are that the small differences observed above are partly due to different output measures and different index formulae of aggregating labour inputs applied in the two approaches. Despite this, both the industry-level approach applied in this paper and the aggregate approach used by the ABS are valid methods of estimating aggregate MFP. Another source of the difference in the aggregate MFP estimates observed above cannot be identified by comparing the component measures and aggregation formulae applied in the two approaches, as we have done in the appendix; it is more fundamental and directly related to the difference between the two approaches themselves. This methodological difference of estimating aggregate MFP is captured in a relation derived by Jorgenson, Gollop and Fraumeni (1987), which augments the Domar aggregation formula (Domar 1961, Hulten 1978):
� � � �
� �
i iG i V ii ki ki Kk kV G i ki k
i i i k kV V V V
li li Ll lli l
i l lV V
p G p V p K p KV V K Kp V p V p V p V
p L p LL Lp V p V
τ τ
= + − + −
+ −
∑ ∑ ∑∑ ∑
∑∑ ∑ (27)
where Vτ is the MFP growth index based on the aggregate approach,
iG i iG V
i V
p Gp V
τ τ
′=
∑ is the MFP growth index based on the industry-level approach; it
is just the Domar aggregation formula in its original form as shown in equation (15). All other notations have been defined before. As can be seen, the augmented Domar formula in equation (27) includes terms in the last three square brackets that capture the contributions of changes in the industrial distribution of value-added, all types of capital and labour inputs to the rate of aggregate productivity growth. We derive the Domar aggregation formula in both its original and augmented forms in Appendix B. In general, V Vτ τ′ ≠ except in some special cases. One of the cases is that all the industries pay the same prices for their capital and labour inputs, an assumption which is not likely to hold in reality. Aulin-Ahmavaara (2003) and Jorgenson, Gollop and Fraumeni (1987) state that the Domar aggregation formula in its original form also requires this assumption. However, in the appendix we show that the original Domar aggregation formula can be derived without using this assumption. Putting the technical details aside, equation (27) can be directly used to explain part of the difference between the aggregate MFP estimates derived from the industry-level and the aggregate approaches as shown in Figure 3. This particular part of the difference is not due to measurement issues; it is caused by the contributions of reallocations of industry value added and primary factor inputs to the aggregate

37
productivity growth. Assuming that the difference caused by the measurement issues (reported in Appendix A) are negligible, these contributions can be directly estimated using equation (27) (by combining capital and labour into primary inputs as a whole) and they are reported in Table 5. Table 5: Decomposing aggregate MFP growth estimates using the augmented Domar aggregation formula*
MFP growth: aggregate approach
(%)
MFP growth: industry-level approach (%)
Contribution of reallocation of
industry VA (%)
Contribution of reallocation of
industry primary inputs (%)
(1) (2) (3) (4) 1990-91 0.11 0.11 0.21 -0.21 1991-92 0.68 1.34 -0.02 -0.65 1992-93 1.57 2.45 0.56 -1.44 1993-94 2.21 1.40 0.09 0.72 1994-95 0.65 0.54 0.36 -0.25 1995-96 2.79 3.07 -0.18 -0.10 1996-97 1.25 2.09 -0.10 -0.73 1997-98 2.27 1.89 0.57 -0.19 1998-99 2.22 1.57 0.18 0.47 1999-00 -0.20 0.37 -0.05 -0.53 2000-01 -1.09 -0.75 -0.25 -0.09 *Using the augmented Domar aggregation formula of equation (27), the MFP growth based on aggregate approach can be decomposed into three main components: the MFP growth based on industry-level approach, the contribution of reallocations of industry value-added and the contribution of reallocations of industry primary inputs. Thus, for the estimates in the columns: (1) = (2) + (3) + (4). Note, however, that the difference between the MFP growth estimates based on the aggregate approach (column (1)) and industry-level approach (column (2)) as well as the term for the industrial reallocation of value-added (column (3)) can also reflect the minor difference between the output measures used in the two approaches. See Appendix A for a detailed comparison of the measures used in the two approaches. As can be seen from Table 5, the effects of reallocation of industry primary inputs have contributed negatively to the aggregate MFP growth in most of the years except in 1993-94 and 1989-99. In some years, these negative contributions have been partially offset by the positive contributions of reallocation of industry value-added. Note, however, that the estimates of these contributions become less important as the differences between the two sets of aggregate MFP estimates are already found small, which is sufficient for our purposes of assessing the plausibility of the experimental industry-level MFP estimates.

38
6. The open versus the closed economy MFP index So far, we have not made a clear distinction between the MFP index under the closed economy and that under the open economy This distinction, however, is important if MFP index is intended to correctly reflect the productivity and efficiency changes generated from domestic production. In an open economy, many of the intermediate inputs are not produced by domestic industries and are imported from other countries. Thus, in theory they should not be treated the same as those domestically produced intermediate inputs in productivity measurement. Rather, they should be classified as primary inputs along with capital and labour, which are considered exogenous to the economy viewed as an input-output system. This is the motivation behind the delivery to final demand model of aggregate MFP growth developed by Gollop (1983, 1987). As seen in Section 2, we have presented the measure of MFP based on the deliveries to final demand as an alternative to value added based aggregate MFP index. According to Gollop (1983, 1987), the aggregate MFP growth formulation as presented in equation (5) is the index adjusted for the effects of the open economy, while the aggregate model of MFP growth based on value added as shown in equation (3) is its closed economy counterpart. It turns out that the relationship between the two aggregate MFP indices is quite simple,
vFD V
FD
p Vp FD
τ τ
=
(28)
As mentioned in Section 2, the value of aggregate deliveries to final demand exceeds the value of aggregate value added by an amount equal to the value of imported intermediate inputs. Thus, in general the rate of growth of aggregate MFP index based on deliveries to final demand is less than that based on value-added, i.e.
FD Vτ τ< , unless the value of imported intermediate inputs is zero, which is the case under the closed economy19. Both the values of the market-sector aggregate value added and aggregate deliveries to final demand can be derived from the national accounts. Thus, the weights in equation (28) can be calculated to obtain the estimates of MFP growth under the open economy. They are presented in Table 6, along with their closed economy counterpart.
19 As pointed out by Balk from one of his comments on this paper, the deliveries to final demand based MFP measure as that of Gollop (1983, 1987), is nothing but the gross output based measure at the level of the entire economy. This point is also implied in Balk (2003a, footnote 5). It can also be seen more clearly by comparing equation (28) with equation (13).

39
Table 6: The open versus the closed economy MFP estimates*
MFP growth from Cat. 5204 (01-02)
Vτ Open economy MFP growth
FDτ
% % 1990-91 0.11 0.10 1991-92 0.68 0.59 1992-93 1.57 1.37 1993-94 2.21 1.92 1994-95 0.65 0.56 1995-96 2.79 2.39 1996-97 1.25 1.08 1997-98 2.27 1.95 1998-99 2.22 1.90 1999-00 -0.20 -0.17 2000-01 -1.09 -0.93 * The open economy MFP growth, FDτ is derived using equation (28). It must be noted, however, that this model of aggregate MFP growth developed by Gollop (1983, 1987) is not the only framework of measuring MFP under the open economy. There are several other approaches which have appeared in the literature with special consideration given to the issues of open economy MFP measurement. For example, Diewert and Morrison (1986), Fox and Kohli (1998) and Kohli (1990, 2003) suggest to correct the productivity indices by a terms of trade effect, as if an improvement in the terms of trade of the economy were equivalent to an outward movement of the economy�s production possibility frontier. Contrast to Gollop�s (1983, 1987) approach where imported intermediate inputs are treated as primary inputs, Durand (1996) and Cas and Rymes (1991) consider alternative ways of closing the economy on imported inputs so that the additional productivity gains generated by imported inputs may be attributed appropriately to an economy under the input-output based MFP framework. Their approaches are based on the argument that looking at the productivity of the integrated set of economies that are trading together, treating their imported inputs as primary inputs as that by Gollop (1987) would result in productivity estimates for each of these economies that would not aggregate to the productivity gains of all the economies taken as a whole. However, the direct application of these approaches within the framework of the non-parametric MFP estimation employed in this paper may not be as straightforward as the method proposed by Gollop (1983, 1987). Thus, it seems that a generally accepted solution to the open economy issue, particularly for the MFP estimates derived for the purposes of statistical production, has yet to crystallise. This may be the topic for future work.

40
7. Conclusions This paper has discussed several issues resulting from a project of estimating industry-level MFP by the Australian Bureau of Statistics to meet users� demand. From the perspectives of statistical production, two approaches to estimating industry-level MFP have been considered: the input-output based approach, which was developed by Statistics Canada (Durand 1996, Cas and Rymes 1991), and the one recently recommended by the OECD Productivity Manual (OECD 2001). The latter one is closely related to the approach developed by Jorgenson, Gollop and Fraumeni (1987), and is also a bottom-up, non-parametric approach based on production economics. After considering the current ABS data environment, our estimation of industry-level MFP followed the approach recommended by the OECD Productivity Manual. We have presented the experimental estimates of MFP based on both gross output and value added for the 12 market-sector industries in Australia. Since aggregate market-sector MFP indices can also be derived from the industry-level estimates, this was used as a way of assessing the plausibility of the experimental industry-level MFP estimates. It has been found that the differences are small based on a comparison between the MFP estimates aggregated from the industry-level results and those currently published by the ABS. This seems to validate the plausibility of the experimental industry-level MFP estimates presented in the paper. To understand the causes of the differences observed in the validation exercise, we also considered the issues of consistency in aggregation. We compared the components of the two indices and found that the small differences are partly due to different output measures and different index formulae for aggregating labour inputs applied in the two approaches. A more important source of the differences is, however, directly related to the models of production underlying the two approaches to the measurement of aggregate MFP. This is revealed by an aggregation relation derived by Jorgenson, Gollop and Fraumeni (1987), which augments the Domar aggregation formula of linking industry-level and aggregate MFP indices. Using the augmented Domar aggregation formula, we decomposed the estimates of MFP growth derived from the aggregate approach into a weighted sum of industry-level MFP growth and weighted sums of rates of growth of value added, capital input and labour input, reflecting the contributions of the reallocations of these outputs and inputs among industries. We also presented open economy MFP estimates for the aggregate market-sector based on an approach by Gollop (1983, 1987). It has been noted that although there are several other approaches dealing with the issues of MFP measurement under the open economy, the direct application of these approaches within the framework of the non-parametric MFP estimation employed in this paper may not be as straightforward as the method proposed by Gollop (1983, 1987). Thus, it seems that a generally accepted solution to the open economy issue has yet to crystallise. This may be the topic for future work.

41
Appendix A: Comparing the components of industry-level and aggregate MFP
indices In Section 5, we aggregated the experimental estimates of industry-level MFP by applying the aggregation formula of equation (14) (summing over the market industries). The resulting estimates of aggregate MFP are quite close to those from the aggregate approach used for the published MFP, with the largest difference being less than one percentage point in 1992-93. This exercise of comparison seems to validate the plausibility of the experimental industry-level MFP estimates. However, the question of what explains and causes these differences, however small, between the two sets of aggregate MFP estimates still remains. This appendix compares the components used in the two MFP indices so that part of the difference caused by the measurement issues can be identified. The next appendix discusses the causes of the difference as a result of methodological distinctions between industry-level and aggregate approaches. A1. Output measures One source of discrepancy between the estimates based on the two approaches is caused by the fact that we use gross value added (GVA) for the market-sector industries, whereas the published aggregate MFP uses GDP as the measure of output. The following accounting identity shows the difference between the two output measures:
GDP = GVA at basic prices + net taxes on products (29) In the published aggregate MFP, the total market-sector GDP volume measure is defined by
MKT i e-wide
i MKTGDP V net taxes on products
∈
= +∑ (30)
where all measures in the above equation are in volume terms, iV is the volume measure of gross value added (GVA) for industry i, MKT is a shorthand for the market-sector and e-wide stands for the economy-wide, which includes all the industries in the economy, both market and non-market-sectors. Equation (30) indicates that the volume measure of GDP for the market-sector is equal to the volume measure of GVA summing across all the market-sector industries, plus the volume measure of the economy-wide net taxes on products. Thus the method used for deriving the MFP estimates in 5204.0 assumes that all net taxes on products are produced by the market-sector industries, or in other words, the non-market-sector industries do not contribute to any of these net taxes. The GDP volume measures, as shown in equation (30), in the two periods, t and t-1, can then be used to derive the rate of growth in volume GDP, which forms the first component of the aggregate MFP growth index of equation (4) as in the main body of

42
the text. This is essentially the method used in the estimation of aggregate output growth for the published MFP estimates. To compare the output estimates with those based on our industry-level approach, we calculate the aggregate output growth using
the industry-level volume measures of GVA and � �i
i
iV
iii MKT V
i MKT
p VV V
p V∈∈
=
∑ ∑. The
following table and graph contain the results of the comparison. Different measures of aggregate output volume growth (%) Note that the market-sector GDP volume growth is directly obtained from the spreadsheet associated with Cat. 5204.0 (2001-02). As can be seen from the above table and graph, despite the different measures of output used, the differences (GVA column minus GDP column) in the growth rates between the two sets of measures are small, with the average GDP volume growth rate being 0.13 percentage point greater than its GVA counterpart. In addition, the direction of acceleration for the two series are identical.
GVA GDP differ (% pts)1990-91 -0.8 -0.6 -0.21991-92 -1.1 -1.1 0.01992-93 2.5 3.1 -0.61993-94 4.4 4.5 -0.11994-95 4.1 4.4 -0.41995-96 4.9 4.7 0.21996-97 3.6 3.5 0.11997-98 4.3 4.8 -0.61998-99 5.1 5.3 -0.21999-00 4.2 4.2 0.02000-01 0.6 0.3 0.3
Growth in aggregate volume output : market sector
-2.0-1.00.01.02.03.04.05.06.0
1990-91
1991-92
1992-93
1993-94
1994-95
1995-96
1996-97
1997-98
1998-99
1999-00
2000-01
GVA GDP
%

43
A2. Capital services
To compare the estimates for the capital component, we use � �i
iKi
i MKT Ki MKT
GVAK KGVA∈
∈
=
∑ ∑
to calculate the growth rate of aggregate capital services, where iKGVA is the adjusted
capital income for industry i as defined in Section 3.4. The same set of indices of capital services by industry is used in the two approaches. However, instead of using the weights of adjusted capital income as shown in the above aggregation formula for the growth of capital services, the shares of the industry�s gross operating surplus (GOS) in the aggregate GOS for the market-sector, including the net indirect taxes attributed to capital, are employed as weights for the aggregate capital services of the published MFP estimates. As before, the growth rates for the aggregate capital services in the published MFP are obtained using the indices that are available from the spreadsheet associated with Cat. 5204.0 (2001-02). The results of comparison are shown in the following table and graph. Growth in the aggregate capital services (%) As can be seen, the differences between the two sets of estimates are very small. On average, the growth in aggregate capital services in the published MFP is marginally higher than that based on our estimates by 0.05 percentage point, and in majority of the years, the differences are negligible. This is not surprising because in both sets of the estimates, the same industry-level capital services indices are used for aggregation. The very small differences are caused only by the different definitions
our estimates 5204 (01-02) differ (% pts)1990-91 2.8 2.9 -0.11991-92 1.9 1.8 0.21992-93 2.6 2.6 0.01993-94 2.7 2.8 -0.11994-95 3.4 3.4 0.01995-96 3.8 3.9 0.01996-97 5.0 5.1 -0.11997-98 5.4 5.5 -0.11998-99 5.5 5.7 -0.21999-00 5.5 5.6 -0.12000-01 3.5 3.5 0.0
Growth in aggregate capital services: market sector
1.01.52.02.53.03.54.04.55.05.56.0
1990-91
1991-92
1992-93
1993-94
1994-95
1995-96
1996-97
1997-98
1998-99
1999-00
2000-01
our estimates 5204 (01-02)
%

44
of the weights used for aggregation, which turn out to have very little impact on the growth of aggregate capital services. A3. Labour input Our estimates of aggregate labour input growth are calculated using the indices of
hours worked by market-sector industry and applying � �i
iLi
i MKT Li MKT
GVAL LGVA∈
∈
=
∑ ∑, where
iLGVA is the adjusted labour income for industry i as defined in Section 3.4. In
discrete approximation, this is equivalent to the Tornqvist index shown in equation (22) of the main text. In the published MFP estimates, the aggregate (market-sector) labour input is derived by adding up hours worked of all the market-sector industries and then it is indexed to some base year value. The corresponding proportional growth rate for the aggregate labour input is calculated using two years indices, and hence there are no weights being used in this procedure. This is essentially a fixed weight Laspeyres type quantity index as shown in equation (21) of the main text. Thus, the estimates derived from this method can be expected to be different from those based on our approach which uses the Tornqvist index formula. The following table and graph show these differences. Aggregate labour input growth (%)
our estimates 5204 (01-02) differ (% pts)1990-91 -3.30 -2.75 -0.551991-92 -5.32 -4.02 -1.301992-93 -1.62 0.68 -2.301993-94 3.20 1.91 1.291994-95 3.64 3.86 -0.221995-96 0.47 0.74 -0.271996-97 -0.90 0.21 -1.111997-98 0.36 0.53 -0.171998-99 2.20 1.36 0.841999-00 2.72 3.41 -0.692000-01 -0.31 -0.10 -0.21
Growth in aggregate labour input: market sector
-6.0-4.0-2.00.0
2.04.06.0
1990-91
1991-92
1992-93
1993-94
1994-95
1995-96
1996-97
1997-98
1998-99
1999-00
2000-01
our estimates 5204 (01-02)
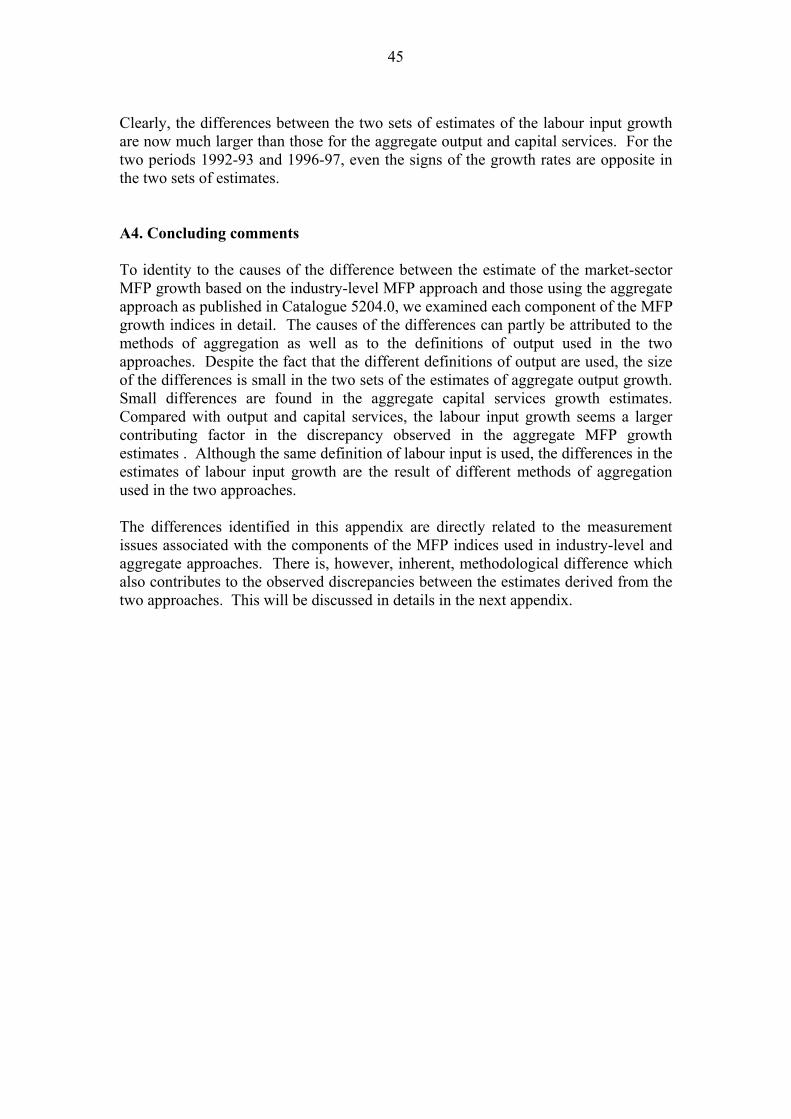
45
Clearly, the differences between the two sets of estimates of the labour input growth are now much larger than those for the aggregate output and capital services. For the two periods 1992-93 and 1996-97, even the signs of the growth rates are opposite in the two sets of estimates. A4. Concluding comments To identity to the causes of the difference between the estimate of the market-sector MFP growth based on the industry-level MFP approach and those using the aggregate approach as published in Catalogue 5204.0, we examined each component of the MFP growth indices in detail. The causes of the differences can partly be attributed to the methods of aggregation as well as to the definitions of output used in the two approaches. Despite the fact that the different definitions of output are used, the size of the differences is small in the two sets of the estimates of aggregate output growth. Small differences are found in the aggregate capital services growth estimates. Compared with output and capital services, the labour input growth seems a larger contributing factor in the discrepancy observed in the aggregate MFP growth estimates . Although the same definition of labour input is used, the differences in the estimates of labour input growth are the result of different methods of aggregation used in the two approaches. The differences identified in this appendix are directly related to the measurement issues associated with the components of the MFP indices used in industry-level and aggregate approaches. There is, however, inherent, methodological difference which also contributes to the observed discrepancies between the estimates derived from the two approaches. This will be discussed in details in the next appendix.

46
Appendix B: The relationship between industry-level and aggregate approaches: an augmented Domar aggregation formula
Aulin-Ahmavaara (2003) and Jorgenson, Gollop and Fraumeni (1987) state that the Domar aggregation formula in its original form (Domar 1961) requires the assumption that all the industries pay the same prices for their capital and labour inputs. Indeed, the Domar aggregation rule in its original form was proved formally in a widely cited paper by Hulten (1978) where this assumption was also employed implicitly. Jorgenson, Gollop and Fraumeni (1987) derived an augmented Domar aggregation formula in which the original version of the Domar formula is only a special case under this assumption. Without relying on this assumption, the augmented formulation by Jorgenson, Gollop and Fraumeni (1987) also includes terms of reflecting the contributions of changes in the sectoral distribution of value-added, all types of capital and labour inputs to the rate of aggregate productivity growth. This appendix shows that under the framework of production economics, the Domar aggregation formula in its original form can be derived without requiring the assumption of equal prices for the primary inputs used by the industries. Still without using this assumption, we also provide a derivation of the augmented Domar formula as that of Jorgenson, Gollop and Fraumeni (1987) that decomposes the MFP growth into several terms; one of them is a weighted sum of sectoral productivity growth, i.e. the Domar aggregation formula in its original form, while the remaining ones are terms reflecting the contribution of changes in sectoral distribution of outputs and inputs. The augmented Domar aggregation formula essentially provides a systematic explanation for the causes of the difference between the estimates of aggregate MFP derived from the aggregate and industry-level approaches. This way of identifying the sources of the difference also has immediate implications for our exercise of validating the experimental industry-level MFP index estimated in this paper. As a way of assessing the plausibility of these estimates, we aggregate them to the market-sector level, and then compare the aggregates to the market-sector MFP estimates derived directly from the aggregate approach. Thus, using the augmented Domar aggregation formula we are able to explain the systematic part of the difference between the aggregate estimates derived from the two approaches. The derivation of the Domar aggregation formula in this appendix draws on Gollop (1981). However, special attention is paid to the assumption of equal primary factor prices across industries, and also we assume a closed economy setting so that the issue of open versus closed economy MFP estimation is not considered. The Domar aggregation formula provides a rule that connects the economy-wide and industry/sectoral level MFP growth. Thus, we need both a sectoral/industry model and an aggregate model of production.

47
B1. Aggregate production and productivity For a closed economy, an aggregate production possibility frontier is postulated in which the maximum aggregate output is expressed as a function of all quantities of value added, all supplies of primary inputs and time:
1 2 11 12 11 12( , ,..., ; , ,..., ; , ,..., ; )n mn rnH V V V K K K L L L t λ= (31)
where λ is a constant. The function H is homogenous of degree minus one in the quantities of value added, homogenous of degree one in the factor supplies and homogenous of degree zero in quantities of valued added and factor supplies together (Jorgenson, Gollop and Fraumeni 1987, pp 53). The rate of aggregate MFP growth ( Vτ ) is derived by taking the total logarithmic derivative of the function F with respect to time:
ln ln ln� � � 0ln ln lni ki li V
i i k i li ki li
H H HV K LV K L
τ∂ ∂ ∂+ + + =
∂ ∂ ∂∑ ∑∑ ∑∑ (32)
where ln /V H tτ = ∂ ∂ . Clearly, aggregate productivity change can be thought of an expansion in the aggregate production possibility frontier, holding all real primary inputs constant. Necessary conditions under the producer equilibrium at the aggregate level imply that the aggregate output elasticities appearing in equation (32) can be represented by value shares:
ln /ln i iV i V i
ii
H p V p VV
∂= −
∂ ∑ i = 1, 2, �, n
ln /ln iki ki V i
iki
H p K p VK
∂=
∂ ∑ k = 1, 2, �, m; i = 1, 2, �, n
ln /ln ili li V i
ili
H p L p VL
∂=
∂ ∑ l = 1, 2, �, r; i = 1, 2, �, n.
where p is the price associated with the quantity of value added and primary inputs. The rate of aggregate MFP growth can then be written as
� � �i
i i i
V i ki ki li liV i ki li
i i k i lV i V i V ii i i
p V p K p LV K Lp V p V p V
τ = − −
∑ ∑∑ ∑∑∑ ∑ ∑ (33)

48
B2. Industry-level production and productivity At the sectoral level, the specification of an industry�s technology is a production function incorporating all primary and intermediate inputs, and time:
( )1 1 1,..., ,..., ; ,... ,... ; ,..., ,..., ;i
i i ki mi i li ri i ji niG f K K K L L L X X X t=
(34) where iG quantity of the ith industry�s gross output; kiK kth capital input used in the ith industry; liL lth labour input used in the ith industry; jiX jth intermediate input used in the ith industry. Total differentiating the above equation logarithmically with respect to time, the rate of growth in gross output can be decomposed into its source components:
ln ln ln� � � �ln ln ln
i i i ii G ki li ji
k k jki li ji
G G GG K L XK L X
τ ∂ ∂ ∂= + + +
∂ ∂ ∂∑ ∑ ∑ (35)
where ln /i
G iG dtτ = ∂ , the measure of MFP growth based on gross output; and it is the rate of growth of gross output while holding all inputs constant. The assumption of competitive equilibrium in all output and input markets implies that each input is paid the value of its marginal product:
lnln
i
i ki ki
ki G i
G p KK p G
∂=
∂ k = 1, 2, �, m
lnln
i
i li li
li G i
G p LL p G
∂=
∂ l = 1, 2, �, r
lnln
i
ji jii
ji G i
p XGX p G
∂=
∂ j = 1, 2, �, n.
where p is the price associated with the outputs and inputs. Under these conditions, the gross output MFP growth for the ith industry can be written as
� � � �i i i
ji jii ki ki li liG i ji ki li
j k lG i G i G i
p X p K p LG X K Lp G p G p G
τ
= − − −
∑ ∑ ∑ (36)

49
Note that all the prices appeared in the formulation of aggregate and industry level MFP growth (i.e. in equations (33) and (36)) are specific to the quantity measures they are associated with; there is no assumption of equal prices for primary inputs across industries ever being used. B3. A decomposition of value added growth To establish the link between the aggregate and industry-level MFP growth, we need to use one extra relation which can be derived from either an accounting identity or a sectoral production function assuming value added separability. Under the assumption of value added separability, the gross output production function (34) can be written as ( )1; ,..., ,...,i
i i i ji niG f V X X X= (37) where ( )1 1,..., ,..., ; ,... ,... ;i
i i ki mi i li riV h K K K L L L t= . Total differentiating equation (37) logarithmically with respect to time and after rearranging, the rate of growth of real value added for the ith industry can be written as
11
ln ln ln ln�� � � �... ...ln ln ln ln
i i i ii i i ji ni
i i ji ni
V V V VV G X X XG X X X
∂ ∂ ∂ ∂= − − − − −∂ ∂ ∂ ∂
(38)
Still assuming competitive equilibrium, we have
lnln
i
i
G ii
i V i
p GVG p V
∂=
∂; ln
lni
ji jii
ji V i
p XVX p V
∂=
∂
Equation (38) can then be written as
�� �i
i i
G i ji jii i ji
jV i V i
p G p XV G X
p V p V
= −
∑ (39)
The above production function approach to deriving the relation in equation (39) also shows how double deflation is consistent with production theory (Oulten 2000). As mentioned before, the relation in equation (39) can also be derived using the accounting identity of nominal value added in industry i:
i iV G i ji jij
p V p G p X= −∑ by
differentiating it with respect to time, while holding prices constant.

50
B4. Domar aggregation formula in its original form Without using the assumption that all the industries pay the same prices for their capital and labour inputs, we have derived the formulae for aggregate and industry-level MFP growth in equations (33) and (36), as well as the extra relation of value added growth decomposition in equation (39) under the framework of production economics. Using these three equations, now it is straightforward to derive the Domar aggregation formula in its original form. Substituting equation (39) for value added growth into the aggregate MFP growth formula in equation (33), we obtain
� � �
�
i
i i i
i
G i ji ji ki kiV i ji ki
i i j i kV i V i V ii i ii
li lili
i l V ii
p G p X p KG X Kp V p V p V
p K Lp V
τ = − −
−
∑ ∑∑ ∑∑∑ ∑ ∑
∑∑ ∑
(40)
Substituting equation (36) of industry level MFP growth for �
iG into the above equation gives
� � �
� �
i
i
i i i
i i i
G i iV G
i V ii
ji ji ki ki li liji ki li
i j i k i lV i V i V ii i i
ji ji ki ki li liji ki
i j i kV i V i Vi i
p Gp V
p X p K p LX K Lp V p V p V
p X p K p KX Kp V p V p
τ τ =
+ + + − − −
∑ ∑
∑∑ ∑∑ ∑∑∑ ∑ ∑
∑∑ ∑∑∑ ∑�
lii l i
i
LV
∑∑ ∑
(41)
The last six terms in the above equation cancel each other out. This leaves the Domar aggregation formula in its original form,
i
i
G i iV G
i V ii
p Gp V
τ τ =
∑ ∑ (42)
Clearly, in the whole process of deriving equation (42), no assumption of equal primary input prices across industries has ever been made. In another word, the conditions ki Kkp p= and li Llp p= are not required for obtaining the Domar aggregation formula in its original form.

51
B5. An augmented Domar aggregation formula In the above derivation of the Domar aggregation formula, we started from a production possibility frontier in equation (31). Instead of this more general case, we now use an aggregate production function with different types of primary inputs while suppressing the industry detail. This way of deriving aggregate MFP growth is called the aggregate approach as oppose to the industry-level approach in the previous section where the aggregate MFP growth is obtained through applying the Domar aggregation formula (in its original form) to the index of industry-level MFP growth. The aggregate production with different types of primary inputs can be expressed as ( )1 2 1 2, ,..., ; , ,..., ;m rV F K K K L L L t= (43) Going through the same procedure of derivation as before and still assuming competitive equilibrium, the aggregate MFP growth is now equal to
� � �Kk k Ll lV k l
k lV V
p K p LV K Lp V p V
τ ′ = − −∑ ∑ (44)
where Vp , Kkp and Llp are the prices associated with aggregate value added, returns to the kth type of capital and returns to the lth type of labour respectively. Using the value added growth decomposition in equation (39), we can express the rate of gross output growth in industry i as,
� � �i
i i
V i ji jii i ji
jG i G i
p V p XG V X
p G p G
= +
∑ (45)
Substituting �
iG from the above equation into the formula for MFP growth based on gross output in equation (36), we obtain
� � �i
i i i
V ii ki ki li liG i ki li
k lG i G i G i
p V p K p LV K Lp G p G p G
τ
= − −
∑ ∑ (46)
Multiplying both sides of equation (46) by /
iG i Vp G p V and summing over i, it gives
� � �i iG i V ii ki ki li liG i ki li
i i i k i lV V V V
p G p V p K p LV K Lp V p V p V p V
τ
= − −
∑ ∑ ∑∑ ∑∑ (47)
Then subtracting both sides of the above equation from the rate of MFP growth for the economy as a whole in equation (44) and after rearranging, we obtain

52
� � � �
� �
i iG i V ii ki ki Kk kV G i ki k
i i i k kV V V V
li li Ll lli l
i l lV V
p G p V p K p KV V K Kp V p V p V p V
p L p LL Lp V p V
τ τ
′ = + − + −
+ −
∑ ∑ ∑∑ ∑
∑∑ ∑ (48)
This is the augmented Domar aggregation formula. It can be expressed in discrete time as that in Jorgenson, Gollop and Fraumeni (1987). The first term on the right hand side of equation (48) is the Domar aggregation formula in its original form as in equation (42). The last three terms with square brackets reflect respectively the contributions of changes in the sectoral distribution of value added, all types of capital input, and all types of labour input to the rate of aggregation MFP growth. Rather than starting from a production possibility frontier, this augmented form of the Domar aggregation formula has been derived using the aggregate production function while keeping the sectoral level formulations exactly the same as in derivation of the original Domar aggregation formula. Note that this augmented Domar aggregation formula is still without relying on the assumption of equal primary input prices across industries. The augmented Domar aggregation formula also makes explicit the conditions under which the aggregate and industry-level approaches can produce the identical MFP estimates at the aggregate level. This is clear from the last three terms in equation (48). For the value added term, it is straightforward to see that, provided that the aggregate value added growth is derived from a Divisia index aggregating from the industry-level value added, this term will disappear. For the last two terms, they will also be zero if the Divisia index is repeatedly applied in all levels of aggregation for the capital and labour growth. This can be easily seen for the capital input growth after repeatedly applying the Divisia index,
� � �
�
� �
i
i
i
K iki ki Kk k ki kiKki k ki
i k k i kV V V K K i
Kk kKk
kV K
K iK Ki
iV K V
K
p Kp K p K p Kp KK K Kp V p V p V p K p K
p Kp K Kp V p K
p Kp K p KK Kp V p K p V
p K
− =
−
= −
=
∑∑ ∑ ∑ ∑
∑
∑
� �
0
K
V V
p KK Kp V p V
−
=
(49)
For the labour input, the same result holds. As can be seen, however, these results are crucially based on continues time. If the Tornqvist index is used as the discrete approximation to these indices, the capital and labour terms in equation (48) may not equal to zero, even if it is used repeatedly at each stage of the aggregation.

53
Consequently, the difference between the augmented Domar aggregation formula and its original form will not usually disappear under this consideration. A more interesting result is that if the assumption of equal primary factor prices across industries is imposed, the augmented Domar aggregation formula of equation (48) will be reduced to the original form of equation (42). To see this, we observe the following market equilibrium conditions: ; ; i k ki l li
i i iV V K K L L= = =∑ ∑ ∑ (50)
Expressing the above conditions in terms of growth rate and substituting each of them into the corresponding variables in equation (48) and after some manipulation, equation (48) can be expressed in the form of
( ) �
( ) ( )� �
i iG i V V iiV G i
i iV V
ki Kk ki li Ll liki li
i k i lV V
p G p p VV
p V p V
p p K p p LK Lp V p V
τ τ−
′ = +
− −+ +
∑ ∑
∑∑ ∑∑ (51)
Assuming that the prices of industry-level value added are identical
iV Vp p= , which is a questionable assumption itself, the above equation will clearly be reduced to the Domar aggregation formula in its original form if all industries pay the same prices for capital and labour inputs, i.e. ki Kkp p= and li Llp p= . This may be the reason behind the statement by Aulin-Ahmavaara (2003) and Jorgenson, Gollop and Fraumeni (1987) that the Domar aggregation formula in its original form requires the assumption of equal primary input prices across industries. However, as we have seen before, equation (42) can be derived without using this assumption. The difference between the original Domar aggregation formula Vτ and its augmented form Vτ ′ can also be interpreted as measures of departures from the assumptions that underlie the aggregate approach to MFP in which an aggregation production is assumed (Jorgenson, Gollop and Fraumeni 1987). These assumptions include that there exist value added functions for each sector and they are identical up to a scalar multiple. In addition, capital and labour inputs are identical functions of their components for all industries. Finally, all industries pay the same prices for capital and labour inputs and the prices of industry-level value added are identical. Now it is clear that in our exercise of comparing the aggregate MFP growth estimates derived from the industry-level and aggregate approaches, we must take into account the effects of contributions of indusial reallocations of value added and the primary factor inputs to the rate of aggregate MFP growth as those captured in the augmented Domar aggregation formula. In anther word, there are inherent differences between the aggregate and industry-level approaches which will cause the divergence between the aggregate MFP estimates we are comparing; and they must be taken into account in our assessment of the plausibility of the experimental industry-level MFP estimates.

54
References Australian Bureau of Statistics (2000), Australian System of National Accounts:
Concepts, Sources and Methods, ABS Cat. No. 5216.0. Australian Bureau of Statistics (2002), Australian System of National Accounts 2001-
02, ABS Cat. No. 5204.0. Aspden, Charles (1990), �Estimates of multifactor productivity, Australia�, Occasional
Paper, Australian Bureau of Statistics Cat. 5233.0, August 1990. Aulin-Ahmavaara, Pirkko (2003), �The SNA93 values as a consistent framework for
productivity measurement: unsolved issues�, Review of Income and Wealth, series 49, no. 1, pp. 117-133.
Baldwin, Jon, R. and Tarek M. Harchaoui (2004), �The integration of the Canadian
productivity accounts within the system of national accounts: current status and challenges ahead�, Statistics Canada�s paper presented at the NBER-CRIW Conference on the New Architecture for the U.S. National Accounts, 16-17 April 2004.
Balk, B. M. (2003a), �On the relation between gross-output and value-added based
productivity measures: the importance of the Domar factor�, paper presented to the Economic Measurement Group�s 4th International Workshop, University of New South Wales, Sydney, Australia, 11-12 December, available from http://economics.web.unsw.edu.au/research/caer/EMG_papers_03.html.
Balk, B. M. (2003b), �The residual: on monitoring and benchmarking firms,
industries, and economies with respect to productivity�, Journal of Productivity Analysis vol. 20, pp. 5-47.
Bruno, N. (1978), �Duality, intermediate inputs and value-added�, in Production
Economics: A Dual Approach to Theory and Applications, edited by M. Fuss and D. McFadden, Amsterdam: North-Holland.
Cas, A. and T. K. Rymes (1991), On Concepts and Measures of Multifactor
Productivity in Canada, 1961�1980, Cambridge University Press, New York. Cobbold, T. and Kulys, A. (2003), Australia�s Industry Sector Productivity
Performance, Productivity Commission Research Memorandum, Canberra. Coelli, Tim, D. S., Prasada Rao and George E. Battese (1998), An Introduction to
Efficiency and Productivity Analysis, Kluwer Academic Publishers. Diewert, W. E. (1976), �Exact and superlative index numbers�, Journal of
Econometrics, vol. 4, pp. 115-146. Diewert, W. E. (1978), �Superlative index numbers and consistency in aggregation�,
Econometrica, vol. 46, pp. 883-900.

55
Diewert, W. E. (1992), �Fisher ideal output, input and productivity indices revisited�,
Journal of Productivity Analysis, vol. 3, pp. 211-248. Diewert, W. E. (2000), �The challenge of total factor productivity measurement�,
International Productivity Monitor, No. 1 Fall 2000, pp. 45-52. Diewert, W. E. and Morrison, C. J. (1986), �Adjusting output and productivity
indexes for changes in the terms of trade�, Economic Journal, vol. 96, pp. 659-679. Domar, Evsey (1961), �On the measurement of technological change�, Economic
Journal, December 71, pp. 309-329. Durand, René (1993), �Statistics Canada�s multifactor productivity accounts: concepts
and methods� (preliminary), Input-Output Division, Statistics Canada. Durand, René (1994), �An alternative to double deflation for measuring real industry
value-added�, Review of Income and Wealth, 40, pp. 303-316. Durand, René (1996), �Canadian input-output-based multi-factor productivity
accounts�, Economic System Research, Vol. 8, No. 4, pp. 367-389. Fox K. J. and U. Kohli (1998), "GDP Growth, Terms-of-Trade Effects and Total
Factor Productivity," Journal of International Trade and Economic Development 7:1, pp. 87-110.
Gowdy, John . M. and Jack L. Miller (1990), �Harrod-Robinson-Read measures of
primary input productivity: theory and evidence from U.S. data�, Journal of Post Keynesian Economics, Summer Vol. 12, No. 4, pp. 591-604.
Gollop, F. M. (1979), �Accounting for intermediate input: the link between sectoral
and aggregate measures of productivity growth�, in National Research Council, Measurement and Interpretation of Productivity, National Academy of Sciences, Washington, pp. 318-333.
Gollop, F. M. (1983), �Growth accounting in an open economy�, in Dogramaci, A.
(ed.), Development in Econometric Analyses of Productivity, Boston, Kluwer Nijhoff.
Gollop, F. M. (1987), �Modeling aggregate productivity growth: the importance of
intersectoral transfer prices and international trade� Review of Income and Wealth, 33(2), pp. 211-226.
Greenwood, J., Hercowitz, Z. and Krusell, P. (1997), �Long-run implications of
investment-specific technological change�, American Economic Review, vol. 87, pp 342-362.
Greenwood, Jeremy and Jovanovic, Boyan (2001), �Accounting for grwoth�, in
Hulten, Dean and Harper (eds) (2001), New Development in Productivity Analysis, University of Chicago Press for the National Bureau of Economic Research.

56
Hall, Robert E. and Dale W. Jorgenson (1967), �Tax policy and investment
behaviour�, American Economic Review, vol. 57, pp. 391-414. Hercowitz, Zvi (1998), �The �embodiment� controversy: a review essay�, Journal of
Monetary Economics vol. 41, pp. 217-224. Hulten, Charles R. (1975), �Technical change and the reproducibility of capital�,
American Economic Review, vol. 65, pp 956-965. Hulten, Charles R. (1978), �Growth accounting with intermediate inputs�, Review of
Economic Studies, October, 45:3, pp. 511-518. Hulten, Charles R. (1979), �On the �importance� of productivity change�, American
Economic Review, vol. 69, Issue 1, pp 126-136. Hulten, Charles R. (1992a), �Growth accounting when technical change is embodied
in capital�, American Economic Review, Vol. 82, Issue 4, pp 964-980. Hulten, Charles R. (1992b), �Accounting for the wealth of nations: the net versus
gross output controversy and its ramifications�, Scandinavian Journal of Economics, vol. 94, pp. 9-24.
Hulten, Charles R. (2001), �Total factor productivity: a short biography�, in Hulten,
Dean and Harper (eds) (2001), New Development in Productivity Analysis, University of Chicago Press for the National Bureau of Economic Research.
Hulten, Charles R. and Wykoff, Frank C. (1981), �The measurement of economic
depreciation using vintage asset prices�, Journal of Econometrics, vol. 15, pp. 367-396.
Jorgenson , D. W. (2003), �Information technology and the G7 economies�, World
Economics, vol. 4, no. 4, pp. 139-169. Jorgenson , D. W. (2001), �Information technology and the US economy�, American
Economic Review, vol. 91, no. 1 pp 1-32. Jorgenson , D. W. (1966), �The embodiment hypothesis�, Journal of Political
Economy, vol. 74, pp. 1-17. Jorgenson, D. W. and Griliches, Z. (1967), �The explanation of productivity change�,
Review of Economic Studies, vol. 34, pp. 249-283. Jorgenson, D. W., Gollop, F. M., and Fraumeni, B. M. (1987), Productivity and US
economic growth, Cambridge, MA, Harvard University Press. Jorgenson, D. W. and Kevin J. Stiroh (2000), �Raising the speed limit: U.S. economic
growth in the information age�, Brookings papers on Economic Activity, 1, pp. 125-211.

57
Kohli, Ulrich (2003), �Growth accounting in the open economy: international comparison�, International Review of Economics and Finance, vol. 12, pp. 417-435.
Kohli, Ulrich (1990), �Growth accounting in the open economy: parametric and
nonparametric estimates�, Journal of Economic and Social Measurement, vol. 16, pp. 125-136.
Lipsey , Richard, G. and Kenneth Carlaw (2001) �What does total factor productivity
measure?� To be published as a Statistics Canada Technical Paper. Down loaded from http://www.sfu.ca/~rlipsey.
OECD (2001), OECD Productivity Manual: A Guide to the Measurement of Industry-
level and Aggregate Productivity Growth, OECD. Oliner, Stephen D., and Daniel J. Sichel (2000), �the resurgence of growth in the late
1990s: is information technology the story?�, Journal of Economic Perspectives, vol. 14, no. 4, pp. 3-22.
Oulton, Nicholas (2002), �ICT and productivity growth in the United Kingdom�,
Oxford Review of Economic Policy, 18(3), pp. 363-79. Oulton, Nicholas (2001), �Must the growth rate decline? Baumol's unbalanced growth
revisited�, Oxford Economic Papers, 53(4), pp. 605-627. Oulton, Nicholas and O�Mahony, Marry (1994), Productivity and Growth, Cambridge
University Press, Cambridge. Pasinetti, L. L. (1981), Structural change and economic growth: a theoretical essay
on the dynamics of the wealth of nations, Cambridge University Press. Productivity Commission (1999), Microeconomic Reforms and Australian
Productivity: Exploring the Links, Commission Research Paper, AusInfo, Canberra Reilly, R. and Milne, W. (2000), �Quality adjusted labour inputs�, ABS paper
presented at the 29th Annual Conference of Economists, Gold Coast, 3-6 July 2000. Rymes, T. K. (1971), On Concepts of Capital and Technical Change, Cambridge
University Press, Cambridge. Rymes, T. K. (1972), �The measurement of capital and total factor productivity in the
context of the Cambridge theory of capital�, Review of Income and Wealth, Series 18, No. 1, March: 79-108.
Rymes, T. K. (1983), �More on the measurement of total factor productivity�, Review
of Income and Wealth, 29, pp. 297-316. Simon, J. and Wardrop, S. (2002), �Australian use of information technology and its
contribution to growth�, Reserve Bank of Australia Research Discussion Paper 2002-02.

58
Solow, R. M. (1957), �Technical change and the aggregate production function�, Review of Economics and Statistics, August, pp. 312-20.
Statistics Canada (2001), Productivity Growth in Canada, Catalogue. No. 15-204-
XIE. Zheng S. Bobbin, I., Zhao, S. and Tallis, K. (2002) �Deriving industry multifactor
productivity from the I-O System�, ABS paper presented at the 14th International Conference on Input-Output Techniques, Montreal, Canada.