Remote Sensing for Hazard Mitigation and Resource Protection in Pacific Latin America

José Durán LimaChief of the Regional Integration Unit,
Division of International Trade and Integration,
ECLAC, United Nations
Productive Integration
between Latin America
and Asia Pacific: How to integrate into value chains.
The role of SMEs
Republic of Korea, 18 September 2019

Motivation
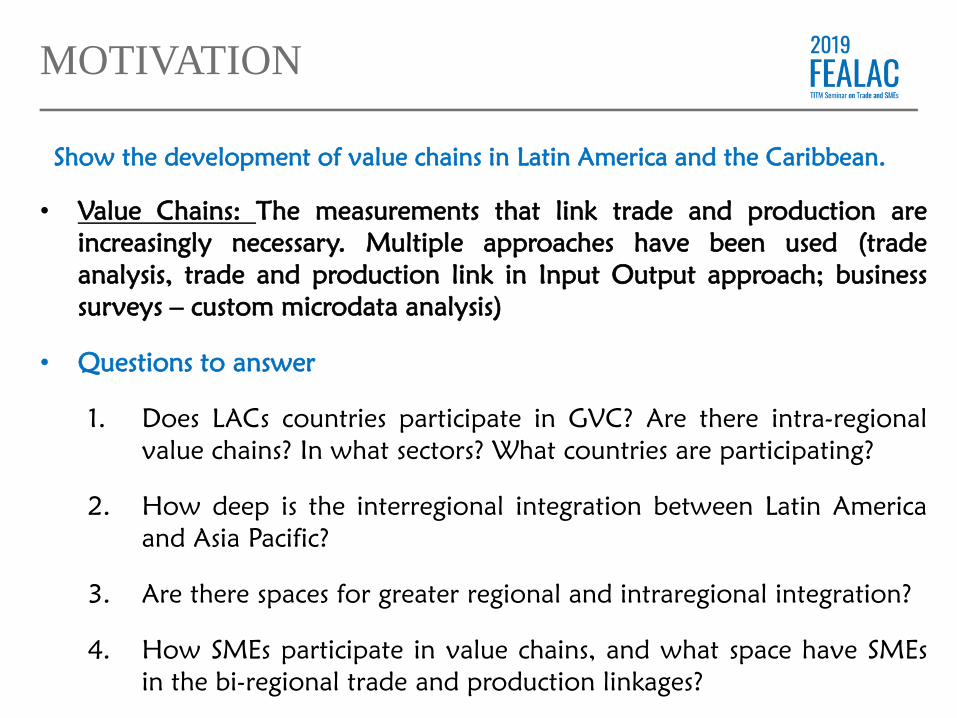
Show the development of value chains in Latin America and the Caribbean.
• Value Chains: The measurements that link trade and production are
increasingly necessary. Multiple approaches have been used (trade
analysis, trade and production link in Input Output approach; business
surveys – custom microdata analysis)
• Questions to answer
1. Does LACs countries participate in GVC? Are there intra-regional
value chains? In what sectors? What countries are participating?
2. How deep is the interregional integration between Latin America
and Asia Pacific?
3. Are there spaces for greater regional and intraregional integration?
4. How SMEs participate in value chains, and what space have SMEs
in the bi-regional trade and production linkages?
MOTIVATION

LACs
characterization
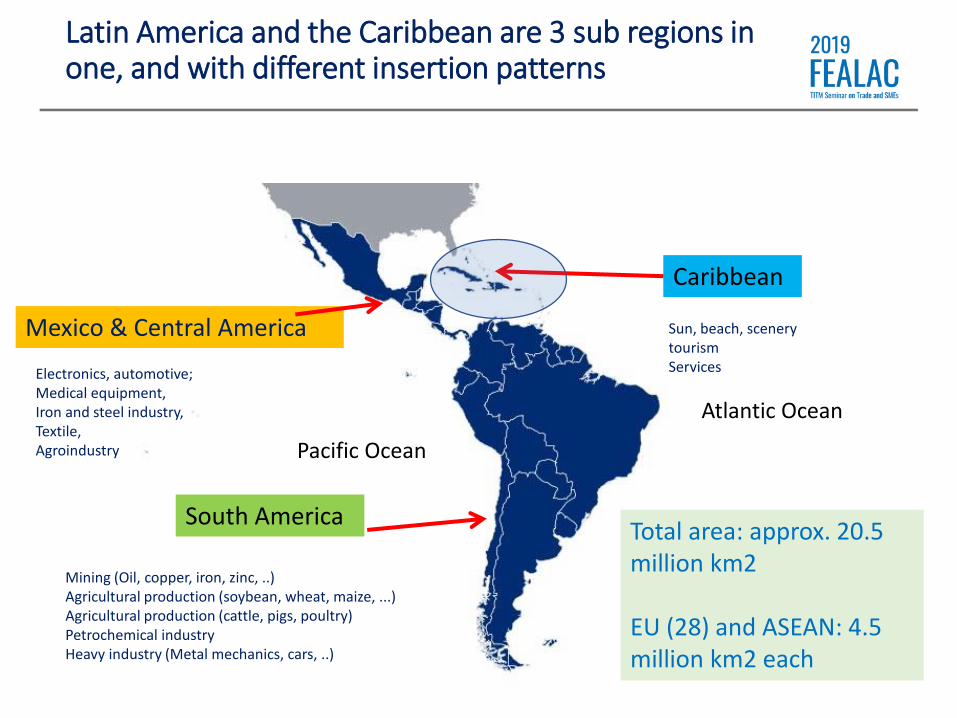
Latin America and the Caribbean are 3 sub regions in one, and with different insertion patterns
Mexico & Central America
South America
Caribbean
Total area: approx. 20.5 million km2
EU (28) and ASEAN: 4.5 million km2 each
Pacific Ocean
Atlantic Ocean
Electronics, automotive;Medical equipment,Iron and steel industry,Textile,Agroindustry
Mining (Oil, copper, iron, zinc, ..)Agricultural production (soybean, wheat, maize, ...)Agricultural production (cattle, pigs, poultry)Petrochemical industryHeavy industry (Metal mechanics, cars, ..)
Sun, beach, scenerytourismServices
Applied tariff(1)
Equivalentad valorem
due to NTBs (2)
Tariff and non tariff protection(3)=(1+2)
Share of non tariff in total protection
(4)=(2/3)*100
Administrative Barriers (EAV)
(5)
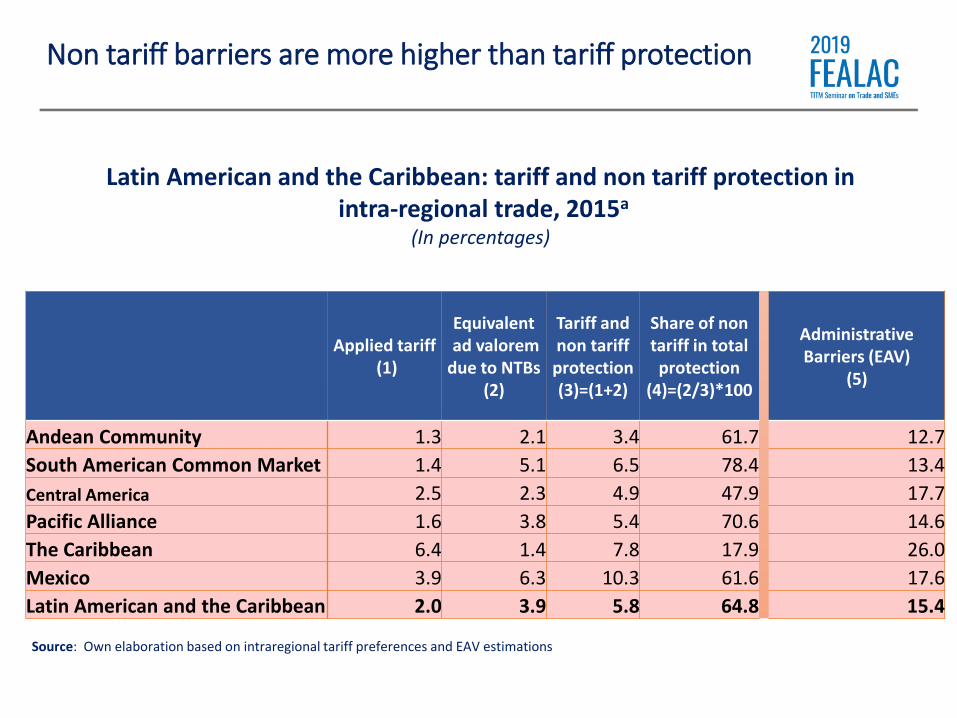
Andean Community 1.3 2.1 3.4 61.7 12.7
South American Common Market 1.4 5.1 6.5 78.4 13.4
Central America 2.5 2.3 4.9 47.9 17.7
Pacific Alliance 1.6 3.8 5.4 70.6 14.6
The Caribbean 6.4 1.4 7.8 17.9 26.0
Mexico 3.9 6.3 10.3 61.6 17.6
Latin American and the Caribbean 2.0 3.9 5.8 64.8 15.4
Latin American and the Caribbean: tariff and non tariff protection inintra-regional trade, 2015a
(In percentages)
Source: Own elaboration based on intraregional tariff preferences and EAV estimations
Non tariff barriers are more higher than tariff protection

Asia is now LAC’s second largest trade partner after the United States
ExportsImports
17
22
10
43
12
0
10
20
30
40
50
60
20
00
20
01
20
02
20
03
20
04
20
05
20
06
20
07
20
08
20
09
20
10
20
11
20
12
20
13
20
14
20
15
20
16
20
17
20
18
Latin American and the Caribbean
Pacific Asia
European Union
United States
China
Source: ECLAC based on official national data
15
31
13
32
0
10
20
30
40
50
60
20
00
20
01
20
02
20
03
20
04
20
05
20
06
20
07
20
08
20
09
20
10
20
11
20
12
20
13
20
14
20
15
20
16
20
17
20
18
Latin American and the Caribbean total merchandise trade, 2000-2018(share of selected partners in percentages)
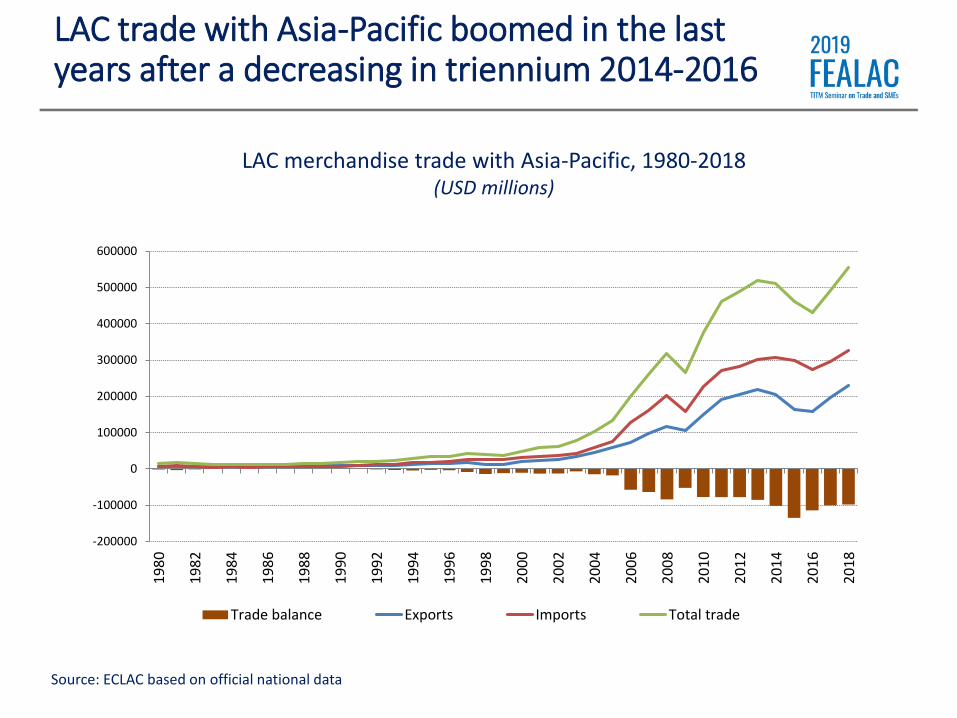
LAC trade with Asia-Pacific boomed in the last years after a decreasing in triennium 2014-2016
LAC merchandise trade with Asia-Pacific, 1980-2018(USD millions)
-200000
-100000
0
100000
200000
300000
400000
500000
600000
19
80
19
82
19
84
19
86
19
88
19
90
19
92
19
94
19
96
19
98
20
00
20
02
20
04
20
06
20
08
20
10
20
12
20
14
20
16
20
18
Trade balance Exports Imports Total trade
Source: ECLAC based on official national data
• International trade is increasingly centered around several
types of value chains: national and regional – those that
have recently leaned toward the creation of “mega-regions”
such as the North America Factory, Asia Factory and Europe
Factory
• In the last forty years global trade has been driven by value
chains.
• In the last few decades, Latin America and the Caribbean
also experienced an increase in this correlation. Notwithstan
ding the levels reached, it is still a far reach from the Europe
an Union or Asia Factory.
9
What about value chains in Latin America and the Caribbean?

What do we mean by Value Chain?
• A value chain describes the wide range of production
activities that a company and its workers undertake to
develop a product from raw material to final product.
• The stages and processes of chaining are varied:
• Backward: The ability of a sector to incorporate other sectorslinked to it by its demand for intermediate goods importedrequired from other sectors. Foreign content of VA
• Forward: The ability of a sector to boost other sectors by itssupply capacity, that is the sale of its products, which in turnare intermediate inputs from other industries in other countries trough export. (Value Added embodied in the exports ofpartners countries)
• Linkages can be national, regional, inter-reginal or global.

The civil aeronautic industry in Brazil is an example of a Global Value Chain
Some EMBRAER international suppliers in the production of a
small plane ERJ 170-190
Source P. Figueiredo, G. Silveira y R. Sbragia, “Risk sharing partnerships with suppliers: The case of EMBRAER”, Journal of Technology, Management and Innovation, 2008, Volume 3, Issue 1.
Au
stra
lia
Bru
nei
Da
r
uss
ala
m
Ch
ina
Rep
ub
lic
of
Ko
rea
Ho
ng
Ko
ng
,
Ch
ina
Ind
ia
Ja
pa
n
Ma
lay
sia
New
Zea
lan
d
Sin
ga
po
re
Th
ail
an
d
Ta
iwa
n P
ro
vin
ce o
f C
hi
na
Vie
t N
am
Argentina In neg’tPSA
(2004)
BrazilIn neg’t PSA
(2004)
Chile FTA
(2009)
FTA
(2006)
FTA (
2006)
FTA
(2004)
FTA
(2014)
PSA
(2007)
AA
(2007)
FTA
(2012)
FTA
(2006)
FTA
(2006)
FTA
(2013)*
FTA
(2014)
Colombia In neg’t FSFTA
(2014)TN In neg’t In neg’t
Costa RicaFTA
(2011)
FTA
(2018)
TLC
(2013)
El SalvadorFTA
(2018)
FTA
(2008)
GuatemalaCooperation
Agreement
(2019)
FTA
(2006)
HondurasFTA
(2018)
FTA
(2008)
Mexico TPP TPPAA
(2005)TPP TPP TPP TPP
NicaraguaFTA
(2018)
FTA
(2008)
PanamaFTA
(2018)
FTA
(2006)
FTA
(2004)
Paraguay In neg’tPSA
(2004)
Peru TPP TPPFTA
(2010)
FTA
(2011)
AA
(2012)TPP TPP
FTA
(2009)
FTA
(2011)TPP
Uruguay In neg’tPSA
(2004)
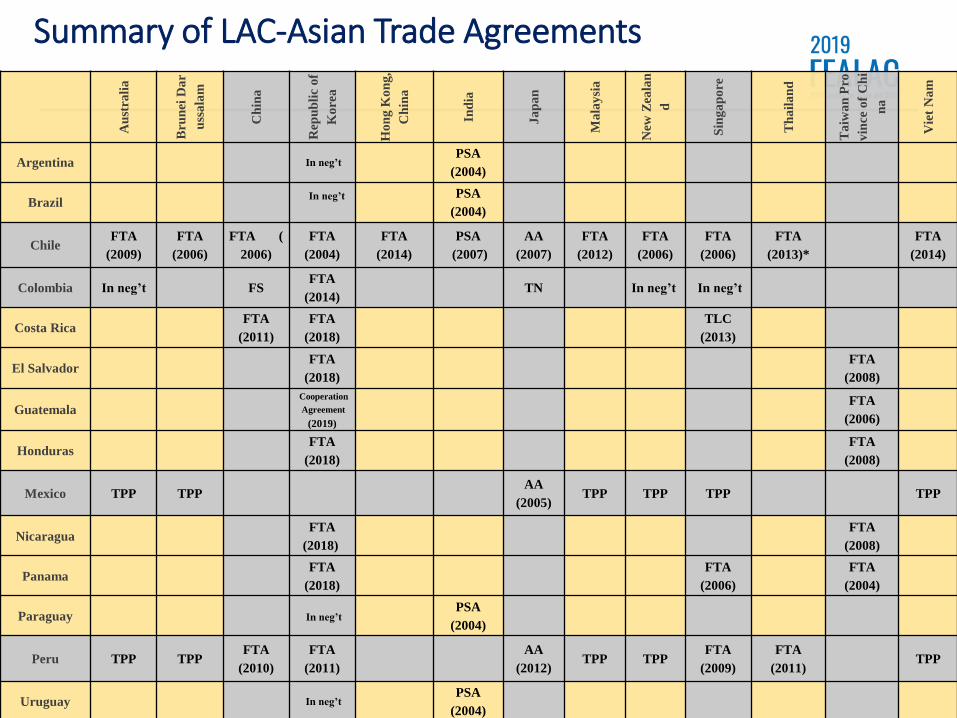
Summary of LAC-Asian Trade Agreements

China JapanRepublic
of Korea
Others
(in force)
TPP-11a
Chile Yes Yes Yes
Australia, Hong Kong (
SAR China), India, Mal
aysia, P4 a Thailand, Vie
tnam
Yes
Colombia No Under negotiation Yes No No
Mexico No Yes No No Yes
Peru Yes Yes Yes Singapore, Thailand Yes
Pacific Alliance members have been very active in negotiating trade agreements with Asia Pacific
Pacific Alliance members: FTA network with Asia Pacific
(as of September 2019)
Source: Organization of American States, Foreign Trade Information System, www.sice.oas.org.a Trans-Pacific Strategic Economic Partnership Agreement. Its original members were Brunei Darussalam, Chile, New Zealand and Singapore.
An expanded to 11 members (Australia, Malaysia, Singapore, Vietnam, Canada, Mexico and Peru)

Methodology:
IO Table, a tool for
FEALAC value chain
analysis
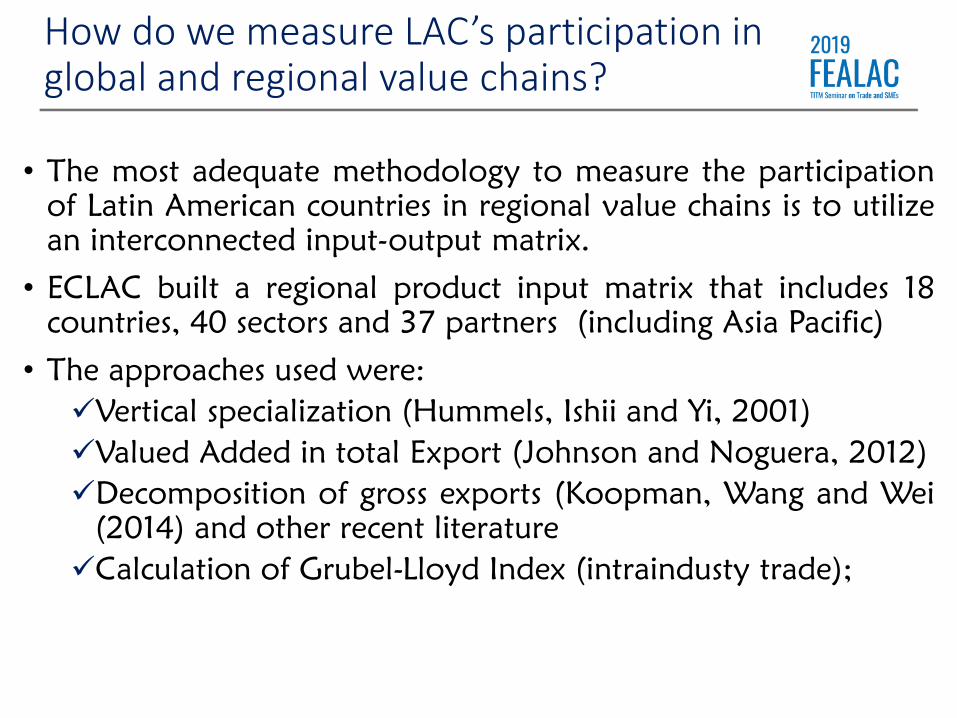
How do we measure LAC’s participation in global and regional value chains?
• The most adequate methodology to measure the participation
of Latin American countries in regional value chains is to utilize
an interconnected input-output matrix.
• ECLAC built a regional product input matrix that includes 18
countries, 40 sectors and 37 partners (including Asia Pacific)
• The approaches used were:
Vertical specialization (Hummels, Ishii and Yi, 2001)
Valued Added in total Export (Johnson and Noguera, 2012)
Decomposition of gross exports (Koopman, Wang and Wei
(2014) and other recent literature
Calculation of Grubel-Lloyd Index (intraindusty trade);
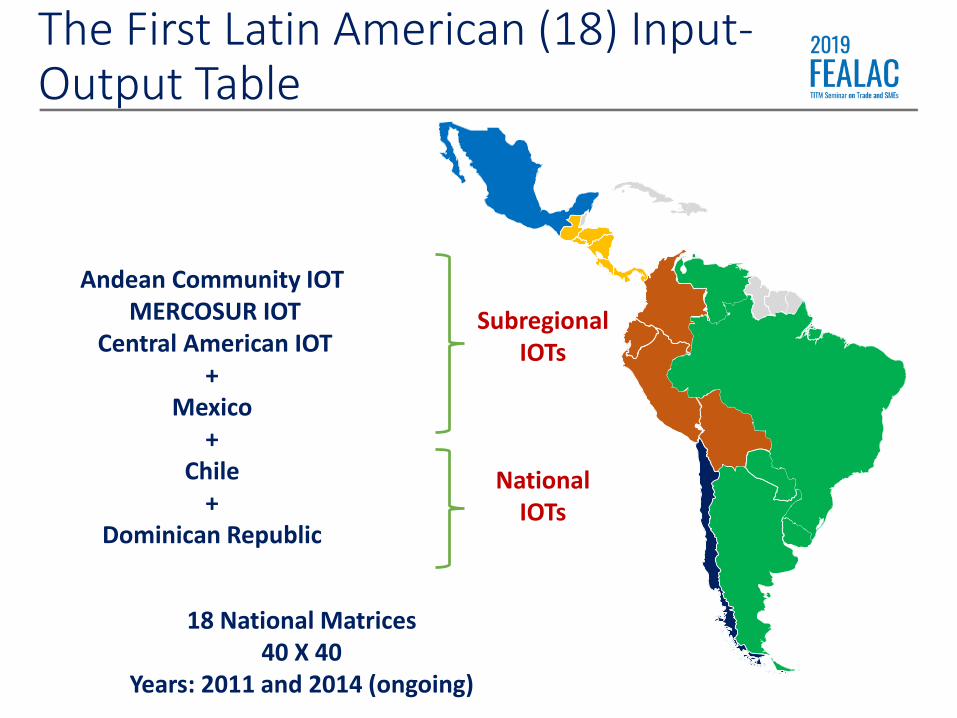
The First Latin American (18) Input-Output Table
Andean Community IOTMERCOSUR IOT
Central American IOT+
Mexico+
Chile+
Dominican Republic
SubregionalIOTs
National IOTs
18 National Matrices40 X 40
Years: 2011 and 2014 (ongoing)

Intermediate Use
(18 LAC countries)
Final Use
(18 LAC countries
Exports
(Asia Pacific and R of World)
Product
Gross
Value
LAC
Im
po
rts
Argentina40x40
40x
2 40x1 40x1
Brazil 40x40
Costa Rica
Dominican Repub
lic
Mexico
….
Uruguay
Venezuela
Asi
an a
nd
RO
W Im
po
rts
United States 40x40
Canada Q
European Union
(EU)
India
Australia
Brunei
Cambodia
Japan
…
R of World
Tax 1x40
Insurance and fr
eight
Value added
Product
16 FEALAC extra regional partners:Australia, Brunei, Cambodia, Japan, China, Thailand, Malaysia, Mongolia, New Zealand, Laos, Myanmar, Mongolia, Indonesia, Philippines, Singapore, Vietnam.
18 LAC countries
with 55 partners

• We have in ECLAC a IO Table with 18 LAC countries
• Covering interregional trade with 16 FEALAC Asia Pacific members
• Is free and available for governments, academics, policy makers, students, …..
• We will be a Global IOT Matrix as a result of FEALAC Project. Together with ESCAP and the Asian Development Bank.
• https://www.cepal.org/es/eventos/matrices-insumo-producto-como-herramienta-politicas-comerciales-industriales-america-latina

Results of FEALAC
Project on bi-regional VC
analysis

The average VA embodied in total LAC export is 73%, with Mexico having the lowest share, and Colombia and Venezuela the highest
78 71 76 7088
67 7957
66 6481 77 77 85 73
88
0
20
40
60
80
100
Latin American (16 countries): Domestic Valued Added content in Total Exports, 2011(VA/XT)*100
Source: ECLAC based on IO Table for Latin America (18).

South America is more connected to Asia Pacific than Central America and Mexico. 22% of the domestic value added incorporated in total exports goes to Asia Pacific
Latin American (16 countries): Domestic Valued Added content in Total Exports by origin, 2011
(VA/XT)*100 (in percentages)
Source: ECLAC based on IO Table for Latin America (18).
1910
28
44
7 3 5 2 2 112
27
2 29
015
2
22
34 4718
15
27 29 28
4
36
5540
17
17
4743
7
15 39
20
3527
38
45
19
22
26
0102030405060708090
100
Arg
enti
na
Bo
livia
,P.S
.
Bra
zil
Ch
ile
Co
lom
bia
Co
sta
Ric
a
Ecu
ado
r
Mex
ico
Nic
arag
ua
Pan
ama
Par
agu
ay
Per
u
Do
m. R
ep.
El S
alva
do
r
Uru
guay
Ven
ezu
ela,
R.B
.
LAC
's
Cen
tral
Am
eric
a
Sou
th A
mer
ican
Asia Latin American United States European Union Rest of the World

0
10000
20000
30000
40000
50000
60000
Andean Community CACM Chile MERCOSUR Mexico The Caribbean
Argentina17%
Bolivia, E.P.3%
Brazil30%
Chile8%
Colombia9%
Costa Rica2%
Ecuador4%
Mexico8%
Nicaragua1%
Panama2%
Paraguay2%
Peru5%
Dominican Republic
1%
El Salvador1%
Uruguay3%
Venezuela, R.B.4%
Source: ECLAC based on IO Table for Latin America (18).
Brazil, Argentina, Colombia, Mexico and Chile are the countries from the region with more VA embodied in total exports
Latin American (16 countries): Domestic Valued Added content in Total exports, 2011(share of total)
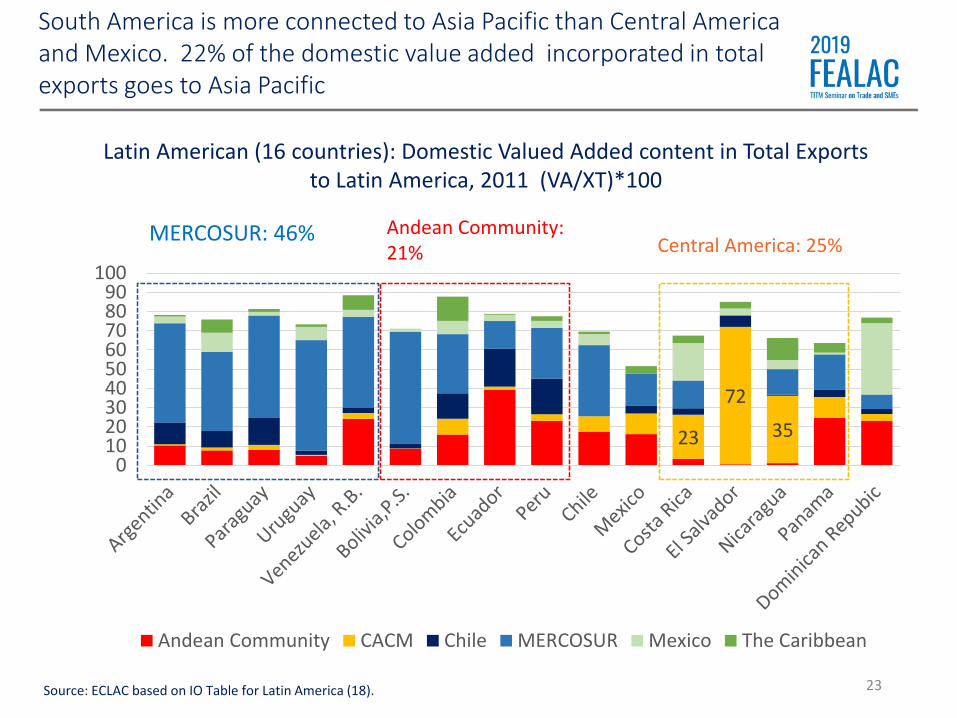
23
23
72
35
0102030405060708090
100
Andean Community CACM Chile MERCOSUR Mexico The Caribbean
MERCOSUR: 46% Andean Community: 21% Central America: 25%
Source: ECLAC based on IO Table for Latin America (18).
Latin American (16 countries): Domestic Valued Added content in Total Exports to Latin America, 2011 (VA/XT)*100
South America is more connected to Asia Pacific than Central America and Mexico. 22% of the domestic value added incorporated in total exports goes to Asia Pacific

Colombia with Ecuador and Peru
Central AmericaBrazil with Argentina
At a regional level, the main productive chains are between countries that are geographically close
Mexico with Central America
Inter-industrial tradePotentially intra-industrialIntra-industrial trade
Automotive industry;Metal mechanicsIron and steel industryMachinery and equipmentChemical and petrochemical
Agroindustry;Paper and paperboard;Wood and paperAutomotive industry;Mechanical metals;Chemical and petrochemical
Agroindustry;Paper and paperboard;Automotive industry;Mechanical metals;Chemical and petrochemical
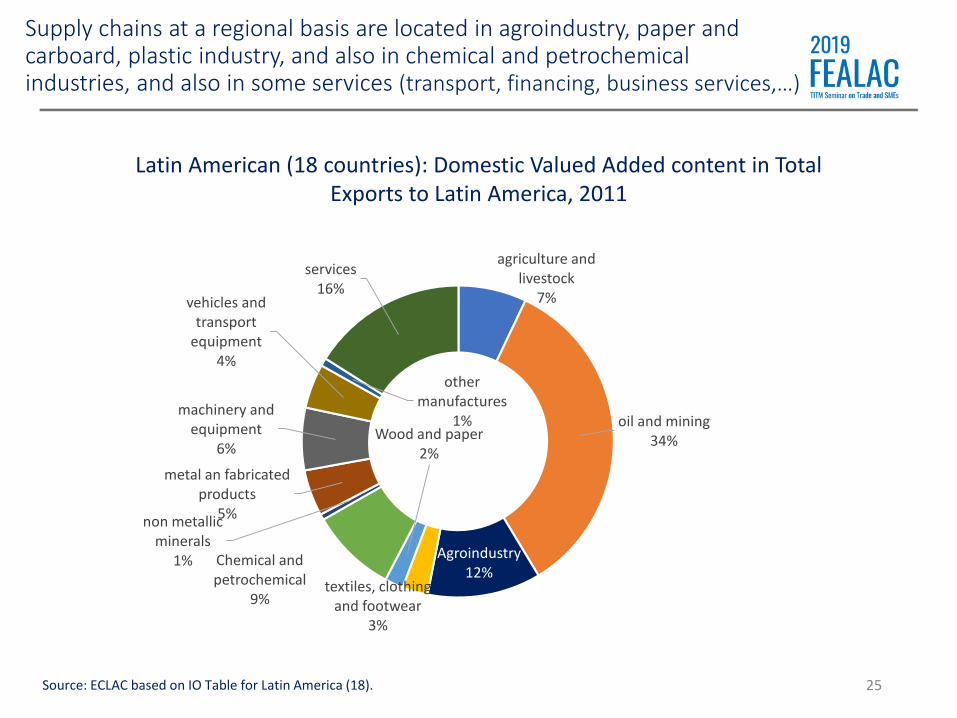
Supply chains at a regional basis are located in agroindustry, paper and carboard, plastic industry, and also in chemical and petrochemical industries, and also in some services (transport, financing, business services,…)
25
Latin American (18 countries): Domestic Valued Added content in Total Exports to Latin America, 2011
Source: ECLAC based on IO Table for Latin America (18).
agriculture and livestock
7%
oil and mining34%
Agroindustry12%
textiles, clothing and footwear
3%
Wood and paper2%
Chemical and petrochemical
9%
non metallic minerals
1%
metal an fabricated products
5%
machinery and equipment
6%
vehicles and transport
equipment4%
other manufactures
1%
services16%

United States, Asia and Latin American are the most important destines for regional Value Added
26
Latin American (18 countries): Domestic Valued Added content in Total Exports to Latin America, 2011
(Percentaje of total)
Source: ECLAC based on IO Table for Latin America (18).
Asia20%
Latin America20%
Rest of the World19%
European Union12%
United States29%

What are the sectors with more value added in VA embodied in intraregional export? Basically services and manufactures
Latin American (18 countries): Domestic Valued Added content in Total Exports to Latin America, distribution by big sectors, 2011
(Share in total)
Source: ECLAC based on IO Table for Latin America (18).

0102030405060708090
100
ASEAN China India Japan Korea Rest of Asia
In the case of the LAC Value Added, the main destination in Asia is China, with some important participation of Japan, ASEANcountries and Korea
28Source: ECLAC based on IO Table for Latin America (18).
Latin American (16 countries): Domestic Valued Added content in Total Exports to Asia Pacific, 2011 (VA/XT)*100

And the sector with more VA exported to Asia are primary products according the comparative advantage of LAC in that products
Latin American (18 countries): Domestic Valued Added content in Total Exports to Asia, distribution by big sectors, 2011
(Share in total)
Source: ECLAC based on IO Table for Latin America (18).
CooperIron mineralOilZincBauxitaAliminia
SoybeanFruits: apple, orange, kiwi, berries,…
Wine,Meal fish,Fresh fish,Tunas,…;Meats,Soya oil,..
Transports,Financing, Business services,…
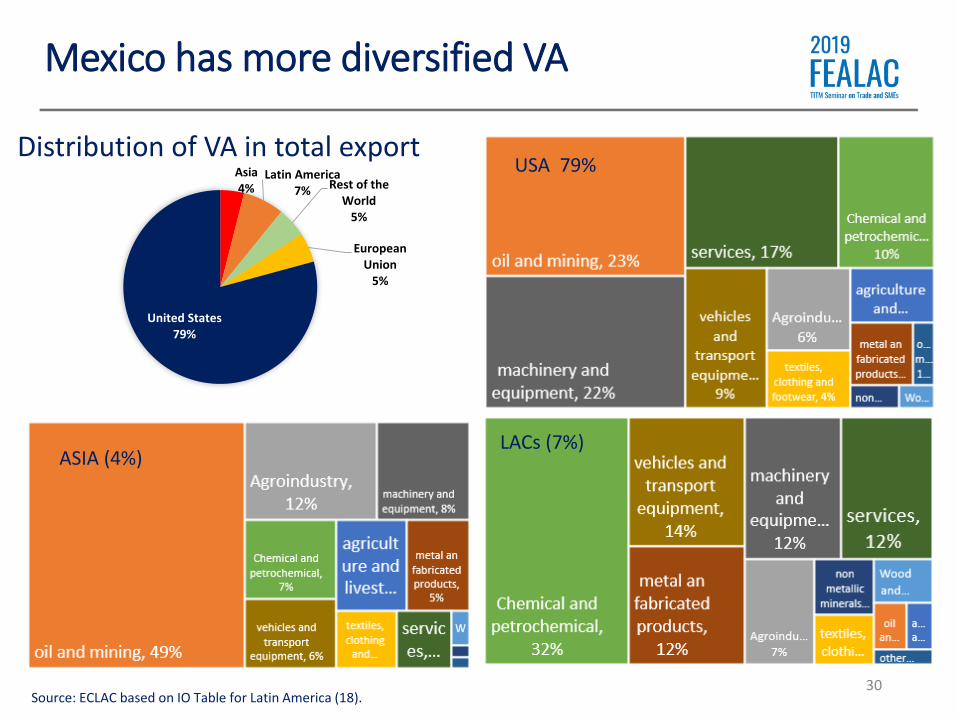
Mexico has more diversified VA
30
Asia4%
Latin America7% Rest of the
World5%
European Union
5%
United States79%
ASIA (4%)
USA 79%
LACs (7%)
Distribution of VA in total export
Source: ECLAC based on IO Table for Latin America (18).

Comparatively, Mexico, Honduras, Nicaragua and Costa Rica appear with greater vertical integration
Latin American (18 countries): Import requirement in total exports, 2011(II/XT)*100
Source: ECLAC based on IO Table for Latin America (18).
71010111111
1212
1417
182020
222222
2432
42
0 10 20 30 40 50
Colombia
Ecuador
Venezuela, R.B.
El Salvador
Panama
Argentina
Peru
Brazil
Paraguay
Chile
Bolivia,P.S.
Guatemala
Uruguay
Dominican Repubic
Costa Rica
LACs
Nicaragua
Honduras
Mexico
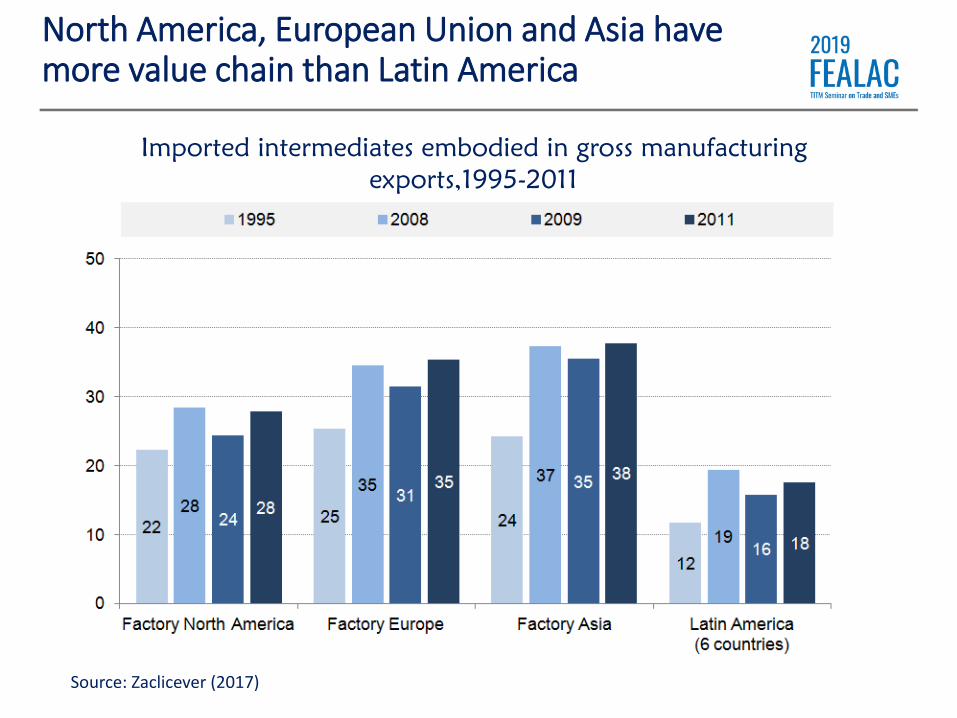
North America, European Union and Asia have more value chain than Latin America
Imported intermediates embodied in gross manufacturing
exports,1995-2011
Source: Zaclicever (2017)

United States38%
European Union12%
Mexico2%
Argentina2%
Chile1%
Brazil4%
Rest of LAC6%
China14%
Korea3%
ASEAN5%
Japan3%
Rest of Asia0%
Rest of the World10%
FEALAC Pacific Asia25%
Latin American and the Caribbean: Main origin of intermediate imports, 2017-2018
(Shares in total)
The main intermediate goods that the region imports from the world come from the United States (38%) and Asia (25%). 15% of the region itself.
Fuente: CEPAL, sobre la base de datos COMTRADE de Naciones Unidas
FEALAC Latin America15%
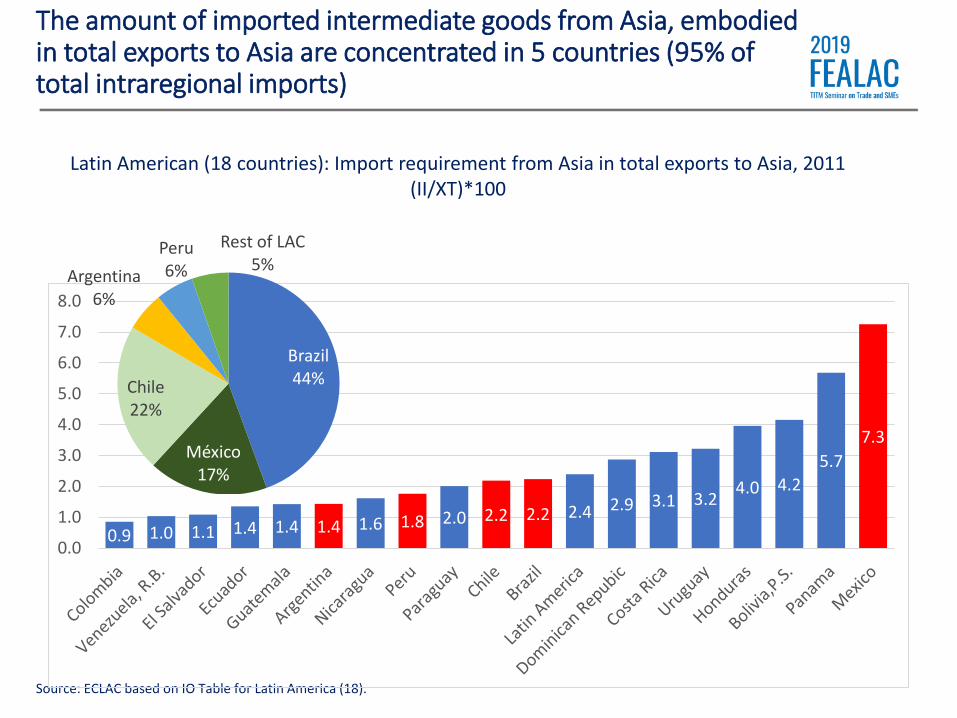
The amount of imported intermediate goods from Asia, embodied in total exports to Asia are concentrated in 5 countries (95% of total intraregional imports)
Latin American (18 countries): Import requirement from Asia in total exports to Asia, 2011(II/XT)*100
Source: ECLAC based on IO Table for Latin America (18).
0.9 1.0 1.1 1.4 1.4 1.4 1.6 1.8 2.0 2.2 2.2 2.4 2.9 3.1 3.24.0 4.2
5.7
7.3
0.0
1.0
2.0
3.0
4.0
5.0
6.0
7.0
8.0
Brazil44%
México17%
Chile22%
Argentina6%
Peru6%
Rest of LAC5%

What kind of intermediate inputs imports Latin America from Asia Pacific?
35
agriculture and livestock
0%
oil and mining6%
Agroindu…
textiles, clothing and
footwear2%
Wood and paper
1%
Chemical and petrochemical
25%
non metallic minerals
1%metal an fabricated products
8%
machinery and equipment
25%
vehicles and transport
equipment6%
services24%Parts and components,
Basic chemical,
Textiles,
Iron and steel, Intermediate
agroindustry Business
services, Transport, etc.
Source: ECLAC based on IO Table for Latin America (18).

Intraregional linkages are more stronger's in Latin America, especially in medium and small countries.
Latin American (16 countries): Import requirement from Latin America in total exports to Latin America, 2011(II/XT)*100
Source: ECLAC based on IO Table for Latin America (18).
2.0 2.1
2.1 3
.0 3.5 3.6 4
.3 5.0 5
.8 6.4 6.7 7.3 8
.5 9.6 9.8 10
.7
10
.7
11
.0
11
.2
0.0
2.0
4.0
6.0
8.0
10.0
12.0Brazil13%
Mexico4%
Chile17%
Argentina20%
Uruguay6%
Bolivia6%
Peru6%
Colombia4%
Ecuador4%
Paraguay4%
Central America
13%
Other LACs3%

What kind of intermediate inputs imports stand out in intraregional trade in Latin America?
37
Oil and mining
Rubber an plastic
Carton and paperboard
Basic chemical,
Textiles,
Iron and steel, Intermediate
agroindustry Business
services, Transport, etc.
Source: ECLAC based on IO Table for Latin America (18).
agriculture and livestock
4%
oil and mining25%
Agroindustry…
textiles, clothing and footwear
5%
Wood and paper
4%
Chemical and petrochemical
21%
non metallic minerals
2%
metal an fabricated products
11%
machinery and equipment
4%
vehicles and transport
equipment3%
services15%

United States18%
European Union19%
México2%Argentina
4%Chile2%
Rest of LAC6%
China16%
Korea4%
ASEAN5%
Japan3%
Rest of Asia1%
Rest of the World20%
BRAZIL MEXICO
BRAZIL AND MEXICO: DISTRIBUTION BY ORIGIN OF IMPORTS OF INDUSTRIAL
INTERMEDIATE GOODS, 2017-2018
(In percentages)
Source: ECLAC based on data from UN Comtrade.
29%
26%
Brazil and Mexico import more industrial intermediate goods from the rest of the world than the rest of LAC
United States53%
European Union10%Argentina
0%
Chile0%
Brazil2%
Rest of LAC1%
China13%
Korea4%
ASEAN5%
Japan4%
Rest of Asia0%
Rest of the World
8%

SMEs linkage with bi-
regional VC analysis

0.20.40.40.4
0.60.80.90.9
1.31.4
1.71.9
3.23.5
3.94.5
55.8
9.1
0 1 2 3 4 5 6 7 8 9 10
ParaguayEcuador
ColombiaBrazilPeru
MexicoChile
NicaraguaEl Salvador
ArgentinaUruguay
GuatemalaCosta Rica
Rep. KoreaSpain
USAFrance
BelgiumGermany
Selected countries: exporting firms as a share of all firms, circa 2013
Source: Roberto Urmeneta, “Dinámica de las empresas exportadoras en América Latina. El aporte de las pymes”, CEPAL, 2016, sobre la base de datos de aduana, censos económicos y registros tributarios o de seguridad social de cada país.
Chile: 0.8% (2015) México: 0.8% (2015)Perú : 0.44% (2015)Brazil: 0.40% (2015)
Colombia: 0.43% (2015)Ecuador: 0.50% (2015)Paraguay: 0.18% (2015
How LACs SMEs participate in value chains?, andwhat space have SMEs in the bi-regional trade
Very few SMEs participate in total exports
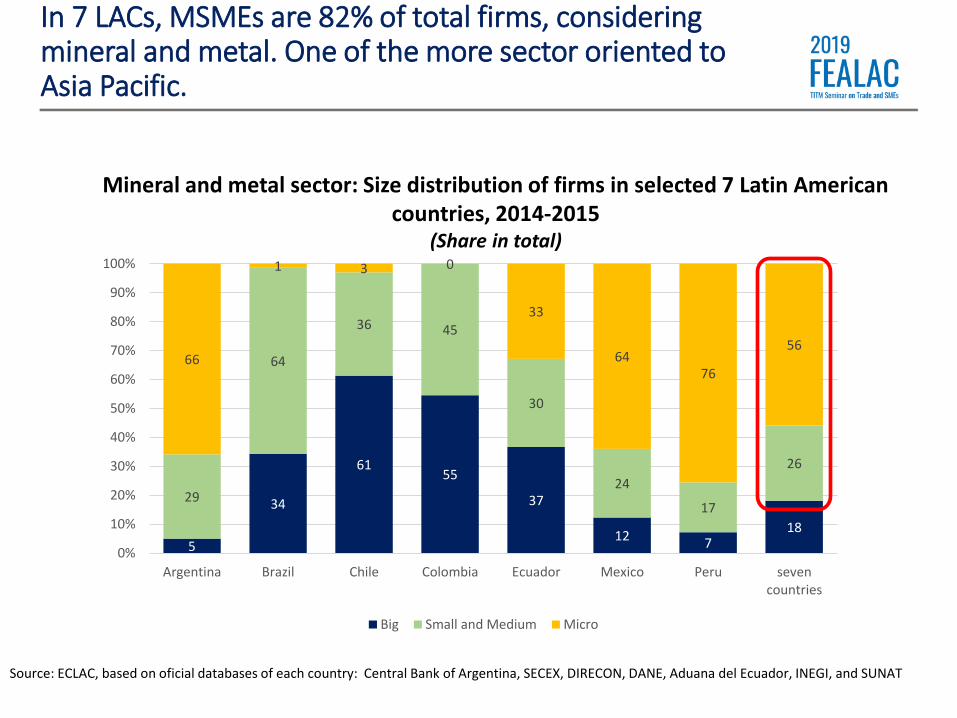
5
34
6155
37
12 718
29
64
36 45
30
24
17
26
66
1 3 0
33
6476
56
0%
10%
20%
30%
40%
50%
60%
70%
80%
90%
100%
Argentina Brazil Chile Colombia Ecuador Mexico Peru sevencountries
Big Small and Medium Micro
In 7 LACs, MSMEs are 82% of total firms, considering mineral and metal. One of the more sector oriented to Asia Pacific.
Mineral and metal sector: Size distribution of firms in selected 7 Latin American countries, 2014-2015
(Share in total)
Source: ECLAC, based on oficial databases of each country: Central Bank of Argentina, SECEX, DIRECON, DANE, Aduana del Ecuador, INEGI, and SUNAT
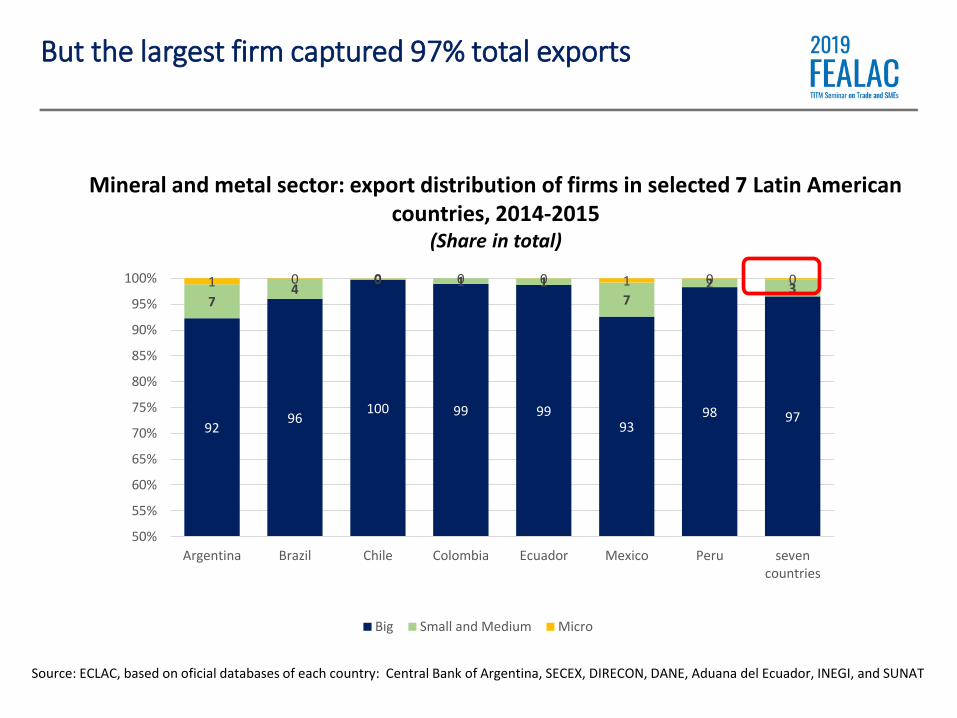
But the largest firm captured 97% total exports
Mineral and metal sector: export distribution of firms in selected 7 Latin American countries, 2014-2015
(Share in total)
Source: ECLAC, based on oficial databases of each country: Central Bank of Argentina, SECEX, DIRECON, DANE, Aduana del Ecuador, INEGI, and SUNAT
9296
100 99 9993
98 97
74
0 1 17
2 31 0 0 0 0 1 0 0
50%
55%
60%
65%
70%
75%
80%
85%
90%
95%
100%
Argentina Brazil Chile Colombia Ecuador Mexico Peru sevencountries
Big Small and Medium Micro
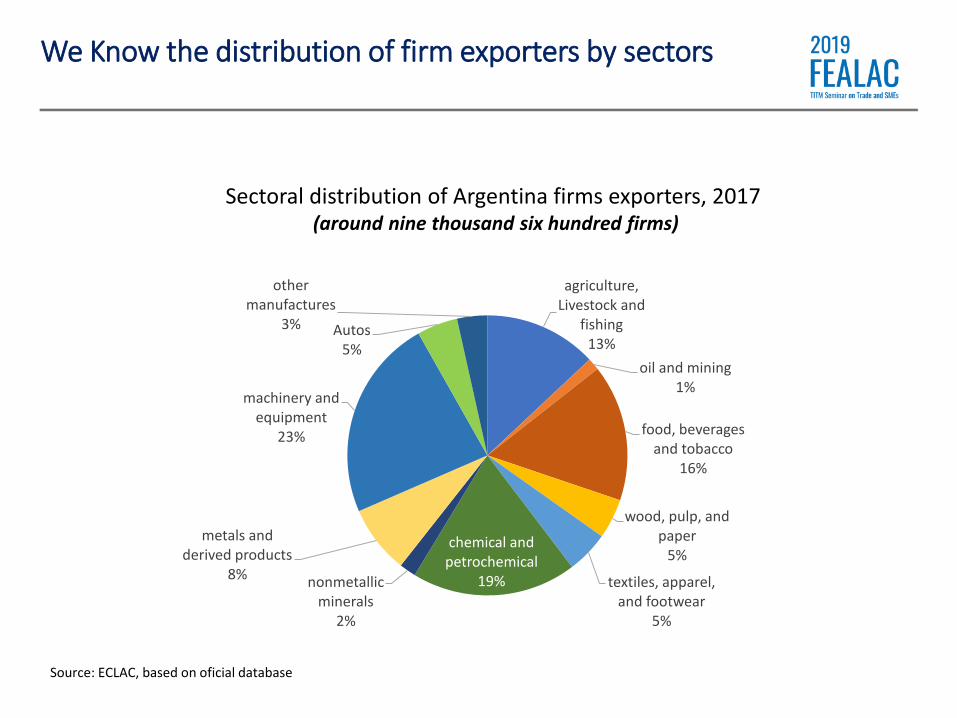
Sectoral distribution of Argentina firms exporters, 2017(around nine thousand six hundred firms)
Source: ECLAC, based on oficial database
We Know the distribution of firm exporters by sectors
agriculture, Livestock and
fishing13%
oil and mining1%
food, beverages and tobacco
16%
wood, pulp, and paper
5%
textiles, apparel, and footwear
5%
chemical and petrochemical
19%nonmetallic minerals
2%
metals and derived products
8%
machinery and equipment
23%
Autos5%
other manufactures
3%

FEALAC Asian countries Total firms SMEs Share in total (%)
China 693 345 49.8
Singapur 470 299 63.6
Hong Kong, SAR Japan 349 201 57.6
Japan 287 145 50.5
Malaysia 255 150 58.8
Republic of Korea 228 129 56.6
India 217 125 57.6
Australia 217 115 53.0
Thailand 211 112 53.1
Vietnam 203 115 56.7
Indonesia 126 66 52.4
Phillipines 98 62 63.3
New Zealand 98 51 52.0
Myanmar 22 19 86.4
cambodia 11 6 54.5
Mongolia 7 6 85.7
Brunei 5 2 40.0
Laos 4 3 75.0
FEALAC Asian countries (mean) 195 108 55.7
FEALAC Asian countries (median) 207 114 56.6
And also by partners. This is the case for Argentine firms that exports to FELAC Asian member countries
Source: ECLAC, based on oficial database
Argentina: number of firms exporters to FEALAC Asia, 2017

FEALAC LAC countries Total firms SMEs Share in total
Uruguay 4228 1216 28.8
Chile 3848 1454 37.8
Brazil 3445 1543 44.8
Paraguay 2560 828 32.3
Bolivia 1910 713 37.3
Colombia 1207 598 49.5
Perú 1172 463 39.5
Mexico 1008 480 47.6
Ecuador 573 261 45.5
Panama 515 257 49.9
Costa Rica 328 172 52.4
Dominican Republic 287 151 52.6
Guatemala 264 138 52.3
Venezuela 198 101 51.0
Nicaragua 132 55 41.7
Honduras 123 65 52.8
El Salvador 104 60 57.7
Argentina 53 19 35.8
FEALAC LAC countries (mean) 1220 476 39.1
FEALAC LAC countries (median) 544 259 46.6
An Argentine firms that exports to FELAC LAC member countries: four times more SMEs than Asia Pacific
Argentina, number of firms exporters to FEALAC LAC countries, 2017
Source: ECLAC, based on oficial database

29
27
25
24
22
20
20
19
18
16
14
14
14
11
0 5 10 15 20 25 30 35
Difficulties of access to credit
Quality certifications difficult to meet
Increase of price inputs incorporated in exports
Insufficient export promotion
High insurance prices
Logistical difficulties in local customs
High international transport prices
High transport costs between business and customs
Import Licenses
Sanitary and Phytosanitary Barriers
Lack of technical capacity to export
Delays in land transport
Difficulties in customs clearance at destination
Merchandise Inspections
Equivalent Ad Valorem
Adverse market conditions
Logistic insufficiency
Bureaucracy
Sanitarity and technical requirement
Lack of export promotion
Bottlenecks and equivalent tariff for exporter firms in Andean countries. SMEs are more affected
Source: Durán, Cracau and Saeteros (2018), Integración productiva en la Comunidad Andina: cadenas de valor entre Colombia y el Ecuador. Documento de Proyecto. En línea en: https://www.cepal.org/fr/node/45914

Some reflexions to
conclude

Evidence of Value Chains in Latin America and the Caribbean
• Mexico and Central America are more integrated in regional value chains that are strongly linked to the North American Factory, centered mostly around the large market of the United States
– United States is the country that leads
– The main chains: Automotive and auto parts, electronics, aeronautics, clothing, among others
• In South America, the presence of countries in integrated production chains is more limited and refers to relationships between few countries: Argentina –Brazil, Colombia – Ecuador – Peru, Brazil – Uruguay
– The main chains: Automotive and auto parts, electronic, aeronautics, and clothing, among others.
– Brazil does not play the role in the region that the United States plays in North America.
• In Central America , GVCs are centered around all countries and to a lesser extent on Nicaragua
• The main chains: chemical and petrochemical, steel and metal industry, pharmaceutical industry
– A second group of light industries: agro industry, textiles, paper and cardboard

• Inter-industry trade: Commodities for manufactures
• LAC and almost all LAC countries have a trade deficit with Asia
• Strongly concentrated:
• By country: Argentina, Brazil, Chile, Mexico and Peru account for 80% of LAC exports; China accounts for more than 50% of Asian exports
• By product: soybeans, iron and copper ore and petroleum account for more than half of LAC total exports
• By type of companies: SMEs 47% of total firms, but only 3% of total exports. Big exporters capture 97% of total.
• Asian exports are much more diversified:
• Telecommunication, vehicles, computers, steel, electronics, transport equipment, footwear, toys, kitchenware, tires, etc.
Main features of Asia-LAC trade

How to promote Value Chains and Productive Integration among both regions?
Promote public-private dialogue (such as this forum)
Plurinational Industrial Policies Clusters in sectors with the most intra-industrial potential
Regulatory convergence
Joint programs to promote SMEs
Training
Quality certifications
Traceability and carbon footprint
Address deficits in infrastructure
Coordinated progress in trade facilitation Single window, digitalization of documents
Incorporate SMEs in the effort
Support from the regional development banks
Conclusions
• At the regional level, there is a need for leadership to createproduction networks
Brazil and Mexico could take the lead
Public policies should take into consideration productive chains
• The large countries of Latin America should imitatethe steps taken by Japan to promote productiveintegration in Asia Pacific

José Durán LimaChief of the Regional Integration Unit,
Division of International Trade and Integration,
ECLAC, United Nations
Productive Integration
between Latin America
and Asia Pacific: How to integrate into value chains.
The role of SMEs
Korea, 18 September 2019