PRODUCTION & UTILIZATION ANALYSIS · PDF fileThe Production and Utilization Analysis for the...
44
SPONSORED BY 2014 PRODUCTION & UTILIZATION ANALYSIS
Transcript of PRODUCTION & UTILIZATION ANALYSIS · PDF fileThe Production and Utilization Analysis for the...
SPONSORED BY
2014PRODUCTION &
UTILIZATION ANALYSIS

Table of Contents
Introduction . . . . . . . . . . . . . . . . . . . . . . . . . . . . . . . . . . . . . . . . . . . . . . . . 3
2013 Crop: U .S . Production and Utilization Summary . . . . . . . . . . . . . . . . . 4• U.S. Apple Production: Volume and Value . . . . . . . . . . . . . . . . . . . . . . . . . . . . . . . . . . . . . . . . . .4
• U.S. Utilization . . . . . . . . . . . . . . . . . . . . . . . . . . . . . . . . . . . . . . . . . . . . . . . . . . . . . . . . . . . . . .6
• U.S. Crop Movement . . . . . . . . . . . . . . . . . . . . . . . . . . . . . . . . . . . . . . . . . . . . . . . . . . . . . . . . .9
• U.S. Exports and Imports . . . . . . . . . . . . . . . . . . . . . . . . . . . . . . . . . . . . . . . . . . . . . . . . . . . . . .9
2014 Crop: U .S . Production Forecast . . . . . . . . . . . . . . . . . . . . . . . . . . . . 11
2014 Crop: U .S . Varietal Analysis . . . . . . . . . . . . . . . . . . . . . . . . . . . . . . . 14• 2014 Varietal Estimates . . . . . . . . . . . . . . . . . . . . . . . . . . . . . . . . . . . . . . . . . . . . . . . . . . . . . .14
2014 Crop: U .S . Utilization and Movement Forecasts . . . . . . . . . . . . . . . . 20• Processing vs. Fresh Market Utilization Forecasts . . . . . . . . . . . . . . . . . . . . . . . . . . . . . . . . . . .23
• 2014 Crop Movement Forecast . . . . . . . . . . . . . . . . . . . . . . . . . . . . . . . . . . . . . . . . . . . . . . . . .23
International Market Outlook . . . . . . . . . . . . . . . . . . . . . . . . . . . . . . . . . . . 26• 2013 U.S. Trade Recap . . . . . . . . . . . . . . . . . . . . . . . . . . . . . . . . . . . . . . . . . . . . . . . . . . . . . .26
• 2014 U.S. Trade Outlook . . . . . . . . . . . . . . . . . . . . . . . . . . . . . . . . . . . . . . . . . . . . . . . . . . . . .27
• European Crop Outlook . . . . . . . . . . . . . . . . . . . . . . . . . . . . . . . . . . . . . . . . . . . . . . . . . . . . . . .29
• Canadian Crop Outlook . . . . . . . . . . . . . . . . . . . . . . . . . . . . . . . . . . . . . . . . . . . . . . . . . . . . . . .32
• U.S. Apple Imports and Exports . . . . . . . . . . . . . . . . . . . . . . . . . . . . . . . . . . . . . . . . . . . . . . . .34
Appendix A: Apple Juice Concentrate Prices . . . . . . . . . . . . . . . . . . . . . . . 36
© 2014. The Production and Utilization Analysis for the 2014 U.S. Apple Association Apple Crop Outlook and Marketing Conference is published by the U.S. Apple Association (USApple). Reproduction in whole or in part of the material contained herein is prohibited without prior permission from USApple. For more information, contact USApple at 8233 Old Courthouse Road, Suite 200, Vienna, Virginia 22182-3816, telephone 703-442-8850 or 800-781-4443, facsimile 703-790-0845, web site www.usapple.org.
2 U.S. Apple Association
Tables and FiguresTable 1: Historical U.S. Apple Annual Production and Five-Year Averages . . . . . . . . . . . . . . . . . . . . . . . . 5
Table 2: Season-Average Apple Prices Received by U.S. Growers . . . . . . . . . . . . . . . . . . . . . . . . . . . . . . 6
Table 3: Trends in Average Apple Prices Received by U.S. Growers . . . . . . . . . . . . . . . . . . . . . . . . . . . . . 7
Table 4: U.S. Per-Capita Utilization of Apples and Apple Products . . . . . . . . . . . . . . . . . . . . . . . . . . . . . . 9
Table 5: Comparison of Forecasted 2014 U.S. Apple Crop with 2013 and Five-Year Average . . . . . . . . . 12
Table 6: U.S. Apple Production, By Region . . . . . . . . . . . . . . . . . . . . . . . . . . . . . . . . . . . . . . . . . . . . . . 12
Table 7: U.S. Apple Production, By State . . . . . . . . . . . . . . . . . . . . . . . . . . . . . . . . . . . . . . . . . . . . . . . 13
Table 8: Total U.S. Apple Production, By Variety . . . . . . . . . . . . . . . . . . . . . . . . . . . . . . . . . . . . . . . . . . 15
Table 9: U.S. Apple Production, By Variety, Region . . . . . . . . . . . . . . . . . . . . . . . . . . . . . . . . . . . . . . . . 16
Table 10: U.S. Crop Distribution, By Variety Grouping, Region . . . . . . . . . . . . . . . . . . . . . . . . . . . . . . . . . 17
Table 11: U.S. Apple Juice Imports . . . . . . . . . . . . . . . . . . . . . . . . . . . . . . . . . . . . . . . . . . . . . . . . . . . . 20
Table 12: Utilization Summary, By U.S. Production Region . . . . . . . . . . . . . . . . . . . . . . . . . . . . . . . . . . . 22
Table 13: U.S. Processing-Apple Utilization: Volume . . . . . . . . . . . . . . . . . . . . . . . . . . . . . . . . . . . . . . . . 23
Table 14: U.S. Processing-Apple Utilization: Value . . . . . . . . . . . . . . . . . . . . . . . . . . . . . . . . . . . . . . . . . 24
Table 15: U.S. Apple Utilization Summary. . . . . . . . . . . . . . . . . . . . . . . . . . . . . . . . . . . . . . . . . . . . . . . . 24
Table 16: U.S. Utilization, Movement and Storage Holdings . . . . . . . . . . . . . . . . . . . . . . . . . . . . . . . . . . 25
Table 17: U.S. Apple Balance of Trade . . . . . . . . . . . . . . . . . . . . . . . . . . . . . . . . . . . . . . . . . . . . . . . . . . 26
Table 18: Top 20 U.S. Apple Export Markets . . . . . . . . . . . . . . . . . . . . . . . . . . . . . . . . . . . . . . . . . . . . . . 27
Table 19: Apple Imports by Country and Year . . . . . . . . . . . . . . . . . . . . . . . . . . . . . . . . . . . . . . . . . . . . . 29
Table 20: European Union Apple Production, By Country . . . . . . . . . . . . . . . . . . . . . . . . . . . . . . . . . . . . 30
Table 21: European Union Apple Production, By Variety . . . . . . . . . . . . . . . . . . . . . . . . . . . . . . . . . . . . . 31
Table 22: Other European and Perimeter Countries, By Country . . . . . . . . . . . . . . . . . . . . . . . . . . . . . . . 32
Table 23: Canadian Apple Production, By Province. . . . . . . . . . . . . . . . . . . . . . . . . . . . . . . . . . . . . . . . . 32
Table 24: Canadian Apple Production, By Variety . . . . . . . . . . . . . . . . . . . . . . . . . . . . . . . . . . . . . . . . . . 33
Table 25: USDA Purchases of Apples and Apple Products . . . . . . . . . . . . . . . . . . . . . . . . . . . . . . . . . . . 35
Figure 1: U.S. Apple Production (line graph) . . . . . . . . . . . . . . . . . . . . . . . . . . . . . . . . . . . . . . . . . . . . . . 8
Figure 2: U.S. Apple Production (bar graph) . . . . . . . . . . . . . . . . . . . . . . . . . . . . . . . . . . . . . . . . . . . . . . 8
Figure 3: Utilization of 2013 U.S. Apple Crop . . . . . . . . . . . . . . . . . . . . . . . . . . . . . . . . . . . . . . . . . . . . . 10
Figure 4: Trends in U.S. Production for Red Delicious and Golden Delicious . . . . . . . . . . . . . . . . . . . . . . 14
Figure 5: Trends in Production for Other Top U.S. Varieties . . . . . . . . . . . . . . . . . . . . . . . . . . . . . . . . . . . 18
Figure 6: Western U.S. Fuji Production . . . . . . . . . . . . . . . . . . . . . . . . . . . . . . . . . . . . . . . . . . . . . . . . . 19
Figure 7: U.S. Gala Production . . . . . . . . . . . . . . . . . . . . . . . . . . . . . . . . . . . . . . . . . . . . . . . . . . . . . . . 19
Figure 8: U.S. Crop Utilization . . . . . . . . . . . . . . . . . . . . . . . . . . . . . . . . . . . . . . . . . . . . . . . . . . . . . . . . 21
Figure 9: U.S. Apple Exports . . . . . . . . . . . . . . . . . . . . . . . . . . . . . . . . . . . . . . . . . . . . . . . . . . . . . . . . . 28
Figure 10: U.S. Apple Exports, by Month for Various Crop Years . . . . . . . . . . . . . . . . . . . . . . . . . . . . . . . . 28
Figure 11: U.S. Apple Imports, by Year . . . . . . . . . . . . . . . . . . . . . . . . . . . . . . . . . . . . . . . . . . . . . . . . . . 28
Figure 12: U.S. Apple Imports, by Month for Various Crop Years . . . . . . . . . . . . . . . . . . . . . . . . . . . . . . . 29
Figure 13: U.S. Fresh Apple Exports as Percent of U.S. Fresh Production. . . . . . . . . . . . . . . . . . . . . . . . . 34
Figure 14: U.S. Fresh Apple Imports as Percent of U.S. Fresh Production . . . . . . . . . . . . . . . . . . . . . . . . 34
Appendix A: Monthly Apple Juice Concentrate Prices (Table) . . . . . . . . . . . . . . . . . . . . . . . . . . . . . . . . . . . 36
Monthly Apple Juice Concentrate Prices (Graph) . . . . . . . . . . . . . . . . . . . . . . . . . . . . . . . . . . . 40

2014 Production & Utilization Analysis 3
IntroductionThe 2014 edition of the U.S. Apple Association (USApple) Production and Utilization Analysis provides an over-view of the production and utilization of U.S. apple crops for recent years and forecasts for the 2014 crop marketing season. The source for much of the production information, including the 2014 forecast, is the U.S. Department of Agriculture (USDA). Varietal data and related commentary have been prepared by USApple. Data on the European crop is provided courtesy of the World Apple and Pear Association (WAPA) from Prognosfruit, the European counterpart to USApple’s Crop Outlook and Marketing Conference. The utiliza-tion information contained in this book is a mixture of USDA-published data and USApple forecasts, based on reports from apple processors and other reporting organizations.
USApple is grateful to all who contributed information for this report, including USDA, the World Apple and Pear Association, the Canadian Horticultural Council, the Ontario Ministry of Agriculture and Rural Affairs, the Federation des Producteurs de Pommes du Quebec, the New Brunswick Apple Marketing Board, the Nova Scotia Fruit Growers Association, The Food Institute and Agrarmarkt Informations-GmbH. USApple would also like to express our gratitude to Agnes Perez, USDA Economic Research Service (ERS), for her assistance in gathering and analyzing data on processed apple products, as well as to Katy Looft, Agricultural Economist with USDA’s Agricultural Marketing Service (AMS) Fruit and Vegetable Division for her work on the Apple Compendium.
Finally, USApple would like to thank Bayer CropScience for their continued support of this important industry publication.
4 U.S. Apple Association
2013 Crop: U.S. Production and Utilization Summary
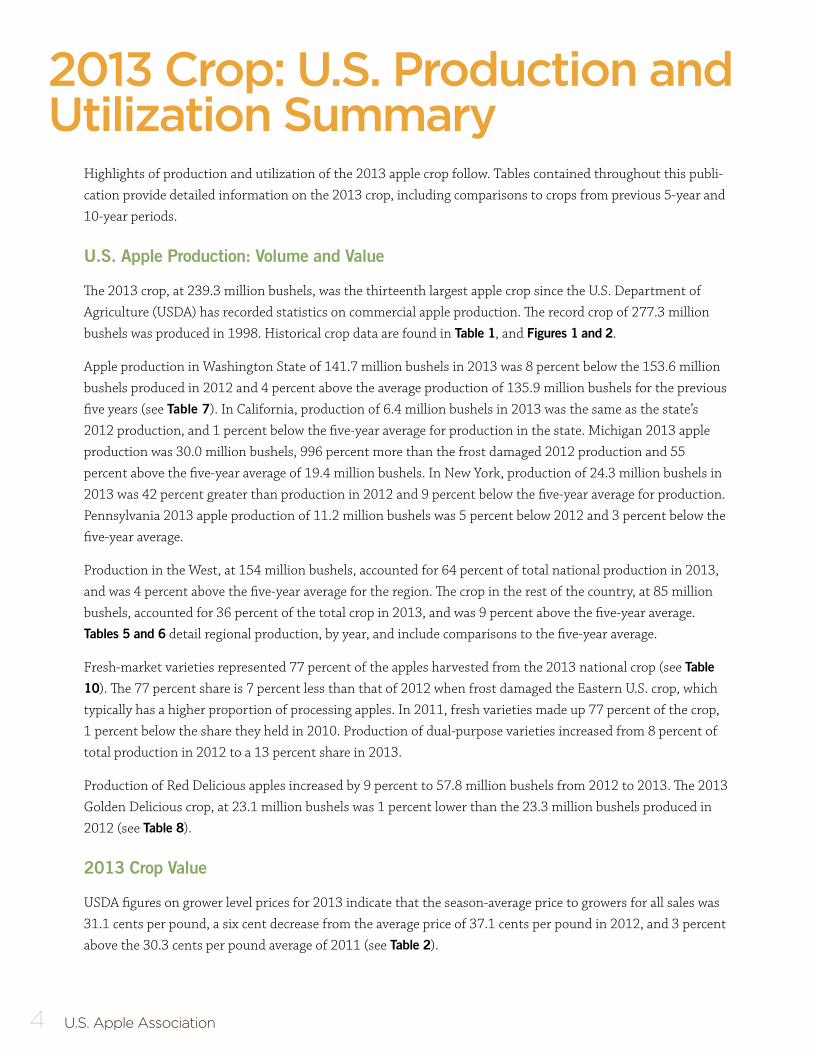
Highlights of production and utilization of the 2013 apple crop follow. Tables contained throughout this publi-cation provide detailed information on the 2013 crop, including comparisons to crops from previous 5-year and 10-year periods.
U .S . Apple Production: Volume and Value
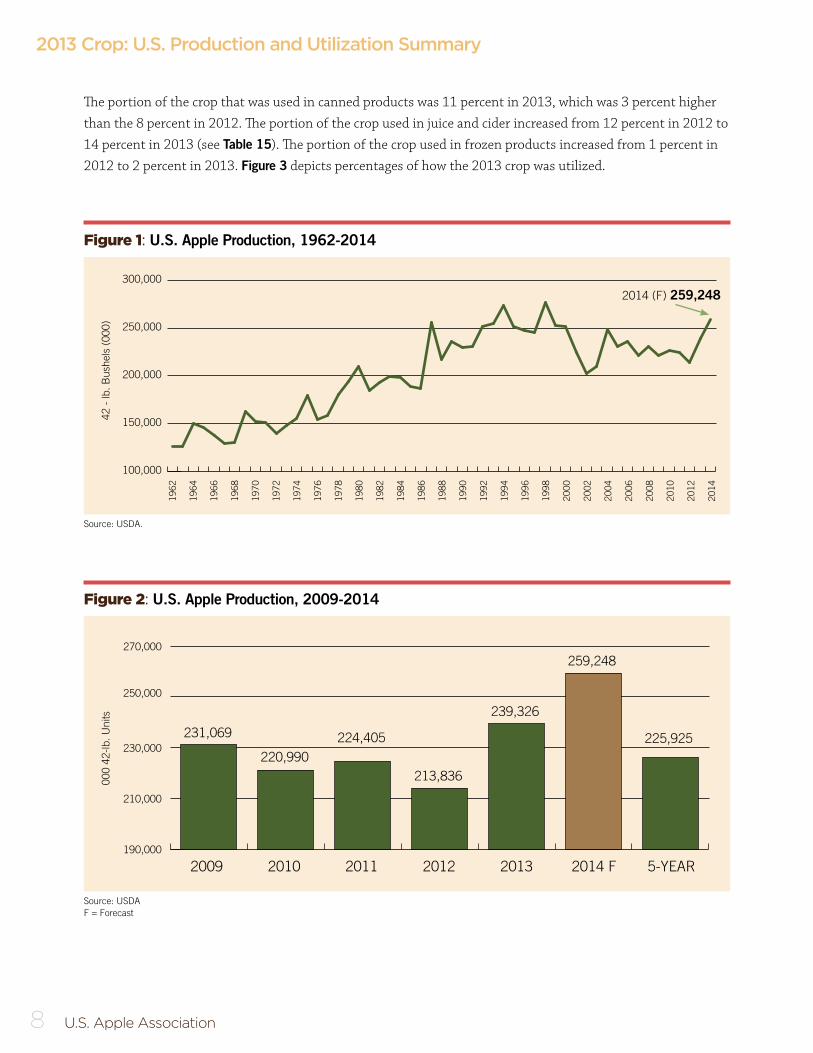
The 2013 crop, at 239.3 million bushels, was the thirteenth largest apple crop since the U.S. Department of Agriculture (USDA) has recorded statistics on commercial apple production. The record crop of 277.3 million bushels was produced in 1998. Historical crop data are found in Table 1, and Figures 1 and 2.
Apple production in Washington State of 141.7 million bushels in 2013 was 8 percent below the 153.6 million bushels produced in 2012 and 4 percent above the average production of 135.9 million bushels for the previous five years (see Table 7). In California, production of 6.4 million bushels in 2013 was the same as the state’s 2012 production, and 1 percent below the five-year average for production in the state. Michigan 2013 apple production was 30.0 million bushels, 996 percent more than the frost damaged 2012 production and 55 percent above the five-year average of 19.4 million bushels. In New York, production of 24.3 million bushels in 2013 was 42 percent greater than production in 2012 and 9 percent below the five-year average for production. Pennsylvania 2013 apple production of 11.2 million bushels was 5 percent below 2012 and 3 percent below the five-year average.
Production in the West, at 154 million bushels, accounted for 64 percent of total national production in 2013, and was 4 percent above the five-year average for the region. The crop in the rest of the country, at 85 million bushels, accounted for 36 percent of the total crop in 2013, and was 9 percent above the five-year average. Tables 5 and 6 detail regional production, by year, and include comparisons to the five-year average.
Fresh-market varieties represented 77 percent of the apples harvested from the 2013 national crop (see Table
10). The 77 percent share is 7 percent less than that of 2012 when frost damaged the Eastern U.S. crop, which typically has a higher proportion of processing apples. In 2011, fresh varieties made up 77 percent of the crop, 1 percent below the share they held in 2010. Production of dual-purpose varieties increased from 8 percent of total production in 2012 to a 13 percent share in 2013.
Production of Red Delicious apples increased by 9 percent to 57.8 million bushels from 2012 to 2013. The 2013 Golden Delicious crop, at 23.1 million bushels was 1 percent lower than the 23.3 million bushels produced in 2012 (see Table 8).
2013 Crop Value
USDA figures on grower level prices for 2013 indicate that the season-average price to growers for all sales was 31.1 cents per pound, a six cent decrease from the average price of 37.1 cents per pound in 2012, and 3 percent above the 30.3 cents per pound average of 2011 (see Table 2).
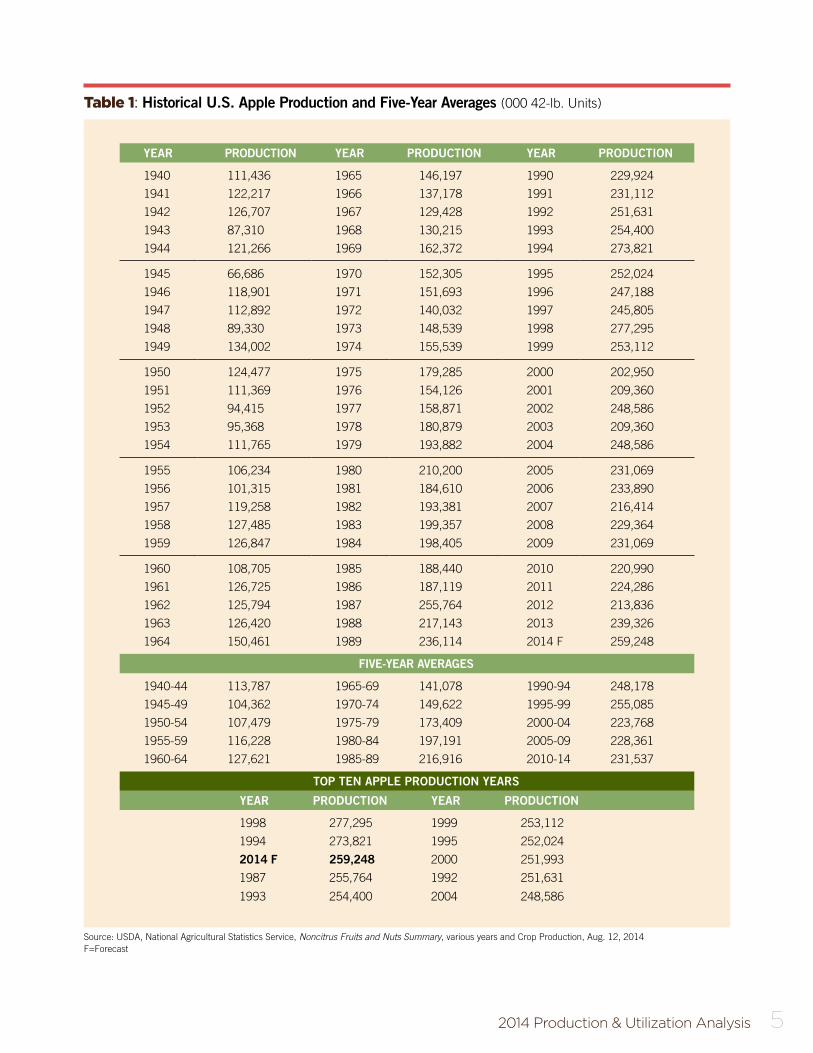
2014 Production & Utilization Analysis 5
Table 1: Historical U .S . Apple Production and Five-Year Averages (000 42-lb. Units)
YEAR PRODUCTION YEAR PRODUCTION YEAR PRODUCTION
1940 111,436 1965 146,197 1990 229,924
1941 122,217 1966 137,178 1991 231,112
1942 126,707 1967 129,428 1992 251,631
1943 87,310 1968 130,215 1993 254,400
1944 121,266 1969 162,372 1994 273,821
1945 66,686 1970 152,305 1995 252,024
1946 118,901 1971 151,693 1996 247,188
1947 112,892 1972 140,032 1997 245,805
1948 89,330 1973 148,539 1998 277,295
1949 134,002 1974 155,539 1999 253,112
1950 124,477 1975 179,285 2000 202,950
1951 111,369 1976 154,126 2001 209,360
1952 94,415 1977 158,871 2002 248,586
1953 95,368 1978 180,879 2003 209,360
1954 111,765 1979 193,882 2004 248,586
1955 106,234 1980 210,200 2005 231,069
1956 101,315 1981 184,610 2006 233,890
1957 119,258 1982 193,381 2007 216,414
1958 127,485 1983 199,357 2008 229,364
1959 126,847 1984 198,405 2009 231,069
1960 108,705 1985 188,440 2010 220,990
1961 126,725 1986 187,119 2011 224,286
1962 125,794 1987 255,764 2012 213,836
1963 126,420 1988 217,143 2013 239,326
1964 150,461 1989 236,114 2014 F 259,248
FIVE-YEAR AVERAGES
1940-44 113,787 1965-69 141,078 1990-94 248,178
1945-49 104,362 1970-74 149,622 1995-99 255,085
1950-54 107,479 1975-79 173,409 2000-04 223,768
1955-59 116,228 1980-84 197,191 2005-09 228,361
1960-64 127,621 1985-89 216,916 2010-14 231,537
TOP TEN APPLE PRODUCTION YEARS
YEAR PRODUCTION YEAR PRODUCTION
1998 277,295 1999 253,112
1994 273,821 1995 252,024
2014 F 259,248 2000 251,993
1987 255,764 1992 251,631
1993 254,400 2004 248,586
Source: USDA, National Agricultural Statistics Service, Noncitrus Fruits and Nuts Summary, various years and Crop Production, Aug. 12, 2014F=Forecast
6 U.S. Apple Association
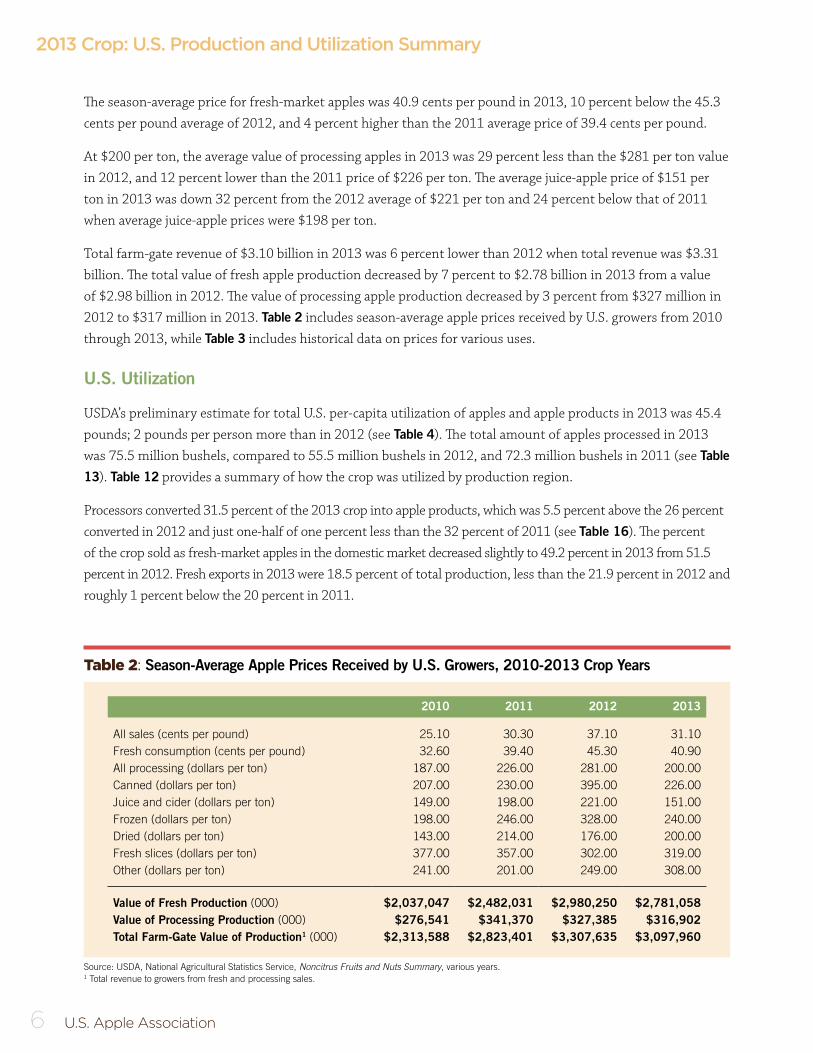
The season-average price for fresh-market apples was 40.9 cents per pound in 2013, 10 percent below the 45.3 cents per pound average of 2012, and 4 percent higher than the 2011 average price of 39.4 cents per pound.
At $200 per ton, the average value of processing apples in 2013 was 29 percent less than the $281 per ton value in 2012, and 12 percent lower than the 2011 price of $226 per ton. The average juice-apple price of $151 per ton in 2013 was down 32 percent from the 2012 average of $221 per ton and 24 percent below that of 2011 when average juice-apple prices were $198 per ton.
Total farm-gate revenue of $3.10 billion in 2013 was 6 percent lower than 2012 when total revenue was $3.31 billion. The total value of fresh apple production decreased by 7 percent to $2.78 billion in 2013 from a value of $2.98 billion in 2012. The value of processing apple production decreased by 3 percent from $327 million in 2012 to $317 million in 2013. Table 2 includes season-average apple prices received by U.S. growers from 2010 through 2013, while Table 3 includes historical data on prices for various uses.
U .S . Utilization
USDA’s preliminary estimate for total U.S. per-capita utilization of apples and apple products in 2013 was 45.4 pounds; 2 pounds per person more than in 2012 (see Table 4). The total amount of apples processed in 2013 was 75.5 million bushels, compared to 55.5 million bushels in 2012, and 72.3 million bushels in 2011 (see Table
13). Table 12 provides a summary of how the crop was utilized by production region.
Processors converted 31.5 percent of the 2013 crop into apple products, which was 5.5 percent above the 26 percent converted in 2012 and just one-half of one percent less than the 32 percent of 2011 (see Table 16). The percent of the crop sold as fresh-market apples in the domestic market decreased slightly to 49.2 percent in 2013 from 51.5 percent in 2012. Fresh exports in 2013 were 18.5 percent of total production, less than the 21.9 percent in 2012 and roughly 1 percent below the 20 percent in 2011.
Table 2: Season-Average Apple Prices Received by U .S . Growers, 2010-2013 Crop Years
2010 2011 2012 2013
All sales (cents per pound) 25.10 30.30 37.10 31.10Fresh consumption (cents per pound) 32.60 39.40 45.30 40.90All processing (dollars per ton) 187.00 226.00 281.00 200.00Canned (dollars per ton) 207.00 230.00 395.00 226.00Juice and cider (dollars per ton) 149.00 198.00 221.00 151.00Frozen (dollars per ton) 198.00 246.00 328.00 240.00Dried (dollars per ton) 143.00 214.00 176.00 200.00Fresh slices (dollars per ton) 377.00 357.00 302.00 319.00Other (dollars per ton) 241.00 201.00 249.00 308.00
Value of Fresh Production (000) $2,037,047 $2,482,031 $2,980,250 $2,781,058Value of Processing Production (000) $276,541 $341,370 $327,385 $316,902Total Farm-Gate Value of Production1 (000) $2,313,588 $2,823,401 $3,307,635 $3,097,960
Source: USDA, National Agricultural Statistics Service, Noncitrus Fruits and Nuts Summary, various years.1 Total revenue to growers from fresh and processing sales.
2013 Crop: U.S. Production and Utilization Summary
2014 Production & Utilization Analysis 7
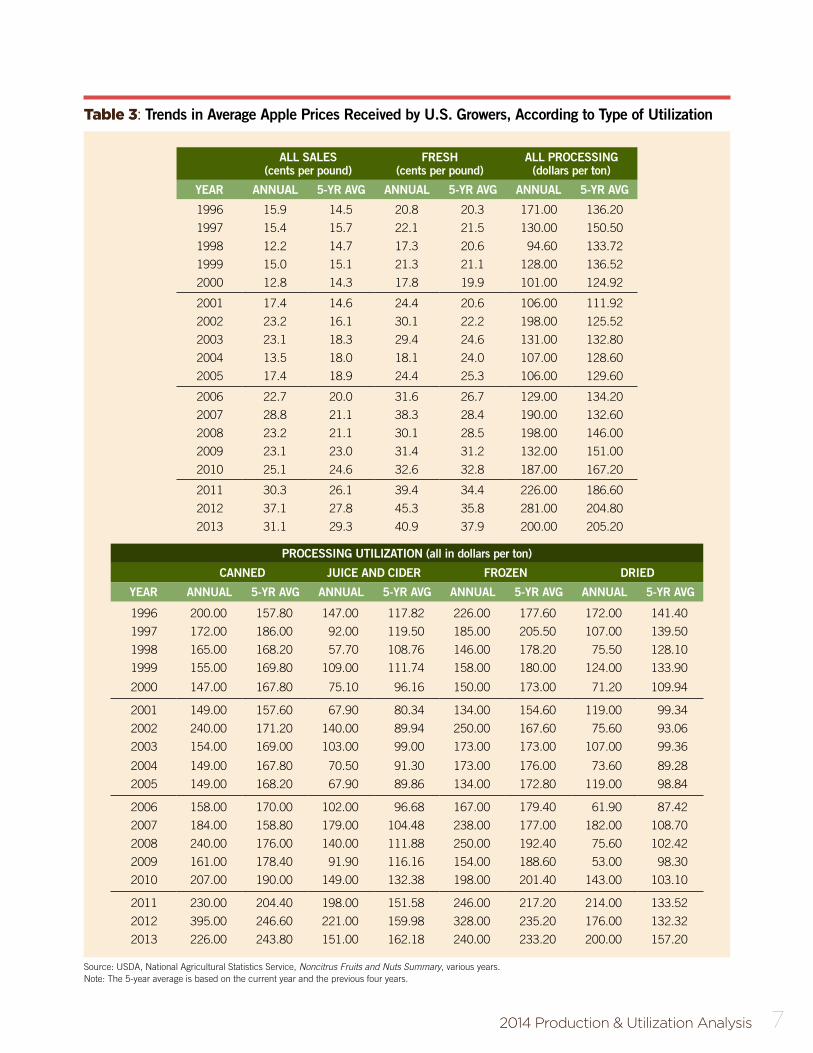
Table 3: Trends in Average Apple Prices Received by U .S . Growers, According to Type of Utilization
Source: USDA, National Agricultural Statistics Service, Noncitrus Fruits and Nuts Summary, various years.Note: The 5-year average is based on the current year and the previous four years.
ALL SALES(cents per pound)
FRESH(cents per pound)
ALL PROCESSING(dollars per ton)
YEAR ANNUAL 5-YR AVG ANNUAL 5-YR AVG ANNUAL 5-YR AVG
1996 15.9 14.5 20.8 20.3 171.00 136.20
1997 15.4 15.7 22.1 21.5 130.00 150.50
1998 12.2 14.7 17.3 20.6 94.60 133.72
1999 15.0 15.1 21.3 21.1 128.00 136.52
2000 12.8 14.3 17.8 19.9 101.00 124.92
2001 17.4 14.6 24.4 20.6 106.00 111.92
2002 23.2 16.1 30.1 22.2 198.00 125.52
2003 23.1 18.3 29.4 24.6 131.00 132.80
2004 13.5 18.0 18.1 24.0 107.00 128.60
2005 17.4 18.9 24.4 25.3 106.00 129.60
2006 22.7 20.0 31.6 26.7 129.00 134.20
2007 28.8 21.1 38.3 28.4 190.00 132.60
2008 23.2 21.1 30.1 28.5 198.00 146.00
2009 23.1 23.0 31.4 31.2 132.00 151.00
2010 25.1 24.6 32.6 32.8 187.00 167.20
2011 30.3 26.1 39.4 34.4 226.00 186.60
2012 37.1 27.8 45.3 35.8 281.00 204.80
2013 31.1 29.3 40.9 37.9 200.00 205.20
PROCESSING UTILIZATION (all in dollars per ton)
CANNED JUICE AND CIDER FROZEN DRIED
YEAR ANNUAL 5-YR AVG ANNUAL 5-YR AVG ANNUAL 5-YR AVG ANNUAL 5-YR AVG
1996 200.00 157.80 147.00 117.82 226.00 177.60 172.00 141.40
1997 172.00 186.00 92.00 119.50 185.00 205.50 107.00 139.50
1998 165.00 168.20 57.70 108.76 146.00 178.20 75.50 128.10
1999 155.00 169.80 109.00 111.74 158.00 180.00 124.00 133.90
2000 147.00 167.80 75.10 96.16 150.00 173.00 71.20 109.94
2001 149.00 157.60 67.90 80.34 134.00 154.60 119.00 99.34
2002 240.00 171.20 140.00 89.94 250.00 167.60 75.60 93.06
2003 154.00 169.00 103.00 99.00 173.00 173.00 107.00 99.36
2004 149.00 167.80 70.50 91.30 173.00 176.00 73.60 89.28
2005 149.00 168.20 67.90 89.86 134.00 172.80 119.00 98.84
2006 158.00 170.00 102.00 96.68 167.00 179.40 61.90 87.42
2007 184.00 158.80 179.00 104.48 238.00 177.00 182.00 108.70
2008 240.00 176.00 140.00 111.88 250.00 192.40 75.60 102.42
2009 161.00 178.40 91.90 116.16 154.00 188.60 53.00 98.30
2010 207.00 190.00 149.00 132.38 198.00 201.40 143.00 103.10
2011 230.00 204.40 198.00 151.58 246.00 217.20 214.00 133.52
2012 395.00 246.60 221.00 159.98 328.00 235.20 176.00 132.32
2013 226.00 243.80 151.00 162.18 240.00 233.20 200.00 157.20
8 U.S. Apple Association
Figure 1: U .S . Apple Production, 1962-2014
100,000
150,000
200,000
250,000
300,000
1962
1964
1966
1968
1970
1972
1974
1976
1978
1980
1982
1984
1986
1988
1990
1992
1994
1996
1998
2000
2002
2004
2006
2008
2010
2012
2014
The portion of the crop that was used in canned products was 11 percent in 2013, which was 3 percent higher than the 8 percent in 2012. The portion of the crop used in juice and cider increased from 12 percent in 2012 to 14 percent in 2013 (see Table 15). The portion of the crop used in frozen products increased from 1 percent in 2012 to 2 percent in 2013. Figure 3 depicts percentages of how the 2013 crop was utilized.
Figure 2: U .S . Apple Production, 2009-2014
190,000
210,000
230,000
250,000
270,000
231,069
2009 2010 2011 2012 2013 2014 F 5-YEAR
220,990224,405
213,836
239,326
259,248
225,925
Source: USDAF = Forecast
42 -
lb. B
ushe
ls (
000)
000
42-lb
. Uni
ts
Source: USDA.
2014 (F) 259,248
2013 Crop: U.S. Production and Utilization Summary

2014 Production & Utilization Analysis 9
Table 4: Per-Capita Utilization of Apples and Apple Products (Pounds, Fresh Weight Equivalent)
SEASON FRESH CANNED JUICE FROZEN DRIED OTHER TOTAL
2003/04 16.90 4.49 23.09 1.02 0.64 0.36 46.51
2004/05 18.82 4.53 25.25 0.85 0.70 0.45 50.59
2005/06 16.66 4.18 22.25 0.66 0.73 0.54 45.03
2006/07 17.73 4.20 26.36 0.90 0.97 0.60 50.75
2007/08 16.39 3.96 27.17 0.86 0.90 0.52 49.82
2008/09 15.90 4.61 25.05 0.75 0.88 0.78 47.96
2009/10 16.25 4.18 24.92 0.73 0.61 0.63 47.32
2010/11 15.32 3.96 26.36 0.67 0.65 0.66 47.69
2011/12 15.42 4.17 20.62 0.59 0.60 0.99 42.38
2012/13 16.00 3.15 22.50 0.35 0.87 0.57 43.44
2013/14 F 16.99 4.19 22.18 0.59 0.65 0.83 45.43
Source: USDA Economic Research Service, Crops BranchPer-capita numbers approximate the trend and general level of consumption over time. Annual consumption estimates do not reflect changes in stocks. Therefore, the numbers do not reflect actual year-to-year changes in consumption. Per capita figures are adjusted for imports and exports, and include shipments to territories. F =Forecast by USDA Economic Research Service Crops BranchOther includes vinegar, wine, slices for pie making and,fresh slices.
U .S . Crop Movement
Thirty - eight percent of the 2013 crop was moved prior to December 1, 2013, with 32.3 million bushels being processed, and 40.0 million bushels used in the domestic fresh market during this period (see Table 16). The supply of apples in storage on Dec. 1, 2013 was 148.6 million bushels, of which 84 percent was in long-term controlled atmosphere storage.
U .S . Exports and Imports
Exports of U.S. apples from the 2013 crop decreased by 6 percent to 44.2 million bushels from the 2012 crop (see Table 18). The decrease in exports resulted from lower volumes of exports to Mexico, Canada, Taiwan, India, Indonesia and Hong Kong, but there were increases in volumes to Vietnam and the United Arab Emirates. The top three destinations for U.S. apple exports and their percentage of total exports were Mexico at 27 percent, Canada at 16 percent and Taiwan at 7 percent.
Fresh-market apple imports increased to approximately 11 million 42-pound cartons in 2013 from 10.6 million 42-pound cartons in 2012 (see Table 19). Chile was the largest source of fresh apple imports, accounting for 63 percent of total imports. New Zealand and Canada followed, capturing approximately 22 percent and 11 percent of total imports, respectively. The yearly balance of trade for fresh apples and equivalent trade in juice apples is illustrated in Table 17.

10 U.S. Apple Association
2013 Crop: U.S. Production and Utilization Summary
Figure 3: Utilization of 2013 U .S . Apple Crop
Source: USDA, National Agricultural Statistics Service.
Fresh Slices 2 .0%
Frozen 2 .1% Dried 1 .7% Other Products 0 .6%
Juice 13 .9%
Total Canned 11 .2%
Not Marketed 0 .8%
67 .6% Fresh
The 2013 estimate of 480 million gallons single-strength equivalent for U.S. apple juice imports represents a 6 percent decrease from 508 million gallons imported in 2012. Table 11 shows imports of apple juice on a single-strength equivalent basis and on a bushel-equivalent basis.

2014 Production & Utilization Analysis 11
2014 Crop: U.S. Production Forecast
On August 12, 2014, the U.S. Department of Agriculture (USDA) forecast the 2014 U.S. apple crop at 10.9 billion pounds. Measured in 42-pound bushels, the crop is forecast to be 259.2 million bushels. This is 20 million bushels more than 2013 production in the U.S. and 33 million bushels above the average U.S. produc-tion for the past five years of 225.9 million bushels.
Production for 2014 in the East is forecast to increase by 7 percent but is expected to decline by 12 percent in the Midwest while the Western forecast projects an increase of 13 percent compared to 2013.
In the East, the 2014 crop is forecast at 54.4 million bushels, up 7 percent from 2013 and 2 percent above the five-year average. The 2014 New York crop, at 29.8 million bushels, is forecast to be 23 percent greater than 2013, and 12 percent above the five-year average. The Appalachian region (Maryland, Pennsylvania, Virginia and West Virginia) 2014 production is forecast at 18.3 million bushels, down 3 percent from 2013. The New England (Connecticut, Maine, Massachusetts, New Hampshire, Rhode Island and Vermont) crop is forecast to decrease by 15 percent from 3.8 million bushels in 2013 to 3.2 million bushels in 2014, and production in the Southeast is expected to decrease from the 2013 crop in that area. See Tables 5 and 6 for regional crop produc-tion data.
Production from the Midwestern region, forecast at 30.3 million bushels, is forecast to be down 12 percent from the 2013 production of 34.4 million bushels but is 23 percent above the five-year average. Michigan’s crop is forecast at 26.2 million bushels, 13 percent below last year’s crop of 30.0 million bushels, and is 35 percent above the five year average. The combined Eastern and Midwestern crop for 2014 is forecast at 84.8 million bushels, down 1 percent from 2013, and 9 percent above the five-year average.
The Western crop is forecast at 174.5 million bushels, a 13 percent increase from 2013, and is 18 percent above the five-year average. Washington State is forecast to produce 161.9 million bushels, 14 percent above its 2013 production, and approximately 19 percent more than the average production over the past five years. California production for 2014 is forecast at 6.2 million bushels, 4 percent below the 2013 production and 5 percent below the five-year average for the state.
Apple production in Oregon is forecast at 3.8 million bushels, 13 percent greater than the 2013 crop. Idaho is forecast to produce 1.6 million bushels in 2014, a decrease of 6 percent from 2013. Arizona is forecast to produce 202,381 bushels in 2014, and Utah is forecast at 500,000 bushels. Arizona’s production estimate is a decrease of 48 percent compared to 2013, and Utah’s production is expected to increase by 27 percent from 2013. See Table 7 for 2014 production forecasts and historical data by state and region.

12 U.S. Apple Association
2014 Crop: U.S. Production Forecast
Table 5: Comparison of Estimated 2014 U .S . Apple Crop with 2013 and Five-year Average (000 42-lb. Units)
Source: USDA, National Agricultural Statistics Service, and Noncitrus Fruits and Nuts Summary, various years and Crop Production, Aug. 12, 2014Note: Columns may not add due to rounding.
2014 FORECAST COMPARED WITH
REGION 2013 2014 FORECAST 5-YEAR AVERAGE 2013 5-YEAR AVERAGE
East 50,845 54,426 53,327 7% 2%
Midwest 34,395 30,348 24,695 -12% 23%
Total East and Midwest 85,240 84,774 78,022 -1% 9%
West 154,086 174,474 147,903 13% 18%
Total United States 239,326 259,248 225,925 8% 15%
Table 6: U .S . Apple Production By Region (000 42 lb. Units)
Source: USDA, National Agricultural Statistics Service, Noncitrus Fruits and Nuts Summary, various years and Crop Production, Aug. 12, 2014Note: Columns may not add due to rounding.
2009 2010 2011 2012 20135-YEAR
AVERAGE2014
FORECAST
Eastern States 61,569 57,074 55,345 41,802 50,845 53,327 54,426
Midwest States 34,274 19,798 28,786 6,224 34,395 24,695 30,348
Total East and Midwest 95,843 76,871 84,131 48,026 85,240 78,022 84,774
Western States 135,226 144,119 140,274 165,810 154,086 147,903 174,474
United States 231,069 220,990 224,405 213,836 239,326 225,925 259,248
REGIONAL SHARE OF U .S . PRODUCTION
2009 2010 2011 2012 20135-YEAR
AVERAGE2014
FORECAST
Eastern States 27% 26% 25% 20% 21% 24% 21%
Midwest States 15% 9% 13% 3% 14% 11% 12%
Total East and Midwest 41% 35% 37% 22% 36% 35% 33%
Western States 59% 65% 63% 78% 64% 65% 67%
United States 100% 100% 100% 100% 100% 100% 100%
2014 Production & Utilization Analysis 13
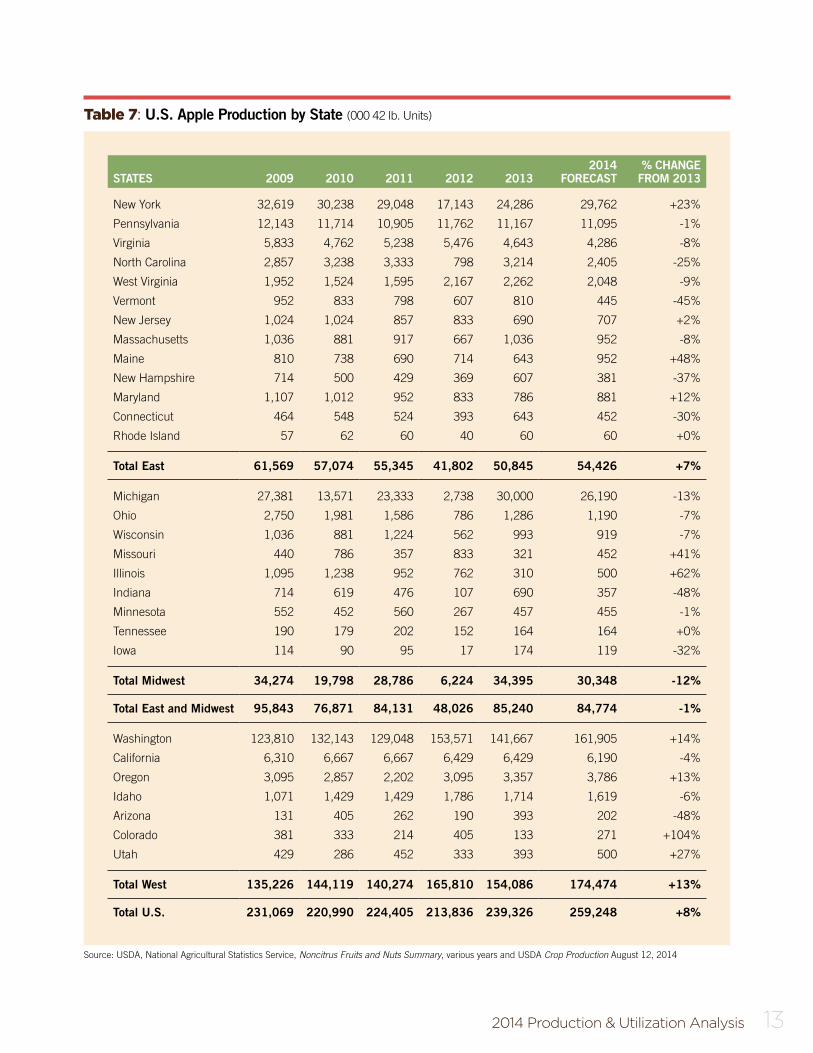
Table 7: U .S . Apple Production by State (000 42 lb. Units)
Source: USDA, National Agricultural Statistics Service, Noncitrus Fruits and Nuts Summary, various years and USDA Crop Production August 12, 2014
STATES 2009 2010 2011 2012 20132014
FORECAST% CHANGE
FROM 2013
New York 32,619 30,238 29,048 17,143 24,286 29,762 +23%
Pennsylvania 12,143 11,714 10,905 11,762 11,167 11,095 -1%
Virginia 5,833 4,762 5,238 5,476 4,643 4,286 -8%
North Carolina 2,857 3,238 3,333 798 3,214 2,405 -25%
West Virginia 1,952 1,524 1,595 2,167 2,262 2,048 -9%
Vermont 952 833 798 607 810 445 -45%
New Jersey 1,024 1,024 857 833 690 707 +2%
Massachusetts 1,036 881 917 667 1,036 952 -8%
Maine 810 738 690 714 643 952 +48%
New Hampshire 714 500 429 369 607 381 -37%
Maryland 1,107 1,012 952 833 786 881 +12%
Connecticut 464 548 524 393 643 452 -30%
Rhode Island 57 62 60 40 60 60 +0%
Total East 61,569 57,074 55,345 41,802 50,845 54,426 +7%
Michigan 27,381 13,571 23,333 2,738 30,000 26,190 -13%
Ohio 2,750 1,981 1,586 786 1,286 1,190 -7%
Wisconsin 1,036 881 1,224 562 993 919 -7%
Missouri 440 786 357 833 321 452 +41%
Illinois 1,095 1,238 952 762 310 500 +62%
Indiana 714 619 476 107 690 357 -48%
Minnesota 552 452 560 267 457 455 -1%
Tennessee 190 179 202 152 164 164 +0%
Iowa 114 90 95 17 174 119 -32%
Total Midwest 34,274 19,798 28,786 6,224 34,395 30,348 -12%
Total East and Midwest 95,843 76,871 84,131 48,026 85,240 84,774 -1%
Washington 123,810 132,143 129,048 153,571 141,667 161,905 +14%
California 6,310 6,667 6,667 6,429 6,429 6,190 -4%
Oregon 3,095 2,857 2,202 3,095 3,357 3,786 +13%
Idaho 1,071 1,429 1,429 1,786 1,714 1,619 -6%
Arizona 131 405 262 190 393 202 -48%
Colorado 381 333 214 405 133 271 +104%
Utah 429 286 452 333 393 500 +27%
Total West 135,226 144,119 140,274 165,810 154,086 174,474 +13%
Total U .S . 231,069 220,990 224,405 213,836 239,326 259,248 +8%
14 U.S. Apple Association
2014 Crop: U.S. Varietal AnalysisThe mix of varieties of the 2014 U.S. apple crop is as important to the apple market as the overall volume of total U.S. apple production. The relationship between fresh-market and processing varieties and the supply of certain fresh-market varieties plays an important role in determining market conditions.
In 1981, the U.S. Department of Agriculture (USDA) discontinued its varietal estimate of the national apple crop. Since then, the U.S. Apple Association (USApple) has provided that service to the apple industry. USApple bases its varietal estimate on the total crop forecast provided by USDA. The estimate is calculated from input received from various regional producer organizations, consultations with regional production experts and varietal data collected from storage facilities.
2014 Regional and Varietal Estimates
Under ideal circumstances, the U.S. varietal mix is reasonably distributed across producing regions, and varietal supplies are sufficient to support fresh-market and processing-apple demand for any particular variety. USApple bases its varietal estimate on the total crop forecast provided by USDA. The estimate is calculated from input received from various regional producer organizations, consultations with regional production experts, and varietal data from storage reports submitted to USApple.
Total Western production is forecast to increase 13 percent from 2013 and will be 18 percent above the five-year average for that region. While the larger 2014 crop will likely result in higher actual volumes, the
Source: U.S. Apple Association.F = Forecast.
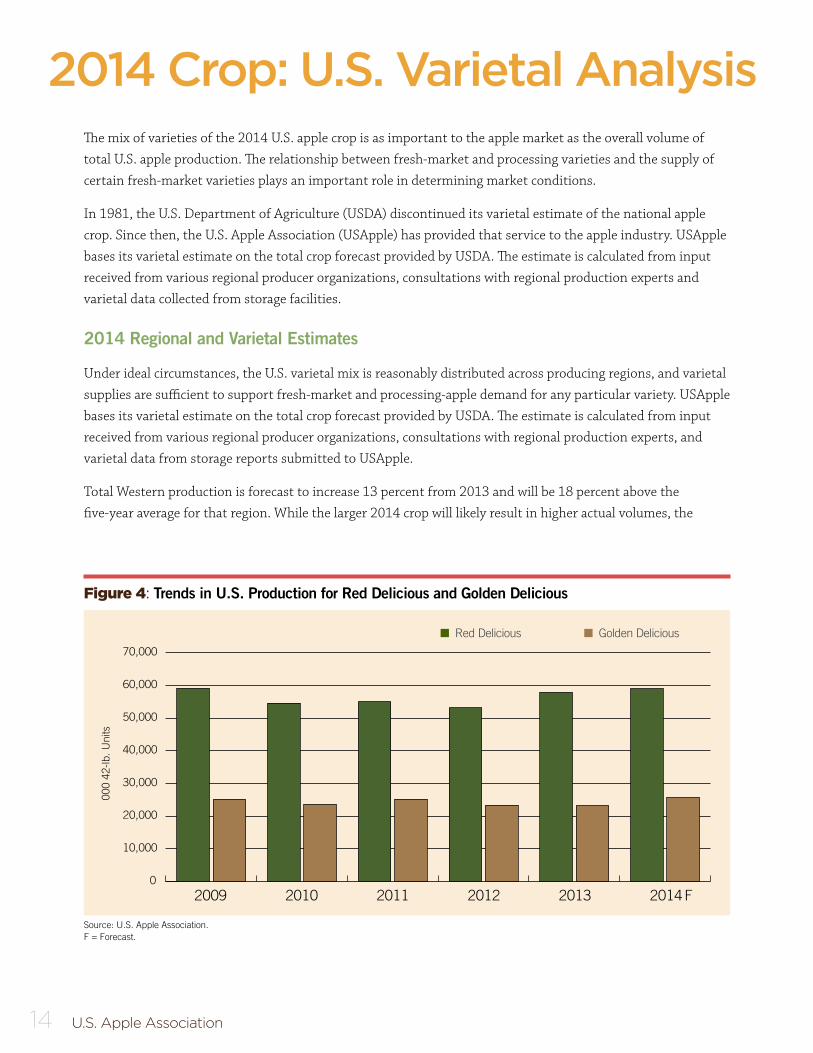
Figure 4: Trends in U .S . Production for Red Delicious and Golden Delicious
0
10,000
20,000
30,000
40,000
50,000
60,000
70,000
2009 2010 2011 2012 2013 2014F
n Red Delicious n Golden Delicious
000
42-lb
. Uni
ts

2014 Production & Utilization Analysis 15
percentage production of Red Delicious in Washington State relative to other varieties is expected to continue to decrease, while other varieties such as Gala, Cripps Pink and Honeycrisp will continue to increase their share of overall production. The production volume for Gala is expected to increase by 14 percent, while Fuji volume is projected to increase by 28 percent. See Table 6 for USApple’s varietal forecast and Table 7 for variety fore-casts by growing region.
Fresh market varieties are forecast to comprise approximately 79 percent of the U.S. crop in 2014. In 2013 and 2012, fresh-market varieties accounted for 77 and 84 percent of the crop respectively. Dual-purpose varieties will make up 35 percent of the Eastern crop and 35 percent of the Midwestern crop, and will comprise 11 percent of overall U.S. production in 2014 (see Table 8).
The varietal picture has changed over the past five years and will continue to change in 2014. Red Delicious still leads varietal production nationally, while Gala holds the second place ranking for 2014, as it has since 2006. Golden Delicious remains in third place since losing the second place position to Gala in 2006.
Table 8: Total U .S . Apple Production by Variety (000 42 lb. Units)
Source: U.S. Apple Association. * Includes only Western production. Eastern and Midwest production is included in other varieties. Note: Braeburn, Cameo, Cripps Pink and Jonagold added in 2007, and Honeycrisp added in 2012, were previously included in “all others.” Note: Sum of varieties may not add to total due to rounding of individual varieties.
VARIETIES 2009 2010 2011 2012 2013 2014
FORECAST
Red Delicious 59,031 54,566 54,942 53,089 57,829 58,914
Gala 30,020 32,742 32,854 36,264 37,546 42,687
Golden Delicious 25,126 23,498 25,107 23,271 23,137 25,554
Fuji * 17,707 20,421 19,853 24,209 20,231 25,808
Granny Smith * 18,268 18,953 18,548 22,808 22,993 23,277
Honeycrisp 4,309 5,180 5,763 7,630 9,012 12,939
McIntosh 11,181 9,489 10,617 6,247 9,658 10,334
Rome 9,844 8,243 8,555 5,325 8,300 7,910
Cripps Pink * 3,601 3,812 3,716 4,587 5,202 5,350
York 4,412 4,007 3,910 4,214 3,910 3,803
Braeburn * 4,002 4,062 3,945 2,695 2,526 2,902
Empire 7,197 6,011 6,366 3,215 5,615 6,099
Jonathan 3,923 2,596 3,208 1,197 3,446 3,045
Idared 4,890 3,528 4,178 1,508 4,306 4,359
Cameo * 1,349 1,151 1,121 1,184 875 1,007
Cortland 2,629 2,293 3,172 1,813 2,356 2,477
Stayman 1,169 1,083 1,031 946 1,005 943
Jonagold * 1,247 1,317 1,280 1,507 1,162 1,401
Northern Spy 1,876 1,120 1,545 389 1,394 1,207
All Others 19,288 16,743 14,694 11,737 18,826 19,231
Total 231,069 220,814 224,405 213,836 239,326 259,248
16 U.S. Apple Association
2014 Crop: U.S. Varietal Analysis
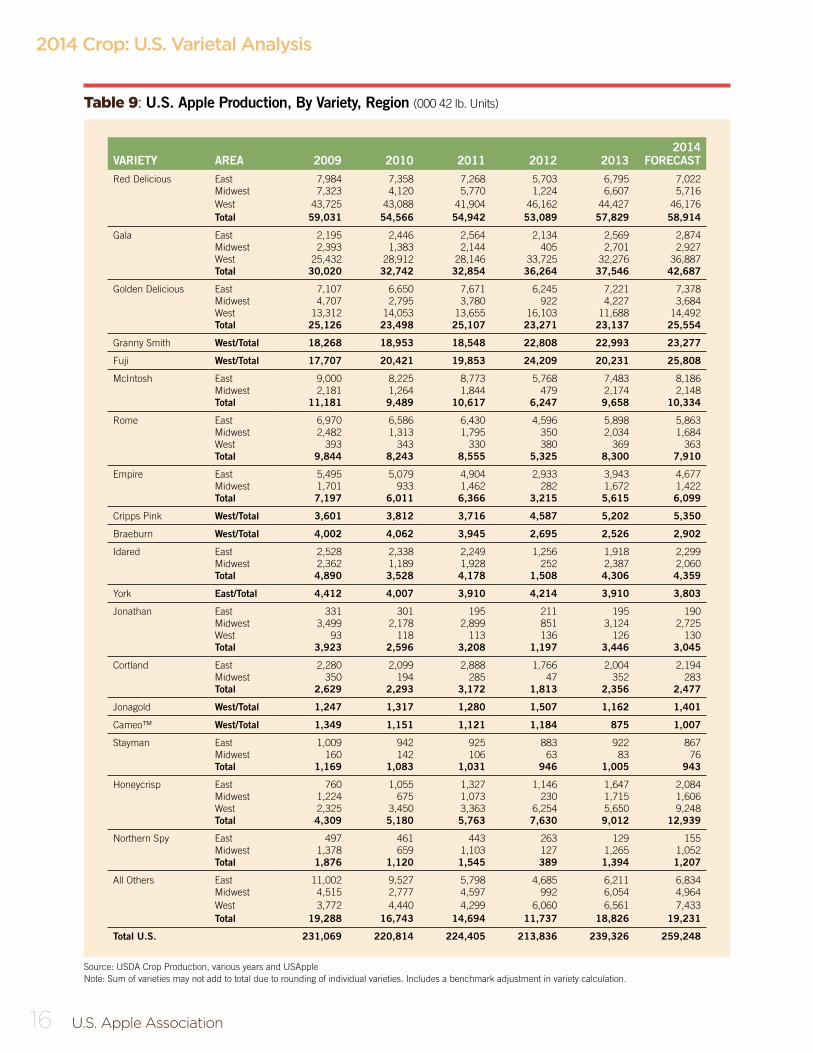
Table 9: U .S . Apple Production, By Variety, Region (000 42 lb. Units)
Source: USDA Crop Production, various years and USAppleNote: Sum of varieties may not add to total due to rounding of individual varieties. Includes a benchmark adjustment in variety calculation.
VARIETY AREA 2009 2010 2011 2012 2013 2014
FORECASTRed Delicious East 7,984 7,358 7,268 5,703 6,795 7,022
Midwest 7,323 4,120 5,770 1,224 6,607 5,716West 43,725 43,088 41,904 46,162 44,427 46,176Total 59,031 54,566 54,942 53,089 57,829 58,914
Gala East 2,195 2,446 2,564 2,134 2,569 2,874Midwest 2,393 1,383 2,144 405 2,701 2,927West 25,432 28,912 28,146 33,725 32,276 36,887Total 30,020 32,742 32,854 36,264 37,546 42,687
Golden Delicious East 7,107 6,650 7,671 6,245 7,221 7,378Midwest 4,707 2,795 3,780 922 4,227 3,684West 13,312 14,053 13,655 16,103 11,688 14,492Total 25,126 23,498 25,107 23,271 23,137 25,554
Granny Smith West/Total 18,268 18,953 18,548 22,808 22,993 23,277
Fuji West/Total 17,707 20,421 19,853 24,209 20,231 25,808
McIntosh East 9,000 8,225 8,773 5,768 7,483 8,186Midwest 2,181 1,264 1,844 479 2,174 2,148Total 11,181 9,489 10,617 6,247 9,658 10,334
Rome East 6,970 6,586 6,430 4,596 5,898 5,863Midwest 2,482 1,313 1,795 350 2,034 1,684West 393 343 330 380 369 363Total 9,844 8,243 8,555 5,325 8,300 7,910
Empire East 5,495 5,079 4,904 2,933 3,943 4,677Midwest 1,701 933 1,462 282 1,672 1,422Total 7,197 6,011 6,366 3,215 5,615 6,099
Cripps Pink West/Total 3,601 3,812 3,716 4,587 5,202 5,350
Braeburn West/Total 4,002 4,062 3,945 2,695 2,526 2,902
Idared East 2,528 2,338 2,249 1,256 1,918 2,299Midwest 2,362 1,189 1,928 252 2,387 2,060Total 4,890 3,528 4,178 1,508 4,306 4,359
York East/Total 4,412 4,007 3,910 4,214 3,910 3,803
Jonathan East 331 301 195 211 195 190Midwest 3,499 2,178 2,899 851 3,124 2,725West 93 118 113 136 126 130Total 3,923 2,596 3,208 1,197 3,446 3,045
Cortland East 2,280 2,099 2,888 1,766 2,004 2,194Midwest 350 194 285 47 352 283Total 2,629 2,293 3,172 1,813 2,356 2,477
Jonagold West/Total 1,247 1,317 1,280 1,507 1,162 1,401
Cameo™ West/Total 1,349 1,151 1,121 1,184 875 1,007
Stayman East 1,009 942 925 883 922 867Midwest 160 142 106 63 83 76Total 1,169 1,083 1,031 946 1,005 943
Honeycrisp East 760 1,055 1,327 1,146 1,647 2,084Midwest 1,224 675 1,073 230 1,715 1,606West 2,325 3,450 3,363 6,254 5,650 9,248Total 4,309 5,180 5,763 7,630 9,012 12,939
Northern Spy East 497 461 443 263 129 155Midwest 1,378 659 1,103 127 1,265 1,052Total 1,876 1,120 1,545 389 1,394 1,207
All Others East 11,002 9,527 5,798 4,685 6,211 6,834Midwest 4,515 2,777 4,597 992 6,054 4,964West 3,772 4,440 4,299 6,060 6,561 7,433Total 19,288 16,743 14,694 11,737 18,826 19,231
Total U .S . 231,069 220,814 224,405 213,836 239,326 259,248
2014 Production & Utilization Analysis 17
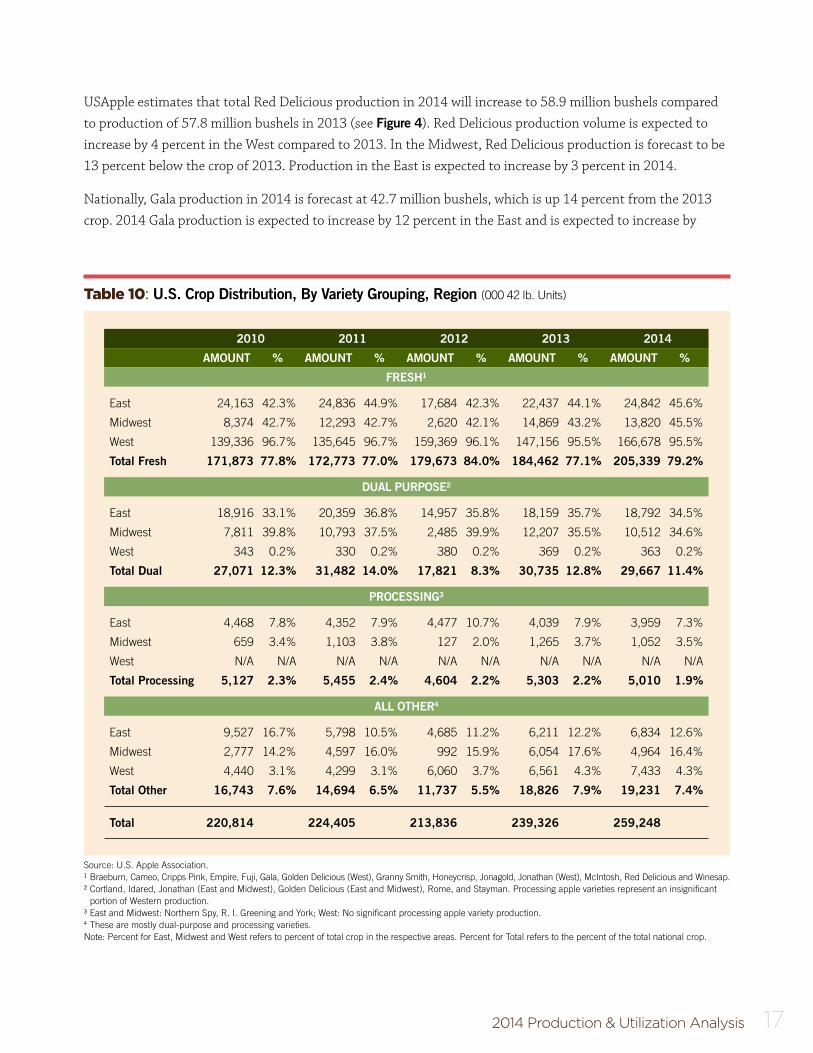
Table 10: U .S . Crop Distribution, By Variety Grouping, Region (000 42 lb. Units)
Source: U.S. Apple Association. ¹ Braeburn, Cameo, Cripps Pink, Empire, Fuji, Gala, Golden Delicious (West), Granny Smith, Honeycrisp, Jonagold, Jonathan (West), McIntosh, Red Delicious and Winesap. ² Cortland, Idared, Jonathan (East and Midwest), Golden Delicious (East and Midwest), Rome, and Stayman. Processing apple varieties represent an insignificant
portion of Western production.³ East and Midwest: Northern Spy, R. I. Greening and York; West: No significant processing apple variety production.4 These are mostly dual-purpose and processing varieties.Note: Percent for East, Midwest and West refers to percent of total crop in the respective areas. Percent for Total refers to the percent of the total national crop.
2010 2011 2012 2013 2014
AMOUNT % AMOUNT % AMOUNT % AMOUNT % AMOUNT %
FRESH¹
East 24,163 42.3% 24,836 44.9% 17,684 42.3% 22,437 44.1% 24,842 45.6%
Midwest 8,374 42.7% 12,293 42.7% 2,620 42.1% 14,869 43.2% 13,820 45.5%
West 139,336 96.7% 135,645 96.7% 159,369 96.1% 147,156 95.5% 166,678 95.5%
Total Fresh 171,873 77 .8% 172,773 77 .0% 179,673 84 .0% 184,462 77 .1% 205,339 79 .2%
DUAL PURPOSE²
East 18,916 33.1% 20,359 36.8% 14,957 35.8% 18,159 35.7% 18,792 34.5%
Midwest 7,811 39.8% 10,793 37.5% 2,485 39.9% 12,207 35.5% 10,512 34.6%
West 343 0.2% 330 0.2% 380 0.2% 369 0.2% 363 0.2%
Total Dual 27,071 12 .3% 31,482 14 .0% 17,821 8 .3% 30,735 12 .8% 29,667 11 .4%
PROCESSING³
East 4,468 7.8% 4,352 7.9% 4,477 10.7% 4,039 7.9% 3,959 7.3%
Midwest 659 3.4% 1,103 3.8% 127 2.0% 1,265 3.7% 1,052 3.5%
West N/A N/A N/A N/A N/A N/A N/A N/A N/A N/A
Total Processing 5,127 2 .3% 5,455 2 .4% 4,604 2 .2% 5,303 2 .2% 5,010 1 .9%
ALL OTHER4
East 9,527 16.7% 5,798 10.5% 4,685 11.2% 6,211 12.2% 6,834 12.6%
Midwest 2,777 14.2% 4,597 16.0% 992 15.9% 6,054 17.6% 4,964 16.4%
West 4,440 3.1% 4,299 3.1% 6,060 3.7% 6,561 4.3% 7,433 4.3%
Total Other 16,743 7 .6% 14,694 6 .5% 11,737 5 .5% 18,826 7 .9% 19,231 7 .4%
Total 220,814 224,405 213,836 239,326 259,248
USApple estimates that total Red Delicious production in 2014 will increase to 58.9 million bushels compared to production of 57.8 million bushels in 2013 (see Figure 4). Red Delicious production volume is expected to increase by 4 percent in the West compared to 2013. In the Midwest, Red Delicious production is forecast to be 13 percent below the crop of 2013. Production in the East is expected to increase by 3 percent in 2014.
Nationally, Gala production in 2014 is forecast at 42.7 million bushels, which is up 14 percent from the 2013 crop. 2014 Gala production is expected to increase by 12 percent in the East and is expected to increase by

18 U.S. Apple Association
Source: U.S. Apple Association.F = Forecast.
Figure 5: Trends in Production for Other Top U .S . Varieties
0
5,000
10,000
15,000
20,000
25,000
30,000
35,000
40,000
45,000
2010 2011 2012 2013 2014F
000
42-lb
. Uni
ts
n Fuji n Granny Smith n Honeycrisp n Gala n McIntosh
2014 Crop: U.S. Varietal Analysis
8 percent in the Midwest. Production in the West is forecast to increase by 14 percent. See Figure 7 for an anal-ysis of Gala production.
In 2014 Golden Delicious production is estimated to increase by 24 percent in the West, but to decrease by 13 percent in the Midwest and to increase by 2 percent in the East compared to 2013 production. Nationally, 2014 Golden Delicious production volume is expected to increase 10 percent compared to 2013 (see Figure
4). Together, Red Delicious, Gala, and Golden Delicious are expected to make up 49 percent of total U.S. apple production in 2014, approximately 1 percent less than the share of U.S. production that the three varieties comprised in 2013.
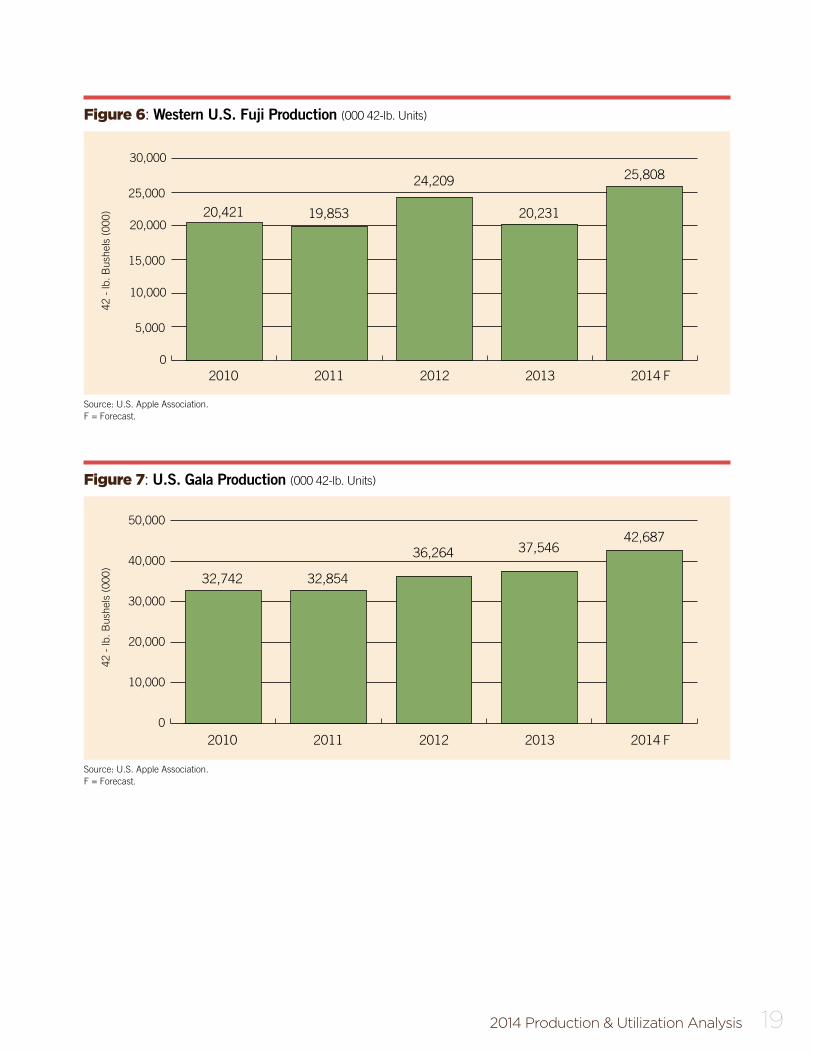
2014 Fuji production in the West is expected to increase by 28 percent as compared to 2013. See Figure 6 for an analysis of Western U.S. Fuji production. Production of Granny Smith is forecast to increase 1 percent as compared to 2013. McIntosh volume is expected to increase by 9 percent in the East and decrease by 1 percent in the Midwest in 2014 from 2013 production levels. Nationally, McIntosh production in 2014 is forecast to increase by 7 percent compared to production in 2013. See Figure 5, Table 6 and Table 7 for historical compari-sons of varietal production.
2014 Production & Utilization Analysis 19
Source: U.S. Apple Association.F = Forecast.
Figure 6: Western U .S . Fuji Production (000 42-lb. Units)
2010 2011 2012 2013 2014
20,421 19,853
24,209
20,231
25,808
0
5,000
10,000
15,000
20,000
25,000
30,000
F
42 -
lb. B
ushe
ls (
000)
Source: U.S. Apple Association.F = Forecast.
Figure 7: U .S . Gala Production (000 42-lb. Units)
2010 2011 2012 2013 2014
32,742 32,854
36,264 37,54642,687
0
10,000
20,000
30,000
40,000
50,000
F
42 -
lb. B
ushe
ls (
000)

20 U.S. Apple Association
2014 Crop: U.S. Utilization and Movement Forecasts
The following forecast of the expected 2014 crop processing apple utilization is based on U.S. Department of Agriculture (USDA) data on the utilization of apples in various processed apple products and through informa-tion USApple has gathered from apple processing firms.
Total Canned Apple Products
Canned apple products are expected to use 27.4 million bushels of raw product in 2014 (see Table 13). Utilization at this level would be 2 percent greater than in 2013.
Apple Juice Concentrate
After increasing steadily in the mid-1980s, imports of single-strength-equivalent apple juice varied from year-to-year in the 1990s. Imports then grew dramatically during the first decade of the twenty-first century. Table
11 illustrates import levels of single-strength-equivalent apple juice over the past five years; import data has also been converted to show the equivalent in bushels of apples and is compared to utilization of domestical-ly-produced apples for juice processing.
In 2013, imports of single-strength apple juice equivalents were 5 percent below 2012 import levels. At the 2013 level, imported bushel equivalents represented 80 percent of the total amount of apples used to process apple juice in the United States. Historical prices for apple juice concentrate are included in Appendix A.
Table 11: U .S . Apple Juice Imports (000)
Source: USDA, Economic Research Service, Crops Branch¹ Based on a marketing year of August through July.The volume shown as bushel equivalents is based on a conversion rate of 3.59 gallons of single-strength juice per 42-lb. unit. One bushel is equivalent to 42 lbs.F = Forecast by Economic Research Service
2008/09 2009/10 2010/11 2012/13 2013/14 (F)
Imported Gallons: Single-Strength Equivalent¹ 541,129 586,976 446,714 507,718 480,000 F
Imported Gallons Converted to: Bushel Equivalents¹
150,732 163,503 124,433 141,426 133,705
Domestic Production in Gallons: Single Strength Equivalent¹
115,783 105,075 100,667 92,675 116,433 F
Domestic Bushels Used for Juice 32,252 29,269 28,041 25,815 32,433
Total Bushel Equivalents Used for Juice(Domestic + Imported)
182,984 192,772 152,474 167,240 166,137
Imported Bushel Equivalents as Percent of Total 82% 85% 82% 85% 80%
2014 Production & Utilization Analysis 21
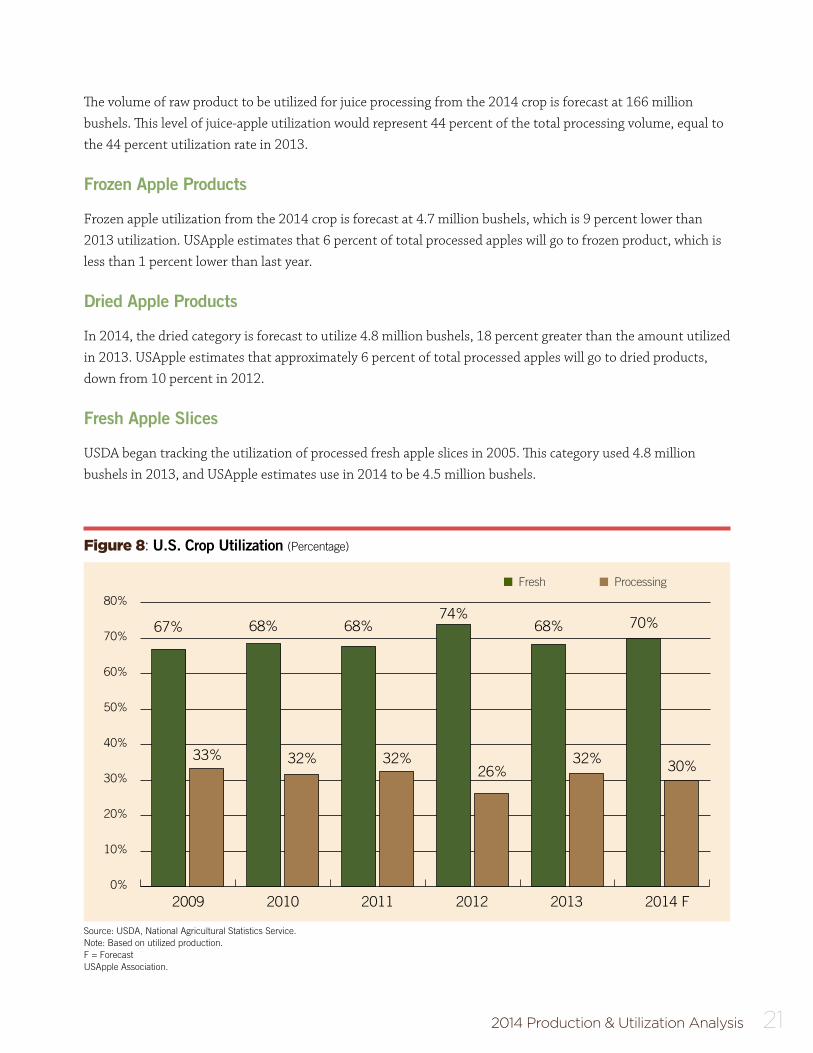
The volume of raw product to be utilized for juice processing from the 2014 crop is forecast at 166 million bushels. This level of juice-apple utilization would represent 44 percent of the total processing volume, equal to the 44 percent utilization rate in 2013.
Frozen Apple Products
Frozen apple utilization from the 2014 crop is forecast at 4.7 million bushels, which is 9 percent lower than 2013 utilization. USApple estimates that 6 percent of total processed apples will go to frozen product, which is less than 1 percent lower than last year.
Dried Apple Products
In 2014, the dried category is forecast to utilize 4.8 million bushels, 18 percent greater than the amount utilized in 2013. USApple estimates that approximately 6 percent of total processed apples will go to dried products, down from 10 percent in 2012.
Fresh Apple Slices
USDA began tracking the utilization of processed fresh apple slices in 2005. This category used 4.8 million bushels in 2013, and USApple estimates use in 2014 to be 4.5 million bushels.
Source: USDA, National Agricultural Statistics Service.Note: Based on utilized production. F = ForecastUSApple Association.
Figure 8: U .S . Crop Utilization (Percentage)
0%
10%
20%
30%
40%
50%
60%
70%
80%
67% 68% 68%74%
68% 70%
32% 32%26%
32% 30%33%
2009 2010 2011 2012 2013 2014 F
n Fresh n Processing
22 U.S. Apple Association
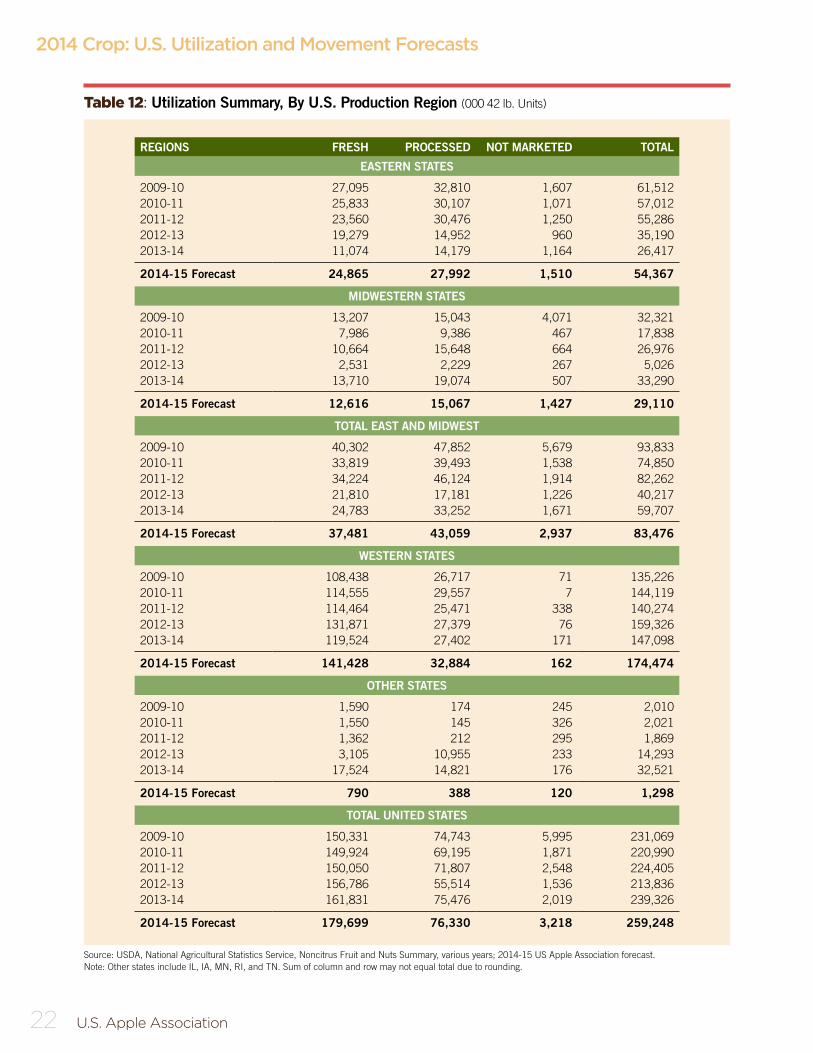
Table 12: Utilization Summary, By U .S . Production Region (000 42 lb. Units)
Source: USDA, National Agricultural Statistics Service, Noncitrus Fruit and Nuts Summary, various years; 2014-15 US Apple Association forecast. Note: Other states include IL, IA, MN, RI, and TN. Sum of column and row may not equal total due to rounding.
REGIONS FRESH PROCESSED NOT MARKETED TOTAL
EASTERN STATES
2009-10 27,095 32,810 1,607 61,5122010-11 25,833 30,107 1,071 57,0122011-12 23,560 30,476 1,250 55,2862012-13 19,279 14,952 960 35,1902013-14 11,074 14,179 1,164 26,417
2014-15 Forecast 24,865 27,992 1,510 54,367
MIDWESTERN STATES
2009-10 13,207 15,043 4,071 32,3212010-11 7,986 9,386 467 17,8382011-12 10,664 15,648 664 26,9762012-13 2,531 2,229 267 5,0262013-14 13,710 19,074 507 33,290
2014-15 Forecast 12,616 15,067 1,427 29,110
TOTAL EAST AND MIDWEST
2009-10 40,302 47,852 5,679 93,8332010-11 33,819 39,493 1,538 74,8502011-12 34,224 46,124 1,914 82,2622012-13 21,810 17,181 1,226 40,2172013-14 24,783 33,252 1,671 59,707
2014-15 Forecast 37,481 43,059 2,937 83,476
WESTERN STATES
2009-10 108,438 26,717 71 135,2262010-11 114,555 29,557 7 144,1192011-12 114,464 25,471 338 140,2742012-13 131,871 27,379 76 159,3262013-14 119,524 27,402 171 147,098
2014-15 Forecast 141,428 32,884 162 174,474
OTHER STATES
2009-10 1,590 174 245 2,0102010-11 1,550 145 326 2,0212011-12 1,362 212 295 1,8692012-13 3,105 10,955 233 14,2932013-14 17,524 14,821 176 32,521
2014-15 Forecast 790 388 120 1,298
TOTAL UNITED STATES
2009-10 150,331 74,743 5,995 231,0692010-11 149,924 69,195 1,871 220,9902011-12 150,050 71,807 2,548 224,4052012-13 156,786 55,514 1,536 213,8362013-14 161,831 75,476 2,019 239,326
2014-15 Forecast 179,699 76,330 3,218 259,248
2014 Crop: U.S. Utilization and Movement Forecasts

2014 Production & Utilization Analysis 23
Other Processed Apple Products
Utilization of apples in this category is forecast at 1.6 million bushels in 2014, about 14 percent higher than the amount used in 2013. Information on USDA purchases of apples and apple products for use by schools and low-income feeding programs can be found in Table 25.
Processing vs . Fresh-Market Forecasts
USDA forecasts the 2014 U.S. apple crop at 259.2 million bushels. Based on this forecast, USApple estimates that approximately 179.7 million bushels will be sold as fresh-market apples, 76.4 million bushels are forecast to be processed, and approximately 3.2 million bushels will not be marketed.
Utilization by production region is found in Table 12. Comparisons of apple-crop processing utilization volume and value are found in Tables 13 and 14 respectively; overall utilization is summarized in Table 15.
Fresh-market apple utilization in 2014 is expected to increase by 11 percent as compared to 2013. The fresh-versus-processing ratio of crop utilization for the 2014 crop is forecast to be 69 percent fresh and 29 percent processing, with 1 percent of the crop not marketed. In 2013, 68 percent was sold in the fresh market, 32 percent was used for processed products, and a small amount, less than 1 percent, was not marketed.
Figure 8 presents the historic utilization breakdown graphically. Table 12 includes a regional breakdown of the crop into fresh-market and processed product destinations. Utilization of the processing portion of the crop estimated for 2014 and for the previous five years is shown in Table 15.
2014 Crop Movement Forecast
USApple estimates that movement of the 2014 crop prior to Dec. 1, 2014 will be 109 million bushels. Of this, 34 percent will go to processing, 45 percent to the fresh domestic market and 18 percent to fresh exports.
Source: USDA, National Agricultural Statistics Service, Noncitrus Fruits and Nuts Summary, various years. 1 Canned apple products include apple sauce and canned slices.Note: Sum of processing utilization categories may not add due to rounding.
Table 13: U .S . Processing-Apple Utilization: Volume (000 42-lb. units)
2009 2010 2011 2012 2013FORECAST
2014
Canned¹ 27,576 25,793 26,755 17,831 26,764 27,424
Juice 33,081 30,021 28,771 26,479 33,267 33,339
Dried 3,838 4,179 4,369 5,310 4,071 4,786
Frozen 5,624 4,310 4,536 1,586 5,100 4,652
Fresh Slices 3,307 3,248 5,676 3,045 4,845 4,542
Other Products 1,317 1,645 1,690 1,257 1,412 1,610
Total 74,743 69,195 72,274 55,507 75,460 76,352

24 U.S. Apple Association
Source: USDA, National Agricultural Statistics Service, Noncitrus Fruits and Nuts Summary, various years. ¹ Sum of categories may not equal total due to rounding.
Table 14: U .S . Processing-Apple Utilization: Value ($000)
Source: USDA, National Agricultural Statistics Service, USApple, Noncitrus Fruits and Nuts Summary, various years - and Foreign Agricultural Service Global Agricultural Trade System (GATS)¹ Based on a marketing year of July through June. ² Sum of categories may not equal total due to rounding.
Table 15: U .S . Apple Utilization Summary (000 42-lb. Units)
2009 2010 2011 2012 2013
Total Canned $93,235 $112,122 $129,242 $147,908 $127,023
Juice $63,843 $93,937 $125,283 $122,887 $105,489
Dried $4,272 $12,548 $17,192 $19,624 $17,100
Frozen $29,879 $17,648 $32,321 $10,922 $25,704
Fresh Slices $22,571 $25,643 $26,434 $19,313 $32,458
Other Products $4,507 $8,292 $7,313 $6,574 $9,132
TOTAL1 $218,307 $270,190 $337,786 $327,228 $316,906
2009/10 2010/11 2011/12 2012/13 2013/14FORECAST
2014/15
Fresh Production 150,331 149,924 150,050 156,786 161,831 179,699
Fresh Imports¹ 8,855 8,484 8,042 10,572 11,022 9,883
Imports as % of Fresh 6% 6% 5% 7% 7% 6%
Fresh Exports¹ 41,095 43,472 44,055 46,747 44,157 48,519
Exports as % of Fresh 27% 29% 29% 30% 27% 27%
Not Marketed 5,995 1,871 2,548 1,536 2,019 3,218
Total Processed² 74,743 69,195 71,807 55,514 75,460 76,352
Canned 27,576 25,793 26,755 17,831 26,764 27,424
Juice 33,081 30,021 28,771 26,479 33,267 33,339
Dried 3,838 4,179 4,369 5,310 4,071 4,786
Frozen 5,624 4,310 4,536 1,586 5,100 4,652
Fresh Slices 3,307 3,248 5,676 3,045 4,845 4,542
Other 1,317 1,645 1,690 1,257 1,412 1,610
Total Production 231,069 220,990 224,405 213,836 239,326 259,248
2014 Crop: U.S. Utilization and Movement Forecasts

2014 Production & Utilization Analysis 25
Table 16: U .S . Utilization, Movement and Storage Holdings (000 42 lb. Units)
Source: USDA, National Agricultural Statistics Service, Noncitrus Fruits and Nuts Summary and USDA August 12, 2014 Crop Production.¹ All apples not marketed are assumed to be waste or shrinkage and are accounted for in the fall period (prior to Dec. 1).Note: Totals may not add up due to rounding.
2011 2012 2013 2014 FORECAST
UTILIZATION QUANTITY % QUANTITY % QUANTITY % QUANTITY %
TOTAL UTILIZATION
Fresh Exports 44,055 19.6% 46,747 21.9% 44,157 18.5% 48,519 18.7%
Fresh Domestic 105,995 47.2% 110,039 51.5% 117,674 49.2% 131,180 50.6%
Processing 71,807 32.0% 55,514 26.0% 75,460 31.5% 76,352 29.5%
Not Marketed¹ 2,548 1.1% 1,536 0.7% 2,019 0.8% 3,218 1.2%
Total Domestic Production 224,405 100 .0% 213,836 100 .0% 239,326 100 .0% 259,248 100 .0%
ESTIMATED FALL MOVEMENT (BEFORE DEC . 1)
Fresh Exports 14,046 16,538 16,367 19,599
Fresh Domestic 41,514 37,323 39,982 48,911
Processing 33,872 17,968 32,302 37,021
Not Marketed 2,548 1,536 2,019 3,331
Total 91,979 73,365 90,670 108,884
ESTIMATED STORAGE MOVEMENT (AFTER DEC . 1)
Fresh Exports 29,980 30,171 27,790 32,258
Fresh Domestic 64,481 72,716 77,692 75,270
Processing 37,935 37,546 43,157 25,965
Total 132,397 140,433 148,639 150,364
MOVEMENT BY TYPE OF STORAGE
From C.A. Storage 107,441 113,526 124,599 118,787
From Regular Storage 24,956 26,907 24,040 31,576
Total Holdings on Dec . 1 132,397 140,433 148,639 150,364
Processor holdings 37,935 37,546 43,157 41,642
Fresh Holdings 94,461 102,887 105,482 108,721
On Dec. 1, 2014, holdings of 2014 crop apples remaining in storage are forecast to be 150.4 million bushels, representing 58 percent of the total crop. About 79 percent of these holdings would be in controlled-atmo-sphere storage. General utilization, movement and storage data are presented in Table 16.
26 U.S. Apple Association
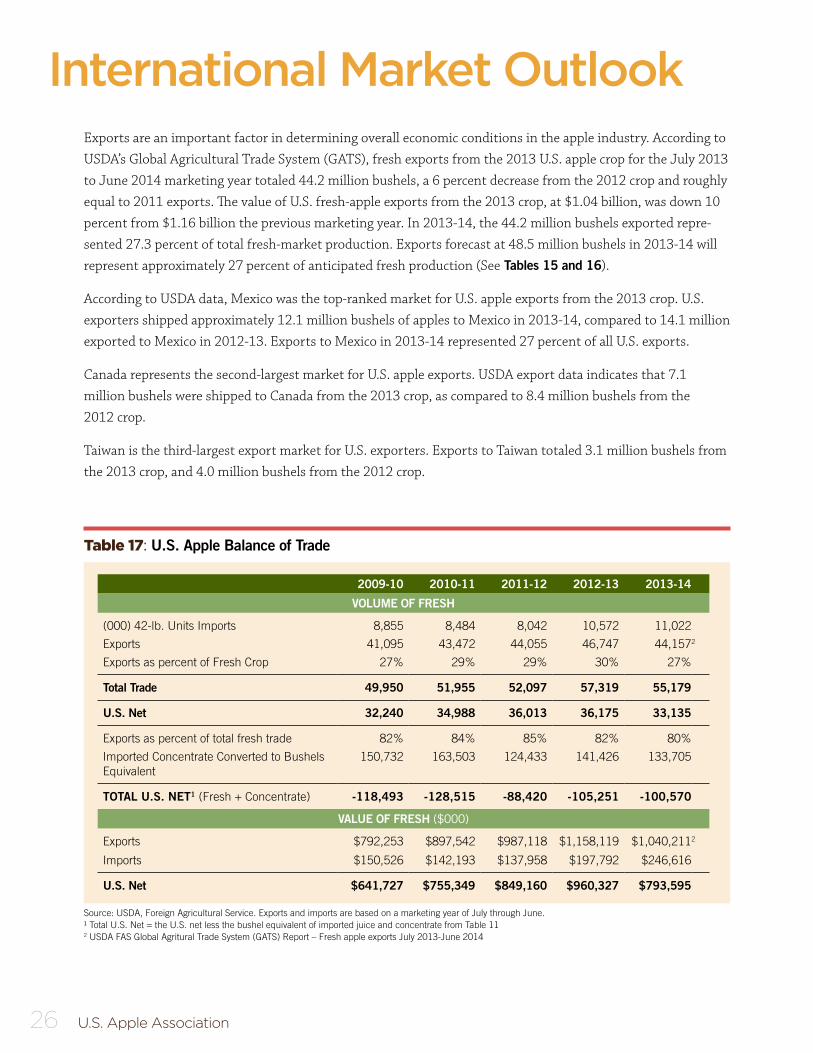
International Market OutlookExports are an important factor in determining overall economic conditions in the apple industry. According to USDA’s Global Agricultural Trade System (GATS), fresh exports from the 2013 U.S. apple crop for the July 2013 to June 2014 marketing year totaled 44.2 million bushels, a 6 percent decrease from the 2012 crop and roughly equal to 2011 exports. The value of U.S. fresh-apple exports from the 2013 crop, at $1.04 billion, was down 10 percent from $1.16 billion the previous marketing year. In 2013-14, the 44.2 million bushels exported repre-sented 27.3 percent of total fresh-market production. Exports forecast at 48.5 million bushels in 2013-14 will represent approximately 27 percent of anticipated fresh production (See Tables 15 and 16).
According to USDA data, Mexico was the top-ranked market for U.S. apple exports from the 2013 crop. U.S. exporters shipped approximately 12.1 million bushels of apples to Mexico in 2013-14, compared to 14.1 million exported to Mexico in 2012-13. Exports to Mexico in 2013-14 represented 27 percent of all U.S. exports.
Canada represents the second-largest market for U.S. apple exports. USDA export data indicates that 7.1 million bushels were shipped to Canada from the 2013 crop, as compared to 8.4 million bushels from the 2012 crop.
Taiwan is the third-largest export market for U.S. exporters. Exports to Taiwan totaled 3.1 million bushels from the 2013 crop, and 4.0 million bushels from the 2012 crop.
Source: USDA, Foreign Agricultural Service. Exports and imports are based on a marketing year of July through June.¹ Total U.S. Net = the U.S. net less the bushel equivalent of imported juice and concentrate from Table 112 USDA FAS Global Agritural Trade System (GATS) Report – Fresh apple exports July 2013-June 2014
Table 17: U .S . Apple Balance of Trade
2009-10 2010-11 2011-12 2012-13 2013-14
VOLUME OF FRESH
(000) 42-lb. Units Imports 8,855 8,484 8,042 10,572 11,022
Exports 41,095 43,472 44,055 46,747 44,1572
Exports as percent of Fresh Crop 27% 29% 29% 30% 27%
Total Trade 49,950 51,955 52,097 57,319 55,179
U .S . Net 32,240 34,988 36,013 36,175 33,135
Exports as percent of total fresh trade 82% 84% 85% 82% 80%
Imported Concentrate Converted to Bushels Equivalent
150,732 163,503 124,433 141,426 133,705
TOTAL U .S . NET1 (Fresh + Concentrate) -118,493 -128,515 -88,420 -105,251 -100,570
VALUE OF FRESH ($000)
Exports $792,253 $897,542 $987,118 $1,158,119 $1,040,2112
Imports $150,526 $142,193 $137,958 $197,792 $246,616
U .S . Net $641,727 $755,349 $849,160 $960,327 $793,595
2014 Production & Utilization Analysis 27
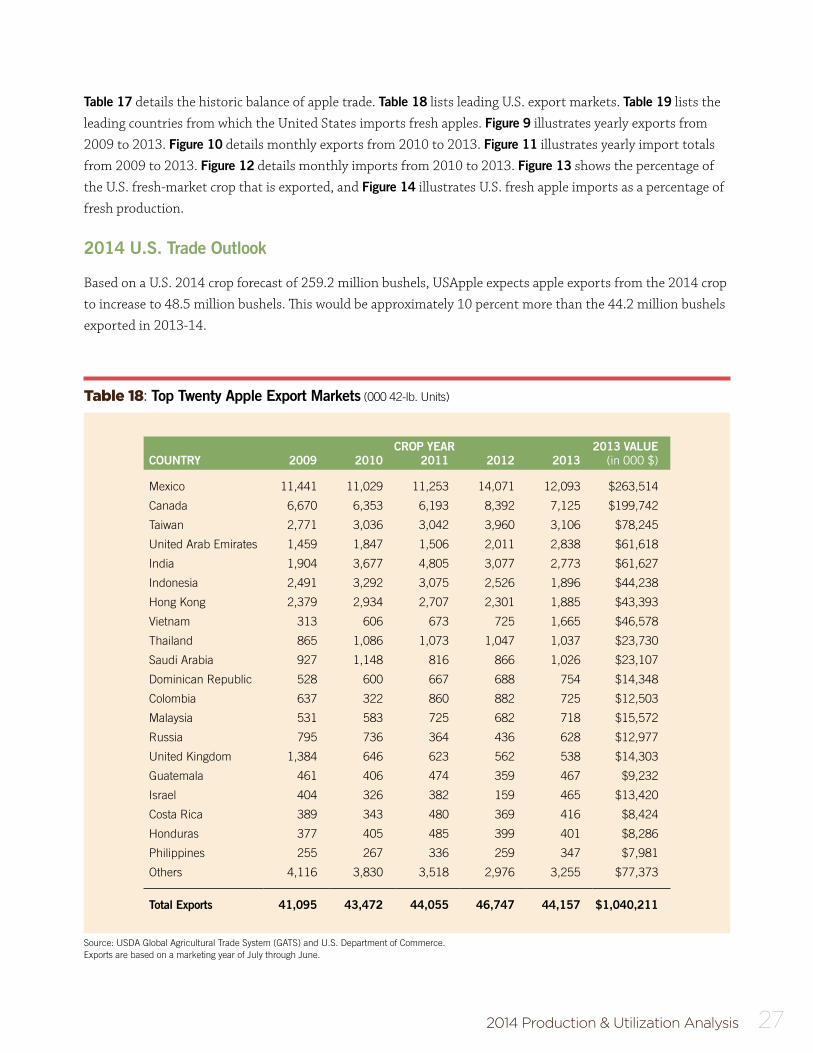
Table 17 details the historic balance of apple trade. Table 18 lists leading U.S. export markets. Table 19 lists the leading countries from which the United States imports fresh apples. Figure 9 illustrates yearly exports from 2009 to 2013. Figure 10 details monthly exports from 2010 to 2013. Figure 11 illustrates yearly import totals from 2009 to 2013. Figure 12 details monthly imports from 2010 to 2013. Figure 13 shows the percentage of the U.S. fresh-market crop that is exported, and Figure 14 illustrates U.S. fresh apple imports as a percentage of fresh production.
2014 U .S . Trade Outlook
Based on a U.S. 2014 crop forecast of 259.2 million bushels, USApple expects apple exports from the 2014 crop to increase to 48.5 million bushels. This would be approximately 10 percent more than the 44.2 million bushels exported in 2013-14.
Source: USDA Global Agricultural Trade System (GATS) and U.S. Department of Commerce.Exports are based on a marketing year of July through June.
Table 18: Top Twenty Apple Export Markets (000 42-lb. Units)
CROP YEAR 2013 VALUECOUNTRY 2009 2010 2011 2012 2013 (in 000 $)
Mexico 11,441 11,029 11,253 14,071 12,093 $263,514
Canada 6,670 6,353 6,193 8,392 7,125 $199,742
Taiwan 2,771 3,036 3,042 3,960 3,106 $78,245
United Arab Emirates 1,459 1,847 1,506 2,011 2,838 $61,618
India 1,904 3,677 4,805 3,077 2,773 $61,627
Indonesia 2,491 3,292 3,075 2,526 1,896 $44,238
Hong Kong 2,379 2,934 2,707 2,301 1,885 $43,393
Vietnam 313 606 673 725 1,665 $46,578
Thailand 865 1,086 1,073 1,047 1,037 $23,730
Saudi Arabia 927 1,148 816 866 1,026 $23,107
Dominican Republic 528 600 667 688 754 $14,348
Colombia 637 322 860 882 725 $12,503
Malaysia 531 583 725 682 718 $15,572
Russia 795 736 364 436 628 $12,977
United Kingdom 1,384 646 623 562 538 $14,303
Guatemala 461 406 474 359 467 $9,232
Israel 404 326 382 159 465 $13,420
Costa Rica 389 343 480 369 416 $8,424
Honduras 377 405 485 399 401 $8,286
Philippines 255 267 336 259 347 $7,981
Others 4,116 3,830 3,518 2,976 3,255 $77,373
Total Exports 41,095 43,472 44,055 46,747 44,157 $1,040,211

28 U.S. Apple Association
Source: USDA Global Agricultural Trade System (GATS) and U.S. Department of Commerce.
Source: USDA Global Agricultural Trade System (GATS) and U.S. Department of Commerce.
Figure 9: U .S . Apple Exports
Figure 11: Apple Imports by year (000 42-lb. units)
Source: USDA Global Agricultural Trade System (GATS) and U.S. Department of Commerce.
Figure 10: U .S . Apple Exports by Month for Various Crop Years
2009 2010 2011 2012 2013
41,095 43,472 44,05546,747
44,157
0
10,000
20,000
30,000
40,000
50,000
6,000
7,000
8,000
9,000
10,000
11,000
12,000
2009 2010 2011 2012 2013
8,855 8,4848,042
10,572 11,022
0
1,000
2,000
3,000
4,000
5,000
6,000
JUL AUG SEP OCT NOV DEC JAN FEB MAR APR MAY JUN
42 -
lb. B
ushe
ls (
000)
42 -
lb. B
ushe
ls (
000)
42 -
lb. B
ushe
ls (
000)
n 2013 Crop Yearn 2012 Crop Yearn 2011 Crop Yearn 2010 Crop Year
International Market Outlook

2014 Production & Utilization Analysis 29
Source: USDA Global Agricultural Trade System (GATS) and U.S. Department of CommerceImports are based on a marketing year of July through June.
Table 19: Apple Imports by Country and Year (000 42-lb. units)
Imports of fresh apples into the United States in 2014-15 are forecast by USApple at 9.9 million 42 lb. cartons, a 10 percent decrease from 2013.
European Crop Outlook
Production in the European Union’s apple-growing countries is forecast at 11.9 million metric tons (624 million bushels) for the 2014 season. This information was developed by the World Apple and Pear Association (WAPA) in conjunction with the Prognosfruit Conference in Istanbul, Turkey from August 6-8, 2014.
The 2014 European forecast is 9 percent greater than 2013, when production was 10.9 million metric tons (573 million bushels). The projected 2014 crop is 13 percent above the five-year average. Apple production for all 28 members of the European Union is reported together.
Source: USDA Global Agricultural Trade System (GATS) and U.S. Department of Commerce.
Figure 12: Apple Imports by Month for Various Crop Years
COUNTRY 2009 2010 2011 2012 2013
Chile 5,685 5,143 5,033 7,201 6,906
New Zealand 1,989 1,848 1,631 2,044 2,443
Canada 903 1,214 1,085 953 1,222
Argentina 215 273 278 373 430
South Africa 0 0 0 1 1
Others 63 6 15 1 20
Total Imports 8,855 8,484 8,042 10,572 11,022
0
500
1,000
1,500
2,000
2,500
3,000
3,500
JUL AUG SEP OCT NOV DEC JAN FEB MAR APR MAY JUN
42 -
lb. B
ushe
ls (
000)
n 2013
n 2012
n 2011
n 2010
30 U.S. Apple Association
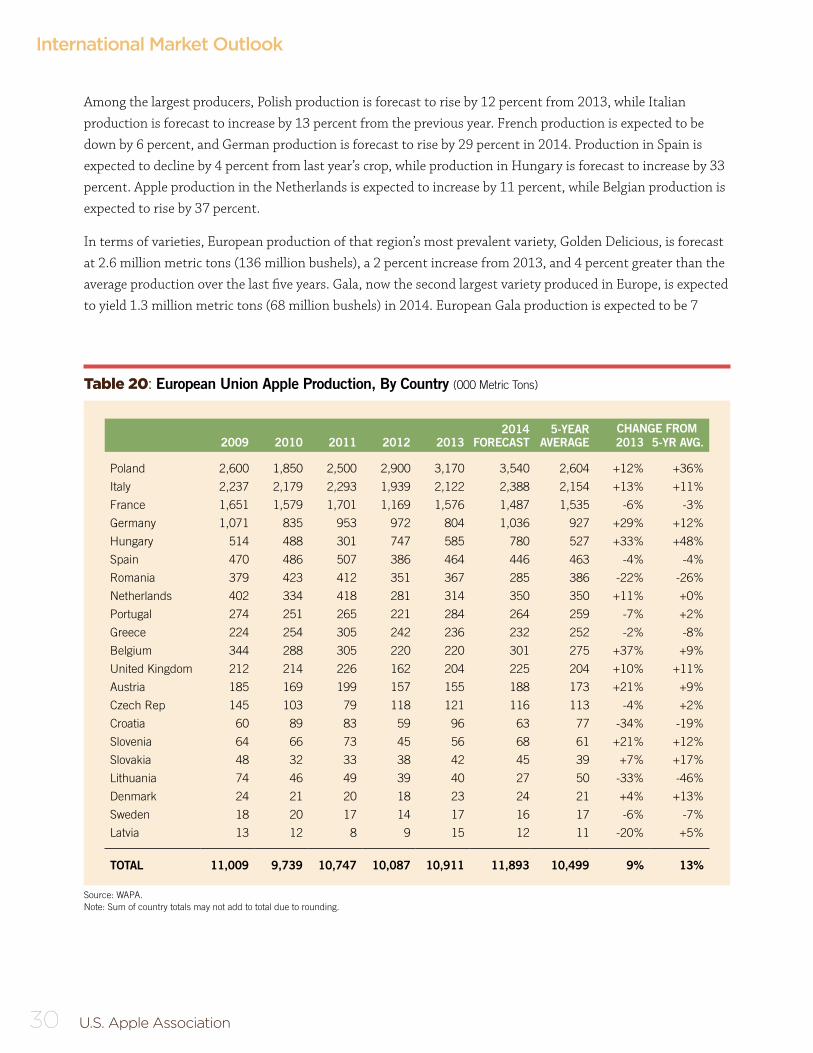
Source: WAPA.Note: Sum of country totals may not add to total due to rounding.
Table 20: European Union Apple Production, By Country (000 Metric Tons)
Among the largest producers, Polish production is forecast to rise by 12 percent from 2013, while Italian production is forecast to increase by 13 percent from the previous year. French production is expected to be down by 6 percent, and German production is forecast to rise by 29 percent in 2014. Production in Spain is expected to decline by 4 percent from last year’s crop, while production in Hungary is forecast to increase by 33 percent. Apple production in the Netherlands is expected to increase by 11 percent, while Belgian production is expected to rise by 37 percent.
In terms of varieties, European production of that region’s most prevalent variety, Golden Delicious, is forecast at 2.6 million metric tons (136 million bushels), a 2 percent increase from 2013, and 4 percent greater than the average production over the last five years. Gala, now the second largest variety produced in Europe, is expected to yield 1.3 million metric tons (68 million bushels) in 2014. European Gala production is expected to be 7
2014FORECAST
5-YEARAVERAGE
CHANGE FROM2009 2010 2011 2012 2013 2013 5-YR AVG .
Poland 2,600 1,850 2,500 2,900 3,170 3,540 2,604 +12% +36%
Italy 2,237 2,179 2,293 1,939 2,122 2,388 2,154 +13% +11%
France 1,651 1,579 1,701 1,169 1,576 1,487 1,535 -6% -3%
Germany 1,071 835 953 972 804 1,036 927 +29% +12%
Hungary 514 488 301 747 585 780 527 +33% +48%
Spain 470 486 507 386 464 446 463 -4% -4%
Romania 379 423 412 351 367 285 386 -22% -26%
Netherlands 402 334 418 281 314 350 350 +11% +0%
Portugal 274 251 265 221 284 264 259 -7% +2%
Greece 224 254 305 242 236 232 252 -2% -8%
Belgium 344 288 305 220 220 301 275 +37% +9%
United Kingdom 212 214 226 162 204 225 204 +10% +11%
Austria 185 169 199 157 155 188 173 +21% +9%
Czech Rep 145 103 79 118 121 116 113 -4% +2%
Croatia 60 89 83 59 96 63 77 -34% -19%
Slovenia 64 66 73 45 56 68 61 +21% +12%
Slovakia 48 32 33 38 42 45 39 +7% +17%
Lithuania 74 46 49 39 40 27 50 -33% -46%
Denmark 24 21 20 18 23 24 21 +4% +13%
Sweden 18 20 17 14 17 16 17 -6% -7%
Latvia 13 12 8 9 15 12 11 -20% +5%
TOTAL 11,009 9,739 10,747 10,087 10,911 11,893 10,499 9% 13%
International Market Outlook

2014 Production & Utilization Analysis 31
Source: WAPA.Note: Column totals reflect EU production as listed in Table 20.
Table 21: European Union Apple Production, By Variety (000 Metric Tons)
2014FORECAST
5-YEARAVERAGE
CHANGE FROM2009 2010 2011 2012 2013 2013 5-YR AVG .
Golden Delicious 2,636 2,413 2,628 2,290 2,530 2,587 2,499 +2% +4%
Gala 1,077 989 1,137 1,114 1,204 1,294 1,104 +7% +17%
Idared 828 619 692 983 1,054 1,096 835 +4% +31%
Red Delicious 724 663 680 542 597 635 641 +6% -1%
Jonagold 742 544 652 475 500 562 583 +12% -4%
Shampion 323 257 327 423 457 481 357 +5% +35%
Jonagored 204 180 194 367 341 443 257 +30% +72%
Elstar 488 362 453 353 346 426 400 +23% +6%
Granny Smith 343 342 413 302 361 356 352 -1% +1%
Braeburn 338 289 324 264 302 313 303 +4% +3%
Fuji 245 251 261 212 311 317 256 +2% +24%
Cripps Pink 162 160 184 144 187 220 167 +18% +31%
Gloster 114 112 148 187 196 200 151 +2% +32%
Jonathan 305 282 242 201 178 164 242 -8% -32%
Reinette Grise 99 101 108 73 121 116 100 -4% +16%
Red Jonaprince 38 29 33 48 53 97 40 +83% +141%
Bramley 95 95 91 59 70 83 82 +19% +1%
Boskoop 82 60 73 58 58 81 66 +40% +22%
Pinova 35 27 37 43 62 76 41 +23% +86%
Morgenduft 67 81 61 53 57 83 64 +46% +30%
Annurca 35 34 35 35 35 35 35 +0% +1%
Cox Orange 65 89 89 38 42 33 65 -21% -49%
Lobo 100 61 100 50 30 30 68 +0% -56%
Cortland 80 50 70 40 25 25 53 +0% -53%
Stayman 16 18 17 12 18 15 16 -17% -7%
Spartan 8 6 6 6 6 6 6 +0% -6%
Other 1,652 1,494 1,541 1,364 1,304 1,682 1,471 +29% +14%
Other New Varieties 108 134 152 350 467 437 275 -6% +59%
TOTAL 11,009 9,742 10,748 10,086 10,912 11,893 10,499 +9% +13%
percent greater than in 2013, and 17 percent above the five-year average. Red Delicious, the fourth most popular European variety, is forecast at 635,000 metric tons (33 million bushels) and is expected to increase by 6 percent from last year but will be 1 percent below the five-year average. Jonagold production, forecast at 562,000 metric tons (29 million bushels), is up 12 percent from last year but 4 percent below the five-year average.
Table 20 shows historical European production by country, while Table 21 denotes historical European production by variety. Table 22 shows production in other European and perimeter countries which are not members of the EU.

32 U.S. Apple Association
Source: The Ontario Ministry of Agriculture and Rural Affairs, Federation des Producteurs de Pommes du Quebec, New Brunswick Apple Marketing Board and Nova Scotia Fruit Growers Association. British Columbia data are adjusted BC Tree Fruit Estimates.
Table 23: Canadian Apple Production, by Province (000 42-lb. Units)
2014FORECAST
5-YEARAVERAGE
CHANGE FROMPROVINCE 2009 2010 2011 2012 2013 2013 5-YR AVG .
Ontario 8,887 9,796 7,622 8,567 9,543 8,960 8,883 -6% +1%
Quebec 5,176 5,404 5,543 5,786 5,920 5,772 5,566 -3% +4%
British Columbia 3,056 3,579 4,502 4,439 3,838 4,457 3,883 +16% +15%
Nova Scotia 2,365 2,350 2,282 2,030 2,120 2,243 2,229 +6% +1%
New Brunswick 144 144 173 173 168 171 160 +1% +6%
Total 19,628 21,273 20,122 20,995 21,589 21,602 20,722 +0% +4%
Source: WAPA.Note: Sum of country totals may not add to total due to rounding.NC = Change of less than one percent.
Table 22: Other European and Perimeter Countries Apple Production, By Country (000 Metric Tons)
2014FORECAST
5-YEARAVERAGE
CHANGE FROM2009 2010 2011 2012 2013 2013 5-YR AVG .
China 31,681 33,263 35,985 38,500 37,500 35,000 35,386 -7% -1%
Turkey 2,518 2,402 2,432 2,445 2,681 2,033 2,496 -24% -19%
Russia 1,775 1,233 1,500 1,622 1,647 1,716 1,555 4% 10%
Ukraine 854 851 954 1,126 1,177 1,300 992 10% 31%
Mexico 561 585 631 375 522 350 535 -33% -35%
Moldova 210 208 269 282 260 285 246 10% 16%
Serbia 282 240 266 179 265 250 246 -6% 1%
Macedonia 106 122 128 140 153 85 130 -44% -35%
Belarus 250 150 180 171 145 160 179 10% -11%
Switzerland 167 127 155 141 132 153 144 16% 6%
Bosnia-Herzegovina 72 52 46 17 46 33 47 -28% -29%
TOTAL 38,476 39,233 42,546 44,998 44,528 41,365 41,956 -7 .6% -1%
Canadian Crop Outlook
Total Canadian apple production for the 2014 crop is forecast at 21.6 million bushels, roughly the same as the 2013 crop. Compared to the five-year average, 2014 production is expected to rise by 4 percent. Ontario production is slated to decrease by 6 percent to 9.0 million bushels in 2014, which is 1 percent above the five-year average. British Columbia production is expected to increase to 4 million bushels in 2014, up 0 percent from 2013, and 15 percent above the five-year average. Quebec production is forecast at 5.8 million bushels
International Market Outlook

2014 Production & Utilization Analysis 33
Source: The Ontario Ministry of Agriculture and Rural Affairs, Federation des Producteurs de Pommes du Quebec, New Brunswick Apple Marketing Board,and Nova Scotia Fruit Growers Association. British Columbia data are adjusted BC Tree Fruit estimates.Data for all provinces include processing apples in each variety estimate.Note: Columns may not add to total due to rounding.F = Forecast* Pink Lady added in 2012
Table 24: Canadian Apple Production, By Variety (000 42-lb. Units)
British Columbia Ontario Quebec New Brunswick Nova Scotia Canadian Total
2013 2014F 2013 2014F 2013 2014F 2013 2014F 2013 2014F 2013 2014F
McIntosh 320 369 1,755 1,627 3,611 3,528 90 91 480 500 6,256 6,115
Gala 1,360 1,600 470 475 163 160 0 0 65 65 2,058 2,300
Spy 0 0 1,690 1,698 0 0 0 0 300 300 1,990 1,998
Empire 0 0 1,227 1,314 317 278 0 0 0 0 1,544 1,592
Cortland 0 0 183 191 474 503 48 49 400 400 1,105 1,143
Spartan 383 440 171 155 519 486 0 0 25 25 1,098 1,106
Red Delicious 255 294 663 600 0 0 0 0 85 100 1,003 994
Honeycrisp™ 51 60 532 550 97 105 0 0 150 250 830 965
Idared 0 0 443 365 0 0 0 0 255 255 698 620
Ambrosia 400 460 96 111 0 0 0 0 0 0 497 571
Golden Delicious 121 139 257 189 0 0 0 0 40 50 418 378
Paula Red 0 0 0 0 235 237 0 0 0 0 235 237
Fuji 119 140 41 16 0 0 0 0 0 0 160 156
Granny Smith 85 98 0 0 0 0 0 0 0 0 85 98
Crispin/Mutsu 0 0 131 98 0 0 0 0 0 0 131 98
Jonagold 13 15 109 74 0 0 0 0 0 0 122 89
Gravenstein 0 0 0 0 0 0 0 0 70 48 70 48
Pink Lady* 16 19 0 0 0 0 0 0 0 0 16 19
Braeburn 3 4 0 0 0 0 0 0 0 0 3 4
Others 31 37 275 246 504 475 30 31 250 250 1,090 1,039
Juice 680 782 1,500 1,250 0 0 0 0 0 0 2,180 2,032
Total 3,838 4,457 9,543 8,960 5,920 5,772 168 171 2,120 2,243 21,589 21,602
in 2014, down 3 percent from 2013, but up 4 percent from the five-year average. Nova Scotia production is estimated at 2.2 million bushels, up 6 percent from 2013, and 1 percent above the five-year average. In New Brunswick, production is expected at 171,000 bushels, up 1 percent from 2013 production, and up 6 percent from the five-year average.
Varietal production in Canada is dominated by McIntosh, which makes up approximately 28 percent of total Canadian apple production. The 2014 McIntosh crop in Canada is forecast to decrease by 2 percent over the 2013 crop. Gala, the second-most widely grown variety this year, is up 12 percent from 2013 production levels. Red Delicious, has fallen to seventh place, and production is expected decrease by 1 percent from 2013. The

34 U.S. Apple Association
Source: USDA Global Agricultural Trade System (GATS) and U.S. Department of CommerceMarketing year is July through June.
Source: USDA Global Agricultural Trade System (GATS) and U.S. Department of CommerceMarketing year is July through June.
Figure 13: U .S . Fresh Apple Exports as Percent of Fresh Production
Figure 14: U .S . Fresh Apple Imports as Percent of Fresh Production
42 -
lb. B
ushe
ls (
000)
42 -
lb. B
ushe
ls (
000)
2008 2010 2011 2012 20132009
23.8%
29.0%29.4% 29.8%
27.3%27.3%
15%
20%
25%
30%
3.0%
4.0%
5.0%
6.0%
7.0%
8.0%
9.0%
10.0%
11.0%
12.0%
2008 2010 2011 2012 20132009
6.2% 5.7%5.4%
6.7% 6.8%
5.9%
International Market Outlook
forecast for other important varieties in 2014 compared to 2013 follows: Empire up 3 percent, Spartan up 1 percent, Spy steady with 2013, Idared down 11 percent, and Cortland up 3 percent.
Table 23 shows historical Canadian apple production by province, and Table 24 shows Canadian apple produc-tion by variety.
2014 Production & Utilization Analysis 35
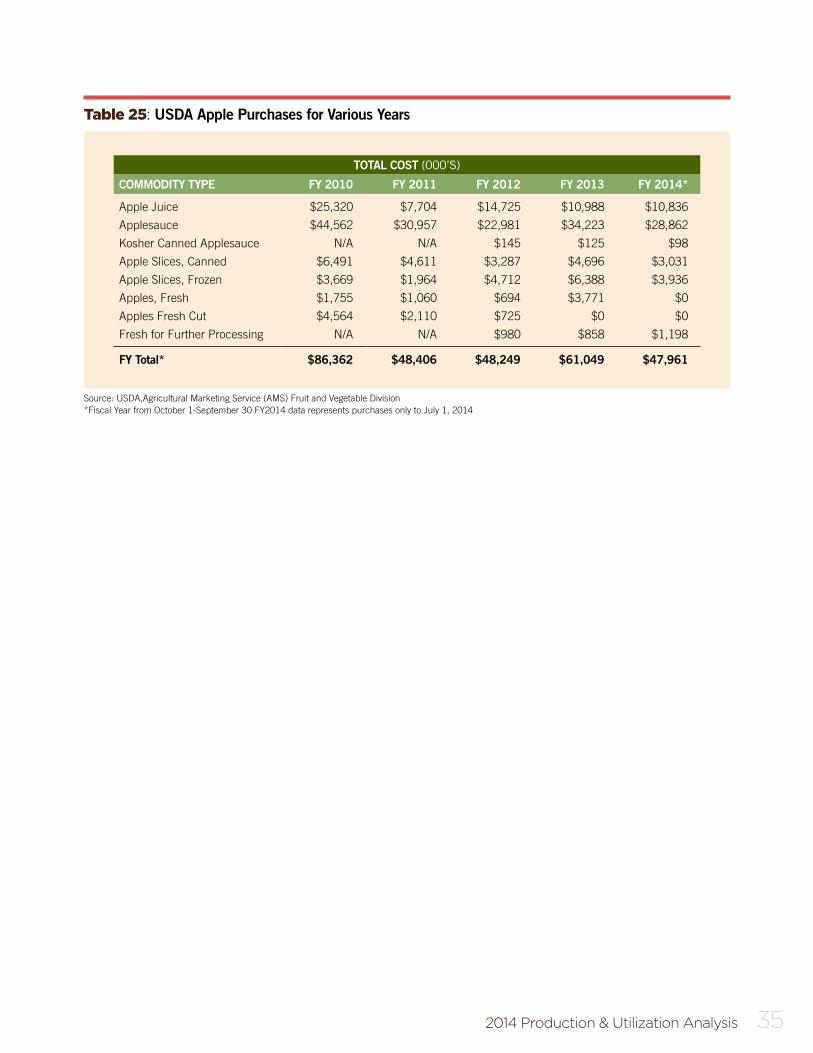
Table 25: USDA Apple Purchases for Various Years
TOTAL COST (000’S)
COMMODITY TYPE FY 2010 FY 2011 FY 2012 FY 2013 FY 2014*
Apple Juice $25,320 $7,704 $14,725 $10,988 $10,836
Applesauce $44,562 $30,957 $22,981 $34,223 $28,862
Kosher Canned Applesauce N/A N/A $145 $125 $98
Apple Slices, Canned $6,491 $4,611 $3,287 $4,696 $3,031
Apple Slices, Frozen $3,669 $1,964 $4,712 $6,388 $3,936
Apples, Fresh $1,755 $1,060 $694 $3,771 $0
Apples Fresh Cut $4,564 $2,110 $725 $0 $0
Fresh for Further Processing N/A N/A $980 $858 $1,198
FY Total* $86,362 $48,406 $48,249 $61,049 $47,961
Source: USDA,Agricultural Marketing Service (AMS) Fruit and Vegetable Division*Fiscal Year from October 1-September 30 FY2014 data represents purchases only to July 1, 2014

36 U.S. Apple Association
Appendix AMonthly Apple-Juice Concentrate Price Ranges, 1999 - 2014 ($US per Gallon 70 Brix)
1999 JAN FEB MAR APR MAY JUN JUL AUG SEP OCT NOV DEC
European, Ex-Dock, NY 7.50 7.50 7.50 5.75 5.75 5.75 5.75 5.75 5.75 7.90 7.90 7.907.50 6.25 6.25 6.25 6.25 6.50 8.50 8.50 8.50
South American, Ex-Dock, NY 5.50 5.50 5.50 5.50 5.50 5.50 5.25 5.25 5.256.00 6.00 6.00 5.75 5.75 5.75 5.50 5.50 5.75
Chinese, Ex-Dock, NY 4.25 4.25 4.25 4.10 4.15 4.15 4.15 4.15 4.255.00 5.00 5.00 4.90 4.90 4.90 4.90 4.90 5.00
U.S.A. FOB, Northwest 4.25 4.25 4.75 4.75 4.75 4.75 4.75 4.75 5.00 7.00 7.00 7.005.00
2000 JAN FEB MAR APR MAY JUN JUL AUG SEP OCT NOV DEC
European, Ex-Dock, NY 7.90 7.90 7.90 7.90 6.20 6.20 5.75 5.50 5.25 5.15 5.258.50 8.50 8.50 8.50 6.80 6.80 6.00 6.00 5.50 5.25 5.50
South American, Ex-Dock, NY 6.00 5.75 5.75 5.75 5.00 5.00 5.006.80 6.50 6.50 6.25 5.25 5.25 5.25
Chinese, Ex-Dock, NY 5.35 4.50 5.00 5.00 4.75 5.00 5.005.95 5.50 5.40 5.40 5.00 5.25 5.25
U.S.A. FOB, Northwest 7.00 7.00 7.00 6.75 6.75 6.00 5.50 5.50 5.50 4.75 5.007.00 7.00 6.25 6.00 6.00 6.00 5.00 5.25
2001 JAN FEB MAR APR MAY JUN JUL AUG SEP OCT NOV DEC
European, Ex-Dock, NY 5.25 5.00 5.00 5.25 4.75 4.35 4.25 4.25 4.50 4.50 4.50 4.505.50 5.25 5.25 5.50 5.25 5.00 5.00 5.00 5.00 4.75 4.75 4.75
South American, Ex-Dock, NY 5.00 4.50 4.50 4.25 4.00 4.00 4.00 4.00 4.00 4.25 4.25 4.505.50 4.75 4.75 4.50 4.50 4.25 4.25 4.25 4.25 4.50 4.50 4.75
Chinese, Ex-Dock, NY 5.00 4.50 4.50 4.00 3.75 3.75 4.00 4.00 4.25 4.25 4.255.25 4.75 4.75 4.25 4.00 4.25 4.25 4.25 4.50 4.50 4.75
U.S.A. FOB, Northwest 5.00 4.50 4.50 4.25 4.00 4.00 4.00 4.00 4.00 4.25 4.25 4.505.25 5.00 4.75 4.50 4.50 4.25 4.25 4.25 4.25 4.50 4.50 4.75
2002 JAN FEB MAR APR MAY JUN JUL AUG SEP OCT NOV DEC
European, Ex-Dock, NY 4.50 4.50 4.50 4.50 4.50 4.45 4.45 4.50 4.50 4.50 4.55 4.554.75 N/A N/A 4.75 4.75 4.75 4.75 4.75 4.75 5.00 4.80 4.95
South American, Ex-Dock, NY 4.50 4.20 4.25 4.25 4.25 4.35 4.35 4.25 4.25 4.40 4.40 4.404.75 4.50 4.55 4.55 4.55 4.55 4.75 4.75 4.75 4.80 4.85 4.85
Chinese, Ex-Dock, NY 4.25 4.00 4.00 4.00 4.00 4.00 4.25 4.00 4.00 4.25 4.25 4.254.75 4.50 4.50 4.50 4.50 4.50 4.50 4.50 4.50 4.75 4.65 4.50
U.S.A. FOB, Northwest 4.50 4.25 4.25 4.20 4.20 4.20 4.50 4.50 4.50 4.50 4.50 4.504.75 4.75 4.75 4.75 4.75 4.75 4.75 4.75 4.75 5.00 5.00 5.25
Source: The Food Institute¹ Apple juice concentrate prices are segregated by country of origin.² N/A indicates that data is unavailable.
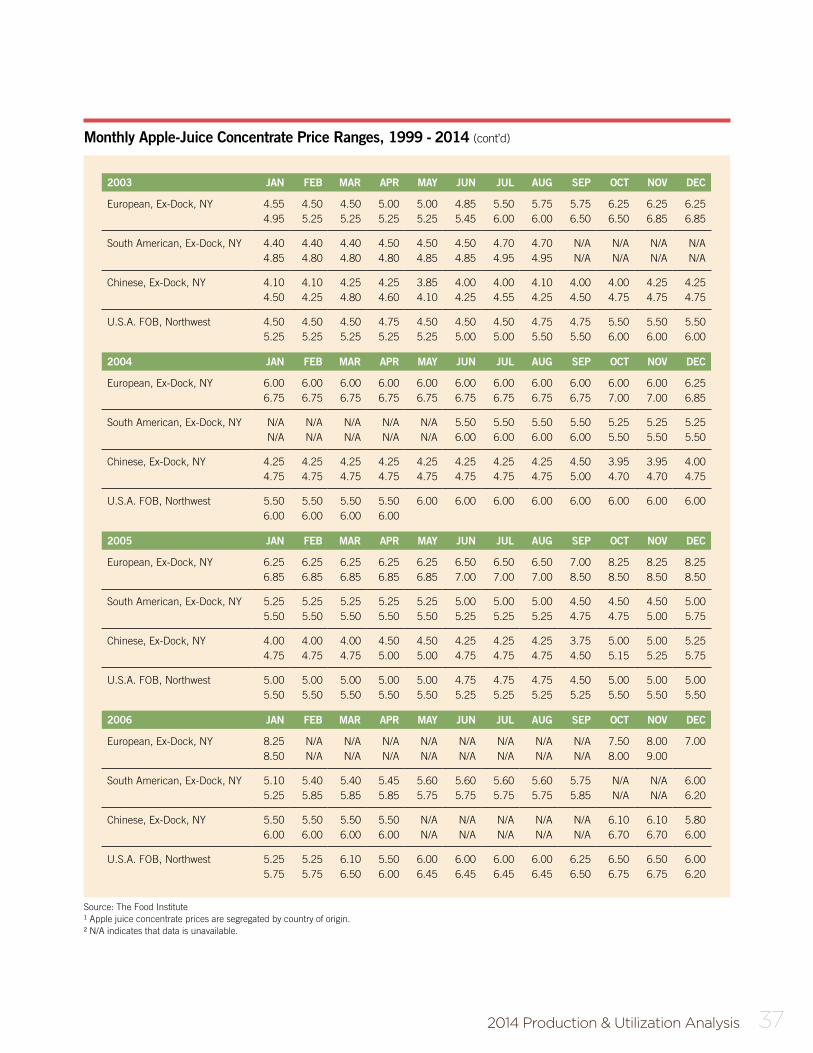
2014 Production & Utilization Analysis 37
Monthly Apple-Juice Concentrate Price Ranges, 1999 - 2014 (cont’d)
2003 JAN FEB MAR APR MAY JUN JUL AUG SEP OCT NOV DEC
European, Ex-Dock, NY 4.55 4.50 4.50 5.00 5.00 4.85 5.50 5.75 5.75 6.25 6.25 6.254.95 5.25 5.25 5.25 5.25 5.45 6.00 6.00 6.50 6.50 6.85 6.85
South American, Ex-Dock, NY 4.40 4.40 4.40 4.50 4.50 4.50 4.70 4.70 N/A N/A N/A N/A4.85 4.80 4.80 4.80 4.85 4.85 4.95 4.95 N/A N/A N/A N/A
Chinese, Ex-Dock, NY 4.10 4.10 4.25 4.25 3.85 4.00 4.00 4.10 4.00 4.00 4.25 4.254.50 4.25 4.80 4.60 4.10 4.25 4.55 4.25 4.50 4.75 4.75 4.75
U.S.A. FOB, Northwest 4.50 4.50 4.50 4.75 4.50 4.50 4.50 4.75 4.75 5.50 5.50 5.505.25 5.25 5.25 5.25 5.25 5.00 5.00 5.50 5.50 6.00 6.00 6.00
2004 JAN FEB MAR APR MAY JUN JUL AUG SEP OCT NOV DEC
European, Ex-Dock, NY 6.00 6.00 6.00 6.00 6.00 6.00 6.00 6.00 6.00 6.00 6.00 6.256.75 6.75 6.75 6.75 6.75 6.75 6.75 6.75 6.75 7.00 7.00 6.85
South American, Ex-Dock, NY N/A N/A N/A N/A N/A 5.50 5.50 5.50 5.50 5.25 5.25 5.25N/A N/A N/A N/A N/A 6.00 6.00 6.00 6.00 5.50 5.50 5.50
Chinese, Ex-Dock, NY 4.25 4.25 4.25 4.25 4.25 4.25 4.25 4.25 4.50 3.95 3.95 4.004.75 4.75 4.75 4.75 4.75 4.75 4.75 4.75 5.00 4.70 4.70 4.75
U.S.A. FOB, Northwest 5.50 5.50 5.50 5.50 6.00 6.00 6.00 6.00 6.00 6.00 6.00 6.006.00 6.00 6.00 6.00
2005 JAN FEB MAR APR MAY JUN JUL AUG SEP OCT NOV DEC
European, Ex-Dock, NY 6.25 6.25 6.25 6.25 6.25 6.50 6.50 6.50 7.00 8.25 8.25 8.256.85 6.85 6.85 6.85 6.85 7.00 7.00 7.00 8.50 8.50 8.50 8.50
South American, Ex-Dock, NY 5.25 5.25 5.25 5.25 5.25 5.00 5.00 5.00 4.50 4.50 4.50 5.005.50 5.50 5.50 5.50 5.50 5.25 5.25 5.25 4.75 4.75 5.00 5.75
Chinese, Ex-Dock, NY 4.00 4.00 4.00 4.50 4.50 4.25 4.25 4.25 3.75 5.00 5.00 5.254.75 4.75 4.75 5.00 5.00 4.75 4.75 4.75 4.50 5.15 5.25 5.75
U.S.A. FOB, Northwest 5.00 5.00 5.00 5.00 5.00 4.75 4.75 4.75 4.50 5.00 5.00 5.005.50 5.50 5.50 5.50 5.50 5.25 5.25 5.25 5.25 5.50 5.50 5.50
2006 JAN FEB MAR APR MAY JUN JUL AUG SEP OCT NOV DEC
European, Ex-Dock, NY 8.25 N/A N/A N/A N/A N/A N/A N/A N/A 7.50 8.00 7.008.50 N/A N/A N/A N/A N/A N/A N/A N/A 8.00 9.00
South American, Ex-Dock, NY 5.10 5.40 5.40 5.45 5.60 5.60 5.60 5.60 5.75 N/A N/A 6.005.25 5.85 5.85 5.85 5.75 5.75 5.75 5.75 5.85 N/A N/A 6.20
Chinese, Ex-Dock, NY 5.50 5.50 5.50 5.50 N/A N/A N/A N/A N/A 6.10 6.10 5.806.00 6.00 6.00 6.00 N/A N/A N/A N/A N/A 6.70 6.70 6.00
U.S.A. FOB, Northwest 5.25 5.25 6.10 5.50 6.00 6.00 6.00 6.00 6.25 6.50 6.50 6.005.75 5.75 6.50 6.00 6.45 6.45 6.45 6.45 6.50 6.75 6.75 6.20
Source: The Food Institute¹ Apple juice concentrate prices are segregated by country of origin.² N/A indicates that data is unavailable.

38 U.S. Apple Association
Monthly Apple-Juice Concentrate Price Ranges, 1999 - 2014 (cont’d)
Source: The Food Institute¹ Apple juice concentrate prices are segregated by country of origin.² N/A indicates that data is unavailable.
2007 JAN FEB MAR APR MAY JUN JUL AUG SEP OCT NOV DEC
European, Ex-Dock, NY 7.00 N/A N/A 7.25 7.00 7.25 N/A 15.00 15.00 15.00 15.00 16.0016.00 16.00 16.00 16.00 17.00
South American, Ex-Dock, NY 6.00 6.15 6.30 6.30 6.25 6.25 N/A N/A N/A N/A N/A N/A6.20 6.35 6.50 6.50 N/A N/A N/A N/A N/A N/A
Chinese, Ex-Dock, NY 5.80 6.05 6.25 6.25 6.25 6.00 N/A 9.00 9.50 9.50 9.50 10.006.00 6.25 6.50 6.50 N/A 10.00 10.00 10.50 10.50
U.S.A. FOB, Northwest 6.00 5.25 5.25 6.00 6.00 6.00 6.00 N/A 6.25 6.25 6.25 6.256.20 5.50 5.50
2008 JAN FEB MAR APR MAY JUN JUL AUG SEP OCT NOV DEC
European, Ex-Dock, NY N/A N/A N/A N/A N/A N/A N/A N/A N/A N/A N/A N/AN/A N/A N/A N/A N/A N/A N/A N/A N/A N/A N/A N/A
South American, Ex-Dock, NY N/A N/A N/A 11.00 11.00 10.50 10.00 10.00 7.50 6.50 6.00 6.00N/A N/A N/A 11.00 11.00 11.50 8.00 6.75 6.25 6.25
Chinese, Ex-Dock, NY 9.50 10.00 9.50 10.00 10.00 10.50 10.50 9.50 6.50 6.00 5.00 5.0010.50 10.00 7.00 6.25 5.25 5.25
U.S.A. FOB, Northwest 10.00 10.50 10.50 11.00 12.50 12.00 11.50 11.50 N/A N/A N/A N/A11.00 11.00 11.50 13.50 13.00 12.00 12.00 N/A N/A N/A N/A
2009 JAN FEB MAR APR MAY JUN JUL AUG SEP OCT NOV DEC
European, Ex-Dock, NY N/A N/A N/A N/A 8.00 8.00 8.00 8.00 8.00 8.00 N/A N/A
South American, Ex-Dock, NY 6.00 6.00 5.00 5.00 5.00 5.25 5.25 5.25 5.25 5.25 5.25 5.256.25 6.25 5.25 5.25 5.25 5.50 5.50 5.50 5.50 5.50 5.50 5.50
Chinese, Ex-Dock, NY 4.00 4.20 4.20 4.20 4.20 4.50 4.50 5.00 4.75 4.75 5.00 5.254.40 4.25 4.25 4.25 4.25 5.00 5.00 5.00 5.00 5.00 5.25 5.50
U.S.A. FOB, Northwest N/A N/A N/A N/A N/A N/A N/A N/A N/A N/A N/A N/A
2010 JAN FEB MAR APR MAY JUN JUL AUG SEP OCT NOV DEC
European, Ex-Dock, NY N/A N/A N/A N/A N/A N/A N/A N/A N/A N/A N/A N/A
South American, Ex-Dock, NY 5.25 N/A N/A 6.00 6.00 6.00 6.00 6.00 6.00 N/A N/A 11.005.50 N/A N/A N/A N/A N/A N/A N/A N/A N/A N/A 11.25
Chinese, Ex-Dock, NY 5.25 5.30 5.30 5.40 5.40 5.45 5.50 5.50 5.80 8.75 9.50 11.005.50 5.50 5.50 5.55 5.55 5.50 5.75 5.75 5.85 N/A 10.00 11.60
U.S.A. FOB, Northwest N/A N/A N/A N/A N/A 6.50 6.50 7.50 7.50 N/A N/A N/A
Appendix A

2014 Production & Utilization Analysis 39
Monthly Apple-Juice Concentrate Price Ranges, 1999 - 2014 (cont’d)
Source: The Food Institute¹ Apple juice concentrate prices are segregated by country of origin.² N/A indicates that data is unavailable.
2011 JAN FEB MAR APR MAY JUN JUL AUG SEP OCT NOV DEC
European, Ex-Dock, NY N/A N/A N/A N/A N/A N/A N/A N/A N/A N/A N/A N/A
South American, Ex-Dock, NY N/A N/A 10.50 10.50 10.50 10.50 10.00 10.00 10 9.5 N/A N/A N/A N/A N/A N/A N/A N/A N/A N/A
Chinese, Ex-Dock, NY 10.50 10.50 10.60 10.60 10.90 10.50 10.25 10.25 10.25 10.50 12.25 12.2511.50 11.50 10.95 10.95 11.00 10.50 10.50 10.50 11.50
U.S.A. FOB, Northwest N/A N/A N/A N/A N/A N/A N/A N/A N/A N/A N/A N/A
2012 JAN FEB MAR APR MAY JUN JUL AUG SEP OCT NOV DEC
European, Ex-Dock, NY N/A N/A N/A N/A N/A N/A N/A N/A N/A N/A N/A N/A
South American, Ex-Dock, NY N/A N/A N/A 10.85 N/A N/A N/A N/A N/A 8.93 8.93 N/A N/A N/A N/A N/A N/A N/A N/A
Chinese, Ex-Dock, NY 12.00 11.25 10.50 10.50 10.25 10.25 10.00- 10.00- 9.85 9.85 9.85 9.4512.00 10.50 10.50 10.50 10.50
U.S.A. FOB, Northwest N/A N/A N/A N/A N/A N/A N/A N/A N/A N/A N/A N/A
2013 JAN FEB MAR APR MAY JUN JUL AUG SEP OCT NOV DEC
European, Ex-Dock, NY N/A N/A N/A N/A N/A N/A N/A N/A N/A N/A N/A N/A
South American, Ex-Dock, NY N/A N/A N/A N/A N/A N/A N/A N/A N/A N/A N/A N/A N/A N/A N/A N/A N/A N/A
Chinese, Ex-Dock, NY 8.75 8.75 7.00 7.00 7.00 8.00 8.00 8.00 8.00 8.00 8.50 8.50
U.S.A. FOB, Northwest N/A N/A N/A N/A N/A N/A N/A N/A N/A N/A 9.00 9.00
2014 JAN FEB MAR APR MAY JUN JUL AUG SEP OCT NOV DEC
European, Ex-Dock, NY N/A N/A N/A N/A N/A 7.85
South American, Ex-Dock, NY N/A N/A N/A N/A N/A N/A
Chinese, Ex-Dock, NY 8.50 8.50 8.00 8.00 7.63 7.40
U.S.A. FOB, Northwest 8.50 8.50 8.25 8.25 7.38 7.38
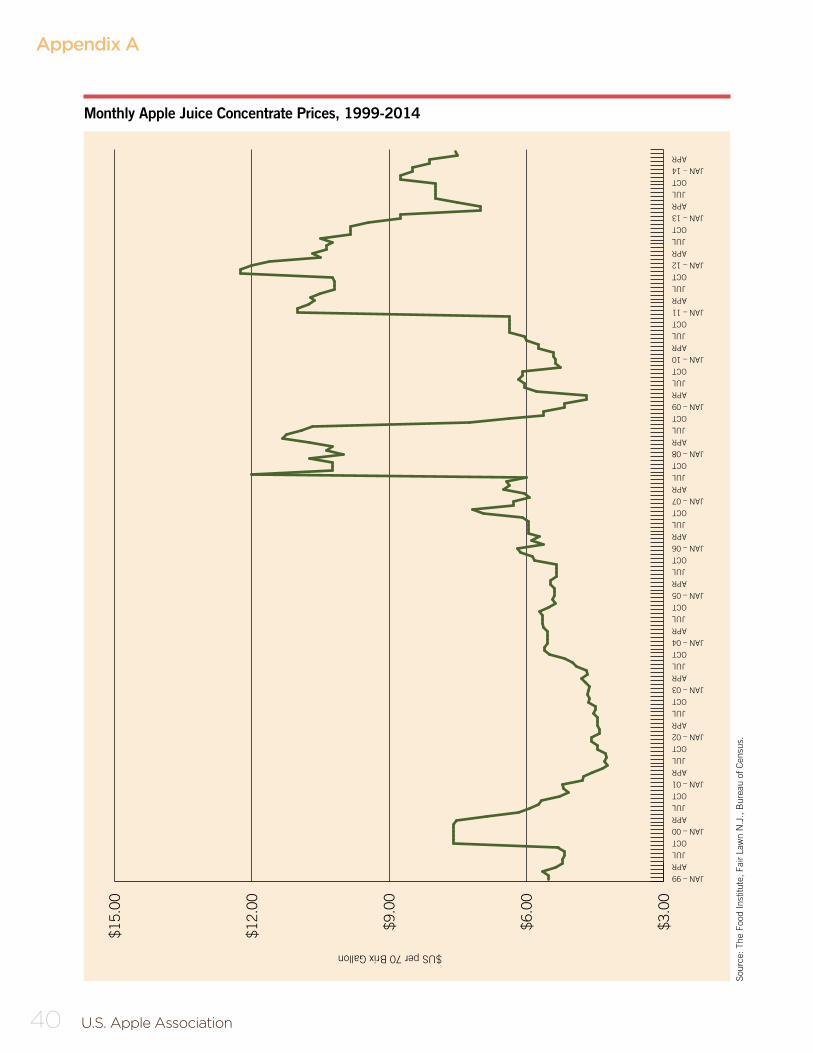
40 U.S. Apple Association
Monthly Apple Juice Concentrate Prices, 1999-2014
Sour
ce: T
he F
ood
Inst
itute
, Fai
r La
wn
N.J
., B
urea
u of
Cen
sus.
$3.0
0
$6.0
0
$9.0
0
$12.
00
$15.
00
$US per 70 Brix Gallon
JAN – 99
JAN – 00
JAN – 01
JAN – 02
JAN – 03
JAN – 04
JAN – 05
JAN – 06
JAN – 07
JAN – 08
JAN – 09
JAN – 10
JAN – 11
JAN – 12
JAN – 13
JAN – 14
APR
APR
APR
APR
APR
APR
APR
APR
APR
APR
APR
APR
APR
APR
APR
APR
JUL
JUL
JUL
JUL
JUL
JUL
JUL
JUL
JUL
JUL
JUL
JUL
JUL
JUL
JUL
OCT
OCT
OCT
OCT
OCT
OCT
OCT
OCT
OCT
OCT
OCT
OCT
OCT
OCT
OCT
Appendix A

Notes
8233 Old Courthouse Road, Suite 200
Vienna, VA 22182
703.442.8850 • USApple.org