Production Log Interpretation Through A Slotted Liner ... · Gn.Salak 330 MW Wayang-Windu 220 MW...
25
2 nd Africal Rift Geothermal Conference November 2008 1 REN/KUNDU 6/3/2009 Production Log Interpretation Through A Slotted Liner During Cold Water Injection: Integration With Electrical Borehole Images In A High Temperature Geothermal Development Well, South Sumatra, Indonesia Richard E. Netherwood, Dibyatanu Kundu, Aditi Pal, Mega Ardhiani Puspa PT Schlumberger Geophysics Nusantara, Jakarta, Indonesia M. Yustin Kamah, Dratjat Budi Hartanto, M. Husni Thamrin PT Pertamina Geothermal Energy, Jakarta, Indonesia
Transcript of Production Log Interpretation Through A Slotted Liner ... · Gn.Salak 330 MW Wayang-Windu 220 MW...
2nd Africal Rift Geothermal ConferenceNovember 2008
1 REN/KUNDU6/3/2009
Production Log Interpretation Through A Slotted Liner During Cold Water Injection:
Integration With Electrical Borehole Images In A High Temperature Geothermal Development Well, South Sumatra,
Indonesia
Richard E. Netherwood, Dibyatanu Kundu, Aditi Pal, Mega Ardhiani PuspaPT Schlumberger Geophysics Nusantara, Jakarta, Indonesia
M. Yustin Kamah, Dratjat Budi Hartanto, M. Husni ThamrinPT Pertamina Geothermal Energy, Jakarta, Indonesia
2 REN/KUNDU6/3/2009
2nd Africal Rift Geothermal ConferenceNovember 2008
Outline Introduction
– Indonesia’s geothermal resources– Wireline log acquisition in geothermal wells– Electrical borehole images and production logs
Interpretation– Fractures, faults, drilling induced features– Integrated fracture and production log analysis
Conclusions
3 REN/KUNDU6/3/2009
2nd Africal Rift Geothermal ConferenceNovember 2008
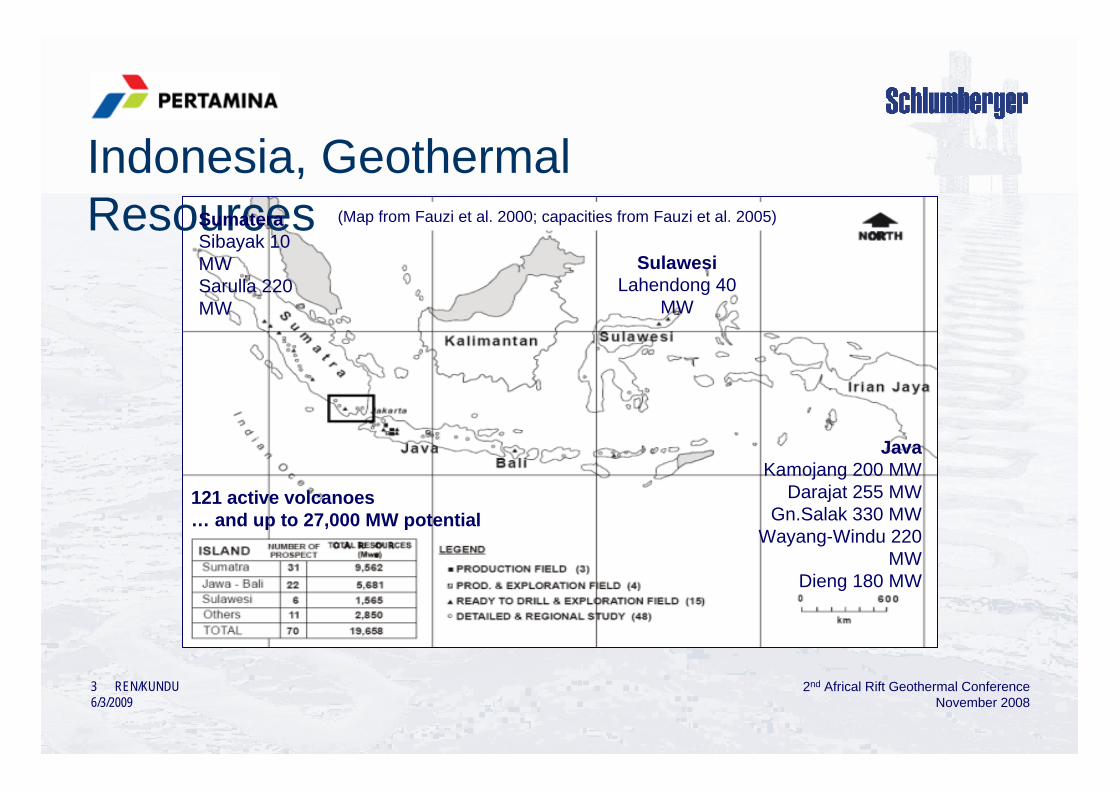
Indonesia, Geothermal Resources (Map from Fauzi et al. 2000; capacities from Fauzi et al. 2005)Sumatera
Sibayak 10 MWSarulla 220 MW
JavaKamojang 200 MW
Darajat 255 MWGn.Salak 330 MW
Wayang-Windu 220 MW
Dieng 180 MW
SulawesiLahendong 40
MW
121 active volcanoes… and up to 27,000 MW potential
4 REN/KUNDU6/3/2009
2nd Africal Rift Geothermal ConferenceNovember 2008
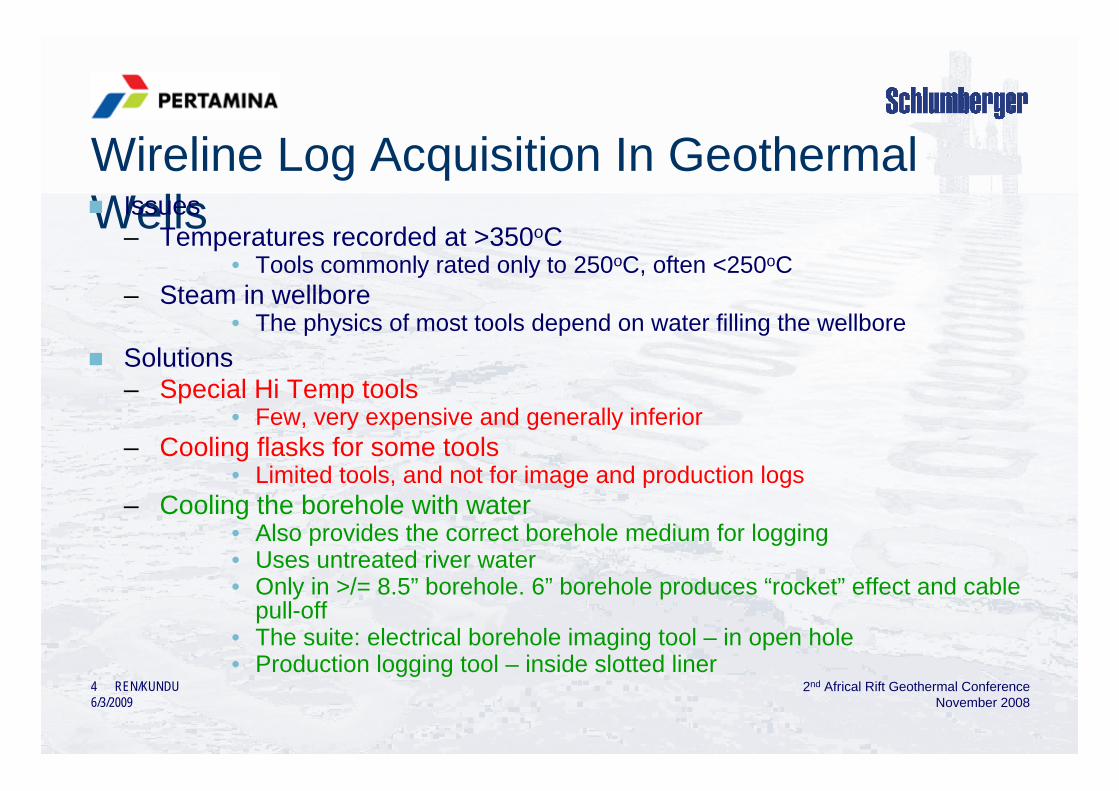
Wireline Log Acquisition In Geothermal WellsIssues
– Temperatures recorded at >350oC• Tools commonly rated only to 250oC, often <250oC
– Steam in wellbore• The physics of most tools depend on water filling the wellbore
Solutions– Special Hi Temp tools
• Few, very expensive and generally inferior– Cooling flasks for some tools
• Limited tools, and not for image and production logs– Cooling the borehole with water
• Also provides the correct borehole medium for logging• Uses untreated river water• Only in >/= 8.5” borehole. 6” borehole produces “rocket” effect and cable
pull-off• The suite: electrical borehole imaging tool – in open hole• Production logging tool – inside slotted liner
5 REN/KUNDU6/3/2009
2nd Africal Rift Geothermal ConferenceNovember 2008
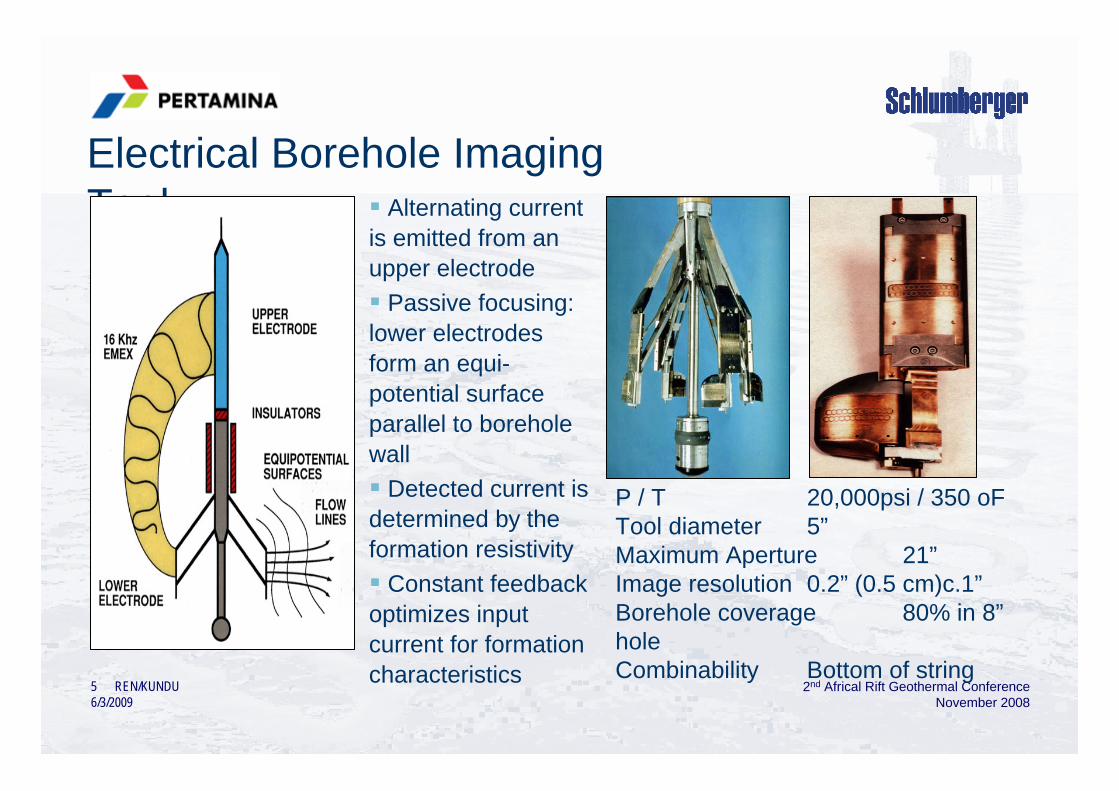
Electrical Borehole Imaging Tool
P / T 20,000psi / 350 oFTool diameter 5”Maximum Aperture 21”Image resolution 0.2” (0.5 cm)c.1”Borehole coverage 80% in 8”holeCombinability Bottom of string
Alternating current is emitted from an upper electrode
Passive focusing: lower electrodes form an equi-potential surface parallel to borehole wall
Detected current is determined by the formation resistivity
Constant feedback optimizes input current for formation characteristics

6 REN/KUNDU6/3/2009
2nd Africal Rift Geothermal ConferenceNovember 2008
Electrical Borehole Image Processing (1)
24 buttons x 8 pads =
192 resistivitycurves
(fast channels: colour-scaled to generate image)
Dark = conductive
Light = resistive

7 REN/KUNDU6/3/2009
2nd Africal Rift Geothermal ConferenceNovember 2008
Electrical Borehole Image Processing (2)
Freq
uenc
yFr
eque
ncy
DynamicDynamic –– resistivityresistivity distribdistrib. 2ft / 1m intervals with overlap. 2ft / 1m intervals with overlap
CONDUCTIVE
StaticStatic –– resistivityresistivity distribution over the entire logging rundistribution over the entire logging run
RESISTIVE
STATIC DYNAMIC

8 REN/KUNDU6/3/2009
2nd Africal Rift Geothermal ConferenceNovember 2008
Electrical Borehole Image Processing (3)
Natural fractures: represented by dip azimuth, strike and magnitude
Planar features crossing the borehole describe a sinewave on the image
Am=dip magnitude, Az=azimuth
E
N W
S
Images Viewed Inside Out
E
N
WS
N
EN WS N
0° 90° 180° 270° 360°
E
N W
S
N E S W
Az
Am

9 REN/KUNDU6/3/2009
2nd Africal Rift Geothermal ConferenceNovember 2008
Production Logging Tool

10 REN/KUNDU6/3/2009
2nd Africal Rift Geothermal ConferenceNovember 2008
Production Logging Tool Processing

11 REN/KUNDU6/3/2009
2nd Africal Rift Geothermal ConferenceNovember 2008
INTERPRETATION

12 REN/KUNDU6/3/2009
2nd Africal Rift Geothermal ConferenceNovember 2008
Fracture & Fault Classification
Conductive (open) fractures
Resistive (healed) fractures
Fault (minor) Drilling induced fractures

13 REN/KUNDU6/3/2009
2nd Africal Rift Geothermal ConferenceNovember 2008
Fracture Distribution

14 REN/KUNDU6/3/2009
2nd Africal Rift Geothermal ConferenceNovember 2008
Fracture & Fault Orientation
Shmin
SHmax
Conductive(open)fractures
Resistive(healed)fractures
Faults
DrillingInducedfractures Faults and
fractures all strike NNW-SSE
parallel to SHmax

15 REN/KUNDU6/3/2009
2nd Africal Rift Geothermal ConferenceNovember 2008
UPPER INTERVAL: 880-1869mOpen hole: 12.25”
Slotted liner: 9.625”
16 REN/KUNDU6/3/2009
2nd Africal Rift Geothermal ConferenceNovember 2008
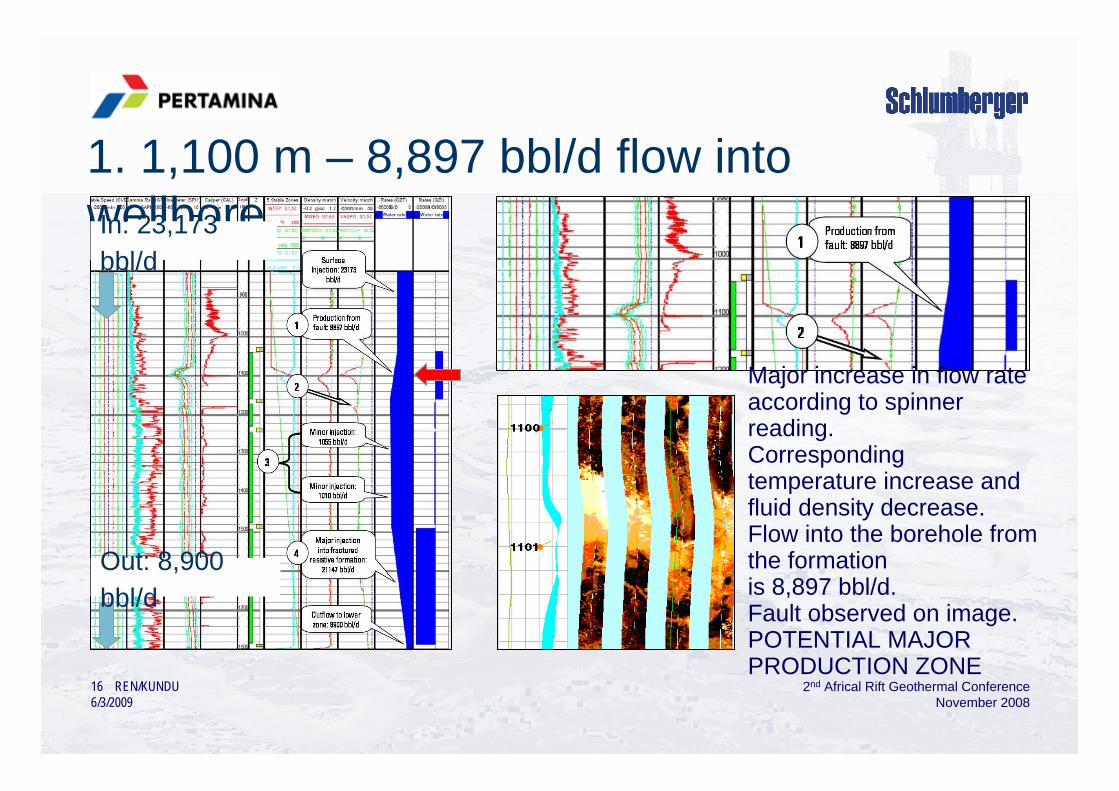
1. 1,100 m – 8,897 bbl/d flow into wellboreIn: 23,173 bbl/d
Out: 8,900 bbl/d
Major increase in flow rate according to spinner reading.Corresponding temperature increase and fluid density decrease. Flow into the borehole from the formationis 8,897 bbl/d.Fault observed on image.POTENTIAL MAJOR PRODUCTION ZONE

17 REN/KUNDU6/3/2009
2nd Africal Rift Geothermal ConferenceNovember 2008
2. 1,180 m – local anomally, no net flow loss/gainIn: 23,173 bbl/d
Out: 8,900 bbl/d
No image.Washout
Minor/local increase in flow rate according to spinner readings, but no overall increase in flow.No temperature increase or fluid density decrease. Major washout and change in formation lithology.Flow disturbance associated with major washout.NO PRODUCTION POTENTIAL

18 REN/KUNDU6/3/2009
2nd Africal Rift Geothermal ConferenceNovember 2008
Minor 2,065 bbl/d flow into the formation. Absence of any major conductive open fractures. Dominance
of resistive healed fractures. NEGLIGIBLE PRODUCTION POTENTIAL
In: 23,173 bbl/d
Out: 8,900 bbl/d
3. 1,180-1,550 m – 2,065 bbl/d flow into formation

19 REN/KUNDU6/3/2009
2nd Africal Rift Geothermal ConferenceNovember 2008
In: 23,173 bbl/d
4. 1,550-1,780 m – 21,147 bbl/d flow into formation
Out: 8,900 bbl/d
Major flow of 21,147 bbp/d into the formation associated with abundant open fractures,
particularly over intervals 1,546-1,554m and 1,660-1,780m.
POTENTIAL MAJOR PRODUCTION ZONE

20 REN/KUNDU6/3/2009
2nd Africal Rift Geothermal ConferenceNovember 2008
LOWER INTERVAL: 1880-2271mOpen hole: 8.5”Slotted liner: 7”

21 REN/KUNDU6/3/2009
2nd Africal Rift Geothermal ConferenceNovember 2008
5. 1,830-1,860 m – 770 bbl/d flow into wellboreIn: 8.900 bbl/d
Out: 2,650 bbl/d
5
6
7
8
Minor flow of 770 bbp/d into the wellbore. Associated with faults at 1,831 m and 1.861 m, and
associated conductive fractures.POTENTIAL MINOR
PRODUCTION ZONE

22 REN/KUNDU6/3/2009
2nd Africal Rift Geothermal ConferenceNovember 2008
6. 1,860-1,930 m – 4,763 bbl/d flow into formationIn: 8.900 bbl/d
Out: 2,650 bbl/d
5
6
7
8
Significant flow of 4,763 bbp/dinto the formation. Associated
with fault at 1,917m with associated washout.POTENTIAL MINOR
PRODUCTION

23 REN/KUNDU6/3/2009
2nd Africal Rift Geothermal ConferenceNovember 2008
7. 2,170-2,260 m – 2,334 bbl/d flow into formationIn: 8.900 bbl/d
Out: 2,650 bbl/d
5
6
7
8
Significant flow of 2,334 bbp/dinto the formation. Associated with open fractures and local
faults.POTENTIAL MINOR
PRODUCTION

24 REN/KUNDU6/3/2009
2nd Africal Rift Geothermal ConferenceNovember 2008
8. Below 2,271 m – 2,650 bbl/d flow into formationIn: 8.900 bbl/d
Out: 2,650 bbl/d
5
6
7
8
2,650 bbl/d flow is calculated below the last logged depth (TD). It is
possible that this represents calculation error, but the lack of a standing water column at the base
of the well supports continued downward flow (into fractures?).
POTENTIAL MINOR PRODUCTION

25 REN/KUNDU6/3/2009
2nd Africal Rift Geothermal ConferenceNovember 2008
ConclusionsInjection of cold water into geothermal wells allows acquisition of standard P&T rated logging tool dataElectrical borehole images provide an excellent way to identify, classify, quantify & orientate fractures, faults, and borehole damage, the latter indicating stress directionElectrical borehole images alone do not, however, identify which fractures will or will not produceIntegration of image data with production logging data can identify individual fractures, fracture zones and faults that will potentially produce steam