PRODUCTION AND CRYSTALLIZATION OF SUGAR FROM TAPIOCA
24
.' .. PRODUCTION AND CRYSTALLIZATION OF SUGAR FROM TAPIOCA Nor Farhana Binti Hamid SB 211 C3 N822 1012 Bachelor of Science with Honours (Resource Biotechnology) 2012
Transcript of PRODUCTION AND CRYSTALLIZATION OF SUGAR FROM TAPIOCA

. ' ..
PRODUCTION AND CRYSTALLIZATION OF SUGAR FROM TAPIOCA
Nor Farhana Binti Hamid
SB 211 C3 N822 1012
Bachelor of Science with Honours (Resource Biotechnology)
2012

.. I . ,. i ;. Pusat Khidmat Makl!Jrnat Akademik
UNIVERSm MALAYSIA SARAWAK
Production and Crystallization of Sugar from Tapioca
PiliiliiiiiillOOi K
1000235457
Nor Farhana binti Hamid
(24398)
A final project report submitted in partial fulfilment of the requirement for the degree of Bachelor of Sciences with Honours.
(Resource Biotechnology)
Supervisor: Prof. Dr. Kopli Bin Bujang
Department of Molecular Biology Faculty of Resource Science and Technology
Universiti Malaysia Sarawak 2012

,....
t • f ' 1:.
DECLARATION
I hereby declare that no portion of the work referred in this project has been submitted in support
of an application for another degree qualification of this or any other university or institution of
higher learning,
(Nor Farhana binti Hamid) Resource Biotechnology Department of Molecular Biology Faculty of Resource Science and Technology University Malaysia Sarawak

ACKNOWLEDGMENT
First of all, I would like to express my appreciation to my supervisor Professor Dr. Kopli bin
Bujang for his dedicated supervision, patience and advice throughout this project.
Then, millions of thank to postgraduate students of Biochemistry Laboratory, Faculty of
Resource Science and Technology, Miss Rubena Malfia Kamal, Miss NurJannah, Miss Sarina,
and Miss Komathi for their assistance in this project.
Last but not least, thanks to my family and friends for their encouragement, motivation and
rendered support during the development of this project.
ii

L ,
Pusat Khidmat Maklumat Akademik VNlVERSm MALAYSIA SAftAWAK
TABLE OF CONTENTS
Declaration 11
Acknowledgement 11l
Table ofContents IV
List of Abbreviations VI
List of Figures V11
List of Tables IX
Abstract X
1.0 Introduction
2.0 Literature Review 3
2.1 Tapioca 3
2.2 Composition of tapioca 3
2.3 Tapioca starch and its production 3
2.4 Sugar industries 4
2.5 Enzymatic hydrolysis of starch 5
2.6 Powdered Activated Charcoal (PAC) 6
2.7 Drying ofhydrolyzed tapioca starch 6
3.0 Materials and Methods 7
3.1 Materials 7
3.1.1 Fresh tapioca (FT) 7
3.1.2 Tapioca Flour (TF) 7
iii

.,~ . ,. i;
3.2 Methods 8
3.2.1 Extraction of fresh tapioca (FT) 8
3.2.2 Preparation of fresh tapioca (FT) for enzymatic hydrolysis 9
3.2.3 Preparation of tapioca flour (TF) for enzymatic hydrolysis 10
3.2.4 Enzymatic hydrolysis of tapioca (FT and TF) 11
3.2.5 Sampling 12
3.2.6 Purification of hydrolyzed tapioca sugar (FT and TF) using 12
Powdered Activated Charcoal (PAC)
3.2.7 Drying of purified fresh tapioca sugar (FTS) and tapioca flour sugar 13
(TFS)
3.3 Analytical method 14
3.3.1 Dry matter and moisture content 14
3.3.2 Total starch determination 14
3.3.3 Glucose concentration (HPLC) 15
4.0 Results 16
4.1 Characterization of fresh tapioca (FT) and tapioca flour (TF) 16
4.2 Enzymatic hydrolysis of tapioca flour (TF) and fresh tapioca (FT) 17
4.2.1 Starch recovery from 500g tapioca flour (TF) mixed at different ratio 17 ofdistilled water (l :1, 1 :2, and 1:3)
4.2.2 Starch recovery from 500g fresh tapioca (FT) mixed at different 17
ratio ofdistilled water (l: 1, 1 :2, and 1 :3)
4.2.3 Glucose recovery from 500g tapioca flour (TF) mixed at different 20
ratio of distilled water (1 :1, 1 :2, and 1 :3)
4.2.4 Glucose recovery from 500g fresh tapioca (FT) mixed at different 20
ratio ofdistilled water (l: 1, 1 :2, and 1 :3)
iv

1
1 'I
4.3 Purification of hydrolyzed tapioca flour sugar (TFS) and fresh tapioca
sugar (FTS)
4.3.1 Glucose recovery from purified tapioca flour sugar (TFS) mixed at
different ratio of distilled water (1 :1, 1 :2, and 1 :3)
4.3.2 Glucose recovery from purified fresh tapioca (FTS) mixed at
different ratio of distilled water (1: 1, 1 :2, and 1:3)
4.4 Drying of purified tapioca flour sugar (TFS) and fresh tapioca (FTS) at
different temperatures (60°C, 70°C, and 80°C)
4.4.1 Drying purified tapioca flour sugar (TFS) at 60°C, 70°C, and 80°C
4.4.2 Drying purified fresh tapioca sugar (FTS) at 60°C, 70°C, and 80°C
5.0 General Discussion
6.0 Conclusion and Recommendation
7.0 List of References
8.0 Appendix
Appendix A
Appendix B
Appendix e
22
22
23
25
25
26
30
33
34
38
39
40
43
v

cm
DNS
DW
FT
FTS
g
gIL
HCI
HPLC
kg
L
ml
NaOH
TF
TFS
tons
LIST OF ABBREVIATIONS
Centimeter
3,5-dinitrosalicycIic acid
Distilled water
Fresh tapioca
Fresh tapioca sugar
Gram
Gram per liter
Hydrochloric acid
High Performance Liquid Chromatography
Kilogram
Liter
Mililiter
Sodiwn hydroxide
Tapioca flour
Tapioca flour sugar
Tonnes
vi
,. ' f o ""
LIST OF FIGURES
Figure Title Page
Fresh tapioca (FT) 7
2 Tapioca flour (TF) 7
3 Deskinning the fresh tapioca 8
4 Removal of the brown outer skin and pink layer 8
5 Deskinned fresh tapioca was cut into thin and small cubes 8
6 Small cubes of fresh tapioca 8
7 Liquefaction of fresh tapioca (FT) 11
8 Liquefaction of tapioca flour (TF) 11
9 Saccharification of fresh tapioca (FT) 12
10 Saccharification of tapioca flour (TF) 12
11 Purification of tapioca sugar 13
12 Starch recovery in dry matter ofTF and FT 19
13 Glucose recovery of hydrolyzed TF and FT 21
14 Glucose recovery of purified TF and FT 24
15 Dried sugar recovery of TFS and FTS (dilution 1: 1) at 60°C, 70°C, and 27 80°C.
16a Colour of purified and dried FTS at 60°C 28
16b Colour of purified and dried FTS at 70°C 28
16c Colour of purified and dried FTS at 80°C 28
17a Colour of ground dried FTS at 60°C 28
17b Colour of ground dried FTS at 70°C 28
17c Colour of ground dried FTS at 80°C 28
vii

18a Colour of purified and dried TFS sugar at 60°C 29
18b Colour of purified and dried TFS sugar at 70°C 29
18c Colour of purified and dried TFS sugar at 80°C 29
19a Colour of ground dried TFS at 60°C 29
19b Colour of ground dried TFS at 70°C 29
19c Colour of ground dried TFS at 80°C 29
26 Standard curve of starch 38
viii

• ( ' I ;.
LIST OF TABLES
Table Title Page
Dilution ratio ofFT mixed with DW 9
2 Dilution ratio ofTF mixed with DW 10
3 Comparison between fresh tapioca (FT) and tapioca flour (TF) 16
4 Starch recovery in dry matter ofTF 17
5 Starch recovery in dry matter ofFT 17
6 Glucose recovery of hydrolyzed TF 20
7 Glucose recovery of hydrolyzed FT 20
8 Glucose recovery of purified TFS 22
9 Glucose recovery of purified FTS 23
10 Dried sugar recovery from dilution I: I ofTFS at 60°C, 70°C and 80°C 25
II Dried sugar recovery from dilution I: I ofFTS at 60°C, 70°C and 80°C 26
12 OD reading on starch 38
13 Drying of tapioca flour sugar at 60°C 43
14 Drying of tapioca flour sugar at 70°C 43
15 Drying of tapioca flour sugar at 80°C 43
16 Drying of fresh tapioca sugar at 60°C 44
17 Drying of fresh tapioca sugar at 70°C 44
18 Drying of fresh tapioca sugar at 80°C 44
ix
..

Production and Crystallization of Sugar from Tapioca
Nor Farhana Hamid
Program Resource Biotechnology Faculty Resources Science and technology
Universiti Malaysia Sarawak
ABSTRACT
This study explains the best mixing ratio of tapioca starch to distilled water during hydrolysis and the optimum oven drying temperature during crystallization of the sugar syrup. Tapioca (Manihot esculenta) is one of the starchy materials that can be hydrolyzed to produce glucose. Production of sugar was performed from hydrolysis of tapioca flour (TF) and fresh tapioca (FT). Exactly, 500g of either TF or FT were mixed with 500ml, IOOOml, and l500ml at dilution ratio 1:1, I :2, and I :3, respectively. The starch slurries of TF and FTwere enzymatically hydrolyzed for 6 hours (2 hours for liquefaction and 4 hours for sachharification). The hydrolysate was purified by filtration using powdered activated charcoal (PAC) and the purified sugar (TF and FT) were dried at 60°C, 70°C and 80°C. It was observed that the highest glucose recovery obtained in dilution 1:1 with TF (86% at 338g1L) and FT (43% at 156g1L).This result followed by dilution 1:2 which 68% (263g1L) produced from TF and 41 % (\ 39g1L)produced from FT . The lowest glucose recovery was exhibited in dilution 1:3 which TF, (55% at 207g1L) and FT, (32% at 96g1L). For drying of sugar, at 60°C, 70°C and 80°C, TFS achieved to dry completely after 12, 10 and 18 days so as recovered 97%, 97% and 93% of glucose, respectively. At the same temperature, FTS achieved to dry completely after 12, 10, and 18 days, so as recovered 83%, 83%, and 79% glucose, respectively. Therefore, the result confirmed that dilution 1:1 (500g/500ml) was selected as the best dilution ratio for efficient enzymatic hydrolysis. Whereas, 70°C was the suitable drying temperature for TFS and FTS to obtain optimum solidified sugar.
Keyword: tapioca, enzymatic hydrolysis, glucose recovery, sugar
ABSTRAK
Kajian ini menerangkan ten tang nisbah pencampuran terbaik antara kanji IIbi kaYIl dengan air suling semasa proses hidrolisasi dan sllhu pengeringan ketuhar yang optimum semasa pengeringan gula kristal. Ubi kayu (Manihot esculellta) merupakan salah satu bahall berkanji yang boleh dihidrolisis lIntuk menghasilkan glllkosa.
Penghasilan gllia telah dilakllkan daripada hidrolisis tepung IIbi dan IIbi segar. 500g tebllng IIbi dan IIbi kayu telah dicampllr dengan 500ml, 1000ml dan 1500ml air slliing pada nisbah pencairan masing-masing 1: 1. 1:2, dan 1 :3. Kanji tepu/lg IIbi dan IIbi segar telah dihidrolisis selama 6 jam (2 jam untuk pencairall dan 4 jam IInlllk pensakarifikasiall). Penapisan hidrolisat dilakllkan menggunakan serbllk arang aktif (PAC) dan gil/a yang ditapis (tepung IIbi dan IIbi segar) dikeringkan pada 600C, 700C dan 800C. Setelah dikaji, glllkosa pemulihan yang tertinggi diperoleh dalam pencairan 1: 1 tepllng IIbi dengan 86% pada 338g / L dall 43% pada 156g / L oleh ubisegar. Kepwusan ini diikllti oleh pencairan 1: 2 dimana 68% g/ukosa pada 263g / L telah dihasilkan dari tepung IIbidan 41% gll/kosa pada 139g / L telah dihasilkan dari IIbi segar. Pemulihan glllkosa terendah telah dipamerkan di pellcairan 1: 3 dim ana tepllng ubi (55% pada 207g / L) dan IIbisegar, (32% pada 96g / L). Untllk pengeringan gula, pada su/1lI 600C, 700C dan 800C, gllia tepung ubi kering sepenllhnya selepas 12, 10 dan 18 hari dan masing-masing mencapai 97%, 97% dan 93% gll/kosa. Pada suhu yang sama, gllia ubi segar kerillg sepenllhllya selepas 12, 10, dall 18 hari dan masil/g-masing mencapai 83%, 83%, dan 79% glukosa . Olel! itl/, kepllt/lsan itl/ mengesahkan bahawa
pencairan 1: 1 (500g/500ml), telah dipilih sebagai nisbah pencairal/ yang terbaik IIntuk hidrolisis enzim yang efisyen. Manakala, sl/hl/ 70D C merupakan sl/hll yal/g sesllai unlllk mellcapai pel/gerillgall gl/Ia yang optimum.
Kala kllnci: IIbi kaYlI, hidrolisis berellzim, pemlllihan gll/kosa, gllla
x

• • f ' I :,
1.0 INTRODUCTION
Recently, the demand for sugar is very high because domestic consumption of sugar in
Malaysia has increased rapidly due to the strong growth in the food processing industry. Soft
drink, ice cream and chocolate are the examples that have created the new demand for sugar
(Bemama, 2011). Thus, this project aimed to produce crystallized sugar from tapioca.
Research have been published by Booty and Bujang (2009) on the recovery of
reducing sugars (RS) and the dextrose equivalent (DE) of tapioca starch which was 187 giL
and 93%, respectively. The highest concentration of sugars was obtained from sago starch at
103% DE followed by com 99% and the lowest concentration of sugar from sweet potato
starch at 86% DE.
In this project, tapioca was selected as the raw material because it is the one of the
cheapest raw material of starch production and more economical (Bangyekan et al., 2005).
Hence, the objectives of this study are:
• To obtain the best mixing ratio of fresh tapioca and tapioca flour to distilled water
during blending for efficient enzymatic hydrolysis.
• To obtain the best oven drying temperature during crystallization of the sugar syrup.
In this experiment, tapioca was used for the production of commercial sugar through
enzymatic hydrolysis of the tapioca starch into sugars, which is mainly glucose. The work
comprised of three major stages: production of hydrolyzed tapioca starch, purification through
filtration powdered activated charcoal (PAC) and crystaHization of the purified sugar. The
enzymatic hydrolysis was conducted using three different volumes of distilled water (500ml,
1

.. , ( , I ;.
lOOOml, and r500ml) in order to investigate the best mixing ratio of tapioca tuber during
blending. On the other hand, three different drying temperatures (60 DC, 70 DC, and 80D C) were
used to crystallize the sugar to obtain the optimum temperature for sugar crystallization.
2

.,. f;.
2.0 LITERATURE REVIEW
2.1 Tapioca
Tapioca (Manihot esculenta) is one of the starchy materials. Tapioca is also known as cassava
and 'ubi kayu' in Malaysia. Tapioca is traditionally used as desserts or breakfast meal.
Tapioca starch is also used in the textile industries, paper industries, and also for
miscellaneous uses (Vandamme et al., 2002). Tapioca is believed was the cheapest source of
starch compared to other cereals, tubers, and root crops (Patle and Lal, 2008).
2.2 Composition of tapioca and characteristic of tapioca starch
According Tonukari (2004), typical composition of tapioca is moisture (70%), starch (24%),
fibers (2%), protein (1 %) and other substances such as minerals (3%).This close with
Santisopasri et al. (2000) which reported that the quality and quantity starch in tapioca
depends on planting time and harvest. Furthermore, the amount of rainfall also influenced the
starch quality (Sriroth et al., 1999).
2.3 Tapioca Starch and Its Production
Starch is the main carbohydrate storage in many plants. Starch from all plant sources occurs
in the form of water soluble granules which differ in size and physical characteristics from
species to species (Madihah et al., 2001). Starch is one type of complex sugar which is
polysaccharide, i.e. Macromolecules that consist of a large number of glucose units also
called as glycans.
3

.. , • f ' t;.
Starch is widely used in the textile industry to maintain the color in the desired area of the
fabric and also to avoid spreading and mixing the color. Besides, starch was used to enhance
the strength of the sheet in paper industry. Plus, starch can be used as an adhesive for paper
bag (Vandamme et al., 2002),
Starch from tapioca has great potential for starch production in Malaysia. Zamora et
al. (2010) reported that tapioca starch are high purity, easy swollen, neutral flavor, solubility,
development of high viscosity and low tendency to retrograde compared with other starches
such as potato, rice and corn. This project highlights the importance and potentials of tapioca
starch as an alternative source to sugar cane for the production of commercial sugar. Tapioca
starch is basically cheaper and easy to get.
Tapioca also is a crop that can grows well and able to tolerant to adverse environment
such as low nutrient soil. Furthermore, it can be harvested from 6-24 month after planting
depending on growing condition with just needs minimal care (EI-Sharkawy, 1993).
2.4 Sugar industries
Sugar is an essential item for food and a widely traded commodity. About 66% of the total
sugar consumption in Malaysia occurs in households, and the rest in the food processing
industries. Soft drink, ice cream, chocolate are examples that have created high demands for
sugar. In addition, Mohammad (2010) reported that over 90% of Malaysia's sugar supply are
imported to meet the domestic demand and has reached a record 1.0 million tons, compared to
the export at a mere 101,000 tones. Demand for sugar is expected to increase 3% annually
which can be over 1.9 million tons by 2020 (Bernama, 2011).
4

Pusat Khidmat MakJumat Akademik • ,(' r;. UNIVERSm MALAYSIA SARAWAK
In Malaysia, sugar is produced from sugar cane.The cultivation of sugar supply (sugar
cane) in Malaysia is relatively small and its production is concentrated in the northwest
extremity of Peninsular Malaysia in the states of Perlis and Kedah (F AO, r997). Thus, the
lack of raw materials and the increased in industrial applications of sugar cane naturally leads
to the higher price of this commodity.
2.5 Enzymatic Hydrolysis
The production of marketable products from starch usually can be achieved by acid or
enzymatic hydrolysis. Enzymatic hydrolysis is more preferred than acid hydrolysis because it
has many advantages. Rattanachomsri et al. (2009) and Nair et al. (2011) showed that
enzymatic hydrolysis could hydrolyze almost all starch in the tapioca pulp. Whereas,
Govindasamy et al. (1997) reported that the product yield produced by acid hydrolysis are
relatively low so as formation of excessive by-products. Previous research has focused on the
use of enzyme hydrolysis of starches. This is usually achieved by using two enzymes which
are involved in two reaction steps namely: liquefaction and saccharification. Bujang and co
worker (2000) reported that hydrolysis was carried out using 0.5f.ll/g ofTermamyl-120L at pH
6.5, 80-90°C during liquefaction and O.6f.lllg of Dextrozyme 225/75L at pH 4.5 and 6O-65°C
generated 187g/L recovery of reducing sugar from tapioca starch after only 4 hours.
5

· .,. ""
2.6 Powdered Activated Charcoal (PAC)
Powdered Activated Charcoal is a black carbonaceous, solid, porous, tasteless material which
is microcrystalline and nongraphitic form of carbon (Ang et al., 2006; Monib, 2011). The
effectiveness of activated charcoal for removal of organic compounds from fluid is enhanced
by its large surface area (Cheremisinoff, 1993). The rate and capacity of adsorption are
influenced by internal surface area, distribution pore size, and shape as well as surface
chemistry of activated charcoal (Baker et al., 1992). According to Ang et al. (2006),
adsorption capacity of the activated charcoal depends on some factors including physical
properties of adsorbent such as pore size and surface area and also chemical nature of carbon
source or amount of associate oxygen and hydrogen. Physical and chemical characteristics of
the adsorbate, concentration of adsorbate in liquid solution, characteristics of the liquid phases
well as the flow rate or contact time of adsorbate with adsorbent also effect the adsorption
capacity of activated charcoal.
2.7 Drying of Hydrolyzed Tapioca Starch
In this project, the drying of purified tapioca flour sugar (TFS) and fresh tapioca sugar (FTS)
were performed using oven at 60°C, 70°C, and 80°C. There are some factors that influenced
the speed of drying time such as temperature, the surface area, concentration of solution, and
the depth of the tray.
6

t • ( I;.
3.0 MATERIALS AND METHODS
3.1 Materials
3.1.1 Fresh tapioca (Ff)
Fresh tapioca (Figure 1) was purchased from a vendor at the Kuching's local market (Pasar
Satok, Kuching) at an average price RM2 per kg.
Figure 1: Fresh tapioca (Manihot esculenta).
3.1.2 Tapioca flour (TF)
The industrial grade tapioca flour was purchased from a local supennarket (Unaco) for RM3
per kg (Figure 2).
Figure 2: Tapioca flour.
7
• f (;.
3.2 Methods
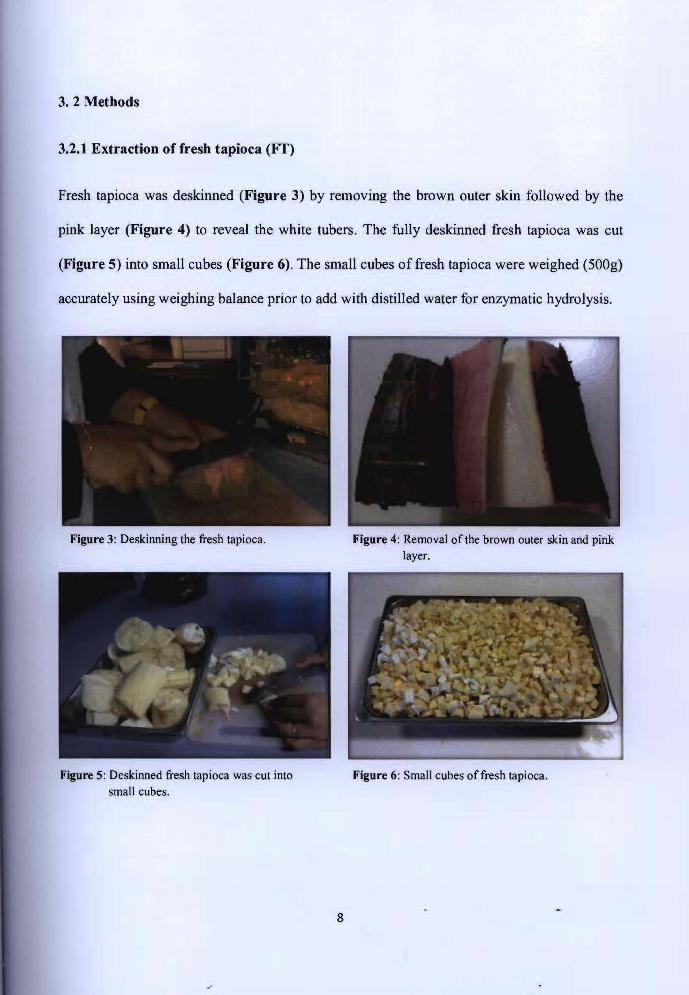
3.2.1 Extraction of fresh tapioca (IT)
Fresh tapioca was deskinned (Figure 3) by removing the brown outer skin followed by the
pink layer (Figure 4) to reveal the white tubers. The fully deskinned fresh tapioca was cut
(Figure 5) into small cubes (Figure 6). The small cubes of fresh tapioca were weighed (500g)
accurately using weighing balance prior to add with distilled water for enzymatic hydrolysis.
Figure 3: Deskinning the fresh tapioca. Figure 4: Removal of the brown outer skin and pink layer.
Figure 5: Deskinned fresh tapioca was cut into Figure 6: Small cubes offresh tapioca. small cubes.
8

.,• ' ,. i;.
3.2.2 Preparation of fresh tapioca (Ff) for enzymatic hydrolysis
Three different volumes (500ml, 1000ml, and 1500ml) of DW was added to 500g of chipped
fresh tapioca tuber (Table 1). The soft tapioca tubers were then pulverized using a high speed
blender. Three sets were prepared, 500g fresh tapioca in 500ml DW (1: 1), 500g fresh tapioca
in l000ml DW (1 :2), and 500g fresh tapioca in 1500ml DW (1 :3). The starch content for each
set was estimated by the iodine method.
Table 1: Dilution ratio ofFf mixed with DW.
Amount of TF + volume of DW Dilution ratio
500g +500ml 1: 1
500g + 1 OOOml 1:2
500g + 1500ml 1:3
9

I •
3.2.3 Preparation of tapioca flour (TF) for enzymatic hydrolysis
Three different volumes (500ml, 1000ml, and 1500ml) of distilled water was added to 500g of
tapioca flour (Table 2) and gelatinized at 80°C for 10-20 minutes to allow the starch to
dissolve in water. Three sets were prepared, 500g tapioca flour in 500ml DW (1 : 1), 500g
tapioca flour in 1000ml DW (1:2), and 500g tapioca flour in 1500ml DW (1:3). The starch
content for each set was estimated by the iodine method.
Table 2: Dilution ratio ofTF mixed witb DW
Amount of TF + volume of DW Dilution ratio
500g +500ml 1: 1
500g + 1 OOOml 1:2
500g + 1500ml 1:3
10

I . , f..
3.5 Enzymatic hydrolysis of fresh tapioca (Ff) and tapioca flour (TF)
Enzymatic hydrolysis of tapioca starch was adapted from Bujang and co-workers (2000). The
pH of blended tapioca starch (FT and TF) was adjusted to 6.5 with 1M NaOH. Hydrolysis of
tapioca starch was achieved utilizing the commercial enzymes (Novo Nordisk) Termamyl
l20L (thermostable a.-amylase from Bacillus licheniformis 120 KNU/g) and Dextrozyme(a
mixture of gluco-amylase from Aspergillus niger and pullulanase from Bacillus
acidopullu/yticus, 225 AGU/ml). Liquefaction of FT (Figure 7 ) and TF (Figure 8) was
carried out by adding 0.5111 of Termamyl-120L (per gram of starch) to tapioca starch (FT and
TF) at pH 6.5 with temperature 85 to 95°C for 2 hours. Then, the thinned starch slurry was
cooled down to room temperature to prevent heat shock. During saccharification of FT
(Figure 9) and TF (Figure 10),0.6111 Dextrozyme (per gram of starch) was added to liquefied
suspension at pH 4.5 with temperature maintained at 60°C for another 4 hours.
Figure 7: Liquefaction of fresh tapioca (FT), Figure 8: Liquefaction of tapioca flour (TF).
11

t •
Figure 10: Saccharification of tapioca flour (TF).
Figure 9: Saccharification of fresh tapioca (FT).
3.6 Sampling
Sampling of hydrolyzed tapioca flour sugar (TFS) and fresh tapioca sugar (FTS) were done
by taking I ml sample for each eppendorf tube (three replicates) after enzymatic hydrolysis
finished completely. The samples were kept at 4°C for further analysis. Sampling was
performed with strict aseptic technique to avoid risk of contaminations.
3.7 Purification of hydrolyzed tapioca sugar (Ff and TF) using Powdered Activated
Charcoal (PAC)
Hydrolyzed fresh tapioca sugar (FTS) and tapioca flour sugar (FTS) were purified (Figure
11) though 5g Powdered Activated Charcoal (PAC) in glass column aided by a peristaltic
pump. Sterilized PAC was used for all experiments which was washed with 0.2M HCI and
then deionized water to adjust the pH from pH of 3 to final, a pH of 6. According Kan-Carbon
(2005), washing PAC with acid will help to minimize the impurities like soluble ash, iron and
heavy metals. The bottom layer of all columns was secured with a sheet of 109 superfine glass
fiber. Subsequently, 100mi of hydrolyzed FTS and TFS were loaded into these columns. The
12