Product range (Minimum Recommended 2017.pdf · Systematic Investment Plan (SIP) DEBT Long Term...
68
Transcript of Product range (Minimum Recommended 2017.pdf · Systematic Investment Plan (SIP) DEBT Long Term...


Product range (Minimum RecommendedInvestment Period (MRIP)
1 day
Liquid
3months 5 years4 years3 years2 years1 year
Arbitrage Hybrid Funds Diversified Funds
UltraShort Debt
ShortTerm Debt
MediumTerm Debt
Large CapMid &
Small Cap
LongTerm Debt
IndexFunds
TaxSavings
“Investor should consult their financial advisors”.

Index
From the Managing Director’s Desk
Market Overview
From the CMO’s Desk
Snapshot of Equity Funds
Equity
LargeCap
Diversified Cap
Midcap & Small Cap
TaxSaving
Thematic
Arbitrage
Index Fund
SBI Blue Chip Fund
SBI Magnum Equity Fund
SBI Magnum Multicap Fund
SBI Contra Fund
SBI Magnum Multiplier Fund
SBI Magnum MidCap Fund
SBI Magnum Global Fund
SBI Small & Midcap Fund
SBI Magnum Taxgain Scheme
SBI Pharma Fund
SBI Banking And Financial Services Fund
SBI PSU Fund
SBI Magnum Comma Fund
SBI Infrastructure Fund
SBI FMCG Fund
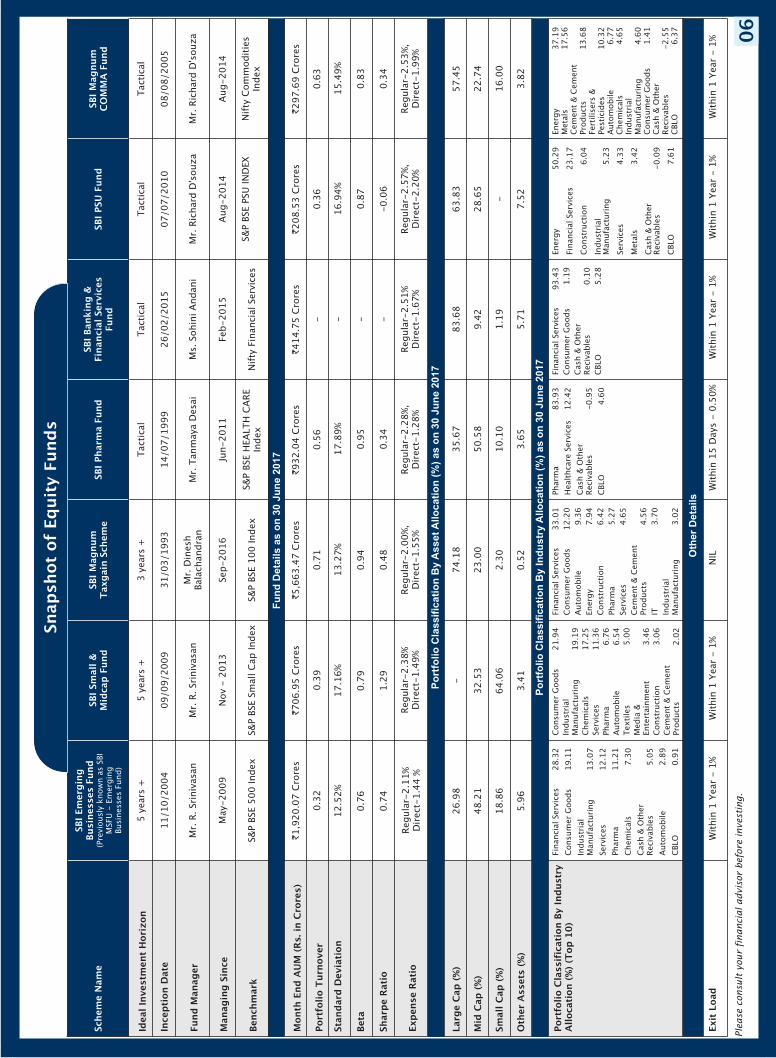
SBI IT Fund
SBI Gold Fund
SBI Arbitrage Opportunities Fund
SBI Nifty Index Fund
SBI Emerging Businesses Fund
1
2
4
5
8
9
10
11
12
14
15
16
17
18
19
20
21
22
23
24
25
26
27
13

Index
Snapshot of Hybrid Funds
How to read the Factsheet
Hybrid Fund
Total Expense Ratios
Disclaimer
SBI Funds Management Pvt Ltd Branches
SBI Magnum Balanced Fund
SBI Dynamic Asset Allocation Fund
SBI Magnum Monthly Income Plan
SBI Magnum Monthly Income Plan – Floater
SBI Magnum Children's Benefit Plan
SBI Equity Savings Fund
SBI Magnum Gilt Fund – Long Term Plan
SBI Magnum Income Fund
SBI Dynamic Bond Fund
SBI Corporate Bond Fund
SBI Regular Savings Fund
SBI Short Term Debt Fund
SBI Magnum Gilt Fund – Short Term Plan
SBI Ultra Short Term Debt Fund
SBI Savings Fund
SBI Treasury Advantage Fund
SBI Premier Liquid Fund
SBI Magnum InstaCash Fund
SBI Magnum InstaCash Fund – Liquid Floater
28
29
30
31
32
33
34
63
35
37
38
39
40
41
42
43
44
45
46
47
48
49
50
55
57
58
61
62
Snapshot of Debt Funds
Comparative Performance for all Schemes
Systematic Investment Plan (SIP)
DEBT
Long Term
Short Term
Ultrashort
Liquid
Medium Term
Dividend History Of Debt & Hybrid Funds

From the Managing Director’s Desk
Dear Friends,
Managing Director & CEO
The Indian equity indices have reached new highs as the Goods and Services Tax (GST)
from July 1 has taken effect. Markets continue to be fuelled by domestic inflows on the
back of a good start to the monsoon season and probable benefits on domestic
consumption due to GST.
The mutual fund industry’s asset base rose 7% this quarter driven largely by strong retail
participation in SIPs. Non-metros (B-15 locations) continued to outpace the top cities (T-
15 locations) during this time with more allocations through SIPs. These markets will be
the bedrock of the growth of the industry as the benefits of the country’s growth and
policies lead to increase in income and savings levels. Net investments by mutual fund
houses have been twice the amount of FIIs, around Rs. 29,000 crore, in the first quarter of
the current financial year buoyed by the strong inflows. As the SIP flows are now
sustainably over Rs. 4,000 crore, the fund houses will continue to provide some stability
vis-à-vis FIIs while seeking the right opportunities as markets reach new highs.
A lot of investors might be looking at markets levels right now and wondering whether it is
the right time to invest. This indecision is compounded when taking into consideration the
falling interest rates for small savings schemes like NSC; PPF etc. For many their
investment plans will need a re-look. Mutual Funds fit in well here. For those have a low
risk appetite or who are nearing retirement, debt-based mutual funds or hybrid funds
which have a lower equity allocation work well to provide better inflation-adjusted
returns. As always, before you make a decision on an investment do consult a
financial/tax advisor to see how it compares with other options but rest assured whatever
your goals are there is a mutual fund scheme for you. And, many facilities like Systematic
Transfer Plans, Systematic Withdrawal Plans and Triggers make it more convenient for you
to invest.
Finally, I am pleased to share with you that SBI Mutual Fund completed 30 years of
operations on June 29, 2017. Since 1987, the company’s mission has been to help
investors achieve their financial goals by providing class leading products and services.
Being a part of State Bank of India, we are proud of our parentage and the joint venture with
AMUNDI, Europe’s largest investment manager, helps us bring best-in-class practices to
our risk management, research and investment processes. We have been part of many
firsts in the industry, possible due to the unflinching support of our partners, investors
and employees. While 30 amazing years are behind us, your trust in us continues to
strengthen our resolve to make the next 30 years even better.
Warm Regards,
Anuradha Rao
Anuradha RaoMD & CEO
01

Market Overview
Navneet MunotED & CIO
Indian equity market had depicted a gain of 16.3% in 1H 2017, albeit marginally less than
emerging market returns of 17.2% (for MSCI-EM). The market fell 1% during the last month.
That said, July started on a positive note as market cheered the country’s transition to Goods
and Services tax (GST) - envisaged to be a game changing reform in the economic history of
India.
Adoption of GST makes the country a common market for all goods and services that come
under the GST base. Such a large and transformational reform will have its fair share of glitches.
Teething problems are bound to occur and would likely have been experienced irrespective of
the timing of GST rollout. For instance, firms have run down their inventories in the run up to
GST and may take a couple of months to replenish the stock. The business focus has been
diverted towards near-term implementation challenges and in reassessing the viability of
operations. There are concerns about whether small and medium enterprises have created the
requisite infrastructure, how the IT backbone will hold up, and also about residual design
issues. This is a radical change and one gets a general sense of business confusion and
uncertainty. Businesses, relying on tax avoidance as the main source of profitability, are
reassessing their viability. This could induce near-term job losses and low investment too as
businesses focus on improving efficiency in the process of entering the formal economy. There
could be a growth hit in the first quarter.
However, once the system stabilizes, one can envisage significant efficiency and productivity
gains for the Indian market. A common market should significantly ease the movement of
goods and services across the country, reduce transactions costs and boost efficiency as firms
will be forced to decide investments, supply chains and business models on economic criteria,
rather than being constrained by tax considerations. All this should have a significant impact
on total factor productivity over time. The self-policing nature of the new taxation regime is
likely to increase compliance, broaden the tax base and eventually boost tax revenues.
Furthermore, in principle, a broader indirect tax-base should spill-over into a broader direct
tax base, as big-data can be used to ensure that new indirect-taxpayers are also in the net for
direct taxes.
Finally, with effective tax rates on goods coming down but those on services going up, and with
large portions of the CPI exempt from tax, we expect the impact on CPI inflation to be minimal –
something echoed by the RBI – presuming that both tax hikes and cuts are symmetrically
passed through to consumers.
Real estate Regulation Act (RERA) and RBI ordinance are other bold measures taken during the
last quarter. In principle, the RERA rules have the ability to clean the real estate mess lurking in
the economy from the past cycle. But with real estate being the state subject, the real clean-up
depends on the states’ willingness to adopt it. So far, Maharashtra has been prompt to adopt
the rules in an almost entirety.
In a bold step, RBI identified 12 large NPA accounts which require increased provisioning by the
banks. Banks have also been asked to resolve 55 cases of bad loans within six months or refer
to the Insolvency and Bankruptcy Code. We have constantly been emphasizing the fast-track
clean-up required in the banks lest the economy to grow to its full potential.
That said, higher provisioning could lead to muted earnings for banks going ahead. On top of
02

that, earnings over 1H FY18 could also be disrupted from the GST implementation, thus
challenging the 20% of NIFTY earnings growth penciled in by the market. Market is counting on
fiscal stimulus from the recent farm loan waiver decisions. But if history is anything to learn by,
the full disbursement of funds will take a couple of years.
Valuations are already rich owing primarily to robust equity market participation by FIIs and
Domestic Mutual funds. Together, they have invested US$ 14.7 billion this year. Sensex is
trading around 19 times 1-year forward earnings as investors bet on the long-term growth
potential of the economy.
Indian economy is an interesting situation of structural long-term growth, but protracted
cyclical challenges. GST, structured to boost tax and logistic efficiency, lower inflation and
rebalancing of the real estate market boosting the financial savings and thus reducing the cost
of investment, digitalization, stabilizing land prices and cheap labor augurs well for long-term
growth and corporate profitability. That said, myriad of cyclical challenges such as bank stress,
high private sector leverage and hence low investment, sector specific challenges (IT and
pharma) and tax disruption clouds the near-term earnings trajectory.
The pick-up in global trade cycle and likely focus on global infrastructure and defense
spending are positive for Indian exports which move in tight sync with the global exports.
However, barring Japan, the central banks have recognized the need to end or reverse the
quantitative easing. The global monetary and hence liquidity tightening will have its
repercussion on the FII inflows and one needs to be cognizant of that. That said, reserves
accumulation by the RBI since 2014 makes India relatively well prepared to withstand the
shock.
Coming to the bond market, the recent fall in food inflation has been unexpectedly acute.
Favorable monsoon and sowing pattern thus far into the Kharif season, contained MSP
announcement and weakness in global food prices adds to the comfort of the food inflation
trajectory. The present print of ~2% inflation looks unsustainable and near-term uncertainty
around inflation has accentuated owing to multiple factors of 7th Pay commission
implementation, GST, unsustainably low food prices, fiscal profligacy in farm loan. But despite
all this, one could comfortably fathom inflation to average around 4% over the next couple of
years owing to falling cost of production and productivity gains that we discussed earlier.
Further, broad economic activity is weak with most of the economic fire-power coming from
government spending (both revenue and capital). In fact, interestingly while the FY17 GDP
growth was 7.1%, government expenditure grew by 21% during the period. Government
spending contributed 2% pt to India’s growth- second only to private consumption growth
(with 4.8% contribution). Thus, the near-term growth inflation dynamics warrants the
incremental accommodation in RBI’s monetary policy.
Rupee’s 5% appreciation in 2017 against the US$ makes it one of the best performers among its
peers. A stable current account, strong foreign investments and the possibility of weak crude
prices imply near-term stability in rupee. Strong rupee returns have been an additional
impetus to FII inflow in India. The debt market had a whopping inflow of US$ 14.6 billion
between January to June. This has led the FX reserves to go up by US$ 22 billion in 2017 (till
23rd June) and RBI’s long forward position to go up from near nil to US$ 13.5 billion as of April
end. Speculation runs that if the central bank is unable to roll-over its forward book, it could
further add to the liquidity glut of the market. While the central bank has decided to conduct a
Rs. 100 billion of OMO sale in 1st week of July, it has been re-emphasizing that they will be
doing so in a non-disruptive fashion. Owing to these mix of factors, liquidity may take its own
sweet time to normalize. The favorable liquidity and growth inflation dynamics makes us more
confident to maintain relatively high duration in our portfolio.
Navneet Munot, CIO – SBI Funds management Private Limited
(Mutual funds' investments are subject to market risks, read all scheme related
documents carefully.)
03

Dear Friends,
Executive Director & CMO (Domestic Business)
The mutual fund industry continues its momentum, with inflows of over Rs. 28,000 crore in
equity mutual funds in the April – June 2017 quarter, a significant growth from over a year ago.
A shift in inflows to equity-oriented schemes is primarily due to low yields and
unattractiveness in traditional investment avenues like small savings schemes (Fixed Deposits,
PPF, NSC etc.), Gold and Real Estate. This momentum should continue even though the equity
markets are at all-time highs as our economic fundamentals remain strong.
Mutual Funds are only going to thrive from here as investors now have realised the power of
financial investments. Investor Education will continue to play a strong role for the industry as
we need to continue to educate investors and savers both about mutual funds and how they are
an ideal investment option for any financial goal.
The growth in SIPs we have seen has been a great testimony to growing maturity of investors to
create wealth for the long term. We at SBI Mutual Fund continue to see sustained inflows into
our equity funds through SIPs. Our live SIP folios are moving towards the 2 million landmark,
with over 2.6 lacs added in the 1st quarter of FY 17, and our monthly SIP book value now stands
at Rs. 500 crore and growing further. It is a testament to the trust reposed in us and the timing
could not have been better as the fund house completed 30 years of its operations on June 29,
2017. We are proud of our parentage with State Bank of India. Our association with AMUNDI,
Europe's largest investment manager, has given us access to global best practices in Risk
Management, Research and Investment Processes.
As a fund house, we have strived to increase our reach to the furthest corners of the country
and give investors access to mutual funds as an investment option. We feel satisfied of what we
have achieved so far and shall continue to do our bit so as to become the Fund Manager to every
Indian. Our website and branches are both good sources of information and help for those
seeking to know more about mutual funds and us. Anytime is a good time to invest but the
earlier you begin the better it gets with mutual funds.
As always, we value your investments and look forward to your continued patronage.
Warm Regards,
D.P.Singh
D.P. SinghED & CMO (Domestic Business)
04
From the CMO’s Desk

Po
rtfo
lio
Cla
ssif
icati
on
By In
du
str
yA
llo
cati
on
(%
) as o
n 3
0 J
un
e 2
017
Port
folio C
lassif
icati
on B
y I
nd
ustr
yA
llocati
on (
%)
(Top
10)
Oth
er
De
tail
s
Exit
Load
Wit
hin
1 Y
ear
- 1
%W
ithin
1 Y
ear
- 1
%W
ithin
6 M
onth
s -
1%
;6
Month
s t
o 1
Year
-0
.50%
Wit
hin
1 Y
ear
- 1
%W
ithin
1 Y
ear
- 1
%W
ithin
1 Y
ear
- 1
%W
ithin
1 Y
ear
- 1
%
Fin
ancia
l Serv
ices
29
.34
Auto
mobile
10
.90
Consum
er
Goods
9.3
3
Energ
y6
.93
Constr
ucti
on
6.5
4
Pharm
a5
.93
IT5
.43
Fert
ilis
ers
& P
esti
cid
es
4.3
5
Industr
ial
Manufa
ctu
ring
3.9
7
Cem
ent
& C
em
ent
Pro
ducts
3.5
3
Fin
ancia
l Serv
ices
37.0
0
IT13.8
0
Consum
er
Goods
11.1
8
Energ
y11.0
6
Pharm
a6.5
6
Serv
ices
5.2
1
Constr
ucti
on
4.1
1
Auto
mobile
3.8
8
Tele
com
3.4
2
Media
& E
nte
rtain
ment
1.9
9
Fin
ancia
l Serv
ices
28.0
5
Consum
er
Goods
15.0
1
Energ
y9.9
8
Auto
mobile
8.5
2
IT6.3
9
Constr
ucti
on
5.8
6
Meta
ls4.5
7
Pharm
a4.0
3
Industr
ial
Manufa
ctu
ring
2.8
3
Cem
ent
& C
em
ent
Pro
ducts
2.8
1
Fin
ancia
l Serv
ices
32.9
4
Serv
ices
9.2
1
IT8.8
2
Pharm
a8.6
4
Consum
er
Goods
8.1
4
Constr
ucti
on
7.7
8
Auto
mobile
6.5
8
Energ
y5.1
7
Industr
ial
Manufa
ctu
ring
4.3
0
Tele
com
2.3
6
Fin
ancia
l Serv
ices
26.5
1
Consum
er
Goods
21.4
9
Energ
y10.6
9
Auto
mobile
9.2
9
Pharm
a5.9
9
Industr
ial
Manufa
ctu
ring
3.7
8
Constr
ucti
on
3.6
7
Fert
ilis
ers
&Pesti
cid
es
3.6
1
Serv
ices
3.4
7
IT3.3
8
Fin
ancia
l Serv
ices
19.4
5
Consum
er
Goods
14.3
0
Industr
ial
Manufa
ctu
ring
13.2
8
Pharm
a12.4
3
Fert
ilis
ers
& P
esti
cid
es
7.6
6
Constr
ucti
on
5.7
4
Serv
ices
5.1
5
Healt
hcare
Serv
ices
4.4
9
Cem
ent
& C
em
ent
Pro
ducts
4.4
5
IT2.3
8
Industr
ial
Manufa
ctu
ring
18.0
0
Consum
er
Goods
16.5
1
Fin
ancia
l Serv
ices
12.5
3
Serv
ices
11.7
5
Auto
mobile
9.0
9
Chem
icals
6.8
6
Pharm
a5.9
1
Texti
les
4.5
7
Fert
ilis
ers
& P
esti
cid
es
4.0
5
Constr
ucti
on
2.1
6
Fu
nd
Deta
ils a
s o
n 3
0 J
un
e 2
017
Month
End
AU
M (
Rs. in
Cro
res)
`14,2
92.5
9 C
rore
s`2
,05
0.2
3 C
rore
s`2
,49
8.7
1 C
rore
s`1
,770
.41
Cro
res
`1
,86
0.8
4 C
rore
s`3
,79
6.7
2 C
rore
s`3
,07
7.6
5 C
rore
s
Port
folio T
urn
over
1.0
30
.54
0.4
20
.79
0.9
50
.45
0.3
7
Exp
ense R
ati
oRegula
r-1.9
7%
Dir
ect-
1.1
2%
Regula
r- 2
.10
%D
irect-
1.5
3%
Regula
r-2.0
7%
,D
irect-
1.2
2%
Regula
r-2
.12
%,
Dir
ect-
1.6
1%
Regula
r-2
.11
%D
irect-
1.7
4%
Regula
r-2
.03
%,
Dir
ect-
1.1
7%
Regula
r-2
.05
%,
Dir
ect-
1.3
9%
Sta
nd
ard
Devia
tion
Beta
Sharp
e R
ati
o
12.2
1%
0.8
6
0.7
6
13
.23
%
0.9
4
0.4
9
14
.04
%
0.9
8
0.8
5
13
.98
%
0.9
6
0.5
2
13
.98
%
1.0
0
0.7
0
14
.02
%
0.7
6
1.0
8
12
.19
%
0.6
4
0.7
7
Schem
e N
am
eSBI
Blu
e C
hip
Fund
SBI
Magnum
Eq
uit
y F
und
SBI
Magnum
Mult
icap
Fund
SBI
Contr
a F
und
(Pre
vio
usly
know
n a
s S
BI
MSFU
- C
ontr
aFund)
SBI
Magnum
Mult
iplier
Fund
(Pre
vio
usly
know
n a
sSBI M
agnum
Mult
iplier
Plu
sSchem
e 1
993)
SBI
Magnum
Mid
cap
Fund
SBI
Magnum
Glo
bal Fund
Ideal In
vestm
ent
Hori
zon
4years
+3
years
+4
years
+5
years
+4
years
+5
years
+5
years
+
Incep
tion D
ate
14/02/2006
01
/0
1/1
99
12
9/0
9/20
05
14
/0
7/1
99
92
8/0
2/1
99
32
9/0
3/2
00
53
0/0
9/1
99
4
Fund
Manager
Ms.
Sohin
i A
ndani
Mr.
R.
Sri
niv
asan
Mr.
Anup U
padhyay
Mr.
R.
Sri
niv
asan
Mr.
Saura
bh P
ant
Ms. Sohin
i A
ndani
Mr.
R. Sri
niv
asan
Managin
g S
ince
Sep-2010
May-2
00
9Feb-2
01
7Ju
n-2
01
1Sep-2
01
6Ju
ly-2
01
0M
ay-2
00
9
Benchm
ark
S&
P B
SE 1
00 Index
Nif
ty 5
0 Index
S&
P B
SE 5
00
Index
S&
P B
SE 1
00
Index
S&
P B
SE 2
00
Index
Nif
ty M
idSm
allcap
400
Index
S&
P B
SE M
idSm
allC
ap
Index
Po
rtfo
lio
Cla
ssif
icati
on
By
Asset
Allo
cati
on
(%
) as o
n 3
0 J
un
e 2
017
Larg
e C
ap
(%
)
Mid
Cap
(%
)
Sm
all C
ap
(%
)
Oth
er
Assets
(%
)
71.5
5
18.6
6
9.7
8
-
98
.21
-
1.7
9
-
64
.48
23
.77
8.6
5
3.1
0
52
.80
25
.60
12
.06
9.5
4
63
.56
25
.74
8.6
9
2.0
1
6.0
7
76
.62
12
.25
5.0
6
10
.07
72
.14
11
.85
5.9
4
Snap
shot
of
Eq
uit
y F
und
s
Ple
ase
consu
lt y
our
financia
l advis
or
befo
re invest
ing.
05
Po
rtfo
lio
Cla
ssif
icati
on
By In
du
str
yA
llo
cati
on
(%
) as o
n 3
0 J
un
e 2
017
Port
folio C
lassif
icati
on B
y I
nd
ustr
yA
llocati
on (
%)
(Top
10)
Fin
ancia
l Serv
ices
28
.32
Consum
er
Goods
19
.11
Industr
ial
Manufa
ctu
ring
13
.07
Serv
ices
12
.12
Pharm
a1
1.2
1
Chem
icals
7.3
0
Cash &
Oth
er
Reciv
able
s5
.05
Auto
mobile
2.8
9
CBLO
0.9
1
Consum
er
Goods
21.9
4
Industr
ial
Manufa
ctu
ring
19.1
9
Chem
icals
17.2
5
Serv
ices
11.3
6
Pharm
a6.7
6
Auto
mobile
6.5
4
Texti
les
5.0
0
Media
&Ente
rtain
ment
3.4
6
Constr
ucti
on
3.0
6
Cem
ent
& C
em
ent
Pro
ducts
2.0
2
Fin
ancia
l Serv
ices
33.0
1
Consum
er
Goods
12.2
0
Auto
mobile
9.3
6
Energ
y7.9
4
Constr
ucti
on
6.4
2
Pharm
a5.2
7
Serv
ices
4.6
5
Cem
ent
& C
em
ent
Pro
ducts
4.5
6
IT3.7
0
Industr
ial
Manufa
ctu
ring
3.0
2
Pharm
a83.9
3
Healt
hcare
Serv
ices
12.4
2
Cash &
Oth
er
Reciv
able
s-0.9
5
CBLO
4.6
0
Fin
ancia
l Serv
ices
93.4
3
Consum
er
Goods
1.1
9
Cash &
Oth
er
Reciv
able
s0.1
0
CBLO
5.2
8
Energ
y50.2
9
Fin
ancia
l Serv
ices
23.1
7
Constr
ucti
on
6.0
4
Industr
ial
Manufa
ctu
ring
5.2
3
Serv
ices
4.3
3
Meta
ls3.4
2
Cash &
Oth
er
Reciv
able
s-0.0
9
CBLO
7.6
1
Energ
y37.1
9M
eta
ls17.5
6C
em
ent
& C
em
ent
Pro
ducts
13.6
8Fert
ilis
ers
&Pesti
cid
es
10.3
2A
uto
mobile
6.7
7C
hem
icals
4.6
5In
dustr
ial
Manufa
ctu
ring
4.6
0C
onsum
er
Goods
1.4
1C
ash &
Oth
er
Reciv
able
s-2.5
5C
BLO
6.3
7
Fu
nd
Deta
ils a
s o
n 3
0 J
un
e 2
017
Month
End
AU
M (
Rs. in
Cro
res)
`1,9
20.0
7 C
rore
s`7
06
.95
Cro
res
`5
,66
3.4
7 C
rore
s`9
32.0
4 C
rore
s`4
14
.75
Cro
res
`2
08.5
3 C
rore
s`2
97
.69
Cro
res
Port
folio T
urn
over
0.3
20
.39
0.7
10
.56
-0
.36
0.6
3
Exp
ense R
ati
oRegula
r-2.1
1%
Dir
ect-
1.4
4 %
Regula
r-2
.38
%D
irect-
1.4
9%
Regula
r-2.0
0%
,D
irect-
1.5
5%
Regula
r-2
.28
%,
Dir
ect-
1.2
8%
Regula
r-2
.51
%D
irect-
1.6
7%
Regula
r-2
.57
%,
Dir
ect-
2.2
0%
Regula
r-2
.53
%,
Dir
ect-
1.9
9%
Sta
nd
ard
Devia
tion
Beta
Sharp
e R
ati
o
12.5
2%
0.7
6
0.7
4
17
.16
%
0.7
9
1.2
9
13
.27
%
0.9
4
0.4
8
17
.89
%
0.9
5
0.3
4
- - -
16
.94
%
0.8
7
-0
.06
15
.49
%
0.8
3
0.3
4
Schem
e N
am
e
SBI
Em
erg
ing
Busin
esses F
und
(Pre
vio
usly
know
n a
s S
BI
MSFU
- E
merg
ing
Busin
esses F
und)
SBI
Sm
all &
Mid
cap
Fund
SBI
Magnum
Taxgain
Schem
eSBI
Pharm
a F
und
SBI
Bankin
g &
Fin
ancia
l Serv
ices
Fund
SBI
PSU
Fund
SBI
Magnum
CO
MM
A F
und
Ideal In
vestm
ent
Hori
zon
5years
+5
years
+3
years
+Tacti
cal
Tacti
cal
Tacti
cal
Tacti
cal
Incep
tion D
ate
11/10/2004
09
/0
9/2
00
93
1/0
3/19
93
14
/0
7/1
99
92
6/0
2/2
01
50
7/0
7/2
01
00
8/0
8/2
00
5
Fund
Manager
Mr.
R.
Sri
niv
asan
Mr.
R.
Sri
niv
asan
Mr.
Din
esh
Bala
chandra
nM
r. T
anm
aya
Desai
Ms. Sohin
i A
ndani
Mr.
Ric
hard
D's
ouza
Mr.
Ric
hard
D's
ouza
Managin
g S
ince
May-2009
Nov
- 2
01
3Sep-2
01
6Ju
n-2
01
1Feb-2
01
5A
ug-2
01
4A
ug-2
01
4
Benchm
ark
S&
P B
SE 5
00 Index
S&
P B
SE S
mall C
ap Index
S&
P B
SE 1
00
Index
S&
P B
SE H
EA
LT
H C
AR
EIn
dex
Nif
ty F
inancia
l Serv
ices
S&
P B
SE P
SU
IN
DEX
Nif
ty C
om
modit
ies
Index
Po
rtfo
lio
Cla
ssif
icati
on
By
Asset
Allo
cati
on
(%
) as o
n 3
0 J
un
e 2
017
Larg
e C
ap
(%
)
Mid
Cap
(%
)
Sm
all C
ap
(%
)
Oth
er
Assets
(%
)
26.9
8
48.2
1
18.8
6
5.9
6
-
32
.53
64
.06
3.4
1
74
.18
23
.00
2.3
0
0.5
2
35
.67
50
.58
10
.10
3.6
5
83
.68
9.4
2
1.1
9
5.7
1
63
.83
28
.65
-
7.5
2
57
.45
22
.74
16
.00
3.8
2
Oth
er
De
tail
s
Exit
Load
Wit
hin
1 Y
ear
- 1
%W
ithin
1 Y
ear
- 1
%N
ILW
ithin
15
Days -
0.5
0%
Wit
hin
1 Y
ear
- 1
%W
ithin
1 Y
ear
- 1
%W
ithin
1 Y
ear
- 1
%
Snap
shot
of
Eq
uit
y F
und
s
Ple
ase
consu
lt y
our
financia
l advis
or
befo
re invest
ing.
06

Po
rtfo
lio
Cla
ssif
icati
on
By In
du
str
yA
llo
cati
on
(%
)a
s o
n 3
0 J
un
e 2
01
7
Port
folio C
lassif
icati
on B
y I
nd
ustr
yA
llocati
on (
%)
(Top
10)
Constr
ucti
on
27.5
3
Industr
ial
Manufa
ctu
ring
19.5
6
Energ
y18.2
6
Tele
com
13.0
8
Serv
ices
12.4
5
Cem
ent
& C
em
ent
Pro
ducts
3.1
6
Auto
mobile
2.6
6
Cash &
Oth
er
Reciv
able
s1.4
1
CBLO
1.8
9
Consum
er
Goods
94.4
0
Texti
les
4.6
9
Cash &
Oth
er
Reciv
able
s-0.0
6
CBLO
0.9
7
IT97.0
9
Cash &
Oth
er
Reciv
able
s-1.5
4
CBLO
4.4
5
Mutu
al Fund
99.8
4
Cash &
Oth
er
Reciv
able
s-0.1
5
CBLO
0.3
1
Fin
ancia
l Serv
ices
25.9
1
Serv
ices
7.9
0
Cem
ent
& C
em
ent
Pro
ducts
7.1
2
Auto
mobile
6.4
1
Tele
com
5.9
1
Media
& E
nte
rtain
ment
5.7
3
Energ
y4.8
0
Consum
er
Goods
4.3
1
Pharm
a4.1
4
Industr
ial
Manufa
ctu
ring
3.8
6
Fin
ancia
l Serv
ices
33.6
9
Energ
y12.5
4
IT11.1
6
Consum
er
Goods
10.7
5
Auto
mobile
10.6
0
Pharm
a4.4
5
Meta
ls3.8
1
Constr
ucti
on
3.7
0
Tele
com
2.0
4
Cem
ent
& C
em
ent
Pro
ducts
1.9
4
Fu
nd
Deta
ils
as
on
30
Ju
ne
20
17
Month
End
AU
M (
Rs. in
Cro
res)
`573.0
1 C
rore
s`3
37.3
3 C
rore
s`5
6.2
8 C
rore
s`4
25
.37
Cro
res
`7
65
.09
Cro
res
`2
19
.04
Cro
res
Port
folio T
urn
over
0.6
90
.17
0.2
9-
10
.40
0.7
1
Exp
ense R
ati
oRegula
r-2
.42
%D
irect-
1.9
0%
Regula
r-2
.53
%D
irect-
1.7
9%
Regula
r-2
.70
%D
irect-
2.1
5%
Regula
r-0
.52
%,
Dir
ect-
0.1
3%
Regula
r-0
.91
%,
Dir
ect-
0.4
3%
Regula
r-0
.66
%,
Dir
ect-
0.2
7%
Sta
nd
ard
Devia
tion
Beta
Sharp
e R
ati
o
14.9
5%
0.7
1
0.3
9
14
.94
%
0.9
8
0.8
5
15
.18
%
0.8
0
-0
.00
3
- - -
0.5
6%
1.2
0
0.5
8
- - -
Schem
e N
am
eSBI
Infr
astr
uctu
reFund
SBI
FM
CG
Fund
(Pre
vio
usly
know
n a
s S
BI
MSFU
- F
MC
G F
und)
SBI
IT F
und
(Pre
vio
usly
know
n a
s S
BI
MSFU
- IT F
und)
SBI
Gold
Fund
SBI
Arb
itra
ge
Op
port
unit
ies F
und
SBI
Nif
ty I
nd
ex F
und
(Pre
vio
usly
know
n a
s S
BI M
agnum
Index F
und)
Ideal In
vestm
ent
Hori
zon
Tacti
cal
Tacti
cal
Tacti
cal
Tacti
cal
3m
onth
s3
years
+
Incep
tion D
ate
06/07/2
00
71
4/0
7/1
99
91
4/0
7/1
99
91
2/0
9/2
01
10
3/1
1/2
00
61
7/0
1/2
00
2
Fund
Manag
er
Mr.
Ric
hard
D's
ouza
Mr.
Saura
bh P
ant
Mr.
Anup U
padhyay
Mr.
Ravip
rakash S
harm
aM
r. N
eera
j K
um
ar
Mr.
Ravip
rakash
Sharm
a
Manag
ing
Sin
ce
Aug-20
14
Jun-2
01
1Ju
n-2
01
1Sep-2
01
1O
ct-
20
12
Feb-2
01
1
Benchm
ark
Nif
ty Infr
astr
uctu
reIn
dex
S&
P B
SE F
ast
Movin
gC
onsum
er
Goods Index
S&
P B
SE -
Info
rmati
on
Technolo
gy Index
Pri
ce o
f Physic
al G
old
CR
ISIL
Liq
uid
Fund
Index
Nif
ty 5
0 Index
Po
rtfo
lio
Cla
ss
ific
ati
on
By
As
se
tA
llo
ca
tio
n (
%)
as
on
30
Ju
ne
20
17
Larg
e C
ap
(In
%)
Mid
Cap
(In
%)
Sm
all C
ap
(In
%)
Oth
er
Assets
(In
%)
38.2
7
37.3
1
21.1
2
3.3
0
59
.73
20
.64
18
.72
0.9
1
63
.61
25
.89
-
10
.51
- - -
10
0.0
0
26
.71
39
.93
0.1
5
33
.21
95
.80
0.3
9
-
3.8
1
Oth
er
De
tail
s
Exit
Load
Wit
hin
1 Y
ear
- 1
%W
ithin
15
Days -
0.5
0%
Wit
hin
15
Days -
0.5
0%
Wit
hin
1 Y
ear
- 1
%W
ithin
1 M
onth
- 0
.50
%N
il
Snap
shot
of
Eq
uit
y F
und
s
Ple
ase
consu
lt y
our
financia
l advis
or
befo
re invest
ing.
07

08
EQUITY-LARGE CAP
Option NAV ( )`
Reg-Plan-Growth 34.9294
Reg-Plan-Dividend 19.8776
Dir-Plan-Dividend 23.5613
Dir-Plan-Growth 36.2961
NET ASSET VALUE
Record Date Dividend NAV ( )`(in /Unit)`
23-Sep-16 (Reg Plan) 1.00 18.5964
23-Sep-16 (Dir Plan) 1.20 21.8569
17-Jul-15 (Reg Plan) 2.50 17.6880
17-Jul-15 (Dir Plan) 2.90 20.5395
21- Mar-14 (Reg Plan) 1.80 12.7618
LAST DIVIDENDS
Investors understand that their principal
will be at Moderately High risk
�
�
Long term capital appreciation.
Investment in equity shares of companies whose market capitalization is at least equal to or morethan the least market capitalized stock of S&P BSE 100 index to provide long term capital growthopportunities.
SBI Blue Chip FundThis product is suitable for investors who are seeking^:
Face value: 10`
Investment Objective
Quantitative Data
To provide investors with opportunities
for long-term growth in capital through
an active management of investments in a
diversified basket of equity stocks of
companies whose market capitalization
is at least equal to or more than the least
market capitalized stock of S&P BSE 100
Index.
Fund Details
Standard Deviation :
Beta :
Sharpe Ratio :
Portfolio Turnover* :
#
#
#
12.21%
0.86
0.76
1.03#Source : CR IS IL Fund Ana lyser
*Portfolio Turnover = lower of total sale ortotal purchase for the last 12 monthsupon Avg. AUM of trailing twelve months.
Risk Free rate: FBIL Overnight Mibor rate(6.25% as on 30th June 2017) Basis forRatio Calculation: 3 Years Monthly DataPoints
PORTFOLIO CLASSIFICATION BY
(%)ASSET ALLOCATION
Financial Services 29.34Automobile 10.90Consumer Goods 9.33Energy 6.93Construction 6.54Pharma 5.93IT 5.43Fertilisers & Pesticides 4.35Industrial Manufacturing 3.97Cement & Cement Products 3.53Metals 2.39Healthcare Services 1.93Chemicals 0.62Cash & Other Recivables -4.29Futures 4.72CBLO 8.24Fixed Deposits 0.14
Large Cap Midcap
FuturesCash & Other Current Assets
•
•
•
•
•
•
•
•
•
•
•
•
•
•
Type of Scheme
Date of Allotment:
Report As On:
AAUM for the Month of June 2017
AUM as on June 30, 2017
Fund Manager: Ms. Sohini Andani
Managing Since:
Total Experience:
Benchmark:
Exit Load:
Entry Load:
Plans Available:
Options:
SIP
Minimum Investment
Additional Investment
An Open - Ended Growth Scheme
14/02/2006
30/06/2017
14,204.29 Crores
14,292.59 Crores
Sep-2010
Over 22 years
S&P BSE 100 Index
For exit within 1 year from the date of
allotment - 1 %; For exit after 1 year
from the date of allotment - Nil
N.A.
Regular, Direct
Growth, Dividend
Weekly - Minimum 1000 & in multiples
of 1 thereafter for a minimum of 6
instalments.
Monthly - Minimum 1000 & in
multiples of 1 thereafter for minimum
six months (or) minimum 500 & in
multiples of 1 thereafter for minimum
one year.
Quarterly - Minimum 1500 & in
multiples of 1 thereafter for minimum
one year.
5000 & in multiples of 1
1000 & in multiples of 1
`
`
`
`
`
`
`
`
`
`
` `
` `
PORTFOLIO CLASSIFICATION BY
INDUSTRY ALLOCATION (%)
PORTFOLIO
HDFC Bank Ltd. 8.29Larsen & Toubro Ltd. 4.46ITC Ltd. 4.07UPL Ltd. 2.95Infosys Ltd. 2.93Mahindra & Mahindra Ltd. 2.92Nestle India Ltd. 2.90Reliance Industries Ltd. 2.86Indusind Bank Ltd. 2.68State Bank Of India 2.63Kotak Mahindra Bank Ltd. 2.57HCL Technologies Ltd. 2.50Bharat Electronics Ltd. 2.48Cholamandalam Investment AndFinance Company Ltd. 2.36Hero Motocorp Ltd. 2.16Hindustan Petroleum Corporation Ltd. 2.11Motherson Sumi Systems Ltd. 1.98Maruti Suzuki India Ltd. 1.90ICICI Bank Ltd. 1.88Sun Pharmaceuticals Industries Ltd. 1.66HDFC Ltd. 1.66Strides Shasun Ltd. 1.59Titan Company Ltd. 1.58Hindalco Industries Ltd. 1.57Ultratech Cement Ltd. 1.52Voltas Ltd. 1.48Mahindra & Mahindra Financial Services Ltd. 1.42The Ramco Cements Ltd. 1.41PI Industries Ltd. 1.40Aurobindo Pharma Ltd. 1.39Indian Oil Corporation Ltd. 1.36The Federal Bank Ltd. 1.22LIC Housing Finance Ltd. 1.18Shriram Transport Finance Company Ltd. 1.10
Stock Name (%) Of Total AUM Stock Name (%) Of Total AUM
Apollo Hospitals Enterprises Ltd. 1.04Tata Motors Ltd. (Dvr-A-Ordy) 0.85Eicher Motors Ltd. 0.84Shriram City Union Finance Ltd. 0.79Divi's Laboratories Ltd. 0.73Pidilite Industries Ltd. 0.62Fag Bearings India Ltd. 0.62Sadbhav Engineering Ltd. 0.61Grasim Industries Ltd. 0.60Petronet LNG Ltd. 0.60Hudco Ltd. 0.58Torrent Pharmaceuticals Ltd. 0.55Thermax Ltd. 0.52Dr. Lal Path Labs Ltd. 0.49Coal India Ltd. 0.44Narayana Hrudayalaya Ltd. 0.41Britannia Industries Ltd. 0.40Tata Steel Ltd. 0.38Procter & Gamble Hygiene AndHealth Care Ltd. 0.38SKF India Ltd. 0.35Tata Motors Ltd. 0.26
Motilal Oswal Securities LtdCP Mat 28.07.2017. 0.42
HDFC Bank Ltd. 0.14
HDFC Ltd. 0.56
Equity Shares Total 90.22
Commercial Paper Total 0.42
Fixed Deposits Total 0.14CBLO 8.24Cash & Other Receivables (4.29)Futures 4.72
Warrants Total 0.56Grand Total 100.00
Pursuant to payment of dividend, the NAV of Dividend Option ofscheme/plans would fall to the extent of payout and statutory levy, ifapplicable.
^Investors should consult their financial advisers if in doubt about whether the product is suitable for them.
71.55
18.66
5.064.72

09
EQUITY-LARGE CAP
Option NAV ( )`
Reg-Plan-Growth 88.6063
Reg-Plan-Dividend 30.9490
Dir-Plan-Dividend 36.5951
Dir-Plan-Growth 91.3887
NET ASSET VALUE
Record Date Dividend NAV ( )`(in /Unit)`
30-May-17 (Reg Plan) 2.00 30.8936
(Dir Plan) 2.50 36.502730-May-17
29-Apr-16 (Reg Plan) 4.50 27.4893
29-Apr-16 (Dir Plan) 5.00 32.3240
24-Apr-15 (Reg Plan) 6.00 31.7479
24-Apr-15 (Dir Plan) 7.00 36.7592
LAST DIVIDENDS
Investors understand that their principal
will be at Moderately High risk
�
�
Long term capital appreciation.
Investments in high growth companies along with the liquidity of an open-ended scheme throughinvestments primarily in equities.
SBI Magnum Equity FundThis product is suitable for investors who are seeking^:
Face value: 10`
Investment Objective
Quantitative Data
To provide the investor long-term capital
appreciation by investing in high growth
companies along with the liquidity of an
o p e n - e n d e d s c h e m e t h r o u g h
investments primarily in equities and the
balance in debt and money market
instruments.
Fund Details
Standard Deviation :
Beta :
Sharpe Ratio :
Portfolio Turnover* :
#
#
#
13.23%
0.94
0.49
0.54#Source : CR IS IL Fund Ana lyser
*Portfolio Turnover = lower of total sale ortotal purchase for the last 12 monthsupon Avg. AUM of trailing twelve months.
Risk Free rate: FBIL Overnight Mibor rate(6.25% as on 30th June 2017) Basis forRatio Calculation: 3 Years Monthly DataPoints
PORTFOLIO CLASSIFICATION BY
(%)ASSET ALLOCATION
Financial Services 37.00
IT 13.80
Consumer Goods 11.18
Energy 11.06
Pharma 6.56
Services 5.21
Construction 4.11
Automobile 3.88
Telecom 3.42
Media & Entertainment 1.99
Cash & Other Recivables 0.66
CBLO 1.13
Large Cap Cash & Other Current Assets
Pursuant to payment of dividend, the NAV of Dividend Option ofscheme/plans would fall to the extent of payout and statutory levy, ifapplicable.
•
•
•
•
•
•
•
•
•
•
•
•
•
•
Type of Scheme
Date of Allotment:
Report As On:
AAUM for the Month of June 2017
AUM as on June 30, 2017
Fund Manager: Mr. R. Srinivasan
Managing Since:
Total Experience:
Benchmark:
Exit Load:
Entry Load:
Plans Available:
Options:
SIP
Minimum Investment
Additional Investment
An Open - Ended Equity Scheme
01/01/1991
30/06/2017
2,062.30 Crores
2,050.23 Crores
May-2009
Over 24 years
Nifty 50 Index
For exit within 1 year from the date of
allotment - 1 %;
For exit after 1 year from the date of
allotment - Nil
N.A.
Regular, Direct
Growth, Dividend
Weekly - Minimum 1000 & in multiples
of 1 thereafter for a minimum of 6
instalments.
Monthly - Minimum 1000 & in
multiples of 1 thereafter for minimum
six months (or) minimum 500 & in
multiples of 1 thereafter for minimum
one year
Quarterly - Minimum 1500 & in
multiples of 1 thereafter for minimum
one year.
1000 & in multiples of 1
1000 & in multiples of 1
`
`
`
`
`
`
`
`
`
`
` `
` `
PORTFOLIO CLASSIFICATION BY
INDUSTRY ALLOCATION (%)
PORTFOLIO
HDFC Bank Ltd. 9.89
ITC Ltd. 7.40
ICICI Bank Ltd. 7.30
State Bank Of India 5.99
Infosys Ltd. 5.01
HCL Technologies Ltd. 4.98
Reliance Industries Ltd. 4.70
Kotak Mahindra Bank Ltd. 4.65
HDFC Ltd. 4.16
Larsen & Toubro Ltd. 4.11
Colgate Palmolive (India) Ltd. 3.78
Bharti Airtel Ltd. 3.42
Interglobe Aviation Ltd. 3.12
Aurobindo Pharma Ltd. 2.63
Sun Pharmaceuticals Industries Ltd. 2.43
Petronet LNG Ltd. 2.31
Stock Name (%) Of Total AUM Stock Name (%) Of Total AUM
Bajaj Finance Ltd. 2.20
Bharat Petroleum Corporation Ltd. 2.18
Container Corporation Of India Ltd. 2.09
Sun TV Network Ltd. 1.99
Hero Motocorp Ltd. 1.98
Axis Bank Ltd. 1.94
Oracle Financial Services Software Ltd. 1.93
Bajaj Auto Ltd. 1.90
Tata Consultancy Services Ltd. 1.88
Indian Oil Corporation Ltd. 1.87
Lupin Ltd. 1.50
Bank Of Baroda 0.87
Equity Shares Total 98.21
CBLO 1.13
Cash & Other 0.66
Grand Total 100.00
Receivables
^Investors should consult their financial advisers if in doubt about whether the product is suitable for them.
98.21
1.79

10
EQUITY-DIVERSIFIED CAP
Option NAV ( )`
Reg-Plan-Growth 42.2115
Reg-Plan-Dividend 22.8133
Dir-Plan-Dividend 26.3439
Dir-Plan-Growth 43.6986
NET ASSET VALUE
Record Date Dividend NAV ( )`(in /Unit)`
30-Dec-16 (Reg Plan) 1.90 19.2173
30-Dec-16 (Dir Plan) 2.20 22.0670
20-Nov-15 (Reg Plan) 2.90 19.2712
20-Nov-15 (Dir Plan) 3.20 21.8941
15-Mar-13 (Reg Plan) 1.40 12.5064
LAST DIVIDENDS
Investors understand that their principal
will be at Moderately High risk
�
�
Long term capital appreciation.
Investment in diversified basket of equity stocks spanning the entire market capitalizationspectrum to provide both long term growth opportunities and liquidity.
SBI Magnum Multicap FundThis product is suitable for investors who are seeking^:
Face value: 10`
Investment Objective
Quantitative Data
To provide investors with opportunitiesfor long-term growth in capital alongwith the liquidity of an open-endedscheme through an active managementof investments in a diversified basket ofequity stocks spanning the entire marketcapitalization spectrum and in debt andmoney market instruments.
Fund Details
Standard Deviation :
Beta :
Sharpe Ratio :
Portfolio Turnover* :
#
#
#
14.04%
0.98
0.85
0.42#Source : CR IS IL Fund Ana lyser
*Portfolio Turnover = lower of total sale ortotal purchase for the last 12 monthsupon Avg. AUM of trailing twelve months.
Risk Free rate: FBIL Overnight Mibor rate(6.25% as on 30th June 2017) Basis forRatio Calculation: 3 Years Monthly DataPoints
PORTFOLIO CLASSIFICATION BY
(%)ASSET ALLOCATION
Financial Services 28.05Consumer Goods 15.01Energy 9.98Automobile 8.52IT 6.39Construction 5.86Metals 4.57Pharma 4.03Industrial Manufacturing 2.83Cement & Cement Products 2.81Fertilisers & Pesticides 1.73Media & Entertainment 1.66Services 1.43Textiles 1.31Healthcare Services 1.02Telecom 0.89Chemicals 0.87Cash & Other Recivables -0.13CBLO 3.15
Pursuant to payment of dividend, the NAV of Dividend Option ofscheme/plans would fall to the extent of payout and statutory levy, ifapplicable.
•
•
•
•
•
•
•
•
•
•
•
•
•
•
Type of Scheme
Date of Allotment:
Report As On:
AAUM for the Month of June 2017
AUM as on June 30, 2017
Fund Manager: Mr. Anup Upadhyay
Managing Since:
otal Experience:
Benchmark:
Exit Load:
Entry Load:
Plans Available:
Options;
SIP
Minimum Investment
Additional Investment
An Open - Ended Growth Scheme
29/09/2005
30/06/2017
2,419.95 Crores
2,498.71 Crores
Feb-2017
T Over 10 years
S&P BSE 500 Index
For exit within 6 months from the date
of allotment - 1 %;
For exit after 6 months but within one
year from the date of allotment – 0.50%
For exit after one year from the date of
allotment - Nil
N.A.
Regular, Direct
Growth, Dividend
Weekly - Minimum 1000 & in multiples
of 1 thereafter for a minimum of 6
instalments.
Monthly - Minimum 1000 & in
multiples of 1 thereafter for minimum
six months (or) minimum 500 & in
multiples of 1 thereafter for minimum
one year.
Quarterly - Minimum 1500 & in
multiples of 1 thereafter for minimum
one year.
1000 & in multiples of 1
1000 & in multiples of 1
`
`
`
`
`
`
`
`
`
`
` `
` `
Large Cap Midcap
Cash & Other Current Assets Smallcap
PORTFOLIO CLASSIFICATION BY
INDUSTRY ALLOCATION (%)
PORTFOLIO
HDFC Bank Ltd. 5.68
ITC Ltd. 4.92
Kotak Mahindra Bank Ltd. 3.75
ICICI Bank Ltd. 3.45
Indusind Bank Ltd. 3.22
HCL Technologies Ltd. 2.98
Indian Oil Corporation Ltd. 2.74
State Bank Of India 2.51
Petronet LNG Ltd. 2.47
Bajaj Finserv Ltd. 2.37
Infosys Ltd. 2.30
Maruti Suzuki India Ltd. 2.25
Mahindra & Mahindra Financial Services Ltd. 2.10
Tata Motors Ltd. 1.97
Equitas Holdings Ltd. 1.91
Oil & Natural Gas Corporation Ltd. 1.89
Nestle India Ltd. 1.86
Muthoot Finance Ltd. 1.83
Colgate Palmolive (India) Ltd. 1.76
Mahindra & Mahindra Ltd. 1.74
Titan Company Ltd. 1.67
PNC Infratech Ltd. 1.62
UPL Ltd. 1.54
Motherson Sumi Systems Ltd. 1.53
Indraprastha Gas Ltd. 1.49
Laurus Labs Ltd. 1.47
Container Corporation Of India Ltd. 1.43
Hindalco Industries Ltd. 1.42
Hindustan Petroleum Corporation Ltd. 1.39
Ge T&D India Ltd. 1.37
Jubilant Foodworks Ltd. 1.36
Indian Terrain Fashions Ltd. 1.31
Sadbhav Engineering Ltd. 1.23
SREI Infrastucture Finance Ltd. 1.23
Stock Name (%) Of Total AUM Stock Name (%) Of Total AUM
Shankara Building Products Ltd. 1.20
Hindustan Zinc Ltd. 1.17
Procter & Gamble Hygiene And Health Care Ltd. 1.12
Hero Motocorp Ltd. 1.04
KEC International Ltd. 1.04
Tech Mahindra Ltd. 1.02
Dr. Lal Path Labs Ltd. 1.02
Strides Shasun Ltd. 1.01
Sagar Cements Ltd. 0.99
United Breweries Ltd. 0.93
TV Today Network Ltd. 0.92
Bharti Airtel Ltd. 0.89
Atul Ltd. 0.87
The India Cements Ltd. 0.87
Aurobindo Pharma Ltd. 0.86
Supreme Industries Ltd. 0.81
Sheela Foam Ltd. 0.81
Techno Electric & Engineering Company Ltd. 0.79
Coal India Ltd. 0.78
ITD Cementation India Ltd. 0.76
Sun TV Network Ltd. 0.74
Natco Pharma Ltd. 0.68
Mold-Tek Packaging Ltd. 0.65
Greenply Industries Ltd. 0.58
JK Cement Ltd. 0.49
Birla Corporation Ltd. 0.45
PSP Projects Ltd. 0.42
Insecticides (India) Ltd. 0.19
3DPLM Software Solutions Ltd. 0.08
Equity Shares Total 96.90
Redeemable Preference Shares Total 0.08
CBLO 3.15
Cash & Other Receivables (0.13)
Grand Total 100.00
^Investors should consult their financial advisers if in doubt about whether the product is suitable for them.
64.48
23.77
8.653.10

11
EQUITY-DIVERSIFIED CAP
Option NAV ( )`
Reg-Plan-Growth 105.0676
Reg-Plan-Dividend 20.3406
Dir-Plan-Dividend 25.4506
Dir-Plan-Growth 107.9678
NET ASSET VALUE
Investors understand that their principal
will be at Moderately High risk
�
�
Long term capital appreciation.
Equity Investments in contrarian stocks which are currently out of favour in the market to providemaximum growth opportunities.
SBI Contra FundThis product is suitable for investors who are seeking^:
Investment Objective
Quantitative Data
To provide the investors maximumgrowth opportunity through equityinvestments in stocks of growth orientedsectors of the economy.
Fund Details
Standard Deviation :
Beta :
Sharpe Ratio :
Portfolio Turnover* :
#
#
#
13.98%
0.96
0.52
0.79#Source : CR IS IL Fund Ana lyser
*Portfolio Turnover = lower of total sale ortotal purchase for the last 12 monthsupon Avg. AUM of trailing twelve months.
Risk Free rate: FBIL Overnight Mibor rate(6.25% as on 30th June 2017) Basis forRatio Calculation: 3 Years Monthly DataPoints
PORTFOLIO CLASSIFICATION BY
(%)ASSET ALLOCATION
Financial Services 32.94
Services 9.21
IT 8.82
Pharma 8.64
Consumer Goods 8.14
Construction 7.78
Automobile 6.58
Energy 5.17
Industrial Manufacturing 4.30
Telecom 2.36
Chemicals 2.32
Cash & Other Recivables 0.23
CBLO 3.49
•
•
•
•
•
•
•
•
•
•
•
•
•
•
Type of Scheme
Date of Allotment:
Report As On:
AAUM for the Month of June 2017
AUM as on June 30, 2017
Fund Manager: Mr. R. Srinivasan
Managing Since:
Total Experience:
Benchmark:
Exit Load:
Entry Load:
Plans Available:
Options:
SIP
Minimum Investment
Additional Investment
An Open - Ended Equity Fund
14/07/1999
30/06/2017
1,818.09 Crores
1,770.41 Crores
Jun-2011
Over 24 years
S&P BSE 100 Index
For exit within 1 year from the date of
allotment - 1 %;
For exit after 1 year from the date of
allotment - Nil.
N.A.
Regular, Direct
Growth, Dividend
Weekly - Minimum 1000 & in multiples
of 1 thereafter for a minimum of 6
instalments.
Monthly - Minimum 1000 & in
multiples of 1 thereafter for minimum
six months (or) minimum 500 & in
multiples of 1 thereafter for minimum
one year.
Quarterly - Minimum 1500 & in
multiples of 1 thereafter for minimum
one year.
5000 & in multiples of 1
1000 & in multiples of 1
`
`
`
`
`
`
`
`
`
`
` `
` `
Large Cap Midcap
Cash & Other Current Assets Smallcap
PORTFOLIO CLASSIFICATION BY
INDUSTRY ALLOCATION (%)
PORTFOLIO
HDFC Bank Ltd. 7.37
State Bank Of India 7.26
Procter & Gamble Hygiene AndHealth Care Ltd. 5.89
ICICI Bank Ltd. 5.40
Divi's Laboratories Ltd. 4.43
ELGI Equipments Ltd. 4.30
HCL Technologies Ltd. 4.23
Kotak Mahindra Bank Ltd. 3.78
Reliance Industries Ltd. 3.12
Aurobindo Pharma Ltd. 2.98
Gruh Finance Ltd. 2.76
Equitas Holdings Ltd. 2.54
Redington (India) Ltd. 2.45
Interglobe Aviation Ltd. 2.44
Bharti Airtel Ltd. 2.36
Balkrishna Industries Ltd. 2.35
Bajaj Finance Ltd. 2.33
Atul Ltd. 2.32
Sadbhav Engineering Ltd. 2.24
Stock Name (%) Of Total AUM Stock Name (%) Of Total AUM
Container Corporation Of India Ltd. 2.10
Bharat Petroleum Corporation Ltd. 2.06
KEC International Ltd. 2.04
Greenply Industries Ltd. 2.02
PNC Infratech Ltd. 1.86
IRB Infrastructure Developers Ltd. 1.65
JK Tyre And Industries Ltd. 1.54
Westlife Development Ltd. 1.50
Ceat Ltd. 1.42
SREI Infrastucture Finance Ltd. 1.40
MRF Ltd. 1.27
Adlabs Entertainment Ltd. 0.73
ITC Ltd. 0.24
Summit Securities Ltd. 0.11
Cognizant Technology Solutions Corporation 4.59
Taro Pharmaceuticals Industries Ltd. 1.23
Equity Shares Total 90.46
Foreign Equity Total 5.82
CBLO 3.49
Cash & Other Receivables 0.23
Grand Total 100.00
(Previously known as SBI MSFU - Contra Fund)
^Investors should consult their financial advisers if in doubt about whether the product is suitable for them.
52.80
25.60
12.06
9.54
Record Date Dividend NAV ( )`(in /Unit)`
23-Jun-17 (Dir Plan) 2.90 25.7138
23-Jun-17 (Reg Plan) 2.30 20.5531
26-Feb-16 (Dir Plan) 2.30 20.0765
26-Feb-16 (Reg Plan) 2.00 16.1649
26-Dec-14 (Reg Plan) 2.00 20.3376
LAST DIVIDENDS Face value: 10`
Pursuant to payment of dividend, the NAV of Dividend Option ofscheme/plans would fall to the extent of payout and statutory levy, ifapplicable.

12
EQUITY-DIVERSIFIED CAP
Option NAV ( )`
Reg-Plan-Growth 193.2659
Reg-Plan-Dividend 97.5076
Dir-Plan-Dividend 114.6362
Dir-Plan-Growth 196.8814
NET ASSET VALUE
Record Date Dividend NAV ( )`(in /Unit)`
27-Feb-17 (Reg-plan) 7.80 89.6546
27-Feb-17 (Dir-plan) 9.20 105.2064
12-Sep-14 (Reg-plan) 11.50 74.9641
LAST DIVIDENDS
Investors understand that their principal
will be at Moderately High risk
�
�
Long term capital appreciation.
Investments in diversified portfolio of equities of high growth companies to provide a blend of longterm capital appreciation and liquidity.
SBI Magnum Multiplier FundThis product is suitable for investors who are seeking^:
Face value: 10`
Investment Objective
Quantitative Data
To provide investors long term capitalappreciation/dividend along with theliquidity of an open-ended scheme.
Fund Details
Standard Deviation :
Beta :
Sharpe Ratio :
Portfolio Turnover* :
#
#
#
13.98%
1.00
0.70
0.95#Source : CR IS IL Fund Ana lyser
*Portfolio Turnover = lower of total sale ortotal purchase for the last 12 monthsupon Avg. AUM of trailing twelve months.
Risk Free rate: FBIL Overnight Mibor rate(6.25% as on 30th June 2017) Basis forRatio Calculation: 3 Years Monthly DataPoints
PORTFOLIO CLASSIFICATION BY
(%)ASSET ALLOCATION
Financial Services 26.51Consumer Goods 21.49Energy 10.69Automobile 9.29Pharma 5.99Industrial Manufacturing 3.78Construction 3.67Fertilisers & Pesticides 3.61Services 3.47IT 3.38Cement & Cement Products 2.00Healthcare Services 1.56Telecom 1.43Metals 1.08Chemicals 0.04Cash & Other Recivables -0.82CBLO 2.40Fixed Deposits 0.43
Pursuant to payment of dividend, the NAV of Dividend Option ofscheme/plans would fall to the extent of payout and statutory levy, ifapplicable.
•
•
•
•
•
•
•
•
•
•
•
•
•
•
Type of Scheme
Date of Allotment:
Report As On:
AAUM for the Month of June 2017
AUM as on June 30, 2017
Fund Manager: Mr. Saurabh Pant
Managing Since:
Total Experience
Benchmark:
Exit Load:
Entry Load:
Plans Available:
Options:
SIP
Minimum Investment
Additional Investment
An Open - Ended Equity Scheme
28/02/1993
30/06/2017
1,874.42 Crores
1,860.84 Crores
Sep-2016
Over 10 years
S&P BSE 200 Index
For exit within 12 months from the date
of allotment - 1.00%;
For exit after 12 months from the date
of allotment - Nil
N.A.
Regular, Direct
Growth, Dividend
Weekly - Minimum 1000 & in multiples
of 1 thereafter for a minimum of 6
instalments.
Monthly - Minimum 1000 & in
multiples of 1 thereafter for minimum
six months (or) minimum 500 & in
multiples of 1 thereafter for minimum
one year.
Quarterly - Minimum 1500 & in
multiples of 1 thereafter for minimum
one year.
5000 & in multiples of 1
1000 & in multiples of 1
`
`
`
`
`
`
`
`
`
`
` `
` `
Large Cap Midcap
Cash & Other Current Assets Smallcap
PORTFOLIO CLASSIFICATION BY
INDUSTRY ALLOCATION (%)
PORTFOLIO
ICICI Bank Ltd. 8.11
ITC Ltd. 7.31
Reliance Industries Ltd. 4.82
Sheela Foam Ltd. 4.50
State Bank Of India 4.12
UPL Ltd. 3.61
Mahindra & Mahindra Financial Services Ltd. 3.52
Manpasand Beverages Ltd. 2.85
Tata Motors Ltd. (Dvr-A-Ordy) 2.69
Tech Mahindra Ltd. 2.46
Muthoot Finance Ltd. 2.45
Jubilant Foodworks Ltd. 2.26
Petronet LNG Ltd. 2.24
HDFC Bank Ltd. 2.22
Mahindra & Mahindra Ltd. 2.17
Indian Oil Corporation Ltd. 2.07
ICICI Prudential Life Insurance Company Ltd. 2.03
Grasim Industries Ltd. 2.00
Hero Motocorp Ltd. 1.99
Delta Corp Ltd. 1.94
Ahluwalia Contracts (India) Ltd. 1.85
Laurus Labs Ltd. 1.85
Larsen & Toubro Ltd. 1.81
Colgate Palmolive (India) Ltd. 1.79
Titan Company Ltd. 1.69
Thyrocare Technologies Ltd. 1.56
Stock Name (%) Of Total AUM Stock Name (%) Of Total AUM
Gail (India) Ltd. 1.55
Disa India Ltd. 1.54
Mahindra Holidays & Resorts India Ltd. 1.53
Sun Pharmaceuticals Industries Ltd. 1.49
Sequent Scientific Ltd. 1.45
Bharti Airtel Ltd. 1.43
Axis Bank Ltd. 1.39
NRB Bearing Ltd. 1.37
Dynamatic Technologies Ltd. 1.31
Equitas Holdings Ltd. 1.21
Strides Shasun Ltd. 1.19
Lumax Auto Technologies Ltd. 1.12
Nestle India Ltd. 1.09
Hindalco Industries Ltd. 1.08
Kotak Mahindra Bank Ltd. 1.03
HCL Technologies Ltd. 0.91
Greaves Cotton Ltd. 0.87
HDFC Ltd. 0.43
Gayatri Bioorganics Ltd. 0.04
HDFC Bank Ltd. 0.43
Equity Shares Total 97.99
Fixed Deposits Total 0.43
CBLO 2.40
Cash & Other Receivables (0.82)
Grand Total 100.00
(Previously known as SBI Magnum Multiplier Plus Scheme 1993)
^Investors should consult their financial advisers if in doubt about whether the product is suitable for them.
63.56
25.74
8.692.01

13
EQUITY-DIVERSIFIED CAP
Option NAV ( )`
Reg-Plan-Growth 113.1973
Reg-Plan-Dividend 23.0575
Dir-Plan-Dividend 31.8348
Dir-Plan-Growth 117.5586
NET ASSET VALUE
Record Date Dividend NAV ( )`(in /Unit)`
28-Apr-17 (Reg Plan) 2.20 22.1892
(Dir Plan) 3.00 30.590528-Apr-17
07-Apr-16 (Reg Plan) 2.00 20.1119
07-Apr-16 (Dir Plan) 2.50 27.4503
28-Nov-14 (Reg Plan) 2.70 21.2616
LAST DIVIDENDS
Investors understand that their principal
will be at Moderately High risk
�
�
Long term capital appreciation.
Investments in companies that are considered emergent and have export orientation/outsourcingopportunities or are globally competitive to participate in growth potential of Indian businesses.
SBI Emerging Businesses FundThis product is suitable for investors who are seeking^:
Face value: 10`
Investment Objective
Quantitative Data
The investment objective of the Emerging
Businesses Fund would be to participate
in the growth potential presented by
various companies that are considered
e m e r g e n t a n d h a v e e x p o r t
orientation/outsourcing opportunities or
are globally competitive by investing in
the stock representing such companies.
The fund may also evaluate Emerging
Businesses with growth potential and
domestic focus.
Fund Details
Standard Deviation :
Beta :
Sharpe Ratio :
Portfolio Turnover* :
#
#
#
12.52%
0.76
0.74
0.32#Source : CR IS IL Fund Ana lyser
*Portfolio Turnover = lower of total sale ortotal purchase for the last 12 monthsupon Avg. AUM of trailing twelve months.
Risk Free rate: FBIL Overnight Mibor rate(6.25% as on 30th June 2017) Basis forRatio Calculation: 3 Years Monthly DataPoints
PORTFOLIO CLASSIFICATION BY
(%)ASSET ALLOCATION
Financial Services 28.32
Consumer Goods 19.11
Industrial Manufacturing 13.07
Services 12.12
Pharma 11.21
Chemicals 7.30
Cash & Other Recivables 5.05
Automobile 2.89
CBLO 0.91
Pursuant to payment of dividend, the NAV of Dividend Option ofscheme/plans would fall to the extent of payout and statutory levy, ifapplicable.
•
•
•
•
•
•
•
•
•
•
•
•
•
•
•
Type of Scheme
Date of Allotment:
Report As On:
AAUM for the Month of June 2017
AUM as on June 30, 2017
Fund Manager: Mr. R. Srinivasan
Managing Since:
Total Experience:
Benchmark:
Exit Load:
Entry Load:
Plans Available:
Options:
SIP
Minimum Investment
Additional Investment
An Open - Ended Equity Fund
11/10/2004
30/06/2017
1,920.94 Crores
1,920.07 Crores
May-2009
Over 24 years
S&P BSE 500 Index
For exit within 1 year from the date of
allotment - 1 %;
For exit after 1 year from the date of
allotment - Nil.
N.A.
Regular, Direct
Growth, Dividend
Weekly - Minimum 1000 & in multiples
of 1 thereafter for a minimum of 6
instalments.
Monthly - Minimum 1000 & in
multiples of 1 thereafter for minimum
six months (or) minimum 500 & in
multiples of 1 thereafter for minimum
one year.
Quarterly - Minimum 1500 & in
multiples of 1 thereafter for minimum
one year.
5000 & in multiples of 1
1000 & in multiples of 1
`
`
`
`
`
`
`
`
`
`
` `
` `
Large Cap Midcap
Cash & Other Current Assets Smallcap
PORTFOLIO CLASSIFICATION BY
INDUSTRY ALLOCATION (%)
PORTFOLIO
Procter & Gamble Hygiene AndHealth Care Ltd. 10.03
HDFC Bank Ltd. 9.47
Solar Industries India Ltd. 7.30
Gruh Finance Ltd. 7.19
Divi's Laboratories Ltd. 6.24
ELGI Equipments Ltd. 6.15
The Great Eastern Shipping Company Ltd. 5.72
Kotak Mahindra Bank Ltd. 4.98
Muthoot Finance Ltd. 3.56
Hawkins Cookers Ltd. 3.54
Westlife Development Ltd. 3.44
Equitas Holdings Ltd. 3.13
3M India Ltd. 2.97
Goodyear India Ltd. 2.89
Agro Tech Foods Ltd. 2.83
Finolex Industries Ltd. 2.83
Stock Name (%) Of Total AUM Stock Name (%) Of Total AUM
Sheela Foam Ltd. 2.71
Aurobindo Pharma Ltd. 2.50
Laurus Labs Ltd. 2.47
Finolex Cables Ltd. 2.14
Thermax Ltd. 1.95
Equity Shares Total 94.04
CBLO 0.91
Cash & Other Receivables 5.05
Grand Total 100.00
(Previously known as SBI MSFU - EmergingBusinesses Fund)
^Investors should consult their financial advisers if in doubt about whether the product is suitable for them.
26.98
48.21
18.86
5.95

14
EQUITY-MIDCAP & SMALLCAP
Option NAV ( )`
Reg-Plan-Growth 76.7309
Reg-Plan-Dividend 33.0816
Dir-Plan-Dividend 47.7482
Dir-Plan-Growth 79.8511
NET ASSET VALUE
Record Date Dividend NAV ( )`(in /Unit)`
30-Jun-16 (Reg-Plan) 2.50 28.2445
30-Jun-16 (Dir-Plan) 3.50 40.3050
20-Mar-15 (Reg-Plan) 4.80 26.6619
20-Mar-15 (Dir-Plan) 6.80 37.4040
08-Aug-13 (Reg-Plan) 5.00 18.1066
LAST DIVIDENDS
Investors understand that their principal
will be at Moderately High risk
�
�
long term capital appreciation.
Investment in diversified portfolio of predominantly in equity and equity-related securities ofsmall & midcap companies.
SBI Magnum Midcap FundThis product is suitable for investors who are seeking^:
Face value: 10`
Investment Objective
Quantitative Data
To provide investors with opportunities
for long-term growth in capital along
with the liquidity of an open-ended
scheme by investing predominantly in a
well diversified basket of equity stocks of
Midcap companies.
Fund Details
Standard Deviation :
Beta :
Sharpe Ratio :
Portfolio Turnover* :
#
#
#
14.02%
0.76
1.08
0.45#Source : CR IS IL Fund Ana lyser
*Portfolio Turnover = lower of total sale ortotal purchase for the last 12 monthsupon Avg. AUM of trailing twelve months.
Risk Free rate: FBIL Overnight Mibor rate(6.25% as on 30th June 2017) Basis forRatio Calculation: 3 Years Monthly DataPoints
PORTFOLIO CLASSIFICATION BY
(%)ASSET ALLOCATION
Financial Services 19.45Consumer Goods 14.30Industrial Manufacturing 13.28Pharma 12.43Fertilisers & Pesticides 7.66Construction 5.74Services 5.15Healthcare Services 4.49Cement & Cement Products 4.45IT 2.38Energy 2.23Chemicals 1.58Media & Entertainment 1.47Textiles 0.54Cash & Other Recivables -0.58Futures 0.82CBLO 4.61
Pursuant to payment of dividend, the NAV of Dividend Option ofscheme/plans would fall to the extent of payout and statutory levy, ifapplicable.
•
•
•
•
•
•
•
•
•
•
•
•
•
•
Type of Scheme
Date of Allotment:
Report As On:
AAUM for the Month of June 2017
AUM as on June 30, 2017
Fund Manager: Ms. Sohini Andani
Managing Since:
Total Experience:
Benchmark:
Exit Load:
Entry Load:
Plans Available:
Options:
SIP
Minimum Investment
Additional Investment
An Open - Ended Growth Scheme
29/03/2005
30/06/2017
3,805.98 Crores
3,796.72 Crores
July-2010
Over 22 years
Nifty MidSmallcap 400
Index
For exit within 1 year from
the date of allotment - 1 %;
For exit after 1 year from the date of
allotment - Nil
N.A.
Regular, Direct
Growth, Dividend
Weekly - Minimum 1000 & in multiples
of 1 thereafter for a minimum of 6
instalments.
Monthly - Minimum 1000 & in
multiples of 1 thereafter for minimum
six months (or) minimum 500 & in
multiples of 1 thereafter for minimum
one year.
Quarterly - Minimum 1500 & in
multiples of 1 thereafter for minimum
one year.
5000 & in multiples of 1
1000 & in multiples of 1
`
`
`
`
`
`
`
`
`
`
` `
` `
Cash & Other Current Assets Futures
Large Cap Midcap Smallcap
PORTFOLIO CLASSIFICATION BY
INDUSTRY ALLOCATION (%)
PORTFOLIO
Carborundum Universal Ltd. 4.24Cholamandalam Investment AndFinance Company Ltd. 3.95The Ramco Cements Ltd. 3.72Manpasand Beverages Ltd. 3.70Strides Shasun Ltd. 3.54The Federal Bank Ltd. 3.45Shriram City Union Finance Ltd. 3.13Sheela Foam Ltd. 3.07PI Industries Ltd. 2.90Greaves Cotton Ltd. 2.70Greenply Industries Ltd. 2.51Voltas Ltd. 2.28UPL Ltd. 2.25VA Tech Wabag Ltd. 2.24Indraprastha Gas Ltd. 2.23Laurus Labs Ltd. 2.12Natco Pharma Ltd. 2.01VIP Industries Ltd. 2.00Sadbhav Engineering Ltd. 1.91Sharda Cropchem Ltd. 1.90Mahindra Holidays & Resorts India Ltd. 1.90Equitas Holdings Ltd. 1.76Thermax Ltd. 1.69Mahindra & Mahindra Financial Services Ltd. 1.68Sanofi India Ltd. 1.64Thyrocare Technologies Ltd. 1.64Dr. Lal Path Labs Ltd. 1.62Clariant Chemicals (India) Ltd. 1.58Eris Lifesciences Ltd 1.53Credit Analysis And Research Ltd. 1.48State Bank Of India 1.37
Stock Name (%) Of Total AUM Stock Name (%) Of Total AUM
SKF India Ltd. 1.35Britannia Industries Ltd. 1.31Narayana Hrudayalaya Ltd. 1.24Hexaware Technologies Ltd. 1.20Persistent Systems Ltd. 1.18Fag Bearings India Ltd. 1.17Emami Ltd. 1.14NCC Ltd. 1.06Hudco Ltd. 1.04Swaraj Engines Ltd. 0.99Sequent Scientific Ltd. 0.93Navkar Corporation Ltd. 0.90UFO Moviez India Ltd. 0.83Repco Home Finance Ltd. 0.75Mangalam Cement Ltd. 0.73Mold-Tek Packaging Ltd. 0.71Divi's Laboratories Ltd. 0.65D.B.Corp Ltd. 0.64Bayer Cropscience Ltd. 0.61Jyothy Laboratories Ltd. 0.58Shriram Transport Finance Company Ltd. 0.57Page Industries Ltd. 0.54ITD Cementation India Ltd. 0.48NRB Bearing Ltd. 0.43AU Small Finance Bank Ltd. 0.21Westlife Development Ltd. 0.11Summit Securities Ltd. 0.05RBL Bank Ltd. 0.01Equity Shares Total 95.15CBLO 4.61Cash & Other Receivables (0.58)Futures 0.82Grand Total 100.00
^Investors should consult their financial advisers if in doubt about whether the product is suitable for them.
6.07
76.62
12.254.24
0.82

15
EQUITY-MIDCAP & SMALL CAP
Option NAV ( )`
Reg-Plan-Growth 152.8570
Reg-Plan-Dividend 51.0664
Dir-Plan-Dividend 61.8930
Dir-Plan-Growth 158.5419
NET ASSET VALUE
Record Date Dividend NAV ( )`(in /Unit)`
25-Nov-16 (Reg Plan) 5.00 45.0759
25-Nov-16 (Dir Plan) 6.00 54.3465
30-Oct-15 (Reg Plan) 5.10 49.9803
30-Oct-15 (Dir Plan) 5.10 59.5549
06-Jun-14 (Reg Plan) 5.70 38.0774
LAST DIVIDENDS
Investors understand that their principal
will be at Moderately High risk
�
�
Long term capital appreciation.
Investments in Indian equities, PCDs and FCDs from selected industries with high growth potentialto provide investors maximum growth opportunity.
SBI Magnum Global FundThis product is suitable for investors who are seeking^:
Face value: 10`
Investment Objective
Quantitative Data
To provide investors maximum growth
opportunity through well researched
investments in Indian equities, PCDs and
FCDs from selected industries with high
growth potential and in Bonds.
Fund Details
Standard Deviation :
Beta :
Sharpe Ratio :
Portfolio Turnover* :
#
#
#
12.19%
0.64
0.77
0.37#Source : CR IS IL Fund Ana lyser
*Portfolio Turnover = lower of total sale ortotal purchase for the last 12 monthsupon Avg. AUM of trailing twelve months.
Risk Free rate: FBIL Overnight Mibor rate(6.25% as on 30th June 2017) Basis forRatio Calculation: 3 Years Monthly DataPoints
PORTFOLIO CLASSIFICATION BY
(%)ASSET ALLOCATION
Industrial Manufacturing 18.00
Consumer Goods 16.51
Financial Services 12.53
Services 11.75
Automobile 9.09
Chemicals 6.86
Pharma 5.91
Cash & Other Recivables 4.75
Textiles 4.57
Fertilisers & Pesticides 4.05
Construction 2.16
Healthcare Services 1.78
Media & Entertainment 1.12
CBLO 0.93
Pursuant to payment of dividend, the NAV of Dividend Option ofscheme/plans would fall to the extent of payout and statutory levy, ifapplicable.
•
•
•
•
•
•
•
•
•
•
•
•
•
•
Type of Scheme
Date of Allotment:
Report As On:
AAUM for the Month of June 2017
AUM as on June 30, 2017
Fund Manager: Mr. R. Srinivasan
Managing Since:
Total Experience:
Benchmark:
Exit Load:
Entry Load:
Plans Available:
Options:
SIP
Minimum Investment
Additional Investment
An Open - Ended Equity Scheme
30/09/1994
30/06/2017
3,084.84 Crores
3,077.65 Crores
May-2009
Over 24 years
S&P BSE MidSmallCap Index
For exit within 12 months
from the date of allotment - 1.00%;
For exit after 12 months from the date
of allotment - Nil
N.A.
Regular, Direct
Growth, Dividend
Weekly - Minimum 1000 & in multiples
of 1 thereafter for a minimum of 6
instalments.
Monthly - Minimum 1000 & in
multiples of 1 thereafter for minimum
six months (or) minimum 500 & in
multiples of 1 thereafter for minimum
one year.
Quarterly - Minimum 1500 & in
multiples of 1 thereafter for minimum
one year.
5000 & in multiples of 1
1000 & in multiples of 1
`
`
`
`
`
`
`
`
`
`
` `
` `
Large Cap Midcap
Cash & Other Current Assets Smallcap
PORTFOLIO CLASSIFICATION BY
INDUSTRY ALLOCATION (%)
PORTFOLIO
Gruh Finance Ltd. 5.79
MRF Ltd. 5.11
Procter & Gamble Hygiene And
Health Care Ltd. 4.96
Solar Industries India Ltd. 4.26
Sundaram Finance Ltd. 3.66
Divi's Laboratories Ltd. 3.56
Grindwell Norton Ltd. 3.53
Redington (India) Ltd. 2.98
Muthoot Finance Ltd. 2.81
Balkrishna Industries Ltd. 2.70
Atul Ltd. 2.59
Westlife Development Ltd. 2.54
Kansai Nerolac Paints Ltd. 2.43
Page Industries Ltd. 2.40
Supreme Industries Ltd. 2.36
Laurus Labs Ltd. 2.35
Mahindra Holidays & Resorts India Ltd. 2.35
United Breweries Ltd. 2.25
Kewal Kiran Clothing Ltd. 2.18
Kajaria Ceramics Ltd. 2.16
PI Industries Ltd. 2.15
Stock Name (%) Of Total AUM Stock Name (%) Of Total AUM
Blue Dart Express Ltd. 2.14
Thermax Ltd. 2.13
Whirlpool Of India Ltd. 2.11
SKF India Ltd. 2.09
Greenply Industries Ltd. 2.06
Ge T&D India Ltd. 1.90
Rallis India Ltd. 1.89
Fag Bearings India Ltd. 1.88
Dr. Lal Path Labs Ltd. 1.78
Finolex Cables Ltd. 1.75
Allcargo Logistics Ltd. 1.73
Relaxo Footwears Ltd. 1.56
ELGI Equipments Ltd. 1.55
Precision Camshafts Ltd. 1.28
Eveready Industries India Ltd. 1.14
UFO Moviez India Ltd. 1.12
Finolex Industries Ltd. 0.81
AU Small Finance Bank Ltd. 0.26
Equity Shares Total 94.32
CBLO 0.93
Cash & Other Receivables 4.75
Grand Total 100.00
^Investors should consult their financial advisers if in doubt about whether the product is suitable for them.
10.07
72.14
11.85
5.94

16
EQUITY-MIDCAP & SMALL CAP
Option NAV ( )`
Reg-Plan-Growth 44.1490
Reg-Plan-Dividend 33.2060
Dir-Plan-Dividend 40.2648
Dir-Plan-Growth 46.3484
NET ASSET VALUE
Record Date Dividend NAV ( )`(in /Unit)`
28-Aug-15 (Reg Plan) 3.60 23.5236
28-Aug-15 (Dir Plan) 4.30 27.8630
30-Jan-15 (Reg Plan) 4.00 26.0785
LAST DIVIDENDS
Investors understand that their principal
will be at Moderately High risk
�
�
long term capital appreciation
Investment in diversified portfolio of predominantly in equity and equity-related securities ofsmall & midcap companies.
SBI Small & Midcap FundThis product is suitable for investors who are seeking^:
Face value: 10`
Investment Objective
Quantitative Data
The Scheme seeks to generate incomeand long term capital appreciation byinvesting in a diversified portfolio ofpredominantly in equity and equityrelated securities of small & midcapCompanies
Fund Details
Standard Deviation :
Beta :
Sharpe Ratio :
Portfolio Turnover* :
#
#
#
17.16%
0.79
1.29
0.39#Source : CR IS IL Fund Ana lyser
*Portfolio Turnover = lower of total sale ortotal purchase for the last 12 monthsupon Avg. AUM of trailing twelve months.
Risk Free rate: FBIL Overnight Mibor rate(6.25% as on 30th June 2017) Basis forRatio Calculation: 3 Years Monthly DataPoints
PORTFOLIO CLASSIFICATION BY
(%)ASSET ALLOCATION
Consumer Goods 21.94
Industrial Manufacturing 19.19
Chemicals 17.25
Services 11.36
Pharma 6.76
Automobile 6.54
Textiles 5.00
Media & Entertainment 3.46
Construction 3.06
Cement & Cement Products 2.02
Cash & Other Recivables 0.51
CBLO 2.91
Smallcap Midcap
Cash & Other Current Assets
Pursuant to payment of dividend, the NAV of Dividend Option ofscheme/plans would fall to the extent of payout and statutory levy, ifapplicable.
•
•
•
•
•
•
•
•
•
•
•
•
•
•
•
Type of Scheme
Date of Allotment:
Report As On:
AAUM for the Month of June 2017
AUM as on June 30, 2017
Fund Manager: Mr. R. Srinivasan
Managing Since:
Total Experience:
Benchmark:
Exit Load:
Entry Load:
Plans Available:
Options:
SIP
Minimum Investment
Additional Investment
An Open Ended Equity Scheme
09/09/2009
30/06/2017
703.74 Crores
706.95 Crores
Nov - 2013
Over 24 years
S&P BSE Small Cap Index
For exit within one year from
the date of allotment -1%
For exit after one year from the date of
allotment – Nil
N.A.
Regular, Direct
Growth, Dividend
Not Available
Not Available
Not Available
Subscription /Additional Subscription/
Switch in/ new SIP/ new STP/ DTP
discontinued till further notice
`
`
^
^
^
^
PORTFOLIO CLASSIFICATION BY
INDUSTRY ALLOCATION (%)
PORTFOLIO
Atul Ltd. 6.74
Westlife Development Ltd. 5.63
Graphite India Ltd. 5.57
Solar Industries India Ltd. 5.48
Orient Refractories Ltd. 5.27
Relaxo Footwears Ltd. 4.76
ELGI Equipments Ltd. 4.58
Greenply Industries Ltd. 4.28
Gabriel India Ltd. 4.27
Nesco Ltd. 4.04
Hawkins Cookers Ltd. 3.99
Kirloskar Oil Engines Ltd. 3.78
Ganesha Ecosphere Ltd. 3.45
Sheela Foam Ltd. 3.13
Fairchem Speciality Ltd. 3.13
Power Mech Projects Ltd. 3.06
Thangamayil Jewellery Ltd. 2.41
Stock Name (%) Of Total AUM Stock Name (%) Of Total AUM
Laurus Labs Ltd. 2.35
Avanti Feeds Ltd. 2.33
Rajratan Global Wire Ltd. 2.28
Divi's Laboratories Ltd. 2.27
UFO Moviez India Ltd. 2.18
Gufic Biosciences Ltd. 2.15
KCP Ltd. 2.02
Himadri Speciality Chemical Ltd. 1.90
Allcargo Logistics Ltd. 1.70
Garware-Wall Ropes Ltd. 1.54
TV Today Network Ltd. 1.28
V2 Retail Ltd. 1.05
Equity Shares Total 96.59
CBLO 2.91
Cash & Other Receivables 0.51
Grand Total 100.00
Pursuant to acquisition of Daiwa Industry
Leaders Fund (DILF) from Daiwa Mutual Fund,
w.e.f November 16, 2013 the name of the
scheme was changed to SBI Small & Midcap
Fund.
^Investors should consult their financial advisers if in doubt about whether the product is suitable for them.
32.53
64.06
3.41

17
EQUITY-TAXSAVING
Option NAV ( )`
Reg-Plan-Growth 133.1130
Reg-Plan-Dividend 43.6139
Dir-Plan-Dividend 54.5686
Dir-Plan-Growth 136.4559
NET ASSET VALUE
Record Date Dividend NAV ( )`(in /Unit)`
17-Mar-17 (Reg Plan) 4.00 41.1004
17-Mar-17 (Dir Plan) 5.00 51.3144
11-Mar-16 (Reg Plan) 4.00 36.4523
11-Mar-16 (Dir Plan) 5.00 45.2369
27-Mar-15 (Reg Plan) 5.50 51.8907
27-Mar-15 (Dir Plan) 7.00 64.2735
LAST DIVIDENDS
Investors understand that their principal
will be at Moderately High risk
�
�
Long term capital appreciation.
Investment in a portfolio of equity shares, while offering deduction under Section 80 C of IT Act,1961.
SBI Magnum Taxgain SchemeThis product is suitable for investors who are seeking^:
Face value: 10`
Investment Objective
Quantitative Data
The prime objective of this scheme is todeliver the benefit of investment in aportfolio of equity shares, while offeringdeduction on such investments made inthe scheme under Section 80 C of theIncome-tax Act, 1961. It also seeks todistribute income periodically dependingon distributable surplus.
Fund Details
Standard Deviation :
Beta :
Sharpe Ratio :
Portfolio Turnover* :
#
#
#
13.27%
0.94
0.48
0.71#Source : CR IS IL Fund Ana lyser
*Portfolio Turnover = lower of total sale ortotal purchase for the last 12 monthsupon Avg. AUM of trailing twelve months.
Risk Free rate: FBIL Overnight Mibor rate(6.25% as on 30th June 2017) Basis forRatio Calculation: 3 Years Monthly DataPoints
PORTFOLIO CLASSIFICATION BY
(%)ASSET ALLOCATION
Financial Services 33.01Consumer Goods 12.20Automobile 9.36Energy 7.94Construction 6.42Pharma 5.27Services 4.65Cement & Cement Products 4.56IT 3.70Industrial Manufacturing 3.02Fertilisers & Pesticides 2.75Telecom 2.75Textiles 1.98Chemicals 1.11Metals 0.45Healthcare Services 0.32Cash & Other Recivables -0.91CBLO 1.43
Pursuant to payment of dividend, the NAV of Dividend Option ofscheme/plans would fall to the extent of payout and statutory levy, ifapplicable.
•
•
•
•
•
•
•
•
•
•
•
•
•
•
Type of Scheme
Date of Allotment:
Report As On:
AAUM for the Month of June 2017
AUM as on June 30, 2017
Fund Manager: Mr. Dinesh
Balachandran
Managing Since:
Total Experience:
Benchmark:
Exit Load:
Entry Load:
Plans Available:
Options:
SIP
Minimum Investment
Additional Investment
An Open - Ended Equity Linked Savings
Scheme
31/03/1993
30/06/2017
5,664.76 Crores
5,663.47 Crores
Sep-2016
Over 15 years
S&P BSE 100 Index
NIL
N.A.
Regular, Direct
Growth, Dividend
Weekly - Minimum 500 & in multiples
of 500 thereafter for a minimum of 6
instalments. Monthly - Minimum 500
& in multiples of 500.
500 & in multiples of 500
500 & in multiples of 500
`
`
`
`
`
`
` `
` `
Large Cap Midcap
Cash & Other Current Assets Smallcap
PORTFOLIO CLASSIFICATION BY
INDUSTRY ALLOCATION (%)
PORTFOLIO
ICICI Bank Ltd. 7.32ITC Ltd. 6.23State Bank Of India 5.64Reliance Industries Ltd. 4.58Larsen & Toubro Ltd. 4.33HDFC Bank Ltd. 3.91Mahindra & Mahindra Ltd. 3.57Kotak Mahindra Bank Ltd. 3.27UPL Ltd. 2.75Mahindra & Mahindra Financial Services Ltd. 2.73Tata Motors Ltd. (Dvr-A-Ordy) 2.64HDFC Ltd. 2.64VA Tech Wabag Ltd. 2.57Ambuja Cements Ltd. 2.15ICICI Prudential Life Insurance Company Ltd. 2.13Infosys Ltd. 2.12KEC International Ltd. 2.10Page Industries Ltd. 1.98Bharti Airtel Ltd. 1.83Axis Bank Ltd. 1.79Glaxosmithkline Consumer Healthcare Ltd. 1.38Bosch Ltd. 1.32Blue Dart Express Ltd. 1.31Shree Cements Ltd. 1.31Aurobindo Pharma Ltd. 1.30CESC Ltd. 1.29Bharat Electronics Ltd. 1.29Laurus Labs Ltd. 1.23Bharat Petroleum Corporation Ltd. 1.13Atul Ltd. 1.11Grasim Industries Ltd. 1.10
Stock Name (%) Of Total AUM Stock Name (%) Of Total AUM
Tech Mahindra Ltd. 1.06Hindustan Unilever Ltd. 1.03The Federal Bank Ltd. 0.97GE T&D India Ltd. 0.96Nestle India Ltd. 0.93Petronet LNG Ltd. 0.93Idea Cellular Ltd. 0.92United Breweries Ltd. 0.86Manpasand Beverages Ltd. 0.83Divi's Laboratories Ltd. 0.80Strides Shasun Ltd. 0.78NRB Bearing Ltd. 0.77Container Corporation Of India Ltd. 0.76Tata Motors Ltd. 0.76Sequent Scientific Ltd. 0.75Equitas Holdings Ltd. 0.69Emami Ltd. 0.65Hero Motocorp Ltd. 0.59SREI Infrastucture Finance Ltd. 0.57Bajaj Finserv Ltd. 0.56HCL Technologies Ltd. 0.52Crisil Ltd. 0.52Dynamatic Technologies Ltd. 0.48Hindalco Industries Ltd. 0.45Sun Pharmaceuticals Industries Ltd. 0.42Apollo Hospitals Enterprises Ltd. 0.32Central Depository Services (India) Ltd. 0.28Bank Of Baroda 0.26Summit Securities Ltd. 0.03Equity Shares Total 99.48CBLO 1.43Cash & Other Receivables (0.91)Grand Total 100.00
^Investors should consult their financial advisers if in doubt about whether the product is suitable for them.
74.18
23.00
2.30 0.52

18
EQUITY-THEMATIC
Option NAV ( )`
Reg-Plan-Growth 125.4647
Reg-Plan-Dividend 93.7016
Dir-Plan-Dividend 108.3456
Dir-Plan-Growth 131.5627
NET ASSET VALUE
Record Date Dividend NAV ( )`(in /Unit)`
30-Jan-15 (Reg Plan) 10.00 93.5001
LAST DIVIDENDS
Investors understand that their principal
will be at High risk
�
�
Long term capital appreciation.
Equity Investments in stock of Pharmaceuticals sector of the economy to provide sector specificgrowth opportunities.
SBI Pharma FundThis product is suitable for investors who are seeking^:
Face value: 10`
Investment Objective
Quantitative Data
To provide the investors maximumgrowth opportunity through equityinvestments in stocks of growth orientedsectors of the economy.
Fund Details
Standard Deviation :
Beta :
Sharpe Ratio :
Portfolio Turnover* :
#
#
#
17.89%
0.95
0.34
0.56#Source : CR IS IL Fund Ana lyser
*Portfolio Turnover = lower of total sale ortotal purchase for the last 12 monthsupon Avg. AUM of trailing twelve months.
Risk Free rate: FBIL Overnight Mibor rate(6.25% as on 30th June 2017) Basis forRatio Calculation: 3 Years Monthly DataPoints
PORTFOLIO CLASSIFICATION BY
(%)ASSET ALLOCATION
Pharma 83.93
Healthcare Services 12.42
Cash & Other Recivables -0.95
CBLO 4.60
Pursuant to payment of dividend, the NAV of Dividend Option ofscheme/plans would fall to the extent of payout and statutory levy, ifapplicable.
•
•
•
•
•
•
•
•
•
•
•
•
•
•
Type of Scheme
Date of Allotment:
Report As On:
AAUM for the Month of June 2017
AUM as on June 30, 2017
Fund Manager: Mr. Tanmaya Desai
Managing Since:
Total Experience:
Benchmark:
Exit Load:
Entry Load:
Plans Available:
Options:
SIP
Minimum Investment
Additional Investment
An Open - Ended Equity Fund
14/07/1999
30/06/2017
909.81 Crores
932.04 Crores
Jun-2011
Over 9 years
S&P BSE HEALTH CARE
Index
For exit within 15 Days from
the date of allotment - 0.50%;
For exit after 15 Days from the date of
allotment - Nil.
N.A.
Regular, Direct
Growth, Dividend
Weekly - Minimum 1000 & in multiples
of 1 thereafter for a minimum of 6
instalments.
Monthly - Minimum 1000 & in
multiples of 1 thereafter for minimum
six months (or) minimum 500 & in
multiples of 1 thereafter for minimum
one year.
Quarterly - Minimum 1500 & in
multiples of 1 thereafter for minimum
one year.
5000 & in multiples of 1
1000 & in multiples of
`
`
`
`
`
`
`
`
`
`
` `
` ` 1
Large Cap Midcap
Cash & Other Current Assets Smallcap
PORTFOLIO CLASSIFICATION BY
INDUSTRY ALLOCATION (%)
PORTFOLIO
Strides Shasun Ltd. 9.67
Aurobindo Pharma Ltd. 8.09
Lupin Ltd. 6.83
Cipla Ltd. 6.56
Dr. Reddy's Laboratories Ltd. 5.78
Divi's Laboratories Ltd. 5.56
Natco Pharma Ltd. 4.30
Thyrocare Technologies Ltd. 4.30
Cadila Healthcare Ltd. 4.23
Sun Pharmaceuticals Industries Ltd. 4.18
Torrent Pharmaceuticals Ltd. 3.93
Sequent Scientific Ltd. 3.89
Neuland Laboratories Ltd. 3.80
Laurus Labs Ltd. 3.77
Alkem Laboratories Ltd. 3.59
Dr. Lal Path Labs Ltd. 3.36
Stock Name (%) Of Total AUM Stock Name (%) Of Total AUM
Apollo Hospitals Enterprises Ltd. 2.74
Sanofi India Ltd. 2.68
Gufic Biosciences Ltd. 2.40
Narayana Hrudayalaya Ltd. 2.03
Ajanta Pharma Ltd. 1.78
Glenmark Pharmaceuticals Ltd. 1.70
Eris Lifesciences Ltd 1.18
Equity Shares Total 96.35
CBLO Total 4.60
Cash & Other Receivables (0.95)
Grand Total 100.00
(Previously known as SBI MSFU - Pharma Fund)
^Investors should consult their financial advisers if in doubt about whether the product is suitable for them.
35.67
50.58
10.103.65

19
EQUITY-THEMATIC
Option NAV ( )`
Dir-Plan-Dividend 14.0434
Dir-Plan-Growth 14.0447
Reg-Plan-Dividend 13.8091
Reg-Plan-Growth 13.8082
NET ASSET VALUE
�
�
Long term capital appreciation.
Investment predominantly in a portfolio of equity & equity related securities of companiesengaged in banking and financial services.
SBI Banking & Financial Services FundThis product is suitable for investors who are seeking^:
Investment Objective
“The investment objective of the scheme
is to generate long-term capital
appreciation to unit holders from a
portfolio that is invested predominantly
in equity and equity related securities of
companies engaged in banking and
financial services. However, there can be
no assurance that the investment
objective of the Scheme will be realized."
Fund Details
PORTFOLIO CLASSIFICATION BY
(%)ASSET ALLOCATION
Financial Services 93.43
Consumer Goods 1.19
Cash & Other Recivables 0.10
CBLO 5.28
•
•
•
•
•
•
•
•
•
•
•
•
•
•
Type of Scheme
Date of Allotment:
Report As On:
AAUM for the Month of June 2017
AUM as on June 30, 2017
Fund Manager: Ms. Sohini Andani
Managing Since:
Total Experience:
Benchmark:
Exit Load:
Entry Load:
Plans Available:
Options:
SIP
Minimum Investment
Additional Investment
An Open - Ended Sector Fund
26/02/2015
30/06/2017
410.65 Crores
414.75 Crores
Feb-2015
Over 22 years
Nifty Financial Services
For exit within 12 months from the date
of allotment - 1.00%;
For exit after 12 months from the date
of allotment - Nil
N.A.
Regular, Direct
Growth, Dividend
Weekly - Minimum 1000 & in multiples
of 1 thereafter for a minimum of 6
instalments.
Monthly – Minimum 1000 & in
multiples of 1 thereafter for minimum
6months or Minimum 500 & in
multiples of 1 thereafter for minimum
12months
Quarterly - Minimum 1500 & in
multiples of 1 thereafter for minimum
one year.
5000 & in multiples of 1
1000 & in multiples of 1
`
`
`
`
`
`
`
`
`
`
` `
` `
PORTFOLIO CLASSIFICATION BY
INDUSTRY ALLOCATION (%)
^Investors should consult their financial advisers if in doubt about whether the product is suitable for them.
PORTFOLIO
HDFC Bank Ltd. 22.84
ICICI Bank Ltd. 13.29
Housing Development Finance Corporation Ltd. 11.73
Kotak Mahindra Bank Ltd. 8.51
Axis Bank Ltd. 7.45
State Bank Of India 6.87
ICICI Prudential Life Insurance Company Ltd. 5.11
Bajaj Finserv Ltd. 4.97
Mahindra & Mahindra Financial Services Ltd. 4.91
RBL Bank Ltd. 4.51
Indusind Bank Ltd. 2.90
Central Depository Services (India) Ltd. 1.19
AU Small Finance Bank Ltd. 0.33
Equity Shares Total 94.62
CBLO 5.28
Cash & Other Receivables 0.10
Grand Total 100.00
Stock Name (%) Of Total AUM
Investors understand that their principal
will be at High risk
83.68
9.42
1.195.71
Large Cap Midcap
Cash & Other Current Assets Smallcap
Quantitative Data
Portfolio Turnover* : 0.78
*Portfolio Turnover = lower of total sale ortotal purchase for the last 12 monthsupon Avg. AUM of trailing twelve months.

20
EQUITY-THEMATIC
Option NAV ( )`
Reg-Plan-Growth 11.3811
Reg-Plan-Dividend 11.3799
Dir-Plan-Dividend 11.6120
Dir-Plan-Growth 11.6238
NET ASSET VALUE
�
�
Long term capital appreciation.
Investments in diversified basket of equity stocks and debt of domestic Public SectorUndertakings to provide long term growth in capital with improved liquidity.
SBI PSU FundThis product is suitable for investors who are seeking^:
Investment Objective
Quantitative Data
The objective of the scheme would be toprovide investors with opportunities forlong-term growth in capital along withthe liquidity of an open-ended schemethrough an active management ofinvestments in a diversified basket ofequity stocks of domestic Public SectorUnder takings and in debt and moneymarket instruments issued by PSUs andothers.
Fund Details
Standard Deviation :
Beta :
Sharpe Ratio :
Portfolio Turnover* :
#
#
#
16.94%
0.87
-0.06
0.36#Source : CR IS IL Fund Ana lyser
*Portfolio Turnover = lower of total sale ortotal purchase for the last 12 monthsupon Avg. AUM of trailing twelve months.
Risk Free rate: FBIL Overnight Mibor rate(6.25% as on 30th June 2017) Basis forRatio Calculation: 3 Years Monthly DataPoints
PORTFOLIO CLASSIFICATION BY
(%)ASSET ALLOCATION
Energy 50.29
Financial Services 23.17
Construction 6.04
Industrial Manufacturing 5.23
Services 4.33
Metals 3.42
Cash & Other Recivables -0.09
CBLO 7.61
•
•
•
•
•
•
•
•
•
•
•
•
•
•
Type of Scheme
Date of Allotment:
Report As On:
AAUM for the Month of June 2017
AUM as on June 30, 2017
Fund Manager: Mr. Richard D'souza
Managing Since:
Total Experience:
Benchmark:
Exit Load:
Entry Load:
Plans Available:
Options:
SIP
Minimum Investment
Additional Investment
An Open - Ended Equity Scheme
07/07/2010
30/06/2017
214.22 Crores
208.53 Crores
Aug 2014
Over 25 years
S&P BSE PSU INDEX
For exit within 1 year from the date of
allotment - 1%;
For exit after 1 year from the date of
allotment - Nil
N.A.
Regular, Direct
Growth, Dividend
Weekly - Minimum 1000 & in multiples
of 1 thereafter for a minimum of 6
instalments.
Monthly - Minimum 1000 & in
multiples of 1 thereafter for minimum
six months (or) minimum 500 & in
multiples of 1 thereafter for minimum
one year.
Quarterly - Minimum 1500 & in
multiples of 1 thereafter for minimum
one year.
5000 & in multiples of 1
1000 & in multiples of 1
`
`
`
`
`
`
`
`
`
`
` `
` `
PORTFOLIO CLASSIFICATION BY
INDUSTRY ALLOCATION (%)
PORTFOLIO
State Bank Of India 9.58
Power Grid Corporation Of India Ltd. 8.68
Indian Oil Corporation Ltd. 6.58
Mahanagar Gas Ltd. 6.50
Engineers India Ltd. 6.04
Indraprastha Gas Ltd. 5.83
Oil & Natural Gas Corporation Ltd. 5.66
Bharat Electronics Ltd. 5.23
Bank Of Baroda 4.38
Container Corporation Of India Ltd. 4.33
LIC Housing Finance Ltd. 4.27
Hindustan Petroleum Corporation Ltd. 3.67
Bharat Petroleum Corporation Ltd. 3.43
National Aluminium Company Ltd. 3.42
Canara Bank 2.99
NTPC Ltd. 2.86
Stock Name (%) Of Total AUM Stock Name (%) Of Total AUM
Gail (India) Ltd. 2.77
Petronet LNG Ltd. 2.38
Union Bank Of India 1.94
Oil India Ltd. 1.92
Equity Shares Total 92.48
CBLO 7.61
Cash & Other Receivables (0.09)
Grand Total 100.00
^Investors should consult their financial advisers if in doubt about whether the product is suitable for them.
Investors understand that their principal
will be at High risk
63.83
28.65
7.52
Large Cap Midcap
Cash & Other Current Assets

21
EQUITY-THEMATIC
Option NAV ( )`
Reg-Plan-Growth 34.7897
Reg-Plan-Dividend 23.4963
Dir-Plan-Dividend 24.1317
Dir-Plan-Growth 35.7041
NET ASSET VALUE
Record Date Dividend NAV ( )`(in /Unit)`
15-03-10 3.00 16.01
25-07-08 2.00 17.14
27-11-06 1.50 16.18
LAST DIVIDENDS
Investors understand that their principal
will be at High risk
�
�
Long term capital appreciation.
Equity Investments in a portfolio of stocks of companies engaged in the commodity businesswithin Oil & Gas, Metals, Materials and Agriculture Sectors of the economy to provide growth andpossibility of consistent returns.
SBI Magnum Comma FundThis product is suitable for investors who are seeking^:
Face value: 10`
Investment Objective
Quantitative Data
To generate opportunities for growthalong with possibility of consistentreturns by investing predominantly in aportfolio of stocks of companies engagedin the commodity business within thefollowing sectors - Oil & Gas, Metals,Materials & Agriculture and in debt &money market instruments.
Fund Details
Standard Deviation :
Beta :
Sharpe Ratio :
Portfolio Turnover* :
#
#
#
15.49%
0.83
0.34
0.63#Source : CR IS IL Fund Ana lyser
*Portfolio Turnover = lower of total sale ortotal purchase for the last 12 monthsupon Avg. AUM of trailing twelve months.
Risk Free rate: FBIL Overnight Mibor rate(6.25% as on 30th June 2017) Basis forRatio Calculation: 3 Years Monthly DataPoints
PORTFOLIO CLASSIFICATION BY
(%)ASSET ALLOCATION
Energy 37.19
Metals 17.56
Cement & Cement Products 13.68
Fertilisers & Pesticides 10.32
Automobile 6.77
Chemicals 4.65
Industrial Manufacturing 4.60
Consumer Goods 1.41
Cash & Other Recivables -2.55
CBLO 6.37
Pursuant to payment of dividend, the NAV of Dividend Option ofscheme/plans would fall to the extent of payout and statutory levy, ifapplicable.
•
•
•
•
•
•
•
•
•
•
•
•
•
•
Type of Scheme
Date of Allotment:
Report As On:
AAUM for the Month of June 2017
AUM as on June 30, 2017
Fund Manager: Mr. Richard D'souza
Managing Since:
Total Experience:
Benchmark:
Exit Load:
Entry Load:
Plans Available:
Options:
SIP
Minimum Investment
Additional Investment
An Open - Ended Equity Scheme
08/08/2005
30/06/2017
302.96 Crores
297.69 Crores
Aug-2014
Over 25 years
Nifty Commodities Index
For exit within 1 year from the date of
allotment - 1 %;
For exit after 1 year from the date of
allotment - Nil.
N.A.
Regular, Direct
Growth, Dividend
Weekly - Minimum 1000 & in multiples
of 1 thereafter for a minimum of 6
instalments.
Monthly - Minimum 1000 & in
multiples of 1 thereafter for minimum
six months (or) minimum 500 & in
multiples of 1 thereafter for minimum
one year.
Quarterly - Minimum 1500 & in
multiples of 1 thereafter for minimum
one year.
5000 & in multiples of 1
1000 & in multiples of 1
`
`
`
`
`
`
`
`
`
`
` `
` `
Large Cap Midcap
Cash & Other Current Assets Smallcap
PORTFOLIO CLASSIFICATION BY
INDUSTRY ALLOCATION (%)
PORTFOLIO
Reliance Industries Ltd. 6.17
Indraprastha Gas Ltd. 5.33
UPL Ltd. 4.94
Hindustan Petroleum Corporation Ltd. 4.80
Sagar Cements Ltd. 4.80
Indian Oil Corporation Ltd. 4.75
EPC Industries Ltd. 4.60
Oil & Natural Gas Corporation Ltd. 4.47
Tata Steel Ltd. 4.31
Grasim Industries Ltd. 4.17
Hindalco Industries Ltd. 4.11
Petronet LNG Ltd. 3.92
CEAT Ltd. 3.83
Gail (India) Ltd. 3.72
Sharda Cropchem Ltd. 3.66
Hindustan Zinc Ltd. 3.23
JK Tyre And Industries Ltd. 2.95
Stock Name (%) Of Total AUM Stock Name (%) Of Total AUM
Ultratech Cement Ltd. 2.93
Coal India Ltd. 2.64
Atul Ltd. 2.51
Tata Power Company Ltd. 2.17
Camlin Fine Sciences Ltd. 2.14
Vedanta Ltd. 2.09
Bayer Cropscience Ltd. 1.71
Birla Corporation Ltd. 1.46
Hatsun Agro Product Ltd. 1.41
NTPC Ltd. 1.20
Tata Metaliks Ltd. 1.19
Oil India Ltd. 0.67
Everest Industries Ltd. 0.33
Equity Shares Total 96.18
CBLO 6.37
Cash & Other Receivables (2.55)
Grand Total 100.00
^Investors should consult their financial advisers if in doubt about whether the product is suitable for them.
57.4522.74
16.00
3.81

22
EQUITY-THEMATIC
Option NAV ( )`
Reg-Plan-Growth 14.3376
Reg-Plan-Dividend 14.3390
Dir-Plan-Dividend 14.6635
Dir-Plan-Growth 14.6807
NET ASSET VALUE
Investors understand that their principal
will be at High risk
�
�
Long term capital appreciation.
Equity Investments in stock of companies directly or indirectly involved in the infrastructuregrowth of the Indian economy to provide long term capital growth opportunities.
SBI Infrastructure FundThis product is suitable for investors who are seeking^:
Investment Objective
Quantitative Data
To provide investors with opportunities
for long-term growth in capital through
an active management of investments in a
diversified basket of equity stocks of
companies directly or indirectly involved
in the infrastructure growth in the Indian
economy and in debt & money market
instruments.
Fund Details
Standard Deviation :
Beta :
Sharpe Ratio :
Portfolio Turnover* :
#
#
#
14.95%
0.71
0.39
0.69#Source : CR IS IL Fund Ana lyser
*Portfolio Turnover = lower of total sale ortotal purchase for the last 12 monthsupon Avg. AUM of trailing twelve months.
Risk Free rate: FBIL Overnight Mibor rate(6.25% as on 30th June 2017) Basis forRatio Calculation: 3 Years Monthly DataPoints
PORTFOLIO CLASSIFICATION BY
(%)ASSET ALLOCATION
Construction 27.53
Industrial Manufacturing 19.56
Energy 18.26
Telecom 13.08
Services 12.45
Cement & Cement Products 3.16
Automobile 2.66
Cash & Other Recivables 1.41
CBLO 1.89
•
•
•
•
•
•
•
•
•
•
•
•
•
•
Type of Scheme
Date of Allotment:
Report As On:
AAUM for the Month of June 2017
AUM as on June 30, 2017
Fund Manager: Mr. Richard D'souza
Managing Since:
Total Experience:
Benchmark:
Exit Load:
Entry Load:
Plans Available:
Options:
SIP
Minimum Investment
Additional Investment
An Open - Ended Growth Scheme
06/07/2007
30/06/2017
576.79 Crores
573.01 Crores
Aug-2014
Over 25 years
Nifty Infrastructure Index
For exit within 1 year from the date of
allotment - 1 %;
For exit after 1 year from the date of
allotment - Nil
N.A.
Regular, Direct
Growth, Dividend
Weekly - Minimum 1000 & in multiples
of 1 thereafter for a minimum of 6
instalments.
Monthly - Minimum 1000 & in
multiples of 1 thereafter for minimum
six months (or) minimum 500 & in
multiples of 1 thereafter for minimum
one year.
Quarterly - Minimum 1500 & in
multiples of 1 thereafter for minimum
one year.
5000 & in multiples of 1
1000 & in multiples of 1
`
`
`
`
`
`
`
`
`
`
` `
` `
Large Cap Midcap
Cash & Other Current Assets Smallcap
PORTFOLIO CLASSIFICATION BY
INDUSTRY ALLOCATION (%)
PORTFOLIO
Larsen & Toubro Ltd. 10.16
Bharti Airtel Ltd. 8.28
Power Grid Corporation Of India Ltd. 6.80
ELGI Equipments Ltd. 5.69
ITD Cementation India Ltd. 4.23
Kirloskar Oil Engines Ltd. 4.14
NCC Ltd. 4.06
Spicejet Ltd. 3.81
Sadbhav Engineering Ltd. 3.73
Indraprastha Gas Ltd. 3.69
Timken India Ltd. 3.50
NTPC Ltd. 3.36
VA Tech Wabag Ltd. 3.25
3M India Ltd. 3.18
Sagar Cements Ltd. 3.16
Stock Name (%) Of Total AUM Stock Name (%) Of Total AUM
Kennametal India Ltd. 3.13
Bharat Electronics Ltd. 3.10
KEC International Ltd. 2.92
Tata Communications Ltd. 2.71
Shanthi Gears Ltd. 2.66
Petronet LNG Ltd. 2.26
PNC Infratech Ltd. 2.25
Adani Ports And Special Economic Zone Ltd. 2.22
Kalpataru Power Transmission Ltd. 2.16
Idea Cellular Ltd. 2.08
The Phoenix Mills Ltd. 0.17
Equity Shares Total 96.70
CBLO 1.89
Cash & Other Receivables 1.41
Grand Total 100.00
(Previously known as SBI Infrastructure Fund - Series 1)
^Investors should consult their financial advisers if in doubt about whether the product is suitable for them.
38.27
37.31
21.12
3.30

23
EQUITY-THEMATIC
Option NAV ( )`
Reg-Plan-Growth 100.3268
Reg-Plan-Dividend 71.3817
Dir-Plan-Dividend 87.1960
Dir-Plan-Growth 104.8348
NET ASSET VALUE
Record Date Dividend NAV ( )`(in /Unit)`
29-May-15 (Reg Plan) 10.00 51.3257
29-May-15 (Dir Plan) 12.00 61.4862
17-May-13 (Reg Plan) 8.00 46.0416
3-Mar-06 6.00 22.05
LAST DIVIDENDS
�
�
Long term capital appreciation.
Equity Investments in stock of FMCG sector of the economy to provide sector specific growthopportunities.
SBI FMCG FundThis product is suitable for investors who are seeking^:
Face value: 10`
Investment Objective
Quantitative Data
To provide the investors maximumgrowth opportunity through equityinvestments in stocks of growth orientedsectors of the economy.
Fund Details
Standard Deviation :
Beta :
Sharpe Ratio :
Portfolio Turnover* :
#
#
#
14.94%
0.98
0.85
0.17#Source : CR IS IL Fund Ana lyser
*Portfolio Turnover = lower of total sale ortotal purchase for the last 12 monthsupon Avg. AUM of trailing twelve months.
Risk Free rate: FBIL Overnight Mibor rate(6.25% as on 30th June 2017) Basis forRatio Calculation: 3 Years Monthly DataPoints
PORTFOLIO CLASSIFICATION BY
(%)ASSET ALLOCATION
Consumer Goods 94.40
Textiles 4.69
Cash & Other Recivables -0.06
CBLO 0.97
•
•
•
•
•
•
•
•
•
•
•
•
•
•
Type of Scheme
Date of Allotment:
Report As On:
AAUM for the Month of June 2017
AUM as on June 30, 2017
Fund Manager: Mr. Saurabh Pant
Managing Since:
Total Experience:
Benchmark:
Exit Load:
Entry Load:
Plans Available:
Options:
SIP
Minimum Investment
Additional Investment
An Open - Ended Equity Fund
14/07/1999
30/06/2017
329.76 Crores
337.33 Crores
Jun-2011
Over 10 years
S&P BSE Fast Moving
Consumer Goods Index
For exit within 15 Days from the date of
allotment - 0.50%;
For exit after 15 Days from the date of
allotment - Nil.
Nil
Regular, Direct
Growth, Dividend
Weekly - Minimum 1000 & in multiples
of 1 thereafter for a minimum of 6
instalments.
Monthly - Minimum 1000 & in
multiples of 1 thereafter for minimum
six months (or) minimum 500 & in
multiples of 1 thereafter for minimum
one year
Quarterly - Minimum 1500 & in
multiples of 1 thereafter for minimum
one year.
5000 & in multiples of 1
1000 & in multiples of 1
`
`
`
`
`
`
`
`
`
`
` `
` `
Large Cap Midcap
Cash & Other Current Assets Smallcap
PORTFOLIO CLASSIFICATION BY
INDUSTRY ALLOCATION (%)
PORTFOLIO
ITC Ltd. 41.84
Sheela Foam Ltd. 6.81
Jubilant Foodworks Ltd. 5.04
Greenply Industries Ltd. 4.92
Indian Terrain Fashions Ltd. 4.69
Nestle India Ltd. 4.58
Manpasand Beverages Ltd. 4.20
Titan Company Ltd. 4.03
Procter & Gamble Hygiene And Health Care Ltd. 3.56
United Breweries Ltd. 3.35
Colgate Palmolive (India) Ltd. 3.29
VIP Industries Ltd. 3.23
Hawkins Cookers Ltd. 2.47
Avenue Supermarts Ltd. 2.42
Thangamayil Jewellery Ltd. 1.78
Hatsun Agro Product Ltd. 1.24
Radico Khaitan Ltd. 0.90
V2 Retail Ltd. 0.73
Equity Shares Total 99.09
CBLO 0.97
Cash & Other Receivables (0.06)
Grand Total 100.00
Stock Name (%) Of Total AUM
(Previously known as SBI MSFU - FMCG Fund)
Investors understand that their principal
will be at High risk
^Investors should consult their financial advisers if in doubt about whether the product is suitable for them.
Pursuant to payment of dividend, the NAV of Dividend Option ofscheme/plans would fall to the extent of payout and statutory levy, ifapplicable.
59.7320.64
18.720.91
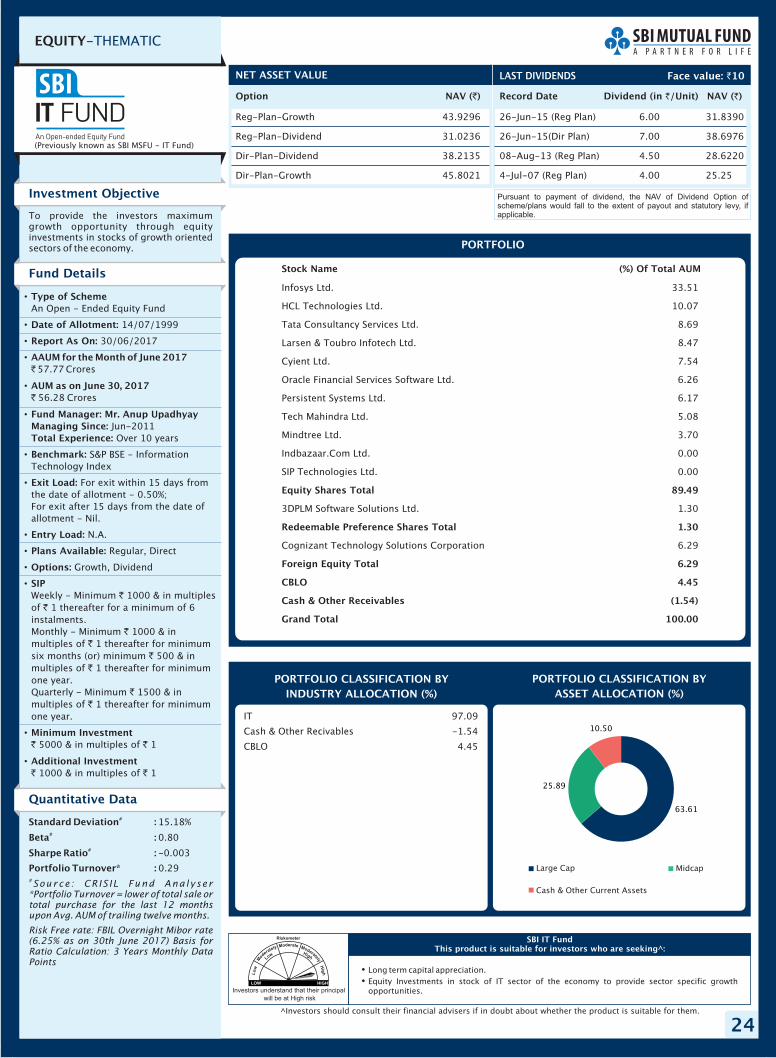
24
EQUITY-THEMATIC
Option NAV ( )`
Reg-Plan-Growth 43.9296
Reg-Plan-Dividend 31.0236
Dir-Plan-Dividend 38.2135
Dir-Plan-Growth 45.8021
NET ASSET VALUE
Record Date Dividend NAV ( )`(in /Unit)`
26-Jun-15 (Reg Plan) 6.00 31.8390
26-Jun-15(Dir Plan) 7.00 38.6976
08-Aug-13 (Reg Plan) 4.50 28.6220
4-Jul-07 (Reg Plan) 4.00 25.25
LAST DIVIDENDS
�
�
Long term capital appreciation.
Equity Investments in stock of IT sector of the economy to provide sector specific growthopportunities.
SBI IT FundThis product is suitable for investors who are seeking^:
Face value: 10`
Investment Objective
Quantitative Data
To provide the investors maximumgrowth opportunity through equityinvestments in stocks of growth orientedsectors of the economy.
Fund Details
Standard Deviation :
Beta :
Sharpe Ratio :
Portfolio Turnover* :
#
#
#
15.18%
0.80
-0.003
0.29#Source : CR IS IL Fund Ana lyser
*Portfolio Turnover = lower of total sale ortotal purchase for the last 12 monthsupon Avg. AUM of trailing twelve months.
Risk Free rate: FBIL Overnight Mibor rate(6.25% as on 30th June 2017) Basis forRatio Calculation: 3 Years Monthly DataPoints
PORTFOLIO CLASSIFICATION BY
(%)ASSET ALLOCATION
IT 97.09
Cash & Other Recivables -1.54
CBLO 4.45
Pursuant to payment of dividend, the NAV of Dividend Option ofscheme/plans would fall to the extent of payout and statutory levy, ifapplicable.
•
•
•
•
•
•
•
•
•
•
•
•
•
•
Type of Scheme
Date of Allotment:
Report As On:
AAUM for the Month of June 2017
AUM as on June 30, 2017
Fund Manager: Mr. Anup Upadhyay
Managing Since:
Total Experience:
Benchmark:
Exit Load:
Entry Load:
Plans Available:
Options:
SIP
Minimum Investment
Additional Investment
An Open - Ended Equity Fund
14/07/1999
30/06/2017
57.77 Crores
56.28 Crores
Jun-2011
Over 10 years
S&P BSE - Information
Technology Index
For exit within 15 days from
the date of allotment - 0.50%;
For exit after 15 days from the date of
allotment - Nil.
N.A.
Regular, Direct
Growth, Dividend
Weekly - Minimum 1000 & in multiples
of 1 thereafter for a minimum of 6
instalments.
Monthly - Minimum 1000 & in
multiples of 1 thereafter for minimum
six months (or) minimum 500 & in
multiples of 1 thereafter for minimum
one year.
Quarterly - Minimum 1500 & in
multiples of 1 thereafter for minimum
one year.
5000 & in multiples of 1
1000 & in multiples of 1
`
`
`
`
`
`
`
`
`
`
` `
` `
Large Cap Midcap
Cash & Other Current Assets
PORTFOLIO CLASSIFICATION BY
INDUSTRY ALLOCATION (%)
PORTFOLIO
Infosys Ltd. 33.51
HCL Technologies Ltd. 10.07
Tata Consultancy Services Ltd. 8.69
Larsen & Toubro Infotech Ltd. 8.47
Cyient Ltd. 7.54
Oracle Financial Services Software Ltd. 6.26
Persistent Systems Ltd. 6.17
Tech Mahindra Ltd. 5.08
Mindtree Ltd. 3.70
Indbazaar.Com Ltd. 0.00
SIP Technologies Ltd. 0.00
3DPLM Software Solutions Ltd. 1.30
Cognizant Technology Solutions Corporation 6.29
Equity Shares Total 89.49
Redeemable Preference Shares Total 1.30
Foreign Equity Total 6.29
CBLO 4.45
Cash & Other Receivables (1.54)
Grand Total 100.00
Stock Name (%) Of Total AUM
(Previously known as SBI MSFU - IT Fund)
^Investors should consult their financial advisers if in doubt about whether the product is suitable for them.
Investors understand that their principal
will be at High risk
63.61
25.89
10.50

25
Option NAV ( )`
Reg-Plan-Growth 9.1570
Reg-Plan-Dividend 9.1588
Dir-Plan-Growth 9.3270
Dir-Plan-Dividend 9.3234
NET ASSET VALUE
Investors understand that their principal
will be at Moderately High risk
�
�
Long term capital appreciation.
Investment in SBI - ETF Gold.
SBI GOLD FundThis product is suitable for investors who are seeking^:
Investment Objective
The scheme seeks to provide returns thatclosely correspond to returns provided bySBI - ETF Gold (Previously known as SBIGETS).
Fund Details
PORTFOLIO CLASSIFICATION BY (%)ASSET ALLOCATION
•
•
•
•
•
•
•
•
•
•
•
•
•
•
Type of Scheme
Date of Allotment:
Report As On:
AAUM for the Month of June 2017
AUM as on June 30, 2017
Fund Manager: Mr. Raviprakash
Sharma
Managing Since:
Total Experience:
Benchmark:
Exit Load:
Entry Load:
Plans Available:
Options:
SIP
Minimum Investment
Additional Investment
An Open Ended Fund of Fund Scheme
12/09/2011
30/06/2017
434.64 Crores
425.37 Crores
Sep-2011
Over 17 years
Price of Physical Gold
Exit within 1 year from the
date of allotment – 1%.
Exit after 1 year from the date of
allotment - Nil
N.A.
Regular, Direct
Growth, Dividend
Weekly - Minimum 1000 & in multiples
of 1 thereafter for a minimum of 6
instalments.
The minimum amount of investment for
SIP transactions is 6000 (aggregate)
either through:
(1) 100/- per month and in multiples
of 1/- thereafter for minimum 60
months
(2) 500/- per month and in multiples
of 1/- thereafter for minimum 12
months
(3) 1000/- per month and in multiples
of 1/- thereafter for minimum 6
months
(4) 500/- per quarter and in multiples
of 1/- thereafter for minimum 12
quarters
(5) 1500/- per quarter and in multiples
of 1/- thereafter for minimum 4
quarters
5000 & in multiples of 1
1000 & in multiples of 1
`
`
`
`
`
`
`
`
`
`
`
`
`
`
`
` `
` `
Mutual Fund Units NCA (INCL. Cash, Deposits)
PORTFOLIO
SBI - ETF Gold 99.84
Mutual Fund Units Total 99.84
CBLO 0.31
Cash & Other Receivables -0.15
Grand Total 100.00
Mutual Fund (%) Of Total AUM
^Investors should consult their financial advisers if in doubt about whether the product is suitable for them.
FUND OF FUNDS
99.84
0.16

26
EQUITY-ARBITRAGE
Option NAV ( )`
Reg-Plan-Growth 21.6928
Reg-Plan-Dividend 13.2643
Dir-Plan-Dividend 14.0774
Dir-Plan-Growth 22.1482
NET ASSET VALUE
Record Date Dividend NAV ( )`(in /Unit)`
30-Jun-17 (Reg Plan) 0.06 13.2643
(Dir Plan) 0.07 14.077430-Jun-17
30-May-17 (Reg Plan) 0.06 13.2608
30-May-17 (Dir Plan) 0.07 14.0742
28-Apr-17 (Reg Plan) 0.06 13.2507
28-Apr-17 (Dir Plan) 0.07 14.0663
LAST DIVIDENDS
Investors understand that their principal
will be at Moderately Low risk
�
�
Short term investment.
Investments to exploit profitable arbitrage opportunities between the spot and derivative marketsegments to provide capital appreciation and regular income.
SBI Arbitrage Opportunities FundThis product is suitable for investors who are seeking^:
Face value: 10`
Investment Objective
Quantitative Data
To provide capital appreciation andregular income for unit holders byident i fy ing prof i table arbi t rageopportunities between the spot andderivative market segments as alsothrough investment of surplus cash indebt and money market instruments.
Fund Details
Standard Deviation :
Beta :
Sharpe Ratio :
Portfolio Turnover* :
#
#
#
0.56%
1.20
0.58
10.40#Source : CR IS IL Fund Ana lyser
*Portfolio Turnover = lower of total sale ortotal purchase for the last 12 monthsupon Avg. AUM of trailing twelve months.
Risk Free rate: FBIL Overnight Mibor rate(6.25% as on 30th June 2017) Basis forRatio Calculation: 3 Years Monthly DataPoints
PORTFOLIO CLASSIFICATION BY
(%)ASSET ALLOCATION
Cash & Other Recivables 65.16Financial Services 25.91Services 7.90Cement & Cement Products 7.12Automobile 6.41Telecom 5.91Media & Entertainment 5.73Energy 4.80Consumer Goods 4.31Pharma 4.14Industrial Manufacturing 3.86Healthcare Services 2.11Chemicals 1.81Metals 1.29IT 1.03Construction 0.19Fertilisers & Pesticides 0.03Futures -67.00CBLO 3.01Fixed Deposits 16.29
Pursuant to payment of dividend, the NAV of Dividend Option ofscheme/plans would fall to the extent of payout and statutory levy, ifapplicable.
•
•
•
•
•
•
•
•
•
•
•
•
•
•
Type of Scheme
Date of Allotment:
Report As On:
AAUM for the Month of June 2017
AUM as on June 30, 2017
Fund Manager: Mr. Neeraj Kumar
Managing Since:
Total Experience:
Benchmark:
Exit Load:
Entry Load:
Plans Available:
Option:
SIP
Minimum Investment
Additional Investment
An Open - Ended Scheme
03/11/2006
30/06/2017
731.26 Crores
765.09 Crores
Oct-2012
Over 20 years
CRISIL Liquid Fund Index
For exit within 1 month fromthe date of allotment - 0.50%;For exit after 1 month from the date ofallotment - Nil.
N.A.
Regular, Direct
Growth, Dividend
Weekly - Minimum 1000 & in multiplesof 1 thereafter for a minimum of 6instalments.
Monthly - Minimum 1000 & in multiplesof 1 thereafter for minimum six months(or) minimum 500 & in multiples of 1thereafter for minimum one year.
Quarterly - Minimum 1500 & inmultiples of 1 thereafter for minimumone year.
5000 & in multiples of 1
1000 & in multiples of 1
`
`
`
`
`
`
` `
`
`
` `
` `
PORTFOLIO CLASSIFICATION BY
INDUSTRY ALLOCATION (%)
PORTFOLIO
Century Textiles & Industries Ltd. 6.98Tata Communications Ltd. 5.91Tata Motors Ltd. (Dvr-A-Ordy) 4.66Indiabulls Housing Finance Ltd. 3.70ITC Ltd. 2.97Cesc Ltd. 2.88TV18 Broadcast Ltd. 2.69IDFC Bank Ltd. 2.51Aurobindo Pharma Ltd. 2.45Bharat Financial Inclusion Ltd. 2.36Zee Entertainment Enterprises Ltd. 2.34Bharat Electronics Ltd. 2.26Jain Irrigation Systems Ltd. 1.50Jet Airways (India) Ltd. 1.34Shriram Transport Finance Company Ltd. 1.22Apollo Hospitals Enterprises Ltd. 1.21Tata Global Beverages Ltd. 1.19Pidilite Industries Ltd. 1.16Capital First Ltd. 1.15Multi Commodity Exchange Of India Ltd. 1.13Wockhardt Ltd. 1.12State Bank Of India 1.05Fortis Healthcare Ltd. 0.90Reliance Infrastructure Ltd. 0.89IDFC Ltd. 0.86Yes Bank Ltd. 0.85Tata Steel Ltd. 0.83JSW Energy Ltd. 0.78Motherson Sumi Systems Ltd. 0.70Tata Chemicals Ltd. 0.65Tata Elxsi Ltd. 0.63South Indian Bank Ltd. 0.60Bosch Ltd. 0.59Sun TV Network Ltd. 0.59Manappuram Finance Ltd. 0.57Dr. Reddy's Laboratories Ltd. 0.47Ashok Leyland Ltd. 0.42
Stock Name (%) Of Total AUM Stock Name (%) Of Total AUM
Axis Bank Ltd. 0.41Infosys Ltd. 0.41Srei Infrastucture Finance Ltd. 0.26Coal India Ltd. 0.26Balrampur Chini Mills Ltd. 0.15ACC Ltd. 0.12Reliance Defence And Engineering Ltd. 0.11Reliance Power Ltd. 0.11JSW Steel Ltd. 0.10National Buildings ConstructionCorporation Ltd. 0.10PVR Ltd. 0.10Hindustan Zinc Ltd. 0.10Piramal Enterprises Ltd. 0.10Indian Oil Corporation Ltd. 0.08NCC Ltd. 0.08Oil India Ltd. 0.04Eicher Motors Ltd. 0.04Gujarat State Fertilizer & Chemicals Ltd. 0.03Chennai Petroleum Corporation Ltd. 0.02Ambuja Cements Ltd. 0.02Bajaj Finserv Ltd. 0.01Indusind Bank Ltd. 0.01Kotak Mahindra Bank Ltd. 0.01
Tata Motors Finance Solutions Ltd. 2.66
Edelweiss Commodities Services Ltd. 6.55Piramal Finance Pvt. Ltd. 5.22Motilal Oswal Securities Ltd. 1.31
RBL Bank Ltd. 9.93Axis Bank Ltd. 6.36
Equity Shares Total 66.79
Non-Convertible Debenture Total 2.66
Commercial Paper Total 13.09
Fixed Deposits Total 16.29CBLO 3.01Cash & Other Receivables 65.16Futures (67.00)Grand Total 100.00
^Investors should consult their financial advisers if in doubt about whether the product is suitable for them.
Cash & Other Current Assets Futures
Large Cap Midcap Smallcap
26.71
39.93
0.15
100.21
-67.00

27
EQUITY-INDEX FUND
Option NAV ( )`
Reg-Plan-Growth 80.9323
Reg-Plan-Dividend 41.4586
Dir-Plan-Dividend 42.3509
Dir-Plan-Growth 82.5131
NET ASSET VALUE
Investors understand that their principal
will be at Moderately High risk
�
�
Long term capital appreciation.
Passive Investment in stocks comprising the Nifty 50 Index in the same proportion as in the indexto achieve returns equivalent to the Total returns Index of Nifty 50 Index.
SBI Nifty Index FundThis product is suitable for investors who are seeking^:
Investment Objective
Quantitative Data
The scheme will adopt a passiveinvestment strategy. The scheme willinvest in stocks comprising the Nifty 50Index in the same proportion as in theindex with the objective of achievingreturns equivalent to the Total ReturnsIndex of Nifty 50 Index by minimizing theperformance difference between thebenchmark index and the scheme. TheTotal Returns Index is an index thatreflects the returns on the index fromindex gain/loss plus dividend paymentsby the constituent stocks.
Fund Details
Portfolio Turnover* :
Tracking Error :
0.71
0.19%
*Portfolio Turnover = lower of total sale ortotal purchase for the last 12 monthsupon Avg. AUM of trailing twelve months.
Tracking Error is computed for the 3 YearPeriod ending 30th June 2017, based onmonth-end NAV. Tracking Error iscomputed using Total Returns Index.
PORTFOLIO CLASSIFICATION BY
(%)ASSET ALLOCATION
Financial Services 33.69
Energy 12.54
IT 11.16
Consumer Goods 10.75
Automobile 10.60
Pharma 4.45
Metals 3.81
Construction 3.70
Telecom 2.04
Cement & Cement Products 1.94
Services 0.78
Media & Entertainment 0.72
Cash & Other Recivables (4.87)
Futures 4.18
CBLO 3.63
Fixed Deposits 0.88
•
•
•
•
•
•
•
•
•
•
•
•
•
•
Type of Scheme
Date of Allotment:
Report As On:
AAUM for the Month of June 2017
AUM as on June 30, 2017
Fund Manager: Mr. Raviprakash
Sharma
Managing Since:
Total Experience:
Benchmark:
Exit Load:
Entry Load:
Plans Available:
Options:
SIP
Minimum Investment
Additional Investment
An Open - Ended Index Fund
17/01/2002
30/06/2017
218.10 Crores
219.04 Crores
Feb-2011
Over 17 years
Nifty 50 Index
Nil
N.A.
Regular, Direct
Growth, Dividend
Weekly - Minimum 1000 & in multiples
of 1 thereafter for a minimum of 6
instalments.
Monthly - Minimum 1000 & in
multiples of 1 thereafter for minimum
six months (or) minimum 500 & in
multiples of 1 thereafter for minimum
one year.
Quarterly - Minimum 1500 & in
multiples of 1 thereafter for minimum
one year.
5000 & in multiples of 1
1000 & in multiples of 1
`
`
`
`
`
`
`
`
`
`
` `
` `
PORTFOLIO CLASSIFICATION BY
INDUSTRY ALLOCATION (%)
PORTFOLIO
HDFC Bank Ltd. 8.95
ITC Ltd. 7.37
HDFC Ltd. 6.86
Reliance Industries Ltd. 6.12
Infosys Ltd. 5.00
ICICI Bank Ltd. 4.97
Larsen & Toubro Ltd. 3.70
Tata Consultancy Services Ltd. 3.36
Kotak Mahindra Bank Ltd. 3.10
State Bank Of India 2.72
Maruti Suzuki India Ltd. 2.56
Axis Bank Ltd. 2.35
Tata Motors Ltd. 2.17
Hindustan Unilever Ltd. 2.06
Indusind Bank Ltd. 1.98
Mahindra & Mahindra Ltd. 1.68
Sun Pharmaceuticals Industries Ltd. 1.64
YES Bank Ltd. 1.43
Bharti Airtel Ltd. 1.34
Asian Paints Ltd. 1.33
HCL Technologies Ltd. 1.30
Hero Motocorp Ltd. 1.28
Vedanta Ltd. 1.24
Power Grid Corporation Of India Ltd. 1.24
Oil & Natural Gas Corporation Ltd. 1.19
Ultratech Cement Ltd. 1.10
NTPC Ltd. 1.05
Indian Oil Corporation Ltd. 1.05
Bajaj Auto Ltd. 1.01
Stock Name (%) Of Total AUM Stock Name (%) Of Total AUM
Tata Steel Ltd. 0.98
Eicher Motors Ltd. 0.96
Indiabulls Housing Finance Ltd. 0.93
Bharat Petroleum Corporation Ltd. 0.89
Wipro Ltd. 0.87
Dr. Reddy's Laboratories Ltd. 0.87
Coal India Ltd. 0.85
Adani Ports And Special Economic Zone Ltd. 0.78
Cipla Ltd. 0.75
Hindalco Industries Ltd. 0.74
Zee Entertainment Enterprises Ltd. 0.72
Bharti Infratel Ltd. 0.70
Lupin Ltd. 0.68
Tech Mahindra Ltd. 0.64
Gail (India) Ltd. 0.62
BOSCH Ltd. 0.58
Aurobindo Pharma Ltd. 0.51
Ambuja Cements Ltd. 0.48
Bank Of Baroda 0.41
Tata Power Company Ltd. 0.39
Tata Motors Ltd. (Dvr-A-Ordy) 0.36
ACC Ltd. 0.35
HDFC Bank Ltd. 0.58
Axis Bank Ltd. 0.30
Equity Shares Total 96.19
Fixed Deposits Total 0.88
CBLO 3.63
Cash & Other Receivables (4.87)
Futures 4.18
Grand Total 100.00
(Previously known as SBI Magnum In Fund)dex
^Investors should consult their financial advisers if in doubt about whether the product is suitable for them.
Record Date Dividend NAV ( )`(in /Unit)`
23-Mar-06 3.30 14.5541
28-Mar-05 3.80 15.0818
LAST DIVIDENDS Face value: 10`
Pursuant to payment of dividend, the NAV of Dividend Option ofscheme/plans would fall to the extent of payout and statutory levy, ifapplicable.
Cash & Other Current Assets Futures
Large Cap Midcap
95.80
0.38-0.36
4.18

Month
End
AU
M (
Rs. in
Cro
res)
`12,2
46.7
6 C
rore
s`1
28
.13
Cro
res
`1
,22
2.5
4 C
rore
s`2
40
.52
Cro
res
`4
4.6
9 C
rore
s`6
31
.38
Cro
res
Sta
nd
ard
Devia
tion
#
Beta
#
Sharp
e R
ati
o#
Exp
ense R
ati
oRegula
r-1.9
8 %
Dir
ect-
1.2
0 %
Regula
r-2
.39
%D
irect-
2.0
3%
Regula
r-1
.96
%D
irect-
1.3
6%
Regula
r-2
.31
%D
irect-
1.6
4%
Regula
r-2
.45
%D
irect-
1.7
8%
Regula
r-2
.05
%D
irect-
0.6
5%
Fu
nd
Deta
ils a
s o
n 3
0 J
un
e 2
017
5.2
4
7.8
8 7.6
0
0.1
6years
years
9.4
4%
0.9
1
0.7
9
- - -
- - -
- - -
- - -
- - -
- - - -
5.1
5
7.6
8 y
ears
7.7
2
-years
1.7
5
2.4
8 y
ears
7.0
0
-years
3.1
2
4.4
7 8.2
0
-years
years
- - -
4.4
7
Schem
e N
am
eSBI
Magnum
Bala
nced
Fund
SBI
Dynam
ic A
sset
Allocati
on F
und
SBI
Magnum
Month
ly I
ncom
e P
lan*
SBI
Magnum
Month
lyIn
com
e P
lan
–Flo
ate
r*SBI
Magnum
Child
ren's
Benefi
t Pla
nSBI
Eq
uit
ySavin
gs F
und
Ideal In
vestm
ent
Hori
zon
3years
+3
years
+2
years
+2
years
+3
years
+1
year
Incep
tion D
ate
31/12/1995
26
/0
3/2
01
50
9/0
4/2
00
12
1/1
2/2
00
52
1/0
2/2
00
22
7/0
5/2
01
5
Fund
Manag
er
Mr.
R.
Sri
niv
asan -
Equit
yM
r. D
inesh A
huja
- D
ebt
Mr.
Din
esh B
ala
chandra
n- E
quit
y &
Equit
y r
ela
ted instr
um
ents
& D
ebt
and M
oney M
ark
et
Instr
um
ents
port
ion- M
s.
Nid
hi C
haw
la-
investm
ents
in f
ore
ign s
ecuri
ties o
fth
e S
chem
e.
Mr.
Ruchit
Mehta
-Equit
yM
r. D
inesh A
huja
-D
ebt
Mr.
Ruchit
Mehta
-Equit
yM
r. D
inesh A
huja
-D
ebt
Mr.
Raje
ev
Radhakri
shnan
Mr.
Neera
j K
um
ar
-A
rbit
rage P
ort
ion
Mr.
Ruchit
Mehta
-Equit
y, D
ebt
Manag
ing
Sin
ce
Jan-2012
Mar-
20
15
July
-2
01
1Ju
ly-2
01
1Ju
n-20
08
May-2
01
5
Benchm
ark
CRIS
IL B
ala
nced F
und -
Aggre
ssiv
eIn
dex
50
% C
risil 1
year
CD
Index +
50
%BSE S
&P S
ensex
CR
ISIL
MIP
Ble
nded F
und
Index
CR
ISIL
MIP
Ble
nded Index
CR
ISIL
MIP
Ble
nded F
und
Index
30
% N
ifty
50
+ 7
0%
Cri
sil L
iquid
Fund Index
Co
mp
osit
ion
by R
ati
ng
s &
Assets
as o
n 3
0 J
un
e 2
017
Exit
Load
For
10%
of
the investm
ents
wit
hin
1Year
–N
il;
For
the r
em
ain
ing investm
ents
-1.0
0%
Wit
hin
1 y
ear
- 1
.00
%For
10%
of
the
investm
ents
wit
hin
1Year
–N
il;For
the
rem
ain
ing
investm
ents
-1.0
0%
For10%
ofth
ein
vest
ments
within
1Year–
Nil;Forth
ere
main
ing
invest
ments
-1.0
0%
Wit
hin
1 y
ear
- 3
%;
Wit
hin
2 y
ears
- 2
%;
Wit
hin
3 y
ears
- 1
%
For
9%
of
the
investm
ents
wit
hin
1Year
–N
il;For
the
rem
ain
ing
investm
ents
-1.0
0%
Larg
e C
ap
Mid
Cap
Futu
res
Sm
all C
ap
Belo
w A
A+
NC
A (
INC
L. C
ASH
, D
EPO
SIT
S)
SO
V, A
AA
, A
A+
and
Eq
uiv
ale
nt
Oth
er
Deta
ils
Co
mp
osit
ion
by
Assets
as o
n 3
0 J
un
e 2
017
Eq
uit
y S
hare
s
Corp
ora
te D
eb
t
Gilts
Money M
ark
et
Instr
um
ents
Oth
er
Assets
69.5
4
14.5
9
9.1
6
-
6.7
0
55
.73
44
.27
- - -
13
.97
52
.30
30
.05
3.6
9
-
14
.11
4.6
9
15
.12
60
.93
5.1
5
25
.55
46
.76
19
.47
-
8.2
1
- - - - -
36.2
5
29.2
0
-
3.7
5
7.0
4
6.7
0
16.7
1
55
.73
-
39
.66
- -
4.6
1
-
7.8
2
4.5
5
-
1.6
0
22
.52
3.6
9
59
.83
5.4
3
5.1
4
-
3.1
1
3.6
1
5.1
5
77
.13
5.4
5
11
.11
-
8.9
9
31
.48
8.2
1
34
.76
53
.35
10
.60
-1
8.8
8
2.4
4
13
.07
27
.08
12
.34
Ple
ase
consu
lt y
our
financia
l advis
or
befo
re invest
ing.
*Month
ly Incom
e is
not
ass
ure
d a
nd is
subje
ct
to t
he a
vailabilit
y o
f dis
trib
uta
ble
surp
lus.
Sourc
e: C
RIS
IL F
und A
naly
ser
*Port
folio T
urn
over
= low
er
of
tota
l sa
le o
r to
tal purc
hase
for
the last
12
month
s upon A
vg.
AU
M o
f tr
ailin
g t
welv
e m
onth
s.
Ris
k F
ree r
ate
: FBIL
Overn
ight
Mib
or
rate
(6.2
5%
as
on 3
0th
June 2
017
) Basi
s fo
r R
ati
o C
alc
ula
tion:
3 Y
ears
Month
ly D
ata
Poin
ts
Mod
ifie
d D
ura
tion
Avera
ge M
atu
rity
Yie
ld t
o M
atu
rity
(%
)
Port
folio T
urn
over$
Snap
shot
of
Hyb
rid
Fund
s

29
HYBRID
Option NAV ( )`
Reg-Plan-Growth 113.7237
Reg-Plan-Dividend 27.7410
Dir-Plan-Dividend 39.8462
Dir-Plan-Growth 118.4045
NET ASSET VALUE
Record Date Dividend Nav ( )`(in /Unit)`
30-Jun-17 (Reg Plan) 0.60 27.7410
30-Jun-17 (Dir Plan) 0.85 39.8462
31-Mar-17 (Reg Plan) 0.60 27.2025
31-Mar-17 (Dir Plan) 0.85 38.9572
30-Dec-16 (Reg Plan) 0.60 25.6184
30-Dec-16 (Dir Plan) 0.85 36.5753
LAST DIVIDENDS
Investors understand that their principal
will be at Moderately High risk
�
�
Long term capital appreciation.
Investment in a mix of debt and equity through stocks of high growth companies and relatively safeportfolio of debt to provide both long term capital appreciation and liquidity.
SBI Magnum Balanced FundThis product is suitable for investors who are seeking^:
Face value: 10`
Investment Objective
Quantitative Data
To provide investors long term capitalappreciation along with the liquidity of anopen-ended scheme by investing in a mixof debt and equity. The scheme will investin a diversified portfolio of equities ofhigh growth companies and balance therisk through investing the rest in arelatively safe portfolio of debt.
Fund Details
Standard Deviation :
Beta :
Sharpe Ratio :
Portfolio Turnover* :
#
#
#
9.44%
0.91
0.79
0.16#Source : CR IS IL Fund Ana lyser
*Portfolio Turnover = lower of total sale ortotal purchase for the last 12 monthsupon Avg. AUM of trailing twelve months.
Risk Free rate: FBIL Overnight Mibor rate(6.25% as on 30th June 2017) Basis forRatio Calculation: 3 Years Monthly DataPoints
PORTFOLIO
HDFC Bank Ltd. 6.88State Bank Of India 5.22Kotak Mahindra Bank Ltd. 3.96ICICI Bank Ltd. 3.61Sundaram Clayton Ltd. 2.55Gruh Finance Ltd. 2.33Infosys Ltd. 2.33Divi's Laboratories Ltd. 2.32Bharti Airtel Ltd. 2.20Sundaram Finance Ltd. 2.00HCL Technologies Ltd. 1.83Colgate Palmolive (India) Ltd. 1.57Aurobindo Pharma Ltd. 1.53Bajaj Finance Ltd. 1.48Gillette India Ltd. 1.45Eris Lifesciences Ltd 1.35Adani Ports And Special Economic Zone Ltd. 1.32Info Edge (India) Ltd. 1.32Procter & Gamble Hygiene And Health Care Ltd. 1.26The Ramco Cements Ltd. 1.15Solar Industries India Ltd. 1.143M India Ltd. 1.11Dr. Lal Path Labs Ltd. 1.04Bajaj Holdings & Investment Ltd. 1.03SJVN Ltd. 1.02Reliance Industries Ltd. 1.00The Great Eastern Shipping Company Ltd. 0.98Eclerx Services Ltd. 0.96Grindwell Norton Ltd. 0.95Equitas Holdings Ltd. 0.87Apollo Hospitals Enterprises Ltd. 0.83Zee Entertainment Enterprises Ltd. 0.81United Breweries Ltd. 0.77Petronet LNG Ltd. 0.75Westlife Development Ltd. 0.73IRB Infrastructure Developers Ltd. 0.69Thermax Ltd. 0.69Allcargo Logistics Ltd. 0.68Navkar Corporation Ltd. 0.67ICICI Prudential Life Insurance Company Ltd. 0.66GE T&D India Ltd. 0.65AIA Engineering Ltd 0.49Goodyear India Ltd. 0.44Redington (India) Ltd. 0.42Graphite India Ltd. 0.42Precision Camshafts Ltd. 0.40
Accelya Kale Solutions Ltd. 0.34Balkrishna Industries Ltd. 0.33Hawkins Cookers Ltd. 0.28ELGI Equipments Ltd. 0.21Muthoot Finance Ltd. 0.20UFO Moviez India Ltd. 0.18Adlabs Entertainment Ltd. 0.10Bosch Ltd. 0.00Numero Uno International Ltd. 0.00
NABARD 2.06National Highways Authority Of India 1.37L&T Metro Rail (Hyderabad) Ltd. 1.15Cholamandalam Investment And Finance Company Ltd. 0.91Equitas Small Finance Bank Ltd. 0.84HDFC Credila Financial Services Pvt Ltd 0.83AU Small Finance Bank Ltd. 0.83Reliance Home Finance Ltd. 0.83Manappuram Finance Ltd. 0.66Tata Motors Ltd. 0.55Century Textiles & Industries Ltd. 0.50Rural Electrification Corporation Ltd. 0.47Repco Home Finance Ltd. 0.46Indian Railway Finance Corporation Ltd. 0.42Tata Chemicals Ltd. 0.22National Housing Bank 0.18Janalakshmi Financial Services Ltd. 0.12Power Finance Corporation Ltd. 0.02Blue Dart Express Ltd. 0.02HDFC Ltd. 0.01
Aditya Birla Retail Ltd. 0.86SVL Ltd. 0.85Repco Home Finance Ltd. 0.45
Government Of India 7.36Central Government Securities Total 7.36Government Of Tamil Nadu 1.70Government Of Madhya Pradesh 0.11
HDFC Bank Ltd. 0.83
Equity Shares Total 69.54
Non-Convertible Debenture Total 12.44
Zero Coupon Bond Total 2.15
State Government Securities Total 1.80
Fixed Deposits Total 0.83CBLO 2.93Cash & Other Receivables 2.95Grand Total 100.00
PORTFOLIO CLASSIFICATION BYASSET CLASS / RATING CLASS (%)
Financial Services 38.18Sovereign 9.16Services 7.19IT 6.77Consumer Goods 6.19Pharma 5.20Automobile 4.27Industrial Manufacturing 3.42Cash & Other Recivables 2.95Energy 2.77Telecom 2.20Construction 2.06Healthcare Services 1.88Cement & Cement Products 1.65Chemicals 1.35Media & Entertainment 1.00CBLO 2.93Fixed Deposits 0.83
Pursuant to payment of dividend, the NAV of Dividend Option ofscheme/plans would fall to the extent of payout and statutory levy, ifapplicable.
•
•
•
•
•
•
•
•
•
•
•
•
•
•
Type of Scheme
Date of Allotment:
Report As On:
AAUM for the Month of June 2017
AUM as on June 30, 2017
Fund Managers:Mr. R. Srinivasan -EquityMr. Dinesh Ahuja -DebtManaging Since:Total Experience:Mr. R. Srinivasan -Mr. Dinesh Ahuja -
Benchmark:
Exit Load:
Entry Load:
Plans Available:
Options:
SIP
Minimum Investment
Additional Investment
An Open - Ended Balanced Scheme
31/12/1995
30/06/2017
11,802.26 Crores
12,246.76 Crores
Jan-2012
Over 24 yearsOver 19 years
CRISIL Balanced Fund -Aggressive Index
For exit within 12 months from the dateof allotment:For 10% of investment - NilFor remaining investments - 1.00%;For exit after 12 months from the dateof allotment - Nil.
N.A.
Regular, Direct
Growth, Dividend
Weekly - Minimum 1000 & in multiplesof 1 thereafter for a minimum of 6instalments.Monthly - Minimum 1000 & inmultiples of 1 thereafter for minimumsix months (or) minimum 500 & inmultiples of 1 thereafter for minimumone yearQuarterly - Minimum 1500 & inmultiples of 1 thereafter for minimumone year.
1000 & in multiples of 1
1000 & in multiples of 1
`
`
`
`
`
`
`
`
`
`
` `
` `
PORTFOLIO CLASSIFICATION BY
INDUSTRY ALLOCATION (%)
Issuer Name (%) Of Total AUM Issuer Name (%) Of Total AUM
^Investors should consult their financial advisers if in doubt about whether the product is suitable for them.
NCA (INCL. Cash, Deposits)
Large Cap Midcap Small Cap Below AA+
SOV,AAA,AA+ and Equivalent
36.25
29.20
3.75
7.04
6.70
16.71

30
HYBRID
Option NAV ( )`
Reg Plan - Dividend 11.8802
Dir Plan - 11.9680
Dir Plan - Growth 11.9751
Reg Plan - 11.8802
Dividend
Growth
NET ASSET VALUE
Investors understand that their principal
will be at Moderately High risk
�
�
Income and capital appreciation.
Dynamic Asset allocation between equity related Instruments and fixed income instruments so asto provide with long term capital appreciation.
SBI Dynamic Asset Allocation FundThis product is suitable for investors who are seeking^:
Investment Objective
The objective of the fund will be toprovide investors with an opportunity toinvest in a portfolio of a mix of equity andequity related securities and fixed incomeinstruments.The allocation between fixed income andequity instruments will be manageddynamically so as to provide investorswith long term capital appreciation.However, there can be no assurance thatthe investment objective of the Schemewill be achieved.
Fund Details
PORTFOLIO
HDFC Bank Ltd. 6.94
ITC Ltd. 5.83
HDFC Ltd. 5.61
Reliance Industries Ltd. 4.83
ICICI Bank Ltd. 3.97
Infosys Ltd. 3.88
Larsen & Toubro Ltd. 2.89
Tata Consultancy Services Ltd. 2.17
Maruti Suzuki India Ltd. 2.02
Axis Bank Ltd. 1.85
State Bank Of India 1.85
Hindustan Unilever Ltd. 1.61
Mahindra & Mahindra Ltd. 1.31
Bharti Airtel Ltd. 1.12
Sun Pharmaceuticals Industries Ltd. 1.11
Hero Motocorp Ltd. 0.94
Oil & Natural Gas Corporation Ltd. 0.89
Tata Steel Ltd. 0.79
Bajaj Auto Ltd. 0.79
Dr. Reddy's Laboratories Ltd. 0.73
Wipro Ltd. 0.73
NTPC Ltd. 0.68
Cipla Ltd. 0.59
Asian Paints Ltd. 0.57
Coal India Ltd. 0.56
Gail (India) Ltd. 0.47
Adani Ports And Special Economic Zone Ltd. 0.38
Tata Motors Ltd. 0.35
Lupin Ltd. 0.29
Power Grid Corporation Of India Ltd. 0.01
Axis Bank Ltd. 3.09
Allahabad Bank 2.13
Equity Shares Total 55.73
Fixed Deposits Total 5.22
CBLO 38.24
Cash & Other Receivables (38.85)
Futures 39.66
Grand Total 100.00
PORTFOLIO CLASSIFICATION BYASSET CLASS / RATING CLASS (%)
Financial Services 20.22
Consumer Goods 8.01
Energy 6.88
IT 6.78
Automobile 5.40
Construction 2.89
Pharma 2.71
Metals 1.35
Telecom 1.12
Services 0.38
Cash & Other Recivables (38.85)
Futures 39.66
CBLO 38.24
Fixed Deposits 5.22
Large Cap NCA (Incl. Cash, Deposits)
•
•
•
•
•
•
•
•
•
•
•
•
•
•
Type of Scheme
Date of Allotment:
Report As On:
AAUM for the Month of June 2017
AUM as on June 30, 2017
Fund Manager:
Mr. Dinesh Balachandran
Ms.
Nidhi Chawla
Managing Since:
Total Experience:
Mr. Dinesh Balachandran
Ms. Nidhi Chawla
Benchmark:
Exit Load:
Entry Load:
Plans Available:
Options:
SIP
Minimum Investment
Additional Investment
An Open - Ended Dynamic Asset
Allocation Scheme
26/03/2015
30/06/2017
128.76 Crores
128.13 Crores
-Equity &
Equity related instruments & Debt and
Money Market Instruments portion-
- investments in foreign
securities of the Scheme.
Mar - 2015
Over 15
Years
Over 10 Years
50% Crisil 1 year CD Index
+ 50% BSE S&P Sensex
For exit within 12 months
from the date of allotment - 1.00%;
For exit after 12 months from the date
of allotment - Nil
N.A.
Regular, Direct
Growth, Dividend
Weekly - Minimum 1000 & in multiples
of 1 thereafter for a minimum of 6
instalments.
Monthly - Minimum 1000 & in
multiples of 1 thereafter for minimum
six months (or) minimum 500 & in
multiples of 1 thereafter for minimum
one year
Quarterly - Minimum 1500 & in
multiples of 1 thereafter for minimum
one year.
5000 & in multiples of 1
1000 & in multiples of 1
`
`
`
`
`
`
`
`
`
`
` `
` `
PORTFOLIO CLASSIFICATION BY
INDUSTRY ALLOCATION (%)
Issuer Name (%) Of Total AUMIssuer Name (%) Of Total AUM
^Investors should consult their financial advisers if in doubt about whether the product is suitable for them.
Total Assets comprise of Futures 39.66%
55.73
4.61

31
HYBRID
Option NAV ( )` Option NAV ( )`
Reg-Plan-Growth 37.5127
Reg-Plan-Monthly Dividend 13.0228
Reg-Plan-Quarterly Dividend 12.6299
Reg-Plan-Annual Dividend 14.7898
Dir-Plan-Growth 38.9767
Dir-Plan-Annual Dividend 17.0727
Dir-Plan-Monthly Dividend 15.7517
Dir-Plan-Quarterly Dividend 13.7771
NET ASSET VALUE
Investors understand that their principal
will be at Moderate risk
�
�
Long term capital appreciation and current income
Investment in equity and equity related instruments as well as fixed income securities (debt andmoney market securities).
SBI Magnum Monthly Income Plan*This product is suitable for investors who are seeking^:
Investment Objective
Quantitative Data
To provide regular income, liquidity andattractive returns to the investorsthrough an actively managed portfolio ofdebt, equity and money marketinstruments.
Fund Details
Modified Duration :
Average Maturity :
Yield to Maturity :
5.15
7.68 years
7.72
PORTFOLIO CLASSIFICATION BYASSET CLASS / RATING CLASS (%)
Financial Services 41.86
Sovereign 30.05
Metals 7.17
Services 4.03
Consumer Goods 3.69
Construction 3.33
Cash & Other Recivables 2.31
Automobile 1.81
Energy 1.67
Cement & Cement Products 0.87
Textiles 0.72
Fertilisers & Pesticides 0.70
Pharma 0.41
•
•
•
•
•
•
•
•
•
•
•
•
•
•
•
Type of Scheme
Date of Allotment:
Report As On:
AAUM for the Month of June 2017
AUM as on June 30, 2017
Fund Managers:
Mr. Ruchit Mehta Equity
Mr. Dinesh Ahuja Debt
Managing Since:
Total Experience
Mr. Ruchit Mehta
Mr. Dinesh Ahuja
Benchmark:
Exit Load:
Entry Load:
Plans Available:
Options:
SIP
Minimum Investment
Additional Investment
An Open - Ended Debt Scheme
09/04/2001
30/06/2017
1,176.37 Crores
1,222.54 Crores
-
-
July-2011
- Over 13 years
- Over 19 years
CRISIL MIP Blended Fund Index
For exit within 1 year from
the date of allotment For 10% of
investment : Nil
For remaining investment: 1.00%
For exit after one year from the date of
allotment – Nil
N.A.
Regular, Direct
Growth, Dividend
Weekly - Minimum 1000 & in multiples
of 1 thereafter for a minimum of 6
instalments.
Monthly - Minimum 1000 & in
multiples of 1 thereafter for minimum
six months (or) minimum 500 & in
multiples of 1 thereafter for minimum
one year
Quarterly - Minimum 1500 & in
multiples of 1 thereafter for minimum
one year.
5,000 & in multiples of 1
1,000 & in multiples of 1
`
`
`
`
`
`
`
`
`
`
` `
` `
PORTFOLIO CLASSIFICATION BY
INDUSTRY ALLOCATION (%)
PORTFOLIO
The Ramco Cements Ltd. 0.87
Greenply Industries Ltd. 0.81
Srei Infrastucture Finance Ltd. 0.75
ITC Ltd. 0.74
Titan Company Ltd. 0.73
Indian Terrain Fashions Ltd. 0.72
Maruti Suzuki India Ltd. 0.71
UPL Ltd. 0.70
Petronet Lng Ltd. 0.67
Kotak Mahindra Bank Ltd. 0.67
State Bank Of India 0.61
Motherson Sumi Systems Ltd. 0.53
Indraprastha Gas Ltd. 0.52
Mahindra & Mahindra FinancialServices Ltd. 0.48
Hindustan PetroleumCorporation Ltd. 0.47
Sheela Foam Ltd. 0.45
Shriram Transport FinanceCompany Ltd. 0.44
Aurobindo Pharma Ltd. 0.41
Tata Motors Ltd. 0.37
Kansai Nerolac Paints Ltd. 0.33
Procter & Gamble Hygiene AndHealth Care Ltd. 0.32
Hindalco Industries Ltd. 0.31
Britannia Industries Ltd. 0.30
Repco Home Finance Ltd. 0.27
Shriram City Union Finance Ltd. 0.25
Indusind Bank Ltd. 0.24
Amara Raja Batteries Ltd. 0.20
PSP Projects Ltd. 0.07
Hindalco Industries Ltd. CRISIL AA- 6.86
Indian Railway FinanceCorporation Ltd. CRISIL AAA 6.77
HDFC Credila FinancialServices Pvt Ltd CRISIL AA+ 4.14
NABARD CRISIL AAA 3.74
Rural Electrification Corporation Ltd.CRISIL AAA 3.41
Muthoot Finance Ltd. CRISIL AA 3.29
Power Finance Corporation Ltd. CRISIL AAA 2.89
Reliance Home Finance Ltd. CARE AA+ 2.88
Manappuram Finance Ltd. CARE AA- 2.52
L&T Metro Rail (Hyderabad) Ltd. ICRA AAA(SO) 2.46
Tata Realty And Infrastructure Ltd. CRISIL AA 2.44
AU Small Finance Bank Ltd. IRRPL INDA+ 2.12
HDFC Ltd. CRISIL AAA 2.08
Equitas Small Finance Bank Ltd. CARE A+ 1.67
Oriental Hotels Ltd. CARE A+ 1.57
Indiabulls Housing Finance Ltd. CARE AAA 1.42
Janalakshmi Financial Services Ltd. ICRA A 1.23
Vadodara Bharuch Tollway Ltd. IRRPL INDA 0.82
Government Of India SOVEREIGN 25.67
Government Of Tamil Nadu SOVEREIGN 4.37
Equity Shares Total 13.97
Non-Convertible Debenture Total 52.30
Central Government Securities Total 25.67
State Government Securities Total 4.37
CBLO 1.38
Cash & Other Receivables 2.31
Grand Total 100.00
Issuer Name Rating (%) Of TotalAUM
Issuer Name Rating (%) Of TotalAUM
^Investors should consult their financial advisers if in doubt about whether the product is suitable for them.
Large Cap
NCA(INCL. CASH,DEPOSITS) SOV,AAA,AA+ and Equivalent
Midcap Small Cap Below AA+
7.82
4.551.60
22.52
3.6959.83

32
HYBRID
Option NAV ( )` Option NAV ( )`
Reg Plan - Growth 24.5262
Reg Plan- -Dividend 12.3660
Reg Plan- -Dividend 12.5164
Reg Plan-Annual-Dividend 15.3566
Monthly
Quarterly
Dir Plan- -Dividend 13.5898
Dir Plan- -Dividend 12.7549
Dir Plan-Growth 25.3333
Dir Plan-Annual-Dividend 15.9143
Quarterly
Monthly
NET ASSET VALUE
�
�
Long term capital appreciation and current income
Investment in equity and equity related instruments as well as fixed income securities (debt andmoney market securities).
SBI Magnum Monthly Income Plan – Floater*This product is suitable for investors who are seeking^:
Investment Objective
Quantitative Data
To provide regular income, liquidity andattractive returns to investors in additionto mitigating the impact of interest raterisk through an actively managedportfolio of floating rate and fixed ratedebt instruments, equity, money marketinstruments and derivatives.
Fund Details
Modified Duration :
Average Maturity :
Yield to Maturity :
2.48
1.75 years
7.00
PORTFOLIO CLASSIFICATION BYASSET CLASS / RATING CLASS (%)
Financial Services 45.41
Sovereign 22.11
Consumer Goods 9.25
Telecom 7.93
Automobile 2.24
Construction 2.09
Energy 1.25
Textiles 1.17
Chemicals 0.93
Cement & Cement Products 0.70
Pharma 0.67
Fertilisers & Pesticides 0.60
Services 0.50
Cash & Other Recivables -4.63
CBLO 9.79
•
•
•
•
•
•
•
•
•
•
•
•
•
•
Type of Scheme
Date of Allotment:
Report As On:
AAUM for the Month of June 2017
AUM as on June 30, 2017
Fund Managers:
Mr. Ruchit Mehta Equity
Mr. Dinesh Ahuja Debt
Managing Since:
Total Experience
Mr. Ruchit Mehta
Mr. Dinesh Ahuja
Benchmark:
Exit Load:
Entry Load:
Plans Available:
Options:
SIP
Minimum Investment
Additional Investment
An Open - Ended Debt Scheme
21/12/2005
30/06/2017
235.60 Crores
240.52 Crores
-
-
July-2011
- Over 13 years
- Over 19 years
CRISIL MIP Blended Fund Index
For exit within 12 months
from the date of allotment
For 10% of investments : Nil
For remaining investment: 1.00%
For exit after 12 months from the date
of allotment – Nil
N.A.
Regular, Direct
Growth, Dividend
Weekly - Minimum 1000 & in multiples
of 1 thereafter for a minimum of 6
instalments.
Monthly - Minimum 1000 & in
multiples of 1 thereafter for minimum
six months (or) minimum 500 & in
multiples of 1 thereafter for minimum
one year.
Quarterly - Minimum 1500 & in
multiples of 1 thereafter for minimum
one year.
5,000 & in multiples of 1
1,000 & in multiples of 1
`
`
`
`
`
`
`
`
`
`
` `
` `
PORTFOLIO CLASSIFICATION BY
INDUSTRY ALLOCATION (%)
PORTFOLIO
Titan Company Ltd. 1.03
Atul Ltd. 0.93
Maruti Suzuki India Ltd. 0.87
State Bank Of India 0.87
Kotak Mahindra Bank Ltd. 0.75
Indian Terrain Fashions Ltd. 0.72
Mahindra & Mahindra FinancialServices Ltd. 0.72
JK Tyre And Industries Ltd. 0.70
The Ramco Cements Ltd. 0.70
Petronet Lng Ltd. 0.68
Reliance Capital Ltd. 0.67
Tata Motors Ltd. 0.67
Alkem Laboratories Ltd. 0.67
Itd Cementation India Ltd. 0.64
Sharda Cropchem Ltd. 0.60
PNC Infratech Ltd. 0.60
Hindustan Petroleum Corporation Ltd. 0.56
Ganesha Ecosphere Ltd. 0.45
Shriram City Union Finance Ltd. 0.44
AU Small Finance Bank Ltd. 0.42
Shriram Transport FinanceCompany Ltd. 0.42
Manappuram Finance Ltd. CARE AA- 2.13
Equity Shares Total 14.11
Tata Realty And Infrastructure Ltd. CRISIL AA 0.85
Janalakshmi Financial Services Ltd. ICRA A 0.63
LIC Housing Finance Ltd. CRISIL AAA 0.59
L&T Metro Rail (Hyderabad) Ltd. ICRA AAA(SO) 0.50
United Spirits Ltd. ICRA A1+ 8.22
Indus Tower Ltd. CRISIL A1+ 7.93
Altico Capital India Pvt. Ltd. IRRPL INDA1+ 6.17
Kotak Mahindra Investments Ltd. CRISIL A1+ 5.95
TGS Investment & Trade Pvt. Ltd. ICRA A1+ 3.91
JM Financial Products Ltd. CRISIL A1+ 3.71
HDFC Ltd. ICRA A1+ 2.07
NABARD CRISIL A1+ 8.00
Small Industries DevelopmentBank Of India CARE A1+ 7.96
Government Of India SOVEREIGN 14.55
Government Of Tamil Nadu SOVEREIGN 0.57
323 Day T-Bill Mat 13.03.2018 SOVEREIGN 6.99
Non-Convertible Debenture Total 4.69
Commercial Paper Total 37.97
Certificate Of Deposits Total 15.97
Central Government Securities Total 14.55
State Government Securities Total 0.57
Treasury Bills Total 6.99
CBLO 9.79
Cash & Other Receivables (4.63)
Grand Total 100.00
Issuer Name Rating (%) Of TotalAUM
Issuer Name Rating (%) Of TotalAUM
^Investors should consult their financial advisers if in doubt about whether the product is suitable for them.
Investors understand that their principal
will be at Moderate risk
NCA (INCL. Cash, Deposits) SOV,AAA,AA+ and Equivalent
Large Cap Midcap Small Cap Below AA+
5.435.14
3.11
3.61
5.15
77.13

33
HYBRID
Option NAV ( )`
Reg Plan-Growth 48.7816
Dir Plan-Growth 50.5893
NET ASSET VALUE
Investors understand that their principal
will be at Moderately High risk
�
�
Long term capital appreciation and current income
Investment in equity and equity related instruments as well as fixed income securities (debt andmoney market securities).
SBI Magnum Children's Benefit PlanThis product is suitable for investors who are seeking^:
Investment Objective
Quantitative Data
To provide attractive returns to theMagnum holders / Unit holders by meansof capital appreciation through anactively managed portfolio of debt, equityand money market instruments.
Fund Details
Modified Duration :
Average Maturity :
Yield to Maturity :
3.12
4.47 years
8.20
PORTFOLIO CLASSIFICATION BYASSET CLASS / RATING CLASS (%)
Financial Services 33.38
Sovereign 19.47
Construction 10.46
Consumer Goods 7.12
Metals 5.93
Media & Entertainment 4.03
Pharma 3.17
Industrial Manufacturing 2.55
Cash & Other Recivables 2.14
Textiles 1.33
Telecom 0.98
Automobile 0.94
Energy 0.87
IT 0.86
Healthcare Services 0.70
CBLO 6.07
•
•
•
•
•
•
•
•
•
•
•
•
•
•
Type of Scheme
Date of Allotment:
Report As On:
AAUM for the Month of June 2017
AUM as on June 30, 2017
Fund Manager:
Mr. Rajeev RadhakrishnanManaging Since:Total Experience:
Benchmark:
Exit Load:
Entry Load:
Plans Available:
Options:
SIP
Minimum Investment
Additional Investment
An Open - Ended Income Scheme
21/02/2002
30/06/2017
43.82 Crores
44.69 Crores
Jun-2008Over 16 years
CRISIL MIP Blended Fund Index
Within 1 year :3%, Within 2 years :2%,Within 3 years :1%, above 3 years: NIL.
N.A
Regular, Direct
Growth,
Weekly - Minimum 1000 & inmultiples of 1 thereafter for aminimum of 6 instalments.Monthly - Minimum 1000 & inmultiples of 1 thereafter for minimumsix months (or) minimum 500 & inmultiples of 1 thereafter for minimumone yearQuarterly - Minimum 1500 & inmultiples of 1 thereafter for minimumone year.
5,000 & in multiples of 1
1,000 & in multiples of 1
`
`
`
`
`
`
`
`
`
`
` `
` `
PORTFOLIO CLASSIFICATION BY
INDUSTRY ALLOCATION (%)
PORTFOLIO
Central Depository Services(India) Ltd. 3.44
Gufic Biosciences Ltd. 2.22
Tata Global Beverages Ltd. 1.86
State Bank Of India 1.84
NCC Ltd. 1.35
Sadbhav Engineering Ltd. 1.26
Ahluwalia Contracts (India) Ltd. 1.19
PNC Infratech Ltd. 1.19
Raymond Ltd. 1.18
Gillette India Ltd. 1.00
Bharti Airtel Ltd. 0.98
Divi'S Laboratories Ltd. 0.94
Mahindra & Mahindra Ltd. 0.94
Kalpataru Power Transmission Ltd. 0.87
Thermax Ltd. 0.86
Tech Mahindra Ltd. 0.86
GE T&D India Ltd. 0.84
Bharat Forge Ltd. 0.84
VIP Industries Ltd. 0.73
Narayana Hrudayalaya Ltd. 0.70
Power Mech Projects Ltd. 0.21
Issuer Name Rating (%) Of TotalAUM
Issuer Name Rating (%) Of TotalAUM
Page Industries Ltd. 0.15
United Breweries Ltd. 0.09
Rural ElectrificationCorporation Ltd. CRISIL AAA 7.88
Janalakshmi FinancialServices Ltd. ICRA A 7.84
Reliance Home Finance Ltd. CARE AA+ 6.71
Hindalco Industries Ltd. CRISIL AA- 5.93
Manappuram Finance Ltd. CARE AA- 4.57
Floreat Investment Ltd. ICRA AA(SO) 4.57
Indostar Capital Finance Ltd. CARE AA- 4.54
Sharda Solvent Ltd. BRICK BWRAA-(SO) 4.03
L&T Interstate Road Corridor Ltd. ICRA AAA(SO) 0.70
Government Of India SOVEREIGN 19.47
Equity Shares Total 25.55
Non-Convertible Debenture Total 46.07
Zero Coupon Bond Total 0.70
Central GovernmentSecurities Total 19.47
CBLO 6.07
Cash & Other Receivables 2.14
Grand Total 100.00
^Investors should consult their financial advisers if in doubt about whether the product is suitable for them.
NCA (INCL. Cash, Deposits) SOV,AAA,AA+ and Equivalent
Large Cap Mid Cap Small Cap Below AA+
5.45
11.11
8.99
31.48
8.21
34.76

34
HYBRID
Investors understand that their principal
will be at Moderately High risk
�
�
Regular income & Capital appreciation.
To generate income by investing in arbitrage opportunities in the cash and derivatives segment ofthe equity market, and capital appreciation through a moderate exposure in equity.
SBI Equity Savings FundThis product is suitable for investors who are seeking^:
Investment Objective
The scheme aims to generate income byinvesting in arbitrage opportunities in thecash and derivatives segment of theequity market, and capital appreciationthrough a moderate exposure in equity.
Fund Details
PORTFOLIO CLASSIFICATION BYASSET CLASS / RATING CLASS (%)
Financial Services 33.51Cash & Other Recivables 21.05Consumer Goods 10.80Automobile 8.90Energy 7.18Services 4.89Sovereign 4.88IT 4.85Construction 4.42Pharma 3.37Metals 3.01Media & Entertainment 1.54Fertilisers & Pesticides 1.36Cement & Cement Products 1.26Textiles 1.19Telecom 0.62Futures (18.88)CBLO 4.09Fixed Deposits 1.93
•
•
•
•
•
•
•
•
•
•
•
•
•
•
Type of Scheme
Date of Allotment:
Report As On:
AAUM for the Month of June 2017
AUM as on June 30, 2017
Fund Manager:Mr. Neeraj Kumar -Mr. Ruchit Mehta -Managing Since:Total Experience:Mr. Neeraj Kumar -Mr. Ruchit Mehta -
Benchmark:
Exit Load:
Entry Load:
Plans Available:
Options:
SIP
Minimum Investment
Additional Investment
An Open-Ended Equity Scheme
27/05/2015
30/06/2017
581.13 Crores
631.38 Crores
Arbitrage portionEquity, Debt
May-2015
Over 20 yearsOver 13 years
30% Nifty 50 + 70% CrisilLiquid Fund Index.
For exit within 1 year from the date ofallotment:– For 9 % of the investments-Nil;– For remaining investments-1.00%- Switches made to all open endedequity schemes of SBI Mutual Fund andSBI Magnum Balanced Fund within 1 yearfrom the date of allotment – NilFor exit after 1 year from the date ofallotment – Nil.
N.A.
Regular, Direct
Growth, Dividend
Weekly - Minimum 1000 & in multiples
of 1 thereafter for a minimum of 6
instalments.Monthly - Minimum 1000 & in
multiples of 1 thereafter for minimum
6 months (or) minimum 500 & in
multiples of 1 thereafter for minimum
one yearQuarterly - Minimum 1500 & in
multiples of 1 thereafter for minimum
one year
1000 & in multiples of 1
1000 & in multiples of 1
`
`
`
`
`
`
`
`
`
`
` `
` `
PORTFOLIO CLASSIFICATION BY
INDUSTRY ALLOCATION (%)
PORTFOLIO
ITC Ltd. 5.53Jet Airways (India) Ltd. 3.11Reliance Industries Ltd. 2.81HDFC Bank Ltd. 2.71Tata Motors Ltd. 2.39Yes Bank Ltd. 2.27HDFC Ltd. 2.08Kotak Mahindra Bank Ltd. 2.06Hero Motocorp Ltd. 2.06HCL Technologies Ltd. 1.86Maruti Suzuki India Ltd. 1.83State Bank Of India 1.60Infosys Ltd. 1.52ICICI Bank Ltd. 1.51Adani Enterprises Ltd. 1.31Larsen & Toubro Ltd. 1.12Tata Consultancy Services Ltd. 1.02Zee Entertainment Enterprises Ltd. 1.01Greenply Industries Ltd. 0.98Srei Infrastucture Finance Ltd. 0.91Sun Pharmaceuticals Industries Ltd. 0.90UPL Ltd. 0.86Motherson Sumi Systems Ltd. 0.84Tata Global Beverages Ltd. 0.84Colgate Palmolive (India) Ltd. 0.81Indian Terrain Fashions Ltd. 0.79Petronet LNG Ltd. 0.79JSW Steel Ltd. 0.79Hindustan Petroleum Corporation Ltd. 0.76Aurobindo Pharma Ltd. 0.76Bharat Petroleum Corporation Ltd. 0.73Axis Bank Ltd. 0.71Shriram Transport Finance Company Ltd. 0.70Bajaj Finance Ltd. 0.69The Ramco Cements Ltd. 0.68Manpasand Beverages Ltd. 0.64Mahindra & Mahindra Ltd. 0.63Hindustan Unilever Ltd. 0.63Indusind Bank Ltd. 0.60Gail (India) Ltd. 0.60Hindustan Zinc Ltd. 0.59Coal India Ltd. 0.54Tata Steel Ltd. 0.51Sharda Cropchem Ltd. 0.51Strides Shasun Ltd. 0.49Wockhardt Ltd. 0.48Procter & Gamble Hygiene And Health Care Ltd. 0.42Bharti Airtel Ltd. 0.41United Breweries Ltd. 0.41
Stock Name (%) Of Total AUM Stock Name (%) Of Total AUM
Asian Paints Ltd. 0.40Ganesha Ecosphere Ltd. 0.40Power Grid Corporation Of India Ltd. 0.37Vedanta Ltd. 0.37Oil & Natural Gas Corporation Ltd. 0.36Tata Motors Ltd. (Dvr-A-Ordy) 0.36Ultratech Cement Ltd. 0.33NTPC Ltd. 0.32Indian Oil Corporation Ltd. 0.32Dr. Reddy's Laboratories Ltd. 0.32Bajaj Auto Ltd. 0.31Eicher Motors Ltd. 0.30The Federal Bank Ltd. 0.28Indiabulls Housing Finance Ltd. 0.28TV Today Network Ltd. 0.27Sun TV Network Ltd. 0.26Wipro Ltd. 0.26Adani Ports And Special Economic Zone Ltd. 0.24Cipla Ltd. 0.23Bharti Infratel Ltd. 0.21Hindalco Industries Ltd. 0.21Lupin Ltd. 0.21Tech Mahindra Ltd. 0.19Bosch Ltd. 0.18Jubilant Foodworks Ltd. 0.15Ambuja Cements Ltd. 0.15Bank Of Baroda 0.12Tata Power Company Ltd. 0.12ACC Ltd. 0.11Equity Shares Total 66.39AU Small Finance Bank Ltd. 5.79HDFC Ltd. 4.73Muthoot Finance Ltd. 2.92Floreat Investment Ltd. 2.48Indiabulls Housing Finance Ltd. 2.47Equitas Small Finance Bank Ltd. 0.82Vadodara Bharuch Tollway Ltd. 0.81Blue Dart Express Ltd. 0.24Power Finance Corporation Ltd. 0.16LIC Housing Finance Ltd. 0.08
Government Of India 4.88
Axis Bank Ltd. 1.93
Non-Convertible Debenture Total 20.52
Central Government Securities Total 4.88
Fixed Deposits Total 1.93CBLO 4.09Cash & Other Receivables 21.05Futures (18.88)Grand Total 100.00
Total Assets comprise of Futures -18.88%
NCA (INCL. Cash, Deposits) SOV,AAA,AA+ and Equivalent
Option NAV ( )`
Dir-Plan-Growth 12.2870
Dir-Plan-Monthly Dividend 11.9263
Dir-Plan-Quarterly Dividend 12.1090
Reg-Plan-Growth 11.8909
Reg-Plan-Monthly Dividend 11.6138
Reg-Plan-Quarterly Dividend 11.7191
NET ASSET VALUE
Quantitative Data
Portfolio Turnover* :
*
4.47
Portfolio Turnover = lower of total sale ortotal purchase for the last 12 monthsupon Avg. AUM of trailing twelve months.
^Investors should consult their financial advisers if in doubt about whether the product is suitable for them.
Midcap Small Cap Below AA+Large Cap
53.35
10.602.44
13.07
27.08
12.34
Record Date Dividend Nav ( )`(in /Unit)`
30-Jun-17 (Reg Plan) 0.07 11.6138
30-Jun-17 (Dir Plan) 0.07 11.9263
31-May-17 (Reg Plan) 0.07 11.6432
31-May-17 (Dir Plan) 0.07 11.9383
LAST DIVIDENDS Face value: 10`
Pursuant to payment of dividend, the NAV of Dividend Option ofscheme/plans would fall to the extent of payout and statutory levy, ifapplicable.

Co
mp
osit
ion
by R
ati
ng
s a
s o
n3
0 J
un
e 2
01
7
Wit
hin
1 y
ear
- 1
.50
%N
ILN
IL
SO
V, A
AA
, A
A+
and
Eq
uiv
ale
nt
Belo
w A
A+
NC
A (
INC
L. C
ASH
, D
EPO
SIT
S)
Eq
uit
y S
hare
s
Oth
er
Deta
ils
Exit
Load
NIL
Fu
nd
Deta
ils a
s o
n3
0 J
un
e 2
01
7
Month
End
AU
M (
Rs. in
Cro
res)
`2,3
24.8
1 C
rore
s`1
,84
4.0
5 C
rore
s`3
,01
4.0
2 C
rore
s`3
,981
.97
Cro
res
`8
13
.33
Cro
res
`7
,23
4.1
5 C
rore
s`4
03
.27
Cro
res
Exp
ense R
ati
oRegula
r-0.9
3%
Dir
ect-
0.4
3%
Regula
r-1
.45
%D
irect-
0.6
0%
Regula
r-1.5
2%
Dir
ect-
0.9
0%
Regula
r-1
.40
%D
irect-
0.7
0%
Regula
r-1
.20
%D
irect-
0.5
0%
Regula
r-0
.90
%D
irect-
0.3
0%
Regula
r-0
.65
%,
Dir
ect-
0.3
5%
Mod
ifie
d D
ura
tion
Avera
ge M
atu
rity
Yie
ld t
o M
atu
rity
8.1
4
14.9
7 y
ears
6.9
0
4.4
5
6.3
4years
7.6
2
7.8
7
13
.39 6.8
5years
2.2
4
2.7
9 8.3
2
years
3.4
3
4.6
4 7.8
7
years
2.4
1
2.9
7 7.4
0years
2.1
2
2.8
5 y
ears
6.5
4
Snap
shot
of
Fund
sD
eb
t
Schem
e N
am
eSBI
Magnum
Gilt
Fund
–Long T
erm
Pla
nSBI
Magnum
Incom
eFund
SBI
Dynam
ic B
ond
Fund
SBI
Corp
ora
te B
ond
Fund
(SBI M
IF -
Flo
ati
ng
Rate
Pla
n -
LTP r
estr
uctu
red a
sSBI C
orp
ora
te B
ond F
und
(w.e
.f July
17, 2014)
SBI
Regula
r Savin
gs
Fund
(Pre
vio
usly
know
n a
sSBI M
agnum
Incom
e P
lus
Fund -
Investm
ent)
SBI
Short
Term
Deb
t Fund
SBI
Magnum
Gilt
Fund
-Short
Term
Ideal In
vestm
ent
Hori
zon
3years
+3
years
+3
years
+2
years
+2
years
+1
year
+1
year
+
Incep
tion D
ate
30/12/2000
25
/1
1/1
99
80
9/0
2/20
04
17
/0
7/2
00
41
2/1
1/2
00
32
7/7/2
00
73
0/1
2/2
00
0
Fund
Manag
er
Mr.
Din
esh A
huja
Mr.
Din
esh A
huja
Mr.
Din
esh A
huja
Mr.
Lokesh
Mallya
&M
s.
Mansi Saje
ja
Mr.
Ruchit
Mehta
-Equit
y M
r. D
inesh
Ahuja
-D
ebt
Mr.
Raje
ev
Radhakri
shnan
Mr.
Din
esh A
huja
Manag
ing S
ince
Jan-2011
Jan-2
01
1Ja
n-2
01
1Feb-2
01
7Ju
l-2
01
1Ju
n-2
00
8Ja
n-2
01
1
Benchm
ark
I-Sec L
i-BEX Index
CR
ISIL
Com
posit
e B
ond
Fund Index
CR
ISIL
Com
posit
e B
ond
Fund Index
CR
ISIL
Com
posit
e B
ond
Fund Index
CR
ISIL
MIP
Ble
nded
Index
CR
ISIL
Short
Term
Bond
Fund Index
I-Sec S
i-BEX Index
Co
mp
osit
ion
by
Assets
as o
n3
0 J
un
e 2
01
7
Eq
uit
y S
hare
s
Corp
ora
te D
eb
t
Gilts
Money M
ark
et
Instr
um
ents
Oth
er
Assets
- - -
98.2
7
1.7
3
- -
62
.43
35
.73
1.8
4
- -
28
.66
69
.78
1.5
6
-
94
.15
-
2.1
1
3.7
3
-
67
.78
25
.61
-
6.6
0
-
90
.23
10
.19
-0
.42
-
- -
46
.85
-
53
.15
98.2
7
-
1.7
3
-
67
.77
30
.38
1.8
4
-
98
.44
-
1.5
6
-
34
.68
61
.59
3.7
3
-
49
.56
43
.84
6.6
0
-
98
.09
2.3
3
-0
.42
-
46
.85
-
53
.15
-
For
10
% o
f th
ein
vestm
ents
wit
hin
1Year
–N
il;
For
the
rem
ain
ing investm
ents
- 1
.00
%
For
10
% o
f th
ein
vestm
ents
1m
onth
–N
il;
For
the r
em
ain
ing
investm
ents
- 0
.25
%
wit
hin
For
8%
of
the investm
ents
1 Y
ear
–N
il;
For
the
rem
ain
ing investm
ents
- 3
.00%
For
8%
of
the investm
ents
aft
er
1 Y
ear
to 2
Years
–N
il;
For
the
rem
ain
ing investm
ents
- 1
.50%
For
8%
of
the investm
ents
aft
er
2 Y
ear
to 3
Years
–N
il;
For
the
rem
ain
ing investm
ents
- 0
.75%
wit
hin
Ple
ase
consu
lt y
our
financia
l advis
or
befo
re invest
ing.
35

Co
mp
osit
ion
by R
ati
ng
s a
s o
n3
0 J
un
e 2
01
7
Exit
Load
NIL
Wit
hin
3 b
usin
ess d
ays -
0.1
0%
NIL
NIL
NIL
NIL
SO
V, A
AA
, A
A+
and
Eq
uiv
ale
nt
Belo
w A
A+
NC
A (
INC
L. C
ASH
, D
EPO
SIT
S)
Eq
uit
y S
hare
s
Oth
er
Deta
ils
Fu
nd
Deta
ils a
s o
n3
0 J
un
e 2
01
7
Month
End
AU
M (
Rs. in
Cro
res)
`10,7
60.7
1 C
rore
s`3
,94
6.1
7 C
rore
s`4
,81
4.2
4 C
rore
s`21
,05
6.4
9 C
rore
s`6
,96
0.7
3 C
rore
s`5
2.5
9 C
rore
s
Exp
ense R
ati
oRegula
r-0.4
2%
Dir
ect-
0.3
3%
Regula
r-1
.17
%D
irect-
0.5
4%
Regula
r-0
.80
%D
irect-
0.3
0%
Regula
r-0
.16
%D
irect-
0.1
0%
Regula
r-0
.21
%D
irect-
0.1
0%
Regula
r-0
.22
%D
irect-
0.1
0%
Mod
ifie
d D
ura
tion
Avera
ge M
atu
rity
Yie
ld t
o M
atu
rity
0.6
2
0.6
7 y
ears
6.9
3
0.8
4
0.9
4 y
ears
7.4
6
0.9
2
1.1
0 y
ears
7.0
5
0.1
2
0.1
3 y
ears
6.5
8
0.1
2
0.1
3 6.7
6years
1 D
ay
1 D
ay
6.2
0
Schem
e N
am
eSBI
Ult
ra S
hort
Term
Deb
t Fund
SBI
Savin
gs F
und
(Pre
vio
usly
know
n a
s S
BI M
IF -
FRP -
Savin
gs P
lus B
ond P
lan)
SBI
Tre
asury
Ad
vanta
ge
Fund
^SBI
Pre
mie
r Liq
uid
Fund
SBI
Magnum
Insta
cash
Fund
SBI
Magnum
Insta
cash
Fund
-Liq
uid
Flo
ate
r
Ideal In
vestm
ent
Hori
zon
3m
onth
s+
3m
onth
s+
3m
onth
s+
1day
+1
day
+1
day
+
Incep
tion D
ate
27/7/2007
19
/0
7/2
00
40
9/1
0/2
00
92
4/1
1/2
00
32
1/0
5/1
999
01
/1
0/2
00
2
Fund
Manag
er
Mr.
Raje
ev
Radhakri
shnan
Mr.
R. A
run
Mr.
Raje
ev
Radhakri
shnan
Mr.
Raje
ev
Radhakri
shnan
Mr.
Raje
ev
Radhakri
shnan
Mr.
R. A
run
Manag
ing S
ince
Jun-2008
Apr-
20
12
Nov-2
01
3M
ay-2
01
0M
ay-2
01
0A
pr-
20
12
Benchm
ark
CRIS
IL L
iquid
Fund Index
CR
ISIL
Liq
uid
Fund Index
CRIS
IL 1
Year
CD
Index
CR
ISIL
Liq
uid
Fund Index
CR
ISIL
Liq
uid
Fund Index
CR
ISIL
Liq
uid
Fund Index
Co
mp
osit
ion
by
Assets
as o
n3
0 J
un
e 2
01
7
Eq
uit
y S
hare
s
Corp
ora
te D
eb
t
Gilts
Money M
ark
et
Instr
um
ents
Oth
er
Assets
-
43.6
3
1.9
5
46.3
4
8.0
8
-
74
.30
1.9
8
20
.40
3.3
3
-
49
.52
3.3
3
43
.23
3.9
2
- - -
11
3.8
7
-1
3.8
7
-
1.7
2
-
81
.54
16
.74
- - - -
10
0.0
0
84.7
5
7.1
7
8.0
8
-
59
.24
37
.43
3.3
3
-
81
.41
14
.67
3.9
2
-
11
3.8
7
-
-1
3.8
7
-
83
.26
-
16
.74
-
- -
10
0.0
0
-
Snap
shot
of
Deb
t Fund
s
^Purs
uant
to a
cquis
itio
n o
f D
aiw
aTre
asury
Advanta
ge F
und,
(DT
AF)
from
Daiw
aM
utu
al Fund,
w.e
.f N
ovem
ber
16
, 2
01
3 t
he n
am
e o
f th
e s
chem
e w
as c
hanged t
o S
BI T
reasury
Advanta
ge F
und.
Ple
ase
consu
lt y
our
financia
l advis
or
befo
re invest
ing.
36

37
DEBT-LONG TERM
Investment Objective
Quantitative Data
To provide the investors with returnsgenerated through investments ingovernment securities issued by theCentral Government and / or a StateGovernment.
Fund Details
Modified Duration :
Average Maturity :
Yield to Maturity :
8.14
14.97 years
6.90
Following Plans of SBI Magnum Gilt Funddiscontinued with effect from01/10/2012 : SBI Gilt Fund - Long term -PF - Fixed Period - 1 year, 2 years & 3years- Growth/Dividend and PF - RegularGrowth/Dividend.
•
•
•
•
•
•
•
•
•
•
•
•
•
•
Type of Scheme
Date of Allotment:
Report As On:
AAUM for the Month of June 2017
AUM as on June 30, 2017
Fund Manager: Mr. Dinesh Ahuja
Managing Since:
Total Experience:
Benchmark:
Exit Load:
Entry Load:
Plans Available:
Options:
Minimum Investment
Additional Investment
An Open - Ended Gilt Fund Long Term
Plan
30/12/2000
30/06/2017
2,272.22 Crores
2,324.81 Crores
Jan-2011
Over 19 years
I-Sec Li-BEX Index
NIL
N.A.
Regular, Direct
Growth, Dividend
Weekly - Minimum 1000 & in multiples
of 1 thereafter for a minimum of 6
instalments.
Monthly - Minimum 1000 & in
multiples of 1 thereafter for minimum
six months (or) minimum 500 & in
multiples of 1 thereafter for minimum
one year
Quarterly - Minimum 1500 & in
multiples of 1 thereafter for minimum
one year.
5,000 & in multiples of 1
1,000 & in multiples of 1
`
`
`
`
`
`
`
`
`
`
` `
` `
SIP Options
Option NAV ( )`
PF - Fixed Period - 1 Year - Dividend 13.5654
PF - Fixed Period - 2 Year - Dividend 13.7125
PF - Fixed Period - 3 Year - Dividend 13.3392
PF - Fixed Period - 1 Year - Growth N/A
PF - Fixed Period - 2 Year - Growth N/A
PF - Fixed Period - 3 Year - Growth 23.0078
NET ASSET VALUE
Option NAV ( )`
PF - Regular - Dividend 14.1250
PF - Regular - Growth 24.6250
Reg - Plan - Dividend 13.9567
Reg - Plan - Growth 38.3608
Dir - Plan - Growth 39.0449
Dir - Plan - Dividend 14.6444
PORTFOLIO CLASSIFICATION BY
RATING CLASS (%)
Central Government Securities 92.98
State Government Securities 5.30
Cash & Other Receivables 1.19
CBLO 0.54
PORTFOLIO CLASSIFICATION BY
ASSET ALLOCATION (%)
(Long Term Plan)
Investors understand that their principal
will be at Moderate risk
�
�
Regular income for medium term
Investment in government securities.
SBI Magnum Gilt Fund – Long Term PlanThis product is suitable for investors who are seeking^:
^Investors should consult their financial advisers if in doubt about whether the product is suitable for them.
PORTFOLIO
Government Of India SOVEREIGN 92.98
Government Of Tamil Nadu SOVEREIGN 2.41
Government Of Telangana SOVEREIGN 1.32
Government Of West Bengal SOVEREIGN 0.66
Government Of Himachal Pradesh SOVEREIGN 0.65
Government Of Chhatisgarh SOVEREIGN 0.26
Central Government Securities Total 92.98
State Government Securities Total 5.30
CBLO 0.54
Cash & Other Receivables 1.19
Grand Total 100.00
Issuer Name Rating (%) Of TotalAUM
Sovereign NCA (Incl. Cash, Deposits)
98.27
1.73

38
DEBT-LONG TERM
Option NAV ( )`
Reg-Plan-Bonus 25.1088
Reg-Plan- 12.8324
Reg-Plan- 41.4393
Reg-Plan- Dividend 13.4618
Dividend
Growth
Quarterly
NET ASSET VALUE
Option NAV ( )`
�
�
Regular income for medium term
Investment in Debt and Money Market securities
SBI Magnum Income FundThis product is suitable for investors who are seeking^:
Investment Objective
Quantitative Data
To provide the investors an opportunityto earn, in accordance with theirrequirements, through capital gains orthrough regular dividends, returns thatwould be higher than the returns offeredby comparable investment avenuesthrough investment in debt & moneymarket securities.
Fund Details
Modified Duration :
Average Maturity :
Yield to Maturity :
4.45
6.34 years
7.62
PORTFOLIO CLASSIFICATION BY
RATING CLASS (%)
Non-convertible Debenture 61.04
Central Government Securities 31.22
State Government Securities 4.51
Zero Coupon Bond 1.38
Cash & Other Receivables 1.33
CBLO 0.51
•
•
•
•
•
•
•
•
•
•
•
•
•
•
Type of Scheme
Date of Allotment:
Report As On:
AAUM for the Month of June 2017
AUM as on June 30, 2017
Fund Manager: Mr. Dinesh Ahuja
Managing Since:
Total Experience:
Benchmark:
Exit Load:
Entry Load:
Plans Available:
Options:
SIP
Minimum Investment
Additional Investment
An Open - Ended Debt Scheme
25/11/1998
30/06/2017
1,797.10 Crores
1,844.05 Crores
Jan-2011
Over 19 years
CRISIL Composite Bond Fund Index
For exit within 1 year from
the date of allotment.
For 10% of investment : Nil
For remaining investment: 1.00%
For exit after one year from the date of
allotment – Nil
N.A.
Regular, Direct
Growth, Dividend
Weekly - Minimum 1000 & in multiples
of 1 thereafter for a minimum of 6
instalments.
Monthly - Minimum 1000 & in
multiples of 1 thereafter for minimum
six months (or) minimum 500 & in
multiples of 1 thereafter for minimum
one year
Quarterly - Minimum 1500 & in
multiples of 1 thereafter for minimum
one year.
5,000 & in multiples of 1
1,000 & in multiples of 1
`
`
`
`
`
`
`
`
`
`
` `
` `
PORTFOLIO CLASSIFICATION BY
ASSET ALLOCATION (%)
Dir-Plan- 14.0616
Dir-Plan- 42.2789
Dir-Plan- Dividend 14.0721
Dir-Plan-Bonus 25.6705
Dividend
Growth
Quarterly
PORTFOLIO
L&T Metro Rail (Hyderabad) Ltd. ICRA AAA(SO) 9.98
Muthoot Finance Ltd. CRISIL AA 9.51
Hindalco Industries Ltd. CRISIL AA- 8.01
Floreat Investment Ltd. ICRA AA(SO) 7.80
HDFC Credila FinancialServices Pvt Ltd CRISIL AA+ 6.12
HDFC Ltd. CRISIL AAA 4.10
NABARD CRISIL AAA 3.58
Indiabulls Housing Finance Ltd. CARE AAA 2.76
Rural Electrification Corporation Ltd.CRISIL AAA 2.53
Indostar Capital Finance Ltd. CARE AA- 2.36
Power Finance Corporation Ltd. CRISIL AAA 1.62
ICICI Bank Ltd. ICRA AAA 1.35
Forbes & Company Ltd. ICRA AA- 1.32
Non-Convertible Debenture Total 61.04
SVL Ltd. ICRA AA(SO) 1.38
Government Of India SOVEREIGN 31.22
Government Of Madhya Pradesh SOVEREIGN 2.87
Government Of Tamil Nadu SOVEREIGN 1.64
Zero Coupon Bond Total 1.38
Central Government Securities Total 31.22
State Government Securities Total 4.51
CBLO 0.51
Cash & Other Receivables 1.33
Grand Total 100.00
Issuer Name Rating (%) Of TotalAUM
Issuer Name Rating (%) Of TotalAUM
^Investors should consult their financial advisers if in doubt about whether the product is suitable for them.
Investors understand that their principal
will be at Moderate risk
AAA AA+ Below AA+Sovereign
NCA (Incl. Cash, Deposits)
15.94
6.12
35.73
40.37
1.84

39
DEBT-LONG TERM
Option NAV ( )`
Reg Plan-Growth 21.2920
Reg Plan-Dividend 12.8565
Dir Plan-Growth 21.9067
Dir Plan-Dividend 13.9538
NET ASSET VALUE
Investors understand that their principal
will be at Moderate risk
�
�
Regular income for medium term
Investment in Debt/Money Market/Corporate Bonds/Government securities
SBI Dynamic Bond FundThis product is suitable for investors who are seeking^:
Investment Objective
Quantitative Data
To actively manage a portfolio of goodquality debt as well as Money MarketInstruments so as to provide reasonablereturns and liquidity to the Unit holders.
Fund Details
Modified Duration :
Average Maturity :
Yield to Maturity :
7.87
13.39 years
6.85
PORTFOLIO CLASSIFICATION BY
RATING CLASS (%)
Central Government Securities 66.86
Non-convertible Debenture 28.66
State Government Securities 2.92
Cash & Other Receivables 1.15
CBLO 0.41
•
•
•
•
•
•
•
•
•
•
•
•
•
•
Type of Scheme
Date of Allotment:
Report As On:
AAUM for the Month of June 2017
AUM as on June 30, 2017
Fund Manager: Mr. Dinesh Ahuja
Managing Since:
Total Experience:
Benchmark:
Exit Load:
Entry Load:
Plans Available:
Options:
SIP
Minimum Investment
Additional Investment
An Open - Ended Income Scheme
09/02/2004
30/06/2017
3,054.26 Crores
3,014.02 Crores
Jan-2011
Over 19 years
CRISIL Composite Bond Fund Index
For exit within 1 month from the date of
allotment
For 10% of investment : Nil
For remaining investment: 0.25%
For exit after one month from the date
of allotment – Nil
N.A.
Regular, Direct
Growth, Dividend
Weekly - Minimum 1000 & in multiples
of 1 thereafter for a minimum of 6
instalments.
Monthly - Minimum 1000 & in
multiples of 1 thereafter for minimum
six months (or) minimum 500 & in
multiples of 1 thereafter for minimum
one year
Quarterly - Minimum 1500 & in
multiples of 1 thereafter for minimum
one year.
5,000 & in multiples of 1
1,000 & in multiples of 1
`
`
`
`
`
`
`
`
`
`
` `
` `
PORTFOLIO CLASSIFICATION BY
ASSET ALLOCATION (%)
^Investors should consult their financial advisers if in doubt about whether the product is suitable for them.
PORTFOLIO
NABARD CRISIL AAA 10.78
Indian Railway Finance Corporation Ltd. CRISIL AAA 9.00
Rural Electrification Corporation Ltd. CRISIL AAA 3.46
Power Grid Corporation Of India Ltd. CRISIL AAA 3.30
ICICI Bank Ltd. ICRA AAA 1.66
National Housing Bank CRISIL AAA 0.34
Hudco Ltd. CARE AAA 0.08
India Infrastructure Finance Company Ltd. ICRA AAA 0.04
Government Of India SOVEREIGN 66.86
Government Of Tamil Nadu SOVEREIGN 1.89
Government Of Karnataka SOVEREIGN 0.73
Government Of Himachal Pradesh SOVEREIGN 0.29
Non-Convertible Debenture Total 28.66
Central Government Securities Total 66.86
State Government Securities Total 2.92
CBLO 0.41
Cash & Other Receivables 1.15
Grand Total 100.00
Issuer Name Rating (%) Of TotalAUM
AAA Sovereign NCA (Incl. Cash, Deposits)
28.66
69.78
1.56

40
DEBT-LONG TERM
Option NAV ( )`
Reg-Plan-Daily Dividend 10.4632
Reg-Plan-Dividend 13.8655
Reg-Plan-Growth 26.7505
NET ASSET VALUE
Option NAV ( )`
Investors understand that their principal
will be at Moderate risk
�
�
Regular income for medium term
Predominantly investment in corporate debt securities.
SBI Corporate Bond FundThis product is suitable for investors who are seeking^:
Investment Objective
Quantitative Data
The investment objective will be toactively manage a portfolio of goodquality corporate debt as well as MoneyMarket Instruments so as to providereasonable returns and liquidity to theUnit holders. However there is noguarantee or assurance that theinvestment objective of the scheme willbe achieved.
Fund Details
Modified Duration :
Average Maturity :
Yield to Maturity :
2.24
2.79 years
8.32
$per investor per day across allsubscription transactions (i.e. freshpurchases, additional purchases, switch-in and trigger transactions such as SIP,STP and RSP trigger), as available underthe scheme.
PORTFOLIO CLASSIFICATION BY
RATING CLASS (%)
Non-convertible Debenture 84.90
Zero Coupon Bond 9.25
Commercial Paper 2.11
Cash & Other Receivables 1.97
CBLO 1.77
•
•
•
•
•
•
•
•
•
•
•
•
•
•
Type of Scheme
Date of Allotment*:
Report As On:
AAUM for the Month of
AUM as on
Fund Manager:Mr. Lokesh Mallya & Ms. Mansi SajejaManaging Since:Total Experience:Mr. Lokesh MallyaMs. Mansi SajejaBenchmark:
Exit Load
Entry Load:Plans Available:Options:SIP
Minimum Investment
Additional Investment
An Open - Ended Debt Fund17/07/2014
3,865.30 Crores
3,981.97 Crores
Feb-2017
- Over 11 years- Over 11 years
CRISIL Composite Bond FundIndex
For exit within 12 months from the date ofallotment: For 8% of the investment – NilFor the remaining investment - 3% For exitafter 12 months but within 24 months fromthe date of allotment: For 8% of theinvestment – Nil For the remaininginvestment -1.5% For exit after 24 monthsbut within 36 months from the date ofallotment: For 8% of the investment – NilFor the remaining investment -0.75%; Forexit after 36 months from the date ofallotment – Nil
N.A.Regular, Direct
Growth, Dividend
Weekly - Minimum 1000 & in multiples of1 thereafter for a minimum of 6
instalments.Monthly - Minimum 1000 & in multiplesof 1 thereafter for minimum six months(or) minimum 500 & in multiples of 1thereafter for minimum one yearQuarterly - Minimum 1500 & in multiplesof 1 thereafter for minimum one year.Maximum 10 cr
5000 & in multiples of 1 (Restrictinvestment in the scheme to a maximumlimit of 10 Cr. per investor across all folioson cumulative investment)
1,000 & in multiples of 1
30/06/2017June 2017
June 30, 2017`
`
`
`
`
`
` `
`
`
` `
` `
$
PORTFOLIO CLASSIFICATION BY
ASSET ALLOCATION (%)
Dir-Plan-Daily Dividend 10.4634
Dir-Plan-Dividend 14.5355
Dir-Plan-Growth 27.3807
PORTFOLIO
Muthoot Finance Ltd. CRISIL AA 6.94
Power Finance Corporation Ltd. CRISIL AAA 6.87
Sterlite Power Grid Ventures Ltd. IRRPL INDA 5.06
Dalmia Cement (Bharat) Ltd. ICRA AA 5.04
Rural ElectrificationCorporation Ltd. CRISIL AAA 4.96
National Highways AuthorityOf India CRISIL AAA 4.45
Reliance Home Finance Ltd. CARE AA+ 3.79
AU Small Finance Bank Ltd. IRRPL INDA+ 3.44
Vadodara Bharuch Tollway Ltd. IRRPL INDA 3.28
Tata Realty And Infrastructure Ltd. CRISIL AA 3.27
Equitas Small Finance Bank Ltd. CARE A+ 2.55
HDFC Ltd. CRISIL AAA 2.55
Shapoorji Pallonji InfrastruCapital Company Pvt. Ltd. ICRA A 2.30
Quess Corp Ltd. ICRA AA- 1.88
Nuvoco Vistas Corporation Ltd. CRISIL AA 1.81
Manappuram Finance Ltd. CARE AA- 1.80
L&T Metro Rail (Hyderabad) Ltd. ICRA AAA(SO) 1.78
Indian Railway FinanceCorporation Ltd. CRISIL AAA 1.57
Bhaskar Industries Pvt. Ltd. BRICK BWRAA-(SO) 1.55
Advinus Therapeutics Ltd. ICRA AA+(SO) 1.53
Power Grid CorporationOf India Ltd. CRISIL AAA 1.50
Indostar Capital Finance Ltd. CARE AA- 1.41
Crompton Greaves ConsumerElectricals Ltd. CRISIL AA 1.29
Tata Capital Housing Finance Ltd. CRISIL AA+ 1.28
LIC Housing Finance Ltd. CRISIL AAA 1.27
Tata Power Renewable Energy Ltd. CARE AA(SO) 1.27
Mahindra World City Jaipur Ltd. CRISIL A+ 1.18
Oriental Hotels Ltd. CARE A+ 1.02
Century Textiles & Industries Ltd. CRISIL AA- 1.02
Cholamandalam Investment AndFinance Company Ltd. ICRA AA 1.02
Sharda Solvent Ltd. BRICK BWRAA-(SO) 0.98
NABARD CRISIL AAA 0.76
Shapoorji Pallonji Energy(Gujarat) Pvt. Ltd. ICRA AA(SO) 0.64
ICICI Bank Ltd. ICRA AAA 0.63
AU Small Finance Bank Ltd. ICRA A+ 0.53
Forbes & Company Ltd. ICRA AA- 0.51
Shriram Transport FinanceCompany Ltd. CRISIL AA+ 0.50
Sunny View Estates Pvt. Ltd. ICRA AA 0.38
Janalakshmi Financial Services Ltd. ICRA A 0.37
Tata Motors Ltd. ICRA AA 0.28
IFCI Ltd. ICRA A 0.26
Repco Home Finance Ltd. ICRA AA- 0.25
Hindalco Industries Ltd. CRISIL AA- 0.13
Aditya Birla Retail Ltd. IRRPL INDA+ 3.91
Aditya Birla Retail Ltd. CRISIL A- 2.74
Adani Power Ltd. BRICK BWRAA-(SO) 2.61
Altico Capital India Pvt. Ltd. IRRPL INDA1+ 1.24
Tata International Ltd. ICRA A1 0.87
Non-Convertible Debenture Total 84.90
Zero Coupon Bond Total 9.25
Commercial Paper Total 2.11
CBLO 1.77
Cash & Other Receivables 1.97
Grand Total 100.00
Issuer Name Rating (%) Of TotalAUM
Issuer Name Rating (%) Of TotalAUM
*SBI Magnum Income Fund - Floating RatePlan – LTP has been restructured as SBICorporate Bond Fund (w.e.f July 17, 2014)
^Investors should consult their financial advisers if in doubt about whether the product is suitable for them.
AAA AA+
Money Market Fund (A1+) Below AA+
NCA (Incl. Cash, Deposits)
24.55
5.57
1.24
64.90
3.73

41
DEBT-MEDIUM TERM
Option NAV ( )`
Reg Plan-Dividend 13.0286
Reg Plan-Growth 29.0832
Dir Plan-Growth 30.0284
Dir Plan-Dividend 13.4166
NET ASSET VALUE
�
�
Long term capital appreciation and current income
Investment in equity and equity related instruments as well as fixed income securities (debt andmoney market securities).
SBI Regular Savings FundThis product is suitable for investors who are seeking^:
Investment Objective
Quantitative Data
To provide attractive returns to theMagnum holders / Unit holders eitherthrough periodic dividends or throughcapital appreciation through an activelymanaged portfolio of debt, equity andmoney market instruments.
Fund Details
Modified Duration :
Average Maturity :
Yield to Maturity :
3.43
4.64 years
7.87
PORTFOLIO CLASSIFICATION BY
RATING CLASS (%)
Non-convertible Debenture 66.74
Central Government Securities 25.30
CBLO 4.94
Cash & Other Receivables 1.66
Securitized Debt 1.04
State Government Securities 0.31
•
•
•
•
•
•
•
•
•
•
•
•
•
•
Type of Scheme
Date of Allotment:
Report As On:
AAUM for the Month of June 2017
AUM as on June 30, 2017
Fund Managers:
Mr. Ruchit Mehta Equity
Mr. Dinesh Ahuja Debt
Managing Since:
Total Experience:
Mr. Ruchit Mehta
Mr. Dinesh Ahuja
Benchmark:
Exit Load:
Entry Load:
Plans Available:
Options:
SIP
Minimum Investment
Additional Investment
An Open - Ended Income Scheme
12/11/2003
30/06/2017
774.92 Crores
813.33 Crores
-
-
July-2011
- Over 12 years
- Over 18 years
CRISIL MIP Blended Fund Index
For exit within 12 months from the date
of allotment: 1.50%; For exit after 12
months from the date of allotment: Nil
N.A.
Regular, Direct
Growth, Dividend
Weekly - Minimum 1000 & in multiples
of 1 thereafter for a minimum of 6
instalments.
Monthly - Minimum 1000 & in
multiples of 1 thereafter for minimum
six months (or) minimum 500 & in
multiples of 1 thereafter for minimum
one year
Quarterly - Minimum 1500 & in
multiples of 1 thereafter for minimum
one year.
5,000 & in multiples of 1
1,000 & in multiples of 1
`
`
`
`
`
`
`
`
`
`
` `
` `
PORTFOLIO CLASSIFICATION BY
ASSET ALLOCATION (%)
PORTFOLIO
Muthoot Finance Ltd. CRISIL AA 8.91
Indiabulls Housing Finance Ltd. CARE AAA 8.60
Vadodara Bharuch Tollway Ltd. IRRPL INDA 6.67
Tata Power Renewable Energy Ltd. CARE AA(SO) 6.22
Floreat Investment Ltd. ICRA AA(SO) 5.31
Hindalco Industries Ltd. CRISIL AA- 5.13
HDFC Ltd. CRISIL AAA 4.97
HDFC Credila FinancialServices Pvt Ltd CRISIL AA+ 4.74
Rural ElectrificationCorporation Ltd. CRISIL AAA 3.21
Forbes & Company Ltd. ICRA AA- 2.01
Manappuram Finance Ltd. CARE AA- 1.90
Equitas Small Finance Bank Ltd. CARE A+ 1.88
IFCI Ltd. ICRA A 1.26
Shapoorji Pallonji Infrastru CapitalCompany Pvt. Ltd. ICRA A 1.26
Tata Realty And Infrastructure Ltd. CRISIL AA 1.14
L&T Metro Rail (Hyderabad) Ltd. ICRA AAA(SO) 0.75
AU Small Finance Bank Ltd. IRRPL INDA+ 0.64
Power Finance Corporation Ltd. CRISIL AAA 0.64
Nuvoco Vistas Corporation Ltd. CRISIL AA 0.63
Oriental Hotels Ltd. CARE A+ 0.49
Piramal Enterprises Ltd. ICRA AA 0.38
MFL Securitisation Trust Xli(Kotak Mahindra Bank Ltd.And Magma Fincorp Ltd.) ICRA AAA(SO) 1.04
Securitized Debt Total 1.04
Government Of India SOVEREIGN 25.30
Government Of Tamil Nadu SOVEREIGN 0.31
Non-Convertible Debenture Total 66.74
Central Government Securities Total 25.30
State Government Securities Total 0.31
CBLO 4.94
Cash & Other Receivables 1.66
Grand Total 100.00
Issuer Name Rating (%) Of TotalAUM
Issuer Name Rating (%) Of TotalAUM
(Previously known as SBI Magnum Income
Plus Fund - Investment)
^Investors should consult their financial advisers if in doubt about whether the product is suitable for them.
Investors understand that their principal
will be at Moderate risk
AAA AA+
Below AA+
Sovereign
NCA (Incl. Cash, Deposits)
17.41
4.74
25.6145.63
6.60
42
DEBT-SHORT TERM
�
�
Regular income for short term
Investment in Debt and Money Market securities
SBI Short Term Debt FundThis product is suitable for investors who are seeking^:
Investment Objective
Quantitative Data
To provide investors with an opportunityto generate regular income throughinvestments in a portfolio comprising ofdebt instruments which are rated notbelow investment grade by a credit ratingagency, and money market instruments.
Fund Details
Modified Duration :
Average Maturity :
Yield to Maturity :
2.41
2.97 years
7.40
Following Plans of SBI Short Horizon DebtFund- Short Term Fund discontinued witheffect from 01/10/2012 for freshpurchase: SBI Short Horizon Debt Fund-Short Term Fund-Retail Plan-Growth &Weekly/ Fortnightly/ Monthly/Dividend.
PORTFOLIO CLASSIFICATION BY
RATING CLASS (%)
Non-convertible Debenture 87.52
Central Government Securities 6.58
State Government Securities 3.60
Zero Coupon Bond 2.71
Cash & Other Receivables -0.42
• Type of Scheme
Date of Allotment:
Report As On:
AAUM for the Month of June 2017
AUM as on June 30, 2017
Fund Manager:
Mr. Rajeev Radhakrishnan
Managing Since:
Total Experience:
Benchmark:
Exit Load:
Entry Load:
Plans Available:
Options:
SIP
Minimum Investment
Additional Investment
An Open - Ended Income Scheme
27/7/2007
30/06/2017
8,120.05 Crores
7,234.15 Crores
Jun-2008
Over 16 years
CRISIL Short Term Bond Fund Index
Nil
N.A.
Regular, Direct
Growth, Dividend
Weekly - Minimum 1000 & in multiples
of 1 thereafter for a minimum of 6
instalments.
Monthly - Minimum 1000 & in
multiples of 1 thereafter for minimum
six months (or) minimum 500 & in
multiples of 1 thereafter for minimum
one year
Quarterly - Minimum 1500 & in
multiples of 1 thereafter for minimum
one year.
5,000 & in multiples of 1
1,000 & in multiples of 1
•
•
•
•
•
•
•
•
•
•
•
•
•
`
`
`
`
`
`
`
`
`
`
` `
` `
PORTFOLIO CLASSIFICATION BY
ASSET ALLOCATION (%)
Option NAV ( )`
Reg-Plan-Monthly Dividend 12.0745
Reg-Plan-Weekly Dividend 10.5446
Reg-Plan-Growth 19.2553
Reg-Plan-Fortnightly Dividend 10.3680
Retail-Plan-Fortnightly Dividend 10.9811
Retail-Plan-Weekly Dividend 10.9519
NET ASSET VALUE
Option NAV ( )`
Retail-Plan-Monthly Dividend 11.4071
Retail-Plan-Growth 21.7844
Dir-Plan-Weekly Dividend 10.5476
Dir-Plan-Fortnightly Dividend 13.2155
Dir-Plan-Growth 19.6212
Dir-Plan-Monthly Dividend 12.3940
PORTFOLIO
HDFC Ltd. CRISIL AAA 11.62
Power Finance Corporation Ltd. CRISIL AAA 11.01
Power Grid CorporationOf India Ltd. CRISIL AAA 7.09
Rural ElectrificationCorporation Ltd. CRISIL AAA 6.74
LIC Housing Finance Ltd. CRISIL AAA 5.95
Indian Railway FinanceCorporation Ltd. CRISIL AAA 5.07
Daimler Financial ServicesIndia Pvt. Ltd. IRRPL INDAAA 5.00
NABARD CRISIL AAA 4.10
Shriram Transport FinanceCompany Ltd. CRISIL AA+ 3.46
LIC Housing Finance Ltd. CARE AAA 2.77
BMW India FinancialServices Pvt. Ltd. CRISIL AAA 2.77
Export-Import Bank Of India CRISIL AAA 2.42
SP Jammu Udhampur Highway Ltd. ICRA AAA(SO) 2.30
HDB Financial Services Ltd. CRISIL AAA 2.09
Orix Leasing & FinancialServices India Ltd. IRRPL INDAAA 1.68
Tata Sons Ltd. CRISIL AAA 1.46
Ultratech Cement Ltd. CRISIL AAA 1.36
Fullerton India Credit Company Ltd. CARE AAA 1.33
Muthoot Finance Ltd. CRISIL AA 1.27
Nuvoco Vistas Corporation Ltd. CRISIL AA 1.06
Reliance Home Finance Ltd. CARE AA+ 0.96
Food Corporation Of India CRISIL AAA(SO) 0.84
National Bank For Agriculture &Rural Development IRRPL INDAAA 0.72
L&T Infra Debt Fund Ltd. CRISIL AAA 0.71
IDFC Bank Ltd. ICRA AAA 0.69
Small Industries DevelopmentBank Of India CARE AAA 0.63
Advinus Therapeutics Ltd. ICRA AA+(SO) 0.56
L&T Metro Rail (Hyderabad) Ltd. ICRA AAA(SO) 0.41
Rural ElectrificationCorporation Ltd. ICRA AAA 0.36
Tata Advanced Materials Ltd. CRISIL AA+(SO) 0.28
Hudco Ltd. ICRA AAA 0.27
Konkan Railway Corporation Ltd. ICRA AAA 0.25
NTPC Ltd. CRISIL AAA 0.22
State Bank Of India CRISIL AAA 0.04
Nabha Power Ltd. ICRA AAA(SO) 0.03
Shriram Transport FinanceCompany Ltd. IRRPL INDAA+ 1.42
Sheba Properties Ltd. CARE AA+ 0.83
L&T Interstate Road Corridor Ltd. ICRA AAA(SO) 0.38
Axis Finance Ltd. IRRPL INDAAA 0.08
Government Of India SOVEREIGN 6.58
Government Of Rajasthan SOVEREIGN 3.48
Government Of Tamil Nadu SOVEREIGN 0.13
Non-Convertible Debenture Total 87.52
Zero Coupon Bond Total 2.71
Central Government Securities Total 6.58
State Government Securities Total 3.60
CBLO -
Cash & Other Receivables (0.42)
Grand Total 100.00
Issuer Name Rating (%) Of TotalAUM
Issuer Name Rating (%) Of TotalAUM
Investors understand that their principal
will be at Moderately Low risk
^Investors should consult their financial advisers if in doubt about whether the product is suitable for them.
AAA AA+
Below AA+
Sovereign
NCA (Incl. Cash, Deposits)
68.945.26
10.19
16.03-0.42

43
Option NAV ( )`
Reg Plan-Growth 35.5773
Reg Plan-Dividend 12.9709
Dir Plan-Dividend 13.1207
Dir Plan-Growth 36.0560
NET ASSET VALUE
�
�
Regular income for short term
Investment in government securities.
SBI Magnum Gilt Fund – Short Term PlanThis product is suitable for investors who are seeking^:
Investment Objective
Quantitative Data
To provide the investors with returnsgenerated through investments ingovernment securities issued by theCentral Government and / or a StateGovernment.
Fund Details
Modified Duration :
Average Maturity :
Yield to Maturity :
2.12
2.85 years
6.54
PORTFOLIO CLASSIFICATION BY
RATING CLASS (%)
CBLO 53.09
State Government Securities 26.44
Central Government Securities 20.41
Cash & Other Receivables 0.06
•
•
•
•
•
•
•
•
•
•
•
•
•
•
Type of Scheme
Date of Allotment:
Report As On:
AAUM for the Month of June 2017
AUM as on June 30, 2017
Fund Manager: Mr. Dinesh Ahuja
Managing Since:
Total Experience:
Benchmark:
Exit Load:
Entry Load:
Plans Available:
Options:
Minimum Investment
Additional Investment
An Open - Ended Gilt Fund Short Term
Plan
30/12/2000
30/06/2017
403.72 Crores
403.27 Crores
Jan-2011
Over 19 years
I-Sec Si-BEX Index
NIL
N.A.
Regular, Direct
Growth, Dividend
Weekly - Minimum 1000 & in multiples
of 1 thereafter for a minimum of 6
instalments.
Monthly - Minimum 1000 & in
multiples of 1 thereafter for minimum
six months (or) minimum 500 & in
multiples of 1 thereafter for minimum
one year
Quarterly - Minimum 1500 & in
multiples of 1 thereafter for minimum
one year.
5,000 & in multiples of 1
1,000 & in multiples of 1
`
`
`
`
`
`
`
`
`
`
` `
` `
SIP Options
PORTFOLIO CLASSIFICATION BY
ASSET ALLOCATION (%)
DEBT-SHORT TERM
PORTFOLIO
Government Of India SOVEREIGN 20.41
Government Of Rajasthan SOVEREIGN 25.73
Government Of Uttar Pradesh SOVEREIGN 0.71
Central Government Securities Total 20.41
State Government Securities Total 26.44
CBLO 53.09
Cash & Other Receivables 0.06
Grand Total 100.00
Issuer Name Rating (%) Of TotalAUM
(Short Term Plan)
Investors understand that their principal
will be at Moderately Low risk
^Investors should consult their financial advisers if in doubt about whether the product is suitable for them.
SovereignNCA (Incl. Cash, Deposits)
46.8553.15
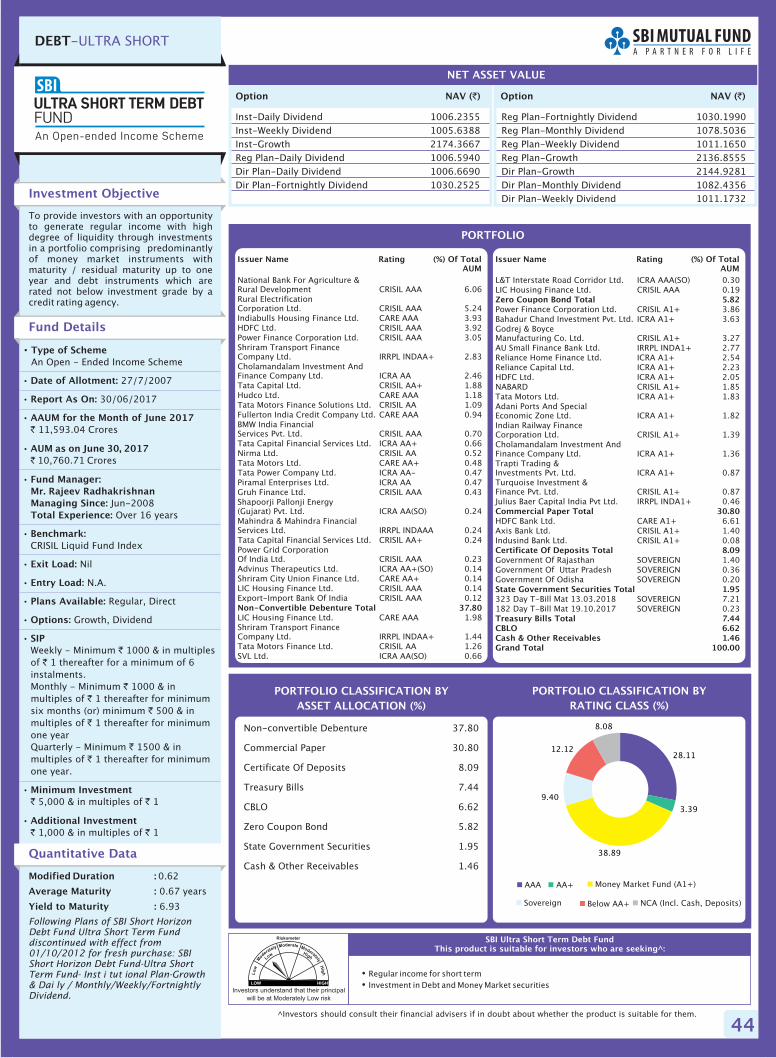
44
Option NAV ( )`
Inst-Daily Dividend 1006.2355
Inst-Weekly Dividend 1005.6388
Inst-Growth 2174.3667
Reg Plan-Daily Dividend 1006.5940
Dir Plan-Daily Dividend 1006.6690
Dir Plan-Fortnightly Dividend 1030.2525
NET ASSET VALUE
Option NAV ( )`
�
�
Regular income for short term
Investment in Debt and Money Market securities
SBI Ultra Short Term Debt FundThis product is suitable for investors who are seeking^:
Investment Objective
Quantitative Data
To provide investors with an opportunityto generate regular income with highdegree of liquidity through investmentsin a portfolio comprising predominantlyof money market instruments withmaturity / residual maturity up to oneyear and debt instruments which arerated not below investment grade by acredit rating agency.
Fund Details
Modified Duration :
Average Maturity :
Yield to Maturity :
0.62
0.67 years
6.93
Following Plans of SBI Short HorizonDebt Fund Ultra Short Term Funddiscontinued with effect from01/10/2012 for fresh purchase: SBIShort Horizon Debt Fund-Ultra ShortTerm Fund- Inst i tut ional Plan-Growth& Dai ly / Monthly/Weekly/FortnightlyDividend.
PORTFOLIO CLASSIFICATION BY
RATING CLASS (%)
Non-convertible Debenture 37.80
Commercial Paper 30.80
Certificate Of Deposits 8.09
Treasury Bills 7.44
CBLO 6.62
Zero Coupon Bond 5.82
State Government Securities 1.95
Cash & Other Receivables 1.46
• Type of Scheme
Date of Allotment:
Report As On:
AAUM for the Month of June 2017
AUM as on June 30, 2017
Fund Manager:
Mr. Rajeev Radhakrishnan
Managing Since:
Total Experience:
Benchmark:
Exit Load:
Entry Load:
Plans Available:
Options:
SIP
Minimum Investment
Additional Investment
An Open - Ended Income Scheme
27/7/2007
30/06/2017
11,593.04 Crores
10,760.71 Crores
Jun-2008
Over 16 years
CRISIL Liquid Fund Index
Nil
N.A.
Regular, Direct
Growth, Dividend
Weekly - Minimum 1000 & in multiples
of 1 thereafter for a minimum of 6
instalments.
Monthly - Minimum 1000 & in
multiples of 1 thereafter for minimum
six months (or) minimum 500 & in
multiples of 1 thereafter for minimum
one year
Quarterly - Minimum 1500 & in
multiples of 1 thereafter for minimum
one year.
5,000 & in multiples of 1
1,000 & in multiples of 1
•
•
•
•
•
•
•
•
•
•
•
•
•
`
`
`
`
`
`
`
`
`
`
` `
` `
PORTFOLIO CLASSIFICATION BY
ASSET ALLOCATION (%)
Reg Plan-Fortnightly Dividend 1030.1990
Reg Plan-Monthly Dividend 1078.5036
Reg Plan-Weekly Dividend 1011.1650
Reg Plan-Growth 2136.8555
Dir Plan-Growth 2144.9281
Dir Plan-Monthly Dividend 1082.4356
Dir Plan-Weekly Dividend 1011.1732
DEBT-ULTRA SHORT
PORTFOLIO
National Bank For Agriculture &Rural Development CRISIL AAA 6.06Rural ElectrificationCorporation Ltd. CRISIL AAA 5.24Indiabulls Housing Finance Ltd. CARE AAA 3.93HDFC Ltd. CRISIL AAA 3.92Power Finance Corporation Ltd. CRISIL AAA 3.05Shriram Transport FinanceCompany Ltd. IRRPL INDAA+ 2.83Cholamandalam Investment AndFinance Company Ltd. ICRA AA 2.46Tata Capital Ltd. CRISIL AA+ 1.88Hudco Ltd. CARE AAA 1.18Tata Motors Finance Solutions Ltd. CRISIL AA 1.09Fullerton India Credit Company Ltd. CARE AAA 0.94BMW India FinancialServices Pvt. Ltd. CRISIL AAA 0.70Tata Capital Financial Services Ltd. ICRA AA+ 0.66Nirma Ltd. CRISIL AA 0.52Tata Motors Ltd. CARE AA+ 0.48Tata Power Company Ltd. ICRA AA- 0.47Piramal Enterprises Ltd. ICRA AA 0.47Gruh Finance Ltd. CRISIL AAA 0.43Shapoorji Pallonji Energy(Gujarat) Pvt. Ltd. ICRA AA(SO) 0.24Mahindra & Mahindra FinancialServices Ltd. IRRPL INDAAA 0.24Tata Capital Financial Services Ltd. CRISIL AA+ 0.24Power Grid CorporationOf India Ltd. CRISIL AAA 0.23Advinus Therapeutics Ltd. ICRA AA+(SO) 0.14Shriram City Union Finance Ltd. CARE AA+ 0.14LIC Housing Finance Ltd. CRISIL AAA 0.14Export-Import Bank Of India CRISIL AAA 0.12
LIC Housing Finance Ltd. CARE AAA 1.98Shriram Transport FinanceCompany Ltd. IRRPL INDAA+ 1.44Tata Motors Finance Ltd. CRISIL AA 1.26SVL Ltd. ICRA AA(SO) 0.66
Non-Convertible Debenture Total 37.80
L&T Interstate Road Corridor Ltd. ICRA AAA(SO) 0.30LIC Housing Finance Ltd. CRISIL AAA 0.19
Power Finance Corporation Ltd. CRISIL A1+ 3.86Bahadur Chand Investment Pvt. Ltd. ICRA A1+ 3.63Godrej & BoyceManufacturing Co. Ltd. CRISIL A1+ 3.27AU Small Finance Bank Ltd. IRRPL INDA1+ 2.77Reliance Home Finance Ltd. ICRA A1+ 2.54Reliance Capital Ltd. ICRA A1+ 2.23HDFC Ltd. ICRA A1+ 2.05NABARD CRISIL A1+ 1.85Tata Motors Ltd. ICRA A1+ 1.83Adani Ports And SpecialEconomic Zone Ltd. ICRA A1+ 1.82Indian Railway FinanceCorporation Ltd. CRISIL A1+ 1.39Cholamandalam Investment AndFinance Company Ltd. ICRA A1+ 1.36Trapti Trading &Investments Pvt. Ltd. ICRA A1+ 0.87Turquoise Investment &Finance Pvt. Ltd. CRISIL A1+ 0.87Julius Baer Capital India Pvt Ltd. IRRPL INDA1+ 0.46
HDFC Bank Ltd. CARE A1+ 6.61Axis Bank Ltd. CRISIL A1+ 1.40Indusind Bank Ltd. CRISIL A1+ 0.08
Government Of Rajasthan SOVEREIGN 1.40Government Of Uttar Pradesh SOVEREIGN 0.36Government Of Odisha SOVEREIGN 0.20
323 Day T-Bill Mat 13.03.2018 SOVEREIGN 7.21182 Day T-Bill Mat 19.10.2017 SOVEREIGN 0.23
Zero Coupon Bond Total 5.82
Commercial Paper Total 30.80
Certificate Of Deposits Total 8.09
State Government Securities Total 1.95
Treasury Bills Total 7.44CBLO 6.62Cash & Other Receivables 1.46Grand Total 100.00
Issuer Name Rating (%) Of TotalAUM
Issuer Name Rating (%) Of TotalAUM
Investors understand that their principal
will be at Moderately Low risk
^Investors should consult their financial advisers if in doubt about whether the product is suitable for them.
AAA AA+ Money Market Fund (A1+)
Below AA+Sovereign NCA (Incl. Cash, Deposits)
28.11
3.39
38.89
9.40
12.12
8.08

45
Option NAV ( )`
Regular Plan - Daily - Dividend 10.0691
Regular Plan - Dividend 11.5809
Regular Plan - Weekly - Dividend 11.5327
Regular Plan - Growth 25.7699
NET ASSET VALUE
Option NAV ( )`
�
�
Regular income for medium term
Investment in Floating rate Debt/Money Market securities
SBI Savings FundThis product is suitable for investors who are seeking^:
Investment Objective
Quantitative Data
To endeavour to mitigate interest raterisk and seek to generate regular incomealong with opportunities for capitalappreciation through a portfolioinvesting in Floating Rate debt securities,f ixed rate securit ies, derivativeinstruments as well as in Money Marketinstruments.
Fund Details
Modified Duration :
Average Maturity :
Yield to Maturity :
0.84
0.94 years
7.46
PORTFOLIO CLASSIFICATION BY
RATING CLASS (%)
Non-convertible Debenture 65.27
Commercial Paper 9.87
Zero Coupon Bond 9.03
Certificate Of Deposits 5.56
Treasury Bills 4.98
CBLO 2.49
State Government Securities 1.98
Cash & Other Receivables 0.83
•
•
•
•
•
•
•
•
•
•
•
•
•
•
•
Type of Scheme
Date of Allotment:
Report As On:
AAUM for the Month of June 2017
AUM as on June 30, 2017
Fund Manager: Mr. R. Arun
Managing Since:
Total Experience:
Benchmark:
Exit Load:
Entry Load:
Plans Available:
Options:
SIP
Minimum Investment
Additional Investment
An Open - Ended Debt Fund
19/07/2004
30/06/2017
3,888.34 Crores
3,946.17 Crores
Apr-2012
Over 11 years
CRISIL Liquid Fund Index
For exit within 3 business days from the
date of allotment - 0.10%
For exit after 3 business days from the
date of allotment - Nil
N.A.
Regular, Direct
Growth, Dividend
Weekly - Minimum 1000 & in multiples
of 1 thereafter for a minimum of 6
instalments.
Monthly - Minimum 1000 & in
multiples of 1 thereafter for minimum
six months (or) minimum 500 & in
multiples of 1 thereafter for minimum
one year
Quarterly - Minimum 1500 & in
multiples of 1 thereafter for minimum
one year.
500 & in multiples of 1
500 & in multiples of 1
`
`
`
`
`
`
`
`
`
`
` `
` `
PORTFOLIO CLASSIFICATION BY
ASSET ALLOCATION (%)
Direct Plan - Daily - Dividend 10.0711
Direct Plan - Dividend 11.8826
Direct Plan - Growth 26.4305
Direct Plan - Weekly - Dividend 11.6231
DEBT-ULTRA SHORT
PORTFOLIO
Tata Power Company Ltd. ICRA AA- 7.67
Indiabulls Commercial Credit Ltd. CRISIL AA+ 6.38
Writers And Publishers Pvt. Ltd. BRICK BWRAA-(SO) 5.03
Power Finance Corporation Ltd. CRISIL AAA 3.84
Dalmia Cement (Bharat) Ltd. ICRA AA 3.80
Rural ElectrificationCorporation Ltd. CRISIL AAA 3.69
Nuvoco Vistas Corporation Ltd. CRISIL AA 3.62
Tata Capital Housing Finance Ltd. CRISIL AA+ 3.60
Advinus Therapeutics Ltd. ICRA AA+(SO) 3.36
Tata Capital Financial Services Ltd. ICRA AA+ 3.23
Bhaskar Industries Pvt. Ltd. BRICK BWRAA-(SO) 2.71
Altico Capital India Pvt. Ltd. IRRPL INDAA- 2.30
Reliance Home Finance Ltd. CARE AA+ 2.18
Indostar Capital Finance Ltd. CARE AA- 1.94
Steel Authority Of India Ltd. CARE AA 1.92
Sharda Solvent Ltd. BRICK BWRAA-(SO) 1.60
Manappuram Finance Ltd. CARE AA- 1.30
Indian Railway FinanceCorporation Ltd. CRISIL AAA 1.29
HDFC Ltd. CRISIL AAA 1.28
Shriram Transport FinanceCompany Ltd. IRRPL INDAA+ 1.28
Export-Import Bank Of India CRISIL AAA 1.23
Power Grid CorporationOf India Ltd. CRISIL AAA 1.20
Shriram City Union Finance Ltd. CARE AA+ 0.26
LIC Housing Finance Ltd. CRISIL AAA 0.26
Cholamandalam Investment AndFinance Company Ltd. ICRA AA 0.26
Small Industries DevelopmentBank Of India CARE AAA 0.06
Janalakshmi Financial Services Ltd. ICRA A 0.01
Adani Power Ltd. BRICK BWRAA-(SO) 5.28
Shriram City Union Finance Ltd. CARE AA+ 2.57
National Bank For Agriculture &Rural Development CRISIL AAA 1.19
HDFC Ltd. ICRA A1+ 2.48
Bahadur Chand Investment Pvt. Ltd. ICRA A1+ 2.47
Ford Credit India Pvt Ltd. IRRPL INDA1+ 1.82
RSPL Ltd. CRISIL A1+ 1.25
Indus Tower Ltd. CRISIL A1+ 1.21
Reliance Home Finance Ltd. ICRA A1+ 0.63
Commercial Paper Total 9.87
HDFC Bank Ltd. CARE A1+ 3.60
ICICI Bank Ltd. ICRA A1+ 1.88
NABARD CRISIL A1+ 0.07
Government Of Rajasthan SOVEREIGN 1.98
63 Days Cmb Mat 08.08.2017 SOVEREIGN 2.53
323 Day T-Bill Mat 13.03.2018 SOVEREIGN 2.44
Non-Convertible Debenture Total 65.27
Zero Coupon Bond Total 9.03
Certificate Of Deposits Total 5.56
State Government Securities Total 1.98
Treasury Bills Total 4.98
CBLO 2.49
Cash & Other Receivables 0.83
Grand Total 100.00
Issuer Name Rating (%) Of TotalAUM
Issuer Name Rating (%) Of TotalAUM
(Previously known as SBI Magnum IncomeFund – Floating Rate Plan – Savings PlusBond Plan)
Investors understand that their principal
will be at Moderately Low risk
^Investors should consult their financial advisers if in doubt about whether the product is suitable for them.
AAA AA+ Money Market Fund (A1+)
Below AA+Sovereign NCA (Incl. Cash, Deposits)
14.03
18.21
15.42
6.95
42.06
3.33

46
Option NAV ( )`
Reg-Plan-Daily Dividend 1009.9749
Reg-Plan-Growth 1838.9654
Reg-Plan-Monthly Dividend 1032.0389
Reg-Plan-Weekly Dividend 1009.2553
NET ASSET VALUE
Option NAV ( )`
�
�
Income over short term
To generate regular income through a judicious mix of portfolio comprising, predominantly ofmoney market instruments and short term debt securities.
SBI Treasury Advantage FundThis product is suitable for investors who are seeking^:
Investment Objective
Quantitative Data
The scheme seeks to generate regularincome through a judicious mix ofportfolio comprising, predominantly ofmoney market instruments and shortterm debt securities.
Fund Details
Modified Duration :
Average Maturity :
Yield to Maturity :
0.92
1.10 years
7.05
PORTFOLIO CLASSIFICATION BY
RATING CLASS (%)
Non-convertible Debenture 46.77
Commercial Paper 31.83
Treasury Bills 7.21
Certificate Of Deposits 4.19
Central Government Securities 3.33
CBLO 1.97
Cash & Other Receivables 1.95
Zero Coupon Bond 1.41
Securitized Debt 1.34
•
•
•
•
•
•
•
•
•
•
•
•
•
•
Type of Scheme
Date of Allotment:
Report As On:
AAUM for the Month of June 2017
AUM as on June 30, 2017
Fund Manager:
Mr. Rajeev Radhakrishnan
Managing Since:
Total Experience:
Benchmark:
Exit Load:
Entry Load:
Plans Available:
Options:
SIP
Minimum Investment
Additional Investment
An Open - Ended Income Scheme
09/10/2009
30/06/2017
4,924.14 Crores
4,814.24 Crores
Nov-2013
Over 16 years
CRISIL 1 Year CD Index
Nil
N.A.
Regular, Direct
Growth, Dividend
Weekly - Minimum 1000 & in multiples
of 1 thereafter for a minimum of 6
instalments.
Monthly - Minimum 1000 & in
multiples of 1 thereafter for minimum
six months (or) minimum 500 & in
multiples of 1 thereafter for minimum
one year.
Quarterly - Minimum 1500 & in
multiples of 1 thereafter for minimum
one year.
5,000 & in multiples of 1
1,000 & in multiples of 1
`
`
`
`
`
`
`
`
`
`
` `
` `
AAA AA+ Money Market Fund (A1+)
Below AA+Sovereign NCA (Incl. Cash, Deposits)
PORTFOLIO CLASSIFICATION BY
ASSET ALLOCATION (%)
Dir-Plan-Daily Dividend 1011.4420
Dir-Plan-Growth 1881.6110
Dir-Plan-Monthly Dividend 1046.1643
Dir-Plan-Weekly Dividend 1011.3616
DEBT-ULTRA SHORT
PORTFOLIO
HDFC Ltd. CRISIL AAA 7.45
Tata Power Company Ltd. ICRA AA- 6.47
Power Finance Corporation Ltd. CRISIL AAA 4.59
LIC Housing Finance Ltd. CRISIL AAA 3.49
Nuvoco Vistas Corporation Ltd. CRISIL AA 3.26
Gruh Finance Ltd. CRISIL AAA 3.23
Indiabulls Housing Finance Ltd. CARE AAA 2.39
Rural ElectrificationCorporation Ltd. CRISIL AAA 2.23
Tata Capital Financial Services Ltd. ICRA AA+ 1.73
Sharda Solvent Ltd. BRICK BWRAA-(SO) 1.66
Mahindra & Mahindra FinancialServices Ltd. IRRPL INDAAA 1.63
Shriram Transport FinanceCompany Ltd. CRISIL AA+ 1.30
NABARD CRISIL AAA 1.20
Tata Motors Ltd. CARE AA+ 1.09
Muthoot Finance Ltd. CRISIL AA 1.08
Writers And Publishers Pvt. Ltd. BRICK BWRAA-(SO) 1.03
Repco Home Finance Ltd. ICRA AA- 0.76
Small Industries DevelopmentBank Of India CARE AAA 0.66
Shriram Transport FinanceCompany Ltd. IRRPL INDAA+ 0.54
Daimler Financial ServicesIndia Pvt. Ltd. IRRPL INDAAA 0.54
Reliance Home Finance Ltd. CARE AA+ 0.43
LIC Housing Finance Ltd. CRISIL AAA 1.00
SVL Ltd. ICRA AA(SO) 0.41
Non-Convertible Debenture Total 46.77
Zero Coupon Bond Total 1.41
Securitized Debt Total 1.34
Commercial Paper Total 31.83
Certificate Of Deposits Total 4.19
Central Government Securities Total 3.33
Treasury Bills Total 7.21
CBLO 1.97
Cash & Other Receivables 1.95
Grand Total 100.00
MFL Securitisation Trust Xli(Kotak Mahindra Bank Ltd.And Magma Fincorp Ltd.) ICRA AAA(SO) 1.34
United Spirits Ltd. ICRA A1+ 6.68
Indus Tower Ltd. CRISIL A1+ 5.73
Power Finance Corporation Ltd. CRISIL A1+ 3.15
Reliance Home Finance Ltd. ICRA A1+ 2.13
Barclays Investments AndLoans (India) Ltd. ICRA A1+ 2.12
Trent Ltd. CARE A1+ 2.06
HDB Financial Services Ltd. CARE A1+ 2.06
Shriram City Union Finance Ltd. CARE A1+ 2.05
Altico Capital India Pvt. Ltd. IRRPL INDA1+ 1.81
Julius Baer Capital India Pvt Ltd. IRRPL INDA1+ 1.60
HDFC Ltd. ICRA A1+ 1.57
JM Financial Products Ltd. CRISIL A1+ 0.87
NABARD CRISIL A1+ 2.17
HDFC Bank Ltd. CARE A1+ 2.02
Government Of India SOVEREIGN 3.33
323 Day T-Bill Mat 13.03.2018 SOVEREIGN 7.21
Issuer Name Rating (%) Of TotalAUM
Issuer Name Rating (%) Of TotalAUM
Investors understand that their principal
will be at Moderate risk
^Investors should consult their financial advisers if in doubt about whether the product is suitable for them.
26.25
4.55
36.02
10.54
18.72
3.92

47
DEBT-LIQUID
�
�
Regular income for short term
Investment in Debt and Money Market securities
SBI Premier Liquid FundThis product is suitable for investors who are seeking^:
Investment Objective
Quantitative Data
To provide attractive returns to the
Magnum holders either through periodic
dividends or through capital appreciation
through an actively managed portfolio of
debt and money market instruments.
Fund Details
Modified Duration :
Average Maturity :
Yield to Maturity :
0.12
0.13 years
6.58
Following Plans of SBI Premier LiquidFund discontinued with effect from01/10/2012 for fresh purchase: SBIPremier Liquid Fund – Institutional Plan–Growth & Dividend / Weekly &Fortnightly Dividend.
PORTFOLIO CLASSIFICATION BY
RATING CLASS (%)
Commercial Paper 63.52
Treasury Bills 40.33
Certificate Of Deposits 10.02
Fixed Deposits 9.29
Cash & Other Receivables -23.16
• Type of Scheme
Date of Allotment:
Report As On:
AAUM for the Month of June 2017
AUM as on June 30, 2017
Fund Manager:
Mr. Rajeev Radhakrishnan
Managing Since:
Total Experience:
Benchmark:
Exit Load:
Entry Load:
Plans Available:
Options:
SIP
Minimum Investment
Additional Investment
An Open - Ended Liquid Scheme
24/11/2003
30/06/2017
27,354.49 Crores
21,056.49 Crores
May-2010
Over 16 years
CRISIL Liquid Fund Index
NIL
N.A.
Regular, Direct
Growth, Dividend
N.A.
50,000 & in multiples of 1
10,000 & in multiples of 1
•
•
•
•
•
•
•
•
•
•
•
•
•
`
`
` `
` ` PORTFOLIO CLASSIFICATION BY
ASSET ALLOCATION (%)
Option NAV ( )`
Reg-Plan-Daily Dividend 1003.2500
Reg-Plan-Fortnightly Dividend 1014.1904
Reg-Plan-Growth 2586.3656
Reg-Plan-Weekly Dividend 1062.2185
Institutional-Daily Dividend 1003.2500
Institutional-Fortnightly Dividend 1025.5332
NET ASSET VALUE
Option NAV ( )`
Institutional-Growth 2610.6839
Institutional-Weekly Dividend 1061.5085
Dir-Plan-Daily Dividend 1003.2500
Dir-Plan-Growth 2593.4875
Dir-Plan-Weekly Dividend 1062.2286
Dir-Plan-Fortnightly Dividend 1014.2547
PORTFOLIO
Reliance Industries Ltd. ICRA A1+ 6.92
Indiabulls Housing Finance Ltd. CRISIL A1+ 6.44
Edelweiss CommoditiesServices Ltd. CRISIL A1+ 4.40
Vedanta Ltd. CRISIL A1+ 3.70
Reliance Commercial Finance Ltd. ICRA A1+ 3.46
Shriram City Union Finance Ltd. CARE A1+ 2.74
Manappuram Finance Ltd. ICRA A1+ 2.40
Hindustan Zinc Ltd. CRISIL A1+ 2.31
NABARD CRISIL A1+ 2.31
Indiabulls Commercial Credit Ltd. CRISIL A1+ 2.30
JSW Steel Ltd. CARE A1+ 2.30
LIC Housing Finance Ltd. CRISIL A1+ 2.30
Tata Capital Financial Services Ltd. ICRA A1+ 2.29
Muthoot Finance Ltd. CRISIL A1+ 2.29
HDFC Ltd. CRISIL A1+ 1.84
Axis Finance Ltd. IRRPL INDA1+ 1.83
Dewan Housing FinanceCorporation Ltd. CRISIL A1+ 1.39
Nirma Ltd. CRISIL A1+ 1.39
Vardhman Textiles Ltd. CRISIL A1+ 1.38
Sheba Properties Ltd. CARE A1+ 1.38
Tata Capital Ltd. CRISIL A1+ 1.37
Alkem Laboratories Ltd. CRISIL A1+ 0.92
Motilal Oswal Securities Ltd. CRISIL A1+ 0.92
Piramal Finance Pvt. Ltd. ICRA A1+ 0.92
L&T Finance Ltd. CARE A1+ 0.69
Hero Fincorp Ltd. CRISIL A1+ 0.69
Tata Projects Ltd. IRRPL INDA1+ 0.69
STCI Finance Ltd. CRISIL A1+ 0.58
Apollo Tyres Ltd. CRISIL A1+ 0.46
Tata Cleantech Capital Ltd. CRISIL A1+ 0.46
Tata Motors Finance Solutions Ltd. CARE A1+ 0.35
Barclays Investments AndLoans (India) Ltd. ICRA A1+ 0.11
ICICI Bank Ltd. ICRA A1+ 4.59
HDFC Bank Ltd. CARE A1+ 3.46
Yes Bank Ltd. ICRA A1+ 1.16
Axis Bank Ltd. CRISIL A1+ 0.81
63 Days Cmb Mat 08.08.2017 SOVEREIGN 29.07
91 Day Tbill Mat 28.09.2017 SOVEREIGN 8.03
91 Day T-Bill Mat 20.07.2017 SOVEREIGN 2.38
91 Day T-Bill Mat 27.07.2017 SOVEREIGN 0.85
Deutsche Bank 6.97
Bandhan Bank 2.32
Commercial Paper Total 63.52
Certificate Of Deposits Total 10.02
Treasury Bills Total 40.33
Fixed Deposits Total 9.29
CBLO -
Cash & Other Receivables (23.16)
Grand Total 100.00
Issuer Name Rating (%) Of TotalAUM
Issuer Name Rating (%) Of TotalAUM
Investors understand that their principal
will be at Low risk
^Investors should consult their financial advisers if in doubt about whether the product is suitable for them.
Money Market Fund (A1+) Sovereign
NCA (Incl. Cash, Deposits)
73.5440.33
-13.87

48
�
�
Regular income for short term
Investment in Debt and Money Market securities
SBI Magnum InstaCash FundThis product is suitable for investors who are seeking^:
Investment Objective
Quantitative Data
To provide the investors an opportunity
to earn returns through investment in
debt & money market securities, while
having the benefit of a very high degree of
liquidity.
Fund Details
Modified Duration :
Average Maturity :
Yield to Maturity :
0.12
0.13 years
6.76
PORTFOLIO CLASSIFICATION BY
RATING CLASS (%)
Commercial Paper 58.93
Treasury Bills 22.61
Mutual Fund Units 6.89
Fixed Deposits 5.03
CBLO 4.70
Zero Coupon Bond 1.07
Non-convertible Debenture 0.65
Cash & Other Receivables 0.12
•
•
•
•
•
•
•
•
•
•
•
•
•
•
Type of Scheme
Date of Allotment:
Report As On:
AAUM for the Month of June 2017
AUM as on June 30, 2017
Fund Manager:
Mr. Rajeev Radhakrishnan
Managing Since:
Total Experience:
Benchmark:
Exit Load:
Entry Load:
Plans Available:
Options:
SIP
Minimum Investment
Additional Investment
An Open - Ended Liquid Scheme
21/05/1999
30/06/2017
6,859.03 Crores
6,960.73 Crores
May-2010
Over 16 years
CRISIL Liquid Fund Index
Nil
N.A.
Regular, Direct
Growth, Dividend
N.A.
5,000 & in multiples of 1
1,000 & in multiples of 1
`
`
` `
` `
PORTFOLIO CLASSIFICATION BY
ASSET ALLOCATION (%)
DEBT-LIQUID
Option NAV ( )`
Reg Plan-Growth Option 3644.0596
Reg Plan-Weekly Dividend 1078.7702
Reg Plan-Daily Dividend 1675.0300
NET ASSET VALUE
Option NAV ( )`
Dir Plan-Growth 3656.5367
Dir Plan-Daily Dividend 1675.0300
Dir Plan-Weekly Dividend 1078.7895
PORTFOLIO
Bmw India FinancialServices Pvt. Ltd. CRISIL AAA 0.65
NABARD CRISIL AAA 1.07
Edelweiss CommoditiesServices Ltd. CRISIL A1+ 7.16
Vedanta Ltd. CRISIL A1+ 7.09
JSW Steel Ltd. CARE A1+ 6.74
Sheba Properties Ltd. CARE A1+ 4.26
Iifl Wealth Finance Ltd. ICRA A1+ 4.26
Piramal Finance Pvt. Ltd. ICRA A1+ 3.71
Reliance Commercial Finance Ltd. ICRA A1+ 3.57
Aarti Industries Ltd. IRRPL INDA1+ 2.86
Deepak Fertilizers AndPetrochemicals Corporation Ltd. ICRA A1+ 2.49
Manappuram Finance Ltd. CRISIL A1+ 2.14
KEC International Ltd. IRRPL INDA1+ 2.14
Nirma Ltd. CRISIL A1+ 1.43
Balrampur Chini Mills Ltd. CRISIL A1+ 1.43
Vardhman Textiles Ltd. CRISIL A1+ 1.43
Haldia Energy Ltd. ICRA A1+ 1.42
Mahindra Rural HousingFinance Ltd. IRRPL INDA1+ 1.41
Non-Convertible Debenture Total 0.65
Zero Coupon Bond Total 1.07
Talwandi Sabo Power Ltd. CRISIL A1+ 1.07
Allcargo Logistics Ltd. CARE A1+ 0.71
Jhajjar Power Ltd. IRRPL INDA1+ 0.71
Sadbhav Engineering Ltd. CARE A1+ 0.71
Turquoise Investment &Finance Pvt. Ltd. CRISIL A1+ 0.71
RSPL Ltd. CRISIL A1+ 0.71
Reliance Securities Ltd. ICRA A1+ 0.36
Birla Tmt Holdings Pvt. Ltd. CRISIL A1+ 0.35
Aditya Birla Financial Services Ltd. ICRA A1+ 0.07
SBI Premier Liquid Fund Mutual Fund 6.89
77 Day CMB T-Bill Mat 16.08.2017 SOVEREIGN 8.77
91 Day Tbill Mat 28.09.2017 SOVEREIGN 6.19
91 Days Tbill Mat 10.08.2017 SOVEREIGN 3.42
91 Days Tbill Mat 21.09.2017 SOVEREIGN 2.13
80 Days CMB Mat 18.09.2017 SOVEREIGN 2.10
Bandhan Bank 3.59
Doha Bank 1.44
Commercial Paper Total 58.93
Mutual Fund Units Total 6.89
Treasury Bills Total 22.61
Fixed Deposits Total 5.03
CBLO 4.70
Cash & Other Receivables 0.12
Grand Total 100.00
Issuer Name Rating (%) Of TotalAUM
Issuer Name Rating (%) Of TotalAUM
Investors understand that their principal
will be at Low risk
^Investors should consult their financial advisers if in doubt about whether the product is suitable for them.
Note: Instant redemption facility available
upto 50,000. For further details visit:
www.sbimf.com
`
AAA Money Market Fund (A1+)
Below AA+Sovereign NCA (Incl. Cash, Deposits)
1.72
58.9322.61
6.89
9.85

49
�
�
Regular income for short term
Investment in Debt and Money Market securities
SBI Magnum InstaCash Fund – Liquid FloaterThis product is suitable for investors who are seeking^:
Investment Objective
Quantitative Data
To mitigate interest rate risk and
generate opportunities for regular
income through a portfolio investing
predominantly in floating rate securities
and Money Market instruments.
Fund Details
Modified Duration :
Average Maturity :
Yield to Maturity :
1 day
1 day
6.20
PORTFOLIO CLASSIFICATION BY
RATING CLASS (%)
CBLO 100.91
Cash & Other Receivables (0.91)
•
•
•
•
•
•
•
•
•
•
•
•
•
•
Type of Scheme
Date of Allotment:
Report As On:
AAUM for the Month of June 2017
AUM as on June 30, 2017
Fund Manager: Mr. R. Arun
Managing Since:
Total Experience:
Benchmark:
Exit Load:
Entry Load:
Plans Available:
Options:
SIP
Minimum Investment
Additional Investment
An Open - Ended Liquid Fund
01/10/2002
30/06/2017
61.44 Crores
52.59 Crores
Apr-2012
Over 11 years
CRISIL Liquid Fund Index
Nil
N.A.
Regular, Direct
Growth, Dividend
N.A.
5,000 & in multiples of 1
1,000 & in multiples of 1
`
`
` `
` `
PORTFOLIO CLASSIFICATION BY
ASSET ALLOCATION (%)
DEBT-LIQUID
Option NAV ( )`
Reg Plan-Growth 2764.4515
Reg Plan-Weekly Dividend 1032.1879
Reg Daily Dividend 1009.9100Plan-
NET ASSET VALUE
Option NAV ( )`
Dir Plan-Growth 2783.8517
Dir Plan-Daily Dividend 1009.9100
Dir Plan-Weekly Dividend 1032.2057
PORTFOLIO
CCIL-Clearing Corporation Of India Ltd (CBLO) 100.91
CBLO Total 100.91
Cash & Other Receivables (0.91)
Grand Total 100.00
Issuer Name (%) Of TotalAUM
Investors understand that their principal
will be at Low risk
^Investors should consult their financial advisers if in doubt about whether the product is suitable for them.
NCA (Incl. Cash, Deposits)
100.00

50
Comparative Performance for all Schemes
Note: Wherever NAV/Benchmark Index value is not available for start/end date for concerned period, the previous business day value of NAV/Benchmark Index is considered for return computation.
Managing Since
Jan-11
Inception Date
09-02-2004
Managing Since
Jan-11
Inception Date
25-11-1998
Managing Since
Jan-11
Inception Date
30-12-2000
Inception Date
30-12-2000
Managing Since
Jan-11
Inception Date
31-12-1995
Inception Date
09-04-2001
Inception Date
12-11-2003
Inception Date
21-12-2005
Managing Since
Jan-12
Managing Since
Jul-11
Managing Since
Jul-11
Managing Since
Jul-11
13.63 11,363 11.29 13,786 9.51 15,757 5.80 21,295
11.47 11,147 10.91 13,646 9.58 15,801 6.84 24,275
11.69 11,169 11.15 13,736 8.46 15,014 5.83 21,363
12.62 11,262 10.57 13,520 9.31 15,614 7.91 41,197
11.47 11,147 10.91 13,646 9.58 15,801 N.A. N.A.
11.69 11,169 11.15 13,736 8.46 15,014 N.A. N.A.
11.79 11,179 11.06 13,704 10.34 16,358 7.98 35,436
8.03 10,803 8.76 12,869 8.52 15,053 N.A. N.A.
6.53 10,653 7.57 12,451 7.36 14,263 6.29 27,325
16.54 11,654 13.67 14,693 12.10 17,708 8.48 38,358
13.20 11,320 12.68 14,312 10.74 16,662 N.A. N.A.
11.69 11,169 11.15 13,736 8.46 15,014 N.A. N.A.
13.70 11,370 14.03 14,834 18.98 23,857 16.18 2,60,699
13.85 11,385 9.08 12,981 11.73 17,419 N.A. N.A.
14.53 11,453 6.75 12,167 12.13 17,736 10.42 86,303
13.31 11,331 12.45 14,224 11.46 17,211 8.47 37,427
12.07 11,207 10.56 13,519 10.15 16,222 N.A. N.A.
11.69 11,169 11.15 13,736 8.46 15,014 N.A. N.A.
8.58 10,858 10.74 13,586 11.06 16,900 8.09 24,526
12.07 11,207 10.56 13,519 10.15 16,222 8.50 25,608
6.53 10,653 7.57 12,451 7.36 14,263 6.27 20,174
12.92 11,292 10.95 13,662 10.60 16,551 8.12 29,021
12.07 11,207 10.56 13,519 10.15 16,222 8.21 29,322
11.69 11,169 11.15 13,736 8.46 15,014 5.75 21,443
SBI Dynamic Bond Fund
SBI Magnum Income Fund
SBI Magnum Gilt Fund - Short Term
SBI Magnum Gilt Fund - Long Term
SBI Magnum Balanced Fund
SBI Magnum Monthly Income Plan
SBI Magnum Monthly Income Plan - Floater
SBI Regular Savings Fund
Scheme Benchmark: - CRISIL Composite Bond Fund Index
Additional Benchmark: - CRISIL 10 Year Gilt Index
Scheme Benchmark: - CRISIL Composite Bond Fund Index
Additional Benchmark: - CRISIL 10 Year Gilt Index
Scheme Benchmark: - I-Sec Si-BEX
Additional Benchmark: - CRISIL 1 Year T-Bill Index
Scheme Benchmark: - I-Sec Li-BEX
Additional Benchmark: - CRISIL 10 Year Gilt Index
Scheme Benchmark: - CRISIL Balanced Fund - Aggressive Index
Additional Benchmark: - S&P BSE Sensex
Scheme Benchmark: - CRISIL MIP Blended Index
Additional Benchmark: - CRISIL 10 Year Gilt Index
Scheme Benchmark: - CRISIL MIP Blended Index
Additional Benchmark: - CRISIL 1 Year T-Bill Index
Scheme Benchmark: - CRISIL MIP Blended Index
Additional Benchmark: - CRISIL 10 Year Gilt Index
Funds Managed by Mr. Dinesh Ahuja
Fund Jointly Managed by Mr. R. Srinivasan (Equity portion) & Mr. Dinesh Ahuja (Debt portion)
Fund Jointly Managed by Mr. Dinesh Ahuja (Debt portion) & Mr. Ruchit Mehta (Equity portion)
CAGR %Point-to-Point
returns on StandardInvestment ofRs. 10,000/-
CAGR %Point-to-Point
returns on StandardInvestment ofRs. 10,000/-
CAGR %Point-to-Point
returns on StandardInvestment ofRs. 10,000/-
3 Years 5 Years
CAGR %Point-to-Point
returns on StandardInvestment ofRs. 10,000/-
Since Inception
Inception Date &Managing Since
Managing Since
May-09
Inception Date
01-01-1991
1 Year
Managing Since
May-09
Inception Date
30-09-1994
Managing Since
May-09
Inception Date
11-10-2004
Inception Date
14-07-1999
Managing Since
Jun-11
Inception Date
09-09-2009
Managing Since
Nov-13
14.00 11,400 12.57 14,269 15.74 20,778 14.75 3,83,679
14.88 11,488 7.74 12,509 12.50 18,031 N.A. N.A.
14.53 11,453 6.75 12,167 12.13 17,736 N.A. N.A.
11.66 11,166 16.02 15,624 21.81 26,841 14.96 2,38,846
28.23 12,823 17.25 16,126 19.58 24,471 N.A. N.A.
14.53 11,453 6.75 12,167 12.13 17,736 9.07 72,230
16.51 11,651 15.81 15,538 19.27 24,149 20.89 1,13,197
19.48 11,948 10.40 13,459 14.53 19,716 14.84 58,701
14.53 11,453 6.75 12,167 12.13 17,736 14.35 55,603
17.37 11,737 13.34 14,564 15.73 20,774 20.21 2,74,853
16.88 11,688 8.36 12,725 13.28 18,659 13.09 91,616
14.53 11,453 6.75 12,167 12.13 17,736 11.57 71,804
30.05 13,005 30.47 22,223 32.17 40,376 20.94 44,149
30.58 13,058 14.72 15,104 18.66 23,543 10.27 21,453
14.53 11,453 6.75 12,167 12.13 17,736 8.64 19,107
SBI Magnum Equity Fund
SBI Magnum Global Fund
SBI Emerging Businesses Fund
SBI Contra Fund
SBI Small & Midcap Fund
Scheme Benchmark: - Nifty 50
Additional Benchmark: - S&P BSE Sensex
Scheme Benchmark: - S&P BSE MidSmallCap
Additional Benchmark: - S&P BSE Sensex
Scheme Benchmark: - S&P BSE 500
Additional Benchmark: - S&P BSE Sensex
Scheme Benchmark: - S&P BSE 100
Additional Benchmark: - S&P BSE Sensex
Scheme Benchmark: - S&P BSE SMALL CAP
Additional Benchmark: - S&P BSE Sensex
Funds Managed by Mr. R. Srinivasan
Notes:
a.
c. Past performance may or may not be sustained in future and the same may not necessarily provide the basis for comparison with other investment.d. Load is not considered for computation of returns.e. Period for which scheme’s performance has been provided is computed basis last day of the month-end preceding the date of advertisement. In case, the start/end date of the concerned period is a non-business day, the NAV of the
previous date is considered for computation of returns.
The details of the period since the Fund Manager is managing the scheme(s) & inception date provided alongside of the table. The total no of schemes managed by Mr. R.Srinivasan is 6 ( 1 scheme is jointly managed by Mr. DineshAhuja). The
total no of schemes managed by DineshAhuja is 8 ( 3 schemes are jointly managed by Mr. Ruchit Mehta & 1 scheme are jointly managed by Mr. R. Srinivasan)b. Different plans shall have a different expense structure. The performance provided for SBI Magnum Equity Fund, SBI Magnum Global Fund, SBI Contra Fund and SBI Magnum Balanced Fund are of regular plan- Dividend Option and is Net of
Dividend distribution tax, if any. Performance for all other scheme(s) are of Regular- growth option. SBI Magnum Equity Fund Growth option introduced on 27/11/06, SBI Magnum Global Fund Growth option introduced on 27/06/05, SBI Contra
Fund Growth option introduced on 06/05/05, SBI Magnum Balanced Fund Growth option introduced on 19/01/05. In case of return calculated the dividend option, it is assumed that dividend declared under the schemes have been reinvested
at the prevailing NAV.
f. Scheme count for the total schemes managed by the Fund Managers does not include close ended scheme.
i. The data of the last working day has been considered for the calculation of performance.

51
Comparative Performance for all Schemes
Notes:
a.
b.
c. Past performance may or may not be sustained in future and the same may not necessarily provide the basis for comparison with other investment.
d. Load is not considered for computation of returns.
e. Period for which scheme’s performance has been provided is computed basis last day of the month-end preceding the date of advertisement. In case, the start/end date of the concerned period is a non-business day, the NAV of the previous
date is considered for computation of returns.
f. Scheme count for the total schemes managed by the Fund Managers does not include
The details of the period since the Fund Manager is managing the scheme(s) & inception date provided alongside of the table. The total no of schemes managed by Mr. Neeraj Kumar is 2 (1 scheme is jointly managed by Mr. Ruchit Mehta).
The total no of schemes managed by Mr.Anup Upadhyay is 2. The total no of schemes managed by Mr. Lokesh Mallya and Ms. Mansi Sajeja is 1
Different plans shall have a different expense structure. The performance provided for SBI IT Fund are of regular plan- Dividend Option and is Net of Dividend distribution tax, if any. SBI IT Fund Growth option introduced on 01/01/13. The
performance details provided for SBI Magnum MultiCap Fund, SBI Arbitrage Opportunities Fund, SBI Equity Savings Fund, SBI Magnum Monthly Income Plan, SBI Magnum Monthly Income Plan - Floater, SBI Regular Savings Fund, SBI
Corporate Bond Fund are of Growth Option-Regular Plan. In case of return calculated the dividend option, it is assumed that dividend declared under the schemes have been reinvested at the prevailing NAV.
close ended scheme.
g. SBI Equity Savings Fund & SBI Corporate Bond Fund scheme have not completed 3 & 5 years period, hence the performance of such period are not provided.
i. The data of the last working day has been considered for the calculation of performance.
CAGR %Point-to-Point
returns on StandardInvestment ofRs. 10,000/-
CAGR %Point-to-Point
returns on StandardInvestment ofRs. 10,000/-
CAGR %Point-to-Point
returns on StandardInvestment ofRs. 10,000/-
3 Years 5 Years
CAGR %Point-to-Point
returns on StandardInvestment ofRs. 10,000/-
Since Inception
Inception Date &Managing Since
Managing Since
Oct-12
Inception Date
03-11-2006SBI Arbitrage Opportunities Fund
SBI Equity Savings Fund
Scheme Benchmark: - CRISIL Liquid Fund Index
Additional Benchmark: - S&P BSE Sensex
Scheme Benchmark: - 30% Nifty 50 + 70%CRISIL Liquid Fund Index
Additional Benchmark: - S&P BSE Sensex
5.84 10,584 6.77 12,173 7.54 14,385 7.53 21,693
6.86 10,686 7.83 12,541 8.25 14,869 7.58 21,793
14.53 11,453 6.75 12,167 12.13 17,736 8.36 23,549
9.63 10,963 N.A. N.A. N.A. N.A. 8.61 11,891
9.34 10,934 N.A. N.A. N.A. N.A. 7.38 11,609
14.53 11,453 N.A. N.A. N.A. N.A. 5.64 11,218
1 Year
Managing Since
May-15
Inception Date
27-05-2015
Fund Jointly Managed by Mr. Neeraj Kumar (Arbitrage portion) & Mr. Ruchit Mehta (Equity & Debt portion)
Funds Managed by Mr. Neeraj Kumar
Managing Since
Jun-11
Inception Date
14-07-1999
SBI IT Fund
SBI Magnum MultiCap Fund
Scheme Benchmark: - S&P BSE - InformationTechnology Index
Additional Benchmark: - S&P BSE Sensex
Scheme Benchmark: - S&P BSE 500 Index
Additional Benchmark: - S&P BSE Sensex
-3.93 9,607 5.20 11,644 14.23 19,460 12.48 82,987
-12.20 8,780 1.71 10,521 11.26 17,053 12.00 76,953
14.53 11,453 6.75 12,167 12.13 17,736 11.57 71,804
19.03 11,903 18.66 16,716 21.19 26,161 13.03 42,212
19.48 11,948 10.40 13,459 14.53 19,716 11.87 37,377
14.53 11,453 6.75 12,167 12.13 17,736 11.44 35,747Managing Since
Feb-17
Inception Date
29-09-2005
Managing Since
Feb-17
Inception Date
17-07-2014SBI Corporate Bond Fund
Scheme Benchmark: - CRISIL Composite Bond Fund
Additional Benchmark: - CRISIL 10 Year Gilt Index
9.65 10,965 N.A. N.A. N.A. N.A. 10.11 13,293
11.47 11,147 N.A. N.A. N.A. N.A. 11.00 13,614
11.69 11,169 N.A. N.A. N.A. N.A. 11.17 13,675
Funds Managed by Mr. Lokesh Mallya and Ms. Mansi Sajeja
Funds Managed by Mr. Anup Upadhyay

52
Comparative Performance for all Schemes
Notes:
a.
b.
c. Past performance may or may not be sustained in future and the same may not necessarily provide the basis for comparison with other investment.
d. Load is not considered for computation of returns.
e. Period for which scheme’s performance has been provided is computed basis last day of the month-end preceding the date of advertisement. In case, the start/end date of the concerned period is a non-business day, the NAV of the previous
date is considered for computation of returns.
f. Scheme count for the total schemes managed by the Fund Managers does not include
The details of the period since the Fund Manager is managing the scheme(s) & inception date provided alongside of the table. The total no of schemes managed by Mr. Saurabh Pant is 2. The total no of schemes managed by Mr.Tanmaya Desai
is 1.
Different plans shall have a different expense structure. The performance provided for SBI FMCG Fund, SBI Magnum Multiplier Fund, SBI Pharma Fund are of regular plan- Dividend Option and is Net of Dividend distribution tax, if any. SBI
FMCG Fund Growth option introduced on 01/01/13, SBI Magnum Multiplier Fund Growth option introduced on 25/05/05, SBI Pharma Fund Growth option introduced on 31/12/04. In case of return calculated the dividend option, it is assumed
that dividend declared under the schemes have been reinvested at the prevailing NAV.
close ended scheme.
i. The data of the last working day has been considered for the calculation of performance.
CAGR %Point-to-Point
returns on StandardInvestment ofRs. 10,000/-
CAGR %Point-to-Point
returns on StandardInvestment ofRs. 10,000/-
CAGR %Point-to-Point
returns on StandardInvestment ofRs. 10,000/-
3 Years 5 Years
CAGR %Point-to-Point
returns on StandardInvestment ofRs. 10,000/-
Since Inception
Inception Date &Managing Since
Managing Since
Jun-11
Inception Date
14-07-1999
SBI FMCG Fund
SBI Magnum Multiplier Fund
Scheme Benchmark: - S&P BSE Fast MovingConsumer Goods Index
Additional Benchmark: - S&P BSE Sensex
Scheme Benchmark: - S&P BSE 200 Index
Additional Benchmark: - S&P BSE Sensex
23.60 12,360 19.35 17,011 19.07 23,953 15.64 1,36,801
23.37 12,337 16.01 15,620 15.86 20,884 12.46 82,734
14.53 11,453 6.75 12,167 12.13 17,736 11.57 71,804
18.86 11,886 16.09 15,652 20.22 25,131 14.81 2,88,690
18.08 11,808 9.91 13,280 14.16 19,401 11.27 1,34,653
14.53 11,453 6.75 12,167 12.13 17,736 10.39 1,11,074
Managing Since
Sep-16
Inception Date
28-02-1993
1 Year
Funds Managed by Mr. Saurabh Pant
Managing Since
Jun-11
Inception Date
14-07-1999SBI Pharma Fund
Scheme Benchmark: - S&P BSE Health Care Index
Additional Benchmark: - S&P BSE Sensex
-7.72 9,228 11.38 13,822 20.12 25,028 16.78 1,63,066
-8.41 9,159 7.37 12,380 15.55 20,608 14.29 1,10,769
14.53 11,453 6.75 12,167 12.13 17,736 11.57 71,804
Funds Managed by Mr. Tanmaya Desai
Notes:
a. Ms. SohiniAndani has been managing SBI Blue Chip Fund since September 2010, SBI Magnum Midcap Fund sinceJuly 2010 and SBI Banking and Financial Services Fund since February 2015. The total number of schemes managed by Ms. SohiniAndani is 3.
b. Past performance may or may not be sustained in future and the same may not necessarily provide the basis for comparison with other investment.c. Load is not considered for computation of returns.d. Period for which scheme’s performance has been provided is computed basis last day of the month-end preceding the date of advertisement. In case, the start/end date of the concerned period is a non-business day, the NAV of the previous date
is considered for computation of returns.e. Different plans shall have a different expense structure. The performance details provided herein are of Growth Option - Regular Plan. Performance for Schemes not having Growth Option has been calculated considering the Dividend Option
and is Net of Dividend distribution tax, if any.f. Scheme count for the total schemes managed by the Fund Managers does not include close ended scheme.g. SBI Banking & Financial Services Fund scheme has not completed 3 & 5 years period, hence the performance of such period are not provided.i. The data of the last working day has been considered for the calculation of performance.
The details of the period since the Fund Manager is managing the scheme(s) & inception date provided alongside of the table.
CAGR %Point-to-Point
returns on StandardInvestment ofRs. 10,000/-
CAGR %Point-to-Point
returns on StandardInvestment ofRs. 10,000/-
CAGR %Point-to-Point
returns on StandardInvestment ofRs. 10,000/-
3 Years 5 Years
CAGR %Point-to-Point
returns on StandardInvestment ofRs. 10,000/-
Since Inception
Inception Date &Managing Since
Managing Since
July-10
Inception Date
29-03-2005
SBI Magnum MidCap Fund
SBI Blue Chip Fund
SBI Banking & Financial Services Fund
Scheme Benchmark: - Nifty MidSmallcap 400 Index
Additional Benchmark: - S&P BSE Sensex
Scheme Benchmark: - S&P BSE 100 Index
Additional Benchmark: - S&P BSE Sensex
Scheme Benchmark: - Nifty Financial Services
Additional Benchmark: - S&P BSE Sensex
17.15 11,715 22.50 18,392 29.07 35,858 18.08 76,731
29.74 12,974 17.00 16,024 21.41 26,401 N.A. N.A.
14.53 11,453 6.75 12,167 12.13 17,736 13.75 48,559
15.82 11,582 15.77 15,523 20.14 25,049 11.62 34,929
16.88 11,688 8.36 12,725 13.28 18,659 10.73 31,903
14.53 11,453 6.75 12,167 12.13 17,736 10.34 30,656
29.36 12,936 N.A. N.A. N.A. N.A. 14.77 13,808
29.69 12,969 N.A. N.A. N.A. N.A. 9.28 12,312
14.53 11,453 N.A. N.A. N.A. N.A. 3.16 10,757
1 Year
Managing Since
Sep-10
Inception Date
14-02-2006
Managing Since
Feb-15
Inception Date
26-02-2015
Funds Managed by Ms. Sohini Andani

53
Comparative Performance for all Schemes
Notes:
a. Mr. R.Arun has been managing SBI Savings Fund and SBI Magnum InstaCash Fund – Liquid Floater Plan sinceApril2012. The total number of schemes managed by Mr. R.Arun is 2.
b. Past performance may or may not be sustained in future and the same may not necessarily provide the basis for comparison with other investment.c. Load is not considered for computation of returns.d. Period for which scheme’s performance has been provided is computed basis last day of the month-end preceding the date of advertisement. In case, the start/end date of the concerned period is a non-business day, the NAV of the previous date
is considered for computation of returns.e. Different plans shall have a different expense structure. The performance details provided herein are of Growth Option - Regular Plan. Performance for Schemes not having Growth Option has been calculated considering the Dividend Option
and is Net of Dividend distribution tax, if any.f. Scheme count for the total schemes managed by the Fund Managers does not include close ended scheme.i. The data of the last working day has been considered for the calculation of performance.
The details of the period since the Fund Manager is managing the scheme(s) & inception date provided alongside of the table.
CAGR %Point-to-Point
returns on StandardInvestment ofRs. 10,000/-
CAGR %Point-to-Point
returns on StandardInvestment ofRs. 10,000/-
CAGR %Point-to-Point
returns on StandardInvestment ofRs. 10,000/-
3 Years 5 Years
CAGR %Point-to-Point
returns on StandardInvestment ofRs. 10,000/-
Since Inception
Inception Date &Managing Since
Managing Since
Apr-12
Inception Date
01-10-2002SBI Magnum InstaCash Fund - Liquid Floater
SBI Savings Fund
Scheme Benchmark: - CRISIL Liquid Fund Index
Additional Benchmark: - CRISIL 1 Year T-Bill Index
Scheme Benchmark: - CRISIL Liquid Fund Index
Additional Benchmark: - CRISIL 1 Year T-Bill Index
5.96 10,596 7.21 12,325 7.87 14,608 7.12 27,608
6.86 10,686 7.83 12,541 8.25 14,869 6.80 26,398
6.53 10,653 7.57 12,451 7.36 14,263 5.95 23,451
7.49 10,749 8.08 12,629 8.55 15,074 7.57 25,753
6.86 10,686 7.83 12,541 8.25 14,869 7.12 24,374
6.53 10,653 7.57 12,451 7.36 14,263 6.05 21,393
Managing Since
Apr-12
Inception Date
19-07-2004
1 Year
Funds Managed by Mr. R. Arun
Notes:
a. Mr. Dinesh Balachandran has been managing SBI Magnum Taxgain Scheme since September 2016 and comanaging SBI Dynamic Asset Allocation Fund (Equity & Equity related instruments and Debt & Money Market instruments portion) since March 2015 with Ms. Nidhi Chawla (investments in foreign securities portion). The total number ofschemes managed by Mr. Dinesh Balachandran is 2 (1 scheme is jointly managed by Ms. Nidhi Chawla).
b. Past performance may or may not be sustained in future and the same may not necessarily provide the basis for comparison with other investment.c. Load is not considered for computation of returns.d. Period for which scheme’s performance has been provided is computed basis last day of the month-end preceding the date of advertisement. In case, the start/end date of the concerned period is a non-business day, the NAV of the previous date
is considered for computation of returns.e. Different plans shall have a different expense structure. The performance provided for SBI Magnum Taxgain Scheme, are of regular plan - Dividend Option and is Net of Dividend distribution tax, if any. SBI
Magnum Taxgain Scheme Growth option introduced on 07/05/07. The performance details provided for SBI DynamicAssetAllocation Fund are of Growth Option-Regular Plan.f. Scheme count for the total schemes managed by the Fund Managers does not include close ended scheme.g. SBI Dynamic Asset Allocation Fund scheme has not completed 3 & 5 years period, hence the performance of such period are not provided.i. The data of the last working day has been considered for the calculation of performance.
The details of the period since the Fund Manager is managing the scheme(s) & inception date provided alongside of the table.
CAGR %Point-to-Point
returns on StandardInvestment ofRs. 10,000/-
CAGR %Point-to-Point
returns on StandardInvestment ofRs. 10,000/-
CAGR %Point-to-Point
returns on StandardInvestment ofRs. 10,000/-
3 Years 5 Years
CAGR %Point-to-Point
returns on StandardInvestment ofRs. 10,000/-
Since Inception
Inception Date &Managing Since
Managing Since
Sep-16
Inception Date
31-03-1993
SBI Magnum Taxgain Scheme
SBI Dynamic Asset Allocation Fund
Scheme Benchmark: - S&P BSE 100 Index
Additional Benchmark: - S&P BSE Sensex
Scheme Benchmark: - 50% CRISIL 1 year CD Index +50% BSE S&P Sensex
Additional Benchmark: - S&P BSE Sensex
18.00 11,800 12.41 14,210 17.83 22,724 16.57 4,13,235
16.88 11,688 8.36 12,725 13.28 18,659 12.28 1,66,318
14.53 11,453 6.75 12,167 12.13 17,736 11.34 1,35,590
11.22 11,122 N.A. N.A. N.A. N.A. 7.90 11,880
10.97 11,097 N.A. N.A. N.A. N.A. 6.93 11,640
14.53 11,453 N.A. N.A. N.A. N.A. 5.38 11,262
1 Year
Managing Since
Mar-15
Inception Date
26-03-2015
Fund Jointly Managed by Mr. Dinesh Balachandran (Equity portion) & Ms. Nidhi Chawla (investments in foreign securities portion)
Funds Managed by Mr. Dinesh Balachandran

54
Comparative Performance for all Schemes
Notes:
a. Mr. Rajeev Radhakrishnan is also the Fund Manager of other close-ended schemes like SBI Debt Fund Series andmanages the debt portion of the SBI DualAdvantage Fund Series.
b. Past performance may or may not be sustained in future and the same may not necessarily provide the basis for comparison with other investment.c. Load is not considered for computation of returns.d. Period for which scheme’s performance has been provided is computed basis last day of the month-end preceding the date of advertisement. In case, the start/end date of the concerned period is a non-business day, the NAV of the previous date
is considered for computation of returns.e. Different plans shall have a different expense structure. The performance details of all the schemes provided herein are of Growth Option - Regular Plan. Performance for Schemes not having Growth Option has been calculated considering the
Dividend Option and is Net of Dividend distribution tax, if any.f. Scheme count for the total schemes managed by the Fund Managers does not include close ended scheme.i. The data of the last working day has been considered for the calculation of performance.
The details of the period since the Fund Manager is managing the scheme(s) & inception date provided alongside of the table.
CAGR %Point-to-Point
returns on StandardInvestment ofRs. 10,000/-
CAGR %Point-to-Point
returns on StandardInvestment ofRs. 10,000/-
CAGR %Point-to-Point
returns on StandardInvestment ofRs. 10,000/-
3 Years 5 Years
CAGR %Point-to-Point
returns on StandardInvestment ofRs. 10,000/-
Since Inception
Inception Date &Managing Since
Managing Since
Jun-08
Inception Date
27-07-2007
1 Year
Managing Since
Jun-08
Inception Date
27-07-2007
Managing Since
Jun-08
Inception Date
21-02-2002
Inception Date
09-10-2009
Inception Date
21-05-1999
Inception Date
24-11-2003
Managing Since
Nov-13
Managing Since
May-10
Managing Since
May-10
7.61 10,761 8.32 12,714 8.61 15,117 7.94 21,369
6.86 10,686 7.83 12,541 8.25 14,869 7.54 20,585
6.53 10,653 7.57 12,451 7.36 14,263 6.33 18,395
8.90 10,890 8.88 12,911 8.96 15,365 6.82 19,255
8.88 10,888 9.12 12,995 9.09 15,451 8.19 21,852
6.53 10,653 7.57 12,451 7.36 14,263 6.33 18,395
18.44 11,844 14.34 14,955 14.28 19,501 10.84 48,587
12.07 11,207 10.56 13,519 10.15 16,222 N.A. N.A.
11.69 11,169 11.15 13,736 8.46 15,014 6.86 27,708
7.56 10,756 8.44 12,756 8.60 15,113 8.20 18,390
7.22 10,722 8.21 12,674 8.51 15,047 N.A. N.A.
6.53 10,653 7.57 12,451 7.36 14,263 6.55 16,329
6.87 10,687 7.90 12,566 8.41 14,976 7.38 36,357
6.86 10,686 7.83 12,541 8.25 14,869 N.A. N.A.
6.53 10,653 7.57 12,451 7.36 14,263 6.57 31,662
6.78 10,678 7.86 12,552 8.39 14,962 7.74 21,515
6.86 10,686 7.83 12,541 8.25 14,869 7.62 21,275
6.53 10,653 7.57 12,451 7.36 14,263 6.45 19,023
SBI Ultra Short Term Debt Fund
SBI Short Term Debt Fund
SBI Magnum Children's Benefit Plan
SBI Treasury Advantage Fund
SBI Magnum InstaCash Fund
SBI Premier Liquid Fund
Scheme Benchmark: - CRISIL Liquid Fund Index
Additional Benchmark: - CRISIL 1 Year T-Bill Index
Scheme Benchmark: - CRISIL Short Term Bond Fund Index
Additional Benchmark: - CRISIL 1 Year T-Bill Index
Scheme Benchmark: - CRISIL MIP Blended Index
Additional Benchmark: - CRISIL 10 Year Gilt Index
Scheme Benchmark: - CRISIL 1 Year CD Index
Additional Benchmark: - CRISIL 1 Year T-Bill Index
Scheme Benchmark: - CRISIL Liquid Fund Index
Additional Benchmark: - CRISIL 1 Year T-Bill Index
Scheme Benchmark: - CRISIL Liquid Fund Index
Additional Benchmark: - CRISIL 1 Year T-Bill Index
Funds Managed by Mr. Rajeev Radhakrishnan
Notes:
a. The total number of schemes managed by Mr. Richard D’souza is 3.b. Past performance may or may not be sustained in future and the same may not necessarily provide the basis for comparison with other investment.c. Load is not considered for computation of returns.d. Period for which scheme’s performance has been provided is computed basis last day of the month-end preceding the date of advertisement. In case, the start/end date of the concerned period is a non-business day, the NAV of the previous date
is considered for computation of returns.e. Different plans shall have a different expense structure. The performance details provided herein are of Growth Option - Regular Plan. Performance for Schemes not having Growth Option has been calculated considering the Dividend Option
and is Net of Dividend distribution tax, if any.f. Scheme count for the total schemes managed by the Fund Managers does not include close ended scheme.i. The data of the last working day has been considered for the calculation of performance.
The details of the period since the Fund Manager is managing the scheme(s) & inception date provided alongside of the table.
CAGR %Point-to-Point
returns on StandardInvestment ofRs. 10,000/-
CAGR %Point-to-Point
returns on StandardInvestment ofRs. 10,000/-
CAGR %Point-to-Point
returns on StandardInvestment ofRs. 10,000/-
3 Years 5 Years
CAGR %Point-to-Point
returns on StandardInvestment ofRs. 10,000/-
Since Inception
Inception Date &Managing Since
Managing Since
Aug-14
Inception Date
08-08-2005SBI Magnum Comma Fund
SBI Infrastructure Fund
SBI PSU Fund
Scheme Benchmark: - Nifty Commodities Index
Additional Benchmark: - S&P BSE Sensex
Scheme Benchmark: - Nifty Infrastructure Index
Additional Benchmark: - S&P BSE Sensex
Scheme Benchmark: - S&P BSE PSU INDEX
Additional Benchmark: - S&P BSE Sensex
31.17 13,117 10.93 13,654 11.36 17,134 11.04 34,790
25.99 12,599 3.89 11,213 7.29 14,220 9.73 30,204
14.53 11,453 6.75 12,167 12.13 17,736 12.51 40,653
14.20 11,420 11.63 13,915 13.49 18,836 3.67 14,338
12.50 11,250 -1.72 9,492 5.79 13,249 -1.93 8,235
14.53 11,453 6.75 12,167 12.13 17,736 7.53 20,664
27.69 12,769 3.97 11,241 6.87 13,945 1.87 11,381
20.78 12,078 -2.05 9,397 2.25 11,177 -2.05 8,654
14.53 11,453 6.75 12,167 12.13 17,736 8.52 17,699
Managing Since
Aug-14
Inception Date
06-07-2007
1 Year
Funds Managed by Mr. Richard D'souza
Managing Since
Aug-14
Inception Date
07-07-2010

55
The Fund offers flexible and convenient Systematic Investment Plan (SIP) facility. To illustrate the advantages of SIP investments, this is how your investments wouldhave grown if you had invested say 10,000 systematically on the first Business Day of every month over a period of time in the Respective Scheme by using XIRRapproach. XIRR helps in calculating return on investments given an initial and final value and a series of cash inflows and outflows with the correct allowance for thetime impact of the transactions. Data as on June 30, 2017.
`
Investors are advised to refer to the performance summary table on page 49-53. Returns are calculated for the Regular plan.Disclaimer: The above investment simulation is for illustrative purposes only and should not be construed as a promise on minimum returns and safeguard ofcapital. The AMC / Mutual Fund is not guaranteeing or promising or forecasting any returns. Investors are advised to consult their financial advisor/consultantbefore taking any investment decision. SIP does not assure a profit or guarantee protection against a loss in a declining market. Please refer SID of the respectiveSchemes before investing.
Source: ICRA Online
Benefits of Systematic Investment Plan (SIP)SIP Performance of Select Schemes - Fund Manager-wise
31,80,000 18,00,000 12,00,000 6,00,000 3,60,000 1,20,0003,29,40,342 76,01,533 24,06,442 8,68,293 4,23,969 1,28,413
14.80 17.40 13.35 14.78 10.93 13.3511.77 13.08 10.03 11.39 9.14 16.7311.66 13.11 9.61 10.69 8.38 17.36
Total Amount Invested ( )Mkt Value as on June 30, 2017 ( )
Benchmark Returns (Annualised) (%) #Additional Benchmark Returns (Annualised) (%) ##
`
`
Returns (Annualised) (%)
SIP Investments
Past performance may or may not be sustained in the future. # Nifty 50 Index, ## S&P BSE SENSEX, Inception Date: January 01, 1991
Returns are calculated for Dividend Option. It is assumed that dividends declared under the scheme have been reinvested at the prevailing NAV.
SBI Magnum Equity Fund FUND MANAGER -R. SRINIVASAN
21,60,000 18,00,000 12,00,000 6,00,000 3,60,000 1,20,0001,92,65,984 89,03,739 22,33,174 8,81,540 4,33,332 1,32,217
21.19 19.20 11.94 15.40 12.44 19.5513.93 13.80 10.51 12.36 10.21 17.6913.20 13.11 9.62 10.69 8.38 17.36
Total Amount Invested ( )Mkt Value as on June 30, 2017 ( )
Benchmark Returns (Annualised) (%) #Additional Benchmark Returns (Annualised) (%) ##
`
`
Returns (Annualised) (%)
SIP Investments
Past performance may or may not be sustained in the future. # S&P BSE 100, ## S&P BSE SENSEX, Inception Date: July 14, 1999
Returns are calculated for Dividend Option. It is assumed that dividends declared under the scheme have been reinvested at the prevailing NAV.
SBI Contra Fund FUND MANAGER -R. SRINIVASAN
13,70,000 N.A. 12,00,000 6,00,000 3,60,000 1,20,00032,05,790 N.A. 26,54,329 9,46,407 4,40,129 1,30,109
14.18 N.A. 15.18 18.30 13.52 16.1010.36 N.A. 10.51 12.36 10.21 17.699.53 N.A. 9.62 10.69 8.38 17.36
Total Amount Invested ( )Mkt Value as on June 30, 2017 ( )
Benchmark Returns (Annualised) (%) #Additional Benchmark Returns (Annualised) (%) ##
`
`
Returns (Annualised) (%)
SIP Investments
Past performance may or may not be sustained in the future. # S&P BSE 100, ## S&P BSE SENSEX, Inception Date: February 14, 2006
Returns are calculated for Regular Growth
SBI Blue Chip Fund FUND MANAGER -SOHINI ANDANI
29,30,000 18,00,000 12,00,000 6,00,000 3,60,000 1,20,0003,30,36,385 1,03,29,569 27,45,989 9,73,951 4,45,314 1,32,295
16.76 20.88 15.81 19.48 14.34 19.6812.89 14.00 11.19 13.64 11.36 18.6111.70 13.11 9.62 10.69 8.38 17.36
Total Amount Invested ( )Mkt Value as on June 30, 2017 ( )
Benchmark Returns (Annualised) (%) #Additional Benchmark Returns (Annualised) (%) ##
`
`
Returns (Annualised) (%)
SIP Investments
Past performance may or may not be sustained in the future. # S&P BSE 200 Index, ## S&P BSE SENSEX, Inception Date: February 28, 1993
Returns are calculated for Dividend Option. It is assumed that dividends declared under the scheme have been reinvested at the prevailing NAV.
SBI Magnum Multiplier Fund FUND MANAGER -SAURABH PANT
14,70,000 N.A. 12,00,000 6,00,000 3,60,000 1,20,00047,71,076 N.A. 34,94,617 11,58,185 4,65,753 1,30,489
17.96 N.A. 20.28 26.68 17.49 16.7214.99 N.A. 16.33 23.50 19.96 29.6810.13 N.A. 9.62 10.69 8.38 17.36
Total Amount Invested ( )Mkt Value as on June 30, 2017 ( )
Benchmark Returns (Annualised) (%) #Additional Benchmark Returns (Annualised) (%) ##
`
`
Returns (Annualised) (%)
SIP Investments
Past performance may or may not be sustained in the future. # Nifty MidSmallcap 400 Index, ## S&P BSE SENSEX, Inception Date: March 29, 2005
Returns are calculated for Regular Growth
SBI Magnum MidCap Fund FUND MANAGER -SOHINI ANDANI
Since InceptionSIP
15 YearsSIP
10 YearsSIP
5 YearsSIP
3 YearsSIP
1 YearSIP
Since InceptionSIP
15 YearsSIP
10 YearsSIP
5 YearsSIP
3 YearsSIP
1 YearSIP
Since InceptionSIP
15 YearsSIP
10 YearsSIP
5 YearsSIP
3 YearsSIP
1 YearSIP
Since InceptionSIP
15 YearsSIP
10 YearsSIP
5 YearsSIP
3 YearsSIP
1 YearSIP
Since InceptionSIP
15 YearsSIP
10 YearsSIP
5 YearsSIP
3 YearsSIP
1 YearSIP

56
The Fund offers flexible and convenient Systematic Investment Plan (SIP) facility. To illustrate the advantages of SIP investments, this is how your investments wouldhave grown if you had invested say 10,000 systematically on the first Business Day of every month over a period of time in the Respective Scheme by using XIRRapproach. XIRR helps in calculating return on investments given an initial and final value and a series of cash inflows and outflows with the correct allowance for thetime impact of the transactions. Data as on June 30, 2017.
`
Investors are advised to refer to the performance summary table on page 49-53. Returns are calculated for the Regular plan.Disclaimer: The above investment simulation is for illustrative purposes only and should not be construed as a promise on minimum returns and safeguard ofcapital. The AMC / Mutual Fund is not guaranteeing or promising or forecasting any returns. Investors are advised to consult their financial advisor/consultantbefore taking any investment decision. SIP does not assure a profit or guarantee protection against a loss in a declining market. Please refer SID of the respectiveSchemes before investing.
Benefits of Systematic Investment Plan (SIP)SIP Performance of Select Schemes - Fund Manager-wise
25,80,000 18,00,000 12,00,000 6,00,000 3,60,000 1,20,0002,14,13,803 73,98,502 25,15,553 9,06,393 4,27,176 1,28,819
16.90 17.09 14.17 16.53 11.45 14.0010.63 11.40 9.99 11.19 9.76 14.0912.45 13.11 9.62 10.69 8.38 17.36
Total Amount Invested ( )Mkt Value as on June 30, 2017 ( )
Benchmark Returns (Annualised) (%) #Additional Benchmark Returns (Annualised) (%) ##
`
`
Returns (Annualised) (%)
SIP Investments
Past performance may or may not be sustained in the future. # CRISIL Balanced Fund - Aggressive Index, ## S&P BSE SENSEX, Inception Date: December 31, 1995
Returns are calculated for Dividend Option. It is assumed that dividends declared under the scheme have been reinvested at the prevailing NAV.
SBI Magnum Balanced Fund FUND MANAGER -R. SRINIVASAN (Equity) & DINESH AHUJA (Debt)
29,20,000 18,00,000 12,00,000 6,00,000 3,60,000 1,20,0004,61,73,977 1,05,75,424 24,94,113 9,08,570 4,28,391 1,31,861
18.96 21.14 14.01 16.63 11.65 18.9612.61 13.80 10.51 12.36 10.21 17.6911.76 13.11 9.62 10.69 8.38 17.36
Total Amount Invested ( )Mkt Value as on June 30, 2017 ( )
Benchmark Returns (Annualised) (%) #Additional Benchmark Returns (Annualised) (%) ##
`
`
Returns (Annualised) (%)
SIP Investments
Past performance may or may not be sustained in the future. # S&P BSE 100, ## S&P BSE SENSEX, Inception Date: March 31, 1993
Returns are calculated for Dividend Option. It is assumed that dividends declared under the scheme have been reinvested at the prevailing NAV.
SBI Magnum Taxgain Scheme FUND MANAGER -DINESH BALACHANDRAN
27,40,000 18,00,000 12,00,000 6,00,000 3,60,000 1,20,0003,92,31,118 1,20,11,138 30,89,567 9,68,499 4,22,694 1,28,838
19.67 22.58 18.00 19.25 10.73 14.049.14 12.38 14.93 21.56 19.12 26.79
12.18 13.11 9.62 10.69 8.38 17.36
Total Amount Invested ( )Mkt Value as on June 30, 2017 ( )
Benchmark Returns (Annualised) (%) #Additional Benchmark Returns (Annualised) (%) ##
`
`
Returns (Annualised) (%)
Since InceptionSIP
15 YearsSIP
10 YearsSIP
5 YearsSIP
3 YearsSIP
1 YearSIP
SIP Investments
Past performance may or may not be sustained in the future. # S&P BSE MIDSMALL CAP, ## S&P BSE SENSEX, Inception Date: September 30, 1994
Returns are calculated for Dividend Option. It is assumed that dividends declared under the scheme have been reinvested at the prevailing NAV.
SBI Magnum Global Fund FUND MANAGER -R. SRINIVASAN
15,30,000 N.A. 12,00,000 6,00,000 3,60,000 1,20,00049,97,484 N.A. 31,53,272 9,39,298 4,40,283 1,31,498
17.26 N.A. 18.38 17.99 13.54 18.3711.72 N.A. 11.44 14.37 12.24 20.2110.58 N.A. 9.62 10.69 8.38 17.36
Total Amount Invested ( )Mkt Value as on June 30, 2017 ( )
Benchmark Returns (Annualised) (%) #Additional Benchmark Returns (Annualised) (%) ##
`
`
Returns (Annualised) (%)
Since InceptionSIP
15 YearsSIP
10 YearsSIP
5 YearsSIP
3 YearsSIP
1 YearSIP
SIP Investments
Past performance may or may not be sustained in the future. # S&P BSE 500, ## S&P BSE SENSEX, Inception Date: October 11, 2004
Returns are calculated for Regular Growth
SBI Emerging Businesses Fund FUND MANAGER -R. SRINIVASAN
9,40,000 N.A. N.A. 6,00,000 3,60,000 1,20,00027,13,102 N.A. N.A. 13,45,183 5,11,995 1,39,292
26.47 N.A. N.A. 33.01 24.31 31.3415.00 N.A. N.A. 22.64 19.01 31.879.70 N.A. N.A. 10.69 8.38 17.36
Total Amount Invested ( )Mkt Value as on June 30, 2017 ( )
Benchmark Returns (Annualised) (%) #Additional Benchmark Returns (Annualised) (%) ##
`
`
Returns (Annualised) (%)
SIP Investments
Past performance may or may not be sustained in the future. # S&P BSE SMALL CAP, ## S&P BSE SENSEX, Inception Date: September 09, 2009
Returns are calculated for Regular Growth
SBI Small & Midcap Fund FUND MANAGER -R. SRINIVASAN
Since InceptionSIP
15 YearsSIP
10 YearsSIP
5 YearsSIP
3 YearsSIP
1 YearSIP
Since InceptionSIP
15 YearsSIP
10 YearsSIP
5 YearsSIP
3 YearsSIP
1 YearSIP
Since InceptionSIP
15 YearsSIP
10 YearsSIP
5 YearsSIP
3 YearsSIP
1 YearSIP

57
Statutory Details & Risk Factors
Mutual Fund investments are subject to market risks, read all scheme related documents carefully.
Disclaimer: In the preparation of the material contained in this document, the Asset Management Company (AMC) has used information that
is publicly available, including information developed in-house. Some of the material used in the document may have been obtained from
members/persons other than the AMC and/or its affiliates and which may have been made available to the AMC and/or to its affiliates.
Information gathered and material used in this document is believed to be from reliable sources. The AMC however does not warrant the
accuracy, reasonableness and / or completeness of any information. We have included statements / opinions / recommendations in this
document, which contain words, or phrases such as “will”, “expect”, “should”, “believe” and similar expressions or variations of such
expressions that are “forward looking statements”. Actual results may differ materially from those suggested by the forward looking
statements due to risk or uncertainties associated with our expectations with respect to, but not limited to, exposure to market risks, general
economic and political conditions in India and other countries globally, which have an impact on our services and / or investments, the
monetary and interest policies of India, inflation, deflation, unanticipated turbulence in interest rates, foreign exchange rates, equity prices
or other rates or prices etc.
The AMC (including its affiliates), the Mutual Fund, the trust and any of its officers, directors, personnel and employees, shall not be liable for
any loss, damage of any nature, including but not limited to direct, indirect, punitive, special, exemplary, consequential, as also any loss of
profit in any way arising from the use of this material in any manner. The recipient alone shall be fully responsible/are liable for any decision
taken on this material.
SBI Blue Chip Fund 1.97% 1.12%
SBI Magnum Balanced Fund 1.98% 1.20%
SBI Magnum Global Fund 2.05% 1.39%
SBI Magnum MidCap Fund 2.03% 1.17%
SBI Magnum Equity Fund 2.10% 1.53%
SBI Emerging Businesses Fund 2.11% 1.44%
SBI FMCG Fund 2.53% 1.79%
SBI Pharma Fund 2.28% 1.28%
SBI IT Fund 2.70% 2.15%
SBI Contra Fund 2.12% 1.61%
SBI Magnum Multi Cap Fund 2.07% 1.22%
SBI Magnum Multiplier Fund 2.11% 1.74%
SBI Nifty Index Fund 0.66% 0.27%
SBI Magnum Comma Fund 2.53% 1.99%
SBI PSU Fund 2.57% 2.20%
SBI Infrastructure Fund 2.42% 1.90%
SBI Arbitrage Opportunities Fund 0.91% 0.43%
SBI Small And Midcap Fund 2.38% 1.49%
SBI Dynamic Asset Allocation Fund 2.40% 2.03%
SBI Equity Savings Fund 2.05% 0.65%
SBI Banking And Financial Services Fund 2.51% 1.67%
SBI Gold Fund 0.52% 0.13%
SBI Magnum Tax Gain Scheme 2.00% 1.55%
SBI Ultra Short Term Debt Fund 0.42% 0.33%
SBI Short Term Debt Fund 0.90% 0.30%
SBI Magnum Monthly Income Plan 1.96% 1.36%
SBI Premier Liquid Fund 0.16% 0.10%
SBI Magnum Childrens Benefit Plan 2.45% 1.78%
SBI Magnum Income Fund 1.45% 0.60%
SBI Magnum Gilt Fund - Short Term 0.65% 0.35%
SBI Magnum Gilt Fund-long Term 0.93% 0.43%
SBI Magnum Monthly Income Plan Floater 2.31% 1.64%
SBI Savings Fund 1.17% 0.54%
SBI Dynamic Bond Fund 1.52% 0.90%
SBI Corporate Bond Fund 1.40% 0.70%
SBI Regular Savings Fund 1.20% 0.50%
SBI Magnum InstaCash Fund 0.21% 0.10%
SBI Magnum Instacash Fund-liquid Floater Plan 0.22% 0.10%
SBI Treasury Advantage Fund 0.80% 0.30%
Equity Schemes Reg -Plan Dir-Plan Debt Schemes Reg -Plan Dir-Plan
Note: Expense ratio excluding service tax on management fees and B15 Expenses.
Total Expense Ratios

58
SBI Magnum Monthly Income Plan - Monthly Dividend
28-Apr-17 0.0600 0.0600 15.4472
28-Apr-17 0.0600 0.0600 12.8108
26-May-17 0.0600 0.0600 15.5891
26-May-17 0.0600 0.0600 12.9093
30-Jun-17 0.0600 0.0600 15.7517
30-Jun-17 0.0600 0.0600 13.0228
Scheme Name Record Date Individual Corporate NAV(in Rs./Unit) (in Rs./Unit) ( )`
Direct Plan - Mthly Div
Regular Plan - Mthly Div
Direct Plan - Mthly Div
Regular Plan - Mthly Div
Regular Plan - Mthly Div
Direct Plan - Mthly Div
Face value: 10`
SBI Magnum Monthly Income Plan - Quarterly Dividend
Scheme Name Record Date Individual Corporate NAV(in Rs./Unit) (in Rs./Unit) ( )`
Regular Plan - Qtr Div
Direct Plan - Qtr Div
Regular Plan - Qtr Div
Direct Plan - Qtr Div
Regular Plan - Qtr Div
Direct Plan - Qtr Div
Face value: 10`
30-Dec-16 0.2000 0.2000 12.3062
30-Dec-16 0.2000 0.2000 13.3247
24-Mar-17 0.2000 0.2000 12.3726
24-Mar-17 0.2000 0.2000 13.4422
30-Jun-17 0.2400 0.2400 12.6299
30-Jun-17 0.2400 0.2400 13.7771
SBI Magnum Monthly Income Plan - Annual Dividend
20-Mar-15 1.2000 1.2000 13.1654
20-Mar-15 1.2000 1.2000 14.6305
23-Mar-16 0.7500 0.7500 13.1919
23-Mar-16 0.7500 0.7500 14.9221
24-Mar-17 0.8000 0.8000 14.2182
24-Mar-17 0.8000 0.8000 16.3740
Scheme Name Record Date Individual Corporate NAV(in Rs./Unit) (in Rs./Unit) ( )`
Regular Plan - Annual Div
Direct Plan - Annual Div
Regular Plan - Annual Div
Direct Plan - Annual Div
Regular Plan - Annual Div
Direct Plan - Annual Div
Face value: 10`
SBI Magnum Monthly Income Plan - Floater
28-Apr-17 0.0600 0.0600 12.3748
28-Apr-17 0.0600 0.0600 12.7390
31-May-17 0.0600 0.0600 12.3783
31-May-17 0.0600 0.0600 12.7555
30-Jun-17 0.0600 0.0600 12.3660
30-Jun-17 0.0600 0.0600 12.7549
Scheme Name Record Date Individual Corporate NAV(in Rs./Unit) (in Rs./Unit) ( )`
Reg. Plan - Monthly Div
Direct Plan - Monthly Div
Reg. Plan - Monthly Div
Direct Plan - Monthly Div
Reg. Plan - Monthly Div
Direct Plan - Monthly Div
Face value: 10`
SBI Magnum Monthly Income Plan -Floater - Quarterly Dividend
30-Dec-16 0.2000 0.2000 12.3490
30-Dec-16 0.2000 0.2000 13.3076
24-Mar-17 0.2000 0.2000 12.5025
24-Mar-17 0.2000 0.2000 13.5214
30-Jun-17 0.2300 0.2300 12.5164
30-Jun-17 0.2300 0.2300 13.5898
Scheme Name Record Date Individual Corporate NAV(in Rs./Unit) (in Rs./Unit) ( )`
Regular Plan - Qtr Div
Direct Plan - Qtr Div
Regular Plan - Qtr Div
Direct Plan - Qtr Div
Regular Plan - Qtr Div
Direct Plan - Qtr Div
Face value: 10`
Pursuant to payment of dividend, the NAV of Dividend Option of schemes/plans would fall to the extent of payout and statutory levy, if applicable.Existing plans under the scheme are named Regular w.e.f. 01/01/2013
SBI Magnum Monthly Income Plan - Floater - Annual Dividend
20-Mar-15 1.2000 1.2000 13.9524
20-Mar-15 1.2000 1.2000 14.0803
23-Mar-16 0.7500 0.7500 14.2490
23-Mar-16 0.7500 0.7500 14.5438
24-Mar-17 0.8000 0.8000 15.0660
24-Mar-17 0.8000 0.8000 15.5711
Scheme Name Record Date Individual Corporate NAV(in Rs./Unit) (in Rs./Unit) ( )`
Regular Plan - Annual Div
Direct Plan - Annual Div
Regular Plan - Annual Div
Direct Plan - Annual Div
Regular Plan - Annual Div
Direct Plan - Annual Div
Face value: 10`
SBI Magnum Gilt Fund - Long Term Plan Dividend -PF Fixed 1 Year - Quarterly Dividend
30-Jun-16 0.2000 0.2000 12.3566
30-Sep-16 0.2000 0.2000 12.9517
30-Dec-16 0.2000 0.2000 13.3213
24-Mar-17 0.1500 0.1500 13.2200
30-Jun-17 0.2500 0.2500 13.5654
Scheme Name Record Date Individual Corporate NAV(in Rs./Unit) (in Rs./Unit) ( )`
Dividend - PF Fixed 1 Year
Dividend - PF Fixed 1 Year
Dividend - PF Fixed 1 Year
Dividend - PF Fixed 1 Year
Dividend - PF Fixed 1 Year
Face value: 10`
30-Jun-16 0.2000 0.2000 12.4829
30-Sep-16 0.2000 0.2000 13.0861
30-Dec-16 0.2000 0.2000 13.4616
24-Mar-17 0.1500 0.1500 13.3607
30-Jun-17 0.2500 0.2500 13.7125
Scheme Name Record Date Individual Corporate NAV(in Rs./Unit) (in Rs./Unit) ( )`
Div-PF Fixed 2 Years
Div-PF Fixed 2 Years
Div-PF Fixed 2 Years
Div-PF Fixed 2 Years
Div-PF Fixed 2 Years
SBI Magnum Gilt Fund - Long Term Plan Dividend -PF Fixed 2 Years - Quarterly Dividend
Face value: 10`
SBI Magnum Gilt Fund - -PF Fixed 3 Years -
Long Term Plan DividendQuarterly Dividend
30-Jun-16 0.2000 0.2000 12.1625
30-Sep-16 0.2000 0.2000 12.7452
30-Dec-16 0.2000 0.2000 13.1057
24-Mar-17 0.1500 0.1500 13.0035
30-Jun-17 0.2500 0.2500 13.3392
Scheme Name Record Date Individual Corporate NAV(in Rs./Unit) (in Rs./Unit) ( )`
Div-PF Fixed 3 Years
Div-PF Fixed 3 Years
Div-PF Fixed 3 Years
Div-PF Fixed 3 Years
Div-PF Fixed 3 Years
Face value: 10`
30-Jun-16 0.2000 0.2000 12.8364
30-Sep-16 0.2000 0.2000 13.4624
30-Dec-16 0.2000 0.2000 13.8549
24-Mar-17 0.1500 0.1500 13.7555
30-Jun-17 0.2500 0.2500 14.1250
Scheme Name Record Date Individual Corporate NAV(in Rs./Unit) (in Rs./Unit) ( )`
Dividend - PF Regular
Dividend - PF Regular
Dividend - PF Regular
Dividend - PF Regular
Dividend - PF Regular
SBI Magnum Gilt Fund - -Long Term Plan DividendQuarterly Dividend
Face value: 10`
Dividend History Of Debt & Hybrid Funds

59Pursuant to payment of dividend, the NAV of Dividend Option of schemes/plans would fall to the extent of payout and statutory levy, if applicable.Existing plans under the scheme are named Regular w.e.f. 01/01/2013
SBI Magnum Income Fund - Quarterly Dividend
30-Dec-16 0.2000 0.2000 13.2764
30-Dec-16 0.2000 0.2000 13.8113
24-Mar-17 0.1500 0.1500 13.2234
24-Mar-17 0.1500 0.1500 13.7774
30-Jun-17 0.2500 0.2500 13.4618
30-Jun-17 0.2500 0.2500 14.0721
Scheme Name Record Date Individual Corporate NAV(in Rs./Unit) (in Rs./Unit) ( )`
Regular Plan - Dividend
Direct Plan - Dividend
Regular Plan - Dividend
Direct Plan - Dividend
Regular Plan - Dividend
Direct Plan - Dividend
Face value: 10`
SBI Magnum Income Fund - Half Yearly Dividend
24-Sep-15 0.3000 0.3000 11.6262
24-Sep-15 0.3000 0.3000 12.4809
23-Mar-16 0.3000 0.3000 11.6745
23-Mar-16 0.3000 0.3000 12.6225
30-Sep-16 0.4000 0.4000 12.1855
30-Sep-16 0.4000 0.4000 13.2601
24-Mar-17 0.3000 0.3000 12.3751
24-Mar-17 0.3000 0.3000 13.5272
Scheme Name Record Date Individual Corporate NAV(in Rs./Unit) (in Rs./Unit) ( )`
Regular Plan - Dividend
Direct Plan - Dividend
Regular Plan - Dividend
Direct Plan - Dividend
Regular Plan - Dividend
Direct Plan - Dividend
Regular Plan - Dividend
Direct Plan - Dividend
Face value: 10`
30-Dec-16 0.2000 0.2000 12.7074
30-Dec-16 0.2000 0.2000 13.7164
24-Mar-17 0.1500 0.1500 12.6235
24-Mar-17 0.1500 0.1500 13.6554
30-Jun-17 0.2400 0.2400 12.8565
30-Jun-17 0.2400 0.2400 13.9538
Scheme Name Record Date Individual Corporate NAV(in Rs./Unit) (in Rs./Unit) ( )`
Regular Plan - Dividend
Direct Plan - Dividend
Regular Plan - Dividend
Direct Plan - Dividend
Regular Plan - Dividend
Direct Plan - Dividend
SBI Dynamic Bond Fund - Quarterly Dividend
Face value: 10`
SBI Regular Savings Fund - Quarterly Dividend
30-Sep-16 0.2000 0.2000 12.5732
30-Sep-16 0.2000 0.2000 12.8614
30-Dec-16 0.2000 0.2000 12.7909
30-Dec-16 0.2000 0.2000 13.1143
24-Mar-17 0.2000 0.2000 12.8424
24-Mar-17 0.2000 0.2000 13.1912
30-Jun-17 0.2400 0.2400 13.0286
30-Jun-17 0.2400 0.2400 13.4166
Scheme Name Record Date Individual Corporate NAV(in Rs./Unit) (in Rs./Unit) ( )`
Regular Plan - Dividend
Direct Plan - Dividend
Regular Plan - Dividend
Direct Plan - Dividend
Regular Plan - Dividend
Direct Plan - Dividend
Regular Plan - Dividend
Direct Plan - Dividend
Face value: 10`
SBI Short Term Debt Fund
28-Apr-17 0.0600 0.0600 12.3157
28-Apr-17 0.0600 0.0600 12.0139
31-May-17 0.0600 0.0600 12.3502
31-May-17 0.0600 0.0600 12.0395
30-Jun-17 0.0600 0.0600 12.3940
30-Jun-17 0.0600 0.0600 12.0745
Scheme Name Record Date Individual Corporate NAV(in Rs./Unit) (in Rs./Unit) ( )`
Direct Plan - Monthly Div
Regular Plan - Monthly Div
Direct Plan - Monthly Div
Regular Plan - Monthly Div
Direct Plan - Monthly Div
Regular Plan - Monthly Div
Face value: 10`
SBI Short Term Debt Fund - Retail Plan
30-Dec-16 0.0600 0.0600 11.3877
31-Jan-17 0.0600 0.0600 11.4250
28-Feb-17 0.0600 0.0600 11.3634
31-Mar-17 0.0600 0.0600 11.3752
28-Apr-17 0.0600 0.0600 11.3564
31-May-17 0.0600 0.0600 11.3773
30-Jun-17 0.0600 0.0600 11.4071
Scheme Name Record Date Individual Corporate NAV(in Rs./Unit) (in Rs./Unit) ( )`
Monthly Dividend
Monthly Dividend
Monthly Dividend
Monthly Dividend
Monthly Dividend
Monthly Dividend
Monthly Dividend
Face value: 10`
SBI Magnum Gilt Fund - Long Term Plan - Quarterly Dividend
Scheme Name Record Date Individual Corporate NAV(in Rs./Unit) (in Rs./Unit) ( )`
30-Dec-16 0.2000 0.2000 13.6945
30-Dec-16 0.2000 0.2000 14.3216
24-Mar-17 0.1500 0.1500 13.5944
24-Mar-17 0.1500 0.1500 14.2340
30-Jun-17 0.2500 0.2500 13.9567
30-Jun-17 0.2500 0.2500 14.6444
Face value: 10`
Regular Plan - Dividend
Direct Plan - Dividend
Regular Plan - Dividend
Direct Plan - Dividend
Regular Plan - Dividend
Direct Plan - Dividend
30-Sep-16 0.2000 0.2000 13.6747
30-Sep-16 0.2000 0.2000 14.2283
30-Dec-16 0.2000 0.2000 13.7486
30-Dec-16 0.2000 0.2000 14.3389
24-Mar-17 0.2000 0.2000 13.7772
24-Mar-17 0.2000 0.2000 14.3998
30-Jun-17 0.2500 0.2500 13.8655
30-Jun-17 0.2500 0.2500 14.5355
Scheme Name Record Date Individual Corporate NAV(in Rs./Unit) (in Rs./Unit) ( )`
Regular Plan - Dividend
Direct Plan - Dividend
Regular Plan - Dividend
Direct Plan - Dividend
Regular Plan - Dividend
Direct Plan - Dividend
Regular Plan - Dividend
Direct Plan - Dividend
SBI Corporate Bond Fund - Quarterly Dividend#
(#SBI MIF - Floating Rate Plan - LTP restructured as SBI Corporate Bond Fund)
Face value: 10`
Dividend History Of Debt & Hybrid Funds

60Pursuant to payment of dividend, the NAV of Dividend Option of schemes/plans would fall to the extent of payout and statutory levy, if applicable.Existing plans under the scheme are named Regular w.e.f. 01/01/2013
31-Mar-17 6.0000 6.0000 1081.4672
28-Apr-17 6.0000 6.0000 1077.8119
28-Apr-17 6.0000 6.0000 1081.5210
31-May-17 6.0000 6.0000 1078.2365
31-May-17 6.0000 6.0000 1082.0673
30-Jun-17 6.0000 6.0000 1078.5036
30-Jun-17 6.0000 6.0000 1082.4356
Scheme Name Record Date Individual Corporate NAV(in Rs./Unit) (in Rs./Unit) ( )`
Direct Plan - Mthly Div
Regular Plan - Mthly Div
Direct Plan - Mthly Div
Regular Plan - Mthly Div
Direct Plan - Mthly Div
Mthly Div
Mthly Div
Regular Plan -
Direct Plan -
SBI Ultra Short Term Debt Fund
Face value: 1000`
SBI Ultra Short Term Debt Fund - Retail Plan
31-Jul-14 6.5000 6.5000 1047.1081
31-Jul-14 6.5000 6.5000 1047.4407
30-May-14 6.0000 6.0000 1045.1610
30-May-14 6.0000 6.0000 1045.3861
30-Jun-14 6.3000 6.3000 1046.5158
30-Jun-14 6.3000 6.3000 1046.7751
Scheme Name Record Date Individual Corporate NAV(in Rs./Unit) (in Rs./Unit) ( )`
Retail Plan
Retail Plan - Dir - Mthly Div
Retail Plan
Retail Plan - Dir - Mthly Div
Retail Plan
Retail Plan - Dir - Mthly Div
Face value: 1000`
SBI Ultra Short Term Debt Fund - Institutional Plan
31-Oct-12 8.0486 8.0486 1065.0685
30-Nov-12 7.1638 7.1638 1065.0685
31-Dec-12 7.5144 7.5144 1065.0685
31-Jan-13 7.5715 7.5715 1065.0685
28-Feb-13 6.1130 6.1130 1065.0685
26-Mar-13 7.5986 7.5986 1065.0685
30-Apr-13 9.7772 9.7772 1065.0685
31-May-13 7.2888 7.2888 1065.0685
Scheme Name Record Date Individual Corporate NAV(in Rs./Unit) (in Rs./Unit) ( )`
Institutional Plan - Mthly Div
Institutional Plan - Mthly Div
Institutional Plan - Mthly Div
Institutional Plan - Mthly Div
Institutional Plan - Mthly Div
Institutional Plan - Mthly Div
Institutional Plan - Mthly Div
Institutional Plan - Mthly Div
Face value: 1000`
SBI Treasury Advantage Fund - Monthly Dividend
31-Mar-17 6.0000 6.0000 1032.2515
31-Mar-17 6.0000 6.0000 1044.8174
28-Apr-17 6.0000 6.0000 1031.6954
28-Apr-17 6.0000 6.0000 1044.7528
31-May-17 6.0000 6.0000 1031.8899
31-May-17 6.0000 6.0000 1045.5013
30-Jun-17 6.0000 6.0000 1032.0389
30-Jun-17 6.0000 6.0000 1046.1643
Scheme Name Record Date Individual Corporate NAV(in Rs./Unit) (in Rs./Unit) ( )`
Regular Plan - Mthly Div
Direct Plan - Mthly Div
Regular Plan - Mthly Div
Direct Plan - Mthly Div
Regular Plan - Mthly Div
Direct Plan - Mthly Div
Regular Plan - Mthly Div
Direct Plan - Mthly Div
Face value: 1000`
SBI Magnum Gilt Fund Short Term
31-Mar-17 0.0600 0.0600 12.8823
28-Apr-17 0.0600 0.0600 12.9951
28-Apr-17 0.0600 0.0600 12.8538
31-May-17 0.0600 0.0600 13.0587
31-May-17 0.0600 0.0600 12.9134
30-Jun-17 0.0600 0.0600 13.1207
30-Jun-17 0.0600 0.0600 12.9709
Scheme Name Record Date Individual Corporate NAV(in Rs./Unit) (in Rs./Unit) ( )`
Regular Plan - Dividend
Direct Plan - Dividend
Regular Plan - Dividend
Direct Plan - Dividend
Regular Plan - Dividend
Direct Plan - Dividend
Regular Plan - Dividend
Face value: 10`
SBI Savings Fund (Previously known as SBI Magnum Income Fund –Floating Rate Plan – Savings Plus Bond Plan)
31-Mar-17 0.0600 0.0600 11.8464
28-Apr-17 0.0600 0.0600 11.5644
28-Apr-17 0.0600 0.0600 11.8497
31-May-17 0.0600 0.0600 11.5720
31-May-17 0.0600 0.0600 11.8665
30-Jun-17 0.0600 0.0600 11.5809
30-Jun-17 0.0600 0.0600 11.8826
Scheme Name Record Date Individual Corporate NAV(in Rs./Unit) (in Rs./Unit) ( )`
Direct Plan - Dividend
Regular Plan - Dividend
Direct Plan - Dividend
Regular Plan - Dividend
Direct Plan - Dividend
Regular Plan - Dividend
Direct Plan - Dividend
Face value: 10`
Dividend History Of Debt & Hybrid Funds

61
Disclaimer for data from CRISIL'S FUND ANALYSER:
Disclaimer:
Disclaimer of SBI Nifty Index Fund:
Mutual Fund Investments are subject to market risks, read all scheme related documents carefully.
Asset Management Company:
Trustee Company:
Registered Office:
CRISIL has taken due care and caution in compilation of the
Data contained in the CRISIL'S FUNDANALYSER. The Data in the CRISIL'S FUNDANALYSER has been obtained by
CRISIL from sources, which it considers reliable. However, CRISIL does not guarantee the accuracy, adequacy or
completeness of any Data in the CRISIL'S FUND ANALYSER and is not responsible for any errors or omissions or for
the results obtained from the use of such Data. CRISIL especially states that it has no financial liability whatsoever to
the users of CRISIL'S FUND ANALYSER. CRISIL or any of its directors/ employees/ representatives does not accept
any liability for any direct or consequential loss arising from the use of the Data contained in the CRISIL'S FUND
ANALYSER or any data generated from the CRISIL'S FUNDANALYSER.
This investment update is for information purpose only and is not an offer to sell or a solicitation to buy any
mutual fund units/securities. These views alone are not sufficient and should not be used for the development or
implementation of an investment strategy. It should not be construed as investment advice to any party.All opinions and
estimates included in this schemes guide constitute our view as of this date and are subject to change without notice.
Neither SBI Funds Management Private Limited, nor any person connected with it, accepts any liability arising from the
use of this information. The recipient of this material should rely on their own investigations and take professional
advice on their own.
In the preparation of the material contained in this document, the AMC has used information that is publicly available,
including information developed in-house. Information gathered and material used in this document is believed to be
from reliable sources published by third parties. While such publications are believed to be reliable, however, neither
theAMC, its officers, the trustees, the Fund nor any of their affiliates or representatives assume any responsibility of the
accuracy, reasonableness and/or completeness of any information. For data referred to of any third party in this
material no such party will assume any liability for the same. Further, all opinion included in this newsletter are as of date
and are subject to change without any notice.All recipients of this material should seek appropriate professional advice
and carefully read the scheme information document/ statement of additional information and before dealing and or
transacting in any of the products referred to in this material make their own investigation.The Fund, the AMC and
Trustees and any of its directors, officers, employees and other personnel shall not liable for any loss, damage of any
nature, including but not limited to direct, indirect, punitive, special, exemplary, consequential, as also any loss of profit
in any way arising from the use of this material in any manner whatsoever. The recipient alone shall be fully
responsible/are liable for any decision taken on the basis of this material.
“The “SBI Nifty Index Fund” offered by “SBI Funds Management Private Limited”
is not sponsored, endorsed, sold or promoted by India Index Services & Products Limited (IISL) and its affiliates. IISLdo
not make any representation or warranty, express or implied (including warranties of merchantability or fitness for
particular purpose or use) and disclaims all liability to the owners of “SBI Nifty Index Fund” or any member of the public
regarding the advisability of investing in securities generally or in the “SBI Nifty Index Fund” linked to Nifty 50 Index or
particularly in the ability of the Nifty 50 Index to track general stock market performance in India. Please read the full
Disclaimers in relation to the Nifty 50 Index in the Scheme Information Document.”
SBI Funds Management Private Limited (A joint venture between SBI & AMUNDI)
CIN: U65990MH1992PTC065289. SBI Mutual Fund Trustee Company Private Limited
9th Floor, Crescenzo, C-38 & 39, G Block, Bandra-Kurla Complex,
Bandra (East), Mumbai 400 051. Tel.: 022-61793000 E-mail : [email protected] • www. sbimf.com
CIN:
U65991MH2003PTC138496.
Disclaimer

62
NORTH
SOUTH
EAST
WEST
Chandigarh: 0172-2703380 • Gurgaon: 0124-4200828/ 0124-4083769 • Jaipur: 0141-2740061/2740023• Kanpur: 0512-6900314/15 • Lucknow: 0522-2286742 • Ludhiana: 0161-2449849 • New Delhi: (011) 23466666Aligarh: 0571-2402017 • Ambala: (0171) 2653400 • Bathinda: (0164) 2218415 • Dehradun: 0135-2651719• Dhanbad: 0326-2301545 • Dharamshala: 01892-225814 • Faizabad: 919999029351/ 919811607620• Faridabad: 0129 - 4030661 • Ferozepur: 01632-236167 • Ghaziabad: 0120-2797582 Gorakhpur:0551-2203378 • Haldwani: 0594-6220526 • Hissar: 01662 238415 Hosiharpur: 0188-2228415 • Jabalpur:0761-2410042 • Jalandhar: 0181-2238415 • Jammu: 0191-2474975 • Jhansi: 0510-2330298 • Jodhpur:0291-2611929/ 28 • Leh: 09469468778 • Meerut: 0121-2667877 • Moradabad: 0591-2411411 • Panchakula:9592008415 • Panipat: 0180-2648415 • Pathankot: 8872008415 • Patiala: 0175-2300058 • Rohtak:(0126) 2258415 • Saharanpur: 0132-2720789 • Shimla: 0177-2807608 • Sonepat: 011- 23466666 • Udaipur: -• Varanasi: 0542-2222492 • Nehru Place (Delhi): (011) 26224606 • Noida: 0120-4232214 • Pitam Pura (Delhi):(011) 23751974
Bangalore: 080-25580014/51 • Chennai : 044 2854 3382/83 • Coimbatore: 0422 - 2541666 • Ernakulam:0484-2323489 2318886 • Hyderabad: 040-69000541/42 • Thrivanthapuram: 0471-4011590 / 4011591 / 4011592• Vijayawada: 0866-2436113/2438217 Bareilly: 7830111140 • Belgaum: 0831-2422463 • Bellary: 0839-2271775• Calicut: 0495-2768270/4020079 • Cuttack: 0671-2422792 • Davangere: 08192-231463
• Guntur: 0863-2211022 • Hubli: 0836-2368477 • Kannur: 0497-2708180 • Kollam: 0474-2752760• Kottayam: 0481-2570816 • Kurnool: 08518-227776 • Madurai: 0452 4374242 • Mangalore: 0824-2222463• Mysore: 0821-2424919 • Nellore: 0861-2338688 • Pondichery: 9445196934 • Rajahmundry:0883-2434002/2432306 • Salem: 0427 - 4552289 • Shimoga: 08182-222463 • Thiruchirapalli: 0431-4000667• Thrissur: 8129354324 • Thrissur: 0487-2445700 • Tinsukia: - • Tirunelveli: 0462 4220023 • Tirupati(0877)6450828 • Vellore: 0416- 2225005 • Vishakapatnam: 0891-3293018/2511853 • Warangal: 0870-2430307
Bhubaneshwar: (0674) 2392401/501 • Guwahati: 0361-2463747/2130366 • Kolkata: 22882342 / 22883767 /22883768 • Patna: 0612-3242047 • Raipur: (0771) 2543355 / 4263256 • Ranchi:0651-2213212/3205026 Agartala: 0381-2384107 • Asansol: 8170037270 • Balasore: 0678-2262646• Bhagalpur: 0641-2420661 • Bhilai: 0788-6940012/6940011-6940010/6940014/6940013 • Bokaro: 9304823011• Bokaro: 06542-232561 • Burdwan: 8335844461 • Darbhanga: 06272-245004 • Dimapur: 0386-2224267• Durgapur: 2544191 / 192 • Gaya: 0631-2222405 • Hazaribagh: 06546-270415 • Imphal: 0386-2224267• Itanagar: 0360-2292416 • Jamshedpur: 0657-2440446 • Jorhat: 0367-2304396 • Kalyani: 033-25827700• Kharagpur: (03222) 225592 • Malda: (03512)266128 • Port Blair: (03192)235552 • Rourkela: 0661-2400299• Sambalpur: 0663-2410001 • Shillong: 9436704232 • Silchar: 0384-2221109 • Siliguri: (0353) 2537065• Sriganganagar: 9829067384
Ahmedabad: 079-26423060/70; 26463090 • Bhopal: 0755-2557341 • Goa: (0832) 2235283 / 6642475 • Indore:0731-2541141/6900080/85 • Mumbai: (022) 66532800 • Nagpur: 0712 - 6458368 • Pune: 020 25670961/25671524/ 25653398 / 99 • Surat: 0261-3994800/6646555/2462764 • Vadodara: 0265-2323010 Agra: 0562-2850239 • Ajmer: 0145-2426284 • Allahabad: 0532-2261028 • Alwar: (0144) 2332035 • Amravati: - • Amritsar:0183-2221755 • Anand: 02692-246210 • Aurangabad: 0240 3244781 • Bavnagar: (0278) 2523788 • Bharuch:02642-247550 • Bhilwara: 01482-240144 • Bhuj: (02832) 250900 • Bilaspur: 07752-415300 • Gandhidham:02836-233615 • Gwalior: 0751-2447272 • Jalgaon: 9545025850 • Jamnagar: (0288) 2660104 • Junagadh: 0285-2670350 • Kolhapur: 0231 2680880 • Korba: 07759-230082 • Kota: 0744 – 2390631 • Margao: 0832-6578283• Mehsana: 02762-233872 • Nadiad: 0268-2560110 • Nashik: 0253 - 6575888, 2232553 • Navsari: 02637-242266• Raipur: (0771) 2543355 / 4263256 • Rajkot: 0281-2466740/41 • Ratlam: 07412-409492 • Sagar: 07582-241367• Solapur: 09226389292 • Srinagar: 0194-2474864 • Valsad: 02632-245440 • Vapi: 0260-2400480 • Borivali(Mumbai): 022-28927551 • Chinchwad: 020 27355721 • Kalyan: (0251) 2311850 / 2311980 • Thane:022-25414594 • Vashi: 022-27810368
•
• Gulbarga:9980872463
• Muzzaffarpur: 9473199059
•
SBI Funds Management Pvt Ltd Branches

63
Fund Manager :
Application Amount for Fresh Subscription :
Minimum Additional Amount :
Yield to Maturity :
SIP :
NAV :
Benchmark :
Entry Load :
Note:
Exit Load :
Modified Duration :
Standard Deviation :
Sharpe Ratio :
Beta :
AUM :
Holdings :
Nature of Scheme :
Rating Profile :
Tracking Error :
An employee of the asset management company such as a mutual fund or life insurer, who manages
investments of the scheme. He is usually part of a larger team of fund managers and research analysts.
This is the minimum investment amount for a new investor in a mutual fund
scheme.
This is the minimum investment amount for an existing investor in a mutual fund scheme.
The Yield to Maturity or the YTM is the rate of return anticipated on a bond if held until maturity. YTM is
expressed as an annual rate. The YTM factors in the bond's current market price, par value, coupon interest rate and time to
maturity.
SIP or systematic investment plan works on the principle of making periodic investments of a fixed sum. It works similar
to a recurring bank deposit. For instance, an investor may opt for an SIP that invests Rs 500 every 15th of the month in an
equity fund for a period of three years.
The NAV or the net asset value is the total asset value per unit of the mutual fund after deducting all related and
permissible expenses. The NAV is calculated at the end of every business day. It is the value at which the investor enters or
exits the mutual fund.
A group of securities, usually a market index, whose performance is used as a standard or benchmark to
measure investment performance of mutual funds, among other investments. Some typical benchmarks include the Nifty 50,
S&P BSE Sensex, BSE 200, BSE 500, 10-Year Gsec.
A mutual fund may have a sales charge or load at the time of entry and/or exit to compensate the
distributor/agent. Entry load is charged at the time an investor purchases the units of a mutual fund. The entry load is added to
the prevailing NAV at the time of investment. For instance, if the NAV is Rs. 100 and the entry load is 1%, the investor will enter
the fund at Rs 101.
SEBI, vide circular dated June 30, 2009 has abolished entry load and mandated that the upfront commission to
distributors will be paid by the investor directly to the distributor, based on his assessment of various factors including the
service rendered by the distributor
Exit load is charged at the time an investor redeems the units of a mutual fund. The exit load is deducted from the
prevailing NAV at the time of redemption. For instance, if the NAV is Rs 100 and the exit load is 1%, the redemption price would
be Rs 99 Per Unit.
Modified duration is the price sensitivity and the percentage change in price for a unit change in yield
Standard deviation is a statistical measure of the range of an investment's performance. When a mutual
fund has a high standard deviation, its means its range of performance is wide, implying greater volatility.
The Sharpe Ratio, named after its founder, the Nobel Laureate William Sharpe, is a measure of risk-adjusted
returns. It is calculated using standard deviation and excess return to determine reward per unit of risk.
Beta is a measure of an investment's volatility vis-à-vis the market. Beta of less than 1 means that the security will be
less volatile than the market. A beta of greater than 1 implies that the security's price will be more volatile than the market.
AUM or assets under management refers to the recent / updated cumulative market value of investments managed by a
mutual fund or any investment firm.
The holdings or the portfolio is a mutual fund's latest or updated reported statement of investments/securities.
These are usually displayed in terms of percentage to net assets or the rupee value or both. The objective is to give investors an
idea of where their money is being invested by the fund manager.
The investment objective and underlying investments determine the nature of the mutual fund scheme.
For instance, a mutual fund that aims at generating capital appreciation by investing in stock markets is an equity fund or
growth fund. Likewise, a mutual fund that aims at capital preservation by investing in debt markets is a debt fund or income
fund. Each of these categories may have sub-categories.
Mutual funds invest in securities after evaluating their creditworthiness as disclosed by the ratings. A
depiction of the mutual fund in various investments based on their ratings becomes the rating profile of the fund. Typically,
this is a feature of debt funds.
Measure that indicates how closely the portfolio return tracks the benchmark return. Tracking error is the
standard deviation of the difference of returns between a portfolio and the benchmark over a specified holding period.
S&P S&P
How to read the Factsheet?