Short-term modulation of Indian summer monsoon … 1 Short-term modulation of Indian summer monsoon...
28
1 Short-term modulation of Indian summer monsoon rainfall by 1 West Asian dust 2 3 4 V Vinoj 1,2 , Philip J Rasch 1* , Hailong Wang 1 , Jin-Ho Yoon 1 , Po-Lun Ma 1 , Kiranmayi 5 Landu 1 and Balwinder Singh 1 6 7 1 Atmospheric Sciences and Global Change Division 8 Pacific Northwest National Laboratory 9 Richland, WA - 99352, USA 10 11 2 School of Earth, Ocean and Climate Sciences 12 Indian Institute of Technology Bhubaneswar 13 Odisha, INDIA 14 15 Email correspondence to [email protected] * 16 17 18
Transcript of Short-term modulation of Indian summer monsoon … 1 Short-term modulation of Indian summer monsoon...
1
Short-term modulation of Indian summer monsoon rainfall by 1
West Asian dust 2
3
4 V Vinoj1,2, Philip J Rasch1*, Hailong Wang1, Jin-Ho Yoon1, Po-Lun Ma1, Kiranmayi 5
Landu1 and Balwinder Singh1 6 7
1 Atmospheric Sciences and Global Change Division 8
Pacific Northwest National Laboratory 9
Richland, WA - 99352, USA 10
11 2 School of Earth, Ocean and Climate Sciences 12
Indian Institute of Technology Bhubaneswar 13
Odisha, INDIA 14
15
Email correspondence to [email protected]* 16
17
18
2
Abstract 19
The Indian summer monsoon results from a complex interplay between radiative heating, 20
dynamics, and cloud-aerosol interactions. Despite increased scientific attention, the effect 21
of aerosols on monsoons still remains uncertain. Previous studies (using observational 22
and modeling approaches) have focused primarily on local climate effects on seasonal 23
timescales, but shorter-term and non-local links have not previously been explored or 24
identified. Here we present observational evidence and numerical modeling results to 25
demonstrate a link between aerosols over the Arabian Sea and West Asia and Indian 26
summer monsoon rainfall. Simulations using a state-of-the-art global climate model 27
support this remote link and indicate that variability in dust aerosol loadings influence 28
radiative heating rates that can induce larger scale circulation changes, modulating 29
moisture transport and convergence over Central India, and change monsoon rainfall on 30
relatively short time scales (about a week). Our simulations suggest that dust induced 31
solar heating over North Africa and West Asia increases low-level winds over the 32
Arabian Sea changing the moisture flowing into India. Our findings highlight the 33
importance of natural aerosols in influencing the strength of the Indian summer monsoon, 34
motivating additional research in how changes in background aerosols of natural origin 35
may be influencing monsoon precipitation. 36
37
38
39
40
Key Words: Dust, sea-salt, natural aerosol, Indian monsoon, climate change 41
3
1. Introduction 42
The inter-annual variability of the Indian summer monsoon rainfall is only about 10% 43
of the long term mean 1,2; but these relatively small variations have important impacts on 44
mankind and natural systems in India. A number of factors contribute to this variability, 45
including aerosols that act directly (via solar radiation) and indirectly (through cloud 46
microphysics) in influencing/modulating the monsoon strength. The role of aerosols in 47
modulating monsoon rainfall over India has gained increased scientific attention in the 48
recent past3-12. 49
Many recent studies have focused on anthropogenic and/or biomass burning aerosol 50
influences3,7,11-13. However, the high winds over Arabian Sea associated with the 51
monsoon not only act as a conduit for moisture from oceans, but also act as a source and 52
conduit of natural aerosols of marine (sea-salt) and continental (dust, mobilized by 53
Shamal winds over Arabia) origins that depend on both wind speed and direction 14-16. 54
These natural aerosols dominate the aerosol mass loading over the Arabian Sea and as we 55
show below, likely influence the monsoon precipitation on short time scales. 56
Observational studies exploring pre-monsoon (April/May) aerosol loading and its 57
effect on monsoon precipitation have found that maxima in aerosols lead precipitation6,17-58
19 by a month or more. There is observational evidence for an elevated heat pump 6 59
(EHP) associated with a warming by dust and black carbon aerosol layers, that 60
accumulates in the southern foothills of the Himalayas during the pre-monsoon period. 61
The hypothesis is that this elevated heat source can advance the monsoon circulation and 62
also strengthen rainfall during subsequent months, which has been a subject of scientific 63
debate 18. It has been challenging to obtain concomitant measurements of both aerosols 64
4
and precipitation at such large spatial scales (due to limitations in measurements and also 65
their interactive nature) to explore aerosol/rainfall interactions 20, and we know of no 66
existing observational studies that have used concomitant aerosol and precipitation 67
measurements on seasonal and shorter timescales. Aerosols can influence monsoons on 68
multiple timescales: aerosol absorption and scattering can influence heating rates and 69
stability in the atmospheric column and drive a relatively rapid monsoon response, but 70
the reduction in sunlight reaching the surface can also affect the monsoon more slowly. 71
The higher heat capacity of the surface leads to slower response in sea surface 72
temperatures over the northern Indian Ocean producing a reduction of north-south 73
temperature gradient with very important impacts on the monsoon11,21. Many climate 74
modeling studies have focused on aerosol–monsoon precipitation interactions3-8,10,11; 75
however, most of those concentrated on the slower forcing and response and the impact 76
of changes in anthropogenic aerosol emissions. Only a few studies have focused 77
specifically on natural aerosols 5 or variations that occur on the faster sub-seasonal time 78
scales. 79
In this paper we present evidence for the existence of a positive relationship between 80
natural (mostly dust) aerosol and monsoon precipitation using temporally collocated but 81
spatially separated satellite based aerosol and precipitation fields. The fields are 82
correlated at short timescales (within a week). This observational relationship is also 83
reproduced in simulations using an atmospheric global climate model (AGCM), which 84
further suggest that dust aerosols over the North Africa, West Asia and Arabian region 85
(operating through the fast forcing and response mechanism described above) modulate 86
the summer monsoon precipitation over India. 87
5
88
2. Aerosol-Monsoon Precipitation Relationships 89
We analyze anomalies (relative to monthly means) of weekly precipitation over 90
central India (averaged over 16.5-26.5oN, 74.5-86.6oE box shown in Fig. 1a selected to 91
be similar to an All India Rainfall index used in reference 22) and weekly aerosol optical 92
depth (AOD) at each grid cell over the domain covering the Indian sub-continent during 93
the monsoon season (June to August). We use the global precipitation climatology 94
project (GPCP) estimate for precipitation and AOD retrievals from the MODerate 95
resolution Imaging Spectroradiometer (MODIS) and Multi-angle Imaging 96
Spectroradiometer (MISR) (more details on the observational data, model and 97
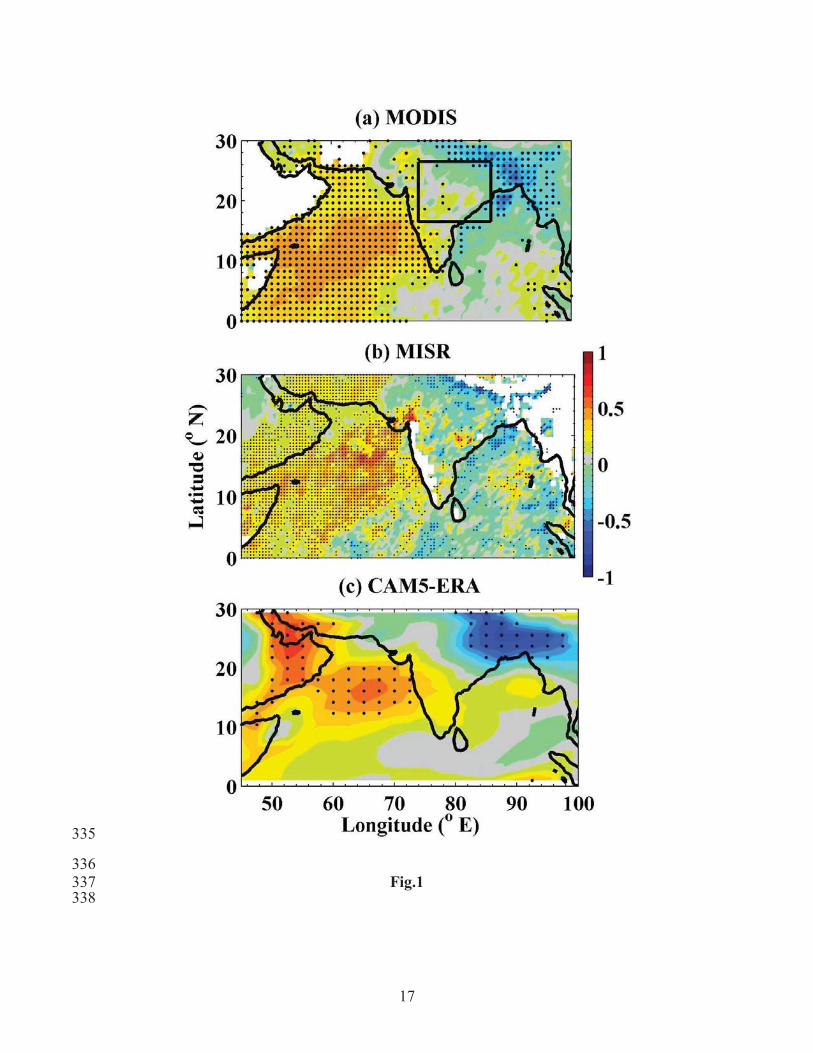
methodology are provided in the supplementary materials). Figs. 1a and 1b show the 98
correlation coefficient between Central India monsoon precipitation and AOD at each 99
grid point over the Indian sub-continent based on satellite measurements (MODIS and 100
MISR AODs). Fig. 1c shows the simulated relationship using the Community 101
Atmosphere Model (CAM5) operating in “offline mode”, where the temperature, winds, 102
and air mass (pressure) fields (called ‘meteorology’ hereafter) are prescribed by a re-103
analysis product23 (ERA Interim reanalysis for 2000-2009), and the aerosols and water 104
variables evolve freely from the forcing provided by that meteorology (see 105
supplementary material for details). In all three panels, the central Indian rainfall is 106
strongly correlated with AOD over the Arabian Sea, West Asia and Saudi peninsular 107
regions, but they have low or even negative correlations over the Eastern India and Bay 108
of Bengal. A lead-lag analysis of weekly aerosols and precipitation variation indicates 109
6
that correlations are strongest (~0.6) for a zero-lag (Fig S3), indicating that aerosol and 110
precipitation vary in concert. 111
It is important to understand the source of these correlations. Although there are 112
clear relationships between pre-monsoon aerosol forcing, and monsoon precipitation 6,17, 113
the lifetime of aerosols is very short (about a week) near the Earth’s surface, and the 114
heavy precipitation during the monsoon effectively cleanses the atmosphere locally, so 115
the mechanisms that connect aerosol and precipitation on longer seasonal time scales are 116
probably not same as those evident on shorter timescales. In this study we focus on the 117
shorter term aerosol/precipitation relations identified earlier, attempting to tease out the 118
physical mechanism for the relationship, and the important aerosol types that contribute 119
to it. Hints about the type of aerosols responsible for the observed relationship (shown in 120
Fig. 1) are evident using the MODIS Angstrom Exponent (AE) product, an indicator of 121
aerosol size (with lower values indicating dominance of larger sized particles). A similar 122
pattern in AE of opposite sign (Fig. S2) suggests that coarse-mode particles dominated by 123
sea-salt and/or dust are responsible for the positive correlations shown in Fig. 1. A 124
similar analysis using a different MODIS product (i.e., fine-mode aerosol fraction) 125
suggests no significant positive correlation between central-India precipitation and 126
anthropogenic fine-mode aerosols over the Arabian Sea (as in Fig S2) and thus reinforces 127
the above finding. It is difficult to discriminate between dust and sea-salt aerosol induced 128
correlations using observations alone because both sources are sensitive to wind speed 129
and contribute to the coarse size mode. We therefore resort to climate model simulations 130
to separate the effects of different aerosols and expose the underlying physical 131
mechanisms. 132
7
133
3. Model Results and Discussion 134
While models are imperfect, and may have difficulty in simulating all aspects of 135
these correlations (especially on smaller spatial scales) they can provide significant 136
insight into the working of the complex climate system. Various configurations of the 137
CAM5 global climate model have been used (Table S1) to expose the physical 138
mechanism behind the observed and modeled relationships seen in Fig. 1. The model 139
includes treatments of the major aerosols species and their precursors, simulating dust, 140
sea-salt, black and organic carbon, and sulfate. Aerosols affect the liquid and ice 141
microphysics of stratiform clouds in the model (acting as nuclei for cloud liquid drop and 142
ice crystal formation) and the radiative transfer calculation24. As with most global climate 143
models, aerosols do not directly affect the CAM5 convective cloud parameterization’s 144
microphysics 25,26, but convection does respond to aerosol radiative forcing as it affects 145
stability and the surface buoyancy fluxes. CAM5 can be run in “offline mode” as 146
described earlier, or in its standard “free running” mode in which aerosols and 147
meteorological fields evolve and interact simultaneously unconstrained by observations. 148
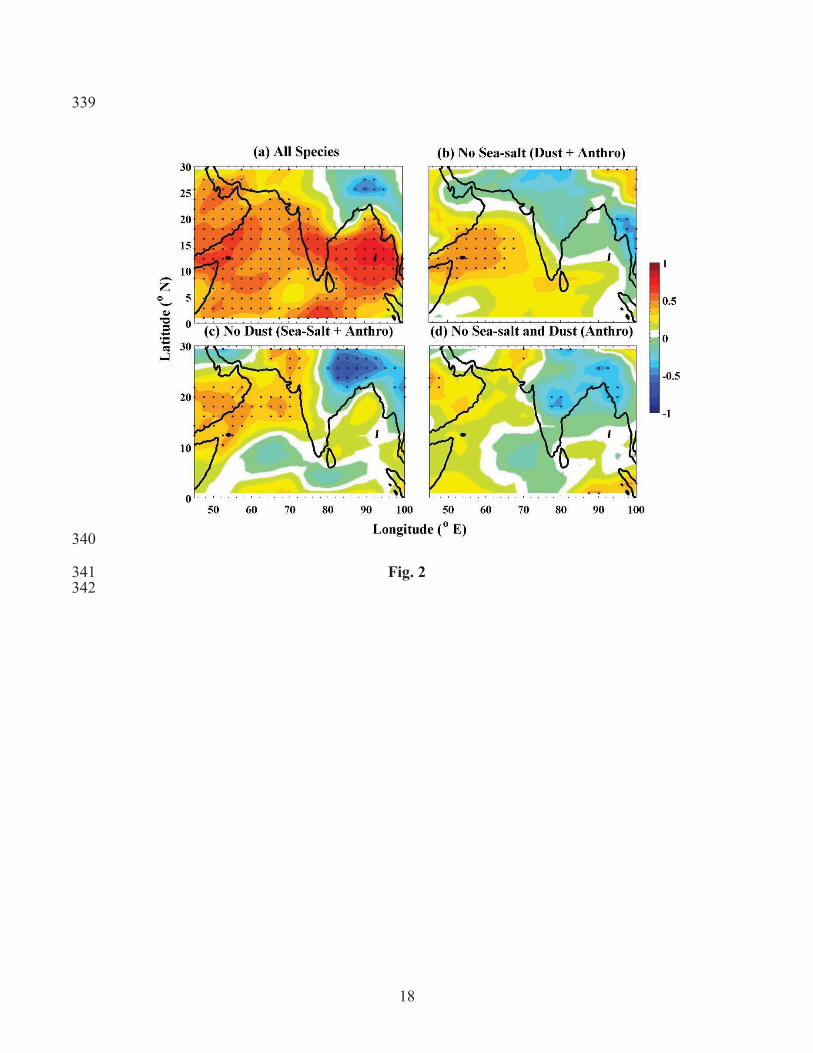
The correlation between central Indian monsoon precipitation and AOD for the 149
free running CAM5 is shown in Fig. 2a. The spatial correlation pattern is similar to that 150
seen in Fig. 1, but the positive correlation extends over a much larger area, covering the 151
whole of Arabian Sea, Bay of Bengal and peninsular India. Modest changes to 152
meteorology can have a large impact on the aerosol spatial distribution, but the model 153
physical parameterizations (in both free running and offline mode) do reproduce the 154
general correlation pattern, positive over Arabian Sea and negative over Northeast India. 155
8
(Areas where the free running and offline simulations produce different correlation 156
patterns are regions where some caution is needed in inferring physical relationships from 157
the free running simulations). 158
Additional simulations have also been made removing sea-salt, dust and 159
anthropogenic aerosol sources individually, and in combination (see table S1 in 160
supplementary materials for more details of the model experiments). Exclusion of these 161
combinations of sources helps to determine the cause for the observed correlation 162
patterns (Fig. 2). Note that natural pre-industrial (PI) emissions of OC and EC fire 163
sources (wildfires), dimethyl sulfide (DMS) and background volcanic SO2 sources, and 164
SOA emissions from vegetation were always included as aerosols sources. 165
A statistically significant relationship exists (with slightly changed spatial pattern) 166
over the Arabian Sea with present-day (PD) anthropogenic aerosol sources when sea-salt 167
and dust emissions are individually excluded (Fig. 2b and 2c). However, when both dust 168
and sea-salt are removed (Fig. 2d), the amplitude of the correlation decreases and 169
statistical significance disappears, indicating that both sea-salt and dust aerosols together 170
contribute to the observed pattern. This also implies that anthropogenic aerosols alone are 171
not responsible for the correlations, which is consistent with our interpretation of the AE, 172
and fine/coarse mode partitioning of the aerosol retrievals (Fig. S2). Both dust and sea 173
salt influence clouds and radiative heating. Removal of one species may have an impact 174
on the other (through competition for water vapor, or vapor deposition of sulfuric acid 175
and organics versus new particle formation etc27,28 and/or through changes to 176
meteorology), affecting the precipitation downwind. Therefore, to identify the role of 177
anthropogenic aerosols (within the model), we also repeated the analysis with pre-178
9
industrial (PI) emissions. The observed patterns are very similar to those seen with PD 179
anthropogenic emissions (Fig. 2a) when both dust and sea-salt natural emissions are 180
included (not shown). This again implies that anthropogenic aerosols alone cannot 181
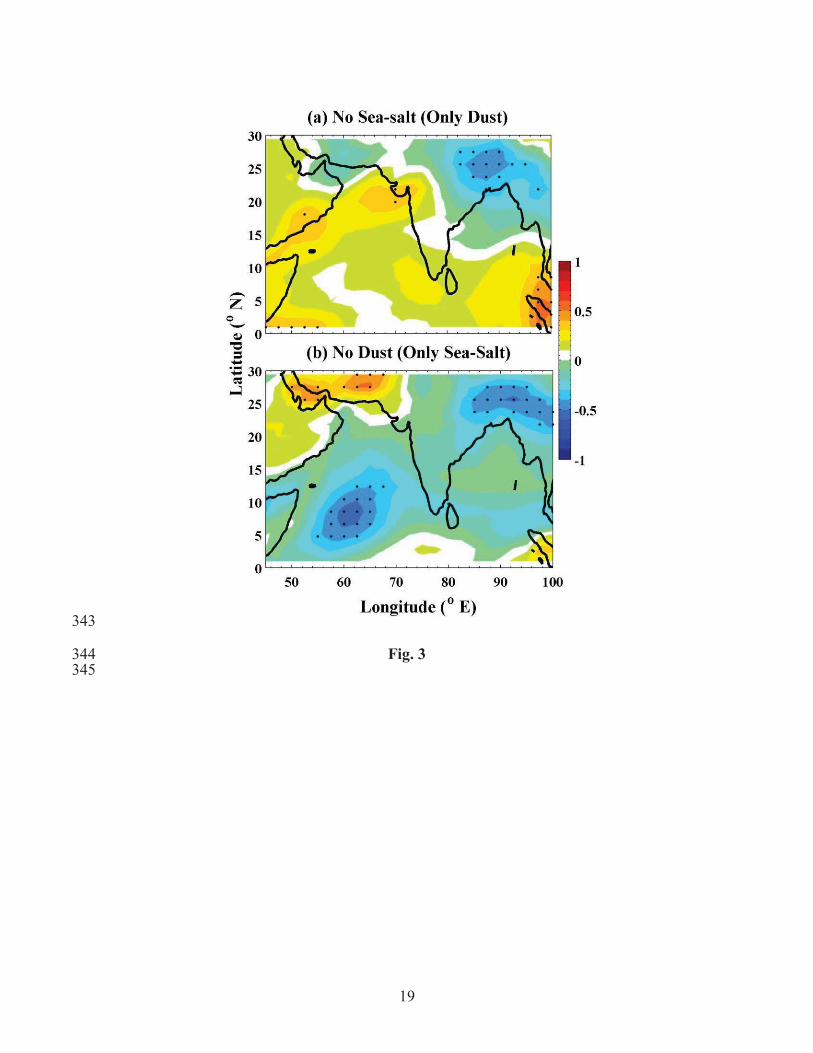
produce these positive correlation patterns. However, as shown in the PI case (Figs. 3 a 182
&b), removal of any type of aerosol leads to a significant change in the observed 183
correlation patterns. The most striking change is produced by the removal of the dust 184
source (Fig. 3b), which leads to a complete disappearance and even change of sign in the 185
observed correlations. Correlations are still present, but weaker when sea-salt sources are 186
removed (Fig. 3a). The simulations suggest that the observed correlations can be 187
reproduced only when dust is present along with either sea-salt or anthropogenic aerosols 188
in the model. We note that in regions where aerosols are a minor player, and passively 189
responding to meteorological variability, removal of one species ought not to strongly 190
influence the correlation patterns. For example, removal of SO2 emissions affecting the 191
Arabian Sea does not strongly influence the correlation pattern there (not shown) and the 192
central Indian precipitation response on these very short time scales. 193
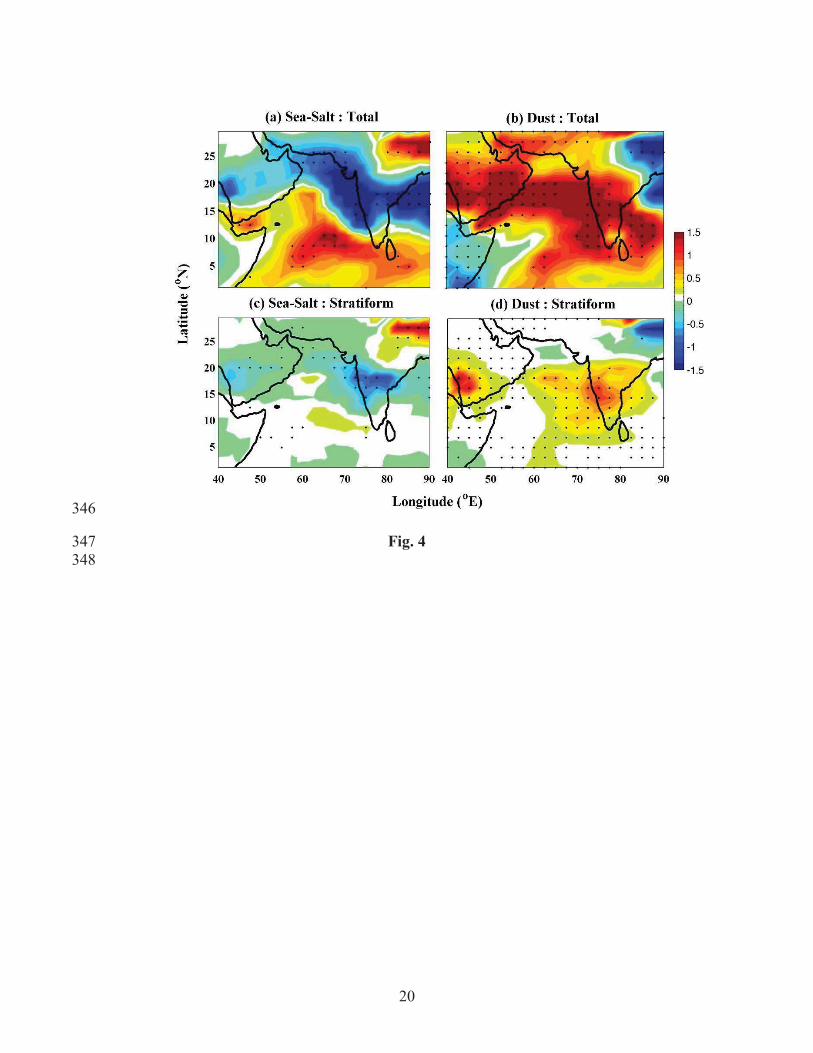
The modeled summer monsoon rainfall response to changes in dust and sea-salt 194
emissions is shown in Fig. 4. Sea-salt aerosol emissions lead to decreased precipitation 195
over the coastal southern peninsular and central Indian region (Fig. 4 a & c) and dust 196
aerosol emissions lead to increased precipitation (Fig. 4 b & d). Except for the intensity, 197
the responses are identical in both the stratiform and convective precipitation. Since the 198
convective precipitation microphysics is not linked to the presence of aerosols, the model 199
precipitation response must be a function of local or remote circulation and stability 200
changes (see next section), rather than a direct microphysical response (for example 201
10
through aerosol invigoration 29). South of 15oN, over oceanic regions remote from India, 202
the sea-salt correlates with increased rainfall, opposite behavior to that found over coastal 203
and central India. 204
Although the timescale cannot be inferred from the time averaged response shown in 205
Fig. 4,these seasonal changes in precipitation are consistent with the observed correlative 206
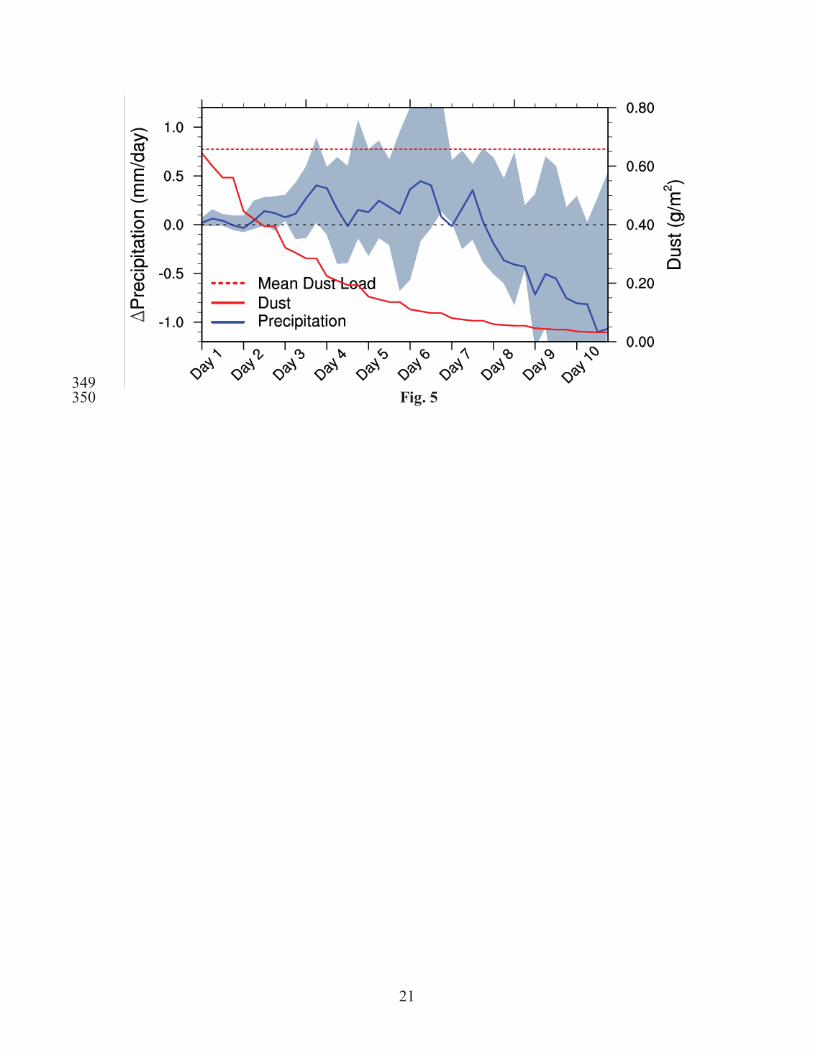
signatures found with shorter weekly scales shown in Fig. 1; increased precipitation over 207
central India is correlated with increased dust aerosols over Arabian Sea/West Asia and 208
the Saudi peninsula. To elucidate the short time scale response of aerosol-precipitation 209
interactions, another set of simulations called the Dust Pulse Experiment (DPE) was 210
performed. Two sets of 10-day model simulations were made starting from initial 211
conditions drawn during the monsoon period: one set of simulations included a dust 212
source, while the other simulation set had no dust source, so dust concentrations dropped 213
rapidly over the 10-day simulation period. All other aspects of the simulations were 214
identical (see Fig. S10 and corresponding text for details). Changes in dust burden (over 215
west Asia), and precipitation (over central India) were composited (by day of simulation) 216
to identify the impact on precipitation as the dust is gradually scavenged (Fig. 5). The 217
dust burden over West Asia/North Africa/Arabian region disappears quite rapidly, 218
decreasing to 10% of its climatological regional average within 5-7 days. Average 219
precipitation begins systematically decreasing over central India by day 7. The central 220
Indian precipitation drops as dust concentration decrease in the west Asian region. 221
222
223
224
11
4. The physical mechanism behind the remote dust aerosols and Indian 225
monsoon rainfall connection. 226
Dust is the largest contributor to the aerosol mass loading over northern Africa 227
and West Asia including the Arabian Peninsula. Observational studies have shown that 228
dust induced warming (clear sky) is the highest over Arabian Sea among the many dust 229
laden regions30. Our model estimates that dust aerosol increases top of the atmosphere 230
(TOA) absorption of solar insolation (+6 Wm-2), and decreases sunlight reaching the 231
surface (-30 Wm-2) producing a net atmospheric warming (+36Wm-2) and surface cooling 232
(dust aerosols can also change cloud microphysical properties, but this has a much 233
smaller effect on model radiative forcing and circulation changes). This combined 234
warming over regions with high dust concentrations leads to a reduction in surface 235
pressure thereby driving large-scale convergence over the North Africa/Arabian 236
Peninsula region (Fig. S7&S8a). The climatological winds are mostly southwesterly over 237
Indian region during the summer monsoon season. The convergent flow created by the 238
dust heating over land regions to the north and west of Arabian Sea strengthens the 239
northward component of the monsoon westerly (as a consequence of strengthening of the 240
pressure gradient) over Arabian Sea (see Figs. 6, S7a, S8a & S9a) leading to increased 241
moisture convergence (Fig. S9a) and precipitation (Fig. 4b) over the Indian region. This 242
mechanism is consistent for both the observed seasonal relationships and the DPE and is 243
summarized in Fig.S11 (see supplementary material for more information). The 244
proposed mechanism operates as a result of remote dust aerosol forcing far from central 245
India on a time scales of about a week, showing a different signature from the one the 246
EHP hypothesis5 addresses. 247
12
248
5. Synthesis, Integration, Implications. 249
We have used independent satellite retrievals to document a strong correlation 250
between Arabian Sea AOD and central Indian monsoon precipitation occurring on short 251
timescales. Satellite estimates of Angstrom Exponent and the Fine Mode Fraction (both 252
characterizing particle size) suggest that the aerosol involved is either dust or sea salt. 253
Our model shows a similar correlation, and our analysis indicates that desert dust aerosols 254
(originating over North Africa / West Asia/Arabian region and appearing as high aerosol 255
loading over the Arabian Sea) are responsible for the co-variability. This study suggests 256
that the interaction operates as a “direct radiative effect” where the radiative heating near 257
dust sources modulates the climatological monsoon westerly over the Arabian Sea with a 258
resultant change in precipitation (~3 to 6%) over central India. This aerosol effect on 259
precipitation through thermodynamics and large-scale circulation operates on timescales 260
of less than a week, and it does not involve a change to sea surface temperatures (SSTs). 261
While aerosols have been shown to be important in modulating sea surface temperatures, 262
significant ocean temperature change is not expected on these very short timescales. The 263
observed changes must primarily be a consequence of the atmospheric response to the 264
aerosol induced radiative effect. Previous studies have shown that anthropogenic 265
aerosols lead to decreases in Indian monsoon rainfall 3,11,12. These studies indicate that 266
anthropogenic aerosols over India (or adjacent ocean regions) also act to affect local 267
heating rates, and/or SSTs. We believe that the monsoon response to SST changes is very 268
important (perhaps more important than the interaction we are documenting), but they 269
operate on longer time scales. The present study shows that remote changes to natural 270
13
dust emissions as a consequence of anthropogenic and/or natural causes over regions to 271
the west of the Indian land mass, may also be modulating the rainfall over the Indian 272
region, highlighting the need to understand the effect of both natural and anthropogenic 273
aerosols and their interactions on precipitation in order to provide better predictions of 274
changes in monsoon precipitation. 275
276
14
6. Methods Summary 277
A weekly rainfall (using Global Precipitation Climatology Project daily dataset) 278
time series (the region averaged over 16.5 to 26.5oN and 74.5 to 86.6oE) was created for 279
the period 2000 to 2009 (June to August). This box was chosen as past studies have 280
shown that the inter-annual variability of rainfall over this region is similar to that of all 281
India rainfall (AIR) 22. The spatial and temporal homogeneity of rainfall22, consistency 282
with previous studies3 and ultimately its relationship with all India rainfall were the 283
important factors that influenced the choice of this box over India. The climatological 284
monthly mean rainfall over this region was subtracted from each time point 285
(corresponding to the month) to create a new time series of anomalies, forming the 286
primary index of rainfall over central India for this study. Similar anomaly time series 287
was created for the satellite-based AOD (MODIS and MISR) at each grid point over the 288
Indian sub-continent region shown in Fig.1. The Correlation coefficient between the 289
rainfall index over central India and the time series of aerosol optical depth at each grid 290
point was calculated and shown in Fig.1 (a&b). The statistical significance was 291
calculated using the standard student-t test. A dust pulse experiment was used to show 292
the short time scale nature of the aerosol-monsoon link. 293
294
15
Figure Captions 295
Fig. 1: Correlation coefficient between precipitation (over central India as indicated 296
by the box) and aerosol optical depth over the Indian region. (a) MODIS Terra (550 297
nm) and (b) MISR (558 nm) and (c) CAM5 in “offline mode” (550 nm). The black dots 298
represent significance at 95% confidence level. 299
Fig. 2: Correlation between precipitation over central India and aerosol optical 300
depth in free running simulations with present day emissions. Simulations include: 301
(a) All species, (b) No Sea-salt, (c) No Dust and (d) No Sea-salt and dust for present day 302
anthropogenic aerosol emissions. The black dots represent significance at 95% 303
confidence level. 304
Fig. 3: Correlation between precipitation over central India and aerosol optical 305
depth in free running simulations with pre-industrial emissions. Simulations include: 306
(a) No Sea-salt and (b) No Dust for pre-industrial aerosol emissions. The black dots 307
represent significance at 95% confidence level. 308
Fig. 4: The precipitation response associated with natural aerosol emissions (mm 309
day-1). The figure shows the control minus the simulation with suppressed dust or sea salt 310
emissions) Left panels (a & c) indicate the role of sea-salt aerosols. Right panels (b & d) 311
indicate the role of dust emissions. The top panels (a & b) show total precipitation 312
(convective + stratiform precipitation) and bottom panels (c & d) only the stratiform 313
precipitation. The black dots indicate a statistically significant change at the 95% 314
confidence level. 315
Fig. 5: The short-time response of precipitation to dust forcing as estimated from the 316
composite of two 19-member sets of 10-day simulations (the Dust Pulse 317
16
Experiment). The blue line corresponds to changes in precipitation over central India 318
and red line shows dust burdens over West Asia when the dust emissions are disabled. 319
The grey envelope represents the range of precipitation change between the 25th and 75th 320
percentiles of the 19 member ensembles. The dotted red line shows the mean dust 321
loading during the monsoon period from the control simulation. 322
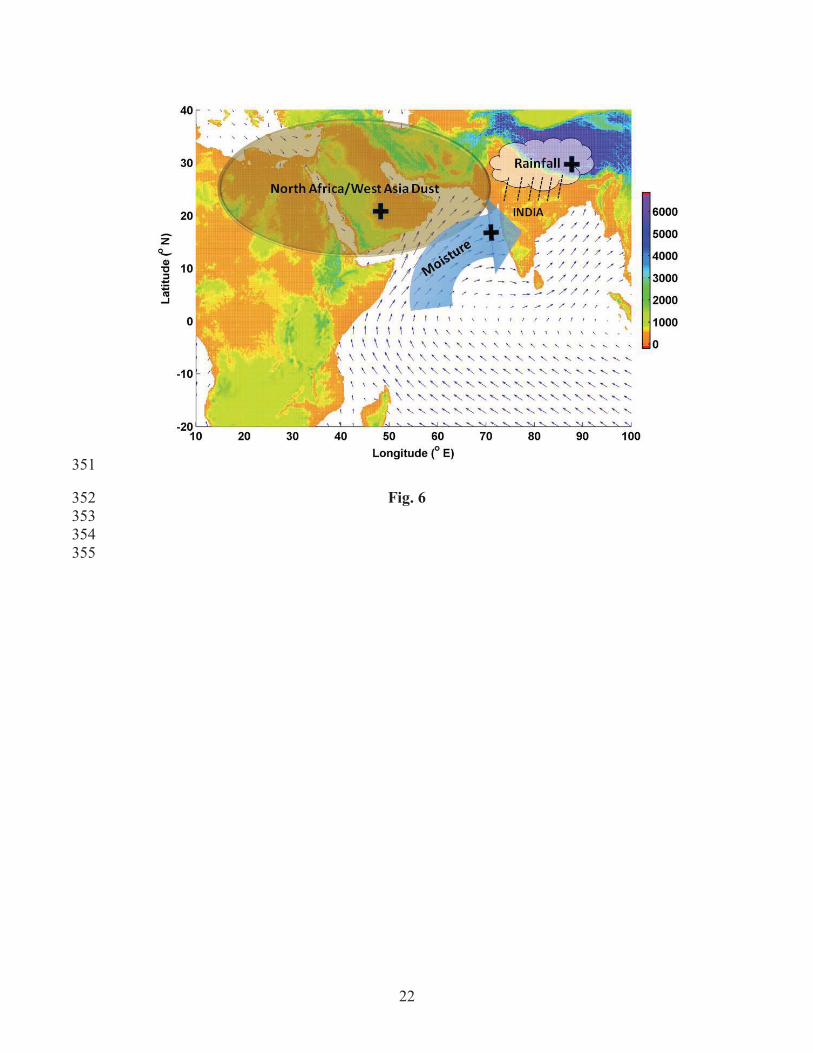
Fig. 6: Schematic representation of circulation response (the aerosol induced 323
anomalies) suggested in the paper from dust aerosols over West Asia/Arabian Sea. 324
Land colors indicate altitude above mean sea level and vectors indicate the 325
climatological direction of winds between June and August (from the NCEP Reanalysis). 326
The darker elliptic region indicates the areas of increased warming from high dust 327
concentrations that lead to a reduction in surface pressure that induces large-scale 328
convergence over the North Africa/Arabian Peninsula region. The convergent flow 329
created by the dust heating to the north and west of Arabian Sea strengthens the 330
northward component of the monsoon westerly (brown arrows) as a consequence of 331
strengthening of the pressure gradient over Arabian Sea. This leads to an increased 332
moisture convergence and precipitation over the Indian region. 333
334
17
335
336 Fig.1 337
338
18
339
340
Fig. 2 341 342
19
343
Fig. 3 344 345
20
346
Fig. 4 347 348
21
349 Fig. 5 350
22
351
Fig. 6 352 353 354
355
23
References 356
357 1 Webster, P. J. et al. Monsoons: Processes, predictability, and the prospects for 358
prediction. J. Geophys. Res. 103, 14451-14510, doi:10.1029/97jc02719 (1998). 359
2 Gadgil, S. The Indian monsoon and its variability. Annual Review of Earth and 360
Planetary Sciences 31, 429-467, doi:10.1146/annurev.earth.31.100901.141251 361
(2003). 362
3 Bollasina, M., Ming, Y. & Ramaswamy, V. Anthropogenic Aerosols and the 363
Weakening of the South Asian Summer Monsoon. Science 334, 502-505, 364
doi:10.1126/science.1204994 (2011). 365
4 Chung, C. E. & Ramanathan, V. Weakening of North Indian SST gradients and 366
the monsoon rainfall in India and the Sahel. J Climate 19, 2036-2045 (2006). 367
5 Lau, K. M., Kim, M. K. & Kim, K. M. Asian summer monsoon anomalies 368
induced by aerosol direct forcing: the role of the Tibetan Plateau. Climate 369
Dynamics 26, 855-864, doi:10.1007/s00382-006-0114-z (2006). 370
6 Lau, K. M. & Kim, K. M. Observational relationships between aerosol and Asian 371
monsoon rainfall, and circulation. Geophys Res Lett 33, 372
doi:10.1029/2006gl027546 (2006). 373
7 Meehl, G. A., Arblaster, J. M. & Collins, W. D. Effects of Black Carbon Aerosols 374
on the Indian Monsoon. Journal of Climate 21, 2869-2882, 375
doi:10.1175/2007jcli1777.1 (2008). 376
8 Menon, S., Hansen, J., Nazarenko, L. & Luo, Y. Climate effects of black carbon 377
aerosols in China and India. Science 297, 2250-2253, 378
doi:10.1126/science.1075159 (2002). 379
24
9 Patra, P. K. et al. The Indian summer monsoon rainfall: interplay of coupled 380
dynamics, radiation and cloud microphysics. Atmospheric Chemistry and Physics 381
5, 2181-2188 (2005). 382
10 Wang, C., Kim, D., Ekman, A. M. L., Barth, M. C. & Rasch, P. J. Impact of 383
anthropogenic aerosols on Indian summer monsoon. Geophys Res Lett 36, 384
doi:10.1029/2009gl040114 (2009). 385
11 Ramanathan, V., C. Chung, D. Kim, T. Bettge, L. Buja, J. T. Kiehl, W. M. 386
Washington, Q. Fu, D. R. Sikka, M. Wild. Inaugural Article: Atmospheric brown 387
clouds: Impacts on South Asian climate and hydrological cycle. Proceedings of 388
the National Academy of Sciences 102, 5326-5333, doi:10.1073/pnas.0500656102 389
(2005). 390
12 Ganguly, D., Rasch, P. J., Wang, H. L. & Yoon, J. H. Climate response of the 391
South Asian monsoon system to anthropogenic aerosols. J Geophys Res-Atmos 392
117, doi:Artn D13209 393
Doi 10.1029/2012jd017508 (2012). 394
13 Menon, S., Hansen, J., Nazarenko, L. & Luo, Y. F. Climate effects of black 395
carbon aerosols in China and India. Science 297, 2250-2253 (2002). 396
14 Vinoj, V. & Satheesh, S. K. Measurements of aerosol optical depth over Arabian 397
Sea during summer monsoon season. Geophys Res Lett 30, 398
doi:10.1029/2002GL016664 (2003). 399
15 Satheesh, S. K. & Srinivasan, J. Enhanced aerosol loading over Arabian Sea 400
during the pre-monsoon season: Natural or anthropogenic? Geophys Res Lett 29, 401
doi:10.1029/2002gl015687 (2002). 402
25
16 Vinoj, V., Satheesh, S. K. & Moorthy, K. K. Optical, radiative, and source 403
characteristics of aerosols at Minicoy, a remote island in the southern Arabian 404
Sea. Journal of Geophysical Research 115, doi:10.1029/2009jd011810 (2010). 405
17 Bollasina, M., Nigam, S. & Lau, K. M. Absorbing Aerosols and Summer 406
Monsoon Evolution over South Asia: An Observational Portrayal. Journal of 407
Climate 21, 3221-3239, doi:10.1175/2007jcli2094.1 (2008). 408
18 Nigam, S. & Bollasina, M. “Elevated heat pump” hypothesis for the aerosol-409
monsoon hydroclimate link: “Grounded” in observations? Journal of Geophysical 410
Research 115, doi:10.1029/2009jd013800 (2010). 411
19 Manoj, M. G., Devara, P. C. S., Safai, P. D. & Goswami, B. N. Absorbing 412
aerosols facilitate transition of Indian monsoon breaks to active spells. Climate 413
Dynamics 37, 2181-2198, doi:10.1007/s00382-010-0971-3 (2010). 414
20 Bollasina, M. & Nigam, S. Absorbing aerosols and pre-summer monsoon 415
hydroclimate variability over the Indian subcontinent: The challenge in 416
investigating links. Atmos Res 94, 338-344, doi:10.1016/j.atmosres.2009.06.008 417
(2009). 418
21 Ganguly, D., Rasch, P. J., Wang, H. L. & Yoon, J. H. Fast and slow responses of 419
the South Asian monsoon system to anthropogenic aerosols. Geophys. Res. Lett. 420
39, doi:10.1029/2012gl053043 (2012). 421
22 Goswami, B. N., Venugopal, V., Sengupta, D., Madhusoodanan, M. S. & Xavier, 422
P. K. Increasing trend of extreme rain events over India in a warming 423
environment. Science 314, 1442-1445, doi:10.1126/science.1132027 (2006). 424
26
23 Ma, P.-L. et al. The role of circulation features on black carbon transport into the 425
Arctic in the Community Atmosphere Model version 5 (CAM5). Journal of 426
Geophysical Research: Atmospheres 118, 4657-4669, doi:10.1002/jgrd.50411 427
(2013). 428
24 Liu, X. et al. Toward a minimal representation of aerosol direct and indirect 429
effects: model description and evaluation. Geosci. Model Dev. Discuss. 4, 3485-430
3598, doi:10.5194/gmdd-4-3485-2011 (2011). 431
25 Zhang, G. J. & McFarlane, N. A. Sensitivity of climate simulations to the 432
parameterization of cumulus convection in the Canadian Climate Center general-433
circulation model. Atmosphere Ocean 33, 407-446 (1995). 434
26 Park, S., Bretherton, C. S. & Rasch, P. The global cloud simulations in the 435
community atmosphere model CAM5. In Preparation (2012). 436
27 Ghan, S. J., Guzman, G. & Abdul-Razzak, H. Competition between sea salt and 437
sulfate particles as cloud condensation nuclei. Journal of the Atmospheric 438
Sciences 55, 3340-3347 (1998). 439
28 O'Dowd, C. D., Lowe, J. A. & Smith, M. H. Coupling sea-salt and sulphate 440
interactions and its impact on cloud droplet concentration predictions. Geophys 441
Res Lett 26, 1311-1314 (1999). 442
29 Rosenfeld, D. et al. Flood or drought: how do aerosols affect precipitation? 443
Science 321, 1309-1313, doi:10.1126/science.1160606 (2008). 444
30 Zhu, A., Ramanathan, V., Li, F. & Kim, D. Dust plumes over the Pacific, Indian, 445
and Atlantic oceans: Climatology and radiative impact. J Geophys Res-Atmos 446
112, doi:Artn D16208 447

27
Doi 10.1029/2007jd008427 (2007). 448
449
450
28
Supplementary Information is linked to the online version of the paper at 451
www.nature.com/ngeo 452
453
Acknowlegements: This work was supported by the Pacific Northwest National 454
Laboratory (PNNL) Program for Laboratory Directed Research and the U.S. Department 455
of Energy (DOE) Office of Science (BER) Earth System Modeling Program. PNNL is 456
operated for the DOE by Battelle Memorial Institute under contract DE-AC05-76RLO 457
1830. The MODIS, MISR and GPCP mission scientists and associated NASA personnel 458
are acknowledged for the production of the data used in this research effort. 459
460
Author Contributions 461
VV and PJR primarily conceived the idea. VV carried out the data analysis and free 462
running model simulations. PM and JHY carried out the offline and DPE model 463
simulations respectively. All authors contributed through discussions and interpretation 464
of the results. VV wrote a first draft of the paper with subsequent input from all the 465
coauthors. 466
467
Author Information Reprints and permissions information is available at 468
www.nature.com/reprints. Correspondence should be addressed to P.J.R. 469
([email protected]). 470
471
Competing Interests The authors declare that they have no competing financial interests. 472
473