
PRODUCT DATA SHEET - Pitney Bowescontent.pbinsight.com/.../discover-pa/EncomPA_120_DataSheet.pdf ·...
4
Product Overview Encom PA is an application for analysing and presenting geophysical data in profiles, maps and 3D displays. The information that can be analysed by this software includes single or multi-channel data acquired from airborne or ground surveys, including electro-magnetics (AEM) and potential field (gravity or magnetic) data. Encom PA also provides advanced visualisation using both 2 and 3 dimensional displays. 3-dimensional presentations of images, sections, graphs, flight paths and data objects provides interactive display manipulation with zooming, pan and fly- through. Templates allow fast creation of application-specific displays for magnetic, gravity, EM and spectrometer data. The template capability enables combinations of various display types. For example, you can easily combine profiles, sections, maps and graphs together for high quality printed output. The routine production of maps, sections and profiles is simple when templates are used. Benefit With Encom PA you can visualise and compare all your line data, profiles, grids, modelling, images, drilllholes, maps and 3D visualisations in a single interactive environment. This solution also allows data linking between profiles and 2D maps so that you can easily pick a feature in one view and have its location shown in another. Airborne EM interpreters have the ability to present and interpret multi-channel FEM and TEM data alongside CDI inversion sections, flight maps, voxel models and imagery, such as seismic or geological sections. You can pick anomalies on profiles or draw interpretations on CDI sections to demonstrate the most probable geological picture. Interpretations from sequential sections are easilyinterpolated to form 3D geological models. Geophysical data can be enhanced using the various data processing tools including line and grid FFT and Convolution filtering, 2D and 3D data gridding. With the separate free-to-use Viewer installation you can collaborate ideas with colleagues and clients or convey your information to joint venture or investment partners. INCREASE EFFICIENCY PRODUCT DATA SHEET Encom PA will deliver more results from your existing software investments through better use of visualisation and cross-product integration. Forget trying to line up 5 different maps or sections, link them live with Encom PA. Out of the box you can do some amazing things and then, in almost no time at all, build powerful applications that replace complex workflows using our unique application template designer. ENCOM PA v12.0 TURN EXPLORATION INTO REALITY WITH THIS ADVANCED GEOPHYSICAL VISUALISATION AND ANALYSIS SOLUTION.
Transcript of PRODUCT DATA SHEET - Pitney Bowescontent.pbinsight.com/.../discover-pa/EncomPA_120_DataSheet.pdf ·...
Product OverviewEncom PA is an application for analysing and presenting geophysical data in profiles, maps and 3D displays. The information that can be analysed by this software includes single or multi-channel data acquired from airborne or ground surveys, including electro-magnetics (AEM) and potential field (gravity or magnetic) data.
Encom PA also provides advanced visualisation using both 2 and 3 dimensional displays. 3-dimensional presentations of images, sections, graphs, flight paths and data objects provides interactive display manipulation with zooming, pan and fly-through.
Templates allow fast creation of application-specific displays for magnetic, gravity, EM and spectrometer data. The template capability enables combinations of various display types. For example, you can easily combine profiles, sections, maps and graphs together for high quality printed output. The routine production of maps, sections and profiles is simple when templates are used.
BenefitWith Encom PA you can visualise and compare all your line data, profiles, grids, modelling, images, drilllholes, maps and 3D visualisations in a single interactive environment. This solution also allows data linking between profiles and 2D maps so that you can easily pick a feature in one view and have its location shown in another.
Airborne EM interpreters have the ability to present and interpret multi-channel FEM and TEM data alongside CDI inversion sections, flight maps, voxel models and imagery, such as seismic or geological sections. You can pick anomalies on profiles or draw interpretations on CDI sections to demonstrate the most probable geological picture. Interpretations from sequential sections are easilyinterpolated to form 3D geological models.
Geophysical data can be enhanced using the various data processing tools including line and grid FFT and Convolution filtering, 2D and 3D data gridding.
With the separate free-to-use Viewer installation you can collaborate ideas with colleagues and clients or convey your information to joint venture or investment partners.
INCREASE EFFICIENCY
PRODUCTDATA SHEET
Encom PA will deliver more results from your existing software investments through better use of visualisation and cross-product integration. Forget trying to line up 5 different maps or sections, link them live with Encom PA. Out of the box you can do some amazing things and then, in almost no time at all, build powerful applications that replace complex workflows using our unique application template designer.
ENCOM PA v12.0
TURN EXPLORATION INTO REALITY
WITH THIS ADVANCED GEOPHYSICAL
VISUALISATION AND ANALYSIS SOLUTION.
PRODUCT DATA SHEET
ENCOM PA IS THE MOST COST-EFFECTIVE, ADVANCED GEOPHYSICAL
INTERPRETATION TOOL AVAILABLE TODAY. IT PROVIDES A COMPLETE
SOLUTION FOR GEOPHYSICAL DATA VISUALISATION, INTERPRETATION
AND REPORT PRODUCTION.
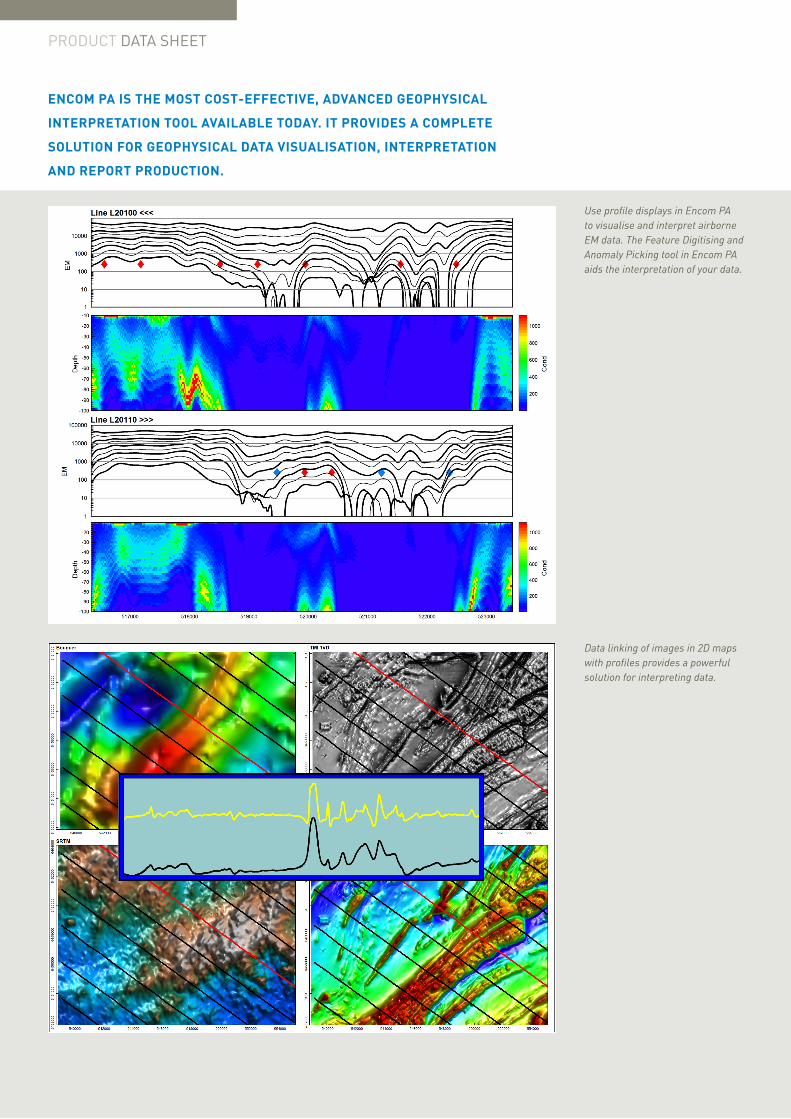
Use profile displays in Encom PA to visualise and interpret airborne EM data. The Feature Digitising and Anomaly Picking tool in Encom PA aids the interpretation of your data.
Data linking of images in 2D maps with profiles provides a powerful solution for interpreting data.

How easy is it to enhance my data?Encom PA provides you with a range of interpretive enhancement tools that include line, section, grid and voxel gridding, filtering, calculators and toolkits. The calculator tools include a rich array of function capabilities which can be applied to line, feature or grid data formats.
Encom PA has a rich set of gridding options that include minimum curvature, inverse distance weighting with elliptical weighting and triangulation. Gridding of sectional data is also supported for processed EM or IP data. 3D voxel gridding options include discretely layered, inverse distance weighting, discretised (lithology) and 3D Kriging with full 3D variogram support. Advanced 2D and 3D toolkits are provided for manipulation, merging and calculation, and scripting of 3D voxel models. Use the Import Vector File utility to populate a voxel model with density or susceptibility values contained within a ModelVision model file.
Encom PA includes a complete range of FFT, convolution and non-linear filters for grids and line data. The line filters include convolution, FFT and some non-linear methods. The convolution filters include median, average and user-defined filter kernels plus fourteen standard and non-linear methods (AGC, Median and noise). As well as the normal range of filters (band pass continuation, reduction, derivative etc), the FFT suite includes the ZS Geofilter suite, analytic signal, component, integral, pseudo-gravity, pseudo-magnetic and general phase transformations.
Data ImportEncom PA provides a rich environment for building interpretations that cover anomaly picking, map interpretations, section interpretation and 3D geological model building. The Feature Manager utility uses a 3D object database to capture your interpretation elements from which you can build sophisticated 3D targets, models, surfaces, faults, geological units and intrusions.
Map Interpretation elements in the form of points, lines and polygons are easily drawn onto a map with live updates into any other concurrent map or 3D display. You can instantly see your interpretation in the same context as ten separate images.
How easy does it get when you can build your geological interpretations by synthesising all the data, model inversions, geochemistry and geological knowledge? This is where you turn exploration into reality for your colleagues. Nothing will be left to guesswork when you can show where the drillhole should be placed.
Encom PA v12.0
Heading
Encom PA consists of two licensed packages designed to simplify the choice of available modules.
•For the Report Writer: PA Explorer contains all visualisation methods (in curve profiles, section profiles, 2D maps and 3D displays), data linking, import utilities and basic processing, conversion and display utilities.
•For the Interpreter: PA Professional includes all modules available in PA Explorer plus a number of additional utilities for extending the interpretation functionality of Encom PA, such as TEM Tau Calculator, EM Plate Importer, section and 3D gridding, anomaly picking and digitising features in 1D, 2D and 3D.
•For the Client: PA Viewer is a non-licenced version allowing any packaged session file from Encom PA Explorer or Encom PA Professional to be displayed and the views manipulated, including turning data object on and off, playing fly-through recordings and printing hard copies.
Case StudyA geophysical airborne survey was flown in southern New South Wales, Australia. The geology was assumed to be complex and possibly an extension of a number of steeply dipping inter-bedded volcanic units plus a granitic intrusion located in the north of the region. There was also a possibility that the granite intruded the volcanics in this area and may therefore host base metal accumulations that are known to exist elsewhere to the north-west of the survey area. However, much of the survey area was covered by swamp and is inaccessible to conventional ground surveys.
The aim of the magnetic and time-domain EM airborne survey was to map the area and determine the nature and extent of the main structure and granitic intrusion. Due to the large area of the survey the time domain EM data was processed using the EM Flow software and then the processed data was visualised as conductivity-depth sections and integrated in profile, 2D map and 3D displays in Encom PA. The magnetic data was filtered and gridded in Encom PA using a series of powerful processing tools and then visualised and integrated with the conductivity-depth images so that a 3D interpretation of the region was obtained.
By using Encom PA to enhance and integrate the EM data with the magnetic data, it was concluded there was a distinctive magnetic structure in this survey showing a major NW-SE trending fault plus the low amplitude zone of the granitic intrusive in the north.
For more information call +61.2.9437.6255 or visit us online: www.pitneybowes.com.au/software
PRODUCT UPDATES
•All data format projection and reprojection support
•EM Plate model support
•Diurnal corrections
•TEM Tau Calculations
•New Voxel Toolkit Utilities
•Improved IGRF Calculation
•New content-driven menu structure
•Improved scale bar management
UNITED STATES
CANADA
EUROPE/UNITED KINGDOM
ASIA PACIFIC/AUSTRALIA
[email protected]@pb.com
PRODUCTDATA SHEET
Pitney Bowes Software, Inc. is a wholly-owned subsidiary of Pitney Bowes Inc. Pitney Bowes, the Corporate logo is a [registered] trademark of Pitney Bowes Inc. or a subsidiary. All other trademarks are the property of their respective owners. © 2012 Pitney Bowes Software, Inc. All rights reserved.
Every connection is a new opportunity™
SpecificationsSupported Operating Systems:
• Windows® XP Professional (Service Pack 3)
• Windows® Vista (Service Pack 2)
• Windows® 7 32-bit and 64-bit
• CPU: Pentium 4 series 2 Giga-hertz PC with 2 Giga-bytes of RAM is recommended.
• Graphics Card: A high-quality graphics monitor of at least SVGA capability (1024 x 768 pixel screen display) is recommended. A 256 MB video card is recommended.
• Disk Space: 650 MB of available disk space is required.
92963 APAC 1202 DS
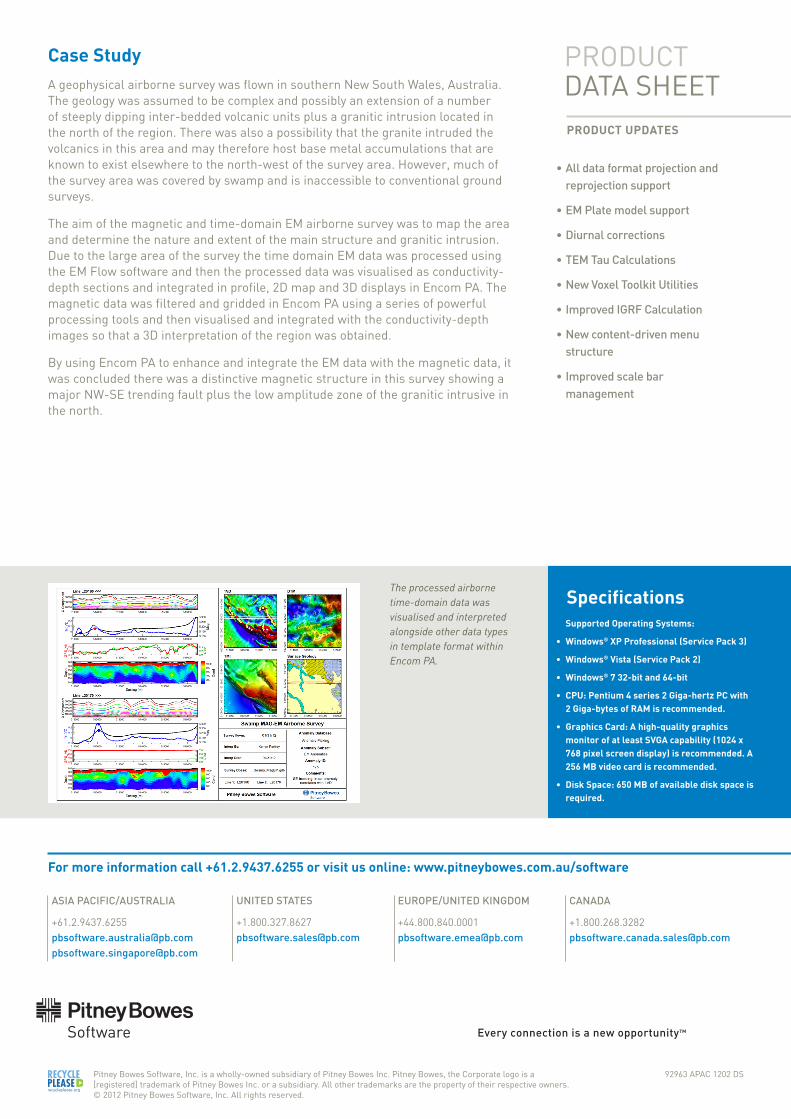
The processed airborne time-domain data was visualised and interpreted alongside other data types in template format within Encom PA.


![AdministrationGuide - Pitney Bowescontent.pbinsight.com/documentation/portrait-miner/... · 8.IfyouplantousethePortraitMinerdata-buildcommands,settheenvironmentforcommand-line utilities[seeSettingtheenvironmentforcommand-lineutilitiesonpage19].](https://static.fdocuments.in/doc/165x107/5e94d3da9009eb0553497621/administrationguide-pitney-8ifyouplantousetheportraitminerdata-buildcommandssettheenvironmentforcommand-line.jpg)
