PRODUCT CONFIGURATION OF PHOTOVOLTAIC SYSTEM IN …
99
UNIVERSITY OF VAASA FACULTY OF TECHNOLOGY INDUSTRIAL MANAGEMENT Bamidele Francis Oyeyiola PRODUCT CONFIGURATION OF PHOTOVOLTAIC SYSTEM IN DEVELOPING COUNTRIES - Case Ghana Master’s thesis in Industrial Management VAASA 2015
Transcript of PRODUCT CONFIGURATION OF PHOTOVOLTAIC SYSTEM IN …

UNIVERSITY OF VAASA FACULTY OF TECHNOLOGY INDUSTRIAL MANAGEMENT
Bamidele Francis Oyeyiola
PRODUCT CONFIGURATION OF PHOTOVOLTAIC
SYSTEM IN DEVELOPING COUNTRIES
- Case Ghana
Master’s thesis in
Industrial Management
VAASA 2015

2
TABLE OF CONTENTS
ABSTRACT 9
1. INTRODUCTION 10
1.1 Background 10
1.2 Research objectives and question 12
1.3 Limitation and definition 13
1.4 Structure of the study 16
2. CASE COUNTRY BACKGROUND 18
2.1 Ghana – Historical, political, economy and technical administration of energy
systems 18
2.2 Renewable energy policies in Ghana 27
3. TECHNOLOGY AND PRODUCT CONFIGURATION 30
3.1 Photovoltaic technologies: definition, development, types and installed capacity
30
3.2 Types of components in a photovoltaic system 34
3.3 Configuration of photovoltaic systems: Standalone, Backup and Hybrid 46
4. RESEARCH METHODOLOGIES 56
4.1 Data collection 57
4.2 Data analysis 61
4.3 Reliability and validity of the research 62

3
5. EMPIRICAL ANALYSIS AND FINDINGS 64
5.1 Empirical analysis 64
5.2 Survey analysis and findings 66
6. SUMMARIES AND CONCLUSIONS 72
6.1 Research summary 72
6.2 Conclusion and recommendation 74
APPENDIXES 97
Appendix 1: Focus Group Questionnaire 97
Appendix 2: Survey Questionnaire 98

4
List of Figures
Figure 1. 2012 Energy consumption in Ghana 19
Figure 2. Volta River Authority Transmission Network 20
Figure 3. Solar radiation in Ghana 23
Figure 4. Ghana wind distribution 25
Figure 5. Annual evolution of PV capacity 32
Figure 6. Photovoltaic efficiency in converting light to electricity 33
Figure 7. Classification of solar cells materials 35
Figure 8. Parallel and series connections of photovoltaic panels 36
Figure 9. Summary of technical parameters 46
Figure 10. Hybrid system with an auxiliary power source 48
Figure 11. A configuration segment of a photovoltaic system 49
Figure 12. Configuration of a simple backup system for a household 55
Figure 13. Average monthly electricity bill 67
Figure 14. Percentage of tenants to homeowners 67
Figure 15. Percentage of business owners 68
Figure 16. Various renewable energy sources 69
Figure 17. Percentage distribution of solar photovoltaic energy use 70

5
List of Tables
Table 1. Summary of potential projects to meet the 2015 targets 22
Table 2. Gross wind resource potential of Ghana 24
Table 3. Feed-in-Tariff from September 2013 29
Table 4. Photovoltaic module voltage and current calculations 37
Table 5. Power consumption of home appliances 44
Table 6. Estimated energy consumption for a household in Ghana 52
Table 7. Distribution of business owners 68
Table 8. Synthesis of the findings 71
6
ABBREVIATIONS
MoE Ministry of Energy
MoE& P Ministry of Energy& Petroleum
UNCTAD United nation Conference on Trade and Development
HEP Hydro Electric Power
KWh Kilowatt hour
NRC National resources Canada
EMA Energy Market Authority
BCA Building and Construction Authority
IEA International Energy Agency
FSEC Florida Solar Energy Centre
CRO Construction Review Online
GoG Government of Ghana
ECG Electricity Company of Ghana
EC-Ghana Energy Commission of Ghana
NPA National Petroleum Authority
CIA Central Intelligence Agency
VRA Volta River Authority
NREL National Renewable Energy Laboratory
AIEDAM Artificial Intelligence for Engineering Design, Analysis and
Manufacturing
REEEP Renewable Energy and Energy Efficiency Partnership
ECREEE ECOWAS Centre for Renewable Energy and Energy Efficiency
EPIA European Photovoltaic Industry Agency
PVPS Photovoltaic Power Systems
EPVTP European Photovoltaic Technology Platform
EMTC Exide Management and Technology Company
CEC Clean Energy Council
EASHW European Agency for Safety and Health at Work
MSU Michigan State University

7
ACKNOWLEDGEMENT
I would like to thank all people who have helped me to get through this long project
especially my family and members of Kpanlogo Yede Association for their everlasting
support during my studies.
I would like to acknowledge the patient and feedback of my supervisor Prof. Josu
Takala.
I really appreciate the support from my assistant supervisor Dr. Emmanuel Ndzibah
who has guided me through this thesis. He has provided me with lots of interesting
ideas and advice. Without his help this research would not be presented in this form.

8

UNIVERSITY OF VAASA Author: Bamidele Francis Oyeyiola Topic of the Thesis: Product configuration of photovoltaic systems in
developing countries – Case Ghana Name of the supervisor: Prof. Josu Takala Assistant supervisor: Dr. Emmanuel Ndzibah
Department: Department of Production
Degree: Master of Science in Economics and Business
Administration
Major subject: Industrial Management
Year of entering the University: 2009
Year of completing the Thesis: 2015 Pages: 99
ABSTRACT
This study aims at introducing product configuration of photovoltaic systems in developing countries with focus on Ghana. The current problem of electricity production and delivery in Ghana forms the background of the objective of the study. Solving this, particular attention is focused on solar photovoltaic technologies. The objective was to look at how various configurations of photovoltaic systems would help either households or businesses in developing countries to improve their day-to-day life and activities. Focusing on photovoltaic system configurations offers households and businesses the options of standalone, backup or hybrid systems although, the study limits its options to backup systems as a result of the rationing of electricity in Ghana. The theoretical part provided comprehensive background for the study with an insight into the current energy situation and the renewable energy policies in Ghana. Furthermore, an in-depth understanding of the different components (i.e. panels, charge controllers, inverters, battery and load) of a photovoltaic system is achieved with a look at their basic technical parameters. The empirical research is conducted via a focus group study and a survey. The focus group study was conducted in Finland among African students while the survey was done in Ghana through questionnaire sent to 102 respondents via an online survey portal: Google Form. From the result, the most common areas of use for solar photovoltaic are for lighting, household and office appliances for which varied configuration can be established. The research established the electrification problem in Ghana and one key recommendation in solving this is the use of renewable energy such as solar photovoltaic systems. KEY WORDS: Photovoltaic (PV), product configuration, developing countries, Ghana

10
1. INTRODUCTION
1.1 Background
“Climate change, the possibility of fossil fuel scarcity, and the need to improve the
security of energy supply have heightened the need for strong promoting renewable
energies” - (Algieri, Aquino & Succurro, 2011)
The demand for energy especially in developing economies is growing but the supply
cannot meet up. Fossil fuel energy production and use pose great environmental
challenges therefore there is a need to build a cleaner and resourceful energy future
(IEA, 2012). According to the International Energy Outlook 2013 (IEO 2013) produced
by the US Energy Information Administration, the energy consumption will increase by
56% by 2040 and much of this demand will take place outside the Organization for
Economic Cooperation and Development (non-OECD) due to the increase in long-term
and strong economic demand (EIA 2013).
Developing nations particularly those from sub-Saharan Africa, are struggling with
stable energy supplies hence, facing electricity shortage. Currently, most of the
continents electricity comes from hydroelectric power (HEP). Ghana is no exception to
this problem as the bulk of energy generation and supply comes from the Akosombo
HEP. Unpredictability in climatic conditions is a major problem in African continent
today. This makes it impossible to predict when and the amount of rainfall at a
particular time and place. The problem of energy crisis in Ghana has resulted in
rationing of electricity by location. According to Algieri et al. (2011), this has led to low
productivity, development and slow economic growth (Algieri et al. 2011; Ndzibah
2013).
Day-to-day activities in the rural areas often rely on biomass, candle or kerosene while
the urban switches between the national grid and generator (for those who can afford it).
For the purpose of this study, the focus is going to be on households in the urban areas
of Ghana. It is important to note that some businesses are run from households in the

11
urban therefore electricity consumption and uses are different from household to
household. These household are either personally owned or rented. Therefore, the type
of product configuration of photovoltaic system in the urban area will vary based on the
purpose for which it is intended for (Ndzibah 2013; Ahiataku-Togobo 2012).
Algieri et al. (2011) explained that green technology and industries are considered new
development in energy sustainability. Even though this is true, some part of the world
still lack the necessary energy required for the daily activities. This problem has led to
what energy experts call “energy poverty”. Energy poverty can be defined as the lack of
adequate modern energy for the basic needs of cooking, warmth and lighting, and
essential energy services for schools, health centers and income generation (Practical
Action 2009; Algieri et al. 2011).
Ghana’s Ministry of Energy under their Policy Framework and Guide for Development
of Independent Power Producer has asserted that the demand of energy for the last 10
years has increased by 5% therefore; there is a need to increase the availability of
energy in developing economies such as Ghana (MoE-Ghana 2007; Ndzibah 2013).
Developing countries are nations with lower living standard, low Human Development
Index (HDI), underdeveloped industries with low GDP per capital in comparison with
other nations (O'sullivan & Sheffrin, 2003; World Bank, 2012; UNCTAD, 2007). These
countries tend to have energy deficiency which has led to low level economic
development. According to Ndzibah (2013), it’s worth nothing that all economies are
dynamic “for better or worse” and developing economies are also dynamic due to
globalization. Khara (2010) nevertheless added that this phenomenon is changing
rapidly as developing countries are growing faster than developed countries due to
younger “demographic transition”.
Finally, although the energy problems facing developing nations is general, this
research hope to reduced, if not completely eradicate the situation by tapping into the
abundance sources of renewable energy such as the sun (Karekezi & Kithyoma, 2003).

12
1.2 Research objectives and question
“The total solar energy that reaches the Earth’s surface could meet existing global
energy needs 10,000 times over.”- EPIA & Greenpeace (2011)
Today’s energy crisis has brought about lots of research in sustainability and renewable
energy. Although, most of the research already conducted focuses on business and
management practices and activities for such energy technologies in the African region
which is limited to North and South, therefore, there is a need to look at the other parts
of Africa (Ndzibah, 2013). According to Karekezi (2002a), the energy sector in Africa
is divided into three distinct regions – North Africa (which depends on oil and gas),
South Africa (which depends on coal) and finally Sub-Saharan Africa (which rely on
biomass).
Sub-Saharan African use of wood (as a source of energy) has a serious environmental
and health impact. An example is the air pollution from unvented charcoal cooking
stoves which can contribute to respiratory problems in sub-Sahara Africa and erosion
which is caused by deforestation. The consumption of wood and charcoal as a source of
energy has led to very low consumption of modern energy (e.g. hydrocarbon such as
petrol and diesel).In sub-Saharan (excluding South Africa), the consumption of
hydrocarbon is at 292kgoe (kilograms of oil equivalent) from 317kgoe between 1980
and 2002 (World Bank, 2003). This means that sub-Saharan African generate only 24
per cent electricity (8 per cent in rural areas), the lowest in the world (Eberhard et al.
2008; Ram 2006).
According to Karekezi and Ranja (1997), Africa is blessed with significant renewable
energy resources such as HEP (1.1 Gigawatt), geothermal (9000 Megawatt) and
abundant solar, wind and biomass. Therefore there is a need to utilize and harnessed
these sources of renewable energies. Although, it will be a monumental task to discuss
all renewable energy sources Africa has to offer and for the purpose of these studies,
solar as source energy will be the focus.

13
The main research objective of this study is to develop advantage in product
configuration of photovoltaic systems for developing nations. The configuration will be
based on usage segments in Ghana for urban sectors of the economy. A brief look at the
rural sector will be considered. Thus, the main research question will be: How product
configuration of photovoltaic (PV) system can help reduce and improve energy crisis in
developing countries and for that fact Ghana? This objective will help explain
photovoltaic system – components and applications. Additionally, a closer look into
how this can help improve the problem of electrification in developing nation thereby
improving standard of living and developments. It is important to also note that to
achieve this, policy makers, investors and other stakeholders in the energy sector needs
to throw their support behind the adoption of photovoltaic systems as one of the means
of solving the energy crisis facing Ghana.
Hence, the main objectives of this research are:
▪ To give background and explain the electrification development in Ghana
▪ To find out the current policies in Ghana.
▪ To add value to current configuration standards
▪ To analyse and propose a set of product configurations of photovoltaic systems
in solving the energy crisis in Ghana.
1.3 Limitation and definition
The research topic in question is broad and as such; there is a need to focus on a specific
area. Africa has various sources of renewable energy to offer. The main renewable
energies are: Solar, Wind, Hydro, Tidal, Wave, Land fill, Sewage and other bio gas,
incineration of waste (municipal, industrial, hospital etc.), Geothermal, and Bio-fuel.
Renewable energy sources such as solar and wind are known as intermittent renewable
sources whereas some others like hydro and biomass are classified as non-intermittent
sources (Zahedi, 1996).

14
To be able to understand the topic in question, there is a need to define some of the key
terminology which will be used. Also a brief look at the various products that makes up
the photovoltaic system needs to be discussed. According to Sustainable Resources
(2014), “photovoltaic” is made of two words – “photo” which means light (“photon”)
and “voltaic” which means voltage (“volt” – unit of electric potential). Hence,
photovoltaic (PV) uses photovoltaic cells (semiconductors) and other components to
generate electricity by converting solar radiation into direct electricity (Shah et al.,
1999; Pearce 2002; Ndzibah 2013, Sustainable Resources 2014).
Photovoltaic system is an arrangement of components designed to supply usable electric
power for various purposes, using the Sun as the power source. Although there are other
types of photovoltaic systems such as grid and off-grid connected systems, fort his
study, the focus is on standalone, backup and hybrid systems (EMA & BCA 2009;
Ndzibah 2013; NRC 2001).
Photovoltaic modules: these are made up of solar cells. A solar cell is formed from
silicon - semi-conductor. Silicon is the second most abundant element on earth found in
quartz and sand. These solar cells are the unit which converts sunlight to electricity. A
collection of cells make up photovoltaic modules which when put together forms
photovoltaic arrays. Although there are different types of photovoltaic cells, for the
purpose of this study, the focus will be on - monocrystalline silicon photovoltaic and
polycrystalline silicon photovoltaic (Ndzibah 2013; Sustainable Resources 2014).
Photovoltaic charge controller: This help prevents photovoltaic modules from
overcharging the battery and vice versa. The excessive voltage could damage the
batteries. To prevent this, a charge controller is used to maintain the proper charging
voltage on the batteries (Ndzibah 2013; Sustainable Resources 2014).
Photovoltaic Inverters: Converts direct current (DC) from photovoltaic panels or
modules into utility frequency alternating current (AC) which can be fed to appliances.
Therefore, any unit that can convert a 12-volt battery or a direct solar current to 220/230
volt electricity is an inverter (Ndzibah 2013).

15
Battery: The battery serves as a storage device for the voltage generated by the solar
cells. The stored voltage are later used during power disruption or to power some
appliances while the electricity from the grid is used for equipment or appliances the
required more energy to operate (Ndzibah 2013; Sustainable Resources 2014).
Product configuration is a way of modifying a product or components to meet the needs
of a particular customer. The product or components may consist of mechanical parts,
services, and or software (Mehrotra et al 2013; AIEDAM 2003; Haug et al 2012).
Photovoltaic standalone system is a system used by people who have no access to the
national electric grid. This means that electrification is solely generated from
photovoltaic system.
Photovoltaic backup system is recommended for those who have access to the national
grid but are ready to use the photovoltaic system instead of a diesel or petrol powered
generator in case of a power outage.
Hybrid photovoltaic system is a unit recommended for specific households or businesses
with enormous energy requirement. For such requirements, key appliances are
connected to the grid while the photovoltaic unit powers other equipment or
machineries (Ndzibah 2013; NRC 2001; FSEC).
According to Merriam Webster (2014) online dictionary, the term “configuration”
simple means “the way the parts of something are arranged”. FSEC (2002) explains that
photovoltaic systems comprise of photovoltaic modules, photovoltaic arrays, inverter,
charge controller and battery.
Developing countries are nations with lower living standard, low Human Development
Index (HDI), underdeveloped industries with low GDP per capital in comparison with
other nations (O'sullivan & Sheffrin 2003; World Bank 2012; UNCTAD 2007).

16
Ghana is a country located in West Coast of Africa surrounded in the North by Burkina
Faso, to the East by Togo and to the West by Cote d’Ivoire with the Gulf of Guinea to
the South. Ghana was formally known as Gold Coast until 1957 when it got
independence from the United Kingdom in 1957. The capital of Ghana is Accra (Ghana
Web 2014; GoG 2013).
1.4 Structure of the study
This research is meant to look at the energy situation in the case country Ghana,
particularly the electrification problems and how this can be reduce and improve.
Additionally, an investigation into how the role and types of renewable energy can help
achieve afore mention goal. The focus will be on photovoltaic systems due to the
abundance of sunlight. Various findings regarding photovoltaic systems will be
reviewed in comparison with how these systems are implemented in Ghana. The
findings will help improve the development of alternatives and reliable energy in
developing countries. This research will commence with a review of the energy
situation in Sub-Saharan Africa with particular importance to the energy problem facing
Ghana. The end with the research objectives, questions, limitation and definition are
reviewed.
Chapter 1 examines the energy situation in developing countries. A look at sub-Sahara
various energy sources being used. The research objectives and questions were
elaborated. Finally, definitions and the limitations of the studies were examined.
Chapter 2 will look at the historical, political and technical frame work of the energy
sector, particularly the electrification of the case country – Ghana. This will also include
examining the various types of the energy systems as well as the capacity and future
energy potentials. Finally, a brief assessment of Ghana’s renewable energy policies will
be discussed.

17
Chapter 3 starts with the introduction of photovoltaic. This will examine key aspect of
photovoltaic technology. Furthermore, the concept of product configuration with
relation to product design will be evaluated and discussed. Finally, a look at the
different photovoltaic systems which includes standalone, backup and hybrid will be
introduced including basic technical parameters for photovoltaic systems components.
Chapter 4 examines the research methodologies approach used in this study to establish
meaningful and reliable conclusion. This study will use a hybrid research approach. A
hybrid research approach uses both qualitative and quantitative methods (Ndzibah 2013;
Burns & Bush 2000: 230, 231). This type of research will help develop and evaluate key
findings.
Chapter 5 looks at the research findings and analysis. The researcher pre-assumptions
were also examined.
Chapter 6 will draw conclusion to the study by presenting a summary analysis and
findings. Finally, recommendations will be suggested on how Ghana can improve their
energy problems. These recommendations can be used by developing economies to also
improve the energy problems thereby leading to economic and social development.

18
2. CASE COUNTRY BACKGROUND
This chapter will look at the historical, political and technical backdrop of Ghana’s
energy systems since independence. A review of the energy systems including the
various means to which Ghana generate its energy will be discussed. Finally, a look at
the Ghana energy policies will be considered.
2.1 Ghana – historical, political, economy and technical administration of energy
systems
Ghana is a country located in West Coast of Africa surrounded in the North by Burkina
Faso, to the East by Togo and to the West by Côte d’ Ivoire with the Gulf of Guinea to
the South. Ghana was formally known as Gold Coast and became the first sub-Saharan
African country to gain independent from the United Kingdom in 1957. The capital of
Ghana is Accra though it was previously located at Cape Coast. Since independence,
Ghana has endured series of coups until Lt. Jerry Rawlings took power in 1981, setting
up a one party system. A new constitution was approved which brought about
multiparty system to Ghana in 1992 and Mr. Rawlings won the presidential election that
year. The official language is English though there are more than 79 languages and
dialects spoken by the Ghanaians. Currently, the population of Ghana is about 25.5
million at a growth rate of 2.19 % (Ghana Web 2014, GoG 2013; Ndzibah 2010; Just
Landed 2014).
Ghana’s economy has strengthened over the last quarter century with good
management; competitive business environment together with sustained reduction in
poverty (CIA 2014). Ghana is blessed with natural resources and agriculture which
account to about 25% of GDP while the service sectors generate 50% of GDP. Major
foreign exchange is derived from gold and cocoa production. It is worth mentioning that
the discovery and production of oil at the Jubilee field which commenced in 2010 will
reduce Ghana’s energy dependency on other nations. This is also expected to add to the
national income of Ghana. As of 2013, the GDP is between 7% - 7.9% with per capita

19
at $3,500 compared to $3,200 in 2011 and inflation is at 11% (CIA 2014; GoG 2013;
Heritage 2014; Ahiataku-Togobo2012).
2.1.1 Types of energy systems, capacity and future forecast
Since Ghana got independence in 1957 from the United Kingdom, and built the first
energy generating system at Akosombo (1961 – 1964 and was opened in 1965) at a cost
of $258 million, the country’s energy production cannot meet up with demand due to
the rapid population growth and developments. Although the output power from the
Akosombo dam was meant to serve only Ghana, an agreement between Togo and Benin
was made to supply them electricity (Ndzibah 2010; Ndzibah 2013).
Even with the installation of additional electricity generating system (in the 1980s,
1990s and 200s), most are currently underperforming as domestic energy demand is
growing at 7% annually. Figure 1 (below) shows the current energy consumption in
Ghana. It’s obvious that most of Ghana’s energy is derived from biomass hence; there is
a need to explore other sustainable sources of energy.
Figure 1. 2012 Energy consumption in Ghana Adopted: Ahiataku-Togobo W. (2012)
Biomass64%
Petroleum27%
Hydro power
9%

20
According to Ndzibah (2013), the consumption, export and importation of electricity
were approximately 5.7 billion kWh, 2.49 billion kWh and 435 million kWh,
respectively while production at Akosombo and Kpong hydro power plants was 6.7
billion kWh. Nonetheless, it should be noted that there are other power plants which
generate enough power to offset the net deficit of consumption, export and importation.
Despite this level of electricity production, more than 9 million Ghanaians are still
without power thus resorting to the use of standby generators by households and
industries. Figure 2 show both power distribution networks and proposed future grids in
various regions in Ghana (Kofi Agyarko 2012; Isaac Ennison 2012; CRO 2014).
Figure 2. Volta River Authority Transmission Network Adopted: Ndzibah (2013)
21
To combat the shortage, an increase power production upgrade took place in 2006
where the capacity was increased from 912 MW to 1,020 MW. Furthermore, there are
numerous projects that are under construction to meet the demand and considered target
set out by the government to increase the existing facility capacity to 5000 MW by 2015
from 2000 MW (see Table 1) but according to Essah (2011); this is approximately 53%
less than the estimated capacity that is required to be installed in order to achieve a
substantial level of electricity usage for every individual. For example, the construction
of Aboadze Thermal Plant which started in 2011 at a cost of $750 million due to be
completed in 2014, is expected to increase Ghana’s power generation (Kofi Agyarko
2012; Isaac Ennison 2012; CRO 2014; Heritage 2014; Ahiataku-Togobo2012;
Kpekpena 2014).

22
Table 1. Summary of potential projects to meet the 2015 targets Adopted: EC-Ghana (2006)
Although Ghana is endowed with abundant sunlight, photovoltaic systems are yet to
contribute significantly to power generation. Solar energy utilization has been limited
owing to its comparatively higher cost. Figure 3 (below) show the distribution of annual
solar radiation. Ghana receives very high radiation levels at a monthly average of 4.0 -
6.5kW/m2/day. The capacity of solar photovoltaic electrification in Ghana has seen a
significant growth from 0.3MWp in 1987 to 2.1MWp in 2009. Some 5,000 photovoltaic
systems have been installed in remote areas by 2006 to support 15,000 homes through a

23
$10.9 million World Bank project. Most of the installations by the government are
aimed to provide lighting for health care centers, power solar water pumps,
telecommunication towers and refrigeration of vaccines. In May 2013, a 2MWp solar
project was commissioned by the Volta River Authority (VRA) at Navrongo. The
Navrongo Solar Power Plant is the largest grid photovoltaic plant in West Africa,
besides those in Cape Verde. Furthermore, VRA is expected to install a total of 10MWp
in areas such as Kaleo, Lawra and Jirapa though, they are currently looking for funding
to develop the remaining 8MWp (Ghana EC 2009; Oteng-Adjei 2010; Ndzibah 2013;
VRA 2013).
Figure 3. Solar radiation in Ghana Adopted: NREL 2014

24
Other sources of energy that can help improve the electricity situation in Ghana are
wind and bio energy. The wind energy power generation in Ghana is at the infant stage.
Preliminary wind resources evaluations are being undertaken to select sites for the
installation. The sites considered are the coastal and high elevation areas of the country.
Table 2 (below) shows wind resources potential and capacities while figure 4 (below)
potential areas for wind power installation in Ghana. The eastern coastlines seem
promising which can generate up to 5,600MW covering about 1,128km2 (MoE & P
2013; NREL 2014). According the VRA (2013), the first wind power project is been
under construction and estimated to be completed in 2015 with an output of 150MW.
Ghana’s bio energy prospective is in biomass in form of charcoal and wood fuel which
account for about 72% of total energy consumption. The reason is due to the fact that
wood fuel is very easy to afford. Two-third (about 18.3Mha) of Ghana’s land mass is
covered with trees. With an annual rainfall of 1,300 – 2,200 mm, Ghana can produce
243PJ/year or 65,000GWh/year of wood fuel (MoE & P 2013; Ahiataku-Togobo 2012;
Nutsukpo et al 2012).
Table 2. Gross wind resource potential of Ghana Adopted: MoE & P (2013)
Wind
Resource
Utility
Scale
Wind
class
Wind
Power at
50m
(W/m2)
Wind
Speed at
50m
(m/s)
Total
Area
Km2
Percent
Windy
land
Total
capacity
Installed
(MW)
Moderate 3 300–400 6.4 – 7.0 715 0.3 3,575
Good 4 400 – 500 7.0 – 7.5 268 0.1 1,340
Excellent 5 500 – 600 7.5 – 8.0 82 0.1 410
Excellent 6 600 – 800 8.0 – 8.8 63 0.1 315
Total 1,128 0.5 5,640

25
Figure 4. Ghana wind distribution Source: NREL 2014
2.1.2 Ghana’s energy policies
In order to tackle the shortage, energy technical administrations and institutions are
scrambling to increase production. The increase in demand for power generations is
caused by inefficient appliances which account to 30% of total electricity generation
26
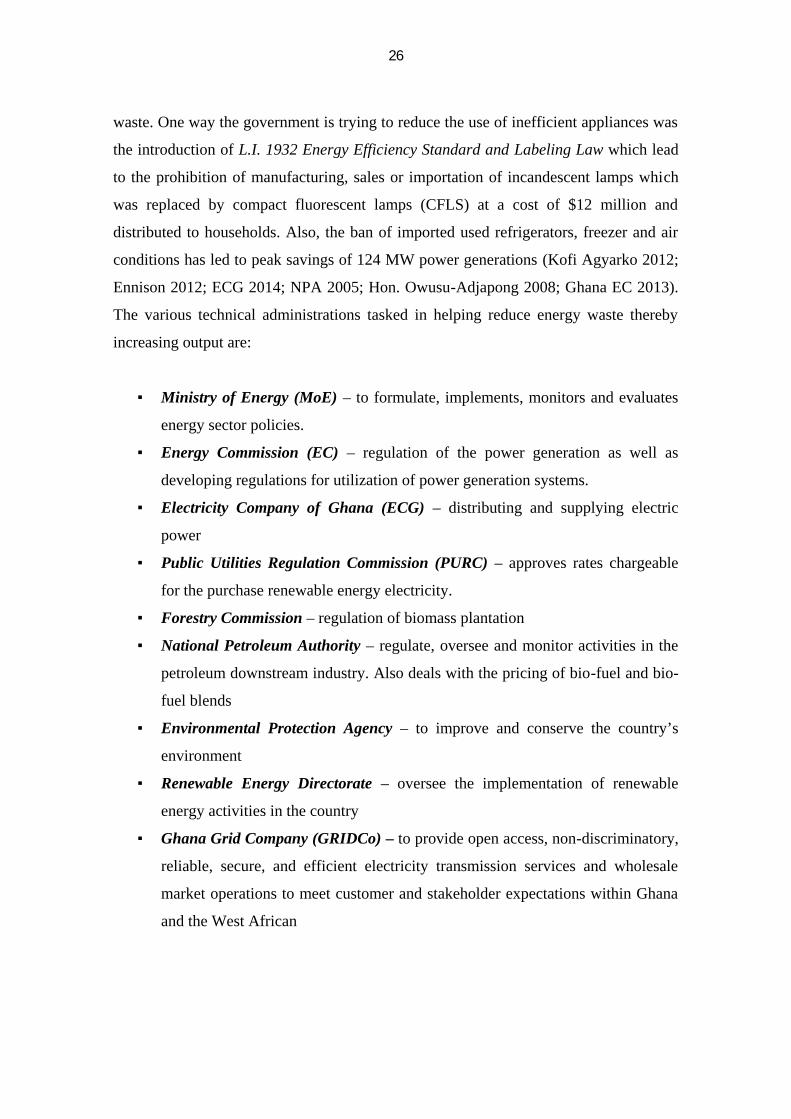
waste. One way the government is trying to reduce the use of inefficient appliances was
the introduction of L.I. 1932 Energy Efficiency Standard and Labeling Law which lead
to the prohibition of manufacturing, sales or importation of incandescent lamps which
was replaced by compact fluorescent lamps (CFLS) at a cost of $12 million and
distributed to households. Also, the ban of imported used refrigerators, freezer and air
conditions has led to peak savings of 124 MW power generations (Kofi Agyarko 2012;
Ennison 2012; ECG 2014; NPA 2005; Hon. Owusu-Adjapong 2008; Ghana EC 2013).
The various technical administrations tasked in helping reduce energy waste thereby
increasing output are:
▪ Ministry of Energy (MoE) – to formulate, implements, monitors and evaluates
energy sector policies.
▪ Energy Commission (EC) – regulation of the power generation as well as
developing regulations for utilization of power generation systems.
▪ Electricity Company of Ghana (ECG) – distributing and supplying electric
power
▪ Public Utilities Regulation Commission (PURC) – approves rates chargeable
for the purchase renewable energy electricity.
▪ Forestry Commission – regulation of biomass plantation
▪ National Petroleum Authority – regulate, oversee and monitor activities in the
petroleum downstream industry. Also deals with the pricing of bio-fuel and bio-
fuel blends
▪ Environmental Protection Agency – to improve and conserve the country’s
environment
▪ Renewable Energy Directorate – oversee the implementation of renewable
energy activities in the country
▪ Ghana Grid Company (GRIDCo) – to provide open access, non-discriminatory,
reliable, secure, and efficient electricity transmission services and wholesale
market operations to meet customer and stakeholder expectations within Ghana
and the West African

27
The Ministry of Ghana in 2001, drafted an energy sector policy framework as a
platform towards the development of the energy sector. A review of this policy was
conducted in 2006 by key stakeholders and revised to meet Growth and Poverty
Reduction Strategy II known as GPRS II. These policies are design to help improve the
current challenges facing the energy sector in Ghana. It was noted in the report that
Ghana is rich with various energy resources such as biomass, hydrocarbons,
hydropower, solar and wind. Also, Ghana has the capacity to produce bio-fuel and
nuclear energy. The energy policies cover a wide range of issues. These issues are
classifies based on the energy sub-sectors such as power sub-sector, petroleum
subsector, renewable energy subsector (just to mention a few) (Ndzibah 2010; Ndzibah
2013; MoE-Ghana 2009; Ennison 2012).
Regarding the power sub-sector, there is a plan to increase power generation by
installing 5,000 MW to improve universal affordability by 2015. Petroleum sub-sector
policy goal is to “ensure the sustainability exploration of the country’s oil and gas
endowment and the judicious management of the oil and gas revenue for the overall
benefit of Ghanaians as well as a commitment of indigenization of knowledge, expertise
and technology”. As for the renewable energy sub-sector policy, some of the challenges
are how to reverse and improve the production and use of wood fuel resources,
improving the production of biomass and how to reduce the high cost in both solar and
wind energy production. As part of observation, it was clear that energy efficiency and
conservation policy will help improve production and transportation which will reduce
wastage hence, benefitting the national economy. Finally, in the managing the future,
there is a need to address energy management as well as to mobilize future investments
in the energy sector (MoE 2007; MoE, 2009; Essah 2011; Norton Rose Fulbright 2013).
2.2 Renewable energy policies in Ghana
Renewable energy sources have been identified as a means capable with significant role
in the nation’s energy portfolio. In 2010, the industrial, residential and commercial
sectors accounted for 46%, 40% and 14% respectively of the total electricity end-use in

28
Ghana. Currently, 90-95% of the Ghana’s energy is obtained from wood fuel with
biomass accounting to more than 60%, 5-10% hydro and less than 1% from
photovoltaic energy. Due to limited renewable energy source in Ghana, in December
2011, renewable energy law was promulgated. The Renewable Energy Act is meant to
provide development, management and utilization of renewable energy sources for the
production of both heat and power in an efficient and environmental way. The law
explained renewable energy as energy sourced from non-depleting sources and these
includes wind, bioenergy, solar, geothermal, ocean energy and hydro power (with
capacity not more than 100MW). As part of this policy, the government plans to
decentralize electricity supply by breaking the monopoly by the public sector to
improve regulatory transparency (Ndzibah 2013; Ennison 2012; Kpekpena 2014).
Furthermore, the creation of Strategic National Energy Plan (SNEP) for 2006 - 2020
also adds to the government determination to improve the use of renewable energy. This
policy focuses on import and usage of renewable energy products in the Ghana and the
connection to international renewable energy sector. Additionally, this policy aim at
reducing wood fuel energy consumption by 30% by 2015 and further by 2020. Also, the
use of biogas should increase its share to 1% by 2015 and 2% by 2020 with limit to
hotels, restaurants and institutional kitchens. Due to the international connections,
Ghana has signed international environmental protocol notable, the United Nation’s
Millennium Development Goals (UNMDG) among others to eradicate poverty and
hunger by promoting sustainable energy, environmental policies and to protect future
generations (REEGLE 2014; ECOWREX 2011; REEEP 2009; Ndzibah 2013; Ghana-
EC 2009)
The creation of Independent Power Producers (IPPs) with the recognitions by the
government of Ghana has a great importance to the achievement of these international
and domestic expansion objectives. According to Norton Rose Fulbright (2013), one of
the disincentives to private sector investment in power generation projects in Ghana was
the succeeding level of tariffs, which were considered to be too low to be economic due
to the fact that most of the nation’s energy is derived from hydropower projects which

29
has very low cost per kilowatt hour compare to thermal power projects. Table 3 below
shows the effective Feed-in-Tariffs (FIT) implemented by the Ghanaian government.
Table 3. Feed-in-Tariff from September 2013 Adopted: ECREEE 2014
In order to encourage investors, the Public Utilities Regulation Commission (PURC)
have been increasing tariffs aim at cost wistful although there is pressure to keep
consumer tariffs low, which hampers the establishment of fully cost-reflective tariffs
that would support IPPs. As part of the Renewable Energy Act 2011, Act 832 gives
PURC the responsibility to set the Feed-In-Tariff (FIT). The Act stated that the pricing
mechanism for Renewable Energy Technology in Ghana and FIT rate for electricity
generated from renewable energy sources shall be guaranteed for a period of ten (10)
years and subsequently be subject to review every two years” (Ennison 2012; ECREEE
2014).
Renewable energy
Technology
FIT Effective 1st September 2013
(GHp/kWh)
Wind 32.1085
Solar 40.2100
Hydro ≤ 10MW 26.5574
Hydro (10MW˃≤ 100MW) 22.7436
Landfill Gas 31.4696
Sewage Gas 31.4696
Biomass 31.4696

30
3. TECHNOLOGY AND PRODUCT CONFIGURATION
This section of the research defines photovoltaic technologies and its development,
types and components involved in the installation process as well as an in-depth
analysis of various configurations. The introduction of an off grid solution in product
configurations add value to the varied segments be it standalone, backup, or hybrid
system suitable for either households or SMEs.
3.1 Photovoltaic technologies: definition, development, types and installed capacity
Renewable energy technologies can help countries meet their policy goals for secure,
reliable and affordable energy to expand electricity access and promote economic
development. Although there are other sources of energy, renewable energy is being
adopted and account for the majority of capacity additions in power generation today
(IRENA 2012). Photovoltaic technology is one of the essential forms of renewable
energy that will help offset the deficit created by the demand and supply of electric
energy in most developing economy. Furthermore, such reliable technology has a
significant potential for long-term growth in nearly all regions (IEA & OECD 2010).
The Photovoltaic Sustainable Resources (2014) defines the term “photovoltaic” with
two words – “photo” which means light (photon) and “voltaic” which means voltage
(“volt” – unit of electric potential). The way photovoltaic systems generates electricity
process is no different from the way plants converts sunlight or the energy from the sun
to store food (see also - Green Peace & EPIA 2011).
According to the World Energy Council (2007), photovoltaic conversion “is the direct
conversion of sunlight into electricity with no intervening heat engine”. Photovoltaic
devices are rugged and simple in design and need very little maintenance. As such, the
major advantage of solar photovoltaic is the ability to assemble a stand-alone system to
give outputs from microwatts to megawatts. For this reason, they have been used as the
power source for calculators, watches, remote buildings, satellites and space vehicles. In

31
some area, megawatt-scale power plants have been commissioned and constructed to
support electricity production (Viessmann 2009; IEA PVPS 2013).
The history and development of solar technology started from the 17th Century B.C.
with the magnifying glass and the first solar collector in 1767.The first solar cells was
made from selenium wafers by Charles Fritts in 1883 but the phenomenon known as the
photovoltaic effect was discovered by Edmund Bacquerel in 1839. The development of
photovoltaic technology started in the 1950’s but gain more attention in the 1960’s with
NASA’s space program. Since then, the technology has been improved and today some
of the largest rooftop and solar farms for power generation are in operation (EERE
2014; The Solar Cooking 2014; Masson 2013; IEA-PVPS 2013; Dahl T. 2012).
A collection of photovoltaic cells make up a single modular unit. These cells are
sometimes known as solar cells; which convert light into electricity through a
semiconductor material (e.g. silicon) (Howard 2005; Fernandes et al 2014). According
to Ndzibah (2013), photovoltaic design platform is a semiconductor device prepared
from silicon. Monocrystalline and polycrystalline are the two most common crystalline
silicon solar cells while others models are made from ribbon, thin film technologies, and
concentrating photovoltaic (CPV) all with varying output capacity (Evo Energy 2012;
EPVTP 2011).
Even though the installations and procurement of photovoltaic systems are expensive,
the prices have been falling as a result of many manufacturers in the market and the
advancement in technology. Figure 5 (below) shows the annual growth of photovoltaic
installations around the world. Although, there is a need for further research and
development to improve the efficiency of all types of cells.(Viessmann 2009; RENI
2012; Mitavachan et al 2011; IEA PVPS 2013).

32
Figure 5. Annual evolution of PV capacity Source: IEA PVPS 2013
The efficiency of photovoltaic module is important during decision making process for
the purchasing and installation of a photovoltaic system. This is because the power
output of photovoltaic panels are not the same hence the prices. Figure 11 below shows
advancement in photovoltaic development by different companies and research groups
since 1975. Furthermore, more research needed to increase and optimise maximum
power output using these photovoltaic technologies (Laser Focus World 2010).

33
Figure 6. Photovoltaic efficiency in converting light to electricity Source: Laser Focus World (2010)
Pros and Cons of photovoltaic technologies
As the demand for energy grows especially in non-OECD nations, many are thinking
about the adoption of alternative means of generating electricity (EIA 2013).
Photovoltaic systems could be an ideal choice since the source of fuel is naturally free
and abundant (Green D. 2012).
Photovoltaic systems provide clean energy. When compare with generators or power
plants, photovoltaic system does not use fossil fuel, therefore there is no GHG; making
it an environmental friendly source of energy. Unlike power plants and generator,
photovoltaic systems do not make noise making them suitable for both urban and
residential use. The high cost of photovoltaic system often makes it difficult for people
to invest but in recent time, most government provides subsidies for the installation.

34
These subsidies are in a form of Feed in Tariffs (FITs), tax credits, low interest rates etc.
(IEA 2012; Green 2012; Rio & Mir-Artigues 2014; CEC 2008).
Solar energy is subjected to irregular supply of sun light due to weather condition, day
and night and this leads to unpredictability. As a result of this limitation, storage
systems such as battery are used in photovoltaic systems. The initial cost involve is
high. Even though in some country subsidies are provided, this is not a common
practice in other countries. The efficiency of photovoltaic panels (between 14% - 25%)
is too low compare to other renewable energy systems. Furthermore, the cost of insuring
the systems is high (Green 2012; Practical Action 2012).
3.2 Types of components in a photovoltaic system
Photovoltaic system may include panels, charge controller, batteries and inverters.
These various components must be integrated properly to ensure safety and optimized
maximum output during operation. The configurations of these components can be
arranged either in series or parallel with the load either direct current (DC), alternate
current (AC) or both (Whitaker et al. 2008; Mehrotra et al 2013; AIEDAM 2003; Haug
et al 2012; Schimpf & Norum 2008; Zeman 2014).
Photovoltaic modules: These are made up of solar cells. A solar cell is formed from
silicon - semi-conductor. Silicon is the second most abundant element on earth found in
quartz and sand. These solar cells are the unit which converts sunlight to electricity.
The cells are often connected together to produce voltage capable of charging 12 or 24
volt battery. A collection of cells make up photovoltaic modules which when put
together forms photovoltaic arrays. These photovoltaic arrays are also made up of any
support structure and inter-connection. Photovoltaic module is the building block of
photovoltaic systems (Ndzibah 2013; Sustainable Resources 2014; Brooks 2014; Patel
2006).

35
Monocrystalline and polycrystalline silicon photovoltaic are two of the most common
photovoltaic cells with an average annual growth of 40% (Goodrich et al. 2013;
Dobrzanski et al. 2012). There are other types of photovoltaic cells such as amorphous
silicon, cadmium telluride (CdTe) and thin film (Prida et al. 2011), figure 12 indicate
the main groups of materials for the production of photovoltaic cells (Dobrzanski et al.
2012). Monocrystalline silicon photovoltaic are highly efficient solar cell with robust
design and the highest conversion efficiency (17% - 24 %) of all the silicon solar cells
while polycrystalline silicon photovoltaic cell is made from large block of silicon and
the cells are less efficient compare to monocrystalline (Redarc 2011; Dobrzanski et al.
2012).
Figure 7. Classification of solar cells materials Sources: Dobrzanski et al. 2012
Series vs. Parallel connections: Connecting photovoltaic module in series or parallel
depends of the required output. Photovoltaic modules arranged in series will yield high
voltage (V) while the one arranged in parallel yields high current (I) (Pearsall & Hill

2001; Obinata et al. 2010).
configuration of photovoltaic modules respectively. The configuration in both series and
parallel uses two photovoltaic modules with each operating at 12VDC at 3amp. The
configuration in parallel produces 12
configuration in series which output voltage is double to 24 volt while the current is half
at 3amp. The reason for obtaining different voltage or current output to power the load
can be clarified using Ohm’s
Adopted: Dahl
Ohm’s law explains the relationship between current and voltage which state that the
voltage passing through a circuit is directly proportional to the product of the current
and resistor. This is illustrated in equation (1) (MSU 2014; Sparkfun 2014). Accor
to Rahman et al. (2012), when a photovoltaic module is directly connected to a load, the
operating point of the photovoltaic module will be at the intersection of its I
This means that the load is directly proportional to the voltage and inve
proportional to the current. Hence, resistor in equation (1) is the load.
Figure
2001; Obinata et al. 2010).
configuration of photovoltaic modules respectively. The configuration in both series and
parallel uses two photovoltaic modules with each operating at 12VDC at 3amp. The
configuration in parallel produces 12
configuration in series which output voltage is double to 24 volt while the current is half
at 3amp. The reason for obtaining different voltage or current output to power the load
can be clarified using Ohm’s
Adopted: Dahl (2012)
Ohm’s law explains the relationship between current and voltage which state that the
voltage passing through a circuit is directly proportional to the product of the current
and resistor. This is illustrated in equation (1) (MSU 2014; Sparkfun 2014). Accor
to Rahman et al. (2012), when a photovoltaic module is directly connected to a load, the
operating point of the photovoltaic module will be at the intersection of its I
This means that the load is directly proportional to the voltage and inve
proportional to the current. Hence, resistor in equation (1) is the load.
A
Figure 8. Parallel and series connections of photovoltaic panels
2001; Obinata et al. 2010).
configuration of photovoltaic modules respectively. The configuration in both series and
parallel uses two photovoltaic modules with each operating at 12VDC at 3amp. The
configuration in parallel produces 12
configuration in series which output voltage is double to 24 volt while the current is half
at 3amp. The reason for obtaining different voltage or current output to power the load
can be clarified using Ohm’s
(2012)
Ohm’s law explains the relationship between current and voltage which state that the
voltage passing through a circuit is directly proportional to the product of the current
and resistor. This is illustrated in equation (1) (MSU 2014; Sparkfun 2014). Accor
to Rahman et al. (2012), when a photovoltaic module is directly connected to a load, the
operating point of the photovoltaic module will be at the intersection of its I
This means that the load is directly proportional to the voltage and inve
proportional to the current. Hence, resistor in equation (1) is the load.
A: Parallel
Parallel and series connections of photovoltaic panels
2001; Obinata et al. 2010). Figure 13 A and B shows the parallel and series
configuration of photovoltaic modules respectively. The configuration in both series and
parallel uses two photovoltaic modules with each operating at 12VDC at 3amp. The
configuration in parallel produces 12
configuration in series which output voltage is double to 24 volt while the current is half
at 3amp. The reason for obtaining different voltage or current output to power the load
can be clarified using Ohm’s law (MSU 2014).
Ohm’s law explains the relationship between current and voltage which state that the
voltage passing through a circuit is directly proportional to the product of the current
and resistor. This is illustrated in equation (1) (MSU 2014; Sparkfun 2014). Accor
to Rahman et al. (2012), when a photovoltaic module is directly connected to a load, the
operating point of the photovoltaic module will be at the intersection of its I
This means that the load is directly proportional to the voltage and inve
proportional to the current. Hence, resistor in equation (1) is the load.
Parallel and series connections of photovoltaic panels
36
Figure 13 A and B shows the parallel and series
configuration of photovoltaic modules respectively. The configuration in both series and
parallel uses two photovoltaic modules with each operating at 12VDC at 3amp. The
configuration in parallel produces 12 volt at 6amp to power the load compare to the
configuration in series which output voltage is double to 24 volt while the current is half
at 3amp. The reason for obtaining different voltage or current output to power the load
law (MSU 2014).
Ohm’s law explains the relationship between current and voltage which state that the
voltage passing through a circuit is directly proportional to the product of the current
and resistor. This is illustrated in equation (1) (MSU 2014; Sparkfun 2014). Accor
to Rahman et al. (2012), when a photovoltaic module is directly connected to a load, the
operating point of the photovoltaic module will be at the intersection of its I
This means that the load is directly proportional to the voltage and inve
proportional to the current. Hence, resistor in equation (1) is the load.
Parallel and series connections of photovoltaic panels
Figure 13 A and B shows the parallel and series
configuration of photovoltaic modules respectively. The configuration in both series and
parallel uses two photovoltaic modules with each operating at 12VDC at 3amp. The
volt at 6amp to power the load compare to the
configuration in series which output voltage is double to 24 volt while the current is half
at 3amp. The reason for obtaining different voltage or current output to power the load
Ohm’s law explains the relationship between current and voltage which state that the
voltage passing through a circuit is directly proportional to the product of the current
and resistor. This is illustrated in equation (1) (MSU 2014; Sparkfun 2014). Accor
to Rahman et al. (2012), when a photovoltaic module is directly connected to a load, the
operating point of the photovoltaic module will be at the intersection of its I
This means that the load is directly proportional to the voltage and inve
proportional to the current. Hence, resistor in equation (1) is the load.
B
Parallel and series connections of photovoltaic panels
Figure 13 A and B shows the parallel and series
configuration of photovoltaic modules respectively. The configuration in both series and
parallel uses two photovoltaic modules with each operating at 12VDC at 3amp. The
volt at 6amp to power the load compare to the
configuration in series which output voltage is double to 24 volt while the current is half
at 3amp. The reason for obtaining different voltage or current output to power the load
Ohm’s law explains the relationship between current and voltage which state that the
voltage passing through a circuit is directly proportional to the product of the current
and resistor. This is illustrated in equation (1) (MSU 2014; Sparkfun 2014). Accor
to Rahman et al. (2012), when a photovoltaic module is directly connected to a load, the
operating point of the photovoltaic module will be at the intersection of its I
This means that the load is directly proportional to the voltage and inve
proportional to the current. Hence, resistor in equation (1) is the load.
B: Series
Parallel and series connections of photovoltaic panels
Figure 13 A and B shows the parallel and series
configuration of photovoltaic modules respectively. The configuration in both series and
parallel uses two photovoltaic modules with each operating at 12VDC at 3amp. The
volt at 6amp to power the load compare to the
configuration in series which output voltage is double to 24 volt while the current is half
at 3amp. The reason for obtaining different voltage or current output to power the load
Ohm’s law explains the relationship between current and voltage which state that the
voltage passing through a circuit is directly proportional to the product of the current
and resistor. This is illustrated in equation (1) (MSU 2014; Sparkfun 2014). Accor
to Rahman et al. (2012), when a photovoltaic module is directly connected to a load, the
operating point of the photovoltaic module will be at the intersection of its I–V curve.
This means that the load is directly proportional to the voltage and inve
Figure 13 A and B shows the parallel and series
configuration of photovoltaic modules respectively. The configuration in both series and
parallel uses two photovoltaic modules with each operating at 12VDC at 3amp. The
volt at 6amp to power the load compare to the
configuration in series which output voltage is double to 24 volt while the current is half
at 3amp. The reason for obtaining different voltage or current output to power the load
Ohm’s law explains the relationship between current and voltage which state that the
voltage passing through a circuit is directly proportional to the product of the current
and resistor. This is illustrated in equation (1) (MSU 2014; Sparkfun 2014). According
to Rahman et al. (2012), when a photovoltaic module is directly connected to a load, the
V curve.
This means that the load is directly proportional to the voltage and inversely

37
푽 = 푰 × 푹 (1)
Where:
푽 = 푉표푙푡푎푔푒 (푣표푙푡)
푰 = 퐶푢푟푟푒푛푡 (푎푚푝)
푹 = 푅푒푠푖푠푡표푟 (표ℎ푚푠)
Table 4 shows how voltage and current can be calculated when configuring either a
series or parallel photovoltaic system. The equations can be considered when two
resistors or in this case two load.
Table 4. Photovoltaic module voltage and current calculations
Series Parallel
푽풕풐풕풂풍 = 푽ퟏ + 푽ퟐ 푽풕풐풕풂풍 = 푽ퟏ = 푽ퟐ
푰풕풐풕풂풍 = 푰ퟏ = 푰ퟐ 푰풕풐풕풂풍 = 푰ퟏ + 푰ퟐ
Basic technical parameter for photovoltaic module
Photovoltaic panel calculation: The number of solar panel required in a photovoltaic
system depends on the photovoltaic watts at the installation location. Since solar
irradiance varies from location to location, the photovoltaic watts need to be calculated.
The values obtained might vary from month-to-month. Therefore to achieve a
maximum power output from the photovoltaic power, it is advisable to use the lowest
photovoltaic watt for that location. There are software and web applications that can be

38
used to obtain the exact photovoltaic watts (Budischak 2013; Marion et al 2001; Dobos
2013; Enphase Energy 2013).
The unit for photovoltaic panel is measured in kilowatt hour for every square meter in a
day. This is written as 푘푊ℎ/푚 /푑푎푦. This unit is sometimes called sun hours and also
having unit of hours/day (ℎ/푑푎푦). According to Ndzibah (2013), the lowest
photovoltaic watts or sun hour for Greater Accra is 4.35 푘푊ℎ/푚 /푑푎푦. The variations
in solar irradiation are caused by topography, humidity and clouds. Greater Accra is
used due to existence of valid working examples which provides more parameters. We
can calculate how many panels are needed to power the load in the Greater Accra, the
capital of Ghana. Assuming the panel operate at 100 푤푎푡푡푠 at full sunlight, the energy
produced (푘푊ℎ/푑푎푦) by one panel will be:
→ 4.35ℎ푟푠푑푎푦
× 100 푤푎푡푡푠
1 푠표푙푎푟 푝푎푛푒푙 ×
1 푘푖푙표푤푎푡푡1000 푤푎푡푡푠
=
0.435 푘푊ℎ푑푎푦
1 푠표푙푎푟 푝푎푛푒푙
= 0.435kWh/day/panel
Assuming the total energy required by the load was 0.4 kWh/day, the total number of
panel needed can be obtained as follows:
→ 0.4 푘푊ℎ푑푎푦
÷
0.435 푘푊ℎ푑푎푦푝푎푛푒푙
= 0.4 푘푊ℎ푑푎푦
× 푑푎푦 /푝푎푛푒푙0.435 푘푊ℎ
= 0.9195 푝푎푛푒푙 ~ 1 푝푎푛푒푙
Photovoltaic Inverters: Inverters plays a major role in the configuration of photovoltaic
systems. Photovoltaic inverter converts direct current (DC) from photovoltaic panels or
modules into utility frequency alternating current (AC) which can be fed to appliances.

39
Therefore, any unit that can convert a 12-volt battery or a direct solar current to 220/230
volt electricity is an inverter. According to Hills and Pearsall (2001), inverters used in
standalone are capable of “operating independently from a utility grip and uses an
internal frequency generator to obtain the correct output frequency (50/60 Hz)” but this
is different when it comes to grid-connected. Generally, inverters have efficiencies
ranging from 90% to 96% for full load and from 85% to 95% for 10% load (especially
for loads that need surge voltage) (Ndzibah 2013; Hill & Pearsall 2001; Zeman 2014).
There are basically two types of inverters – pure sine wave (PSW) inverter and modified
sine wave (MSW) inverter. However, it is worth mentioning that in recent years, the
module-integrated inverter has been developed to be positioned on the back of a module
and converting the electrical output from a single module and specifically designed for
grid-connected applications. The PSW with total harmonic distortion (THD) is used to
operate sensitive electronic devices needed for clean, near-sine-wave outputs for
instruments like medical equipment and other critical applications with an embedded
motorized system whereas MSW designed to satisfy the efficiency of photovoltaic
system at a less cost when compared to PSW. MSW is used in a wide variety of loads,
electronics and household items such as TV, computer and satellite (Hahn 2006; Wilson
2011; Turna 2011; Hill & Pearsall 2001).
Basic technical parameter for an inverter
Inverter input power: The basic function of the inverter is to convert DC power
produced by the photovoltaic modules to AC in other to power electrical loads. This is
done by switching on and off the power transistors at high frequency to obtain power
from the photovoltaic modules during their maximum power output (Patel 1999; Gilbert
2004). According to Budischak (2013), the efficiency of inverter (휂 ) can be
obtained using the following equation:
휼풊풏풗풆풓풕풆풓 = 푂푢푡푝푢푡 푝표푤푒푟퐼푛푝푢푡 푝표푤푒푟
→ 풊풏풑풖풕 풑풐풘풆풓 = 푂푢푡푝푢푡 푝표푤푒푟
휂 (2)

40
Where:
휼 = 퐸푓푓푖푐푖푒푛푐푦
Khatib et al. (2012) explained that equation (2) can be used when the loss produced by
the inverter during output is not considered. This loss is not constant and can depend on
many conditions making it difficult to be calculated. Therefore, an alternative model for
inverter efficiency needs to be developed in order to estimate the inverter’s exact output
power.
For example, assuming the inverter has an efficiency of 55% with an output of 100
watts. Using the (2), the input power of the inverter will be:
풊풏풑풖풕 풑풐풘풆풓 = 푂푢푡푝푢푡 푝표푤푒푟
휂=
100푤푎푡푡푠55%
= 181.8 푤푎푡푡푠
The input power of 200 watts does not mean that is the maximum. All inverters come
with a rated maximum input or upper limit rating which varies depending on type and
manufacture (Chiasson et al 2005; Bower et al. 2004; Tolbert et al. 2000).
Photovoltaic Charge controller: For a prolonged battery life, a charge controller is
needed. This is because charge controller help sense the battery voltage by reducing and
stopping charged current when the voltage is too high. Charge controllers also prevent
photovoltaic modules from overcharging the battery and over discharging during
operation of the system. Without the charge controller, the excessive voltage could
easily damage the batteries (Ndzibah 2013; Sustainable Resources 2014; Solar Direct
2014).

41
Basic technical parameter for charge controller
Charge controller amperage: Charge controllers are rated and sized by the solar panel
array current and the system voltage. The most common are 12, 24, and 48 volt charge
controllers. The amperage ratings normally run from 1 amp to 60 amps while the
voltage is between 6 and 60 volts (PV Depot 2014).
From equation 2, the voltage passing through the inverter was calculated. According to
Rahman et al. (2012), for any given set of operational conditions, cells have a single
operating point where the values of the current (I) and voltage (V) result in a maximum
power output. These values correspond to a particular load resistance which can be
represented using 푹 = 푽푰 as specified by Ohm’s Law. To obtain the amperage using
basic circuit theory, the following equation needs to be utilized:
푷 = 푰 × 푽 (3)
Where:
푷 = 푃표푤푒푟 (푤푎푡푡푠)
푰 = 퐶푢푟푟푒푛푡 (푎푚푝)
푽 = 푉표푙푡푎푔푒 (푣표푙푡)
Therefore, the power can be calculated. Assuming the charge controller is operating at
24 volt with an amperage of 10 amps and an efficiency of 100%:
푷 = 퐼 × 푉 = 24 × 10 = 240 푤푎푡푡푠

42
Battery: The battery serves as a storage device for the voltage generated by the solar
cells. They are the simplest means of storing electricity and are essential in standalone,
backup and hybrid configurations (Harrington et al. 1992). The stored voltage are later
used during power disruption or to power some appliances while the electricity from the
grid is used for equipment or appliances that required more energy to operate (Ndzibah
2013; Sustainable Resources 2014). The life cycle of a battery is related to the depth-of-
discharge (Dunlop & Farhi 2001; Spiers & Royer 1998). The capacity of a battery is
rated in amp-hour (Ah) at a given voltage e.g. 220Ah at 6 volts. One amp delivered for
1 hour is equivalent to 1 amp-hour. According to Zeman (2014), there are some factors
needed to be considered before purchasing a battery for use in a photovoltaic system.
These are:
▪ Operating temperature range (e.g.: -15°C to 50°C)
▪ Self-discharge rate (% per month)
▪ Required frequency for topping up the electrolyte
▪ Cycle life to 80% depth of discharge (DOD)
▪ Charge efficiency from 20% discharged
▪ Capacity (Ah) at 10hr and 100hr rates (C10 & C100)
▪ Resistance to overcharging
▪ Cost
There are two types of batteries – lead-acid batteries and alkaline batteries. Lead-acid
batteries are of three kinds – flooded lead-acid, gelled electrolyte and absorbed glass
mat (AGM). Gelled electrolyte and absorbed glass mat are known as sealed or valve-
regulated lead-acid (VRLA) batteries. This is because they do not need additional water
unlike the flooded lead-acid batteries. Instead, valves are installed in each cell to
prevent build-ups of gases which is caused by excessive overcharge. This type of
problem is rectifiable in flooded lead-acid batteries due to the fact that it is not sealed
and water can be added. Lead-acid batteries are the most common used in photovoltaic
configurations (Zeman 2014; Spiers & Royer 1998; EMTC 1981). According to Dunlop
& Farhi (2001); alkaline batteries are often used in extreme climate conditions. The two
most commonly used are nickel-cadmium and nickel-metal-hydride. However, they are

43
expensive due to the lack of availability (see also Medved et al. 2011). In developing
country such as Ghana gelled electrolyte batteries is highly recommended. This is gelled
electrolyte batteries has been known to be very efficient due to its ability to withstand
high temperature
Batteries can be connected in series, parallel or series/parallel depending on the
configuration in mind (Baghzouz 2014; Medved et al. 2011). The principle of Ohm’s
law can be applied to batteries. Voltage calculation using Ohm’s law can be applied to
batteries connected in series or parallel (Dahl 2012). Example, the total voltage in a
configuration of 6 batteries in series with each measuring 2VDC will yield 12V. When
compared to 2 batteries configured in parallel with each one measuring 12VDC, the
output will be the same i.e. 12V.
Basic technical parameter for battery
Number of batteries: The number of batteries depends on the amount of energy needed
to power the load. Assuming the total energy needed to power the load for 4 ℎ표푢푟푠
every day was 0.4 kWh/day and the battery is 10Ah at 12 volts while the load uses the
energy for 3 days:
→ 0.4 푘푊ℎ푑푎푦
× 3 푑푎푦푠 = 1.2 푘푊ℎ
But since the battery is measure in amp hours, ohms law can be used to calculate
current (amp hour) using equation (3):
푰 = 푃푉
= 1.2 푘푊ℎ12 푣표푙푡
= 0.1 푘퐴ℎ × 1000 퐴ℎ
1 푘퐴ℎ = 100 푎푚푝ℎ표푢푟푠
44
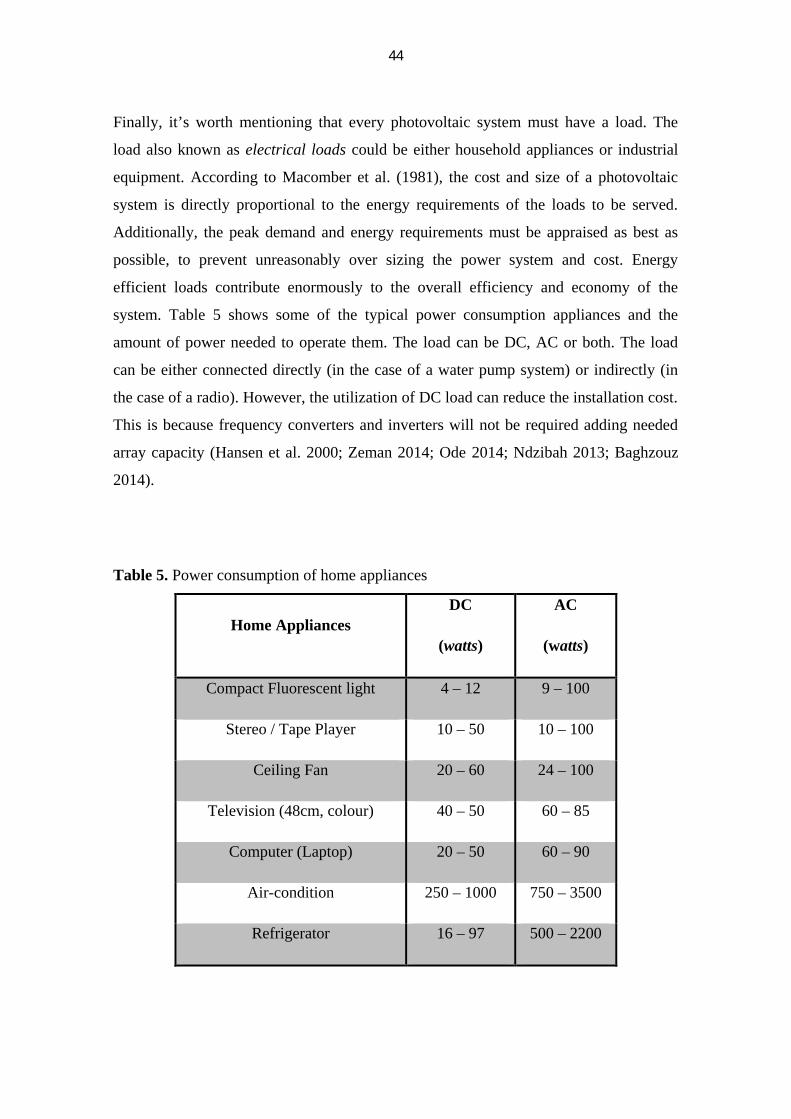
Finally, it’s worth mentioning that every photovoltaic system must have a load. The
load also known as electrical loads could be either household appliances or industrial
equipment. According to Macomber et al. (1981), the cost and size of a photovoltaic
system is directly proportional to the energy requirements of the loads to be served.
Additionally, the peak demand and energy requirements must be appraised as best as
possible, to prevent unreasonably over sizing the power system and cost. Energy
efficient loads contribute enormously to the overall efficiency and economy of the
system. Table 5 shows some of the typical power consumption appliances and the
amount of power needed to operate them. The load can be DC, AC or both. The load
can be either connected directly (in the case of a water pump system) or indirectly (in
the case of a radio). However, the utilization of DC load can reduce the installation cost.
This is because frequency converters and inverters will not be required adding needed
array capacity (Hansen et al. 2000; Zeman 2014; Ode 2014; Ndzibah 2013; Baghzouz
2014).
Table 5. Power consumption of home appliances
Home Appliances DC
(watts)
AC
(watts)
Compact Fluorescent light 4 – 12 9 – 100
Stereo / Tape Player 10 – 50 10 – 100
Ceiling Fan 20 – 60 24 – 100
Television (48cm, colour) 40 – 50 60 – 85
Computer (Laptop) 20 – 50 60 – 90
Air-condition 250 – 1000 750 – 3500
Refrigerator 16 – 97 500 – 2200

45
Basic technical parameter for load
Load energy usage: Various loads use different energy and they could be either DC or
AC. AC loads consume more energy than DC loads as seen in table 13. These loads are
also known as appliances (Zeman 2014). The load energy usage is the amounts of
energy required to power or operate a load or appliance taking into consideration for
how long an appliance will be powered on when it is connected to a photovoltaic
system. The energy consumed by a load or appliance is measured in kilowatts hour
(kWh) i.e. the unit of energy (Packer 2011; OECD/IEA 2010). Therefore, assuming the
load is a light bulb and consumes 100 watts for 4 hours every day all year round. This
needs to be converted to the amount of energy the bulb will use in a day. This can be
done by converting the 100 watts to kilowatts and multiply it by the hours.
100 푤푎푡푡푠 = 1 푘푖푙표푤푎푡푡1000 푤푎푡푡푠
× 4 ℎ표푢푟푠푑푎푦
=0.4 푘푊ℎ푑푎푦
This means that the amount of energy consumed by the bulb in a day will be 0.4 kWh.
With this in mind, the amount of energy the charge controller can supply to the inverter
can be calculated using equation (2) but instead of power, energy is used. Note that the
output energy in now the amount of energy consumed by the bulb.
→ 풊풏풑풖풕 풆풏풆풓품풚 = 푂푢푡푝푢푡 energy
휂 =
0.4 푘푊ℎ푑푎푦55%
= 0.73 kWh/day
Figure 15 gives a summary of all the basic technical parameters. These basic technical
parameters can be used to configure either as standalone, backup or hybrid depending
on market segment. Note that other parameters such as the type and efficiency of the

46
components were not taken into consideration during the calculation. These and many
more parameters could affect the outcome of the results when the calculations are done
in the field or the location where they need to be installed.
Figure 9. Summary of technical parameters
3.3 Configuration of photovoltaic systems: Standalone, Backup and Hybrid
The interest in photovoltaic is greater than ever and thus, an increase in the installation
of photovoltaic systems. The installations of photovoltaic systems are getting larger and
the interactive with utility grid is growing (Whitaker et al. 2008). For this reason, there
are various types of photovoltaic systems and configurations. This section of the
research will look at the various photovoltaic configurations. The way the parts are put
together or arranged is referred to as configuration (Merriam Webster 2014).

47
Product configuration is a way of modifying a product or components to meet the needs
of a particular customer. The components that make up a photovoltaic system consist of
mechanical parts, services, and or software. There are different types of photovoltaic
configuration and for this research, standalone; backup and hybrid (Ndzibah 2013) will
be the main focus. Although, there are other classification of photovoltaic systems other
than the one mentioned earlier. According to EMA & BCA (2009), there are two types
of systems:
▪ Grid- Connected: these are systems whereby photovoltaic system is connected
to the utility grid. They often contain photovoltaic panels, solar inverters,
maximum power point tracking (MPPT) and grid connection equipment
(Schimpf & Norum 2008).
▪ Off-Grid Connected: as the name implies, these types of systems are relevant for
areas not connected to the utility grid. Generally, these are installed in isolated
areas. Although, they may also be installed within the city (in areas deemed too
expensive to extend electricity). This is often known as standalone photovoltaic
system (EMA & BCA 2009).
Whitaker et al. (2008) further explained that, grid-connected can also be classified as:
▪ Grid connected with storage: this type of system allows solar energy to be
stored, thus increasing self-consumption thereby reducing purchase of power
from the grid whereas;
▪ Grid connected without storage: this type of photovoltaic system does not have
any storage system therefore rely on the power grid when there is disruption in
solar energy from the photovoltaic panel due to bad weather conditions.
Standalone Systems: This type of system is used by people who have no access to the
national electric grid. This means that electrification is solely generated from
photovoltaic system. This could also be classified as an off-grid system (Whitaker et al.
2008; Ndzibah 2013). According to Macomber et al. (1981) a stand-alone electrical
system can be self-sufficient system which contains an array field, power conditioning
and control; battery storage, instrumentation and dc loads. However, a standalone
system may or may not have energy storage. The capacity of the battery must be

48
enough to handle the load(s) it intended to serve (Medved et al. 2011; Spiers & Royer
1998; Solar Direct 2014).
Backup Systems: is recommended for those who have access to the national grid but are
ready to use the photovoltaic system instead of a diesel or petrol powered generator in
case of a power outage (Ndzibah 2013). This type of system could be classified as grid-
connected with storage (Whitaker et al. 2008).
Hybrid system, differ from standalone systems. This type of photovoltaic system is
recommended for specific households or businesses with enormous energy requirement.
Figure 14 shows a hybrid system with an auxiliary power source. According to Hristov
(2014), hybrid signifies a photovoltaic system that is used in conjunction with one or
more auxiliary sources of power. This means secondary sources of power such as wind
or hydroelectric is used. However, many modern hybrid photovoltaic systems uses
fossil fuelled generator or utility grid.
Figure 10. Hybrid system with an auxiliary power source Source: Hristov H. (2014)
For such requirements, key appliances are connected to the grid while the photovoltaic
unit powers other equipment or machineries. The design of a hybrid system should take

into account the inverter capacity. This must correspond to the required energy
consumption (Ndzibah 2013; SMA 2014).
Configuration segments
Photovoltaic systems are often used for many reasons. Some of these reasons includes;
reduce energy cost, reduce GHG footprint and limit reliance on electricity suppliers.
These may be regarded as external factors since the main application may differ
depe
necessitate varied configuration segments. According to Ndzibah (2013), a segment
could either be standalone, backup or hybrid. Nevertheless, the configuration for each of
the se
a photovoltaic system for only lighting (see fig. 11) or for refrigeration while others
might use it to power all the appliances (radio, TV, computer). Figure 16 shows the
relationship between different configuration segments when a backup system is
considered for either a home or business.
Figure
Lighting
into account the inverter capacity. This must correspond to the required energy
consumption (Ndzibah 2013; SMA 2014).
Configuration segments
Photovoltaic systems are often used for many reasons. Some of these reasons includes;
reduce energy cost, reduce GHG footprint and limit reliance on electricity suppliers.
These may be regarded as external factors since the main application may differ
depending on either in a house, business or factory. These different applications
necessitate varied configuration segments. According to Ndzibah (2013), a segment
could either be standalone, backup or hybrid. Nevertheless, the configuration for each of
the segments may vary depending on the application. For example, one might configure
a photovoltaic system for only lighting (see fig. 11) or for refrigeration while others
might use it to power all the appliances (radio, TV, computer). Figure 16 shows the
ionship between different configuration segments when a backup system is
considered for either a home or business.
Figure 11. A configuration segment of a photovoltaic system
Backup Configuration
House
Lighting Refrigeration
into account the inverter capacity. This must correspond to the required energy
consumption (Ndzibah 2013; SMA 2014).
Configuration segments
Photovoltaic systems are often used for many reasons. Some of these reasons includes;
reduce energy cost, reduce GHG footprint and limit reliance on electricity suppliers.
These may be regarded as external factors since the main application may differ
nding on either in a house, business or factory. These different applications
necessitate varied configuration segments. According to Ndzibah (2013), a segment
could either be standalone, backup or hybrid. Nevertheless, the configuration for each of
gments may vary depending on the application. For example, one might configure
a photovoltaic system for only lighting (see fig. 11) or for refrigeration while others
might use it to power all the appliances (radio, TV, computer). Figure 16 shows the
ionship between different configuration segments when a backup system is
considered for either a home or business.
A configuration segment of a photovoltaic system
Backup Configuration
House
Refrigeration
into account the inverter capacity. This must correspond to the required energy
consumption (Ndzibah 2013; SMA 2014).
Photovoltaic systems are often used for many reasons. Some of these reasons includes;
reduce energy cost, reduce GHG footprint and limit reliance on electricity suppliers.
These may be regarded as external factors since the main application may differ
nding on either in a house, business or factory. These different applications
necessitate varied configuration segments. According to Ndzibah (2013), a segment
could either be standalone, backup or hybrid. Nevertheless, the configuration for each of
gments may vary depending on the application. For example, one might configure
a photovoltaic system for only lighting (see fig. 11) or for refrigeration while others
might use it to power all the appliances (radio, TV, computer). Figure 16 shows the
ionship between different configuration segments when a backup system is
considered for either a home or business.
A configuration segment of a photovoltaic system
Backup Configuration
House
Refrigeration
General Home
Appliances (TV, Radio,
fan etc)
49
into account the inverter capacity. This must correspond to the required energy
consumption (Ndzibah 2013; SMA 2014).
Photovoltaic systems are often used for many reasons. Some of these reasons includes;
reduce energy cost, reduce GHG footprint and limit reliance on electricity suppliers.
These may be regarded as external factors since the main application may differ
nding on either in a house, business or factory. These different applications
necessitate varied configuration segments. According to Ndzibah (2013), a segment
could either be standalone, backup or hybrid. Nevertheless, the configuration for each of
gments may vary depending on the application. For example, one might configure
a photovoltaic system for only lighting (see fig. 11) or for refrigeration while others
might use it to power all the appliances (radio, TV, computer). Figure 16 shows the
ionship between different configuration segments when a backup system is
considered for either a home or business.
A configuration segment of a photovoltaic system
Backup Configuration
General Home
Appliances (TV, Radio,
fan etc)
Refrigeration
into account the inverter capacity. This must correspond to the required energy
Photovoltaic systems are often used for many reasons. Some of these reasons includes;
reduce energy cost, reduce GHG footprint and limit reliance on electricity suppliers.
These may be regarded as external factors since the main application may differ
nding on either in a house, business or factory. These different applications
necessitate varied configuration segments. According to Ndzibah (2013), a segment
could either be standalone, backup or hybrid. Nevertheless, the configuration for each of
gments may vary depending on the application. For example, one might configure
a photovoltaic system for only lighting (see fig. 11) or for refrigeration while others
might use it to power all the appliances (radio, TV, computer). Figure 16 shows the
ionship between different configuration segments when a backup system is
A configuration segment of a photovoltaic system
Backup Configuration
Business
Lighting
into account the inverter capacity. This must correspond to the required energy
Photovoltaic systems are often used for many reasons. Some of these reasons includes;
reduce energy cost, reduce GHG footprint and limit reliance on electricity suppliers.
These may be regarded as external factors since the main application may differ
nding on either in a house, business or factory. These different applications
necessitate varied configuration segments. According to Ndzibah (2013), a segment
could either be standalone, backup or hybrid. Nevertheless, the configuration for each of
gments may vary depending on the application. For example, one might configure
a photovoltaic system for only lighting (see fig. 11) or for refrigeration while others
might use it to power all the appliances (radio, TV, computer). Figure 16 shows the
ionship between different configuration segments when a backup system is
Backup Configuration
Business
Lighting
General Office
Appliance (Computer, Printer etc)
into account the inverter capacity. This must correspond to the required energy
Photovoltaic systems are often used for many reasons. Some of these reasons includes;
reduce energy cost, reduce GHG footprint and limit reliance on electricity suppliers.
These may be regarded as external factors since the main application may differ
nding on either in a house, business or factory. These different applications
necessitate varied configuration segments. According to Ndzibah (2013), a segment
could either be standalone, backup or hybrid. Nevertheless, the configuration for each of
gments may vary depending on the application. For example, one might configure
a photovoltaic system for only lighting (see fig. 11) or for refrigeration while others
might use it to power all the appliances (radio, TV, computer). Figure 16 shows the
ionship between different configuration segments when a backup system is
General Office
Appliance (Computer, Printer etc)

50
Designing a simple photovoltaic system
According to Clean Energy Council (2008), when designing a photovoltaic system,
there are some things which need to be considered, these include the electricity demand,
location, budget and rebate. The electricity demand focuses on how much electricity is
used. Furthermore, the budget and the rebate are equally important when it come to
financing. More so, the rebate could help reduce the financial burden. With this said,
there are some calculation needed to be considered when designing a photovoltaic
system. According to Budischak (2013) these include:
The amount of energy the load(s) will consume (kwh/day).
The number of solar panels needed to provide the required energy to power the
load at a particular location as well as its average peak/lean hour.
Calculating the number of batteries the system will need when there is little or
no sunlight.
The output power to the inverter when the load is on. This help to determine the
inverter capacity required for the systems.
The amperage the charge controller supplied to the inverter to decide the
wattage capacity of charge controller.
Considering the limitation of the research, an example of a segment configuration for a
household in Ghana will be given based on a backup system. Assuming the household
uses a bulb, ceiling fan, TV, stereo and refrigerator, the total energy of all these
appliances need to be calculated. Table 5 shows an average household in Ghana with
the appliances and their total capacity using equation 4. These appliances are used at
different hours of the day. The type of bulb used in this configuration is a compact
fluorescent (CFL) light bulb due to the fact that incandescent bulbs are not allowed in
Ghana. This is because Ghana energy policy toward efficiency required the use of CFL
bulbs in other to reduce electricity consumption, reduce blowout and transformer
overloads. This made Ghana the first country in Africa to take such action (Fuseini
2011). This configuration is for a household with a family of 4.

51
According to Essah (2011), the basic energy needs of a person in a country (such as
Ghana) can be obtained via installed capacity of a generated source which forms the
fundamental basic requirement of all developed nations. For this reason, there is a need
to obtain the net actual demand and net supply to help arrive at the net deficit of
electricity required to meet the needs of the population of Ghana. This can be achieved
using the following basic equations. It is good to note that these equations do not take
into consideration loss of energy due to inefficiency of the appliances:
Daily:
퐷 푃 퐶 = 퐴푅 × 푄 × ℎ표푢푟푠 (푝푒푟 푑푎푦) (4)
Annual:
퐴 푃 퐶 = 퐷 푃 퐶 × 퐷푎푦푠 표푓 푡ℎ푒 푦푒푎푟
1000 (5)
Where:
퐷 푃 퐶 = 퐷푎푖푙푦 푃표푤푒푟 퐶표푛푠푢푚푝푡푖표푛; (푊ℎ/푑푎푦)
퐴 푃 퐶 = 퐴푛푛푢푎푙 푃표푤푒푟 퐶표푛푠푢푚푝푡푖표푛; (푘푊ℎ/푦푒푎푟)
퐴푅 = 퐴푝푝푙푖푎푛푐푒 푅푎푡푖푛푔푠; (푊푎푡푡푠)
푄 = 푄푢푎푛푡푖푡푦 표푓 푎푝푝푙푖푎푛푐푒

52
Table 6. Estimated energy consumption for a household in Ghana
Appliance Appliance Rating
(watts) Quantity
Hours
(per day)
Total Capacity
(Wh/day)
Bulb (CFL) 12 4 4 192
Ceiling Fan 50 2 4 400
Stereo 40 1 3 120
TV 75 1 5 375
Refrigerator /
Freezer 350 1 6 2100
Total 3187
Using equation (4), the total energy consumed by the household in a day is
3187Wh/day. This can be approximated to 3.19kWh/day. Assuming the household
decided to use a 100 watt photovoltaic panel with a sun hour of 4.35hours/day, the
energy produced by the panel is calculated as:
→ 4.35ℎ푟푠푑푎푦
× 100 푤푎푡푡푠
1 푠표푙푎푟 푝푎푛푒푙 ×
1 푘푖푙표푤푎푡푡1000 푤푎푡푡푠
=
0.435 푘푊ℎ푑푎푦
1 푠표푙푎푟 푝푎푛푒푙
= 0.435kWh/day/panel
But the total energy consumed by the household appliance was 3.19kWh/day, therefore
the total number of panel needed can be obtained as follows:
→ 3.19 푘푊ℎ푑푎푦
÷
0.435 푘푊ℎ푑푎푦푝푎푛푒푙
= 3.2 푘푊ℎ푑푎푦
× 푑푎푦 /푝푎푛푒푙0.435 푘푊ℎ
= 7.33 푝푎푛푒푙푠 ~ 7 푝푎푛푒푙푠

53
Therefore, the total capacity of the photovoltaic panel is 700 watts while the energy
produce will be 3.199kWh/day. With the capacity and energy of the panels calculated,
there is a need to decide which storage medium the household will use when there is
limited or no sun light. The suggested storage medium will be a battery specifically gel
battery. Gel batteries are known for its durability and toughness to withstand high
temperature. Since the total power consumption by the appliances is 3.19kWh/day, the
capacity of the battery needed to support the load can be obtained using equation 3. If a
12V 250Ah battery is used, the amperage of the battery will be:
→ 푰 = 푃푉 =
3.19 푘푊ℎ12 푣표푙푡 = 0.266 푘퐴ℎ ×
1000 푎푚푝ℎ표푢푟1 푘퐴ℎ = 266 푎푚푝ℎ표푢푟푠
The quantity of batteries can be calculated since a 250Ah battery is used:
→ 266 퐴ℎ250 퐴ℎ
= 1.06 ~ 1 푏푎푡푡푒푟푖푒푠
The final calculation shows that one gel battery can be used to produce the energy
required to operate the loads. With the number and capacity of both the photovoltaic
panels and the battery calculated, it is possible to determine the type of charge
controller. For this configuration, a Maximum Power Point Tracking (MPPT) charge
controller will be used. This help the system to automatically and efficiently convert
higher voltage down to the lower voltage produced by the photovoltaic panel. With this
type of charge controller, the size of the photovoltaic panel can be increase without
having to buy new one. But according to PV Depot (2014), one fundamental advantage
to having a higher voltage solar panel array is that smaller gauge wiring can be used to
the charge controller.

54
MPPT charge controller is rated by their output amperage rather than the input current
from the photovoltaic panel. Since the battery is operating at 12V, the capacity or size
of the charge controller can be calculated. To determine the output current, equation 3 is
used.
→ 푰 = 푃푝푎푛푒푙푠
푉 = 700 푤푎푡푡푠
12 푣표푙푡 = 58.33 푎푚푝푠
But due to special conditions that can lead to possible power surge, the value of current
obtained need to be increased by 25%. Therefore, 58.33A increased by 25% is 72.91A.
With this value, an 80A MPPT Charge Controller, like Outback Power's MX80 can be
used.
According to Peacock (2013), inverters are rated in "DC input" and "AC output". For
this reason, it is very important that the inverter is also rated to suit the output of the
photovoltaic panels in DC. This is because inverter needs to be able to handle the
maximum power that the solar power system can generate and to be able to power the
load. With the total capacity of the load at 3,19kWh/day, and inverter with a capacity of
3kW will be enough to power the load. Although it is good to note that in some cases,
not all the load will be power on while is some case all will be on simultaneously. In the
case where the loads are not going to be used simultaneously, a lower capacity of the
inverter can be used. According to Clean Energy Council (2012), the following must
also be considered when choosing photovoltaic system inverter:
a) nominal AC power output cannot be less than 75% of the peak power and
b) the maximum power output of the photovoltaic panel or the load should not be
outside the inverter manufacturers maximum input power specification.
Therefore, the chosen inverter’s nominal AC power output should be enough for this
system configuration because the manufacturer’s nominal output is not more than the

55
maximum power output of the photovoltaic panel. Figure 12 below shows a summary of
the final configuration using the basic technical calculation.
Figure 12. Configuration of a simple backup system for a household

56
4. RESEARCH METHODOLOGIES
This chapter examines the research methodologies used in this study to establish
meaningful and reliable conclusion. This study will use a hybrid research approach; this
approach uses both qualitative and quantitative methods (Ndzibah 2013; Burns & Bush
2000: 230, 231). This type of method will help develop and evaluate key findings.
According to Fischler (2014), “research” is a process of steps used to collect and
analyze information in order to increase our understanding of a topic or issue”.
Qualitative and quantitative research differs in the procedure rather than “quality”. In
some cases, qualitative data can be quantified. For this reason, qualitative and
quantitative methods can be said not to be mutually exclusive due to the difference in
emphasis and objective of the study (Ghauri & Gronhaug 2005).
The aim of using a hybrid research is to gather an in-depth understanding of the
research question. The descriptive nature of qualitative research and the analysis of
qualitative research will provide help to establish clearer and meaningful data
collection, its analysis and interpretation. Qualitative research involves examining and
reflecting on the less tangible aspects of a research subject such as values, attitudes and
perceptions. Additionally, qualitative help solve topics from the perspective of a local
population obtaining culturally specific information about particular populations. Some
of the methods involve in collecting qualitative data includes observation, focus groups
and case studies (Hafner 2012; Gazette 2014). Qualitative research is inductive, making
it easier for researchers to develop abstractions, hypotheses, concepts and theories. This
helps investigates the “why” and “how” of decision making as well as answering the
question: “what”, “where”, and “when” (Merriam 1988; Creswell 1994).
According to Colin Neville (2007), quantitative research is the collecting and analyzing
numerical data which concentrates on measuring the scale, range, frequency etc. of a
phenomenon. Quantitative research often uses mathematical based methods (SAGE
2010). Furthermore, Colby (2010) define quantitative research as the manipulation of
numbers to make claims, provide evidence, describe phenomena, determine

57
relationships, or determine causation. He further explains that qualitative research uses a
systematic way of collecting, interpreting and reporting data to maintain consistency
across different contexts. This means that this type of research can be used for make
predictions about the research in question, opinion, phenomena or experiments.
The researcher uses focus group study and questionnaire. A focus group is defined as
group of interacting individuals having some common interest or characteristics,
brought together by a moderator, who uses the group and its interaction as a way to gain
information about a specific or focused issue (Marczak & Sewell 2014). Focus group
was use in other to know how well people are familiar with photovoltaic systems. Most
importantly, how photovoltaic system work and the various components involve in a
typical photovoltaic configuration. Furthermore, questionnaire and secondary data helps
the researcher to understand the level of energy consumption and the problem facing
Ghana’s electrification output. This helps the researcher to identify how the electricity
are used, the cost of electricity, where they are used (home or office), for how many
hours and the devices or appliances that they often use. These questions help the
researcher to evaluate and access which of the various configurations can be
recommended based on the consumption patterns of electricity.
4.1 Data collection
In other to present the advantages of product configuration of photovoltaic system, there
is a need to understand how well the Ghanaian society is aware of the importance of
photovoltaic systems and its various configurations. This section will explain how data
was collected and the tool used for analysis. For effective data collection, primary and
secondary data collection methods will be adopted.
According to Harvard Gazette (2014), primary data are self-generated and consist of
experimental designs, case studies, survey data, focus groups and participant
observation while secondary data refer to already existing data which can be raw or
processed making secondary data the most used in international studies. Secondary data

58
was used to evaluate and investigate the current energy situation in Ghana. This help to
identify the problems; collecting and analyzing records to generate solutions. The
researcher employs two stages of primary data collection. The first stage was the use of
focus group. The information obtained from the first stage made it possible to readjust
the questions for the second stage which was in the form of questionnaire. Secondary
data contributed to the understanding of both the theoretical and practical nature of
photovoltaic systems. Previous published publications and articles were used to
ascertain better understanding of the technology, components and configuration of
photovoltaic systems. Furthermore, Ndzibah (2013) explained that primary data are
preferred when new theories, proposals and models are being developed. Research data
can be obtained via a variety of ways depending on the nature of the research.
The researcher used focus group to gather primary information from members of a
clearly defined target audience to promote self-disclosure among participants. Due to
lack of funding to visit the case country for data collection, selected Africans studying
in Finland were used for this study providing opinions through the view of the
population. These students are of different background as well as studying in different
discipline. The areas of study include information technology, international business,
hotel and restaurant management, nursing and energy and environmental engineering.
The focus group was conducted with eight African students, living and studying in
Vaasa. The data collected helped to re-define further questions which were used for the
second stage of data collection. The second stage involves an online questionnaire. This
questionnaire was developed using Google Form. The questionnaire was sent to
individuals with various occupational backgrounds in Ghana. The data collected were
analyzed and the result is presented in Chapter 4.2.
The planning of the research followed basic principle of good research study. These
include efficiency, openness, privacy protection, usefulness, validity, reliability, proper
schedule and objectivity. The validity and reliability of the research is presented in
chapter 4.3.The following were the objective of the research:
1. To give background and explain the electrification development in Ghana

59
2. To find out the current energy policies in Ghana.
3. To add value to current configuration standards
4. To analyze and propose a set of product configurations of photovoltaic systems
in solving the energy crisis in Ghana.
In chapter 2, objective 1 and 2 were answered while chapter 3 added value and
explanation to objective 3. The analysis and proposed product configuration of
photovoltaic systems to solving Ghana’s electrification problems is introduced in
chapter 5. The efficiency and openness of the study can be explained in how the data
were collected and analyzed. To do this, the respondent were informed the reason why
the data is needed. In addition, the openness was justified by informing the respondents
the findings and outcome of the study without hiding any facts. To avoid mistrust, the
privacy of the respondent was kept secret. Therefore, no identity of the respondents
were publish in the study nor reveal to the public. Finally, it is very important to ensure
usefulness and meaningful outcome from the study by establishing various photovoltaic
system configurations for different segment of the Ghanaian society.
Data collected from the focus group established some of the assumptions of the
researcher. During the session, the interviewees displayed their knowledge of the
importance of photovoltaic in solving the electrification problem in Ghana. It was also
clear from the feedback that the best alternative to reducing Green House Gas (GHG) in
Ghana will be the use of photovoltaic energy to replace generators. Generators are often
used to generate electricity during disruption of power in the urban cities. This proves
that the adoption of photovoltaic would be good for both industries and households.
Despite the importance of photovoltaic energy, it was obvious to the researcher that the
interviewees had limited knowledge of the types, components and the different
configurations that exist. With knowledge obtained by the researcher during the
secondary data collection, the researcher was able to educate the interviewees.
Interviewees proposed future seminar or lectures for in-depth understanding of
photovoltaic systems.

60
The following are brief summary obtained during the focus group studies. This answers
provided valuable knowledge and assessment of how well the participants are familiar
with the various problem facing Ghana and possible ways to prevent or improve the
electrification problem.
How well are you familiar with the current electrification problems in Ghana?
It was obvious that the electrification problem is affecting all the participants. Some of
whom expresses the effect it is having on them, their families and business owners in
their areas. The problems include higher cost of goods and services due to the use of
generators. This is because both domestic and industries rely heavily on electricity.
How do you think this problem can be solved?
Solving the electrification problem could be done by looking at alternative source of
electricity such as wind energy, hydro power, bio fuel and solar energy. Other expresses
the need for the government to upgrade the facilities and utilities providing electricity.
What is photovoltaic system and how can it be used to produce electricity?
The researcher observed participants lacked understanding of the term “photovoltaic
system”. But when the term solar energy was used, it was clear the understood it. With
abundant of daily sunlight, participants believe installing photovoltaic in home,
businesses and industries could drastically reduce the dependency on the national grid.
What are the components involved in a photovoltaic system?
When asked this question, one respondent said “all you need in the solar panel then you
connect it to your electricity” and the rest agreed. The researcher used this opportunity
to explain the various components involve in a photovoltaic system.
What is the various configuration or types of photovoltaic systems?
None of the participants could name or explain any of the various photovoltaic
configurations.

61
The focus group findings prove that there is need for further education and promotion.
The education could be in the form of seminar or workshops. Regarding promotion,
printed materials could be circulated. Another form could be the use of television or
other electronic device such as the mobile phone.
4.2 Data analysis
According to the Academy for Educational Development (2006), data can be obtained
from various sources and for this reason; they are present in huge amount. In other
words, data analysis is a part of a process i.e. a specific procedure or method. This is
justified by LeCompte & Schensul (1999) definition of data analysis which state; “data
analysis is the process of reducing large amounts of collected data to make sense of
them”. These data are raw and therefore needs to be translated such that it is very easy
to understand (Berthold et al. 2010). Therefore, doing this often rely on the researcher’s
acknowledgement of gathering enough and meaningful data to support his/her theory or
hypothesis (Yin 1994: 102-104). For a reasonable data analysis, the researcher needs to
limit the amount of data collected to a meaningful size (Burn et al. 2000: 488 - 490).
There are several approached to data analysis. According to Merriam (1998), these
include narrative analysis, ethnographic analysis, constant comparative methods and
phenomenological analysis. Other data analysis approach includes grounded theory
analysis, interpretive or hermeneutics analysis, cross-cultural analysis, discourse
analysis, content analysis and performance analysis (Bernard 2000). These mentioned
approaches could be use either as qualitative or quantitative research. For the purpose of
this research, the researcher adopted content and interpretive analysis approach.
Content analysis was used systematically during the focus group study. According to
Abrahamson (1983: 286), content analysis can successfully help examine almost all
type of communication i.e. written, spoken or visual. Berelson (1952) further explained
that content analysis is a technique for systematic, descriptive and objective way of
communication content by adding role perception and behavioral norms. Interpretive

62
analysis on the other hand, helped to analyze the secondary data given the researcher an
insight and adding to the contextual details of the sample data. Most of the secondary
data used came from scientific articles published and online journals. Finally,
descriptive analysis was used to describe the main characteristics of the survey
questionnaire. The findings provided quantitative summaries of the sample. The
approaches used helped the researcher to categorized and arrange all the data to obtain
meaningful findings.
The data collected were analyzed using Microsoft office, particularly Microsoft Excel
spreadsheet. This tool helps the researcher to calculate and present the finding in an
easy and accessible way. Pie chart and histogram were used to give a pictorial
representation of the findings. The findings are presented in chapter 5 under 5.2 Survey
Analysis and Findings.
4.3 Reliability and validity of the research
Reliability and validity of any research is very important which means that the research
needs to be critically examined and evaluated. Miller (2014) explain that the two most
important and fundamental characteristics of any measurement procedure are reliability
and validity. Reliability is a major concern when measuring and testing attributes. This
is because the data obtained during a research are influenced by random or systematic
errors of measurements (Rosenthal & Rosnow 1991). On the other hand, validity adds
meaning to the research. There are many ways to which random errors can influence
measurements especially if the sample contains small number of items (Drost 2011).
According to Maylor and Blackmon (2005: 158-159; 362), validity refers to the
accuracy of conducting a research while reliability is the ability to be able to repeat the
research with its associated phenomenon, producing similar or same result.
Furthermore, validity captures the underlying truth of the situation rather than
misleading to prevent bias and other research errors (Ndzibah 2013). Miller (2014)
further define reliability as the extent to which a questionnaire, test, observation or any

63
measurement procedure produces the same results on repeated trials while validity as
the extent to which the instrument measures what it purports to measure.
The reliability in this research focuses on the methods of secondary data collection,
focus group study and the questionnaire. The secondary data used were selected from
highly respectable scientific journals and publications. The methods of data collection
and analysis are described in the previous sub-headings. The selection of the
participants in the focus group study was conducted to represent the targeted case
country. The focus group provided the basis for the research questionnaire.
Furthermore, the introduction of brainstorming during the focus group provided
valuable information which helped the researcher to widen the basic understanding of
photovoltaic technology to the respondents. To achieve an accurate outcome, the
various energy systems together with the capacity and the future projections planned by
the case country was discussed. In other to reflect the various representation of the case
country, the researcher sent the questionnaire to different individuals with diverse
background. This also added to the validity of the research. Additionally, the findings
describe the objectives of the research. Proper planning and tools use in analyzing data
collected help collaborate the validity of the research. In other to add to the validity of
the research, feedback from the first few despondences allowed the researcher to adjust
the questionnaire.

64
5. EMPIRICAL ANALYSIS AND FINDINGS
This section of the research is devoted to the empirical analysis of data collected. A look
at the pre-assumptions is explained and compared to the final outcome from the survey
while the final findings analyses were presented. The reviews of the findings are
presented using tables and graphs at the end.
5.1 Empirical analysis
The main research objective of this study is to present the advantage in product
configuration of photovoltaic systems for developing nations. The configuration will be
based on usage segments in Ghana particularly, the urban sectors of the economy.
Nevertheless, brief look at the rural sector will be considered. As a result, the main
research question is “How product configuration of photovoltaic (PV) system can help
reduce and improve energy crisis in developing countries and for that fact Ghana?”
This objective is aimed at promoting independent energy production in Ghana and
doing so, the dependency on fossil fuel can be reduced.
According to Zimmerman (2012), information or data gathered as a result of
observation or experimentation and analyzed using scientific methods can be classified
as empirical evidence. The scientific methods start by creating questions to acquire
knowledge to support specific theory or hypothesis (Blakstad, 2009). In this research,
the theory or hypotheses are in the form of pre-assumptions formulated by the
researcher. These pre-assumptions helped generate questionnaire which were used to
obtained and acquire knowledge to support or repudiate the pre-assumptions.
Pre-assumption
The electrification problem facing Ghana is one which needs to be resolved if the
country need to improve the various sectors of the economy. For this reason, the idea of
adopting one of the various photovoltaic system configurations can contribute in

65
reducing this problem. The researcher pre-assumption were based on observations and
conversation with individuals and groups. These took place as a result of discussing the
electrification situation facing Ghana. This assumption is collaborated by Ndzibah
(2013) explaining that the population of Ghana had quadrupled making demand higher
that supply. The main hydroelectric dams (Akosompo & Kpong) have a combined
capacity of 1,180 MW (VRA, 2013) but the demand or consumption in 2007 was 5.7
billion KWh. Some of these pre-assumptions suggest that Ghanaians especially those in
the urban area are well knowledgeable about photovoltaic systems. This was not so as
the researcher found out during the focus group study. Additionally, the researcher
believe that solar photovoltaic will be the presume choice as a renewable option rather
than the use of fossil fuel in the generation of electricity due to abundant daily radiation
in Ghana. The following in a nutshell, expresses the researcher pre-assumptions based
on the questionnaire. The questionnaires are independent to give the researcher clear
and precise results making the outcome simple to understand.
1. The electrification problem is affecting majority of the Ghanaian population in
the urban area.
2. Most of the populations in the urban area are tenants.
3. Majority of Ghanaians in the urban area does not knows or understand the term
“renewable energy”.
4. The idea of switching or looking for alternative source of energy in Ghana will
be welcome.
5. The preferred choice of renewable energy in Ghana would be solar photovoltaic
energy.
6. The adaptation of solar photovoltaic system will be mostly used for all daily
activities – both in homes and businesses
7. The average monthly electric bill for Ghanaians would be GHC20 – GHC40

66
5.2 Survey analysis and findings
The demand for data in research and other studies has increased both nationally and
internationally and for this reason, household surveys are conducted regularly to
provide the necessary data needed to achieve relevant findings (UNESCO 2004). These
data are of different type and kinds and therefore needs to be structured. According to
the Statistical Services Centre of the University of Reading (2001), survey data structure
can be either simple survey data or hierarchical data. This research uses the hierarchical
data structure. This type of data structure uses series of questions in a form of household
questionnaire.
A total number of 102 respondents participated by answering the questionnaire; out of
which 58% are male and 42% female. When the data is further analysis was conducted,
the researcher found out that 65% are tenants while 35% are home owners. This is
illustrated in figure 14 below. Based on the number of respondent, majority of them
were clear in their response when it comes to whether the current electrification
problem is Ghana is affecting their household or businesses. This is because 92%
agreed that they have been affected while only 8% says they have not been affected.
Although, the researcher did not ask the reason why this is so but it was obvious during
the group brainstorm session that majority of the population live from hand-to-mouth
therefore they cannot afford to own a generator. This would have provided them
electricity during disruption of power from the national grid. This is justified as shown
in Figure 13 below. This figure expresses the fact that only 8.8% of the respondents
could afford to pay more than GHC80 of electricity a month which is equivalent to €20
(based on exchange rate of GHC1 = €3.985). According to Numbeo (2014), the monthly
average income after tax is €306.21; though 42% of the income is spent on rent.

67
Figure 13. Average monthly electricity bill
Figure 14. Percentage of tenants to homeowners
A critical look at the data shows that though there are two main groups – tenants and
home owners, some of them operate their own business or businesses. The table below
explains in details the distribution of tenants to home owners when asked whether they
own a business or not. Figure 15 and table 7 show the numbers and percentage of
respondents that owns a business respectively. When compared, it was obvious that
most of the home owners engage in one type of business or the other. These types of
GHC 1 –GHC 2023.5 %
GHC 21 –GHC 4027.5 %
GHC 41 –GHC 6019.6 %
GHC 61 –GHC 8020.6 %
Other8.8 %
Tenants65%
Home owner35%

68
businesses could vary from a small retail store located at their homes or petty trading
which involves selling consumable items to friends and neigbours.
Table 7. Distribution of business owners
Frequency
Percentage
(%)
Yes No
Tenants 66 39.4 60.6
Home Owner 36 47.2 52.8
Total 102
Figure 15. Percentage of business owners
Knowing that majority of Ghanaians cannot rely on the national grid; it was obvious
that an alternate source would be important. Since there are many sources to which they
could get their electricity, the researcher presented a number of options based on various
sources of renewable energy. The finding presented in Fig 16 shows that most of the
respondents would prefer solar photovoltaic as an alternate source of electricity.
However, it was also clear that there are other sources which the respondents could
obtain their electricity due to the abundant of solar irradiation. The researcher gave the
0.0 %
10.0 %
20.0 %
30.0 %
40.0 %
50.0 %
60.0 %
70.0 %
Yes NoTenants Home owner

respondents the opportunity to choose more than one of these criteria therefore these
figures are not presented as a percentage of the total participants but rathe
frequency. The three highest values are 62, 71 and 82 which represent hydro power
energy, others and solar photovoltaic energy respectively. The “others” option was
provided to the respondent to mention other sources of energy they know leading to
non-response error.
Figure
Since most of the respondents prefer solar photovoltaic energy, it was clear where and
what they would use it. Solar photovoltaic is used in different applications and for
different purpose. These different applications could be in or out side of homes,
business and factories. In homes, they could be used for lighting or on other home
appliances. With this in mind, the researcher wanted to know for what and why
Ghanaians would like to use solar photovoltaic energy.
various ways Gh
respondents the opportunity to choose more than one of these criteria therefore these
figures are not presented as a percentage of the total participants but rathe
frequency. The three highest values are 62, 71 and 82 which represent hydro power
energy, others and solar photovoltaic energy respectively. The “others” option was
provided to the respondent to mention other sources of energy they know leading to
response error.
Figure 16. Various renewable energy sources
Since most of the respondents prefer solar photovoltaic energy, it was clear where and
what they would use it. Solar photovoltaic is used in different applications and for
different purpose. These different applications could be in or out side of homes,
siness and factories. In homes, they could be used for lighting or on other home
appliances. With this in mind, the researcher wanted to know for what and why
Ghanaians would like to use solar photovoltaic energy.
various ways Gh
Solar photovoltaic energy
Hydro power Energy
Geo-thermal Energy
Bio fuel Energy
respondents the opportunity to choose more than one of these criteria therefore these
figures are not presented as a percentage of the total participants but rathe
frequency. The three highest values are 62, 71 and 82 which represent hydro power
energy, others and solar photovoltaic energy respectively. The “others” option was
provided to the respondent to mention other sources of energy they know leading to
response error.
Various renewable energy sources
Since most of the respondents prefer solar photovoltaic energy, it was clear where and
what they would use it. Solar photovoltaic is used in different applications and for
different purpose. These different applications could be in or out side of homes,
siness and factories. In homes, they could be used for lighting or on other home
appliances. With this in mind, the researcher wanted to know for what and why
Ghanaians would like to use solar photovoltaic energy.
various ways Ghanaians would like to adopt and use solar photovoltaic energy.
Solar photovoltaic energy
Wind Energy
Hydro power Energy
thermal Energy
Bio fuel Energy
Other
respondents the opportunity to choose more than one of these criteria therefore these
figures are not presented as a percentage of the total participants but rathe
frequency. The three highest values are 62, 71 and 82 which represent hydro power
energy, others and solar photovoltaic energy respectively. The “others” option was
provided to the respondent to mention other sources of energy they know leading to
Various renewable energy sources
Since most of the respondents prefer solar photovoltaic energy, it was clear where and
what they would use it. Solar photovoltaic is used in different applications and for
different purpose. These different applications could be in or out side of homes,
siness and factories. In homes, they could be used for lighting or on other home
appliances. With this in mind, the researcher wanted to know for what and why
Ghanaians would like to use solar photovoltaic energy.
anaians would like to adopt and use solar photovoltaic energy.
0
Solar photovoltaic energy
Wind Energy
Hydro power Energy
thermal Energy
Bio fuel Energy
Other
69
respondents the opportunity to choose more than one of these criteria therefore these
figures are not presented as a percentage of the total participants but rathe
frequency. The three highest values are 62, 71 and 82 which represent hydro power
energy, others and solar photovoltaic energy respectively. The “others” option was
provided to the respondent to mention other sources of energy they know leading to
Various renewable energy sources
Since most of the respondents prefer solar photovoltaic energy, it was clear where and
what they would use it. Solar photovoltaic is used in different applications and for
different purpose. These different applications could be in or out side of homes,
siness and factories. In homes, they could be used for lighting or on other home
appliances. With this in mind, the researcher wanted to know for what and why
Ghanaians would like to use solar photovoltaic energy.
anaians would like to adopt and use solar photovoltaic energy.
20 40
16
31
respondents the opportunity to choose more than one of these criteria therefore these
figures are not presented as a percentage of the total participants but rathe
frequency. The three highest values are 62, 71 and 82 which represent hydro power
energy, others and solar photovoltaic energy respectively. The “others” option was
provided to the respondent to mention other sources of energy they know leading to
Since most of the respondents prefer solar photovoltaic energy, it was clear where and
what they would use it. Solar photovoltaic is used in different applications and for
different purpose. These different applications could be in or out side of homes,
siness and factories. In homes, they could be used for lighting or on other home
appliances. With this in mind, the researcher wanted to know for what and why
Ghanaians would like to use solar photovoltaic energy. Figure 17
anaians would like to adopt and use solar photovoltaic energy.
40 60
51
respondents the opportunity to choose more than one of these criteria therefore these
figures are not presented as a percentage of the total participants but rathe
frequency. The three highest values are 62, 71 and 82 which represent hydro power
energy, others and solar photovoltaic energy respectively. The “others” option was
provided to the respondent to mention other sources of energy they know leading to
Since most of the respondents prefer solar photovoltaic energy, it was clear where and
what they would use it. Solar photovoltaic is used in different applications and for
different purpose. These different applications could be in or out side of homes,
siness and factories. In homes, they could be used for lighting or on other home
appliances. With this in mind, the researcher wanted to know for what and why
Figure 17 below shows the
anaians would like to adopt and use solar photovoltaic energy.
80
82
62
71
respondents the opportunity to choose more than one of these criteria therefore these
figures are not presented as a percentage of the total participants but rather on the
frequency. The three highest values are 62, 71 and 82 which represent hydro power
energy, others and solar photovoltaic energy respectively. The “others” option was
provided to the respondent to mention other sources of energy they know leading to
Since most of the respondents prefer solar photovoltaic energy, it was clear where and
what they would use it. Solar photovoltaic is used in different applications and for
different purpose. These different applications could be in or out side of homes,
siness and factories. In homes, they could be used for lighting or on other home
appliances. With this in mind, the researcher wanted to know for what and why
below shows the
anaians would like to adopt and use solar photovoltaic energy.
100
82
respondents the opportunity to choose more than one of these criteria therefore these
r on the
frequency. The three highest values are 62, 71 and 82 which represent hydro power
energy, others and solar photovoltaic energy respectively. The “others” option was
provided to the respondent to mention other sources of energy they know leading to
Since most of the respondents prefer solar photovoltaic energy, it was clear where and
what they would use it. Solar photovoltaic is used in different applications and for
different purpose. These different applications could be in or out side of homes,
siness and factories. In homes, they could be used for lighting or on other home
appliances. With this in mind, the researcher wanted to know for what and why
below shows the

70
Figure 17. Percentage distribution of solar photovoltaic energy use
It is obvious that most 29% of respondents would like to use solar photovoltaic energy
to provide lighting while only 4% would like to use it for their business operation.
However, 23% would like to use solar photovoltaic for other house appliances. The
house appliances could include refrigerator, cooking stove, radio and television
although; only 15% would like to use it mainly for refrigeration.
At the beginning of the survey analysis, the researcher listed pre-assumptions which
were to be confirmed or rejected by the findings. Although, it is good to point out that
not all the findings supported the researcher’s pre-assumption which proves that
respondents are well familiar with some the questions asked (see pre-assumption 3).
Table below shows this findings and their status. Most of the researcher’s pre-
assumptions were justified by the finding. It was clear that respondents do not like the
energy crisis; therefore, they would like to use other alternative sources of electricity
even though most of them live in the urban area and they are tenants.
Lighting29%
Cooking9%
Refrigeration15%
Household Appliances
23%
Business operation
4%
All of the above20%
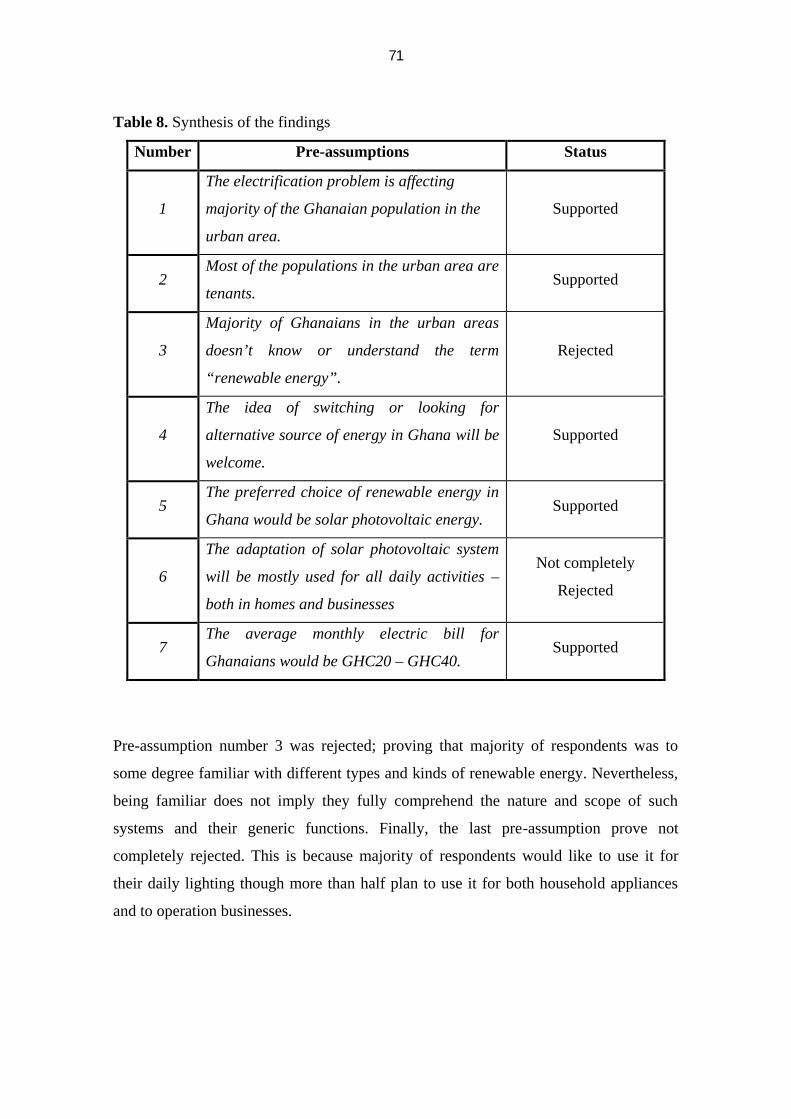
71
Table 8. Synthesis of the findings
Number Pre-assumptions Status
1
The electrification problem is affecting
majority of the Ghanaian population in the
urban area.
Supported
2 Most of the populations in the urban area are
tenants. Supported
3
Majority of Ghanaians in the urban areas
doesn’t know or understand the term
“renewable energy”.
Rejected
4
The idea of switching or looking for
alternative source of energy in Ghana will be
welcome.
Supported
5 The preferred choice of renewable energy in
Ghana would be solar photovoltaic energy. Supported
6
The adaptation of solar photovoltaic system
will be mostly used for all daily activities –
both in homes and businesses
Not completely
Rejected
7 The average monthly electric bill for
Ghanaians would be GHC20 – GHC40. Supported
Pre-assumption number 3 was rejected; proving that majority of respondents was to
some degree familiar with different types and kinds of renewable energy. Nevertheless,
being familiar does not imply they fully comprehend the nature and scope of such
systems and their generic functions. Finally, the last pre-assumption prove not
completely rejected. This is because majority of respondents would like to use it for
their daily lighting though more than half plan to use it for both household appliances
and to operation businesses.

72
6. SUMMARIES AND CONCLUSIONS
This section of the research provides a summary of both the theoretical and empirical
intentions. In addition, relevant findings, recommendations and future research will be
examined.
6.1 Research summary
This research commenced by looking at the current energy situation in developing
nation particularly, Ghana and various institutions responsible for making decisions
related to energy was examined. Like many developing nations, electrification is very
important to the development of their economies. During the study, particular attention
was focused on the current electrification problems and how it can be improve. This is
because businesses need constant and reliable supply of electricity to improve and
develop their processes. This in return provides products or services for their clients or
customers. One possible observed way of improving the electrification was the use of
photovoltaic systems.
The research started by examining the energy situation in developing countries with
particular focus on sub-Sahara various energy sources. Definitions and the limitations of
the studies were examined. The research objectives and questions were elaborated and
the research dealt with the following objectives:
i. Examine the background and explain the electrification development in
Ghana
ii. Explore the current energy policies in Ghana
iii. To add value to current configuration standards
iv. To analyze and propose a set of product configurations of photovoltaic
systems in solving the energy crisis in Ghana.

73
Chapter 2 looks at the historical, political and technical frame work of Ghana’s energy
sector particularly the electrification issues. Additionally, the various types of energy
systems as well as their capacity and future energy potentials were examined. Finally, a
brief assessment of Ghana’s renewable energy policies will be discussed. Particular
focus was on the types of electricity generation systems and their capacities.
Furthermore, the concept of product configuration particularly photovoltaic system
configuration was evaluated in chapter 3. The various configurations discussed were
standalone, backup and hybrid. To help further understand these configurations,
background information of the various components involve in a photovoltaic system,
namely, panel arrays, charge controllers, batteries, inverters and loads were examined
including their basic technical parameters. Completing the chapter, a simple
photovoltaic system configuration for a family of four was design by the researcher. It is
important to note that this configuration only took into consideration only the basic
technical information of the components.
Chapter 4 examined the research methodologies approach used in this study to establish
meaningful and reliable conclusion. This research used a hybrid research approach. This
type of research helped developed and evaluate key findings which was used to evaluate
the researcher’s pre-assumptions. Additionally, chapter presented methods and
techniques for collecting data on the area of study. Although not all the researcher’s pre-
assumptions were supported by the findings. For example, when respondents were
asked if they fully understood the term “renewable energy”, majority said “yes” but the
research pre-assumed they were not familiar with the term. These findings and many
more were explained in chapter 5 which looked at the research findings and analysis.
Different methods and techniques were used to represent the findings. These includes
bar chat, pie chart, histograms and tables. Finally, further recommendations and
suggestions on how Ghana can improve her energy problems were given. These
recommendations can be replicated by other developing countries to improve their
energy particularly electrification problems thereby leading to economic and social
development.

74
6.2 Conclusion and recommendation
The goal of the research was to look at product configuration of photovoltaic systems.
But to do this, there was a need to identify the energy problems facing developing
countries, such as Ghana. The study further provide an insight into the current energy
problems facing many developing nation particularly sub-Sahara Africa. The research
findings were conclusive i.e. there are shortages of electricity in Ghana and as a result,
rationing had been introduced. For this reason, the researcher looked at other means of
generating electricity to solve these issues. Although it was observed that the
governments of Ghana were aware of the rationing of electricity and to solve this, some
measures have been put in place. Some of these measures include the banning of
incandescent light bulb which was replaced with compact fluorescent (CFL) light bulb
which consumes less energy. Also the introduction of Ghana refrigerator energy
efficiency ratings and label has helped reduced the average refrigerator energy
consumption from 1200kWh/year to 650kWh/year (Fuseini 2011). Other projects
currently undertaken by the government to improve electrification situation includes
Kpone Thermal Power Plant (KTPP), Takoradi 2 Thermal Power Project (T2)
expansion, Takoradi 3 (T3) and Bui Hydro Power Plant (VRA 2013). Even with all
these, Ghanaians still face rationing of electricity. In other to improve these problems,
the researcher suggested more attention should be focus on renewable energy
particularly solar energy. Although it is good to point out that the government of Ghana
has commissioned two renewable projects, namely, VRA Wind Power Project and VRA
Solar Power Project with a capacity of 100-150 MW and 10MWp respectively. These
capacities are relatively small compare to KTPP (230MW) which will required an
external source of energy. This will add additional cost to the operation of the power
plant compare to using solar energy to generate clean and efficient energy.
One area of contribution by the researcher is the use of solar photovoltaic in terms of
system configuration as an alternative to other sources of electricity due to the fact that
Ghana is blessed with abundant sunlight. This contribution arose as a result of the
findings obtained during both the focus group studies and the questionnaire where
majority of respondents prefer this type of renewable energy source. Photovoltaic

75
systems can be configured based on the needs either by an individual, household, or
business. When using photovoltaic as a source of electricity, the type of load(s) should
be taken into consideration. Lighting (see fig. 9) and household basic appliance (see fig.
12) are the two main loads the researcher found to be interested for Ghanaians. With
this in mind, photovoltaic system configurations were design using the components
basic technical parameters. These configurations focus on using photovoltaic as a
backup system. This can drastically improve the rationing electricity problem facing
developing countries hence, Ghana.
Although the research focuses only on product configuration of photovoltaic systems
particularly backup systems, there is a need to understand other systems. For this
reason, the researcher recommends reading “Optimal Configuration for Design of
Stand-Alone PV System” by Bataineh & Dalalah (2012). As for the problem facing the
financing when it comes to the installation of photovoltaic systems, the researcher
recommends reading “Marketing Mechanisms for Photovoltaic Technology in
Developing Countries – Case Ghana” by Ndzibah (2013). Ndzibah (2013) suggested
various ways through which government, banks and other institutions can contribute
toward the marketing and financing photovoltaic systems, making it affordable. Finally,
it would be nice for the government of Ghana to start collecting daily average energy
consumptions which will help in future studies. Finally, the findings and results can be
replicated in other developing countries thereby improving their electrification
problems.

76
REFERENCE
Abrahamson M. (1983). Social Research Methods. Prentice-Hall, Englewood Cliffs,
London. ISBN 0138180881
Academy for Educational Development (2006). Introduction to Data Analysis
Handbook. Migrant & Seasonal Head Start Teaching Assistance Center -
AED/TAC-12 Spring 2006.
Agyarko, K (2012). Energy Efficiency drive – The Story of Ghana. Energy Commission.
World Future Council. [Cited 15 May 2014]. Available from World Wide Web:
URL:
http://www.worldfuturecouncil.org/fileadmin/user_upload/PDF/PkfA.neuKofi_
Agyarko-Ghana_Energy_Commission_Energy_Efficiency.pdf
Ahiataku-Togobo W. (2012). Progress made by Ghana on RE Project Implementation
and lessons learned for AREA. Ministry of Energy, Ghana. World Future
Council 11Apr2012. [Cited 05 April 2014]. Available from World Wide Web:
URL: http://www.worldfuturecouncil.org/fileadmin/user_upload/PDF/PkfA-
W._Ahiataku-Togobo-
GH_Ministry_of_Energy_Progress_made_by_Ghana_on_RE_Project_Impleme
ntation.pdf
AIEDAM 2003. Special Issue on Configuration. Cited 05 April 2014]. Available from
World Wide Web: URL: http://web.cs.wpi.edu/~aiedam/SpecialIssues
Algieri, B., Aquino, A. & Succurro, M. (2011). Going “green”: trade specialisation
dynamics in the solar photovoltaic sector. Energy Policy 39, 7275-7283.
Baghzouz, Y. Photovoltaic Systems III. [Cited 05 August 2014]. Available from World
Wide Web: URL:
http://www.egr.unlv.edu/~eebag/Photovoltaic%20Systems%20III.pdf

77
Bataineh K. & Dalalah D. (2012). Optimal Configuration for Design of Stand-Alone PV
System. Smart Grid and Renewable Energy, 2012, 3, 139-147
Berelson, B. (1952). Content analysis in communication research. New York: The Free
Press.
Bernard, H.R. (2000). Social research methods: Qualitative and quantitative
approaches. Thousand Oaks, CA: Stage Publications
Berthold M.R. et al (2010). Guide to Intelligent Data Analysis. [Cited 03 November
2014]. Available from World Wide Web: URL:
file:///C:/Users/s93017/Downloads/9781848822597-c2.pdf
Blakstad O. (2009). Empirical Research. [Cited November 07, 2014]. Available from
World Wide Web: URL: https://explorable.com/empirical-research
Bower, W. et al. (2004). Performance Test Protocol for Evaluating Inverters Used in
Grid-Connected Photovoltaic Systems. Institute for Sustainable Technology,
2004.
Brooks B. (2014). Inspecting Photovoltaic (PV) Systems for Code-Compliance. Brooks
Engineering. [Cited 04 August 2014]. Available from World Wide Web:
http://www.pge.com/includes/docs/pdfs/shared/solar/solareducation/inspecting_
pv_systems_for_code_compliance.pdf
Budischak (2013). Solar Power System Design Calculations. YouTube, published on 19
March 2013.
Burns, C. A. & Bush, F. R. (2000). Marketing Research. 3rd edition. Prentice Hall, Inc.
ISBN 0-13-014411-8

78
CEC (2008). Electricity from the sun: Solar PV systems. Clean Energy Council. 3rd
Edition, June 2008.
Chiasson, J. et al (2005). Elimination of Harmonics in a Multilevel Converter using the
Theory of Symmetric Polynomials and Resultants. IEEE Transactions on Control
Systems Technology, Vol. 13, No. 2, March 2005.
CIA (2014). The World Factbook. [Cited 05 May 2014]. Available from World Wide
Web: URL:
https://www.cia.gov/library/publications/the-world-factbook/geos/gh.html
Clean Energy Council (2008). Electricity from the sun – Solar PV systems explained.
3rd Edition, June 2008.
Clean Energy Council (2012). Grid-Connected Solar PV Systems (No Battery Storage):
Design Guidelines For Accredited Installers, Issue 6.0 December, 2012
http://www.solarquotes.com.au/blog/wp-content/uploads/2013/05/CEC-
guidelines-6.pdf
Colby R. (2010). Qualitative Research: What is Qualitative Research? [Cited 05
September 2014]. Available from World Wide Web: URL:
http://wow.richardcolby.net/wp-content/uploads/2010/03/Chapter8.pdf
Colin Neville (2007). Effective Learning Service: Introduction to Research and
Research Methods. University of Bradford, School of Management. [Cited 05
September 2014]. Available from World Wide Web: URL:
http://www.brad.ac.uk/management/media/management/els/Introduction-to-
Research-and-Research-Methods.pdf
Creswell, J. W. (1994). Research design: Qualitative & quantitative approaches.
Thousand Oaks, CA: Sage Publications

79
CRO (2014). Atuabo Gas plant in Ghana to be completed by July. Construction Review
Online Newsletter 0025_7_2014. [Cited 20 May 2014]. Available from World
Wide Web: URL: http://constructionreviewonline.com/news/west-africa/atuabo-
gas-plant-ghana-completed-
july/?utm_source=Construction+Review+Online+Newsletter&utm_campaign=d
7e412843b-
Construction_Review_Online_Newsletter_0025_7_2014&utm_medium=email
&utm_term=0_2b85ec2ef1-d7e412843b-
182914437&ct=t(Construction_Review_Online_Newsletter_0025_7_2014)
Dahl T. (2012). Photovoltaic Power Systems. Technology White Paper. Polar Power.
[Cited 20 July 2014]. Available from World Wide Web: URL:
http://polarpower.org/static/docs/PVWhitePaper1_31.pdf
Dobos A.P. (2013). PV Watts Version 1 Technical Reference. NREL Technical Report.
NREL/TP-6A20-60272 October 2013
Dobrzanski L.A. et al. (2012). Monocrystalline silicon solar cells applied in
photovoltaic system. Journal of Achievements in Materials and Manufacturing
Engineering (JAMME), Volume 53, Issue 1, July 2012
Drost E. (2011). Validity and Reliability in Social Science Research. Education
Research and Perspectives, Vol.38, No.1
Dunlop J. & Farhi B. (2001). Recommendation for Maximizing Battery Life in
Photovoltaic Systems: A review of Lessons Learned. Florida Solar Energy
Center. Proceedings of Forum 2001, Solar Energy: The Power to Choose, April
21-25, 2001 Washington, DC.
Eberhard et al., 2008, Underpowered: the state of the power sector in sub-Saharan
Africa. Background Paper 6, Africa Infrastructure Country Diagnostic, World
Bank, Washington, DC.

80
EASHW (2014). E-Facts 68 Osh and Small-Scale Solar Energy Applications. [Cited 12
November 2014]. Available from World Wide Web: URL:
https://osha.europa.eu/en/publications/e-facts/e-fact-68-osh-and-small-scale-
solar-energy-applications
ECG (2014). [Cited 15 May 2014]. Available from World Wide Web: URL:
http://www.ecgonline.info/
EC-Ghana (2006). Energy Supply to the Economy – Electricity. Strategic National
Energy Plan 2006 – 2020, Annex Two and Four. Energy Commission, July 2006
ECOWREX (2011).Renewable Energy Bill. ECOWREX Library. [Cited 06June 2014].
Available from World Wide Web: URL:
http://www.ecowrex.org/document/renewable-energy-bill
ECREEE (2014). Ghana Feed-In-Tariff (FIT) Policy and Guidelines. Public Utilities
Regulatory Commission. ECOWAS Centre for Renewable Energy and Energy
Efficiency – ECREEE. [Cited 05 June 2014]. Available from World Wide Web:
URL: http://www.ecreee.org/sites/default/files/event-
att/ghana_fit_policy_and_guidelines.pdf
EERE (2014). The History of Solar. [Cited 06June 2014]. Available from World Wide
Web: URL: http://www1.eere.energy.gov/solar/pdfs/solar_timeline.pdf
EIA (2013). International Energy Outlook 2013. [Cited 06July 2014]. Available from
World Wide Web: URL: http://www.eia.gov/forecasts/ieo/index.cfm
EMA & BCA (2009). Hand book for Solar Photovoltaic (PV) Systems. Energy Market
Authority and Building and Construction Authority. ISBN: 978-981-08-4462-2
[Cited 05 April 2014]. Available from World Wide Web: URL:
http://www.ema.gov.sg/images/files/EMA%20Solar%20Handbook_Apr%20201
1.pdf

81
EMTC (1981). Handbook of Secondary Storage Batteries and Charge Regulators in
Photovoltaic Systems Final Report. Contractor Report, SAND81-7135. [Cited
05 August 2014]. Available from World Wide Web: URL:
http://www.azsolarcenter.org/images/docs/tech-
science/papers/batteries/HandbookOfSecondaryStorageBatteries.pdf
Ennison, I. (2012). Renewable Energy Regulatory Framework in Ghana. Renewable
Energy Directorate, Ministry of Energy, Ghana. ECREEE Regional Workshop
9th to 12th of April 2012, Praia, Cape Verde. [Cited 15 May 2014]. Available
from World Wide Web: URL: http://www.ecreee.org/sites/default/files/event-
att/5._i_-renewable_energy_regulatory_framework_in_ghana.pdf
Enphase Energy (2013). PV Watts Calculation Values with an Enphase Microinverter
System. [Cited 03 December 2014]. Available from World Wide Web: URL:
http://enphase.com/global/files/Enphase-Technical-Brief-PVWatts-
Calculations.pdf
EPIA & Greenpeace (2011). Solar Photovoltaic Electricity Empowering the World.
Solar Generation 6. [Cited 05 April 2014]. Available from World Wide Web:
URL: http://www.scribd.com/doc/104271154/Solar-Generation-6-2011-Full-
Report-Final
EPVTP (2011). A Strategic Research Agenda for Photovoltaic Solar Energy
Technology. Photovoltaic Technology Platform, Edition 2. European Union,
2011. ISBN 978-92-79-20172-1, doi:10.2788/15824.
Essah, E.A. (2011). Energy Generation and Consumption in Ghana. West Africa Built
Environment Research (WABER) Conference, 19-21July 2011, Accra, Ghana.
pp. 391-401.
http://centaur.reading.ac.uk/20973/1/Energy_generation_and_consumption_in_
Ghana.pdf

82
Evo Energy (2012). Solar PV cell comparison. [Cited 08 April 2014]. Available from
World Wide Web: URL:
http://www.evoenergy.co.uk/solar-pv/our-technology/pv-cell-comparison/
Fernandes J. et al (2014). Renewable Energy in the California Desert: Mechanisms for
Evaluating Solar Development on Public Lands. [Cited 08 July 2014]. Available
from World Wide Web: URL:
http://webservices.itcs.umich.edu/drupal/recd/?q=node/156
Fischler S.A. (2014). FSEC (2002). Solar Photovoltaic Systems and Components. [Cited
08 April 2014]. Available from World Wide Web: URL:
http://www.pttrenenergy.upc.edu/index2.php?option=com_docman&task=doc_v
iew&gid=215&Itemid=35
Fuseini I. (2011). Towards Efficient Lighting and Appliance Marker: The Case of
Ghana. Energy Efficiency Global Forum, 2011.
Ghana E.C. (2009). Renewable Energy Policy Framework for Climate Change
Mitigation in Ghana. Review of Existing Renewable Energy resources data,
energy Policies, Strategies, Plans and projects, Energy commission Ghana.
Ghana E.C. (2013). Ghana Appliance Energy Efficiency Standards and Labeling
Programme. Renewable and Energy efficiency, Ghana Energy Commission
2013.[Cited 25 May 2014]. Available from World Wide Web: URL:
http://energycom.gov.gh/Renewable/ghana-appliance-energy-efficiency-
standards-and-labelling-programme.html
Ghana Web (2014). The Country Ghana. [Cited 08 May 2014]. Available from World
Wide Web: URL:
http://www.ghanaweb.com/GhanaHomePage/country_information/

83
Ghauri, P. & Gronhaug, K. (2005). Research methods in business studies: A practical
guide. Essex: Prentice hall Europe.
Gilbert M. (2004) Renewable and Efficient Electric Power Systems; John Wiley &
Sons, Inc., Hoboken, New Jersey, 2004.
GoG (2013). About Ghana – Ghana at a Glance. [Cited 08 May 2014]. Available from
World Wide Web: URL:
http://www.ghana.gov.gh/index.php/about-ghana/ghana-at-a-glance
Goodrich A. et al. (2013). A wafer-based monocrystalline silicon photovoltaics road
map: Utilizing known technology improvement opportunities for further
reductions in manufacturing costs. Solar Energy Materials & Solar Cells.
Volume 114, July 2013, Pages 110–135. DOI: 10.1016/j.solmat.2013.01.030
Green D. (2012). Advantages and disadvantages of Solar Photovoltaic – Quick Pros
and Cons of Solar PV. Renewable Energy World. [Cited 08 June 2014].
Available from World Wide Web: URL:
http://www.renewableenergyworld.com/rea/blog/post/2012/12/advantages-and-
disadvantages-of-solar-photovoltaic-quick-pros-and-cons-of-solar-pv
Green Peace & EPIA (2011). Solar generation 6: Solar photovoltaic electricity
empowering the world 2011. [Cited 08 June 2014]. Available from World Wide
Web: URL:
http://www.greenpeace.org/international/Global/international/publications/clima
te/2011/Final%20SolarGeneration%20VI%20full%20report%20lr.pdf
Hafner C. (2012). Qualitative Research Methods: A Data Collector’s Field Guide.
[Cited 05 September 2014]. Available from World Wide Web: URL:
http://www.ccs.neu.edu/course/is4800sp12/resources/qualmethods.pdf

84
Hahn J.H. (2006). Modified Sine-Wave Inverter Enhanced. Power Electronics
Technology, August 2006. [Cited 03 August 2014]. Available from World Wide
Web: URL: http://powerelectronics.com/site-
files/powerelectronics.com/files/archive/powerelectronics.com/mag/608PET21.p
df
Hansen et al. (2000). Models for a Stand-Alone PV System. Risø National Laboratory,
Roskilde. December 2000. Risø-R-1219(EN) / SEC-R-12
Harrington et al. (1992). Battery Charge Controller Characteristics in Photovoltaic
Systems. Florida Solar Energy Center. IEEE AES magazine, August 1992
Harvard Gazette (2014). Research Methods. [Cited 05 September 2014]. Available from
World Wide Web: URL:
http://isites.harvard.edu/fs/docs/icb.topic851950.files/Research%20Methods_So
me%20Notes.pdf
Haug, A., Hvam, L., & Mortensen, N. H. (2012). Definition and evaluation of product
configurator development strategies. Computer in Industry, Vol. 63, Issue 5,
June 2012, Pages 471-481.
Heritage Foundation (2014). 2014 index of Economic freedom. The Heritage
Foundation. [Cited 15 May 2014]. Available from World Wide Web: URL:
http://www.heritage.org/index/country/ghana
Hill & Pearsall (2001). Photovoltaic Modules, Systems and Applications. Northumbria
Photovoltaic Applications Centre, University of Northumbria at Newcastle
Hon. Owusu-Adjapong F.K. (2008). L.I. 1932 Energy Efficiency. Ghana Publishing
Company Ltd., Assembly Press, Accra, GPCL/ A534/350/9/2OI)8

85
Howard, P. (2005). The sun sets on PV. Contract Journal. Business Source Premier
430:6552, 22–23. ISSN 0010–7859.
Hristov H. (2014). Solar Energy PV Systems. . [Cited 05 April 2014]. Available from
World Wide Web: URL: http://www.fh-
schmalkalden.de/schmalkaldenmedia/solar+energy+pv+systems.pdf
IEA & OECD (2010). Technology Roadmap - Solar photovoltaic energy. IEA
Publications, 9 rue de la Fédération, 75739 Paris Cedex 15. Printed in France by
Corlet, October 2010
IEA (2012). Worldwide engagement for sustainable energy strategies. [Cited 05 April
2014]. Available from World Wide Web: URL:
https://www.iea.org/publications/freepublications/publication/worldwide_engag
ement.pdf
IEA-PVPS (2013). Survey Report of Selected IEA Countries between 1992 and 2012.
TRENDS 2013 in Photovoltaic Applications. Report IEA-PVPS T1-23:2013.
ISBN – 978-3-906042-14-5
IRENA (2012). Renewable Energy Technologies: Cost Analysis Series - Solar
Photovoltaics. Volume 1: Power sector, issue 4/5. International renewable
Energy Agency – IRENA, June 2012.
Jayakumar P. (2009). Solar Energy – Resource Assessment Handbook. [Cited 12
November 2014]. Available from World Wide Web: URL:
http://recap.apctt.org/Docs/SOLAR.pdf
Just Landed (2014). Languages in Ghana. [Cited 05 April 2014]. Available from World
Wide Web: URL: http://www.justlanded.com/english/Ghana/Ghana-
Guide/Language/Languages-in-Ghana

86
Jyvaskyla University (2014). Data Analysis. [Cited 03 November 2014]. Available from
World Wide Web: URL:
https://koppa.jyu.fi/avoimet/hum/menetelmapolkuja/en/methodmap/data-
analysis
Karekezi, S. & Kithyoma, W. (2003). Renewable Energy in Africa: Prospects and
Limits. The Workshop for African Energy Experts on Operationalizing the
NEPAD Energy Initiative, Novotel, Dakar, Senegal
Karekezi, S. & Ranja, T. (1997). Renewable Energy Technologies in Africa. ZED
Books and AFREPREN. Oxford U.K.
Karekezi, S. (2002a). Renewables in Africa – Meeting the Energy Needs of the Poor.
Energy Policy, Vol. 30 Nos. 11-12, Special Issue – Africa: Improving Modern
Energy Services for the Poor. Oxford: Elsevier Science Limited
Kharas, H (2010). The Emerging Middle Class in Developing Countries. OECD
Development Centre, Working Paper No. 285
Khatib et al. (2012). An Iterative Method for Calculating the Optimum Size of Inverter
in PV Systems for Malaysia. PRZEGLĄD ELEKTROTECHNICZNY (Electrical
Review), ISSN 0033-2097, R. 88 NR 4a/2012
Kpekpena J.K. (2014). Status of Clean Energy Development Programs in Ghana..[Cited
05 April 2014]. Available from World Wide Web: URL:
http://www.usea.org/sites/default/files/event-
/Ghana%20Country%20Presentation.pdf
Laser Focus World (2010). Photonic Frontiers: Next-Generation Photovoltaics: New
techniques boost photovoltaic efficiency. [Cited 13 July 2014]. Available from
World Wide Web: http://www.laserfocusworld.com/articles/2010/08/photonic-
frontiers.html

87
LeCompte, M.D. & Schensul, J.J. (1999). Analyzing and interpreting ethnographic
data. Walnut Creek, CA: AltaMira Press.
Macomber et al. (1981). Photovoltaic Stand-Alone Systems: Preliminary Engineering
Design Handbook. [Cited 14 October 2014]. Available from World Wide Web:
http://pdf.usaid.gov/pdf_docs/pnaav338.pdf
Marczak M. & Sewell M. (2014). Using Focus Group for Evaluation. [ Cited 27
November 2014]. Available from World Wide Web: URL:
http://ag.arizona.edu/sfcs/cyfernet/cyfar/focus.htm
Marion et al (2001). PVWATTS Version 2 – Enhanced Spatial Resolution for
Calculating Grid-Connected PV Performance. Presented at NCPV Program
Review Meeting Lakewood, Colorado. NREL/CP-560-30941, October 2001.
Masson G. (2013). Joint Workshop: IEA-PVPS Task 1 / EPIA. IEA-PVPS. Brussels, 6
May 2013.
Maylor, H. & Blackmon, K. (2005). Researching Business and Management.
Basingstoke: Palgrave Macmillan
Medved et al. (2011). Importance of Batteries for Photovoltaic Systems. [Cited 03
August 2014]. Available from World Wide Web:
http://pv.vadium.sk/sub/vadium/files/importance-of-batteries-for-photovoltaic-
systems.pdf
Mehrotra, S., Qiu, X., Cao, Z.,& Tate, A. (2013) Technological Challenges in
Emergency Response (Guest editors' introduction), IEEE Intelligent Systems,
vol.28, Issue No.04, July-Aug. 2013, pp. 5-8, doi:10.1109/MIS.2013.118

88
Merriam, S. B. (1988). Case study research in education: A qualitative approach. San
Francisco: Jossey-Bass.
Merriam, S. B. (1998). Qualitative research and case study applications in education.
San Francisco, CA: Jossey-Bass Publishers.
Miller M.J. (2014). Reliability and Validity. [Cited 04 November 2014]. Available from
World Wide Web:
http://www.michaeljmillerphd.com/res500_lecturenotes/reliability_and_validity.
Mitavachan H., Gokhale A., & Srinivasan J. (2011). A Case Study of 3-Mw Scale Grid-
Connected Solar Photovoltaic Power Plant at Kolar, Karnataka - Performance
Assessment & Recommendations. Divecha Centre for Climate Change, Indian
Institute of Science. Report IISc-DCCC 11 RE 1 August 2011.
MoE & P-Ghana (2013). Renewable. The Directorate. .[Cited 25 May 2014]. Available
from World Wide Web: URL: http://www.energymin.gov.gh/?page_id=205
MoE-Ghana (2007). Policy Framework and Guide for Development of Independent
Power Producers. Ministry of Energy, Ghana. May 2007.
MoE-Ghana (2009). National Energy Policy. Ministry of Energy, Ghana. June 2009
MSU (2014). Ohm’s Law. [Cited 04 November 2014]. Available from World Wide
Web: http://www.pa.msu.edu/courses/2014spring/PHY252/Lab2.pdf
Ndzibah, E. (2010). Diffusion of solar technology: focus group study in Ghana. MEQ:
An International journal emerald Group Publishing Limited 21:6

89
Ndzibah, E. (2013). Marketing Mechanisms for Photovoltaic Technology in Developing
Countries - Case Ghana. Acta Wasaensia, 282. p.1-99 ISBN 978-952-476-468-1
Norton Rose Fulbright (2013). Investing in the African electricity Sector – Ghana, Ten
Things to Know. A Norton Rose Fulbright LLP NRF16189 06/13 (UK)
NPA (2005). National Petroleum Authority Act, 2005 Act 691. [Cited 15 May 2014].
Available from World Wide Web: URL:
http://www.npa.gov.gh/npa_new/downloads/npaAct_doc.pdf
NRC (2001). An Introduction to Photovoltaic Systems. Renewable Energy. [Cited 05
April 2014]. Available from World Wide Web: URL:
http://www.energyalternatives.ca/PDF/Photovoltaic%20Systems%20Introductio
n.pdf
NREL (2003). A Consumer’s Guide – Get Your Power from the Sun. [Cited 08
December 2014]. Available from World Wide Web: URL:
http://www.nrel.gov/docs/fy04osti/35297.pdf
NREL (2014). . [Cited 25 May 2014]. Available from World Wide Web: URL:
http://www.nrel.gov/wind/pdfs/ghana.pdf
Numbeo (2014). Cost of living in Ghana. [Cited 27 November 2014]. Available from
World Wide Web: URL: http://www.numbeo.com/cost-of-
living/country_result.jsp?country=Ghana&displayCurrency=EUR
Nutsukpo D.K. et al (2012). West African Agriculture and Climate Change: Ghana.
International Food Policy Research Institute [Cited 13 June 2014]. Available
from World Wide Web:
http://www.ifpri.org/sites/default/files/publications/rr178ch06.pdf

90
Obinata K. et al. (2010). Geometrical Optimization of Arrangement of Solar Cells in
Photovoltaic Modules. Forma, 25, 31–35, 2010. Toyota Central R&D
Laboratories, Inc., 41-1 Yokomichi, Nagakute-cho, Aichi 480-1192, Japan
Ode M.C. (2014) Photovoltaic Systems. [Cited 05August 2014]. Available from World
Wide Web: http://www.efcog.org/wg/esh_es/events/doe_elec_safety_workshop-
2010/presentations/October%202010%20Photovoltaic%20Systems%20I%20Art
icle%20690%20(NXPowerLite).pdf
OECD/IEA (2010). Renewable Energy Essentials: Geothermal. [Cited 03 December
2014]. Available from World Wide Web:
http://www.iea.org/publications/freepublications/publication/Geothermal_Essent
ials.pdf
O'sullivan, A. & Sheffrin, S. M. (2003). Economics: Principles in Action. Upper Saddle
River, New Jersey 07458: Pearson Prentice Hall. p. 471. ISBN 0-13-063085-3.
Oteng-Adjei, J. (2010). National Energy Policy. Ministry of Energy, Ghana.
Packer N. (2011). A Beginner’s Guide to Energy and Power. Staffordshire University,
UK, February 2011.
Patel, M. R. (1999). Wind and Solar Power Systems; CRC Press LLC; 1999.
Patel, M. R. (2006). Wind and Solar Power Systems: Design, Analysis, and Operation.
2nd edition. Taylor & Francis Group, LLC. ISBN 0–8493–1570–0.
Peacock F. (2013). Solar Inverter Sizing: Don’t violate the new CEC guidelines. [Cited
03 December 2014]. Available from World Wide Web:
http://www.solarquotes.com.au/blog/solar-inverter-sizing-dont-violate-the-new-
cec-guidelines/

91
Pearce J. (2002). Photovoltaics – a Path to Sustainable Futures. Futures 34 (7): 663–
674. Available: doi: 10.1016/S0016-3287(02)00008-3.
Photovoltaic Sustainable Resources (2014). Photovoltaic Systems. Photovoltaic
Sustainable Resources. [Cited 15 June 2014]. Available from World Wide Web:
URL: http://photovoltaics.sustainablesources.com/
Practical Action (2009). Energy Poverty: The hidden energy crisis. [Cited 05 April
2014]. Available from World Wide Web: URL:
http://practicalaction.org/docs/advocacy/energy_poverty_hidden_crisis.pdf
Practical Action (2012). Solar Photovoltaic Water pumping. [Cited 15 June 2014].
Available from World Wide Web: URL: http://practicalaction.org/solar-
photovoltaic-waterpumping
Prida B. et al. (2011). A review of solar photovoltaic technologies. Renewable and
Sustainable Energy Reviews. Volume 15, Issue 3, April 2011, Pages 1625-1636
PV Depot (2014). How to Size a Solar Charge Controller. [Cited 15 June 2014].
Available from World Wide Web: URL: http://pvdepot.com/media/size-a-solar-
charge-controller.pdf
Rahman et al. (2012). Design of a Charge Controller Circuit with Maximum Power
Point Tracker (MPPT) for Photovoltaic System. Dept. of Electrical & Electronic
Engineering, BRAC University. December 15, 2012.
Ram, B. (2006). Renewable Energy Development in Africa - Challenges, Opportunities,
Way Forward. African Development Bank. [Cited 05 April 2014]. Available
from World Wide Web: URL:
http://www.worldenergy.org/documents/congresspapers/275.pdf

92
Redarc (2011). Monocrystalline Solar Panels. DOC389, Version 2. Redarc Electronics
Pty Ltd. [Cited 04 August 2014]. Available from World Wide Web: URL:
http://www.redarc.com.au/images/uploads/images/Monocrystalline_Solar_Panel
s_Instruction_Manual.pdf
REEEP (2009). Renewable Energy Policy Framework for Climate Change Mitigation in
Ghana. Renewable Energy and Energy Efficiency Partnership – REEEP. 31
July, 2009. Also available at ECOWREX Library:
http://www.ecowrex.org/document/renewabel-energy-policy-framework-
climate-change-mitigation-ghana
REEGLE (2014). Ghana. [Cited 05 June 2014]. Available from World Wide Web:
URL: http://www.reegle.info/policy-and-regulatory-overviews/GH
RENI (2012). PV Power Plants 2012 – Industry Guide. [Cited 15 June 2014]. Available
from World Wide Web: URL:
http://www.pv-power-plants.com/fileadmin/user_upload/pdf/PVPP12_low.pdf
Rio P. and Mir-Artigues P. (2014). A Cautionary Tale: Spain’s Solar PV Investment
Bubble. [Cited 15 July 2014]. Available from World Wide Web: URL:
http://www.iisd.org/gsi/sites/default/files/rens_ct_spain.pdf
Rosenthal, R. and Rosnow, R. L. (1991). Essentials of Behavioral Research: Methods
and Data Analysis. Second Edition. McGraw-Hill Publishing Company
SAGE (2010). Introduction to quantitative research. [Cited 05 September 2014].
Available from World Wide Web: URL: http://www.sagepub.com/upm-
data/36869_muijs.pdf
Schimpf T. & Norum L.E. (2008). Grid connected Converters for Photovoltaic, State of
the Art, Ideas for Improvement of Transformerless Inverters. Proceedings of the
Nordic workshop on Power and Industrial Electronics (NORPIE/2008). [Cited

93
05 August 2014]. Available from World Wide Web: URL:
https://aaltodoc.aalto.fi/bitstream/handle/123456789/819/urn011707.pdf?sequen
ce=1
Shah A., Torres P., Tscharner R., Wyrsch N. & Keppner H (1999). Photovoltaic
technology: the case for thin-film solar cells. Science 1999; 285(5427): 692- 698
SMA Solar Technology AG (2014). Solar Stand-Alone Power and Backup Power
Supply. INSELVERSOR-AEN101410 [Cited 05 August 2014]. Available from
World Wide Web: URL: http://files.sma.de/dl/10040/INSELVERSOR-
AEN101410.pdf
Solar Direct (2014). Charge Controller – Photovoltaic System Components: PV
Controllers. Solar PV Electric. Solar Direct. [Cited 05 August 2014]. Available
from World Wide Web: URL:
http://www.solardirect.com/pv/pvlist/control/control.html
Solar Edge Technologies (2011). Problems and Disadvantages in Current Residential
& Commercial On-grid PV Systems. [Cited 05 August 2014]. Available from
World Wide Web: URL: http://ussolarinstitute.com/wp-
content/uploads/2012/11/se-problems-and-disadvantages-in-current-residential-
and-commercial-on-grid-pv-systems.pdf
Sparkfun (2014). Voltage, Current, Resistance, and Ohm's Law. [Cited 05 August
2014]. Available from World Wide Web: URL:
https://learn.sparkfun.com/tutorials/voltage-current-resistance-and-ohms-law
Spiers D. & Royer J. (1998). Guidelines for the Use of Batteries in Photovoltaic
Systems. Canadian Energy Diversification Research Laboratory of CANMET &
Neste Oy, Finland.

94
Stichting TOOL (1990). Solar Energy – Small Scale Application in Developing
Countries. [Cited 12 November 2014]. Available from World Wide Web:
http://www.wot.utwente.nl/publications/solar-energy.pdf
Sustainable Resources (2014). Photovoltaic Systems. Available from World Wide Web:
URL: http://photovoltaics.sustainablesources.com/
The Solar Cooking (2014). Horace de Saussure and his Hot Boxes of the 1700's. [Cited
15 June 2014]. Available from World Wide Web: URL:
http://solarcooking.org/saussure.htm
Tolbert, L.M. et al. (2000). Multilevel PWM Methods at Low Modulation Indices. IEEE
Transactions on Power Electronics, Vol. 15, No. 4, July 2000.
Turna O. (2011). Pure Sine vs. Modified Sine Wave Inverters. Civic Solar. [Cited 05
August 2014]. Available from World Wide Web: URL:
http://www.civicsolar.com/resource/pure-sine-vs-modified-sine-wave-inverters
UNCTAD (2007). Developing Countries in International Trade –Trade and
Development Index. UNITED NATIONS, New York and Geneva. United
Nations Publication - ISSN 1817-1214
UNESCO (2004). Guide to the Analysis and Use of Household Survey and Census
Education Data. [Cited 11 November 2014]. Available from World Wide Web:
URL: http://www.uis.unesco.org/Library/Documents/hhsguide04-en.pdf
Viessmann (2009). Technical Guide – Solar Thermal Systems. Viessmann Werke, 9449
829 GB 05/2009. Cited 25 April 2014]. Available from World Wide Web: URL:
http://www.viessmann.es/content/dam/internet-
es/pdf_documents/brochures/vitosol/guia_tecnica_solar.pdf

95
VRA (2013). Kpong Hydro Plant. Cited 26 November 2014]. Available from World
Wide Web: URL:
http://www.vraghana.com/our_mandate/kpong_hydro_plant.php
VRA (2013). Projects. [Cited 25 April 2014]. Available from World Wide Web: URL:
http://www.vraghana.com/about_us/projects.php
Whitaker et al. (2008). Renewable Systems Interconnection Study: Distributed
Photovoltaic Systems Design and Technology Requirements. Sandia Report,
SAND2008-0946 P. Sandia National Laboratories.
Wilson D. (2011). Sine Wave vs. Modified Sine Wave: Which Is Better? The Inside
Story, Xantrex Technology USA Inc. [Cited 25 April 2014]. Available from
World Wide Web: URL: http://www.xantrex.com/documents/Tech-
Doctor/Universal/Tech1-Universal.pdf
World Bank 2003. African Development Indicators 2003. World Bank. ISBN: 978-0-
8213-5453-7
World bank 2012. Global Development Finance - External Debt of Developing
Countries. The World Bank, Washington DC. ISBN: 978-0-8213-9453-3
World Energy council (2007). 2007 Survey of Energy Resources. World Energy
Council. ISBN: 0 946121 26 5
Wu J. & Ren J. (2012). Research and Application of Solar Energy Photovoltaic-
Thermal Technology. [Cited 12 November 2014]. Available from World Wide
Web: URL: http://cdn.intechopen.com/pdfs-wm/28489.pdf
Yin, R. K. (1994). Case Study Research: Design and Method. 2. Edition. California:
Sage Publications: ISBN 0-8039-5663-0

96
Zahedi A. (1996). Entirely renewable energy-based electricity supply system (small
scale & large scale). Renewable Energy, Volume 9, Issues 1–4, September–
December 1996, Pages 913–916.
Zeman M. (2014). Photovoltaic Systems. Solar Cells, Chapter 9. Photovoltaic Systems.
Delft University of Technology. [Cited 04 August 2014]. Available from World
Wide Web: URL:
http://ocw.tudelft.nl/fileadmin/ocw/courses/SolarCells/res00029/CH9_Photovolt
aic_systems.pdf
Zimmerman K.A. (2012). Empirical Evidence: A Definition. [Cited November 07,
2014]. Available from World Wide Web: URL:
http://www.livescience.com/21456-empirical-evidence-a-definition.html

97
APPENDIXES
Appendix 1: Focus Group Questionnaire
1. How well are you familiar with the current electrification problems in Ghana?
2. How do you think this problem can be solved?
3. What is photovoltaic system and how can it be used to produce electricity?
4. What are the components involved in a photovoltaic system?
5. What is the various configuration or types of photovoltaic systems?

98
Appendix 2: Survey Questionnaire
Study on Product Configuration of Photovoltaic Systems in Developing
Countries – Case Ghana This questionnaire is part of a Master thesis researcher at the University of Vaasa, Finland. The purpose is to obtain feedback to answer the research questions and key objectives.
All answers and information given will be handled confidentially.
Its takes 5 - 10 minutes to fill the questionnaire.
Respondent info: i) How old are you? _________ ii) What is your gender? Male or
Female
iii) Your Occupation (s): __________
1. Are you a business owner? Yes / No
2. Which of the following applies to you?
a. Tenants
b. Home owner
3. What is your average monthly electricity bill?
a. GHC 1 – GHC 20
b. GHC 21 – GHC 40
c. GHC 41 – GHC 60
d. GHC 61 – GHC 80
e. If more than GHC 80, please specify: ________

99
4. Is the current electrification problem in Ghana affecting you? Yes or No
5. Do you have any knowledge about renewable energy? Yes or No
6. Which of the following renewable energy are you familiar with?
a. Solar Photovoltaic Energy
b. Wind Energy
c. Hydropower Energy
d. Geo-thermal Energy
e. Bio fuel Energy
f. Others, please specify: ________
7. Would you like to switch to photovoltaic energy? Yes or No
8. Which of the following would you likely use photovoltaic energy for?
a. Lighting b. Cooking
c. Refrigeration d. Household Appliances
e. Business operation f. All of the above