Product Brochure: Asia-Pacific Cross-Border B2C E-Commerce 2015
13
1 ASIA-PACIFIC CROSS-BORDER B2C E-COMMERCE 2015 PUBLICATION DATE: AUGUST 2015 PAGE 2 GENERAL INFORMATION I PAGE 3 KEY FINDINGS I PAGE 4-5 TABLE OF CONTENTS I PAGE 6 REPORT-SPECIFIC SAMPLE CHARTS I PAGE 7 METHODOLOGY I PAGE 8 RELATED REPORTS I PAGE 9 CLIENTS I PAGE 10-11 FREQUENTLY ASKED QUESTIONS PAGE 12 ORDER FORM I PAGE 13 TERMS AND CONDITIONS
Transcript of Product Brochure: Asia-Pacific Cross-Border B2C E-Commerce 2015

1
ASIA-PACIFIC CROSS-BORDER B2C E-COMMERCE 2015 PUBLICATION DATE: AUGUST 2015
PAGE 2 GENERAL INFORMATION I PAGE 3 KEY FINDINGS I PAGE 4-5 TABLE OF CONTENTS I PAGE 6 REPORT-SPECIFIC SAMPLE
CHARTS I PAGE 7 METHODOLOGY I PAGE 8 RELATED REPORTS I PAGE 9 CLIENTS I PAGE 10-11 FREQUENTLY ASKED QUESTIONS
PAGE 12 ORDER FORM I PAGE 13 TERMS AND CONDITIONS

2
2
PRODUCT DETAILS Title:
Type of Product:
Category:
Covered Regions:
Covered Countries:
Language:
Formats:
Number of Charts:
Asia-Pacific Cross-Border B2C E-Commerce 2015
Market Report
Cross-Border
E-Commerce
Global, Asia-Pacific
China, Japan, South Korea, Australia, India, Hong Kong, Malaysia
English
PDF & PowerPoint
62
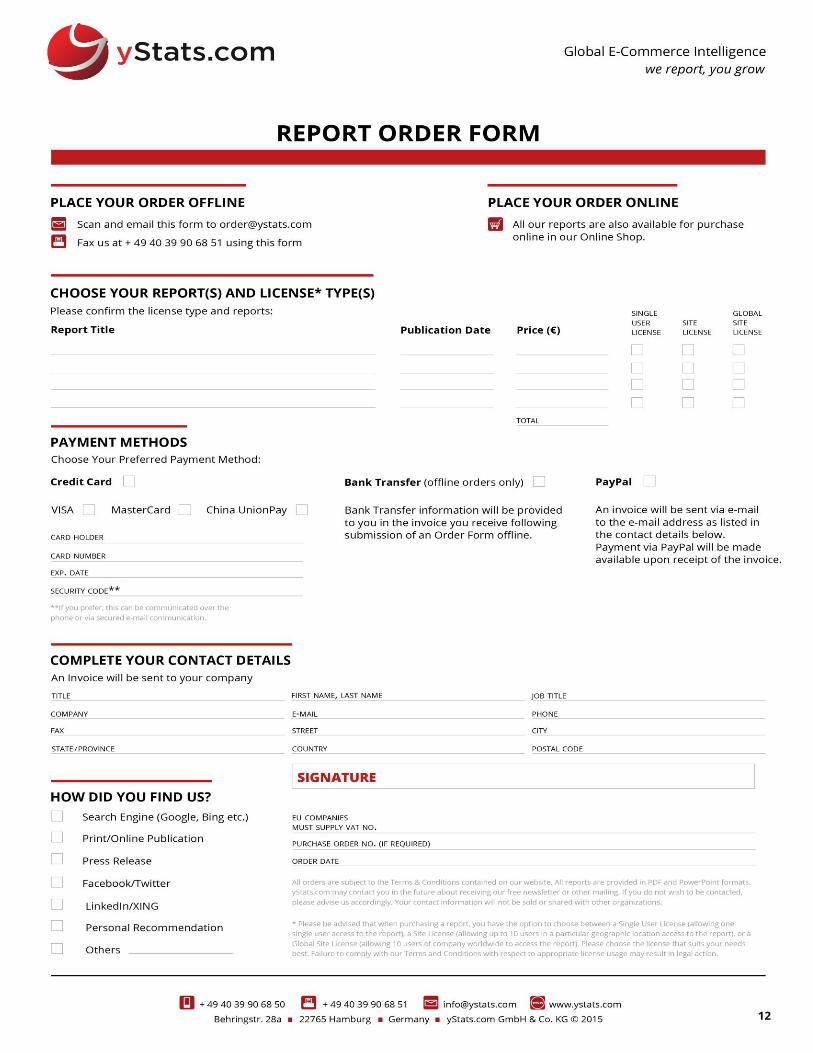
PRICES* Single User License:
Site License:
Global Site License:
€ 950 (exc. VAT)
€ 1,425 (exc. VAT)
€ 1,900 (exc. VAT)
QUESTIONS
ANSWERED
IN THIS REPORT
How large is Asia-Pacific’s share forecasted to become in global cross-border B2C E-Commerce?
Which countries in Asia-Pacific have the highest online shopper penetration rate?
Which countries and product categories are targeted by cross-border online shoppers across the
region?
SECONDARY MARKET
RESEARCH
Our reports are exclusively based on secondary market research. Our researchers derive
information and data from a variety of reliable published sources and compile the data into
understandable and easy-to-use formats.
ADVANTAGES Maximum Objectivity
Reliable Sources
Up-To-Date Analysis
Boardroom-Ready PowerPoint Presentations
Guidance For Strategic Company Decisions
ASIA-PACIFIC CROSS-BORDER B2C E-COMMERCE 2015

3
ASIA-PACIFIC TO ACCOUNT FOR NEARLY HALF OF GLOBAL CROSS-BORDER
B2C E-COMMERCE
Asia-Pacific is the largest region in the world in online retail sales and continues to grow rapidly. Cross-
border online shopping is an important trend in this region, which is reported to have the potential to account
for nearly half of all cross-border B2C E-Commerce sales worldwide in 2020. Cross-border online shopper
penetration throughout the region varied from a low one-digit percentage in Indonesia to a high of over two-
thirds in Australia, as of the beginning of 2015.
China is the key destination of both cross-border online imports and exports. Close to a third of active
online shoppers made purchases across borders in China last year, while China itself ranked at least in the top 3
online shopping destinations of consumers in countries such as Russia, Brazil, and many others. China’s major E-
Commerce companies, Alibaba and JD.com, compete on both fields, using their marketplaces to enable foreign
merchants to access Chinese online consumers and China-based merchants to access overseas online shoppers.
Another major B2C E-Commerce market, Japan, has intense cross-border online trade with China and the
USA, with cross-border B2C E-Commerce exports to these countries from Japan outweighing imports in 2014. In
South Korea, as well, the USA and China were the top two destinations for cross-border online shoppers last
year, while the most purchased product categories were clothing and health supplements. The emerging
Southeast Asian markets also participate in the cross-border trend, led by Singapore.
ASIA-PACIFIC CROSS-BORDER B2C E-COMMERCE 2015
4
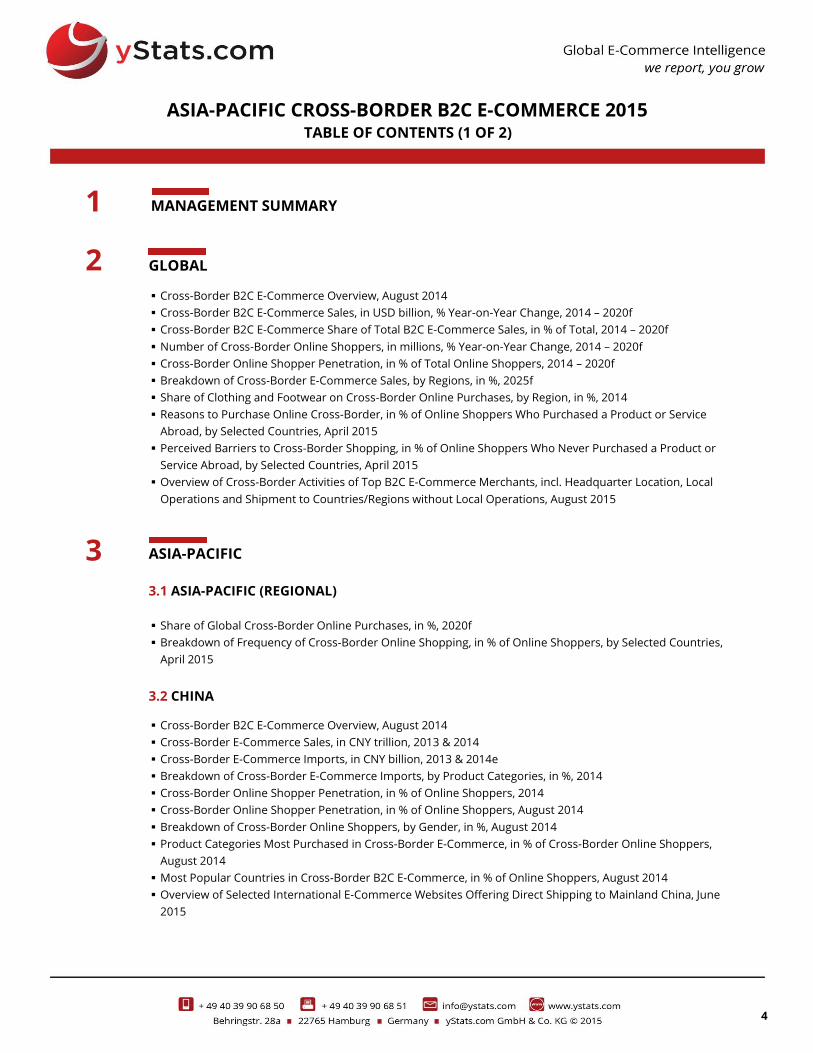
MANAGEMENT SUMMARY
GLOBAL
Cross-Border B2C E-Commerce Overview, August 2014
Cross-Border B2C E-Commerce Sales, in USD billion, % Year-on-Year Change, 2014 – 2020f
Cross-Border B2C E-Commerce Share of Total B2C E-Commerce Sales, in % of Total, 2014 – 2020f
Number of Cross-Border Online Shoppers, in millions, % Year-on-Year Change, 2014 – 2020f
Cross-Border Online Shopper Penetration, in % of Total Online Shoppers, 2014 – 2020f
Breakdown of Cross-Border E-Commerce Sales, by Regions, in %, 2025f
Share of Clothing and Footwear on Cross-Border Online Purchases, by Region, in %, 2014
Reasons to Purchase Online Cross-Border, in % of Online Shoppers Who Purchased a Product or Service
Abroad, by Selected Countries, April 2015
Perceived Barriers to Cross-Border Shopping, in % of Online Shoppers Who Never Purchased a Product or
Service Abroad, by Selected Countries, April 2015
Overview of Cross-Border Activities of Top B2C E-Commerce Merchants, incl. Headquarter Location, Local
Operations and Shipment to Countries/Regions without Local Operations, August 2015
ASIA-PACIFIC
3.1 ASIA-PACIFIC (REGIONAL)
Share of Global Cross-Border Online Purchases, in %, 2020f
Breakdown of Frequency of Cross-Border Online Shopping, in % of Online Shoppers, by Selected Countries,
April 2015
3.2 CHINA
Cross-Border B2C E-Commerce Overview, August 2014
Cross-Border E-Commerce Sales, in CNY trillion, 2013 & 2014
Cross-Border E-Commerce Imports, in CNY billion, 2013 & 2014e
Breakdown of Cross-Border E-Commerce Imports, by Product Categories, in %, 2014
Cross-Border Online Shopper Penetration, in % of Online Shoppers, 2014
Cross-Border Online Shopper Penetration, in % of Online Shoppers, August 2014
Breakdown of Cross-Border Online Shoppers, by Gender, in %, August 2014
Product Categories Most Purchased in Cross-Border E-Commerce, in % of Cross-Border Online Shoppers,
August 2014
Most Popular Countries in Cross-Border B2C E-Commerce, in % of Online Shoppers, August 2014
Overview of Selected International E-Commerce Websites Offering Direct Shipping to Mainland China, June
2015
ASIA-PACIFIC CROSS-BORDER B2C E-COMMERCE 2015
1
2
3
TABLE OF CONTENTS (1 OF 2)

5
5
ASIA-PACIFIC (cont.)
3.3 JAPAN
Cross-Border B2C E-Commerce Overview, August 2014
Cross-Border B2C E-Commerce Flow between Japan, the USA and China, in JPY billion, 2014
Year-on-Year Growth of Cross-Border B2C E-Commerce Flow between Japan, the USA and China, in %, 2014
Cross-Border B2C E-Commerce Imports from the USA and China, in JPY billion, 2014 - 2018f
Most Popular Countries in Cross-Border B2C E-Commerce, in % of Online Shoppers, August 2014
3.4 SOUTH KOREA
Cross-Border E-Commerce Imports, in USD billion, 2013 & 2014
Breakdown of Cross-Border Online Orders, by Country of Origin, in %, 2013 & 2014
Countries Most Purchased From in Cross-Border E-Commerce, in % of Online Shoppers, August 2014
Cross-Border Shopper Penetration, in % of Consumers who Purchased Foreign Goods Overseas Offline
During Vacation or Directly Online, by Purchasing Offline and Online, October 2014
Breakdown of the Most Preferred Channels for Cross-Border Online Shopping, in % of Cross-Border Online
Shoppers, October 2014
Breakdown of Cross-Border Online Orders, by Product Categories, in %, 2014
Breakdown of Cross-Border Online Orders, by Value in USD, in %, 2014
Websites Purchased from in Cross-Border E-Commerce, in % of Cross-Border Online Shoppers, May 2014
3.5 AUSTRALIA
Breakdown of B2C E-Commerce Sales, by International and Domestic, in %, April 2015
Cross-Border Online Shopper Penetration, in % of Online Shoppers, June 2014
Cross-Border Online Shopper Penetration, in % of Online Shoppers, by Age Group and Gender, June 2014
Cross-Border Online Shopper Penetration and Number, in % of Individuals and in millions, 12 Months to
September 2014
Product Categories Purchased from Overseas Websites, in thousands Online Shoppers, 12 Months to
September 2014
Most Popular Countries in Cross-Border B2C E-Commerce, in % of Online Shoppers, August 2014
3.6 INDIA
Share of Online Shoppers who Prefer to Buy from Global Sites, in %, January 2015
Most Popular Countries in Cross-Border B2C E-Commerce, in % of Online Shoppers, August 2014
3.7 HONG KONG
Cross-Border Online Shopper Penetration, in % of Online Shoppers, 2014
3.8 MALAYSIA Share of Cross-Border on Total E-Commerce Sales, in %, 2014e
ASIA-PACIFIC CROSS-BORDER B2C E-COMMERCE 2015 TABLE OF CONTENTS (2 OF 2)
3

6
ASIA-PACIFIC CROSS-BORDER B2C E-COMMERCE 2015

7
GENERAL METHODOLOGY OF OUR MARKET REPORTS
Our reports are compiled based on secondary market
research. Secondary research is information gathered from
previously published sources. Our reports are solely based on
information and data acquired from national and international
statistical offices, industry and trade associations, business
reports, business and company databases, journals, company
registries, news portals and many other reliable sources. By using
various sources we ensure maximum objectivity for all obtained
data. As a result, companies gain a precise and unbiased
impression of the market situation.
Cross referencing of data is conducted in order to
ensure validity and reliability.
The source of information and its release date are
provided on every chart. It is possible that the information
contained in one chart is derived from several sources. If this is
the case, all sources are mentioned on the chart.
Our reports include text charts, pie charts, bar charts,
rankings, line graphs and tables. Every chart contains an Action
Title, which summarizes the main idea/finding of the chart and a
Sub Title, which provides necessary information about the
country, the topic, units or measures of currency, and the
applicable time period(s) to which the data refers. With respect to
rankings, it is possible that the summation of all categories
amounts to more than 100%. In this case, multiple answers were
possible, which is noted at the bottom of the chart.
Reports are comprised of the following elements, in the
following order: Cover page, preface, legal notice, methodology,
definitions, table of contents, management summary
(summarizing main information contained in each section of
report) and report content (divided into sections and chapters).
When available, we also include forecasts in our report content.
These forecasts are not our own; they are published by reliable
sources. Within Global and Regional reports, we include all major
developed and emerging markets, ranked in order of importance
by using evaluative criteria such as sales figures.
If available, additional information about the data
collection, for example the time of survey and number of people
surveyed, is provided in the form of a note. In some cases, the
note (also) contains additional information needed to fully
understand the contents of the respective data.
When providing information about amounts of money,
local currencies are most often used. When referencing currency
values in the Action Title, the EUR values are also provided in
brackets. The conversions are always made using the average
currency exchange rate for the respective time period. Should the
currency figure be in the future, the average exchange rate of the
past 12 months is used.
The reports include mainly data from the last 12 months
prior to the date of report publication. Exact publication dates are
mentioned in every chart.
METHODOLOGY OF OUR ASIA-PACIFIC CROSS-BORDER B2C E-COMMERCE 2015 REPORT
This report covers the cross-border B2C E-Commerce
market, focusing both on cross-border imports and exports.
All major countries from the region are covered, though
data availability varied across the markets.
Information about global developments is included first.
Next, regional information is covered, including country
comparisons.
The rest of the report is divided by countries and
territories, which are ranked in the order of descending B2C E-
Commerce sales.
Depending on data availability, the following types of
market information are included: cross-border online shopper
penetration, cross-border B2C E-Commerce sales (export and/or
import), countries most purchased from, countries most sold to,
most popular product categories. Not all the mentioned types of
information are available for each of the countries covered. For
the leading countries in the region, also a text chart with a
qualitative overview of cross-border B2C E-Commerce is
presented.
ASIA-PACIFIC CROSS-BORDER B2C E-COMMERCE 2015
8
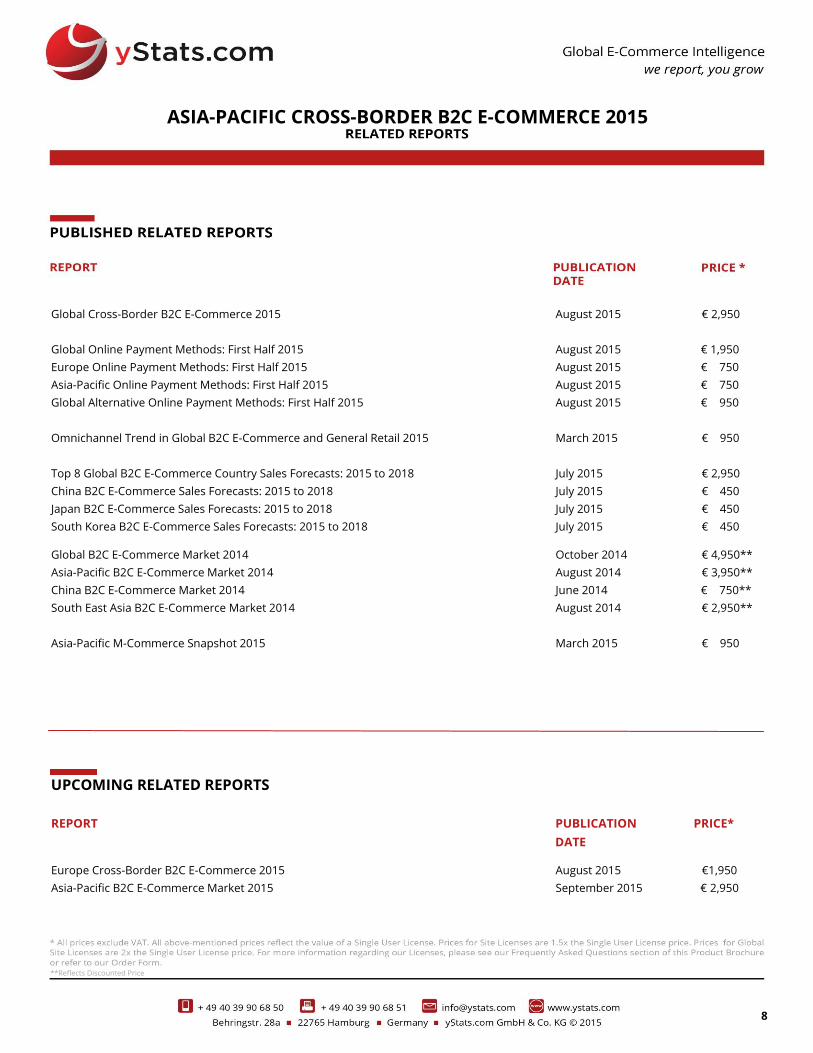
UPCOMING RELATED REPORTS
Global Cross-Border B2C E-Commerce 2015 August 2015 € 2,950
Global Online Payment Methods: First Half 2015 August 2015 € 1,950
Europe Online Payment Methods: First Half 2015 August 2015 € 750
Asia-Pacific Online Payment Methods: First Half 2015 August 2015 € 750
Global Alternative Online Payment Methods: First Half 2015 August 2015 € 950
Omnichannel Trend in Global B2C E-Commerce and General Retail 2015 March 2015 € 950
Top 8 Global B2C E-Commerce Country Sales Forecasts: 2015 to 2018 July 2015 € 2,950
China B2C E-Commerce Sales Forecasts: 2015 to 2018 July 2015 € 450
Japan B2C E-Commerce Sales Forecasts: 2015 to 2018 July 2015 € 450
South Korea B2C E-Commerce Sales Forecasts: 2015 to 2018 July 2015 € 450
Global B2C E-Commerce Market 2014 October 2014 € 4,950**
Asia-Pacific B2C E-Commerce Market 2014 August 2014 € 3,950**
China B2C E-Commerce Market 2014 June 2014 € 750**
South East Asia B2C E-Commerce Market 2014 August 2014 € 2,950**
Asia-Pacific M-Commerce Snapshot 2015 March 2015 € 950
REPORT
PUBLICATION
DATE
PRICE*
Europe Cross-Border B2C E-Commerce 2015 August 2015 €1,950
Asia-Pacific B2C E-Commerce Market 2015 September 2015 € 2,950
ASIA-PACIFIC CROSS-BORDER B2C E-COMMERCE 2015
**Reflects Discounted Price

9

10

11
12

13