PRODUCER PRICE INDEX (IPP) GENERAL … Departamento Administrativo Nacional de Estadística (DANE) 6...
89
Direction of Methodology and Statistical Production (DIMPE) PRODUCER PRICE INDEX (IPP) GENERAL METHODOLOGY OCTOBER 2015
-
Upload
truongthuy -
Category
Documents
-
view
217 -
download
2
Transcript of PRODUCER PRICE INDEX (IPP) GENERAL … Departamento Administrativo Nacional de Estadística (DANE) 6...
Direction of Methodology and Statistical Production
(DIMPE)
PRODUCER PRICE INDEX
(IPP)
GENERAL METHODOLOGY
OCTOBER 2015

NATIONAL ADMINISTRATIVE DEPARTMENT OF STATISTICS
MAURICIO PERFETTI DEL CORRAL
Director
CARLOS FELIPE PRADA LOMBO
Deputy Director
LUIS HUMBERTO MOLINA MORENO
General Secretary
TECHNICAL DIRECTORS
EDUARDO EFRAÍN FREIRE DELGADO
Methodology and Statistical Production
LILIANA ACEVEDO ARENAS
Censuses and Demography
RAMÓN RICARDO VALENZUELA
Statistical Regulation, Planning, Standardization and Normalization
MIGUEL ÁNGEL CÁRDENAS CONTRERAS
Geostatistics
JUAN FRANCISCO MARTÍNEZ
Synthesis and National Accounts
ÉRIKA MOSQUERA ORTEGA
Dissemination, Marketing and Statistical Culture
Bogotá, D. C., 2015
5
Bogotá D. C., Cundinamarca
2015 5
© DANE, 2015
No reproduction, partial or full, may be undertaken without prior authorization
from the National Administrative Department of Statistics, Colombia.
Direction of Methodology and Statistical Production (DIMPE)
Eduardo Efraín Freire Delgado
Technical Staff:
María Ximena Caicedo Moreno, Sandra Milena Duarte Alape, Diana Paola
Saavedra Rojas, Mireya Rendón Bernal, Orlando Jiménez, Jorge Andrés Tenorio
Neira, Andrés Domínguez Moreno, Lorena Sofía Correa Tovar. Technical Team:
Irma Inés Parra Ramírez, Diana Patricia Guarín Aguilar, Ligia Galvis, Jackeline
Suarez Cabezas, Luis Edgar Sánchez, Rubén Alberto Herrera Cardona, Marisol
Sabogal, Yolanda Castillo Romero.
With the support of: Miguel Antonio Torres, Lilian Andrea Guío, Lady Moreno
Cifuentes, Juan Francisco Martínez, Gilma Beatriz Ferreira, Nohora Margarita
Sánchez, Germán Pérez Hernandez, Marion Pinot de Libreros, Ana Victoria Vega,
Henry Antonio Mendoza, Iván Ernesto Piraquive, Jorge Centanaro, Rafael Móvil,
María del Pilar Gómez Arciniegas, Alexander Ortiz Ortiz. Adviser Team:
Edgar Caicedo y Wilmer Martínez (Banco de la República), Dora Sánchez, Juan
Fernando Plazas, Andres Clavijo (DANE), Daniel Santos (International Monetary
Fund), Gaétan Garneau, Louis Marc Ducharme y Norma Chhab Alperin-Statistics
Canada.
6
Departamento Administrativo
Nacional de Estadística (DANE) 6
Producer Price Index (IPP)
General Methodology
CONTENTS
FOREWORD……………………………………………………………………………………………………………..…..8
INTRODUCTION ........................................................................................................................... 9
1. BACKGROUND ....................................................................................................................... 10
2. DESIGN OF THE STATISTICAL OPERATION ......................................................................... 13
2.1 METHODOLOGICAL THEMATIC DESIGN ....................................................................... 13
2.1.1 Needs of information ....................................................................................... 13
2.1.2 Objectives .......................................................................................................... 13
2.1.3 Scope .................................................................................................................. 14
2.1.4 Reference framework ...................................................................................... 14
2.1.5 Design of indicators ......................................................................................... 22
2.1.6 Plan of results ................................................................................................... 43
2.1.6.1 Design of tables of outcomes (results)............................................. 43
2.1.6.2 Design of the form (questionnaire) .................................................. 44
2.1.7 Norms, specifications or editing rules, consistency and imputation ........ 45
2.1.8 Classifications used .......................................................................................... 47
2.2 STATISTICAL DESIGN ....................................................................................................... 49
2.2.1 Basic components of the statistical design .................................................. 49
2.2.2 Statistical units .................................................................................................. 52
2.2.3 Periods of reference and collection of information .................................... 53
2.2.4 Sample Design .................................................................................................. 53
2.3 OPERATIONAL DESIGN ................................................................................................... 54
2.3.1 Training System ................................................................................................ 54
7
Bogotá D. C., Cundinamarca
2015 7
2.3.2 Preparatory activities ....................................................................................... 55
2.3.3. Design of instruments .................................................................................... 57
2.3.4 Data collection .................................................................................................. 57
2.4 SYSTEMS DESIGN ............................................................................................................. 60
2.4.1 Main modules ................................................................................................... 61
2.5 DESIGN METHODS AND MECHANISMS FOR QUALITY CONTROL ............................. 62
2.5.1. Procedure of codification and editing .......................................................... 62
2.5.2. Analysis of the quality of results ................................................................... 62
2.5.3. Indicators for the quality control of the processes of the research ........ 64
2.6 DESIGN OF THE ANALYSIS OF RESULTS ........................................................................ 67
2.6.1 Statistical analysis ............................................................................................. 67
2.6.2 Context Analysis ............................................................................................... 68
2.6.3. Experts Committees ........................................................................................ 69
2.7 DISSEMINATION DESIGN ................................................................................................ 69
2.7.1 Administration of the data repository............................................................... 69
2.7.2 Products and instruments of dissemination .................................................... 70
DESIGN OF THE EVALUATION .................................................................................................. 72
3. RELATED DOCUMENTATION ............................................................................................73
GLOSSARY……………………………………………………………………………………………………………..74
BIBLIOGRAPHY .....................................................................................................................77
ANNEXES……………………………………………………………………………………………………………….79
8
Departamento Administrativo
Nacional de Estadística (DANE) 8
Producer Price Index (IPP)
General Methodology
FOREWORD
The National Administrative Department of Statistics (DANE), a government agency,
is responsible for coordinating and regulating the National Statistical System (SEN).
Within the Statistical Planning and Harmonization project, it works for strengthening
and consolidating the SEN. The following processes support this commitment: the
production of strategic statistics; the generation, adaptation and dissemination of
standards; the consolidation and harmonization of the statistical information and
the coordination of instruments, actors, initiatives and products, all actions geared
towards the improvement of the quality of strategic statistical information, its
availability, timeliness and accessibility in order to respond to the increasing demand
for such information.
Conscious of the need and obligation to offer the best possible products, DANE has
developed a standard guide for the documentation of the methodologies of
statistical operations so as to contribute to the visualization and understanding of
the statistical process. Through this instrument, the organization produces
methodological documents, for use by specialists and the general public. They
present in a standard manner, the main technical characteristics of the processes of
each research. They are complete, of easy reading, which allows its analysis, control
and evaluation.
This series of documents, favors the transparency, confidence and credibility of the
technical quality of the institution for a better understanding and use of the
statistical information produced following the principles of coherence, comparability,
integrity and quality.
9
Bogotá D. C., Cundinamarca
2015 9
INTRODUCTION
This document is a practical guide that compiles the required information to present
the bases and methodologic structure of the Producer Price Index (PPI). The PPI
measures the average monthly change of the prices of a representative basket of
domestically produced goods.
The index is part of the set of tools for short term analysis, geared towards the
detection of inflationary transmission channels, so as to facilitate the study of the
behavior of the prices of products since their entrance in the commercialization
channels.
The first works on the subject were carried out by the Banco de la República
(Colombia’s Central Bank) from 1948 with a general trade index that was shortly
replaced by the Wholesale Price Index (IPM) and as of 1991 the Producer Price Index
(PPI) was introduced. In 2007 DANE assumed the elaboration of the PPI with the
institutional objective of keeping continuity in the series and simultaneously
introducing several required complements and technical adjustments. In 2015, this
research was redesigned and the last published data correspond to the most recent
revision of the index.
DANE carries out regularly the revision of the PPI in order to incorporate operational
and methodological improvements that allow the process of production of the index
to be more complete, in agreement with the new developments of advanced
statistical systems. In agreement with the international recommendations and
standards, the PPI must be updated at least every ten years.
Herewith are presented the main elements of information contained in the
methodologies and other documents concerning the Producer Price Index (PPI)
project, following the System of Quality Management and of Documentation of
Processes.
This document comprises two parts: the first one summarizes the background of this
research and the second presents in detail the design of the statistical operation,
emphasizing in the thematic aspects, the operative and systems organization, topics
related to quality control and finalizes with the analysis and dissemination of results.
10
Departamento Administrativo
Nacional de Estadística (DANE) 10
Producer Price Index (IPP)
General Methodology
1. BACKGROUND
In 1948 the Banco de la República constructed the price index for trade in general.
The initial geographical coverage of the index was limited to Bogotá and included a
representative group of products of agriculture, forest, mining, manufacturing and
power generation sectors. In 1951, following the recommendation of the United
Nations (UN) this index was redesigned and denominated price index of general
wholesale trade (IPM). This redesign included the coverage of other cities, the
enlargement of the basket and the incorporation of the Standard International Trade
Classification (SITC) of products. Later, in 1970 the International Monetary Fund
proposed some recommendations and on this occasion the redesign consisted in
increasing the number of cities observed as well as that of the basket of products.
Additionally, the International Standard Industrial Classification (ISIC) and the
Classification of Foreign Trade According to Use or Economic Purpose (CUODE) were
introduced.
In 1990, the IPM was replaced by the Producer Price Index (PPI). This change was an
answer to the fact that the simultaneous inclusion of producers and wholesale
distributers in the universe of observation of the IPM brought about heterogeneity in
the origin of the information and differences between the components of prices
according to the level of commercialization of the product. The replacement implied
additionally a change in the conceptual and practical base, since it allowed to
introduce methodologic advances in the calculation of the index as well as the update
of the basket of goods and of the system of weights.
In 1999 the PPI was redesigned with the purpose of constructing a family of indices
that allowed to follow up the change in prices from the supply side. Information was
extracted from the supply and use tables of the National Accounts, and intermediate
demand was excluded so as to reflect closer the change in prices from producers to
final consumers.
In 2007, DANE took over the elaboration of the PPI with the institutional objective of
giving continuity to the series and incorporate technical improvements as required.

11
Bogotá D. C., Cundinamarca
2015 11
DANE took over the methodological design of this index, given its advantages in
handling information, as for example: for guaranteeing the updating and extending
the structure of weights, having the required infrastructure for collecting information
on a large scale basis, having its own updated registers of businesses operating in
the country with information on their location and levels of production, having its own
group of data collectors and specialized technicians in sampling as well as the legal
instruments to request information on prices from reporting enterprises.
The redesigned PPI was issued in 2015. It corresponds to the most recent revision of
the index and includes:
Publication of the Price Index of Domestically Produced Goods, referred to goods
produced in the country irrespective of the place of consumption.
Update of weights: The previous structure used a 2000 base and the new one a
2011 base.
Use of the results of the Annual Manufacturing Survey (2012), Statistics of Foreign
Trade, National Agricultural Survey (ENA), Information System of Prices of the
Agricultural Sector.
Update of the baskets for National, Exported and Imported products using as
input the EAM and information on Foreign Trade for the 2009-2012 period and
the corresponding commodity balances of the 2011 National Accounts.
Use of the ISIC version 4 A.C (January 2012) and CPC version 2 (July 2013)
classifications, updated and published by the Direction of Regulation, Planning,
Standardization and Normalization (DIRPEN-DANE).
Implementation of the new Oracle platform for the calculation of PPI.
Adoption of an internationally accepted system of imputation, that allows to deal
with the temporary lack of information from information sources.
Indexation of Weights (2014).
12
Departamento Administrativo
Nacional de Estadística (DANE) 12
Producer Price Index (IPP)
General Methodology
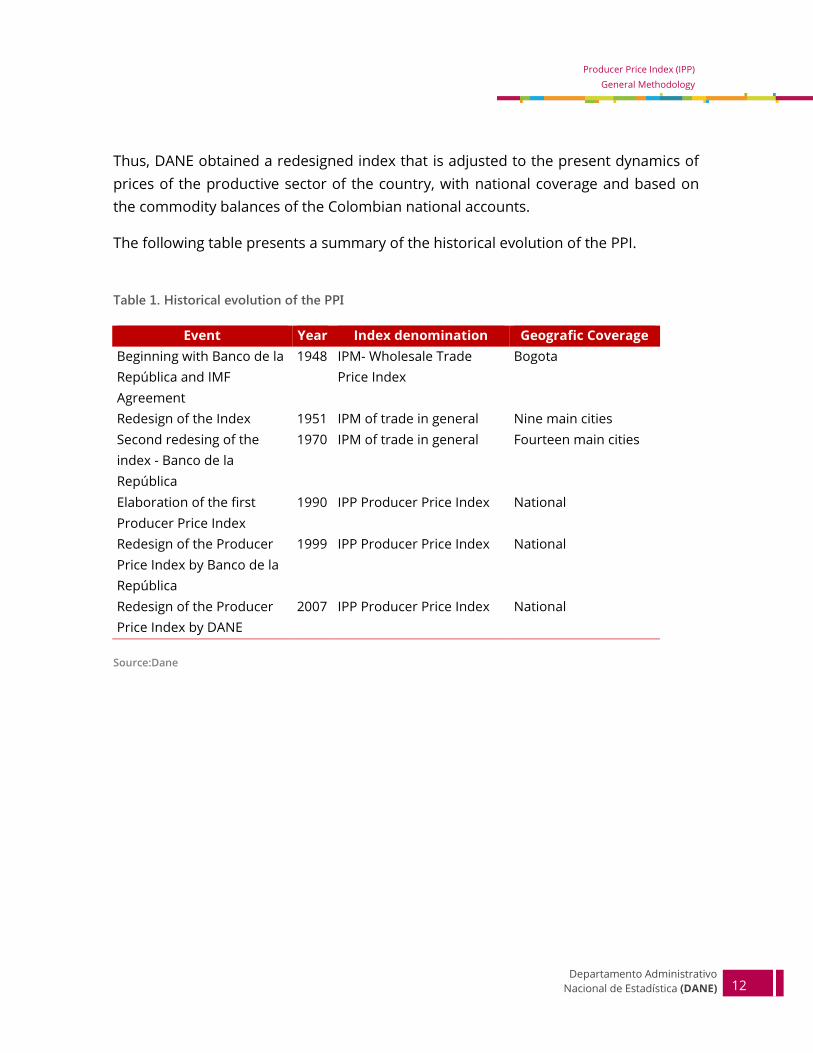
Thus, DANE obtained a redesigned index that is adjusted to the present dynamics of
prices of the productive sector of the country, with national coverage and based on
the commodity balances of the Colombian national accounts.
The following table presents a summary of the historical evolution of the PPI.
Table 1. Historical evolution of the PPI
Event Year Index denomination Geografic Coverage
Beginning with Banco de la
República and IMF
Agreement
1948 IPM- Wholesale Trade
Price Index
Bogota
Redesign of the Index 1951 IPM of trade in general Nine main cities
Second redesing of the
index - Banco de la
República
1970 IPM of trade in general Fourteen main cities
Elaboration of the first
Producer Price Index
1990 IPP Producer Price Index National
Redesign of the Producer
Price Index by Banco de la
República
1999 IPP Producer Price Index National
Redesign of the Producer
Price Index by DANE
2007 IPP Producer Price Index National
Source:Dane
13
Bogotá D. C., Cundinamarca
2015 13
2. DESIGN OF THE STATISTICAL OPERATION
2.1 METHODOLOGICAL THEMATIC DESIGN
2.1.1 Needs of information
The PPI arises from the need to have an index that reflects the behavior of the prices
of products in the first stage of commercialization within the productive structure of
the country, allowing the detection of inflationary transmission channels and the
follow up of the changes in prices in the economic activities of the country.
2.1.2 Objectives
a. General objective
To provide a measurement of the average monthly change of the prices of a
representative basket of domestically produced goods, including both goods
produced for domestic consumption and goods to be exported.
b. Specific objectives
The index should serve as a deflator of nominal values in the production account
of the Colombian National Accounts (annual and quarterly), of the Annual
Manufacturing Survey, and of the Monthly Manufacturing Survey, among others.
To build an index on the change over time of the prices of domestically produced
goods.
To provide index numbers for technical exercises on deflation and indexing of
monetary values related to domestic production.
14
Departamento Administrativo
Nacional de Estadística (DANE) 14
Producer Price Index (IPP)
General Methodology
2.1.3 Scope
At the moment, the research on Producer Price Index is limited to information related
to goods. Services will be included in a next redesign.
With this research DANE provides the users with the information of the price index of
the domestic production which includes goods produced in the country irrespective
of the consumption place. Additionally, the following procedures were undertaken:
the update of the baskets and fixed weights, the inclusion in the calculation of flexible
weights, improvements in the imputation methods, update of classification and use of
CPC ver. 2 A.C and ISIC ver. 4 A.C and the indexation of weights.
2.1.4 Reference framework
a. Theoretical framework
In general terms, the PPI of Colombia is defined as an index that measures the
average change in the prices of a representative basket of domestically produced
goods in the first stage of commercialization.
This index is part of a set of tools for the short term analysis; its main purpose is to
detect inflationary transmission channels, so as to make possible the study of the
behavior of the prices of products when entering into the commercialization channels.
From the microeconomic theory of the producer, mechanisms were developed
attempting to empirically measure the producer prices of the goods and services
generated by the productive units. Another reason for developing the PPI is the need
to measure subjective and intangible variables of economic nature as is the setting up
of a set of production possibilities.
The PPI is immersed within the microeconomic theory of the producer that supposes
certain considerations on the economic reality. Some of those considerations taken
into account in the model on which the PPI is based will be exposed below: the
economy is closed, that is to say, there is no international trade; durable goods,
capital assets or inventories do not exist either, so that the goods produced in a
15
Bogotá D. C., Cundinamarca
2015 15
certain period are consumed in this period; the technology is defined with non-
increasing yields on scale1; externalities do not exist2; the price is considered to be
formed in the marketplace so that producers and consumers are price takers. Finally,
Government is supposed no to exist, therefore taxes do not exist nor public goods
and national production is equal to the production by the private sector.
In theoretical terms, the producer has a production-possibility frontier that is a set of
quantities that he can obtain given a production technology and some inputs, so that
given the prices which the producer faces, and the existing technology and inputs, the
producer can produce a combination of quantities of goods that generate the
maximum benefit for him.
From these theoretical considerations, the inflation from the supply side may be
measured assuming that the producer is a profit maximizer subject to a technological
restriction.
Economic approach to the PPI
The IMF Manual on PPI3, in its section on the economic approach to the PPI (Chapter
17), presents the theoretical mathematical development from which the index is
derived and that is summarized as follows:
Taking into account the inputs, the prices, the technology and the combination of the
quantities to be produced, it is possible to obtain the function of the revenue that the
1 This definition refers to the change in production as a result of a proportional change in all the inputs. If
the production increases in the same proportion as the inputs, there are constant yields of scale; if the
production increases in a proportion lower than the proportion of increase of the inputs there are
decreasing yields of scale and finally if the production increases more than the proportion mentioned
there are increasing yields of scale.
2 An externality appears when the cost or the profit derived from the production of a good or a service
are not reflected in the market price of this product or service. Therefore, this activity may have an
influence on others (positively or negatively), without paying for it (if the externality is positive) or being
paid for (if the externality is negative).
3 Producer Price Index Manual, theory and practice. IMF (2010). Washington D. C.
16
Departamento Administrativo
Nacional de Estadística (DANE) 16
Producer Price Index (IPP)
General Methodology
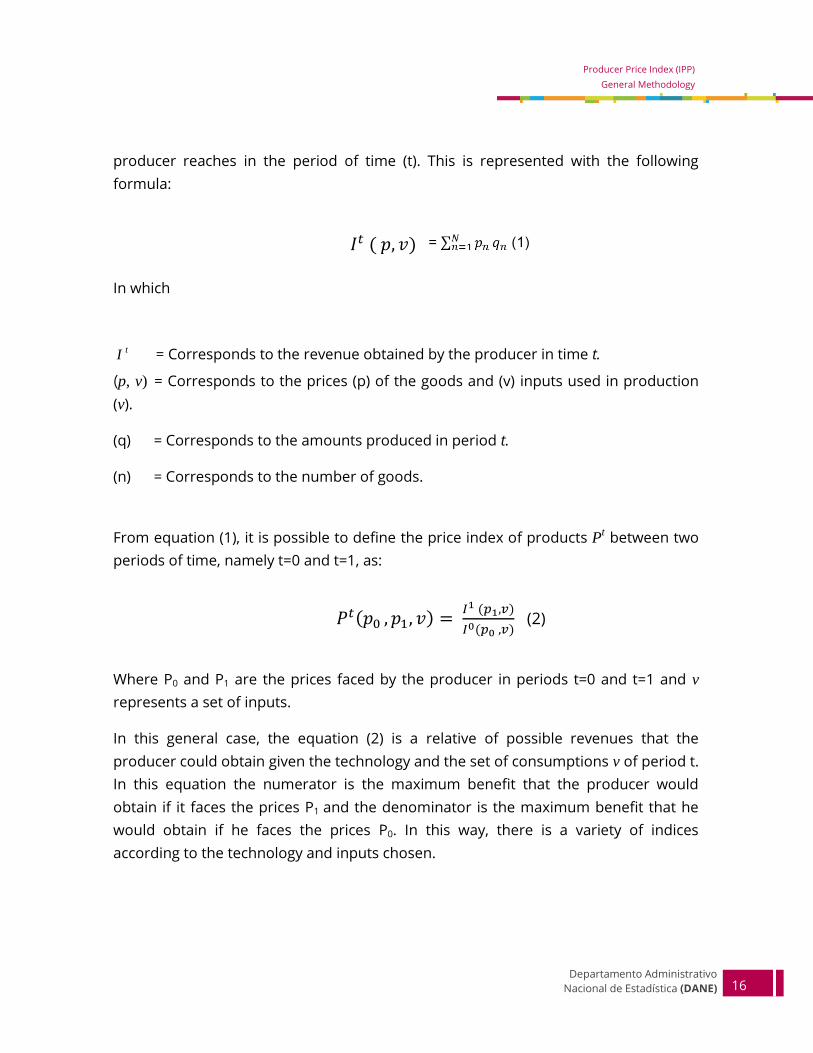
producer reaches in the period of time (t). This is represented with the following
formula:
𝐼𝑡 ( 𝑝, 𝑣)
In which
I t = Corresponds to the revenue obtained by the producer in time t.
(p, v) = Corresponds to the prices (p) of the goods and (v) inputs used in production
(v).
(q) = Corresponds to the amounts produced in period t.
(n) = Corresponds to the number of goods.
From equation (1), it is possible to define the price index of products Pt between two
periods of time, namely t=0 and t=1, as:
𝑃𝑡(𝑝0 , 𝑝1, 𝑣) = 𝐼1 (𝑝1,𝑣)
𝐼0(𝑝0 ,𝑣) (2)
Where P0 and P1 are the prices faced by the producer in periods t=0 and t=1 and v
represents a set of inputs.
In this general case, the equation (2) is a relative of possible revenues that the
producer could obtain given the technology and the set of consumptions v of period t.
In this equation the numerator is the maximum benefit that the producer would
obtain if it faces the prices P1 and the denominator is the maximum benefit that he
would obtain if he faces the prices P0. In this way, there is a variety of indices
according to the technology and inputs chosen.
17
Bogotá D. C., Cundinamarca
2015 17
Assuming that the establishment only produces a good (N=1), it is possible to
demonstrate that the price index of products converges to the ratio of the prices of
the unique product between both periods p11
p10.
Within the great variety of possible indices given in the equation (2), there are two
special cases that give as result two theoretical indices of great relevance for the
theory of indices:
a. A product price index that uses the technology of the base period, the inputs of
the base period may be described as: 𝐼𝑛𝑑ex 0 (𝑝0, 𝑝1, 𝜈0).
b. A product price index that uses de technology of period 1 (subsequent to the
base period) and the inputs of period 1may be described as : 𝐼𝑛𝑑ex 1 (𝑝0, 𝑝1, 𝜈1).
In practical terms, it is possible to get an approximation of these theoretical indices
from the Laspeyres and Paasche indices. The Laspeyres index is the theoretical lower
limit of the price index of products determined in literal (a) and the Paasche index is
the theoretical upper limit of the price index of products determined in literal (b).
The calculation of the PPI is based on an index of fixed weights of a Laspeyres type
that is obtained from:
𝐿𝑎𝑠𝑝𝑒𝑦𝑟𝑒𝑠 𝑝𝑟𝑖𝑐𝑒 𝑖𝑛𝑑𝑒𝑥 = ∑ 𝑝1𝑞0
∑ 𝑝0𝑞0
where fixed amounts are taken both for the current period and the base period (q0)
and the prices correspond to the base period (p0) and to the current or later period,
(p1). This expression shows the relative change in the value of production of a basket
of goods between two periods of time, keeping the amounts produced in the base
period (q0) constant. These amounts reflect the productive structure of the country in
the period of reference.
Despite the previous assertion, a modified Laspeyres formula is used. In this type of
index, the price of the current period is compared directly with the price of the
previous period and indirectly with the price of the base period to which the weights
(quantities) correspond.
18
Departamento Administrativo
Nacional de Estadística (DANE) 18
Producer Price Index (IPP)
General Methodology
Some of the drawbacks of the traditional Laspeyres index are:
In the economies that present very rapid changes the traditional Laspeyres index
does not allow to reflect them.
The traditional Laspeyres index compares relative prices of the current period
with prices of the base period, which implies a comparison of changes in the
prices over large periods of time for each item.
It is not possible to find an easy way to compare the relative price of each item in
the current period, with respect to the price of the period of reference, since the
continuity of the specifications of the item is required over large periods of time.
In the long run, the varieties of a product may completely disappear and there
might not exist representative varieties that replace the old ones; this may lead to
a situation where there is no price in the period of reference to be compared with
that of the base period.
The following are some advantages of the modified Laspeyres index:
For temporarily lost prices, imputed prices are used based on the change in
the total price of the product group under study, it is possible that short term
imputations be more reasonable than long term imputations.
The use of the relative price with respect to the previous period is a solution
for the new varieties that may be introduced as soon as two successive quotes
of prices are available.
19
Bogotá D. C., Cundinamarca
2015 19
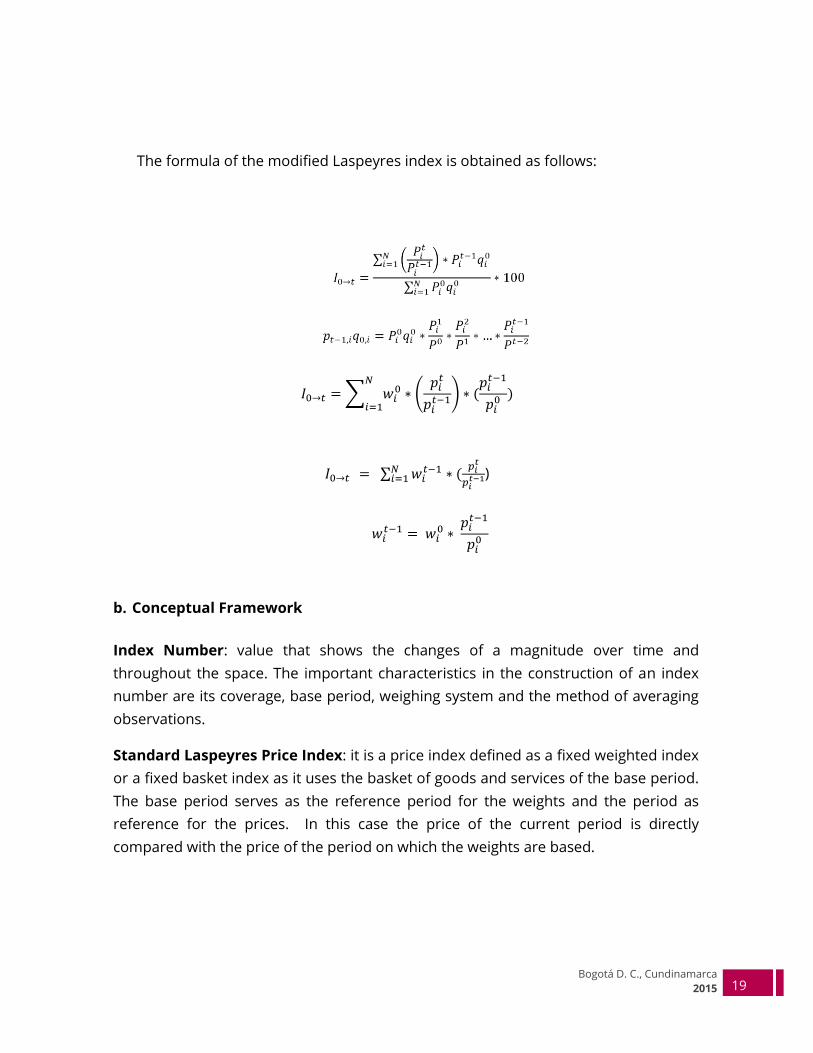
The formula of the modified Laspeyres index is obtained as follows:
𝐼0→𝑡 = ∑ 𝑤𝑖0
𝑁
𝑖=1∗ (
𝑝𝑖𝑡
𝑝𝑖𝑡−1) ∗ (
𝑝𝑖𝑡−1
𝑝𝑖0 )
𝐼0→𝑡 = ∑ 𝑤𝑖𝑡−1𝑁
𝑖=1 ∗ (𝑝𝑖
𝑡
𝑝𝑖𝑡−1)
𝑤𝑖𝑡−1 = 𝑤𝑖
0 ∗ 𝑝𝑖
𝑡−1
𝑝𝑖0
b. Conceptual Framework
Index Number: value that shows the changes of a magnitude over time and
throughout the space. The important characteristics in the construction of an index
number are its coverage, base period, weighing system and the method of averaging
observations.
Standard Laspeyres Price Index: it is a price index defined as a fixed weighted index
or a fixed basket index as it uses the basket of goods and services of the base period.
The base period serves as the reference period for the weights and the period as
reference for the prices. In this case the price of the current period is directly
compared with the price of the period on which the weights are based.
20
Departamento Administrativo
Nacional de Estadística (DANE) 20
Producer Price Index (IPP)
General Methodology
Modified Laspeyres Price Index: in this type of index, the price in the current period
is compared directly with the price in the previous period and indirectly with the price
in the period on which the weights are based.
c. Legal Framework
Decree 3167 of 1968, states explicitly that among other functions DANE must
“Establish price indexes at the level of producers, of distributors and of consumers, for the
main goods and services, to elaborate them and periodically publish the summary of the
obtained results”. (Chapter I, article 2, paragraph J)
d. International references
The international context of this research is defined by the international references
that guarantee and allow the comparability between the different countries
implementing PPI measurements. In the PPI redesign the following references were
taken into account:
International Monetary Fund (IMF)
Organization for Economic Cooperation and Development (OECD).
Recommendations of the Statistical Agency of Canada (STATCAN) through a
technical assistance mission.
“The International Monetary Fund (IMF) promotes the international financial stability
and monetary cooperation. It also seeks to facilitate international trade, to promote
high employment and sustainable economic growth, and to reduce poverty around the
world”4.
4 Information taken from: https://www.imf.org/external/np/exr/facts/spa/glances.htm
21
Bogotá D. C., Cundinamarca
2015 21
The document Producer Price Index Manual: Theory and Practice presents general
recommendations for the elaboration and calculation of the PPI including:
The international classifications to be used.
The methodology and the procedures of calculation.
The characteristics of prices to be collected.
The treatment of quality changes.
The substitution of items and the treatment of new products.
The parameters of publication and dissemination.
On the other hand, the document Producer Price Indices - Comparative Methodological
Analysis, presents a methodological comparison of the OECD countries regarding the
problems that arise in the context of international comparisons of PPI concerning
scope and coverage (type of prices been collected, classifications used, treatment of
exports and weighing system). Additionally, it examines the basic data and their
methods of collection (weighing and their sources, sampling methods), as well as the
problems of compilation.
The Data Quality Assessment Framework (DQAF) of the Producer Price Index (IMF) was
used as the base to guarantee the fulfillment of the international requirements
associated with the quality and opportunity of this indicator and the application of the
good practices in all the processes of this research.
Finally, the international technical assistance represented a mechanism to support
the institutional work. The experiences of other countries in each processes of
construction of the PPI, contributed in deepening more on the difficulties and in
finding possible mechanisms to overcome them.
22
Departamento Administrativo
Nacional de Estadística (DANE) 22
Producer Price Index (IPP)
General Methodology
e. National References
The national references that support this research are: the methodology of the
Consumer Price Index, published in August 20135, the methodology of the Producer
Price Index of the Banco de la República published in June 19996 and the Manual of
Good Practices for the Official Statistics published by DANE in 20157.
2.1.5 Design of indicators
a. Basic information for constructing the basket of product
The basket of product for the follow up of prices in the national market were obtained
from the following sources: the Annual Manufacturing Survey (EAM), the National
Accounts (NA) and the Foreign Trade statistics.
The EAM provided basic information of the industrial sector that help to understand
its structure and evolution. This information was used to select the industrial
products that are characteristic of the productive sectors of the country. The reports
on raw materials and production were used to identify products and the subsectors
for which the follow up is required.
The supply and use tables of the National Accounts were used to determine the
sectors, other than the industrial one, that were relevant in domestic production.
These sectors correspond to: agriculture, fishing, forestry and mining. They were
determined using the ten digit codes of the National Accounts and their
correspondence with the Central Product Classification (CPC).
5 http://www.dane.gov.co/files/investigaciones/fichas/Met_IPC_Ago13_11_14.pdf
6 http://www.banrep.gov.co/es/node/16564
7 http://www.dane.gov.co/files/sen/bp/Codigo_nal_buenas_practicas.pdf

23
Bogotá D. C., Cundinamarca
2015 23
The Foreign Trade statistics were used to identify the imports and exports that were
significant for the national economy. The information was broken down by tariff
subheading and once identified those that represented the most traded products,
their correspondence with the CPC classification was sought in order to guarantee a
unique system of classification.
b. Criteria for the selection of the basket of products
Within the PPI the products to be included in the basket for the follow-up prices, were
selected by applying general and particular criteria. The general criteria used were:
The products must present specific features that make it possible to identify them
throughout the time in a clear) (objective) way.
The products must offer guarantee of permanence in the time.
The products must be produced or commercialized within the national territory by
a legally constituted informant source, in which the commercialized products
make reference to imported and/or exported goods.
The particular criteria correspond to: frequency of production or commercialization;
share in the domestic production or foreign trade, and expectations of growth in the
production or commercialization.
Frequency of production or commercialization
It makes reference to a horizontal analysis of a product or family of product by
subsectors during a given period of time. This analysis verifies the continuity of
their production or commercialization and thus determines the inclusion in the
basket for the follow-up of prices. For the agriculture, forestry, fishing and mining
sectors the information provided by the National Accounts is used.
24
Departamento Administrativo
Nacional de Estadística (DANE) 24
Producer Price Index (IPP)
General Methodology
In the industrial sector the information reported in the EAM is taken with the purpose
of including in the basket those products that are constantly found in a certain time
interval.
Regarding the Foreign Trade statistics, the monthly administrative records are
examined and the frequency of appearance (commercialization) of each of the tariff
subheadings and CPC subclasses within this period is analyzed. Ranks of permanence
in this records are established; on which basis, the inclusion (or exclusion) of the
product in the basket is determined.
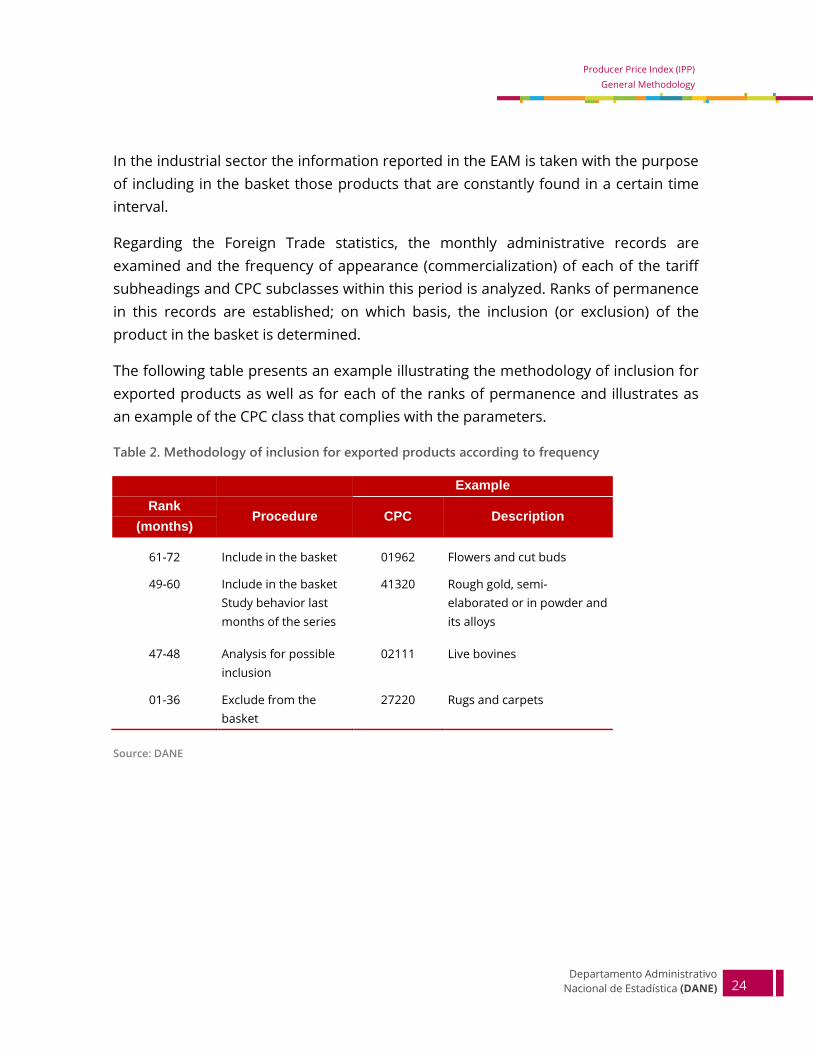
The following table presents an example illustrating the methodology of inclusion for
exported products as well as for each of the ranks of permanence and illustrates as
an example of the CPC class that complies with the parameters.
Table 2. Methodology of inclusion for exported products according to frequency
Example
Rank Procedure CPC Description
(months)
61-72 Include in the basket 01962 Flowers and cut buds
49-60 Include in the basket
Study behavior last
months of the series
41320 Rough gold, semi-
elaborated or in powder and
its alloys
47-48 Analysis for possible
inclusion
02111 Live bovines
01-36 Exclude from the
basket
27220 Rugs and carpets
Source: DANE
25
Bogotá D. C., Cundinamarca
2015 25
Participation in domestic production or foreign trade
This type of analysis of participation by sectors or vertical analysis, tries to
guarantee that the products selected in the basket for the follow-up of prices
significantly represent their respective activities or economic sectors. This type of
analysis aims at complementing the study of the historical behavior of products
and include those that are not produced and commercialized on a frequent base
but have significant transaction values.
In the vertical analysis the products that have been selected for the basket should
represent at least 80% of the value for each subsector:
In the industrial sector, the information of the EAM was used to select the
products that participate with a minimum of 80% of the value of production by
each ISIC class (4 digits).
In the foreign trade sector the minimum target of representativeness was 70%
by ISIC class (4 digits) of all the activities that have participation both in import
and exports, according to the information from Foreign Trade statistics.
Expectations of growth in the production or commercialization
This criterion of selection is used to include within the basket, products that might
not have been selected using the previous criteria. For such purpose, it is
necessary to study the behavior of products by economic sectors that show
expectations of increase in the levels of production and commercialization.
c. Structure of the basket
The basket for the follow-up of prices of the PPI has a matrix structure, where one of
the dimensions corresponds to the different origins of products (produced for
domestic consumption, imported and exported). The other dimension corresponds to
the different sectors that comprise the totality of the productive activity of goods in
the economy of the country (agriculture, cattle farming, forestry, fishing, mining and
26
Departamento Administrativo
Nacional de Estadística (DANE) 26
Producer Price Index (IPP)
General Methodology
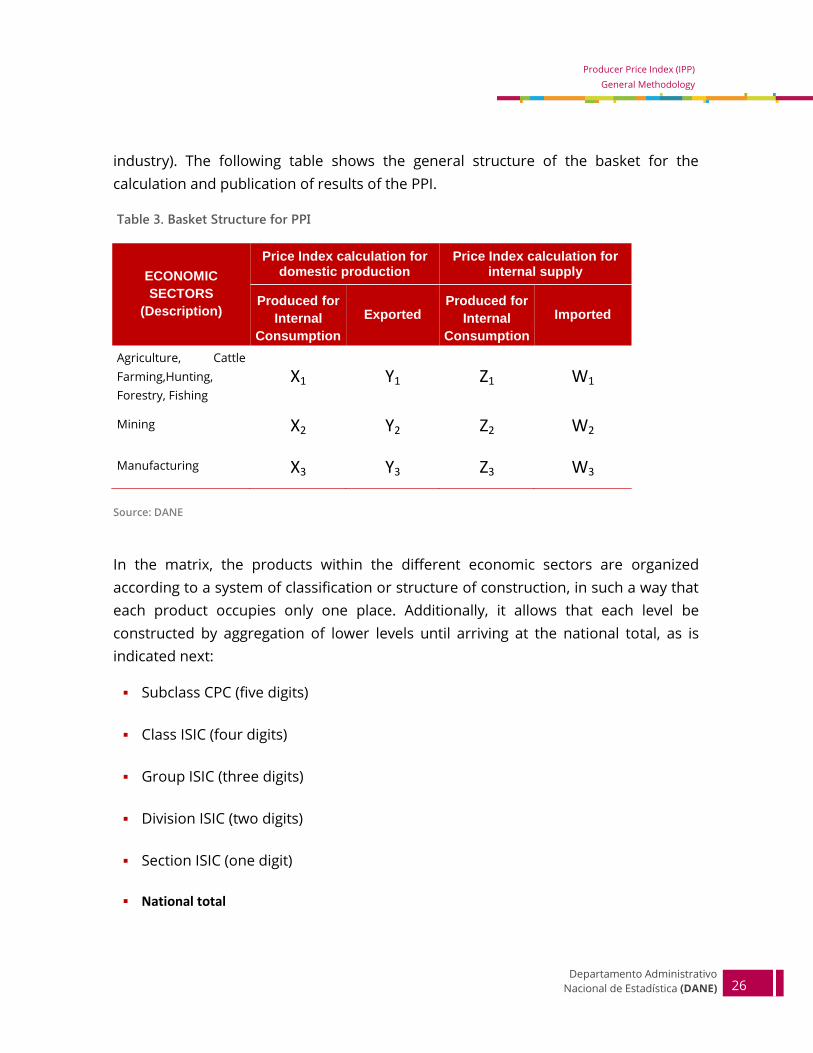
industry). The following table shows the general structure of the basket for the
calculation and publication of results of the PPI.
Table 3. Basket Structure for PPI
ECONOMIC
SECTORS
(Description)
Price Index calculation for domestic production
Price Index calculation for internal supply
Produced for
Internal
Consumption
Exported Produced for
Internal
Consumption
Imported
Agriculture, Cattle
Farming,Hunting,
Forestry, Fishing
X1 Y1 Z1 W1
Mining X2 Y2 Z2 W2
Manufacturing X3 Y3 Z3 W3
Source: DANE
In the matrix, the products within the different economic sectors are organized
according to a system of classification or structure of construction, in such a way that
each product occupies only one place. Additionally, it allows that each level be
constructed by aggregation of lower levels until arriving at the national total, as is
indicated next:
Subclass CPC (five digits)
Class ISIC (four digits)
Group ISIC (three digits)
Division ISIC (two digits)
Section ISIC (one digit)
National total
27
Bogotá D. C., Cundinamarca
2015 27
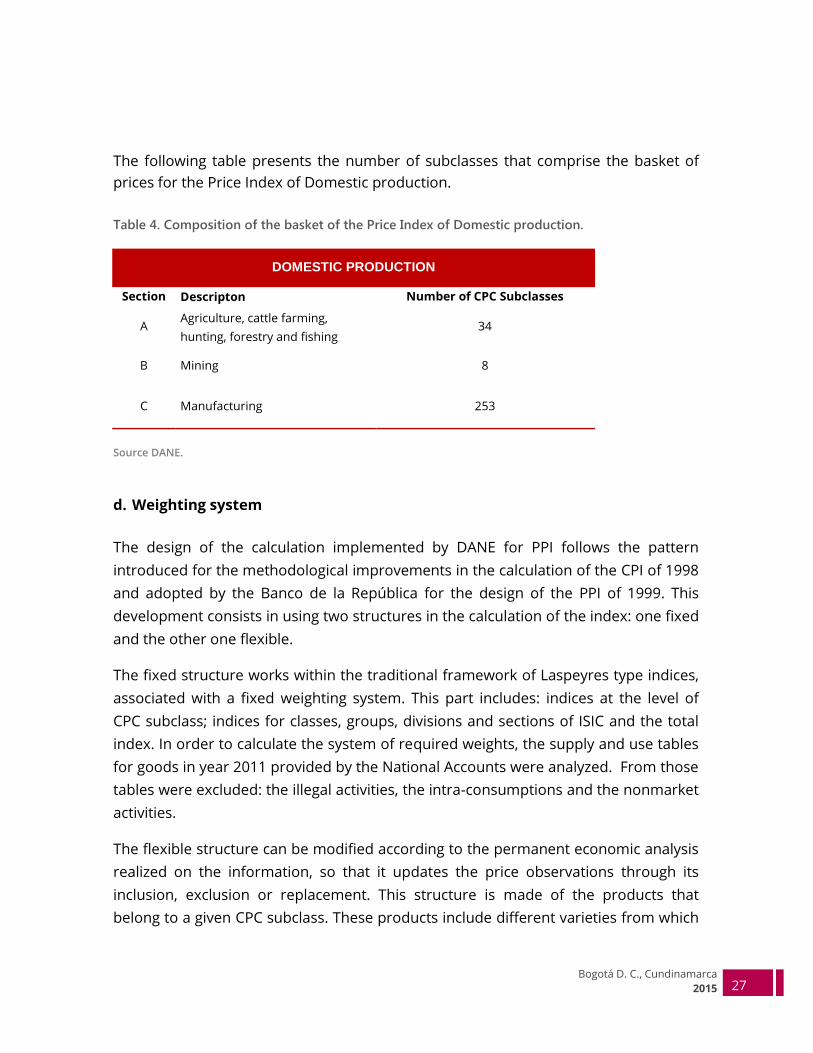
The following table presents the number of subclasses that comprise the basket of
prices for the Price Index of Domestic production.
Table 4. Composition of the basket of the Price Index of Domestic production.
DOMESTIC PRODUCTION
Section Descripton Number of CPC Subclasses
A Agriculture, cattle farming,
hunting, forestry and fishing 34
B Mining 8
C Manufacturing 253
Source DANE.
d. Weighting system
The design of the calculation implemented by DANE for PPI follows the pattern
introduced for the methodological improvements in the calculation of the CPI of 1998
and adopted by the Banco de la República for the design of the PPI of 1999. This
development consists in using two structures in the calculation of the index: one fixed
and the other one flexible.
The fixed structure works within the traditional framework of Laspeyres type indices,
associated with a fixed weighting system. This part includes: indices at the level of
CPC subclass; indices for classes, groups, divisions and sections of ISIC and the total
index. In order to calculate the system of required weights, the supply and use tables
for goods in year 2011 provided by the National Accounts were analyzed. From those
tables were excluded: the illegal activities, the intra-consumptions and the nonmarket
activities.
The flexible structure can be modified according to the permanent economic analysis
realized on the information, so that it updates the price observations through its
inclusion, exclusion or replacement. This structure is made of the products that
belong to a given CPC subclass. These products include different varieties from which

28
Departamento Administrativo
Nacional de Estadística (DANE) 28
Producer Price Index (IPP)
General Methodology
price observations are obtained, so that it reduces the measurement biases that are
naturally introduced when a fixed basket is used and long periods of time are taken
before updating.
Flexible weights are applied at the level of articles -lower than that of CPC subclass-.
These weights vary overtime due to the change in the dynamics of the sectors
associated with the PPI that is reflected in the changes of information provided by the
primary sources.
Flexible weights for national goods of the industrial sector were obtained from EAM
2012; for the farming goods, forestry and fishing sectors, information was taken from
ENNA 2012 and SIPSA 2013 and finally for the imported and exported goods the
figures were taken from Foreign Trade statistics for 2012.
e. Calculation of the PPI
The calculation of the PPI is performed in two stages. In the first stage the elementary
aggregates are constructed and in the second, the calculation of indices of superior
level is engaged, previous conversion of the foreign currencies into Colombian pesos8.
First stage
Step 1: Conversion of foreign currencies into Colombian pesos
When the sources report prices in a currency different from the official one, the
monthly average of the currency is used for the conversion of the value into pesos.
This information is published by the Banco de la República and it is constructed taking
only the work days of the month.
The procedure of calculation is explained step by step as follows:
8 The elementary aggregate corresponds to the lowest aggregation level in which the prices are
combined.
29
Bogotá D. C., Cundinamarca
2015 29
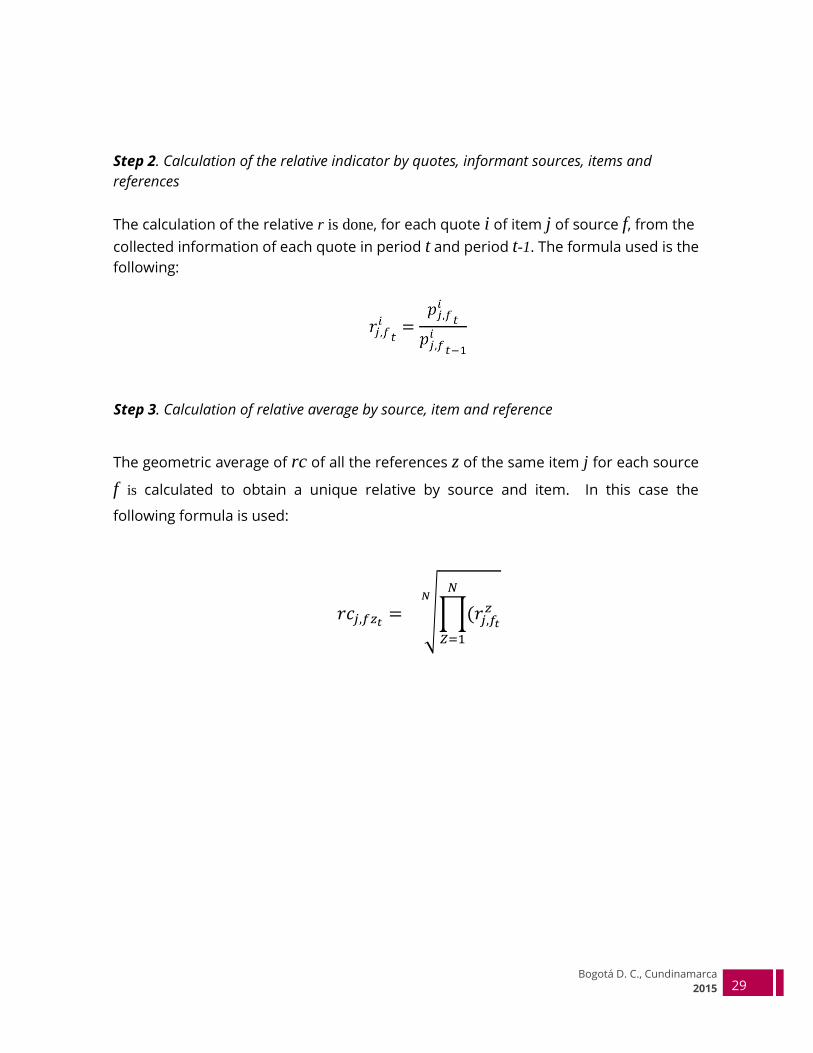
Step 2. Calculation of the relative indicator by quotes, informant sources, items and
references
The calculation of the relative r is done, for each quote i of item j
of source f, from the
collected information of each quote in period t and period t-1. The formula used is the
following:
Step 3. Calculation of relative average by source, item and reference
The geometric average of rc of all the references z of the same item j for each source
f is calculated to obtain a unique relative by source and item. In this case the
following formula is used:
𝑟𝑐𝑗,𝑓𝑧𝑡= √∏(𝑟𝑗,𝑓𝑡
𝑧
𝑁
𝑍=1
𝑁
30
Departamento Administrativo
Nacional de Estadística (DANE) 30
Producer Price Index (IPP)
General Methodology
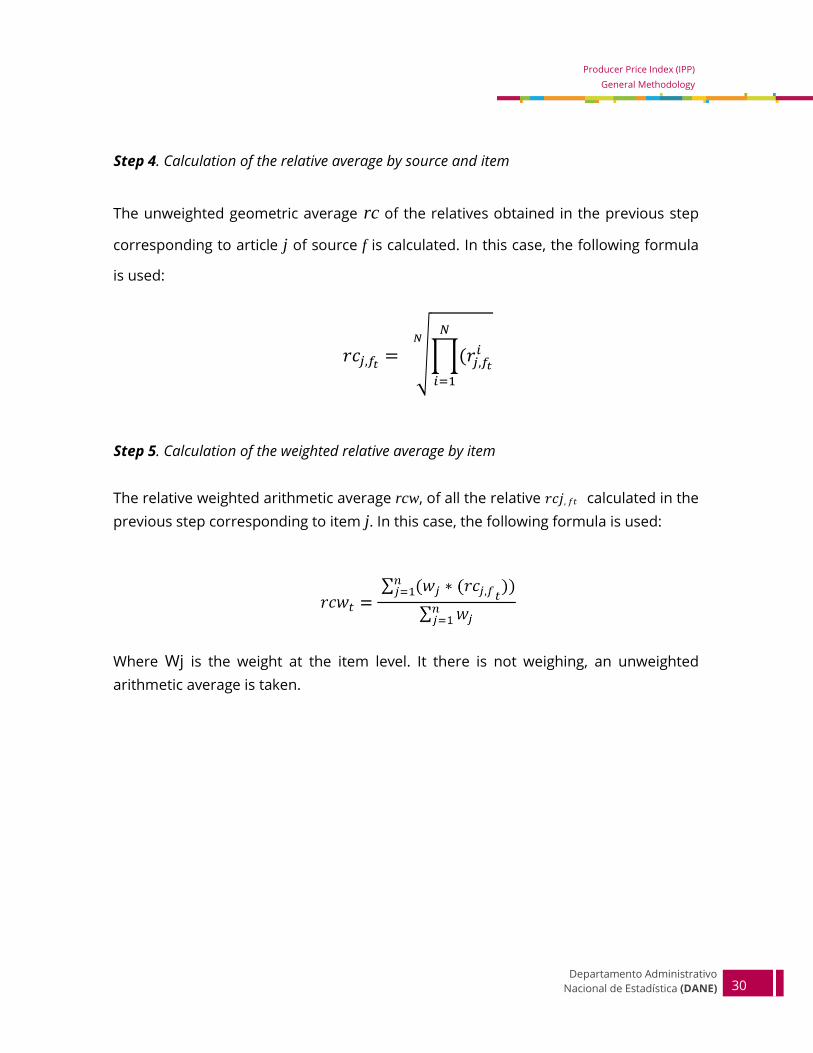
Step 4. Calculation of the relative average by source and item
The unweighted geometric average rc of the relatives obtained in the previous step
corresponding to article j of source f is calculated. In this case, the following formula
is used:
𝑟𝑐𝑗,𝑓𝑡= √∏(𝑟𝑗,𝑓𝑡
𝑖
𝑁
𝑖=1
𝑁
Step 5. Calculation of the weighted relative average by item
The relative weighted arithmetic average rcw, of all the relative 𝑟𝑐𝑗, 𝑓𝑡 calculated in the
previous step corresponding to item j. In this case, the following formula is used:
Where Wj is the weight at the item level. It there is not weighing, an unweighted
arithmetic average is taken.
31
Bogotá D. C., Cundinamarca
2015 31
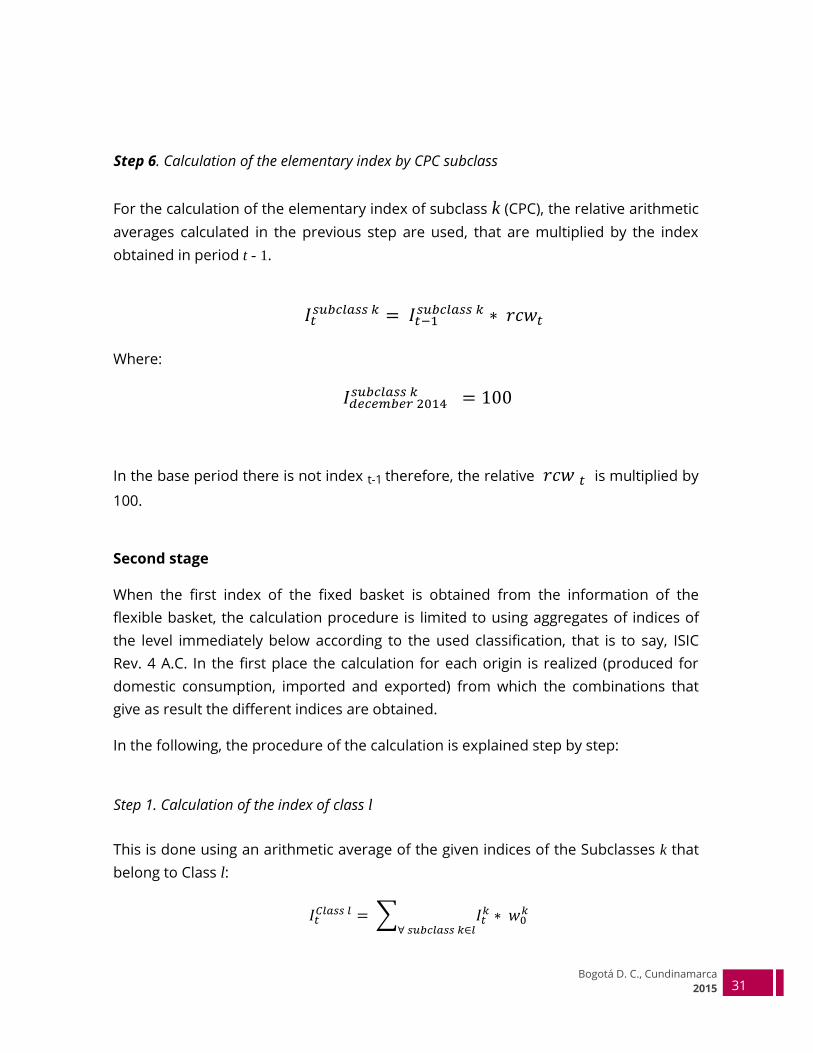
Step 6. Calculation of the elementary index by CPC subclass
For the calculation of the elementary index of subclass k (CPC), the relative arithmetic
averages calculated in the previous step are used, that are multiplied by the index
obtained in period t - 1.
𝐼𝑡𝑠𝑢𝑏𝑐𝑙𝑎𝑠𝑠 𝑘 = 𝐼𝑡−1
𝑠𝑢𝑏𝑐𝑙𝑎𝑠𝑠 𝑘 ∗ 𝑟𝑐𝑤𝑡
Where:
𝐼𝑑𝑒𝑐𝑒𝑚𝑏𝑒𝑟 2014 𝑠𝑢𝑏𝑐𝑙𝑎𝑠𝑠 𝑘 = 100
In the base period there is not index t-1 therefore, the relative 𝑟𝑐𝑤 𝑡 is multiplied by
100.
Second stage
When the first index of the fixed basket is obtained from the information of the
flexible basket, the calculation procedure is limited to using aggregates of indices of
the level immediately below according to the used classification, that is to say, ISIC
Rev. 4 A.C. In the first place the calculation for each origin is realized (produced for
domestic consumption, imported and exported) from which the combinations that
give as result the different indices are obtained.
In the following, the procedure of the calculation is explained step by step:
Step 1. Calculation of the index of class l
This is done using an arithmetic average of the given indices of the Subclasses k that
belong to Class l:
𝐼𝑡𝐶𝑙𝑎𝑠𝑠 𝑙 = ∑ 𝐼𝑡
𝑘
∀ 𝑠𝑢𝑏𝑐𝑙𝑎𝑠𝑠 𝑘∈𝑙∗ 𝑤0
𝑘
32
Departamento Administrativo
Nacional de Estadística (DANE) 32
Producer Price Index (IPP)
General Methodology
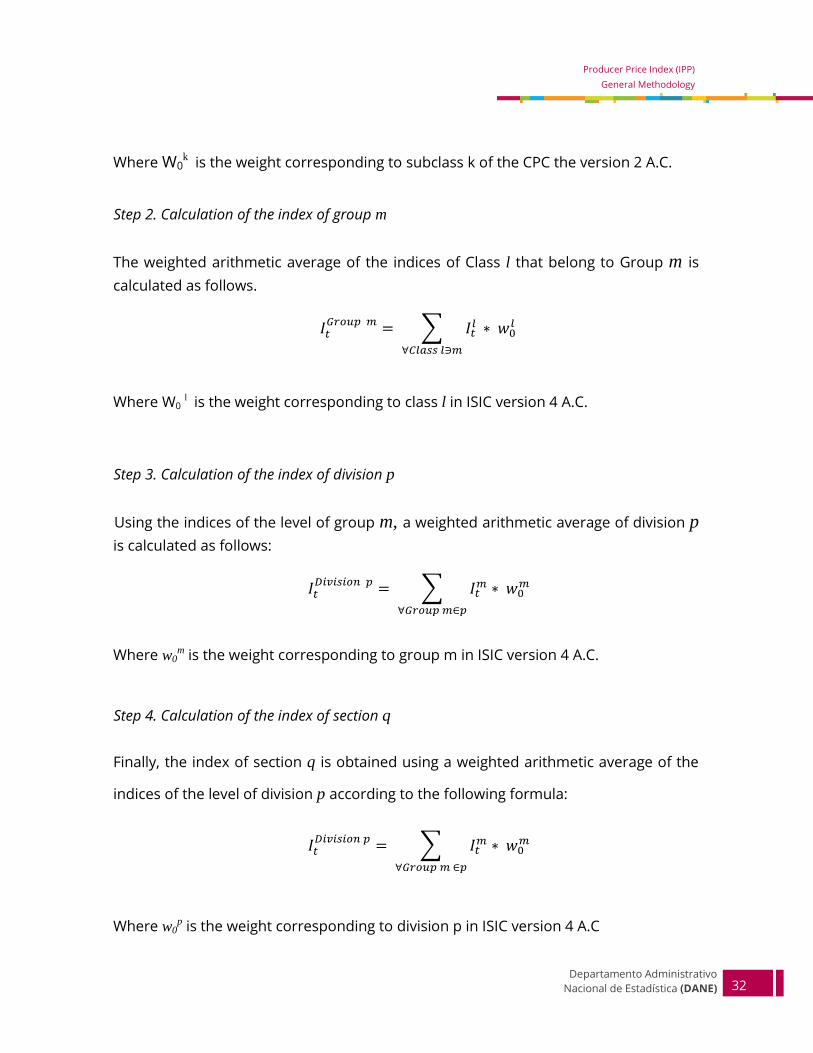
Where W0k is the weight corresponding to subclass k of the CPC the version 2 A.C.
Step 2. Calculation of the index of group m
The weighted arithmetic average of the indices of Class l that belong to Group m is
calculated as follows.
𝐼𝑡𝐺𝑟𝑜𝑢𝑝 𝑚 = ∑ 𝐼𝑡
𝑙
∀𝐶𝑙𝑎𝑠𝑠 𝑙∋𝑚
∗ 𝑤0𝑙
Where W0 l is the weight corresponding to class l in ISIC version 4 A.C.
Step 3. Calculation of the index of division p
Using the indices of the level of group m, a weighted arithmetic average of division p
is calculated as follows:
𝐼𝑡𝐷𝑖𝑣𝑖𝑠𝑖𝑜𝑛 𝑝 = ∑ 𝐼𝑡
𝑚
∀𝐺𝑟𝑜𝑢𝑝 𝑚∈𝑝
∗ 𝑤0𝑚
Where w0m is the weight corresponding to group m in ISIC version 4 A.C.
Step 4. Calculation of the index of section q
Finally, the index of section q is obtained using a weighted arithmetic average of the
indices of the level of division p according to the following formula:
𝐼𝑡𝐷𝑖𝑣𝑖𝑠𝑖𝑜𝑛 𝑝 = ∑ 𝐼𝑡
𝑚
∀𝐺𝑟𝑜𝑢𝑝 𝑚 ∈𝑝
∗ 𝑤0𝑚
Where w0p is the weight corresponding to division p in ISIC version 4 A.C
33
Bogotá D. C., Cundinamarca
2015 33
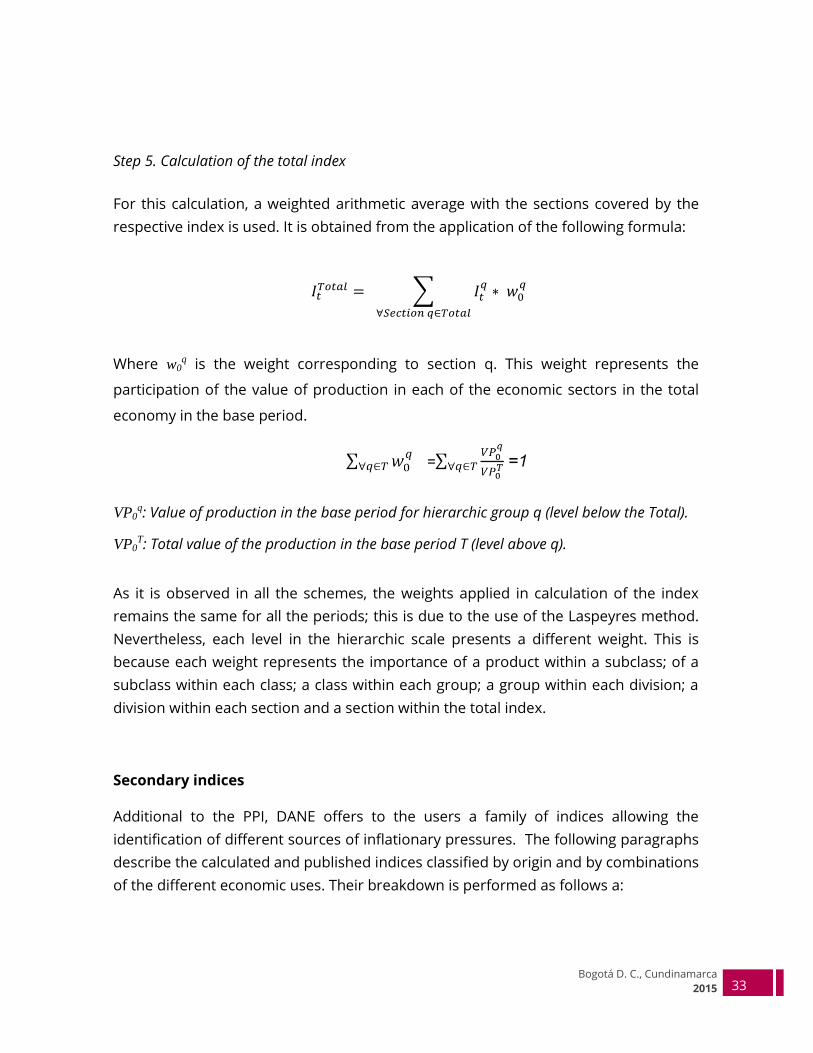
Step 5. Calculation of the total index
For this calculation, a weighted arithmetic average with the sections covered by the
respective index is used. It is obtained from the application of the following formula:
𝐼𝑡𝑇𝑜𝑡𝑎𝑙 = ∑ 𝐼𝑡
𝑞
∀𝑆𝑒𝑐𝑡𝑖𝑜𝑛 𝑞∈𝑇𝑜𝑡𝑎𝑙
∗ 𝑤0𝑞
Where w0q is the weight corresponding to section q. This weight represents the
participation of the value of production in each of the economic sectors in the total
economy in the base period.
VP0q: Value of production in the base period for hierarchic group q (level below the Total).
VP0T: Total value of the production in the base period T (level above q).
As it is observed in all the schemes, the weights applied in calculation of the index
remains the same for all the periods; this is due to the use of the Laspeyres method.
Nevertheless, each level in the hierarchic scale presents a different weight. This is
because each weight represents the importance of a product within a subclass; of a
subclass within each class; a class within each group; a group within each division; a
division within each section and a section within the total index.
Secondary indices
Additional to the PPI, DANE offers to the users a family of indices allowing the
identification of different sources of inflationary pressures. The following paragraphs
describe the calculated and published indices classified by origin and by combinations
of the different economic uses. Their breakdown is performed as follows a:

34
Departamento Administrativo
Nacional de Estadística (DANE) 34
Producer Price Index (IPP)
General Methodology
Domestic Supply Price Index:
OI = PyC + M
OI = CI + CF + BK + MC
Where:
PyC= Goods produced for domestic consumption
M= Imported Goods
CI= Intermediate Consumption Goods from internal supply
CF= Final Consumption Goods from internal supply
BK= Goods for capital formation from internal supply
MC= Construction Materials from internal supply
Price index of goods produced for domestic consumption:
PyC = CI + CF + BK + MC
Where:
PyC= Goods produced for domestic consumption
CI= Intermediate Consumption Goods produced for domestic consumption
CF=Final Consumption Goods produced for domestic consumption
BK=Capital Formation Goods produced for domestic consumption
MC=Construction Materials produced for domestic consumption
35
Bogotá D. C., Cundinamarca
2015 35
Price index of imported goods:
M = CI + CF + BK + MC
Where:
M=Imported goods
CI= Imported intermediate consumption goods
CF= Imported final consumption goods
BK= Imported capital formation goods
MC=Imported construction materials
Price index of exported goods:
X = Exported Goods
The exported goods are not classified according to use or economic purpose
(CUODE). As they are used abroad its use or economic purpose is not known.
Price index of domestically consumed final goods:
BFOI = BKPYC + CFPYC + MCPYC + BKM + CFM + MCM
Where:
BFOI= Domestically consumed final goods
36
Departamento Administrativo
Nacional de Estadística (DANE) 36
Producer Price Index (IPP)
General Methodology
BKPYC= Domestically produced Capital goods
CFPYC= Domestically produced Final Consumption goods
MCPYC= Domestically produced Construction materials
BKM=Imported capital goods
CFM=Imported final consumption goods
MCM=Imported construction materials
Price index of domestically produced final goods for domestic consumption:
This index is one element of final demand.
BFPYC = BKPYC + CFPYC + MCPYC
Where:
BFPYC= Domestically produced final goods
BKPYC= Domestically produced Capital goods
CFPYC= Domestically produced Final consumption goods
MCPYC= Domestically produced Construction Materials
Price index of imported final goods:
BFM = BKM + CFM + MCM
Where:
BFM= Imported final goods
37
Bogotá D. C., Cundinamarca
2015 37
BKM= Imported capital goods
CFM= Imported final consumption goods
MCM=Imported construction materials
All the final goods exclude intermediate consumption goods.
Price index of final demand:
DF = BFPYC + X
DF = BKPYC+ CFPYC + MCPYC + X
Where:
BKPYC= Capital goods produced for domestic consumption
CFPYC= Final Consumption goods produced for domestic consumption
MCPYC=Construction Materials produced for domestic consumption
X=Exports
38
Departamento Administrativo
Nacional de Estadística (DANE) 38
Producer Price Index (IPP)
General Methodology
Price index according to use or economic purpose - CUODE
Price index of intermediate consumption goods
CI = CIPYC + CIM
Where:
CIPYC = Domestically produced Intermediate Consumption goods
CIM = Imported Intermediate Consumption goods
Price index of final consumer goods (CF)
CF = CFPYC + CFM
Where:
CFPYC = Domestically produced Final Consumption goods for Domestic
consumption
CFM = Imported Final Consumption goods
Price index of the capital assets (BK)
BK = BKPYC + BKM
Where:
BKPYC = Domestically produced capital goods for domestic consumption
BKM = Imported capital goods

39
Bogotá D. C., Cundinamarca
2015 39
Price index of construction materials (MC)
MC = MCPYC + MCM
Where:
MCPYC = Domestically produced Construction materials for Domestic
consumption
MCM = Imported Construction materials
f. Published indicators
Index
It is the variable that shows the changes in value of a basket of goods through
time, taking a base period t0 and maintaining constant the quality and the quantity
of the goods.
Base period of the index (t0) = December 2014 Base value of the index =100.
Chained Index
It is a series of index numbers for an aggregate corresponding to a long period. It
is obtained using the association of index numbers covering shorter periods, each
with its own weighing system. The chain linking may be done according to the
change of weights frequency, as long as the data allow it or in specific intervals
from 5 to 10 periods. Weights may be changed every period; each element of the
chain is an index that compares a period with the previous one.
40
Departamento Administrativo
Nacional de Estadística (DANE) 40
Producer Price Index (IPP)
General Methodology
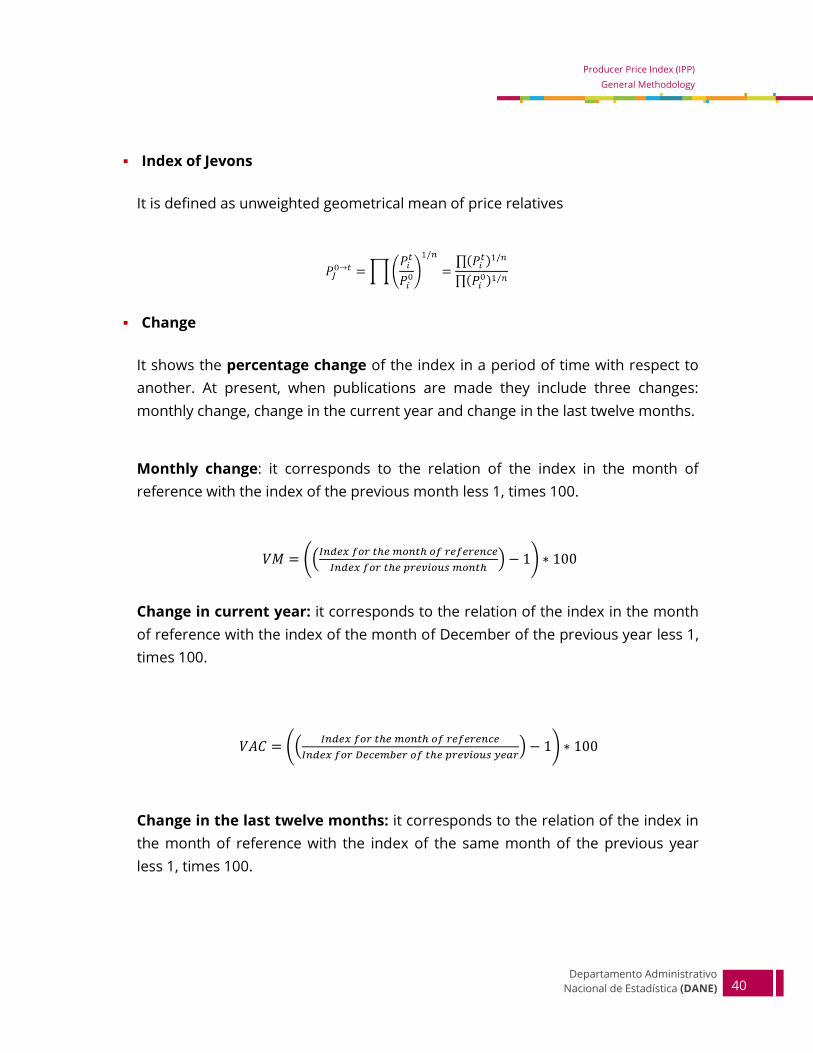
Index of Jevons
It is defined as unweighted geometrical mean of price relatives
Change
It shows the percentage change of the index in a period of time with respect to
another. At present, when publications are made they include three changes:
monthly change, change in the current year and change in the last twelve months.
Monthly change: it corresponds to the relation of the index in the month of
reference with the index of the previous month less 1, times 100.
𝑉𝑀 = ((𝐼𝑛𝑑𝑒𝑥 𝑓𝑜𝑟 𝑡ℎ𝑒 𝑚𝑜𝑛𝑡ℎ 𝑜𝑓 𝑟𝑒𝑓𝑒𝑟𝑒𝑛𝑐𝑒
𝐼𝑛𝑑𝑒𝑥 𝑓𝑜𝑟 𝑡ℎ𝑒 𝑝𝑟𝑒𝑣𝑖𝑜𝑢𝑠 𝑚𝑜𝑛𝑡ℎ) − 1) ∗ 100
Change in current year: it corresponds to the relation of the index in the month
of reference with the index of the month of December of the previous year less 1,
times 100.
𝑉𝐴𝐶 = ((𝐼𝑛𝑑𝑒𝑥 𝑓𝑜𝑟 𝑡ℎ𝑒 𝑚𝑜𝑛𝑡ℎ 𝑜𝑓 𝑟𝑒𝑓𝑒𝑟𝑒𝑛𝑐𝑒
𝐼𝑛𝑑𝑒𝑥 𝑓𝑜𝑟 𝐷𝑒𝑐𝑒𝑚𝑏𝑒𝑟 𝑜𝑓 𝑡ℎ𝑒 𝑝𝑟𝑒𝑣𝑖𝑜𝑢𝑠 𝑦𝑒𝑎𝑟) − 1) ∗ 100
Change in the last twelve months: it corresponds to the relation of the index in
the month of reference with the index of the same month of the previous year
less 1, times 100.
41
Bogotá D. C., Cundinamarca
2015 41
𝑉12𝑀 = ((𝐼𝑛𝑑𝑒𝑥 𝑓𝑜𝑟 𝑡ℎ𝑒 𝑚𝑜𝑛𝑡ℎ 𝑜𝑓 𝑟𝑒𝑓𝑒𝑟𝑒𝑛𝑐𝑒𝑒
𝐼𝑛𝑑𝑒𝑥 𝑓𝑜𝑟 𝑡ℎ𝑒 𝑠𝑎𝑚𝑒 𝑚𝑜𝑛𝑡ℎ 𝑜𝑓 𝑡ℎ𝑒 𝑝𝑟𝑒𝑣𝑖𝑜𝑢𝑠 𝑦𝑒𝑎𝑟) − 1) ∗ 100
Contribution
It allows to measure the contribution in percentage points of each hierarchic level
(subclass, class, group, division, section) to the monthly (current year, or last
twelve months) change of the total index.
Monthly contribution: it measures the contribution in percentage points of each
hierarchic level (section, division, group, class and subclass) to the monthly change
of the total of the index.
𝐶𝑀 = ( 𝐼𝑎 𝑙𝑎𝑠𝑡 𝑚𝑜𝑛𝑡ℎ
𝑇𝑁 𝐼𝑛𝑑𝑒𝑥 𝑙𝑎𝑠𝑡 𝑚𝑜𝑛𝑡ℎ) ∗ 𝑃𝑎 ∗ 𝑉𝑀𝑎 ÷ 100
Contribution in current year: it measures the contribution in percentage points
of each hierarchic level (section, division, group, class and subclass) to the current
year change of the total index.
𝐶𝐴𝐶 = (𝐼𝑎 𝐷𝑒𝑐𝑒𝑚𝑏𝑒𝑟 𝑜𝑓 𝑡ℎ𝑒 𝑝𝑟𝑒𝑣𝑖𝑜𝑢𝑠 𝑦𝑒𝑎𝑟
𝑇𝑁 𝑖𝑛𝑑𝑒𝑥 𝐷𝑒𝑐𝑒𝑚𝑏𝑒𝑟 𝑜𝑓 𝑝𝑟𝑒𝑣𝑖𝑜𝑢𝑠 𝑦𝑒𝑎𝑟 ) ∗ 𝑃𝑎 ∗ 𝑉𝐴𝐶𝑎 ÷ 100
Contribution last twelve months: it measures the contribution in percentage
points of each hierarchic level (section, division, group, class and subclass) to the
twelve months change of the total index.
𝐶12𝑀 = (𝐼𝑎 𝑠𝑎𝑚𝑒 𝑚𝑜𝑛𝑡ℎ 𝑜𝑓 𝑡ℎ𝑒 𝑝𝑟𝑒𝑣𝑖𝑜𝑢𝑠 𝑦𝑒𝑎𝑟
𝑇𝑁 𝐼𝑛𝑑𝑒𝑥 𝑠𝑎𝑚𝑒 𝑚𝑜𝑛𝑡ℎ 𝑜𝑓 𝑡ℎ𝑒 𝑝𝑟𝑒𝑣𝑖𝑜𝑢𝑠 𝑦𝑒𝑎𝑟) ∗ 𝑃𝑎 ∗ 𝑉12𝑀𝑎 ÷ 100
42
Departamento Administrativo
Nacional de Estadística (DANE) 42
Producer Price Index (IPP)
General Methodology
Share
It is the percentage of the contribution of each hierarchic level (section, division,
group, class or subclass) monthly, in current year and in twelve months change of
the total index.
Monthly share: it is the percentage of the contribution of each hierarchic level
(section, division, group, class or subclass) in the monthly change of the total
index.
𝑃𝑀 = (𝐶𝑀 𝑜𝑓 𝑡ℎ𝑒 ℎ𝑖𝑒𝑟𝑎𝑟𝑐ℎ𝑖𝑐𝑎𝑙 𝑙𝑒𝑣𝑒𝑙
𝑇𝑁 𝑚𝑜𝑛𝑡ℎ𝑙𝑦 𝑣𝑎𝑟𝑖𝑎𝑡𝑖𝑜𝑛 ) ∗ 100
Current year share: it is the percentage of the contribution of each hierarchic
level (section, division, group, class or subclass) in the current year change of the
total index.
𝑃𝐴𝐶 = (𝐶𝐴𝐶 𝑜𝑓 𝑡ℎ𝑒 ℎ𝑖𝑒𝑟𝑎𝑟𝑐ℎ𝑖𝑐𝑎𝑙 𝑙𝑒𝑣𝑒𝑙
𝑇𝑁 𝑐𝑢𝑟𝑟𝑒𝑛𝑡 𝑦𝑒𝑎𝑟 𝑣𝑎𝑟𝑖𝑎𝑡𝑖𝑜𝑛 ) ∗ 100
Twelve months share: it is the percentage of the contribution of each hierarchic
level (section, division, group, class or subclass) in the twelve months change of
the total index.
𝑃12𝑀 = (𝐶12𝑀 𝑜𝑓 𝑡ℎ𝑒 ℎ𝑖𝑒𝑟𝑎𝑟𝑐ℎ𝑖𝑐𝑎𝑙 𝑙𝑒𝑣𝑒𝑙
𝑇𝑁 12𝑀 𝑣𝑎𝑟𝑖𝑎𝑡𝑖𝑜𝑛 ) ∗ 100
Where:
a: Hierarchic level
Ia: Index of the hierarchic level
TN: Nacional total
Pa: Weight of the hierarchic level
VMa: Monthly change of the item
VACa: Current year change of the item
43
Bogotá D. C., Cundinamarca
2015 43
V12Ma: Twelve months change of the item
CM: Monthly contribution
CAC: Contribution in current year
C12M: Contribution in twelve months
2.1.6 Plan of results
The results corresponding to the PPI research are published monthly in DANE’s
webpage using a press bulletin, a press release, Annexes and a presentation
where the outstanding results are summarized for the users (external and in-
house).
2.1.6.1 Design of tables of outcomes (results)
The published Annexes of the PPI correspond to a consolidation of the total indices,
changes, contributions and shares (monthly, in current year and twelve months) by
ISIC Rev. 4 A.C section, division, group and class classes and according to CPC version
2 A.C five digits subclasses
The price index presented are:
Domestic production,
Internal supply,
Goods produced for domestic consumption,
Imports,
Exports,
Final goods of domestic supply,
Final goods produced for domestic consumption,

44
Departamento Administrativo
Nacional de Estadística (DANE) 44
Producer Price Index (IPP)
General Methodology
Imported final goods,
Intermediate consumption goods,
Final consumption goods,
Construction materials,
Capital goods
Final demand.
The information is published monthly on the 4th of the month following that of
reference or on the closest working day and previously to the publication of the
CPI.
2.1.6.2 Design of the form (questionnaire)
The questionnaire is an electronic form, previously completed, in which the source
reports the prices of products. Figure 1 below shows the form used by the informant
source via WEB followed by a short description of the sections of this tool.
Figure 1. Collecting Form of the PPI
Source: DANE.
45
Bogotá D. C., Cundinamarca
2015 45
Section 1: It corresponds to the identification data of the source and its geographic
location.
Section 2: It corresponds to the information of the specific products that each source
has to report. In this section the informant source may report the prices of the
product and if necessary, it might update the specifications or include new quotes.
The complete description of the questionnaire is in the Manual for Completing the PPI
form that presents the instructions for the proper reporting of quotes by the sources.
2.1.7 Norms, specifications or editing rules, consistency and imputation
a. Specifications of consistency and editing
The consistency and editing are implemented with the support of set out criteria,
presented in different manuals and according to methodologically established
protocols. There are two reference tables generated monthly, for quotes and for
sources:
E_SOURCE_AAAA_M: This input table contains the identification data of the
informant sources.
D_QUOTE_AAAA_M: This input table contains the information of the monthly
records that will structure the database for the calculation of the index. It is
generated on a monthly basis and it contains the information for the
identification of the product, its previous and present price, its origin and the
currency in which the price was reported.
The editing specifications include the field, the description, the value and the
observation while the consistency specifications presents, besides the previous
elements the rule that must comply the registered information. (See Annex C).
46
Departamento Administrativo
Nacional de Estadística (DANE) 46
Producer Price Index (IPP)
General Methodology
b. Imputation Process
The imputation processes in the PPI research are related to new events that must be
treated before the calculation process, when some existing situation with the source
or with the specific product generates a lack of information. These new events are
applied to the quotes of products with respect to the calculation.
The imputation takes place when there is no price information. This missing price
may be due to specific situations of the product or to specific situations of the source,
which are directly related with the new events mentioned next:
In methodological terms, these situations imply that the products with missing quotes
are temporarily out of production or of commercialization. In these cases, the prices
of products reported by these establishments are imputed with the actual changes
observed for other items belonging to the same CPC subclass.
This imputation procedure might be implemented for a maximum period of six
continuous months. In case of exceeding this time, the informant source is analyzed
by the research staff, which can decide to replace it with related products, either
within new sources or within existing ones in the business register.
New events regarding products: the possible new events regarding products refer to
situations in which the information of quoted prices is missing and a process of
imputation is required: these happen when:
Issue: Period of delay: this issue occurs when the source does not report price
because it is inactive, or it has not been located or “in debt”.
Issue: Seasonality: this issue relates to seasonal factors and the production or
commercialization of the product only happens in certain periods of the year.
In the cases in which new events regarding products occur, the prices are imputed
using the same previously explained methodology of the average changes.

47
Bogotá D. C., Cundinamarca
2015 47
2.1.8 Classifications used
a. Central Product Classification (CPC) Version 2.0 A.C
Until 2006, the PPI used a subclass that was derived from ISIC Rev 3 A.C. as the
maximum level of breakdown for the publication of the index. This subclass was used
in order to generate indices with greater detail for the breakdown of the economic
activities that allowed as well to satisfy the needs of the users.
DANE eager to provide continuity with the information presented by the Banco de la
República, found in the CPC a tool that allowed to show, in a technical way, a
disaggregated index and simultaneously to establish a correspondence with ISIC.
The CPC groups goods that have common characteristics and their categories or
hierarchies are based on the physical properties and the intrinsic nature of products.
This classification maintains close relationship with ISIC which main criterion is
centered on the industrial origin.
In order to establish the direct relationship between both classifications used in this
research, an equivalence table was set up, by which each CPC ver. 1.0 A.C subclass
corresponds to a unique ISIC Rev 3 A.C class.
From the time of redesign of the PPI, the Central Product Classification was updated
to version 2 for Colombia (CPC Ver. 2 A.C.). It is a standard central classification that
includes categories for all the products that can be the object of national or
international transactions or that can be stored. It includes products originated from
an economic activity, including transportable and non-transportable goods. For the
PPI research only transportable goods are taken.
The main changes between the CPC ver. 2.0 A.C and the CPC ver. 1.0 A.C were:
breakdowns, changes in the names and enlargement of the groups, classes and
subclasses. For example: in group 011, “Cereals”, of the version 1.0 A.C, the classes
0116, “Rye” and 0118, “Millet”, with their corresponding subclasses were created.
48
Departamento Administrativo
Nacional de Estadística (DANE) 48
Producer Price Index (IPP)
General Methodology
Finally, the CPC is specifically related to the Harmonized System9 and that guarantees
the international comparability of the classifications used.
b. International Standard Industrial Classification (ISIC) Rev. 4.0 A.C
In order to give continuity to the basic structure of the index published until
December of 2014 and with the purpose of guaranteeing the international
comparability, from the redesign of the PPI, DANE uses ISIC Rev. 4 A.C to classify
economic activities10. This classification also includes a classification of products
according to their main economic activity of origin. Some of the changes that
appeared with respect to the ISIC Rev 3.A.C were the structure of some economic
sectors, as for example the reduction of the first four sections to three, in such a way
that section A includes now Agriculture, cattle farming, hunting, forestry and fishing, B
Operation of mines and quarries and C Manufacturing as shown in Table 1B of Annex B.
c. Classifications according to origin of the goods
This classification makes reference to the origin or destination of the goods followed
up in the indices described in numeral 2.1.5 of this document:
Goods produced for domestic consumption: they correspond to the goods
produced in the country whose destination is to be traded in the internal market.
Imported goods: they correspond to the goods that enter the country to be
consumed or to be transformed.
Exported goods: they correspond to the goods produced for the international
market.
9 The Harmonized System (HS) is a model for the classification of products developed by the World
Customs Organization. Its intention is to create a multi-purpose standard for the classification of the
goods traded worldwide.
10 DANE (2012). Clasificación Industrial Internacional Uniforme de todas las Actividades Económicas, Rev.
4.A.C. Bogotá
49
Bogotá D. C., Cundinamarca
2015 49
d. Classification according to use or economic purpose (CUODE)
It is a classification that identifies the goods according to the use or economic
purpose. This classification allows to carry out different types of economic analyses.
The economic purpose for the PPI are goods for: final consumption, intermediate
consumption, capital formation (BK) and construction materials (MC).
2.2 STATISTICAL DESIGN
2.2.1 Basic components of the statistical design
a. Universe
The universe of study of the PPI corresponds to all the producing and commercial
establishments dedicated to agriculture, cattle farming, hunting, forestry, fishing,
operation of mines and industrial activities, located within the national territory.
The ideal source of primary information for the activities of agriculture, cattle farming
and fishing are the farms and the centers of production, however, given the
conditions of logistics and opportunity informant source being used is the
Information System of Prices of the Agricultural Sector (SIPSA) for those products of
domestic consumption.
b. Objective population
It includes all the establishments that produce or commercialize products that
included in the basket of product which prices serve for elaborating an index in the
different economic sectors.
c. Statistical framework
The sampling framework is provided by the register of establishments specialized in
the production and commercialization of transportable goods. For the goods
produced for domestic consumption information is taken from the Annual
50
Departamento Administrativo
Nacional de Estadística (DANE) 50
Producer Price Index (IPP)
General Methodology
Manufacturing Survey for the industrial sector and from the registers of National
Accounts for the other sectors. Additionally information from wholesale market-
places of the country was taken trough through SIPSA (Information System of Prices
for the Agricultural Sector).
For the imported and exported goods, registers from the foreign trade statistics were
used.
d. Included Variables
Classification variables:
According to Economic Activity: by Section, Division, Group
and Class of ISIC rev4 A.C
According to Products: Subclasses of CPC ver 2 AC.
Variable of Analysis:
Prices of goods.
Calculated variable:
Laspeyres type Indices. Geometric average of relative prices and Weighted Arithmetic
Average in the different levels of aggregation.
e. Sources of data
The PPI is a non-probabilistic type of research. The informant sources are selected
according to the products included in the basket of the index, their possibility of
reporting the information and the continuity in the production or commercialization
of these products.
51
Bogotá D. C., Cundinamarca
2015 51
f. Geographic coverage
The PPI has a national coverage, broken down by economic activity, origin or
destination according to the international classifications used. The information is
collected from the following cities: Cartagena, Villavicencio, Valledupar, Santa Marta,
Cali, Ibagué, Barranquilla, Bucaramanga, Pasto, Armenia, Montería, Neiva, Popayán,
Bogotá, Manizales, Tunja, Medellín, Cúcuta and Pereira.
g. Geographic breakdown
The results are consolidated at the national level.
h. Thematic breakdown
The information is disseminated as indices, changes and shares for the national total:
according to economic activity (Section, Division, Group and Class) and products
(Subclass).
i. Basic price
It is defined as the value of the product at the time of the first transaction (change of
property). This price includes the discounts and other incentives of general character
offered to all the buyers. Should be excluded: the consumption taxes and VAT; the
transportation expenses and the trade margins. This value is taken according to the
origin of the goods as recorded by the informant source. The prices corresponding to
the different origins are described as follows:
Domestically produced goods for domestic consumption: the sale price in factory (ex-
factory) excluding indirect taxes (VAT, consumption). For the agricultural sector the
monthly average of the prices from SIPSA is taken.
52
Departamento Administrativo
Nacional de Estadística (DANE) 52
Producer Price Index (IPP)
General Methodology
Imported origin: two different prices are taken depending on the use of the product
(raw material or finished product):
Raw material: CIF (Cost, Insurance, Freight).
Finished product: sale price (Ex-factory) without taxes, transport charges, in the
currency used for transaction.
Exports: FOB (Free On Board). This price does not include: the freight and the
insurances for the transport from the border of the origin of the product to the
destination place, that is, it corresponds to the price in the customs border of the
exporter.
2.2.2 Statistical units
a. Unit of observation
It corresponds to the producing and trade establishments, related to the domestic
and foreign trade of the country selling their products in the first stage of
commercialization within the productive structure of the country.
b. Unit of analysis
The items included in the basket for the follow-up of the prices of the index, even
though the publication requires the aggregation in the construction of the first fixed
level (CPC subclass).
c. Unit of sampling
They are the producing or commercial establishments.
53
Bogotá D. C., Cundinamarca
2015 53
2.2.3 Periods of reference and collection of information
a. Period of reference
The research has a monthly periodicity, therefore the period of reference is the
month in which the prices are collected.
b. Period of collection of the information
The collection of the information is done from the 15th to the 28th day of every month.
Due to the volatility of the agricultural prices and commodities, a monthly average of
the prices is taken for the month of reference. The prices reported for manufactured
goods correspond to the actual one in the 15th day of every month.
2.2.4 Sample Design
The sample design of the PPI is non-probabilistic. However, the sampling staff
realizes, every month, an analysis of the changes of prices defining the minimum
number of sources needed for each product included in the follow up.
For domestic production, the sample of industry sources is done with the criterion of
a minimum participation of 80% of the value of production. The sources of the
agriculture, forestry and fishing sector were obtained directly from SIPSA, whereas
the foreign trade sources are selected with the criterion of a minimum participation
of 80% of the traded value.
a. Type of sampling
The PPI is a research realized through non-probabilistic sampling.
b. Definition of the sample size
The PPI counts approximately on 3,200 sources and around 15,000 monthly quotes.
The size of sample is defined by the sample design group based on the variability of
the geometric average of the prices admitting a relative error of 5%.
54
Departamento Administrativo
Nacional de Estadística (DANE) 54
Producer Price Index (IPP)
General Methodology
c. Calculation of precision of the results
The PPI manages a 5% relative error at the maximum level of disaggregation of the
information handled.
2.3 OPERATIONAL DESIGN
2.3.1 Training System
The training of the personnel associated to the collection of the information is a factor
of great importance and is the object of a permanent process of quality control. A
continuous training scheme is used; it underlines the evaluation of the results, the
methodological changes and the technical evolution of the index.
An instruction process is organized annually in order to guarantee the technical level
of the tie personnel within the project. The following stages are included:
Analysis of the needs: oriented towards the identification of the abilities and the
specific knowledge required for developing a work of quality within the project.
Design of the training method: the content of the program is elaborated with the
support of pamphlets, books and oriented activities.
Concrete training: practical development of the training program activities
Evaluation: the success or failure of the program is determined
55
Bogotá D. C., Cundinamarca
2015 55
2.3.2 Preparatory activities
a. Awareness-raising process
This activity is under the responsibility of the coordinator of the PPI research. Its
objective is to guarantee a complete knowledge of the results of the research and to
facilitate the accessibility to the different informant sources participating in the
project.
The awareness-raising process includes three main stages:
The selection, qualification and training of the operational personnel in charge of
the direct contact with the informant sources and the collection of the prices of
the products of the basket.
The identification of the informant sources according to the items required for
the generation of the index.
The training of the informant source for delivering the information with monthly
frequency, according to the technological means available to them. The means
available are: completion via webpage, telephone, fax and printed form.
b. Selection of the personnel
The operational personnel plays an important role in the research. They are in charge
of the contact with the informant source and of the collection of prices. This group
includes:
Analysts: staff whose functions are: the collection, validation and capture of the
information given by the sources.
Coordinators: they are in charge of control functions, the coverage of the
operative and the management analyses. These functions are concentrated in the
stage of revision of the information consistency and control of debt of the
informant sources. The basic functions of coordination in the PPI are:
To generate the information corresponding to changes in prices higher than the
parameters of validity established for the research (outliers).
56
Departamento Administrativo
Nacional de Estadística (DANE) 56
Producer Price Index (IPP)
General Methodology
To verify the consistency and to supervise the information collected by the work
group.
To establish the veracity of the changes of prices of those of random selected
products.
To identify the items that deserve direct supervision and follow up.
To respect the collecting and the closing dates.
To consolidate the reports on enterprises and establishments in debt.
To develop the established activities for quality management.
To keep total reserve on the identification of the sources, its prices and products.
To stay updated on the characteristics and evolutions of the local market.
To locate new sources when needed, in agreement with the established criteria
and permanently updating the respective registers.
Thematic staff: staff in charge of defining the methodological process of the
research, to realize the processes of analysis, to perform the required
calculations, produce the documents of dissemination of the information, and
indicate the proper path to the logistics, thematic and systems groups of the
research.
Logistics: staff in charge of the analysis, revision, editing, correction and quality
of the information originating in the regional directions.
Systems staff: they provide maintenance, support and develop the software
for the databases resulting from the research.
57
Bogotá D. C., Cundinamarca
2015 57
2.3.3. Design of instruments
The instruments for the processes of collecting and controlling the data are:
Editing manual
Completion Manual
User Manual
Systems Manual
2.3.4 Data collection
a. Operative scheme
The objective of the operative process of the PPI research is the continuous
publication of reliable figures of a high level of technical quality. The operational
structure is geared towards this objective and centers its human capital in the
logistical processes related to the collection of information. This structure includes
the coordinator, the thematic team, the systems team and the logistics team.
The coordinator must define the schedule of the work and the basic guidelines
towards the continuous improvement of the thematic, systems and field logistics
teams.
The thematic team is in charge of verifying, analyzing and publishing the results
of the process.
The systems team is in charge of giving technical support in all the stages of the
process, from the capture of the information to the publication and delivery of
results.
The field logistics team executes the tasks related to the collection of the prices of
the products included in the index.
58
Departamento Administrativo
Nacional de Estadística (DANE) 58
Producer Price Index (IPP)
General Methodology
b. Methods and mechanisms for collecting prices
The process of collection of the PPI prices is realized using DANE’s webpage, where the
source reports the requested information on a monthly frequency. This reduces the
operative cost and the delay in response.
The collection procedure is summarized as follows:
If the source has just been included in the research and reports for the first time,
an explanation about the importance of its participation is made personally (or
through telephone call or e-mail). A Manual of the Electronic Form is also
provided; this manual gives instructions on how to use the web and how to auto-
complete the form. If the source does not have the technological infrastructure
required, alternative means for collecting the prices are provided.
The collection as such initiates with the process of capture of the information on
the 15th day of every month once the webpage is enabled so that the informant
source reports the prices of the products. The sources have seven working days
as of the date to enter the information
Finalized the seven working days, the coordinators of each regional office
generate the information corresponding to the sources that present
inconsistencies in the information provided, or if they are “in debt” for completing
the form.
As soon as the information is generated, the new events reported by the sources
are reviewed, and if it is necessary to communicate with them, this is done by
telephone or by e-mail, to ask for the missing information or to request
explanations about the observed inconsistency.
For the 27th day of the month, DANE headquarters generates the information at
national level and consults with coordinators to consolidate the number of new
events and “in debt” situations.
For the 30th day of the month, the collection procedure is over and the processing
of results begins.
59
Bogotá D. C., Cundinamarca
2015 59
The system of collection of the PPI uses a combination of methods focused in the
increased use of technological tools in order to reduce the response time by the
source and to lower the operative costs. The methods used are as follows:
Self-completion of the electronic form via webpage.
Self-completion of the paper form and delivery by fax or e-mail.
Collection by telephone with the support of the analysts of the research.
c. Data transmission
The PPI collects and captures the information via Web.
d. Capture of information
The process of capture of the information is realized simultaneously with the process
of collection, since it uses a system of free self-completion with electronic form via the
webpage. The information collected by telephone or via e-mail is recorded in the
system of capture of data of the research by the logistics team.
e. Consolidation of files
In order to consolidate the files some preliminary activities to the completion process
are implemented such as the input of sources and of the products they report about
to the Oracle software with Java interface.
The input of informant sources or previously verified products conforms the main
base. It is considered ready for processing and generation of results once the editing
processes have been finalized.
60
Departamento Administrativo
Nacional de Estadística (DANE) 60
Producer Price Index (IPP)
General Methodology
f. Control of coverage
The mechanisms to control the loss of information are the following: If the
information of some source in the month is missing, the analyst calls and consults the
reason why the source has not been able to report its prices and a follow-up is
initiated until the source can register the corresponding information (offering the
necessary advice).
2.4 SYSTEMS DESIGN
The PPI has been developed using the architectural pattern for WEB applications MVC
Model. This is implemented on 2 technologies J2EE-JAVA Enterprise Edition that are
editions of Java focused on the business logic. Additionally they use the philosophy of
development in N layers, where each layer separates the presentation into what the
end user sees in the screen, the business logic and the persistence towards the data
base.
When differentiating clearly the layers, the independence between them can be
observed. This allows a fast and easy maintenance of each components.
The technologies used for each layer that composes the application are:
For the layer of the view where the display elements of the application are
written, JSF is used (Java Server Faces).
The elements corresponding to the control layer where the navigation logic is
modeled, use framework adf-phases of Oracle.
For the layer of business or services where the logic of the business is described,
components EJB of Session were used.
The logic of persistence of data is developed handling EJBs of organization, where
the basic objects of data are mapped using JPA transcription methods.
The data repository is an ORACLE version 11i database.

61
Bogotá D. C., Cundinamarca
2015 61
2.4.1 Main modules
The modules of the PPI are associated with each phase that constitute the life cycle of
the generation of the index. The following modules available are:
System Management Module: in this module the different processes of the system are
defined. Currencies types as well as the value of the representative rates of the
market are defined. The periods and the associated states are stated; the types of
indices are delimited; the classification trees corresponding both to CPC and to ISIC
are managed and the economic origins and purposes also. This management module
also allows to manage the register base, that is, to insert, to update and to eliminate
sources, quotes and specifications of the PPI research.
Collection Module: it consists of an electronic form previously completed in which the
source provides the prices of the products. In the same way, this module allows to
load the operative directory of sources and quotes.
Logistic Module: it allows to measure the advance of the operative of collecting prices.
Execution Module: it admits to execute all the processes defined for the investigation
in the administration module. In this module, the massive processes of pre-
completion of the electronic forms or the calculation for a given period can be
executed, among others.
Analysis Module: In this module the edition and analysis of the microdata provided by
the sources is performed, once the electronic form is completed. In this module it is
possible to apply technical new features, to observe the variations of the prices of
products, etc.
Dissemination Module: it generates in different types of files (pdf, excel, HTML) the
results of the calculation of the index on a monthly basis.

62
Departamento Administrativo
Nacional de Estadística (DANE) 62
Producer Price Index (IPP)
General Methodology
2.5 DESIGN METHODS AND MECHANISMS FOR QUALITY
CONTROL
2.5.1. Procedure of codification and editing
During the editing process, the staff concentrates on four fundamental aspects for
the control of the information and its corresponding quality:
To guarantee the continuity of the specifications of collection of each of the
products that belong to the basket of products. These must also maintain the
requested characteristics of the products overtime
To verify the changes in prices from month to month and request explanation
from the sources on any anomaly.
To make telephone or e-mail follow-up to the informant sources that did not
report prices and to request the corresponding update.
To update the registers.
2.5.2. Analysis of the quality of results
The guidelines for the development of the quality indicators of the PPI have been
based on the IMF recommendations included in the Data Quality Assessment
Framework for the Producer Price Index11. On the basis of this reference, procedures
and indicators were elaborated to follow up the quality of the results:
Percentage of informant source “in debt”: it measures the percentage of informant
sources that did not report the information on prices in the established periods. Its
objective is to control the effectiveness of the collection process. The coverage is the
national aggregate and has monthly periodicity.
11 Data Quality Assessment Framework for the Producer Price Index. IMF. Kimberly Zieschang and Paul
Armknecht. (2003)
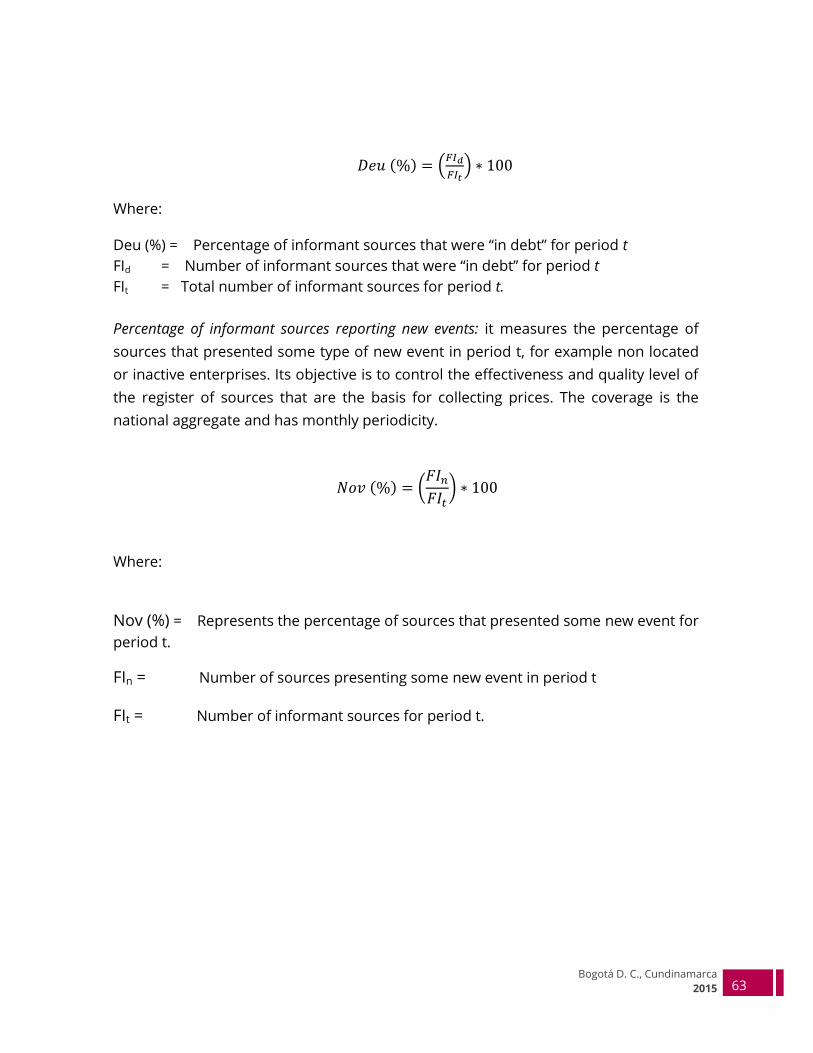
63
Bogotá D. C., Cundinamarca
2015 63
𝐷𝑒𝑢 (%) = (𝐹𝐼𝑑
𝐹𝐼𝑡) ∗ 100
Where:
Deu (%) = Percentage of informant sources that were “in debt” for period t
FId = Number of informant sources that were “in debt” for period t
FIt = Total number of informant sources for period t.
Percentage of informant sources reporting new events: it measures the percentage of
sources that presented some type of new event in period t, for example non located
or inactive enterprises. Its objective is to control the effectiveness and quality level of
the register of sources that are the basis for collecting prices. The coverage is the
national aggregate and has monthly periodicity.
𝑁𝑜𝑣 (%) = (𝐹𝐼𝑛
𝐹𝐼𝑡) ∗ 100
Where:
Nov (%) = Represents the percentage of sources that presented some new event for
period t.
FIn = Number of sources presenting some new event in period t
FIt = Number of informant sources for period t.
64
Departamento Administrativo
Nacional de Estadística (DANE) 64
Producer Price Index (IPP)
General Methodology
2.5.3. Indicators for the quality control of the processes of the research
With the purpose of determining the quality of the processes, the following indicators
of quality are analyzed:
Answering or coverage rate by sources Index (ITRF): it corresponds to the ratio between
the number of sources that were contacted and the number of pre-completed
sources. It determines the answering level or coverage in terms of the visited or
surveyed sources, compared with the expected number of sources programmed or
selected in the research.
ITRF= ((total pre-completed sources + new source – non-found sources)/total pre-
completed sources)*100.
Where:
The pre-completed sources are the actual ones according to the new events of the
previous period
The new sources correspond to those introduced for the first time in the present
period.
The non- found sources are those that were searched in order to get in touch with
them by electronic means, phone call or visits and which were not located.
Answering or record coverage rate Index (ITRR): it corresponds to the relationship
between the number of records of variables collected with the software with actual
information and the expected number of records of variables according to pre-
completed forms. It determines the degree of actual answer or coverage in terms of
the records, compared with their expected number.
The actual records are those in which technical conditions are not used to generate
missing information, i.e. change of reference. It includes zero as answer for actual
records; new events that generate actual imputation (in hold status) or variations
(immediate substitution), are considered as actual records.

65
Bogotá D. C., Cundinamarca
2015 65
ITRR = (total quotes-cr-is/pred. quotes) *100
Where:
Pred. Quotes =Number of pre-completed products for collection.
cr =Records with change of reference indicated as new event.
is =Records eliminated in the present period
Total quotes = Actual records (information without technical new events that
produce missing information (cr).
Non-imputation or Non-estimation Index (INI): it corresponds to the difference between
the total number of records and the number of records with a technical new event
that generates a process of imputation or estimation and its relationship with the
total expected records. It indicates the level of imputation or estimation used within
the research. It is the difference between the total expected records and those
marked as imputation. This last process is carried out at the headquarters on
information that has been already edited and verified at the regional level.
INI= (total quotes-records in on-hold status) /total quotes) *100
Where:
Total quotes = Number of pre-completed products for collection
Records in on-hold status = Records to be imputed or estimated.
Quality Index 1 (IDC1): indicator of the quality of the processes: it is generated through
the verification of the quality in the stages of collection and analysis. It determines the
quality level of the productive processes, using the difference between the tasks
carried out in an appropriate manner and the omissions or errors found in each
process. This indicator is useful for making a disaggregated analysis, mainly at local
level, of the omissions generated both in the collection and in the analysis and editing
stage.

66
Departamento Administrativo
Nacional de Estadística (DANE) 66
Producer Price Index (IPP)
General Methodology
IDC1 = (ICR + ICA)/2
Where:
Collection quality Index (ICR): It is the difference between the expected or pre-
completed number of records and the number of records that present errors in the
collection process, at local level. It is generated in order to make a more detailed
analysis, of the omissions introduced in the collection process.
ICR= (RES-number of records with errors in the collection) /RES) *100
Where:
RES = Number of expected records based in the pre-completed records
Quality in the analysis Index (ICA) is the difference between expected or pre-completed
number of records and the number of records that present errors in the analysis and
editing process at the local level. It is generated in order to make a detailed analysis of
the omissions generated in the process of analysis and editing.
ICA= (RES-number of errors in the process of analysis and editing) /RES) *100
Quality Index 2 (IDC2): it represents the sum of all errors and omissions (inadequate
treatment of product) generated in all the stages of the process: collection, analysis,
etc., with respect to the expected total of records. It defines the quality level of the
productive processes of the research, from the difference between the work carried
out appropriately and the errors and omissions found in each process, expressed as a
percentage of the total expected information. This indicator is useful to make an
analysis of the information aggregated at national level without considering the
analysis at local level.
IDC2 = ((RES-TPNC)/RES)) *100
Where:
IDC2 = Quality Index 2
67
Bogotá D. C., Cundinamarca
2015 67
TPNC = Inadequate treatment of products: it corresponds to the sum of errors and
omissions in the quality control processes corresponding to editing and capture.
RES= Expected number of records
Reliability Index (ICFA): it corresponds to the simple average of all the quality
indicators of the chain of processes of the research.
ICFA = (ITRF + ITRR + INI+IDC1+IDC2)/5
Where:
ITRF= Answering or coverage rate by sources Index
ITRR= Answering or record coverage rate Index
INI = Non-imputation or Non-estimation Index
IDC1= Quality Index 1
IDC2= Quality Index 2
2.6 DESIGN OF THE ANALYSIS OF RESULTS
2.6.1 Statistical analysis
The descriptive analysis of data in the PPI is centered in the validation of the change of
prices of the products in the basket of reference (Pt), between the periods t and t -1 on
a monthly basis.
𝑉𝑎𝑟 (𝑃𝑥) = ((𝑃𝑡
𝑃𝑡−1 ) − 1) ∗ 100
The changes that are outside of the average range of the subclass, require
justification. This analysis is realized in two stages of the operative process. The first
stage takes place at local level where the analysts verify the changes concerning
quotes of the sources assigned to their region. The second stage is realized at the
central level; where all the atypical behaviors analyzed at the local level, are controlled
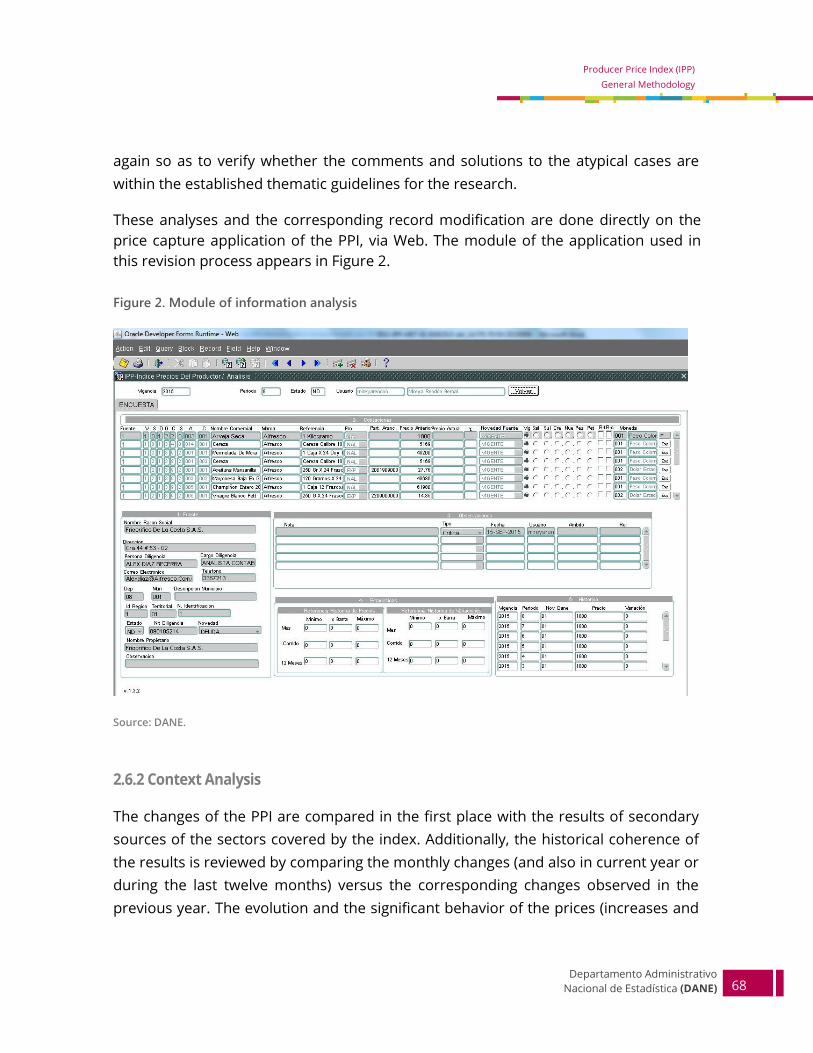
68
Departamento Administrativo
Nacional de Estadística (DANE) 68
Producer Price Index (IPP)
General Methodology
again so as to verify whether the comments and solutions to the atypical cases are
within the established thematic guidelines for the research.
These analyses and the corresponding record modification are done directly on the
price capture application of the PPI, via Web. The module of the application used in
this revision process appears in Figure 2.
Figure 2. Module of information analysis
Source: DANE.
2.6.2 Context Analysis
The changes of the PPI are compared in the first place with the results of secondary
sources of the sectors covered by the index. Additionally, the historical coherence of
the results is reviewed by comparing the monthly changes (and also in current year or
during the last twelve months) versus the corresponding changes observed in the
previous year. The evolution and the significant behavior of the prices (increases and
69
Bogotá D. C., Cundinamarca
2015 69
decreases), at national and international level, is used as a tool of thematic analysis.
The information available from the media referring to the behavior of the different
economic sectors is also taken into account.
2.6.3. Experts Committees
An internal committee takes place every month to present the results of the PPI to
DANE staff in charge of other research areas that may serve as a contrast reference
for the index. The results presented refer to the last month, the current year and the
last twelve months.
Comparisons are also made with other researches, with the international context and
the logistic report. A monthly committee allows to inform the external users explicitly
on the results of the PPI on a confidential way.
These two committees are realized previously to the publication of the results.
2.7 DISSEMINATION DESIGN
2.7.1 Administration of the data repository
The processes of storage of the results and the databases of the PPI are realized
centrally and are responsibility of the systems and thematic teams of the research at
DANE headquarters in Bogota.
The processing section stores the tables related with the identification of the sources
and the prices reported for the products of the basket. These tables are classified on
a monthly basis by the systems team using as format the archives dba_ objects for
Oracle.
70
Departamento Administrativo
Nacional de Estadística (DANE) 70
Producer Price Index (IPP)
General Methodology
Regarding the delivery of results, the thematic team stores the historical series of the
indices in Excel format and the publication bulletins in Word format, which remain at
DANE headquarters.
2.7.2 Products and instruments of dissemination
The research of the PPI delivers the following products to the public in general on the
4th day of the month or on the closest working day preceding the CPI, on DANE’s
webpage:
Technical bulletin: which includes the general results of the index for the month
of reference.
Press release: an official communication that includes a synthesis of the results of
the research.
Informative Annexes: They include series of the indices as well as their changes,
contributions and shares at the different levels of publication.
Historical Annexes: series of the indices and their historical changes for indices
classified by use or economic purpose (CUODE). Also, the historical series of total
internal supply and domestic production with their respective sections are
presented since June 1999.
The results published in Excel format contain the change, contribution and share
(monthly, in current year and twelve last months) of the following indices:
Domestic Production Price index
Internal Supply Price index
Goods Produced for domestic consumption Price Index (PYC)
Imported goods Price index (M)
Exported goods Price Index (X)
71
Bogotá D. C., Cundinamarca
2015 71
Domestically Consumed Final goods Price Index (BFOI)
Domestically Produced Final goods for Domestic Consumption Price Index
(BFPYC)
Imported Final goods Price index (BFM)
Construction materials Price Index (MC)
Intermediate consumption goods Price index
Final Consumption Goods Price index
Capital goods Price Index (BK)
Final Demand Price Index (DF)
This information is published monthly on DANE’s webpage for internal and external
users, and in the National Data Archive (ANDA), from where these statistical data can
be accessed.
72
Departamento Administrativo
Nacional de Estadística (DANE) 72
Producer Price Index (IPP)
General Methodology
DESIGN OF THE EVALUATION
Fulfilling the quality standards is nowadays fundamental in the production process of
statistics. As a consequence, the design of the evaluation in the PPI research
constitutes an important mechanism to give a proper treatment to this information.
The evaluation of the research of the PPI, is a continuous process, in several stages
going from the design to the production and dissemination processes. It includes
among others:
Certification by international experts: It consists of periodic visits of experts of
different international organisms in charge of the evaluation of all the associated
processes of the index: system components, applications (application nets),
calculation and capture recording, components of the sample design, results and
dissemination and finally the approach to external and internal users.
Survey of users’ satisfaction: It is a tool to know the needs of the users. This is a task
shared with the Databank of the organization that is the first channel of contact
with the users.
International recommendations: During the process of design, and induction stage
as well, this research receives technical advice from international organizations
such as the International Monetary Fund (IMF) and some National Institutes of
Statistics with experience in indices. Both report on diagnosis and
recommendations for the implemented process.
Internal and external committees: Monthly meetings are realized with the purpose
of analyzing the results of the research in a context of economic short term
analysis and by informing some users on the results of the PPI in explicit and
confidential way. These two committees are realized previously to the publication
of the results. In these committees suggestions and recommendations of users
and advisers are received, and constitute a permanent evaluation of the research.
73
Bogotá D. C., Cundinamarca
2015 73
3. RELATED DOCUMENTATION
The related documentation that supports this methodology is the following:
Methodologic card of the PPI: document that presents a brief review of the basic
guidelines of the research.
Methodology of PPI 1991, 1999 elaborated by the Banco de la República and the
methodology of PPI 2009 elaborated by DANE, documents that present the
methodological design of the Producer Price Index.
Methodology of design of systems relating to PPI: document deepening in the
technical characteristics and systems support for the process of calculation of the
index.
User Manuals for the PPI system: document that illustrates the access to the
computer systems of the PPI.
Correlative Subclass CPC Rev 1 A.C - Class ISIC Rev 3 A.C and CPC Rev 2 A.C - Class
ISIC Rev 4 A.C: documents that illustrate the relationship between a product
group (subclasses) as those defined by the CPC and a class in the ISIC
classification.
Matrix of weights: table that shows the relative weight of each product group
within the total calculation of the index.
Glossary of terms of the PPI: document that explains in detail the terms used
within the research of the Producer Price Index.
74
Departamento Administrativo
Nacional de Estadística (DANE) 74
Producer Price Index (IPP)
General Methodology
GLOSSARY12
Annual variation: percentage change calculated between the period of reference (t)
and the same period of the previous year (t previous year).
Base unit: it is the unit used as standard measure of the amounts associated with the
observed price. A conversion of prices is necessary when the price observed does not
correspond with this unit, since the prices only can be compared when they are
referred to the same unit of weight, volume or quantity (in units).13
Basic basket: Representative set of goods and services for which the statistics office
does follow up of prices. This basket is set up taking a base year as reference.
Capital good: it is a good used repeatedly (for more than a year) in the process of
production of other goods or services, such as machines, equipment, etc.
Change of reference: It is a condition that allows facing the change of quality of a
given product. The absence may be the result of market conditions or of changes in
the primary characteristics of a specification, those that differentiate one product
from another or even varieties of the same product. The change of reference is a
procedure to grasp implicitly the changes of quality in products.
Chained Index: It is an index number series for a given aggregate spanning a long
sequence of periods obtained by linking index numbers spanning shorter periods,
each one with their own weights.14
Consumer good: good or service bought and used directly by the end user. It does not
require any productive transformation.
12 With some exceptions the definitions included in this glossary were taken from:
http://sen.dane.gov.co:8080/senApp/module/conceptosModule/index.html.
13 IDANE, METODOLOGIA INDICE DE PRECIOS AL CONSUMIDOR – IPC 09-08-2013
14 Definition taken from: Producer Price Index Manual: Theory and Practice. International Monetary Fund.
Statistics Department. September 3, 2004.
75
Bogotá D. C., Cundinamarca
2015 75
Data collection: process by which data are obtained through different types of
surveys or administrative records.
Elementary aggregate: it is a relatively homogenous set of goods both in its physical
characteristics as in the behavior of the variations of the prices.
Elementary aggregated Index: an index calculated as a geometric average of the
quotes of prices collected from the sources.
Immediate substitution: it is used to face the absence of a specification replacing it by
a perfect substitute, taking into account all the characteristics of quality, using as a
proxy of this concept the price, the quantity and the brand. The effect on the
calculation system is of small variations in minimum ranks.15
Index Number: amount that shows, by its variations, the changes over time or space
of a magnitude. The most important characteristics in the construction of an index
number are: coverage, base period, weighting system and method for averaging the
observations.
Index of Jevons: it is defined as the unweighted geometrical average of the current-to
base period price relatives. It is an elementary index.16
Intermediate good: goods and services other than capital goods that are used as
inputs in the processes of production of an establishment and are produced by other
economic sectors or are imported. In addition, they have to be transformed or
completely consumed during the production process. Land, labor and capital are
primary inputs consumptions and they are not included within the intermediate
inputs, denominated also “intermediate products”.
15 DANE, METODOLOGIA INDICE DE PRECIOS AL CONSUMIDOR – IPC 09-08-2013
16 Definition taken from: Producer Price Index Manual: Theory and Practice. International Monetary Fund.
Statistics Department. September 3, 2004.
76
Departamento Administrativo
Nacional de Estadística (DANE) 76
Producer Price Index (IPP)
General Methodology
Laspeyres Price Index: Price index defined as fixed basket of fixed weights index, this index
uses the basket of goods and services of the base period. The base period refers both to
the period of reference of the weights as to the period of reference of the prices.
Modified Laspeyres Price Index: In this type of index, the price of the current period is
compared directly with the price of the previous period and indirectly with the price
of the period on which weights are based.17
Monthly variation: Percentage change of the month with respect to the previous
month. Such rates are expressed as ((Mt / Mt-1) - 1) *100.
Period of reference: period of specific time (day, week, month, year) or point in time
to which corresponds the realized observation, or the variable of interest.
Period of reference of the prices: it refers to the period associated to the prices that
are compared with the current prices
Period of reference of weight: usually a year, corresponds to the period of time for
which the weights are calculated.
Press bulletin: It is a communication of official character that presents the main
indicators and aspects of the statistical research that is being disseminated.
Press release: it is an official communication that contains data of the statistical
research disseminated in a summarized format. It can be defined as the summary of
the statistical press bulletin and it is disclosed to mass media.
Producer Price index (PPI): it is an index that measures the average variation of the
prices of a basket of goods representative of the internal supply in its first stage of
commercialization. Internal supply includes domestically produced goods as well as
goods imported to the country.
Variation: calculated percentage change for a variable in a given period in relation to
another one
Variation in current year: calculated percentage change normally between a given
month of the year and December of the previous year.
17 Ibid
77
Bogotá D. C., Cundinamarca
2015 77
BIBLIOGRAPHY
Banco de la República (1991). “Producer Price Index Methodology 1990”. Bogota, D.C.
Banco de la República (1999). “Producer Price Index Methodology 1999”. Bogotá, D.C.
Berthier, J. (2005). Introduction à la Pratique des Indices Statistiques. Notes de cours.
Series des Documents de Travail Methodologie Statistique. N° M0503. Institut National de
la Statistique et des Etudes Economiques. INSEE (France)
National Administrative Department of Statistics (DANE) (1998). “Consumer Price
Index Methodology 1998”. Bogota, D.C.
National Administrative Department of Statistics (DANE) (2000). “Bases of National
Accounting according to SNA 1993”. Bogota, D.C.
National Administrative Department of Statistics (DANE) (2012). “International
Standard Industrial Classification, Rev 4. A.C.” Bogota, D.C.
National Administrative Department of Statistics (DANE) (2014). “Central Product
Classification Rev 2.0 A.C.” Bogota, D.C.
Diewert, E. (1983). The Theory of the Output Price Index and the Measurement of Real
Output Change. In: Price Level Measurement: Proceedings from a conference sponsored
by Statistics Canada. Edwin Diewert and Claude Montmarquette, editors. Ottawa.
International Monetary Fund - IMF (2003). Data Quality Assessment Framework (DQAF)
for the Producer Price Index.
International Monetary Fund - IMF (2010). Producer Price Index Manual. 2010.
International Monetary Fund- IMF (2006). Consumer Price Index Manual, theory and
practice. Washington D.C. 2006
International Monetary Fund – IMF (2004). Producer Price Index Manual, theory and
practice. Washington D.C.
Minister of Supply and Services Canada (1983).Price Level Measurement. Ottawa.
78
Departamento Administrativo
Nacional de Estadística (DANE) 78
Producer Price Index (IPP)
General Methodology
Organization for Economic Cooperation and Development- OECD (2011) “Producer
price Indices. - Comparative Methodological Analysis” 2011
Recommendations from Statistical Agency of Canada - STATCAN 2009.
Recommendations from Statistical Agency of Canada - STATCAN 2011.
Recommendations from the International Monetary Fund- IMF 2014.
Price index Methodology Summary: Producer prices. Canada.
Price index Methodology Summary: Producer prices. Chile. Julio, 2003.
Price index Methodology Summary: Producer prices. Mexico, September, 2004.

79
Bogotá D. C., Cundinamarca
2015 79
ANNEXES
Annex A. Output tables, Producer Price Index (PPI)18
The following list includes the main output tables of the Producer Price Index - PPI
Table A1. Vertical Indices
Table A2. Final Goods Produced for domestic consumption (BFPYC = BK01 + CF01 +
MC01)
Table A3. Imported Final Goods (BFM = BK02 + CF02 + MC02).
Table A4. Demand (DF = BK01 + CF01 + MC01 + X)
Table A5. Intermediate Consomption (CI = CI01 + CI02)
Table A6. Final Goods of the Internal Supply (BFOI = BK01 + CF01 + MC01 + BK02 +
CF02 + MC02)
Table A7. Total Domestic Supply (OI = PYC + M = BK01 + CF01 + CI01 + MC01 + BK02 +
CF02 +CI02 + MC02)
Table A8. Imports (M = BK01 + CF01 + CI01 + MC01)
Table A9. Capital Goods (BK = BK01 + BK02
Table A10. Consumption (CF = CF01 + CF02)
Table A11. Construction materials (MC = MC01 + MC02)
Table A12. National Production (PN = PYC + X = BK01 + CF01 + CI01 + MC01 + X)
Table A13. Exports (X)
18 These tables are published monthly in the following ling of DANE’s webpage (Annex):
http://www.dane.gov.co/daneweb_V09/index.php?option=com_content&view=article&id=102&Itemid=76
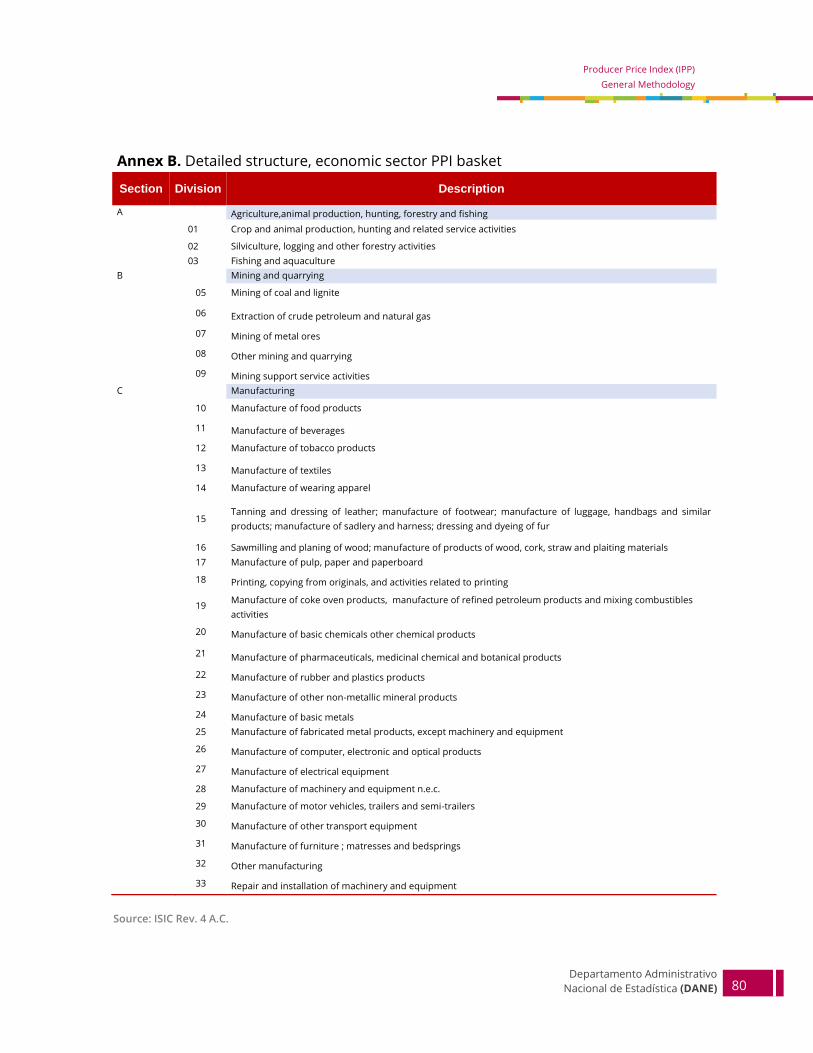
80
Departamento Administrativo
Nacional de Estadística (DANE) 80
Producer Price Index (IPP)
General Methodology
Annex B. Detailed structure, economic sector PPI basket
Section Division Description
A Agriculture,animal production, hunting, forestry and fishing
01 Crop and animal production, hunting and related service activities
02 Silviculture, logging and other forestry activities
03 Fishing and aquaculture
B Mining and quarrying
05 Mining of coal and lignite
06 Extraction of crude petroleum and natural gas
07 Mining of metal ores
08 Other mining and quarrying
09 Mining support service activities
C
Manufacturing
10 Manufacture of food products
11 Manufacture of beverages
12 Manufacture of tobacco products
13 Manufacture of textiles
14 Manufacture of wearing apparel
15 Tanning and dressing of leather; manufacture of footwear; manufacture of luggage, handbags and similar
products; manufacture of sadlery and harness; dressing and dyeing of fur
16 Sawmilling and planing of wood; manufacture of products of wood, cork, straw and plaiting materials
17 Manufacture of pulp, paper and paperboard
18 Printing, copying from originals, and activities related to printing
19 Manufacture of coke oven products, manufacture of refined petroleum products and mixing combustibles
activities
20 Manufacture of basic chemicals other chemical products
21 Manufacture of pharmaceuticals, medicinal chemical and botanical products
22 Manufacture of rubber and plastics products
23 Manufacture of other non-metallic mineral products
24 Manufacture of basic metals
25 Manufacture of fabricated metal products, except machinery and equipment
26 Manufacture of computer, electronic and optical products
27 Manufacture of electrical equipment
28 Manufacture of machinery and equipment n.e.c.
29 Manufacture of motor vehicles, trailers and semi-trailers
30 Manufacture of other transport equipment
31 Manufacture of furniture ; matresses and bedsprings
32 Other manufacturing
33 Repair and installation of machinery and equipment
Source: ISIC Rev. 4 A.C.
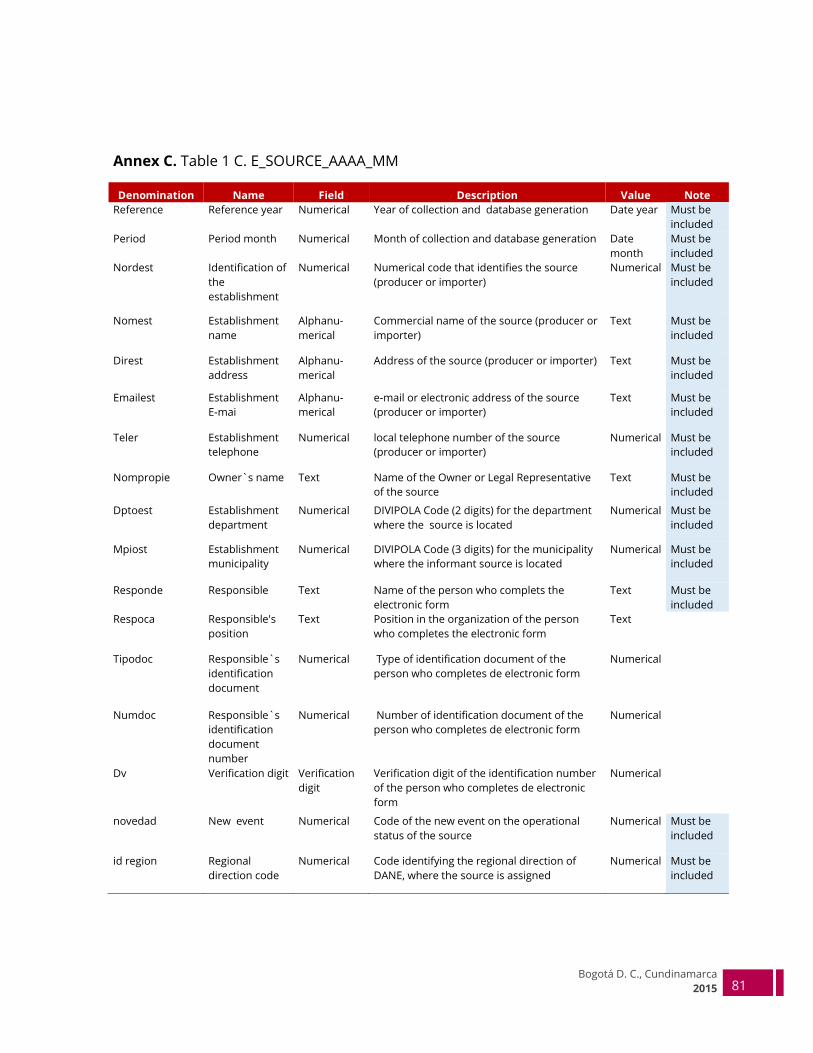
81
Bogotá D. C., Cundinamarca
2015 81
Annex C. Table 1 C. E_SOURCE_AAAA_MM
Denomination Name Field Description Value Note
Reference Reference year Numerical Year of collection and database generation Date year Must be
included
Period Period month Numerical Month of collection and database generation Date
month
Must be
included
Nordest Identification of
the
establishment
Numerical Numerical code that identifies the source
(producer or importer)
Numerical Must be
included
Nomest Establishment
name
Alphanu-
merical
Commercial name of the source (producer or
importer)
Text Must be
included
Direst Establishment
address
Alphanu-
merical
Address of the source (producer or importer) Text Must be
included
Emailest Establishment
E-mai
Alphanu-
merical
e-mail or electronic address of the source
(producer or importer)
Text Must be
included
Teler Establishment
telephone
Numerical local telephone number of the source
(producer or importer)
Numerical Must be
included
Nompropie Owner`s name Text Name of the Owner or Legal Representative
of the source
Text Must be
included
Dptoest Establishment
department
Numerical DIVIPOLA Code (2 digits) for the department
where the source is located
Numerical Must be
included
Mpiost Establishment
municipality
Numerical DIVIPOLA Code (3 digits) for the municipality
where the informant source is located
Numerical Must be
included
Responde Responsible Text Name of the person who complets the
electronic form
Text Must be
included
Respoca Responsible's
position
Text Position in the organization of the person
who completes the electronic form
Text
Tipodoc Responsible`s
identification
document
Numerical Type of identification document of the
person who completes de electronic form
Numerical
Numdoc Responsible`s
identification
document
number
Numerical Number of identification document of the
person who completes de electronic form
Numerical
Dv Verification digit Verification
digit
Verification digit of the identification number
of the person who completes de electronic
form
Numerical
novedad New event Numerical Code of the new event on the operational
status of the source
Numerical Must be
included
id region Regional
direction code
Numerical Code identifying the regional direction of
DANE, where the source is assigned
Numerical Must be
included

82
Departamento Administrativo
Nacional de Estadística (DANE) 82
Producer Price Index (IPP)
General Methodology
Annex C. Table 2 C. D_QUOTATION_AAAA_MM
Denomination Name Field Description Value Note
Reference Reference year Numerical Year of collection and database
generation
Date year Must be
included
Period Period month Numerical Month of collection and database
generation
Date
month
Must be
included
Nordest Identification
of the
establishment
Numerical Numerical code that identifies the
source (producer or importer)
Numerical Must be
included
cpc_tematica CPC_Temática Numerical Code of the item at the quotation
level
Numerical Must be
included
cpc_I CPC_Logistics Numerical Code of the item at the product
level
Numerical Must be
included
nompro Product name Alfanu-
merical
Commercial name of the product Text Must be
included
marca Marca
Producto
Alfanu-
merical
Trademark that identifies the
product or item
Alfanu-
merical
ref Product
reference
Alfanu-
merical
Internal reference of the source for
identifying the product or item
Alfanu-
merical
procedencia Product origin Numerical Code that identifies the origin of the
product or item
Numerical Must be
included
tipomoneda Currency Numerical Code that identifies the currency of
the price of the product or item
reported
Numerical Must be
included
unidad_a Unit a Numerical Code that identifies the base unit
used in the distribution of the
product or item
Numerical Must be
included
tipo_unidad_a Dimension for
unit a
Numerical Dimension of the base unit used in
the distribution of the product or
item
Numerical Must be
included
cantidad_a Quantity unit a Numerical Quantity of the base unit used in the
distribution of the product ot item
Numerical Must be
included
unidad_b Unit b Numerical Code that identifies the second unit
used in the distribution of the
product or item
Numerical
tipo_unidad_b Dimension for
unit b
Numerical Dimension of the second unit used
in the distribution of the product or
item
Numerical
cantidad_b Quantity unit b Numerical Quantity of the second unit used in
the distribution of the product ot
item
Numerical
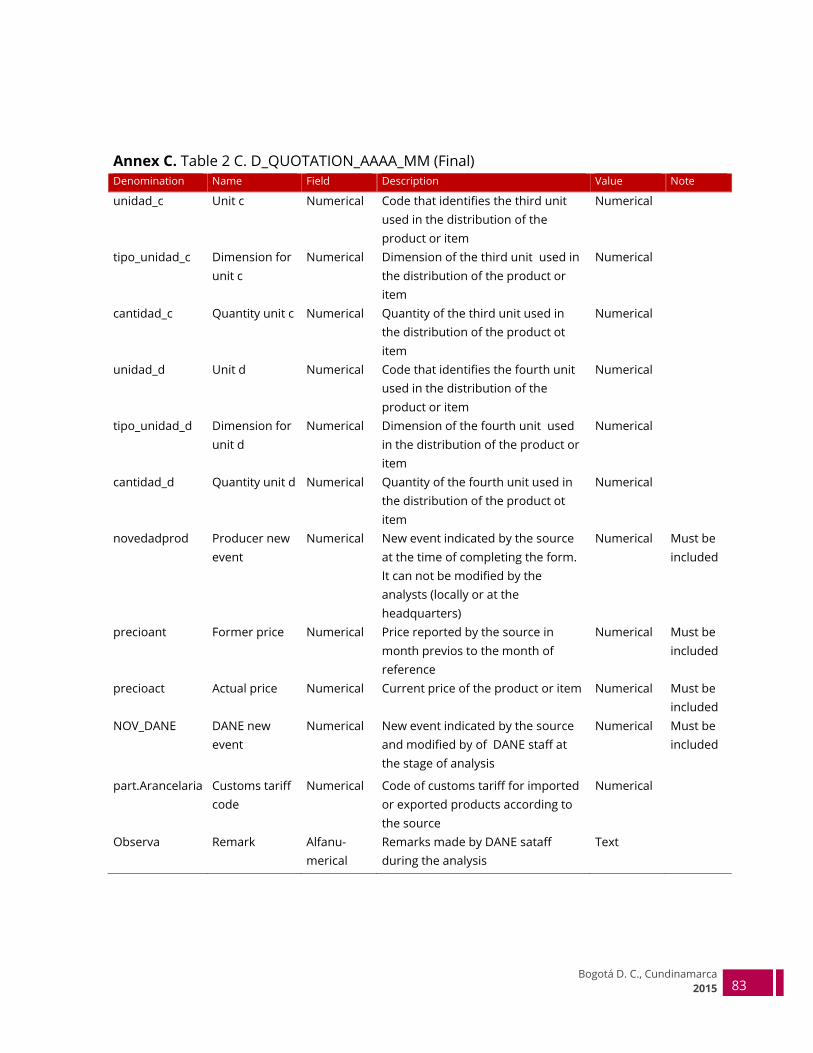
83
Bogotá D. C., Cundinamarca
2015 83
Annex C. Table 2 C. D_QUOTATION_AAAA_MM (Final)
Denomination Name Field Description Value Note
unidad_c Unit c Numerical Code that identifies the third unit
used in the distribution of the
product or item
Numerical
tipo_unidad_c Dimension for
unit c
Numerical Dimension of the third unit used in
the distribution of the product or
item
Numerical
cantidad_c Quantity unit c Numerical Quantity of the third unit used in
the distribution of the product ot
item
Numerical
unidad_d Unit d Numerical Code that identifies the fourth unit
used in the distribution of the
product or item
Numerical
tipo_unidad_d Dimension for
unit d
Numerical Dimension of the fourth unit used
in the distribution of the product or
item
Numerical
cantidad_d Quantity unit d Numerical Quantity of the fourth unit used in
the distribution of the product ot
item
Numerical
novedadprod Producer new
event
Numerical New event indicated by the source
at the time of completing the form.
It can not be modified by the
analysts (locally or at the
headquarters)
Numerical Must be
included
precioant Former price Numerical Price reported by the source in
month previos to the month of
reference
Numerical Must be
included
precioact Actual price Numerical Current price of the product or item Numerical Must be
included
NOV_DANE DANE new
event
Numerical New event indicated by the source
and modified by of DANE staff at
the stage of analysis
Numerical Must be
included
part.Arancelaria Customs tariff
code
Numerical Code of customs tariff for imported
or exported products according to
the source
Numerical
Observa Remark Alfanu-
merical
Remarks made by DANE sataff
during the analysis
Text
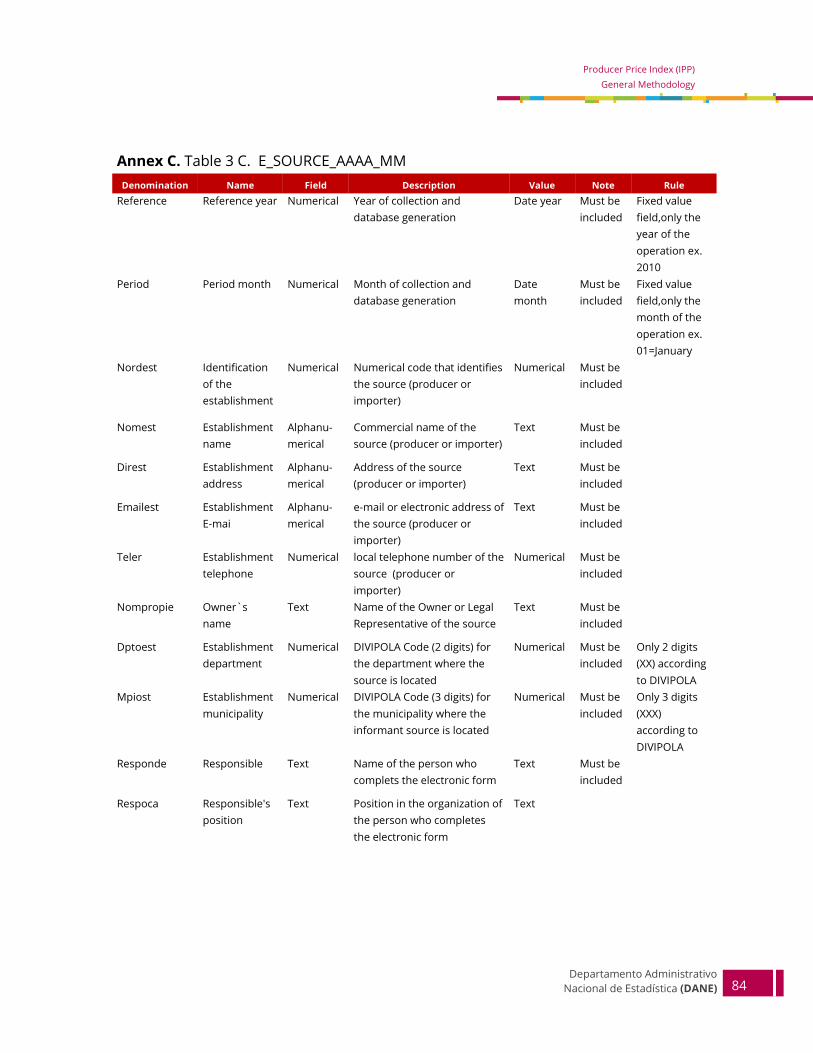
84
Departamento Administrativo
Nacional de Estadística (DANE) 84
Producer Price Index (IPP)
General Methodology
Annex C. Table 3 C. E_SOURCE_AAAA_MM
Denomination Name Field Description Value Note Rule
Reference Reference year Numerical Year of collection and
database generation
Date year Must be
included
Fixed value
field,only the
year of the
operation ex.
2010
Period Period month Numerical Month of collection and
database generation
Date
month
Must be
included
Fixed value
field,only the
month of the
operation ex.
01=January
Nordest Identification
of the
establishment
Numerical Numerical code that identifies
the source (producer or
importer)
Numerical Must be
included
Nomest Establishment
name
Alphanu-
merical
Commercial name of the
source (producer or importer)
Text Must be
included
Direst Establishment
address
Alphanu-
merical
Address of the source
(producer or importer)
Text Must be
included
Emailest Establishment
E-mai
Alphanu-
merical
e-mail or electronic address of
the source (producer or
importer)
Text Must be
included
Teler Establishment
telephone
Numerical local telephone number of the
source (producer or
importer)
Numerical Must be
included
Nompropie Owner`s
name
Text Name of the Owner or Legal
Representative of the source
Text Must be
included
Dptoest Establishment
department
Numerical DIVIPOLA Code (2 digits) for
the department where the
source is located
Numerical Must be
included
Only 2 digits
(XX) according
to DIVIPOLA
Mpiost Establishment
municipality
Numerical DIVIPOLA Code (3 digits) for
the municipality where the
informant source is located
Numerical Must be
included
Only 3 digits
(XXX)
according to
DIVIPOLA
Responde Responsible Text Name of the person who
complets the electronic form
Text Must be
included
Respoca Responsible's
position
Text Position in the organization of
the person who completes
the electronic form
Text
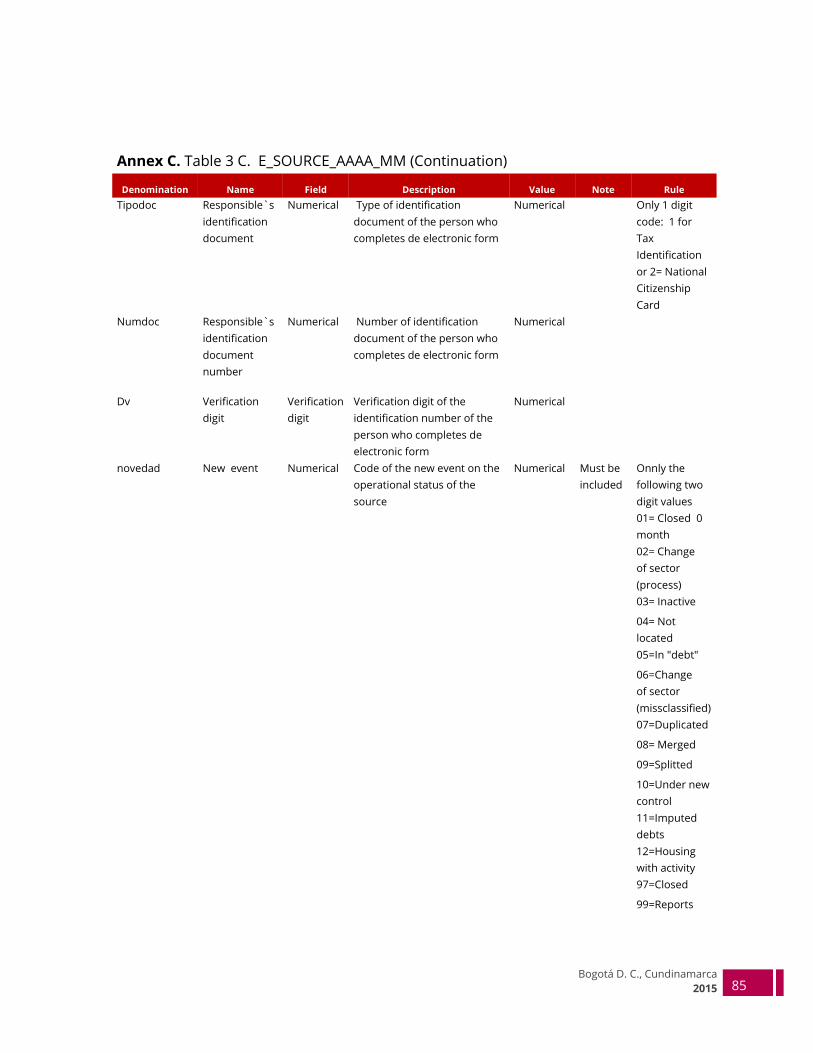
85
Bogotá D. C., Cundinamarca
2015 85
Annex C. Table 3 C. E_SOURCE_AAAA_MM (Continuation)
Denomination Name Field Description Value Note Rule
Tipodoc Responsible`s
identification
document
Numerical Type of identification
document of the person who
completes de electronic form
Numerical Only 1 digit
code: 1 for
Tax
Identification
or 2= National
Citizenship
Card
Numdoc Responsible`s
identification
document
number
Numerical Number of identification
document of the person who
completes de electronic form
Numerical
Dv Verification
digit
Verification
digit
Verification digit of the
identification number of the
person who completes de
electronic form
Numerical
novedad New event Numerical Code of the new event on the
operational status of the
source
Numerical Must be
included
Onnly the
following two
digit values
01= Closed 0
month
02= Change
of sector
(process)
03= Inactive
04= Not
located
05=In "debt"
06=Change
of sector
(missclassified)
07=Duplicated
08= Merged
09=Splitted
10=Under new
control
11=Imputed
debts
12=Housing
with activity
97=Closed
99=Reports
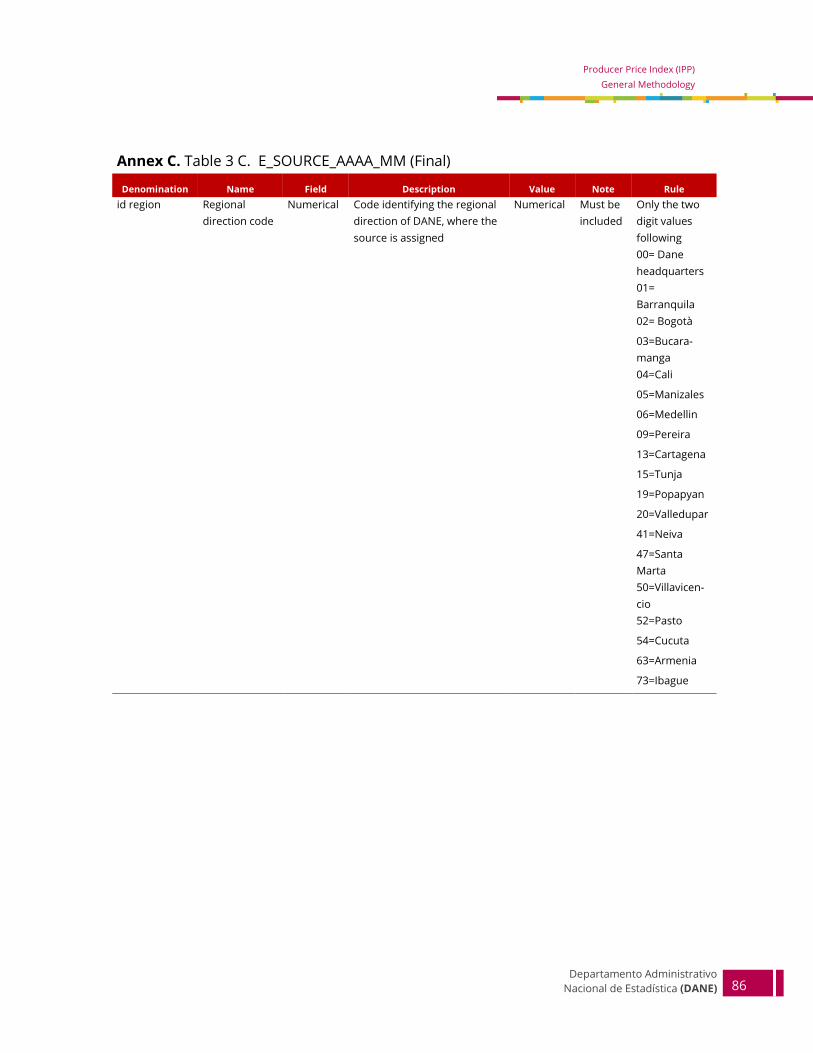
86
Departamento Administrativo
Nacional de Estadística (DANE) 86
Producer Price Index (IPP)
General Methodology
Annex C. Table 3 C. E_SOURCE_AAAA_MM (Final)
Denomination Name Field Description Value Note Rule
id region Regional
direction code
Numerical Code identifying the regional
direction of DANE, where the
source is assigned
Numerical Must be
included
Only the two
digit values
following
00= Dane
headquarters
01=
Barranquila
02= Bogotà
03=Bucara-
manga
04=Cali
05=Manizales
06=Medellin
09=Pereira
13=Cartagena
15=Tunja
19=Popapyan
20=Valledupar
41=Neiva
47=Santa
Marta
50=Villavicen-
cio
52=Pasto
54=Cucuta
63=Armenia
73=Ibague
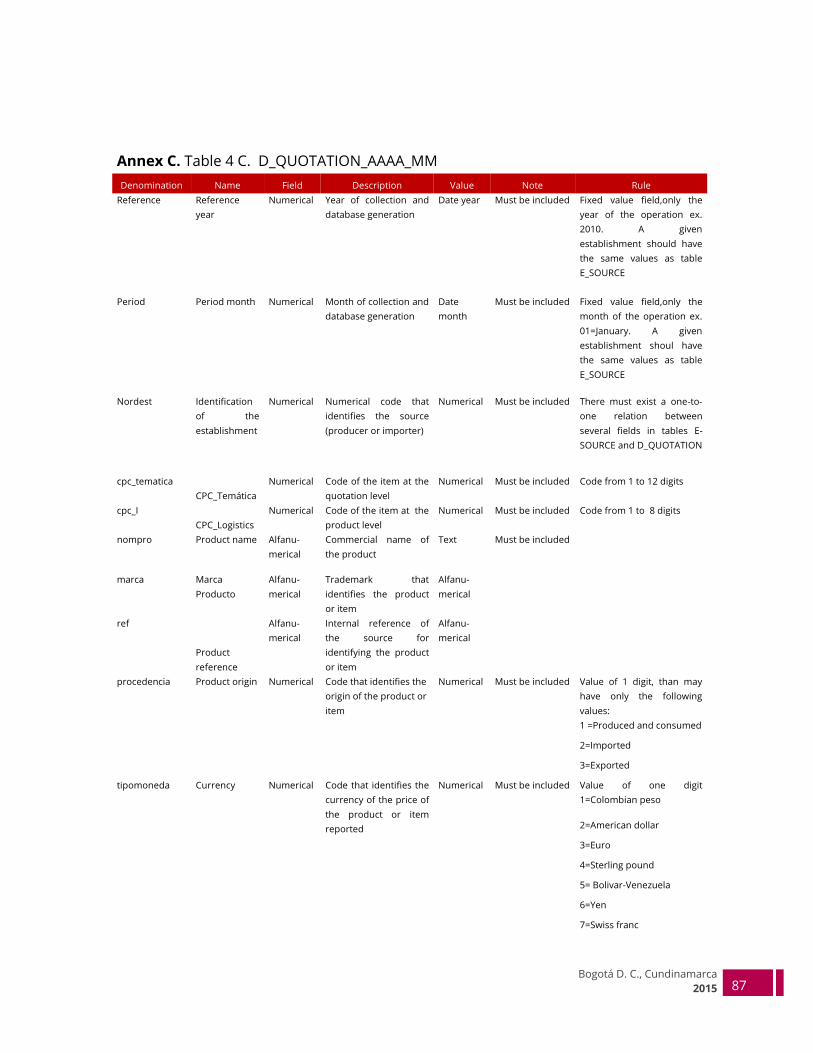
87
Bogotá D. C., Cundinamarca
2015 87
Annex C. Table 4 C. D_QUOTATION_AAAA_MM
Denomination Name Field Description Value Note Rule
Reference Reference
year
Numerical Year of collection and
database generation
Date year Must be included Fixed value field,only the
year of the operation ex.
2010. A given
establishment should have
the same values as table
E_SOURCE
Period Period month Numerical Month of collection and
database generation
Date
month
Must be included Fixed value field,only the
month of the operation ex.
01=January. A given
establishment shoul have
the same values as table
E_SOURCE
Nordest Identification
of the
establishment
Numerical Numerical code that
identifies the source
(producer or importer)
Numerical Must be included There must exist a one-to-
one relation between
several fields in tables E-
SOURCE and D_QUOTATION
cpc_tematica
CPC_Temática
Numerical Code of the item at the
quotation level
Numerical Must be included Code from 1 to 12 digits
cpc_I
CPC_Logistics
Numerical Code of the item at the
product level
Numerical Must be included Code from 1 to 8 digits
nompro Product name Alfanu-
merical
Commercial name of
the product
Text Must be included
marca Marca
Producto
Alfanu-
merical
Trademark that
identifies the product
or item
Alfanu-
merical
ref
Product
reference
Alfanu-
merical
Internal reference of
the source for
identifying the product
or item
Alfanu-
merical
procedencia Product origin Numerical Code that identifies the
origin of the product or
item
Numerical Must be included Value of 1 digit, than may
have only the following
values:
1 =Produced and consumed
2=Imported
3=Exported
tipomoneda Currency Numerical Code that identifies the
currency of the price of
the product or item
reported
Numerical Must be included Value of one digit
1=Colombian peso
2=American dollar
3=Euro
4=Sterling pound
5= Bolivar-Venezuela
6=Yen
7=Swiss franc
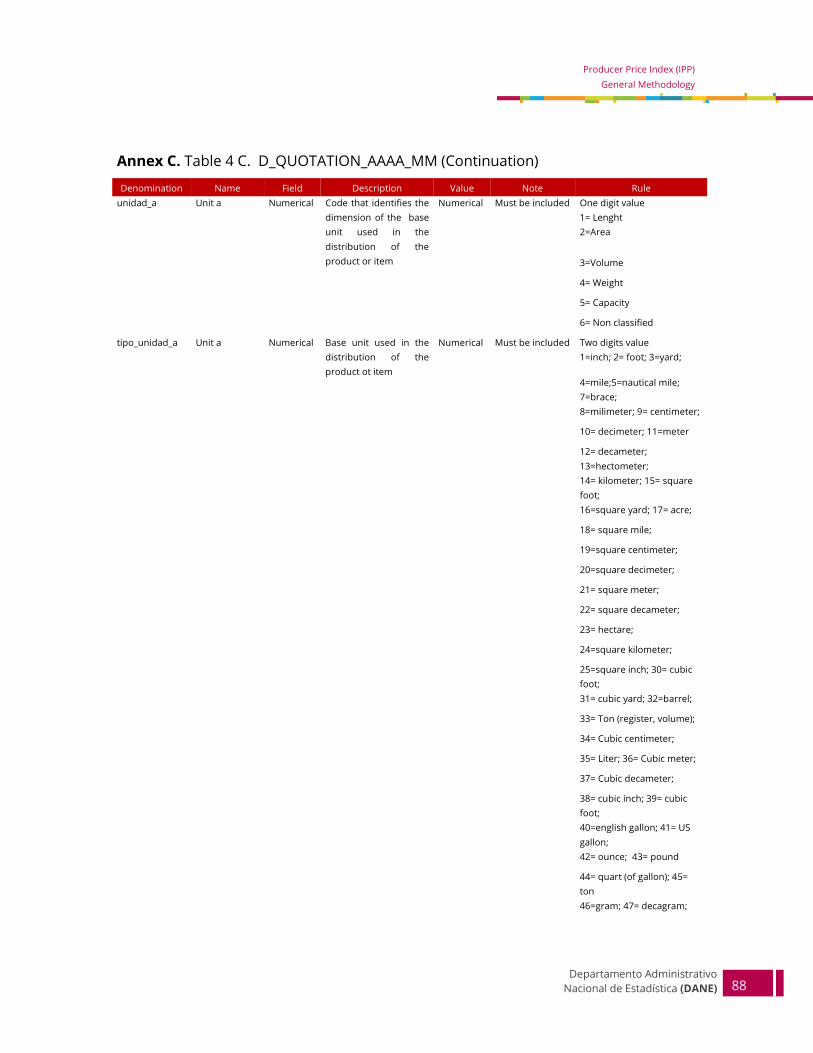
88
Departamento Administrativo
Nacional de Estadística (DANE) 88
Producer Price Index (IPP)
General Methodology
Annex C. Table 4 C. D_QUOTATION_AAAA_MM (Continuation)
Denomination Name Field Description Value Note Rule
unidad_a Unit a Numerical Code that identifies the
dimension of the base
unit used in the
distribution of the
product or item
Numerical Must be included One digit value
1= Lenght
2=Area
3=Volume
4= Weight
5= Capacity
6= Non classified
tipo_unidad_a Unit a Numerical Base unit used in the
distribution of the
product ot item
Numerical Must be included Two digits value
1=inch; 2= foot; 3=yard;
4=mile;5=nautical mile;
7=brace;
8=milimeter; 9= centimeter;
10= decimeter; 11=meter
12= decameter;
13=hectometer;
14= kilometer; 15= square
foot;
16=square yard; 17= acre;
18= square mile;
19=square centimeter;
20=square decimeter;
21= square meter;
22= square decameter;
23= hectare;
24=square kilometer;
25=square inch; 30= cubic
foot;
31= cubic yard; 32=barrel;
33= Ton (register, volume);
34= Cubic centimeter;
35= Liter; 36= Cubic meter;
37= Cubic decameter;
38= cubic inch; 39= cubic
foot;
40=english gallon; 41= US
gallon;
42= ounce; 43= pound
44= quart (of gallon); 45=
ton
46=gram; 47= decagram;

89
Bogotá D. C., Cundinamarca
2015 89
48= hectogram; 49=
kilogram;
51=quart (weight);
54=centiliter; 55= deciliter;
56= liter; 57= cubic meter;
58= parcel; 59=unit; 60=
bottle;
61= box; 62=drum; 63= can;
64=bale; 65= carafe; 66=
flask;
67=small vial; 68= tube;
69=dispenser; 70= package;
71= load; 72=
hundredweight;
73=thousand; 74= tray;
75=roll; 76= basket;
77=plate; 78= form booklet;
79= cone; 80= hank;
81= pot; 82= drum; 83=
block;
84= tin; 85=glass; 86= page;
87= piece; 88= ream;89=
crate;
90=sheet (paper); 91= pair;
92=cardboard
box;97=display;
98=sample; 99= strip;
105= tied sugar loafs;
106=pieces; 108= bag
cantidad_a Quantity unit
a
Numerical Quantity of the base
unit used in the
distribution of the
product ot item
Numerical Must be included Numerical value greater
than 0
unidad_b Unit b Numerical Code that identifies the
second unit used in the
distribution of the
product or item
Numerical Reported only if there is a
value for unit_a.Takes the
same value scheme
tipo_unidad_b Dimension for
unit b
Numerical Dimension of the
second unit used in the
distribution of the
product or item
Numerical Reported only if there is a
value for unit_a.Takes the
same value scheme
cantidad_b Quantity unit
b
Numerical Quantity of the second
unit used in the
distribution of the
product ot item
Numerical Reported only if there is a
value for unit_a.Value
greater than 0

90
Departamento Administrativo
Nacional de Estadística (DANE) 90
Producer Price Index (IPP)
General Methodology
Annex C. Table 4 C. D_QUOTATION_AAAA_MM (Continuation)
Denomination Name Field Description Value Note Rule
unidad_c Unit c Numerical Code that identifies the
third unit used in the
distribution of the
product or item
Numerical
Reported only if there is a
value for unit_a and
unit_b.Takes the same value
scheme
tipo_unidad_c Dimension for
unit c
Numerical Dimension of the third
unit used in the
distribution of the
product or item
Numerical
Reported only if there is a
value for unit_a and
unit_b.Takes the same value
scheme
cantidad_c Quantity unit
c
Numerical Quantity of the third
unit used in the
distribution of the
product ot item
Numerical
Reported only if there is a
value for unit_a and
unit_b.Value greater than 0
unidad_d Unit d Numerical Code that identifies the
fourth unit used in the
distribution of the
product or item
Numerical
Reported only if there is a
value for unit_a and unit_b
and unit_c.Takes the same
value scheme
tipo_unidad_d Dimension for
unit d
Numerical Dimension of the
fourth unit used in the
distribution of the
product or item
Numerical
Reported only if there is a
value for unit_a and unit_b
and unit_c. Takes the same
value scheme
cantidad_d Quantity unit
d
Numerical Quantity of the fourth
unit used in the
distribution of the
product ot item
Numerical
Reported only if there is a
value for unit_a and unit_b
and unit_c. Value greater
than 0
novedadprod Producer new
event
Numerical New event indicated by
the source at the time
of completing the form.
It can not be modified
by the analysts (locally
or at the headquarters)
Numerical Must be included 1 digit field
1= Actual
2=Discontinued
3=Replaced
4= Substitute
5=New
6= Temporarily out of
production
precioant Former price Numerical Price reported by the
source in month
previos to the month of
reference
Numerical Must be included Value greater than 0
precioact Actual price Numerical Current price of the
product or item
Numerical Must be included
Value greater than 0
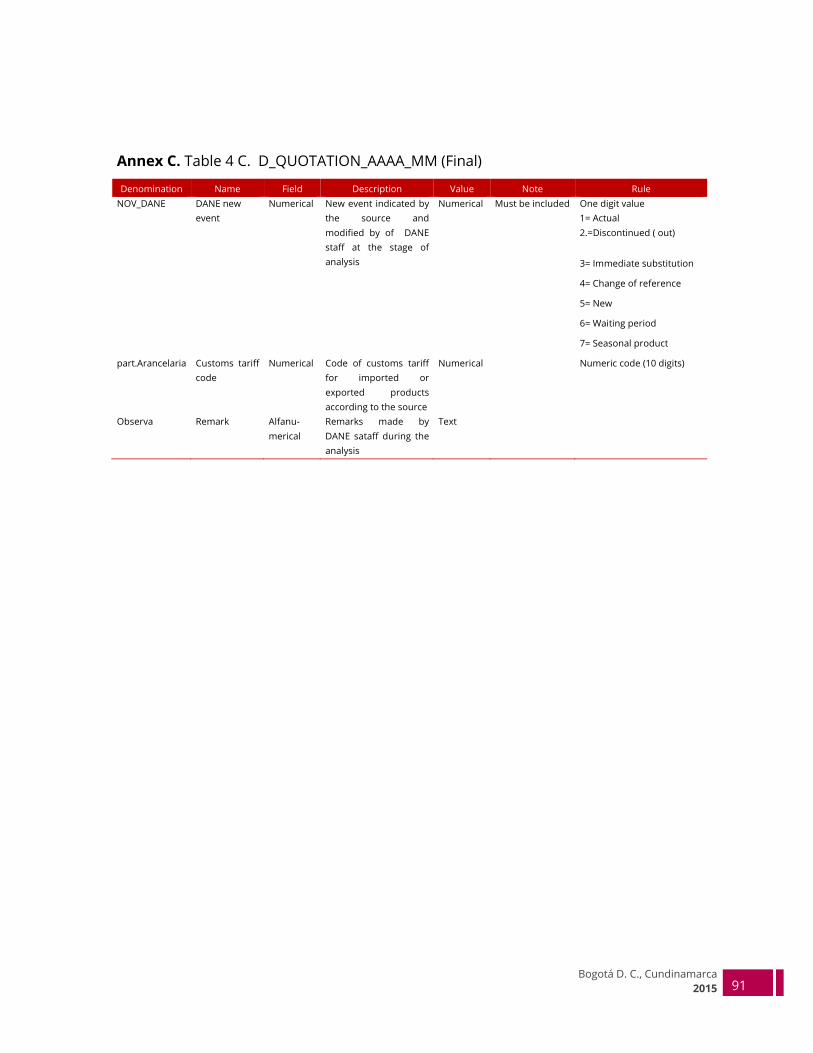
91
Bogotá D. C., Cundinamarca
2015 91
Annex C. Table 4 C. D_QUOTATION_AAAA_MM (Final)
Denomination Name Field Description Value Note Rule
NOV_DANE DANE new
event
Numerical New event indicated by
the source and
modified by of DANE
staff at the stage of
analysis
Numerical Must be included One digit value
1= Actual
2.=Discontinued ( out)
3= Immediate substitution
4= Change of reference
5= New
6= Waiting period
7= Seasonal product
part.Arancelaria Customs tariff
code
Numerical Code of customs tariff
for imported or
exported products
according to the source
Numerical
Numeric code (10 digits)
Observa Remark Alfanu-
merical
Remarks made by
DANE sataff during the
analysis
Text