PRODUCER PRICE INDEX - MANUFACTURING (PPI-M)
19
PRODUCER PRICE INDEX - MANUFACTURING (PPI-M) 1st Quarter 2018 (Base year: 2013 =100) 1. Introduction The Producer Price Index of the Manufacturing sector (PPI-M) measures pure price changes in the effective prices received by producers for that part of their output, which is sold on the domestic market (in Mauritian rupees) and therefore excludes Export Oriented Enterprises. This issue of the Economic and Social Indicators (ESI) presents a series of monthly PPI-M for the period April 2017 to March 2018 and quarterly indices from the second quarter of 2016 to the first quarter of 2018. The weights for the PPI-M have been derived from the results of the 2013 Census of Economic Activities. To facilitate analysis, chain-linked indices with base year 2013 for the period January 2009 to March 2018 are given in tables 4(a) and 4(b). Indices prior to April 2017 are posted on Statistics Mauritius website in the historical series of manufacturing statistics: http://statsmauritius.govmu.org/English/StatsbySubj/Pages/Manufacturing.aspx The methodology used for the computation of PPI-M is annexed. 2. Changes during first quarter 2018 2.1 Manufacturing Sector The Producer Price Index for the manufacturing sector registered an increase of 1.5 points (+1.4%) from 106.1 in December 2017 to 107.6 in March 2018. The main reason for the net increase was higher prices of “Printing and reproduction of recorded media” (+6.5%), “Food products and beverages” (+2.0%) and “Chemicals and chemical products” (+1.6%), partly offset by a decrease in the prices of “Other transport equipment” (-7.3%). On a monthly basis, the PPI-M increased by 0.7 point (+0.7%), 0.4 point (+0.4%) and 0.4 point (+0.4%) in January, February and March 2018 respectively.
Transcript of PRODUCER PRICE INDEX - MANUFACTURING (PPI-M)

PRODUCER PRICE INDEX - MANUFACTURING (PPI-M)
1st Quarter 2018
(Base year: 2013 =100)
1. Introduction
The Producer Price Index of the Manufacturing sector (PPI-M) measures pure price changes
in the effective prices received by producers for that part of their output, which is sold on the
domestic market (in Mauritian rupees) and therefore excludes Export Oriented Enterprises.
This issue of the Economic and Social Indicators (ESI) presents a series of monthly PPI-M
for the period April 2017 to March 2018 and quarterly indices from the second quarter of
2016 to the first quarter of 2018. The weights for the PPI-M have been derived from the
results of the 2013 Census of Economic Activities. To facilitate analysis, chain-linked indices
with base year 2013 for the period January 2009 to March 2018 are given in tables 4(a) and
4(b).
Indices prior to April 2017 are posted on Statistics Mauritius website in the historical series of
manufacturing statistics:
http://statsmauritius.govmu.org/English/StatsbySubj/Pages/Manufacturing.aspx
The methodology used for the computation of PPI-M is annexed.
2. Changes during first quarter 2018
2.1 Manufacturing Sector
The Producer Price Index for the manufacturing sector registered an increase of 1.5 points
(+1.4%) from 106.1 in December 2017 to 107.6 in March 2018. The main reason for the net
increase was higher prices of “Printing and reproduction of recorded media” (+6.5%), “Food
products and beverages” (+2.0%) and “Chemicals and chemical products” (+1.6%), partly
offset by a decrease in the prices of “Other transport equipment” (-7.3%).
On a monthly basis, the PPI-M increased by 0.7 point (+0.7%), 0.4 point (+0.4%) and 0.4
point (+0.4%) in January, February and March 2018 respectively.

2
2.2 Manufacture of Food Products and Beverages
The Producer Price Index for “Food products and beverages”, which accounts for 55.2% of
the total weight, registered a net increase of 2.1 points (+2.0%) from 104.9 in December 2017
to 107.0 in March 2018. This increase was mainly attributable to higher prices of “Grain mill
products” (+14.1%), “Bakery products” (+2.7%) and “Malt liquors and malt including non
alcoholic beer” (+3.9%).
On a monthly basis, the index for this activity group increased by 1.0 point (+1.0 %), 0.6
point (+0.6 %) and 0.5 point (+0.5%) in January, February and March 2018 respectively
(Table 1b).
3. Change in quarterly PPI-M
3.1 Manufacturing Sector

3
The average PPI-M for the first quarter of 2018 stood at 107.2, i.e increasing by 1.3 points
(+1.2%) from 105.9 in the fourth quarter of 2017 (Table 2a). Compared to the corresponding
quarter of 2017, the average PPI-M for the first quarter of 2018 increased by 2.9 points
(+2.8%), mainly explained by higher prices of “Food products and beverages” (+2.6%).
3.2 Manufacture of Food Products and Beverages
Compared to the previous quarter, the index for “Food products and beverages” increased by
1.3 points (+1.2%) in the first quarter of 2018. The index for “Food products” increased by
1.2 points (+1.2%), mainly explained by higher prices of “Grain mill products” (+8.1%) and
“Bakery products” (+1.6%). The index for “Beverages” increased by 1.5% mainly due to an
increase in the prices of “Malt liquors and malt including non alcoholic beer” (+3.9%).
When compared to the first quarter of 2017, the index for “Food products and beverages”
increased by 2.7 points (+2.6%) mainly due to higher prices of “Distilled potable alcoholic
beverages” (+10.3%) and “Malt liquors and malt including non alcoholic beer” (+5.0%),
partly offset by lower prices of “Vegetable and animal oils and fats” (-2.8%).
4. Yearly Index
The average yearly index for the manufacturing sector as a whole was 105.0 in 2017, i.e. 2.3
points (+2.2%) higher than the figure of 102.7 in 2016. The index for the manufacture of
food products and beverages was 104.5 in 2017 compared to 101.5 in 2016, i.e. an increase of
3.0 points (+3.0%).

4
Figure 5 shows that the yearly index for the manufacturing sector as a whole as well as that
for the manufacture of food products and beverages declined in 2009. A steady rise is then
noted from 2010 to 2013. In the year 2014 the indices remained nearly unchanged and then
picked up in 2015. In 2016, the indices remained nearly unchanged and then picked up in
2017.
Statistics Mauritius
Ministry of Finance and Economic Development
Port Louis
June 2018
Contact Persons:
Mr. R. Ajodhea
Statistician
Mr. J. Sowdagur
Senior Statistical Officer
Statistics Mauritius Telephone: (230) 208 1800
L.I.C Centre Fax: (230) 211 4150
J. Kennedy Street
Port Louis

Table 1(a) - Monthly indices of the Manufacturing Sector by industry group, Apr 2017 - Mar 2018
Dec 17
to Jan
18
Jan 18
to Feb
18
Feb 18
to Mar
18
10-33 Total manufacturing 1000 104.3 104.3 105.1 105.1 105.2 105.3 105.4 106.2 106.1 106.8 107.2 107.6 + 0.7 + 0.4 + 0.4
10/11 Food products and beverages 552 103.6 103.8 105.1 104.9 104.9 105.0 105.2 105.2 104.9 105.9 106.5 107.0 + 1.0 + 0.6 + 0.5
13 Textiles 6 103.2 103.2 103.2 103.2 103.2 103.2 103.2 103.2 103.2 103.2 103.2 103.2 + 0.0 + 0.0 + 0.0
14 Wearing apparel 34 118.9 118.9 118.9 118.9 118.9 118.9 118.9 118.9 119.2 119.2 119.2 119.2 + 0.0 + 0.0 + 0.0
15 Leather and related products 3 115.6 115.6 115.6 115.6 115.6 115.6 115.6 115.6 115.6 115.6 115.6 115.6 + 0.0 + 0.0 + 0.0
16/17
Wood and products of wood &
cork; articles of straw and
plaiting materials/ Paper and
paper products
16 102.8 103.4 103.4 105.0 105.0 105.0 105.0 109.8 106.3 106.3 108.3 108.4 + 0.0 + 1.9 + 0.1
18Printing and reproduction of
recorded media28 93.5 92.2 93.4 93.2 93.3 92.5 91.5 91.8 92.0 93.8 92.0 98.0 + 2.0 - 1.9 + 6.5
20Chemicals and chemical
products69 106.8 106.3 106.3 106.3 106.3 106.3 106.4 107.3 107.3 107.4 109.0 109.0 + 0.1 + 1.5 + 0.0
22 Rubber and plastic products 31 109.7 109.7 109.7 110.9 111.8 111.8 111.8 111.8 111.8 111.8 111.8 111.8 + 0.0 + 0.0 + 0.0
23Other non-metallic mineral
products52 102.8 102.8 102.8 102.8 102.8 102.8 102.8 114.7 114.7 114.7 114.8 114.8 + 0.0 + 0.1 + 0.0
24 Basic metals 11 88.5 90.3 90.3 90.3 92.0 93.5 94.4 95.5 95.5 96.0 97.1 97.1 + 0.5 + 1.1 + 0.0
25 Fabricated metal products 76 106.7 106.7 106.7 106.7 106.7 106.7 106.8 106.8 108.0 108.4 108.8 108.4 + 0.4 + 0.4 - 0.4
27 Electrical equipment 2 98.2 98.2 98.2 98.2 98.2 98.2 98.2 98.2 98.2 98.2 98.2 98.2 + 0.0 + 0.0 + 0.0
28 Machinery and equipment, n.e.c 9 88.4 88.4 88.4 88.4 88.4 88.4 88.4 88.4 88.4 88.4 88.4 88.4 + 0.0 + 0.0 + 0.0
29Motor vehicles, trailers and semi-
trailers5 102.6 102.6 102.6 118.5 119.7 119.7 119.7 119.7 119.7 119.7 125.4 125.4 + 0.0 + 4.8 + 0.0
30 Other transport equipment 16 102.0 103.2 104.2 104.3 101.6 102.1 102.6 105.5 104.8 105.7 96.1 97.2 + 0.9 - 9.1 + 1.1
31 Furniture 65 108.8 108.8 108.8 109.3 109.3 109.3 110.2 110.2 110.2 110.2 110.6 110.6 + 0.0 + 0.4 + 0.0
32 Other products 25 95.5 95.5 95.7 95.7 96.4 96.4 96.4 96.7 96.7 98.5 98.7 98.7 + 1.9 + 0.2 + 0.0
Oct
-17
No
v-1
7
Dec
-17
5
NSIC Industry group
Wei
gh
t
Ju
l-1
7
Sep
-17
Ju
n-1
7
Au
g-1
7
Ap
r-1
7
Ma
y-1
7
Ja
n-1
8
Percentage change from
Feb
-18
Ma
r-1
8
Base period: Year 2013=100

Table 1(b) - Monthly indices for Manufacture of Food Products & Beverages by industry group, Apr 2017 - Mar 2018
Dec 17
to Jan
18
Jan 18
to Feb
18
Feb 18
to Mar
18
10-11Total food products &
beverages552 103.6 103.8 105.1 104.9 104.9 105.0 105.2 105.2 104.9 105.9 106.5 107.0 + 1.0 + 0.6 + 0.5
101-108 Food products 375 99.6 99.8 99.4 98.9 99.1 99.2 99.4 99.4 99.0 99.6 100.5 101.2 + 0.6 + 0.9 + 0.7
1010Processing and preserving of
meat97 105.7 106.0 106.3 104.9 106.6 106.6 106.9 106.9 106.9 106.9 106.9 106.6 + 0.0 + 0.0 - 0.3
1020Processing and preserving of
fish, crustaceans & molluscs3 110.0 110.0 110.0 112.4 112.4 112.4 112.4 112.4 112.4 112.4 112.4 112.4 + 0.0 + 0.0 + 0.0
1030Processing and preserving of
fruits and vegetables 10 109.7 110.0 110.2 110.2 110.8 110.8 110.8 110.8 110.8 110.8 110.8 110.8 + 0.0 + 0.0 + 0.0
1040Vegetable and animal oils
and fats30 90.1 90.1 87.6 87.6 87.6 87.6 87.6 87.6 87.6 87.6 87.6 87.6 + 0.0 + 0.0 + 0.0
1050 Dairy products 16 108.6 108.6 108.6 108.6 108.6 108.6 109.2 109.2 109.2 109.2 109.5 109.5 + 0.0 + 0.3 + 0.0
1061 Grain mill products 54 73.4 72.6 71.9 70.8 68.8 69.7 70.5 70.2 70.1 72.1 75.6 80.0 + 2.9 + 4.9 + 5.8
1071 Bakery products 73 112.1 112.1 110.7 110.7 110.7 110.7 110.7 110.7 110.7 110.8 112.9 113.7 + 0.1 + 1.9 + 0.7
10711/
10712Bread/Pastries and cakes 69 111.7 111.7 110.3 110.3 110.3 110.3 110.3 110.3 110.3 110.3 112.5 113.3 + 0.0 + 2.0 + 0.7
10713/
10730
Biscuits and other dry
bakery products4 119.8 119.8 119.8 119.8 119.8 119.8 119.8 119.8 119.8 120.8 120.8 120.8 + 0.8 + 0.0 + 0.0
1074
Macaroni, noodles, couscous
and similar farinaceous
products
11 100.5 105.5 105.5 105.5 105.5 105.5 105.5 105.5 105.5 105.5 105.5 105.5 + 0.0 + 0.0 + 0.0
1075 Prepared meals and dishes 2 114.9 120.2 120.2 120.2 120.2 123.1 121.7 121.7 121.7 121.7 121.7 121.7 + 0.0 + 0.0 + 0.0
1079 Other food products n.e.c 34 110.0 110.5 111.2 112.0 111.6 111.6 111.6 111.6 111.6 111.8 111.8 111.8 + 0.2 + 0.0 + 0.0
10791 Tea 5 82.2 82.2 88.7 93.7 93.7 93.7 93.7 93.7 93.7 93.7 93.7 93.7 + 0.0 + 0.0 + 0.0
10793/
10799
Spices, sauces, condiments
and other food products
n.e.c
29 115.1 115.7 115.3 115.3 114.9 114.9 114.9 114.9 114.9 115.2 115.2 115.1 + 0.3 + 0.0 - 0.1
1080 Animal feed 45 89.3 89.3 89.3 89.3 89.3 89.3 89.3 89.3 86.5 88.3 88.3 88.3 + 2.1 + 0.0 + 0.0
110 Beverages 179 112.2 112.2 117.3 117.3 117.3 117.3 117.3 117.3 117.3 119.1 119.1 119.1 + 1.5 + 0.0 + 0.0
1101Distilled potable alcoholic
beverages65 116.2 116.2 128.2 128.2 128.2 128.2 128.2 128.2 128.2 128.2 128.2 128.2 + 0.0 + 0.0 + 0.0
1102 Wines 13 125.3 125.3 128.8 128.8 128.8 128.8 128.8 128.8 128.8 128.8 128.8 128.8 + 0.0 + 0.0 + 0.0
1103Malt liquors and malt
including non alcoholic beer74 107.8 107.8 109.0 109.0 109.0 109.0 109.0 109.0 109.0 113.2 113.2 113.2 + 3.9 + 0.0 + 0.0
1104Soft drinks, mineral waters
and other bottled waters27 108.1 108.1 108.1 108.1 108.1 108.1 108.1 108.1 108.1 108.1 108.1 108.1 + 0.0 + 0.0 + 0.0
Sep
-17
Ma
r-1
8
Feb
-18
Ju
n-1
7
6
NSIC Industry group
Wei
gh
t
Oct
-17
No
v-1
7
Dec
-17
Au
g-1
7
Ju
l-1
7
Ja
n-1
8
Base period: Year 2013=100
Percentage change from
Ap
r-1
7
Ma
y-1
7

Dec 17
to Jan
18
Jan 18
to Feb
18
Feb 18
to Mar
18
20Chemicals and chemical
products69 106.8 106.3 106.3 106.3 106.3 106.3 106.4 107.3 107.3 107.4 109.0 109.0 + 0.1 + 1.5 + 0.0
2011 Basic chemicals 9 107.4 107.4 107.4 107.4 107.4 107.4 107.4 113.2 113.2 113.2 114.5 114.5 + 0.0 + 1.1 + 0.0
2012Manufacture of fertilizers
and nitrogen compounds8 93.9 89.0 89.0 89.0 89.0 89.0 89.0 89.0 89.0 89.0 89.0 89.0 + 0.0 + 0.0 + 0.0
2022
Paints, varnishes and similar
coatings, printing ink and
mastics
26 110.2 110.2 110.2 110.2 110.2 110.2 110.2 110.2 110.2 110.2 113.5 113.5 + 0.0 + 3.0 + 0.0
2023
Soap and detergents,
cleaning and polishing
preparations, perfumes and
toilet preparations
26 107.3 107.4 107.5 107.5 107.5 107.5 107.9 108.2 108.2 108.4 108.9 108.9 + 0.2 + 0.5 + 0.0
22Rubber and plastic
products31 109.7 109.7 109.7 110.9 111.8 111.8 111.8 111.8 111.8 111.8 111.8 111.8 + 0.0 + 0.0 + 0.0
2211
Rubber tyres and tubes,
retreading and rebuilding of
rubber tyres
5 104.9 104.9 104.9 104.9 110.2 110.2 110.2 110.2 110.2 110.2 110.2 110.2 + 0.0 + 0.0 + 0.0
2220 Plastic products 26 110.6 110.6 110.6 112.1 112.1 112.1 112.1 112.1 112.1 112.1 112.1 112.1 + 0.0 + 0.0 + 0.0
Base period: Year 2013=100
7
Ja
n-1
8
Feb
-18
Ma
r-1
8 Percentage change from
Table 1(c) - Monthly indices for Manufacture of Chemicals and Chemical Products & Rubber and Plastic Products by industry group, Apr 2017 - Mar
2018
NSIC Industry group
Wei
gh
t
Ap
r-1
7
Ma
y-1
7
Oct
-17
No
v-1
7
Dec
-17
Au
g-1
7
Sep
-17
Ju
n-1
7
Ju
l-1
7

Table 2(a) - Quarterly & yearly indices of the Manufacturing sector by industry group, 2nd Quarter 2016 - 1st Quarter 2018
2018
2nd Qr. 3rd Qr. 4th Qr.Year
Average1st Qr. 2nd Qr. 3rd Qr. 4th Qr.
Year
Average1st Qr.
10-33 Total manufacturing 1000 102.0 102.9 104.1 102.7 104.3 104.6 105.2 105.9 105.0 107.2
10/11 Food products and beverages 552 100.3 101.3 103.6 101.5 103.7 104.2 104.9 105.1 104.5 106.4
13 Textiles 6 103.2 103.2 103.2 103.0 103.2 103.2 103.2 103.2 103.2 103.2
14 Wearing apparel 34 118.8 118.8 118.9 118.7 118.9 118.9 118.9 119.0 118.9 119.2
15 Leather and related products 3 103.1 108.1 108.1 105.0 115.6 115.6 115.6 115.6 115.6 115.6
16/17
Wood and products of wood & cork;
articles of straw and plaiting materials/
Paper and paper products
16 97.3 97.8 101.5 98.5 102.8 103.2 105.0 107.0 104.5 107.7
18Printing and reproduction of recorded
media28 100.5 94.4 92.0 96.3 94.0 93.0 93.0 91.8 92.9 94.6
20 Chemicals and chemical products 69 105.2 105.7 106.3 104.5 106.7 106.5 106.3 107.0 106.6 108.4
22 Rubber and plastic products 31 105.6 109.2 109.2 106.7 109.4 109.7 111.5 111.8 110.6 111.8
23 Other non-metallic mineral products 52 102.8 102.8 102.8 102.8 102.8 102.8 102.8 110.7 104.8 114.8
24 Basic metals 11 88.6 86.4 86.1 88.8 88.6 89.7 91.9 95.1 91.3 96.7
25 Fabricated metal products 76 106.0 105.9 105.8 105.9 106.6 106.7 106.7 107.2 106.8 108.5
27 Electrical equipment 2 98.2 98.2 98.2 97.6 98.2 98.2 98.2 98.2 98.2 98.2
28 Machinery and equipment, n.e.c 9 88.4 88.4 88.4 88.4 88.4 88.4 88.4 88.4 88.4 88.4
29Motor vehicles, trailers and semi-
trailers5 102.6 102.6 102.6 102.6 102.6 102.6 119.3 119.7 111.0 123.5
30 Other transport equipment 16 101.4 117.2 109.1 105.2 102.4 103.2 102.7 104.3 103.1 99.6
31 Furniture 65 107.2 107.7 108.7 107.7 108.8 108.8 109.3 110.2 109.2 110.5
32 Other products 25 94.6 94.9 95.5 94.7 95.5 95.6 96.1 96.6 96.0 98.7
8
2016 2017
NSIC Industry group
Wei
gh
t
Base period: Year 2013=100

2018
2nd Qr. 3rd Qr. 4th Qr.Year
Average1st Qr. 2nd Qr. 3rd Qr. 4th Qr.
Year
Average1st Qr.
10-11 Total food products & beverages 552 100.3 101.3 103.6 101.5 103.7 104.2 104.9 105.1 104.5 106.4
101-108 Food products 375 97.4 98.6 99.6 98.5 99.6 99.6 99.1 99.2 99.4 100.4
1010 Processing and preserving of meat 97 99.8 102.2 104.2 101.4 105.2 106.0 106.1 106.9 106.1 106.8
1020Processing and preserving of fish,
crustaceans & molluscs3 110.0 110.0 110.0 108.1 110.0 110.0 112.4 112.4 111.2 112.4
1030Processing and preserving of fruits and
vegetables 10 107.8 108.9 109.5 107.3 109.7 110.0 110.6 110.8 110.2 110.8
1040 Vegetable and animal oils and fats 30 85.4 86.6 86.6 86.6 90.1 89.3 87.6 87.6 88.6 87.6
1050 Dairy products 16 106.9 105.3 106.4 106.4 108.1 108.6 108.6 109.2 108.6 109.4
1061 Grain mill products 54 78.3 78.8 79.5 82.8 74.7 72.6 69.8 70.2 71.8 75.9
1071 Bakery products 73 109.8 111.7 111.9 109.6 112.1 111.6 110.7 110.7 111.3 112.5
10711/
10712Bread/Pastries and cakes 69 109.8 111.5 111.7 109.5 111.7 111.2 110.3 110.3 110.8 112.0
10713/
10730Biscuits and other dry bakery products 4 106.5 112.8 116.1 110.0 119.8 119.8 119.8 119.8 119.8 120.8
1074Macaroni, noodles, couscous and
similar farinaceous products11 100.3 100.5 100.5 100.4 100.5 103.9 105.5 105.5 103.9 105.5
1075 Prepared meals and dishes 2 114.9 114.9 114.9 112.8 114.9 118.4 121.2 121.7 119.0 121.7
1079 Other food products n.e.c 34 105.4 106.6 109.6 105.5 109.9 110.6 111.7 111.6 110.9 111.8
10791 Tea 5 76.1 76.1 80.8 76.1 82.2 84.4 93.7 93.7 88.5 93.7
10793/
10799
Spices, sauces, condiments and other
food products n.e.c29 110.8 112.2 114.9 110.9 115.0 115.4 115.0 114.9 115.1 115.1
1080 Animal feed 45 89.3 89.3 89.3 89.7 89.3 89.3 89.3 88.0 88.9 88.3
110 Beverages 179 106.3 106.9 111.9 107.6 112.2 113.9 117.3 117.3 115.2 119.1
1101 Distilled potable alcoholic beverages 65 107.1 107.1 115.4 109.2 116.2 120.2 128.2 128.2 123.2 128.2
1102 Wines 13 120.3 120.4 125.3 119.5 125.3 126.5 128.8 128.8 127.4 128.8
1103Malt liquors and malt including non
alcoholic beer74 104.5 105.9 107.8 105.4 107.8 108.2 109.0 109.0 108.5 113.2
1104Soft drinks, mineral waters and other
bottled waters27 102.7 102.7 108.1 104.1 108.1 108.1 108.1 108.1 108.1 108.1
9
2016 2017NSIC Industry group
Wei
gh
t
Table 2(b)- Quarterly & yearly indices for the Manufacturing of Food Products & Beverages by industry group, 2nd Quarter 2016 - 1st
Quarter 2018
Base period: Year 2013=100

2018
2nd Qr. 3rd Qr. 4th Qr.Year
Average1st Qr. 2nd Qr. 3rd Qr. 4th Qr.
Year
Average1st Qr.
20Chemicals and chemical
products69 105.2 105.7 106.3 104.5 106.7 106.5 106.3 107.0 106.6 108.4
2011 Basic chemicals 9 104.4 104.4 104.4 103.3 107.0 107.4 107.4 111.3 108.3 114.1
2012Manufacture of fertilizers
and nitrogen compounds8 93.9 93.9 93.9 93.9 93.9 90.6 89.0 89.0 90.6 89.0
2022
Paints, varnishes and
similar coatings, printing
ink and mastics
26 108.4 108.4 110.0 107.3 110.2 110.2 110.2 110.2 110.2 112.4
2023
Soap and detergents,
cleaning and polishing
preparations, perfumes and
toilet preparations
26 105.9 107.1 107.1 105.5 107.3 107.4 107.5 108.1 107.6 108.7
22Rubber and plastic
products31 105.6 109.2 109.2 106.7 109.4 109.7 111.5 111.8 110.6 111.8
2211
Rubber tyres and tubes,
retreading and rebuilding
of rubber tyres
5 100.0 104.9 104.9 102.7 104.9 104.9 108.4 110.2 107.1 110.2
2220 Plastic products 26 106.7 110.0 110.0 107.4 110.2 110.6 112.1 112.1 111.2 112.1
10
Table 2(c) - Quarterly & yearly indices for the Manufacture of Chemicals and Chemical Products & Rubber and Plastic products,
by industry group, 2nd Quarter 2016 to 1st Quarter 2018
2016 2017
NSIC Industry group
Wei
gh
t
Base period: Year 2013=100

Table 3(a) - Quarterly percentage change of the Manufacturing Sector by industry group, 2nd Quarter 2016 - 1st Quarter 2018
1st Qr 17
to
2nd Qr 17
2nd Qr 17
to
3rd Qr 17
3rd Qr 17
to
4th Qr 17
4th Qr 17
to
1st Qr 18
2nd Qr 16
to
2nd Qr 17
3rd Qr 16
to
3rd Qr 17
4th Qr 16
to
4th Qr 17
1st Qr 17
to
1st Qr 18
10-33 Total manufacturing 1000 + 0.3 + 0.6 + 0.7 + 1.2 + 2.5 + 2.2 + 1.7 + 2.8
10/11 Food products and beverages 552 + 0.5 + 0.7 + 0.2 + 1.2 + 3.9 + 3.6 + 1.4 + 2.6
13 Textiles 6 + 0.0 + 0.0 + 0.0 + 0.0 + 0.0 + 0.0 + 0.0 + 0.0
14 Wearing apparel 34 + 0.0 + 0.0 + 0.1 + 0.2 + 0.1 + 0.0 + 0.1 + 0.2
15 Leather and related products 3 + 0.0 + 0.0 + 0.0 + 0.0 + 12.1 + 6.9 + 6.9 + 0.0
16/17
Wood and products of wood & cork; articles
of straw and plaiting materials/ Paper and
paper products
16 + 0.4 + 1.7 + 1.9 + 0.7 + 6.1 + 7.4 + 5.4 + 4.8
18 Printing and reproduction of recorded media 28 - 1.1 + 0.0 - 1.3 + 3.1 - 7.5 - 1.5 - 0.2 + 0.6
20 Chemicals and chemical products 69 - 0.2 - 0.2 + 0.7 + 1.3 + 1.2 + 0.6 + 0.7 + 1.6
22 Rubber and plastic products 31 + 0.3 + 1.6 + 0.3 + 0.0 + 3.9 + 2.1 + 2.4 + 2.2
23 Other non-metallic mineral products 52 + 0.0 + 0.0 + 7.7 + 3.7 + 0.0 + 0.0 + 7.7 + 11.7
24 Basic metals 11 + 1.2 + 2.5 + 3.5 + 1.7 + 1.2 + 6.4 + 10.5 + 9.1
25 Fabricated metal products 76 + 0.1 + 0.0 + 0.5 + 1.2 + 0.7 + 0.8 + 1.3 + 1.8
27 Electrical equipment 2 + 0.0 + 0.0 + 0.0 + 0.0 + 0.0 + 0.0 + 0.0 + 0.0
28 Machinery and equipment, n.e.c 9 + 0.0 + 0.0 + 0.0 + 0.0 + 0.0 + 0.0 + 0.0 + 0.0
29 Motor vehicles, trailers and semi-trailers 5 + 0.0 + 16.3 + 0.3 + 3.2 + 0.0 + 16.3 + 16.7 + 20.4
30 Other transport equipment 16 + 0.8 - 0.5 + 1.6 - 4.5 + 1.8 - 12.4 - 4.4 - 2.7
31 Furniture 65 + 0.0 + 0.5 + 0.8 + 0.3 + 1.5 + 1.5 + 1.4 + 1.6
32 Other products 25 + 0.1 + 0.5 + 0.5 + 2.2 + 1.1 + 1.3 + 1.2 + 3.4
NSIC Industry group
Wei
gh
t
11
Percentage change from
Base period: Year 2013=100

1st Qr 17
to
2nd Qr 17
2nd Qr 17
to
3rd Qr 17
3rd Qr 17
to
4th Qr 17
4th Qr 17
to
1st Qr 18
2nd Qr 16
to
2nd Qr 17
3rd Qr 16
to
3rd Qr 17
4th Qr 16
to
4th Qr 17
1st Qr 17
to
1st Qr 18
10-11 Total food products & beverages 552 + 0.5 + 0.7 + 0.2 + 1.2 + 3.9 + 3.6 + 1.4 + 2.6
101-108 Food products 375 + 0.0 - 0.5 + 0.1 + 1.2 + 2.3 + 0.5 - 0.4 + 0.8
1010 Processing and preserving of meat 97 + 0.8 + 0.1 + 0.8 - 0.1 + 6.2 + 3.8 + 2.6 + 1.5
1020Processing and preserving of fish, crustaceans
& molluscs3 + 0.0 + 2.2 + 0.0 + 0.0 + 0.0 + 2.2 + 2.2 + 2.2
1030Processing and preserving of fruits and
vegetables 10 + 0.3 + 0.5 + 0.2 + 0.0 + 2.0 + 1.6 + 1.2 + 1.0
1040 Vegetable and animal oils and fats 30 - 0.9 - 1.9 + 0.0 + 0.0 + 4.6 + 1.2 + 1.2 - 2.8
1050 Dairy products 16 + 0.5 + 0.0 + 0.6 + 0.2 + 1.6 + 3.1 + 2.6 + 1.2
1061 Grain mill products 54 - 2.8 - 3.9 + 0.6 + 8.1 - 7.3 - 11.4 - 11.7 + 1.6
1071 Bakery products 73 - 0.4 - 0.8 + 0.0 + 1.6 + 1.6 - 0.9 - 1.1 + 0.4
10711/
10712Bread/Pastries and cakes 69 - 0.4 - 0.8 + 0.0 + 1.5 + 1.3 - 1.1 - 1.3 + 0.3
10713/
10730
Biscuits, other dry bakery products, cocoa,
chocolate and sugar confectionery4 + 0.0 + 0.0 + 0.0 + 0.8 + 12.5 + 6.2 + 3.2 + 0.8
1074Macaroni, noodles, couscous and similar
farinaceous products11 + 3.4 + 1.5 + 0.0 + 0.0 + 3.6 + 5.0 + 5.0 + 5.0
1075 Prepared meals and dishes 2 + 3.0 + 2.4 + 0.4 + 0.0 + 3.0 + 5.5 + 5.9 + 5.9
1079 Other food products n.e.c 34 + 0.6 + 1.0 - 0.1 + 0.2 + 4.9 + 4.8 + 1.8 + 1.7
10791 Tea 5 + 2.7 + 11.0 + 0.0 + 0.0 + 10.9 + 23.1 + 16.0 + 14.0
10793/
10799
Spices, sauces, condiments and other food
products n.e.c29 + 0.3 - 0.3 - 0.1 + 0.2 + 4.2 + 2.5 + 0.0 + 0.1
1080 Animal feed 45 + 0.0 + 0.0 - 1.5 + 0.3 + 0.0 + 0.0 - 1.5 - 1.1
110 Beverages 179 + 1.5 + 3.0 + 0.0 + 1.5 + 7.1 + 9.7 + 4.8 + 6.1
1101 Distilled potable alcoholic beverages 65 + 3.4 + 6.7 + 0.0 + 0.0 + 12.2 + 19.7 + 11.1 + 10.3
1102 Wines 13 + 1.0 + 1.8 + 0.0 + 0.0 + 5.2 + 7.0 + 2.8 + 2.8
1103Malt liquors and malt including non alcoholic
beer74 + 0.4 + 0.7 + 0.0 + 3.9 + 3.5 + 2.9 + 1.1 + 5.0
1104Soft drinks, mineral waters and other bottled
waters27 + 0.0 + 0.0 + 0.0 + 0.0 + 5.3 + 5.3 + 0.0 + 0.0
12
NSIC Industry group
Wei
gh
t Percentage change from
Table 3(b) - Quarterly percentage change for Manufacture of Food Products & Beverages by industry group, 2nd Quarter 2016 - 1st Quarter 2018
Base period: Year 2013=100
1st Qr 17
to
2nd Qr 17
2nd Qr 17
to
3rd Qr 17
3rd Qr 17
to
4th Qr 17
4th Qr 17
to
1st Qr 18
2nd Qr 16
to
2nd Qr 17
3rd Qr 16
to
3rd Qr 17
4th Qr 16
to
4th Qr 17
1st Qr 17
to
1st Qr 18
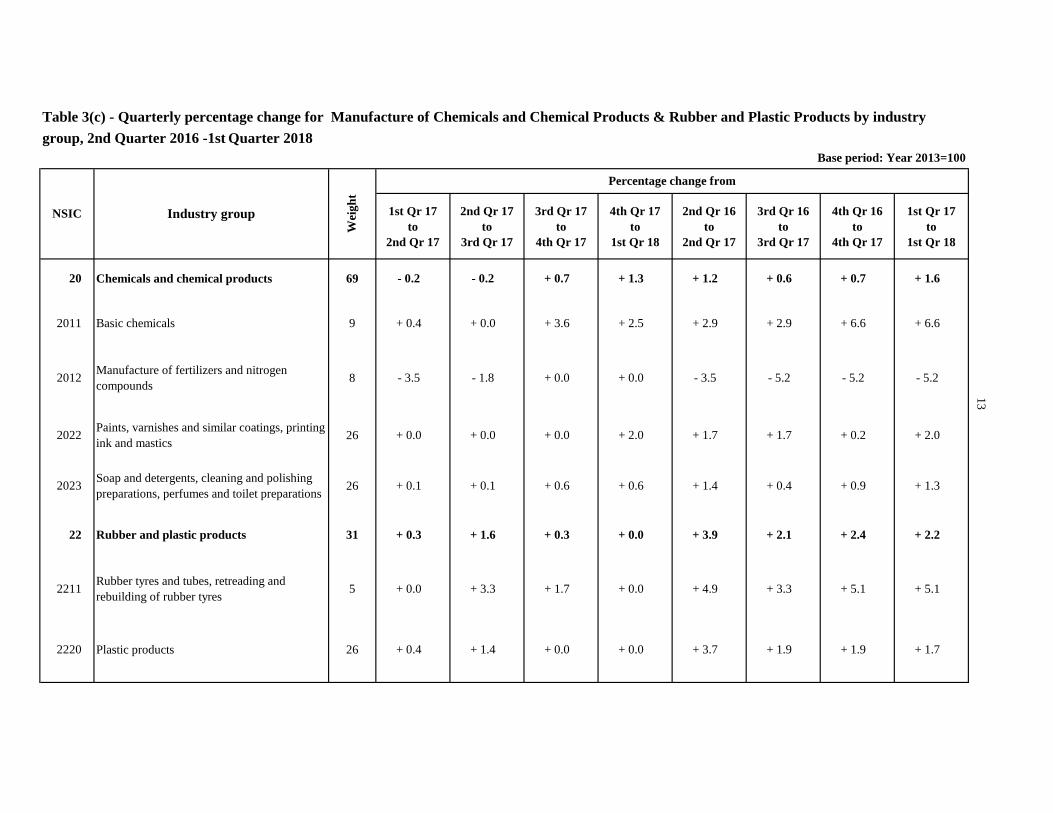
20 Chemicals and chemical products 69 - 0.2 - 0.2 + 0.7 + 1.3 + 1.2 + 0.6 + 0.7 + 1.6
2011 Basic chemicals 9 + 0.4 + 0.0 + 3.6 + 2.5 + 2.9 + 2.9 + 6.6 + 6.6
2012Manufacture of fertilizers and nitrogen
compounds8 - 3.5 - 1.8 + 0.0 + 0.0 - 3.5 - 5.2 - 5.2 - 5.2
2022Paints, varnishes and similar coatings, printing
ink and mastics26 + 0.0 + 0.0 + 0.0 + 2.0 + 1.7 + 1.7 + 0.2 + 2.0
2023Soap and detergents, cleaning and polishing
preparations, perfumes and toilet preparations26 + 0.1 + 0.1 + 0.6 + 0.6 + 1.4 + 0.4 + 0.9 + 1.3
22 Rubber and plastic products 31 + 0.3 + 1.6 + 0.3 + 0.0 + 3.9 + 2.1 + 2.4 + 2.2
2211Rubber tyres and tubes, retreading and
rebuilding of rubber tyres5 + 0.0 + 3.3 + 1.7 + 0.0 + 4.9 + 3.3 + 5.1 + 5.1
2220 Plastic products 26 + 0.4 + 1.4 + 0.0 + 0.0 + 3.7 + 1.9 + 1.9 + 1.7
NSIC Industry group
Wei
gh
t
Percentage change from
Table 3(c) - Quarterly percentage change for Manufacture of Chemicals and Chemical Products & Rubber and Plastic Products by industry
group, 2nd Quarter 2016 -1st Quarter 2018
Base period: Year 2013=100
13

Month 2009 2010 2011 2012 2013 2014 2015 2016 2017 2018
January 85.7 83.2 89.1 94.6 98.6 100.1 101.6 101.6 104.3 106.8
February 83.3 83.3 91.9 94.3 99.9 100.1 101.5 101.5 104.1 107.2
March 83.4 83.4 91.5 93.9 100.0 100.3 102.0 102.0 104.4 107.6
Average 1st Quarter 84.1 83.3 90.8 94.3 99.5 100.2 101.7 101.7 104.3 107.2
April 82.7 84.1 91.5 94.4 100.0 100.4 101.9 101.9 104.3
May 82.0 84.8 91.7 94.5 99.9 100.4 101.9 102.1 104.3
June 81.8 85.3 92.3 94.9 99.8 100.6 102.1 102.2 105.1
Average 2nd
Quarter 82.2 84.7 91.8 94.6 99.9 100.5 102.0 102.0 104.6
July 82.3 85.3 92.6 95.4 100.1 100.6 102.3 102.8 105.1
August 82.3 85.4 92.9 95.5 100.1 100.3 103.1 102.8 105.2
September 82.2 85.2 93.0 95.6 100.0 100.3 103.3 103.0 105.3
Average 3rd
Quarter 82.3 85.3 92.8 95.5 100.1 100.4 102.9 102.9 105.2
October 82.6 85.4 94.1 96.9 100.1 100.4 103.4 103.7 105.4
November 82.7 86.6 94.6 97.8 100.9 100.3 103.5 104.3 106.2
December 82.7 87.1 94.9 97.8 100.5 100.0 103.5 104.3 106.1
Average 4th
Quarter 82.7 86.4 94.6 97.5 100.5 100.2 103.5 104.1 105.9
Yearly average 82.8 84.9 92.5 95.5 100.0 100.3 102.5 102.7 105.0
Annual change (%) - 3.5 + 2.5 + 8.9 + 3.2 + 4.7 + 0.3 + 2.2 + 0.2 + 2.2
Table 4(a) - Comparative monthly and quarterly indices of the Manufacturing Sector, January 2009 - March 2018
Base period: Year 2013=100
14

Month 2009 2010 2011 2012 2013 2014 2015 2016 2017 2018
January 86.2 81.5 85.5 93.5 97.4 100.5 100.5 100.6 103.8 105.9
February 82.6 81.7 90.0 92.4 99.7 100.0 100.3 100.4 103.6 106.5
March 82.7 81.9 89.2 92.4 99.9 100.0 101.0 101.1 103.6 107.0
Average 1st Quarter 83.9 81.7 88.2 92.8 99.0 100.2 100.6 100.7 103.7 106.4
April 82.8 82.0 89.4 93.1 100.0 100.0 101.0 100.1 103.6
May 81.8 82.5 89.4 93.3 100.1 100.1 100.9 100.2 103.8
June 81.4 82.7 89.5 93.8 100.1 100.4 101.2 100.5 105.1
Average 2nd
Quarter 82.0 82.4 89.4 93.4 100.0 100.2 101.1 100.3 104.2
July 81.9 82.7 89.8 94.4 100.2 100.4 101.3 100.9 104.9
August 81.9 82.9 90.1 94.5 100.2 100.1 102.0 101.3 104.9
September 81.6 82.8 90.5 94.4 100.0 100.4 102.6 101.7 105.0
Average 3rd
Quarter 81.8 82.8 90.2 94.4 100.2 100.3 102.0 101.3 104.9
October 81.4 82.5 92.4 95.5 99.8 100.4 102.7 102.9 105.2
November 81.3 84.1 92.9 96.9 101.5 100.5 102.9 103.9 105.2
December 81.2 84.9 93.3 96.8 101.1 99.9 102.8 103.9 104.9
Average 4th
Quarter 81.3 83.9 92.9 96.4 100.8 100.3 102.8 103.6 105.1
Yearly average 82.2 82.7 90.2 94.3 100.0 100.2 101.6 101.5 104.5
Annual change (%) - 5.5 + 0.6 + 9.1 + 4.5 + 6.1 + 0.2 + 1.4 - 0.1 - 2.1
15
Table 4(b) - Comparative monthly and quarterly indices for Manufacture of Food Products & Beverages, January 2009 - March 2018
Base period: Year 2013=100

i
Producer Price Index – Manufacturing (PPI-M)
Methodology for the computation of the PPI-M
1. Definition
The Producer Price Index (PPI-M) measures changes in the effective prices received by
producers in the manufacturing sector for that part of their output, which is sold on the
domestic market. It reflects the price trends of a fixed basket of goods representative of the
output of Non Export Oriented Enterprises (Non EOE).
The concepts and definitions of the PPI-M largely follow the guidelines provided in the “IMF
Producer Price Index Manual Theory and Practice”.
2. Scope
The PPI-M covers both large and small manufacturing establishments falling within divisions
10 to 33 of the National Standard Industrial Classification Rev.2 (NSIC Rev.2), which is an
adapted version of the International Standard Industrial Classification (ISIC) Rev.4. The
establishments are classified under 24 divisions, 71 groups, 137 classes and 240 sub-classes.
The following divisions have been excluded for reasons given in brackets:
(a) Division 12: Manufacture of tobacco products (no longer manufactured in Mauritius)
(b) Division 19: Manufacture of coke and refined petroleum products (weight in the
overall index is not significant)
(c) Division 21: Manufacture of basic pharmaceutical products and pharmaceutical
preparations (weight in the overall index is not significant and change of products is
too dynamic)
(d) Division 26: Manufacture of computers, electronic and optical products (weight in the
overall index is not significant and change of products is too dynamic)
(e) Division 33: Repair and installation of machinery and equipment (weight in the overall
index is not significant and change of products is too dynamic)
The activities covered by the index represent around 97% of the gross output generated by the
Non-EOE manufacturing sector during year 2013.
3. Frame
A list of all large establishments (engaging 10 or more persons) falling under the scope of the
PPI-M was obtained from the 2013 Census of Economic Activities (CEA 2013). For small
establishments (engaging less than 10 persons), the list of respondents at the CEA 2013 was
used.
Annex

ii
4. Selection of establishments (producers)
A sample of 126 large establishments was selected from the list of large manufacturing
establishments. Those establishments were the most important ones in terms of Gross Output
(GO) in their respective 5-digit sub-class.
Small establishments selected for price collection were those engaged in the manufacture of
wearing apparel, fabricated metal products and furniture as these activities were the most
important ones performed by small manufacturing establishments.
Output of the selected establishments represented around 60% of the total GO generated by all
establishments falling within the scope of the PPI-M.
5. Selection of products to be priced
Some 400 products have been selected for pricing. These are the most important ones in terms
of contribution to the gross output or turnover of the selected establishments.
6. Price collection
Prices collected refer to the prices received by producers for the sale of their products on the
local market. The prices exclude all taxes on products, namely excise duty and value added
tax (VAT).
As from July 2013, prices are collected on a monthly basis and provisional monthly indices
are compiled. The overall PPI-M on a monthly basis is published according to SDDS
requirements.
For revised monthly and quarterly indices at division level and in some specific cases at even
lower level, the selected establishments are visited on a quarterly basis and prices of the
selected products are collected for each month of the reference quarter.
7. Updating of weights
7.1 Historical background
Statistics Mauritius first published a Producers Price Index limited to the
“Manufacturing of food products, beverages and tobacco” in March 1994 with 1993 as base
period (1993 = 100). The index was revised in June 2002 to cover all relevant industry groups
of the former Non-EPZ manufacturing sector, based on the results of the 1997 Census of
Economic Activities. The base period was 1998. The base year was subsequently revised to
2003 and 2007, based on the results of the 2002 and 2007 rounds of the Census of Economic
Activities.
The current basket of goods has been updated based on the results of the 2013 Census of
Economic Activities and the index is computed with year 2013 as base period.

iii
8. Index calculation
The PPI-M is computed according to the Laspeyres Formula.
The formula used is given below
100*W
)P
P(*W
Ii
oi
cii
c
Where Ic = Index for current month
Wi = Weight associated with product i
Pci = Price of product i for the current month
Poi = Price for product i for the base period (2013)
The PPI-M is calculated at the 5-digit sub-class level of the NSIC Rev.2 by the above formula.
The lowest level indices are determined as a geometric average of the price relatives of the
basic observations. Indices at the division level (2-digit code) are then derived as a weighted
average of the indices of the products falling within each division. Finally, the overall index is
obtained as a weighted average of the division indices.
9. Uses of PPI
(a) The PPI is a leading indicator of the future status of inflation. Movement of
PPI is usually indicative of a similar change of part of the Consumer Price Index
(CPI). PPI can also be used in the economic analysis of inflation transmission
process.
(b) It provides specific price deflators for the computation of national accounts at
constant prices in order to measure real growth
(c) It is helpful in the formulation of contract agreement. It can be used as an
escalation clause to protect buyers and sellers against inflation or deflation.
(d) PPI is also used in econometric models, in forecasting and in inventory
accounting.
10. Missing prices
In case of temporarily missing prices for products, the change in the prices are assumed to be
following the same trend as the average price in the 5-digit sub-class or of a higher level.

iv
11. Treatment of product permanently disappeared
Products may disappear permanently for various reasons. The products may disappear from
the market because new products have been introduced or the establishments from which the
price has been collected have stopped selling the product. When a product disappears
permanently, a replacement product of a similar nature will be included in the index.
12. Treatment of quality change
The index is a measure of only “PURE” price changes and should as far as possible measure
the price changes of the same products. Hence, the products must not be affected by quality
change. If the change is due to quality, an estimate of the proportion of the change attributed
to the quality element is made and adjustment done accordingly.
13. Reliability of the PPI-M
The statistical accuracy of the PPI-M depends heavily on the quality of information provided
by the selected establishments (respondents). This office places great emphasis on the need for
reporting effective selling prices, i.e. prices after discounts and other price deductions rather
than the list or catalogue prices.
Standard editing procedures are used to validate the accuracy and reliability of the data.
Collected prices are validated during the field work and inconsistencies discussed with the
respondents and corrected.
Further computer checks are made at office level when compiling the indices. Comparison is
also made with the CPI and with the import/export price indices. Systematic analyzes of the
source data are made in the context of weight and base year revisions that occur every five
years.