Produce for Better Health Foundation · Positioning Case Study: ... ©2008 Produce for Better...
85
©2008 Produce for Better Health Foundation Produce for Better Health Foundation
Transcript of Produce for Better Health Foundation · Positioning Case Study: ... ©2008 Produce for Better...

©2008 Produce for Better Health Foundation
Produce for Better Health Foundation

©2008 Produce for Better Health Foundation
THE “PROBLEM”
©2008 Produce for Better Health Foundation
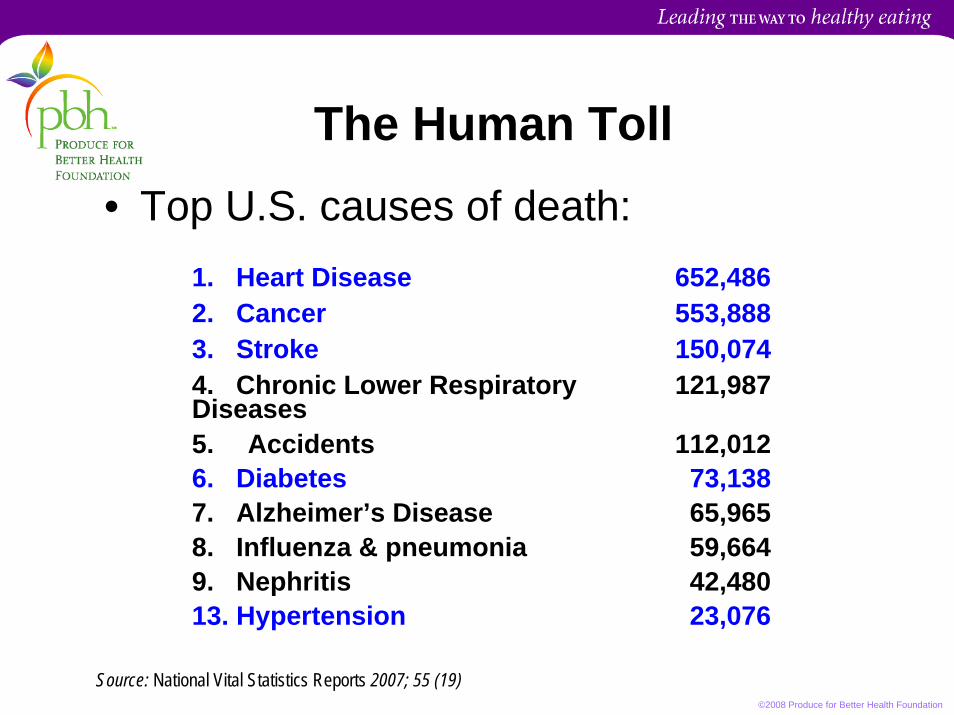
The Human Toll• Top U.S. causes of death:
1. Heart Disease 652,4862. Cancer 553,8883. Stroke 150,0744. Chronic Lower Respiratory Diseases
121,987
5. Accidents 112,0126. Diabetes 73,1387. Alzheimer’s Disease 65,9658. Influenza & pneumonia 59,6649. Nephritis 42,48013. Hypertension 23,076
Source: National Vital Statistics Reports 2007; 55 (19)

©2008 Produce for Better Health Foundation
Factors Contributing to Death
1990 2000 PCT Change# Deaths
1. Tobacco Use 400,000 435,000 9%
2. Diet & Inactivity 300,000 400,000 33%
3. Alcohol Misuse 100,000 85,000 -15%

©2008 Produce for Better Health Foundation
Leading Causes of Death
6% 19%
75%
Other Chronic Diseases
Infectious Diseases

©2008 Produce for Better Health Foundation
Spending on Prevention vs. Treatment
National spending for population-based prevention
Population-based Prevention ($26 billion)
Health Care Expenditures ($1.27 trillion)

©2008 Produce for Better Health Foundation
Factors influencing gain in life expectancy: past 100 years
Public Health and Preventive Measures 83.4%+ 25 Years to Life
Curative Measures 16.6%+ 5 Years to Life

Obesity Trends Among U.S. AdultsBRFSS, 1985

Obesity Trends Among U.S. AdultsBRFSS, 1986

Obesity Trends Among U.S. AdultsBRFSS, 1987

Obesity Trends Among U.S. AdultsBRFSS, 1988

Obesity Trends Among U.S. AdultsBRFSS, 1989

Obesity Trends Among U.S. AdultsBRFSS, 1990

Obesity Trends Among U.S. AdultsBRFSS, 1991

Obesity Trends Among U.S. AdultsBRFSS, 1992

Obesity Trends Among U.S. AdultsBRFSS, 1993

Obesity Trends Among U.S. AdultsBRFSS, 1994

Obesity Trends Among U.S. AdultsBRFSS, 1995

Obesity Trends Among U.S. AdultsBRFSS, 1996

Obesity Trends Among U.S. AdultsBRFSS, 1997

Obesity Trends Among U.S. AdultsBRFSS, 1998

Obesity Trends Among U.S. AdultsBRFSS, 1999

Obesity Trends Among U.S. AdultsBRFSS, 2000

Obesity Trends Among U.S. AdultsBRFSS, 2001

Obesity Trends Among U.S. AdultsBRFSS, 2002
(*BMI ≥30, or ~ 30 lbs overweight for 5’4” person)

Obesity Trends Among U.S. AdultsBRFSS, 2003

Obesity Trends Among U.S. AdultsBRFSS, 2004

Obesity Trends Among U.S. AdultsBRFSS, 2005
No Data <10% 10%–14% 15%–19% 20%–24% 25%–29% ≥30%

Obesity Trends Among U.S. AdultsBRFSS, 2006
No Data <10% 10%–14% 15%–19% 20%–24% 25%–29% ≥30%

©2008 Produce for Better Health Foundation
Overweight Children Ages: 6-11 & 12-19
0%
2%
4%
6%
8%
10%
12%
14%
16%
6-11 Years 12-19 Years
1963-19701976-19801999-20004.2%
6.5%4.6%
5.0%
15.5%15.3%
CDC, National Center for Health Statistics, Health, US, 2003

©2008 Produce for Better Health Foundation
“Today’s kids may be the first generation in history whose life expectancy is projected to be less than that of their parents.”
- Dr. David Katz, YaleMarch 2004

©2008 Produce for Better Health Foundation
OUR PART IN THE SOLUTION

©2008 Produce for Better Health Foundation
Fruits and Vegetables Play Preventative Role In …
CancerHeart DiseaseStrokeHypertensionBirth DefectsCataractsObesity
DiverticulosisDiabetes MellitusCOPD OsteoporosisAlzheimer’sSkin Wrinkling

©2008 Produce for Better Health Foundation
Variety of Protective Componentsin Fruits and Vegetables
• Antioxidants• Folate• Potassium• Fiber• Flavonoids• Phytochemicals• No fat, saturated fat,
trans fats, or cholesterol
• Low in sodium and calories

©2008 Produce for Better Health Foundation
Yet consumers are overweight and not
eating enough fruit/vegetables…
WHY??

©2008 Produce for Better Health Foundation
Evolution?
The Economist

©2008 Produce for Better Health Foundation
Advertising/Marketing Expenditures?
• McDonald’s $1,748,300,000• General Mills $ 920,500,000• Kellogg Company $ 765,100,000• Coca-Cola Company $ 740,800,000• Pepsi (PepsiCo) $ 191,772,000• Quaker (PepsiCo) $ 182,924,000• Post (Kraft) $ 104,792,000• Oscar Mayer (Kraft) $ 46,510,000• CDC’s Division of Nutr & PA $ 42,000,000• Lean Cuisine (Nestle) $ 36,707,000• Tostitos (PepsiCo) $ 35,332,000• Tropicana (PepsiCo) $ 17,770,000• Ragu (Unilever) $ 11,636,000• PBH’s Budget $ 5,700,000
Advertising Age, Dec 31, 2007

©2008 Produce for Better Health Foundation
Menu Choices?

©2008 Produce for Better Health Foundation
Accessibility?

©2008 Produce for Better Health Foundation
Only 4.5% of USDA's Spending to Promote Production and Consumption of Major Commodities Was Used for Promotion of Fruits and Vegetables in FY 1999.
$1,281,278,420
$3,162,005,000$5,189,297,440
$452,116,000
DairyFood GrainsMeat, Fish, EggsFruits, Vegetables
Government Support?

©2008 Produce for Better Health Foundation
Women Working Outside the Home?
0
10
20
30
40
50
60
70
1970 2004
59%
43%

©2008 Produce for Better Health Foundation
37 3735 36
40 4042
4446
4846 47
90 91 92 93 94 95 96 97 98 99 '00 '01
“Convenience is most important in the foods I eat.”Percent that Agree
Source: The NPD Group's National Eating Trends® Service
Drive for Convenience?

©2008 Produce for Better Health Foundation
OUR OPPORTUNITY

©2008 Produce for Better Health Foundation
Our Opportunity
• Consumer interest in nutrition & health• National Nutrition Policy
– WIC Program– School Wellness Policies– Fresh F/V Snack Program– School Lunch/Breakfast
• Profitable for supermarkets• International Flavors

©2008 Produce for Better Health Foundation
ABOUT PBH

©2008 Produce for Better Health Foundation
History
• 1988 5 A Day in California• 1991 PBH incorporated; P/P/P with NCI;
5 A Day Launched Nationally• 2000 Expanded into Alliance• 2005 NCI to CDC• 2007 Fruits & Veggies—More Matters

©2008 Produce for Better Health Foundation
47
• American Cancer Society (ACS)
• American Diabetes Association (ADA)
• American Heart Association (AHA)
• National Alliance for Nutrition & Activity (NANA)
• California Department of Health Services
• National Council of Fruit & Vegetable Nutrition Coordinators
• Centers for Disease Control & Prevention (CDC)*
• National Cancer Institute (NCI)
• US Department of Agriculture: (USDA)
• Produce for Better Health Foundation (PBH)*
• Produce Marketing Association (PMA)
• United Fresh Produce Association
• American Frozen Food Institute (AFFI)
• Canned Food Alliance
National Fruit & Vegetable Alliance Steering Committee

©2008 Produce for Better Health Foundation
National Action Plan

©2008 Produce for Better Health Foundation
PBH Mission
To lead people to eat more fruits and vegetables because it matters for their
better health.

©2008 Produce for Better Health Foundation
PBH’s Role
To cultivate partners, industry, consumer influencers and thought
leaders as advocates for Fruits & Veggies–More Matters
&To change behavior through moms.

©2008 Produce for Better Health Foundation
Change Behavior Through Moms
2. Secure sustainablefunding source for PBH(Sustainability)
1. Implement comprehensive Fruits & Veggies—More Matters marketing, communications, and education effort targeted to moms (Message)

©2008 Produce for Better Health Foundation
I. Implement comprehensive Fruits & Veggies—More Matters
marketing, communications, and education effort targeted to
Moms.
“Message”

©2008 Produce for Better Health Foundation
Replacing 5 A Day is…

©2008 Produce for Better Health Foundation
Research with Momsserve up the passion thrive
appetite for life primed to perform
pre-emptivepreventative
emotional
rational

©2008 Produce for Better Health Foundation
The Ultimate Emotional BenefitMom’s internal gratification from meeting her
responsibility to help her family be at their best

©2008 Produce for Better Health Foundation
Positioning Case Study: Don’t Mess with Texas
• in mid-1980s, Texas DOT was concerned about highway littering in state
• chief culprits were males 18-34 (macho identity)• strategy was a tough-talking campaign that
appealed to state identification• between 1986-1991 highway litter reduced by
72% (Institute for Applied Research)

©2008 Produce for Better Health Foundation
Comparing Then and Now
functionally-basedinstructionalconstantly changinglogoawareness
emotionally-basedinspirationala stake in the ground
brandhow to

©2008 Produce for Better Health Foundation
Comparing Then and Now
perceived freshproduce departmentrecipes = packagedconsumer in-directpublic/private
all formsentire supermarketrecipes = prepackaged
consumer interactivepublic/private

©2008 Produce for Better Health Foundation
Comparing Then and Now
publichealth authority
licenses public healthstate training & assistance
message dissemination
privatebrand managerlicenses industry
industry assistancemessage dissemination

©2008 Produce for Better Health Foundation
Public Health Partners
National Council of State Fruit and Vegetable Nutrition Coordinators

©2008 Produce for Better Health Foundation
Grass-roots Involvement
Florida
Hawaii
Texas
Idaho
North Dakota

©2008 Produce for Better Health Foundation
AholdAssociated Food StoresAssociated Grocers, LA
AWGBig Y
Bozzuto’sBrookshire
Clemen’sCoburn’s
DierbergsEW JamesFelpauschFood Lion
Giant EagleHarris Teeter
HEB Hy-Vee
Key Food StoresKrogerLowes
To Date: >24,000 StoresMeijerNash-FinchPathmarkPrice Chopper Publix Raley’sRedner’sRoche BrosSafewaySavemartSchnuck ShopRiteSpartanSuperValuTimes UnitedWal-MartWegman’sWeis + Others
Retail Partners

©2008 Produce for Better Health Foundation
Supplier Partners
To Date: >650 SKUs

©2008 Produce for Better Health Foundation
Media

©2008 Produce for Better Health Foundation
Educators/health professionals

©2008 Produce for Better Health Foundation
Millions of Moms

©2008 Produce for Better Health Foundation
fruitsandveggiesmorematters.org
Mom-2-Mom Chatroom for Idea Exchange & Guest Speakers
Fruits & Veggies Database
Recipe and Shopping Tips
Children Activity Downloadables
Opt-in for Bi-Monthly Updates
News and Information Several Rotating Topics

©2008 Produce for Better Health Foundation
II. Secure sustainable funding source for PBH.
“Sustainability”
©2008 Produce for Better Health Foundation
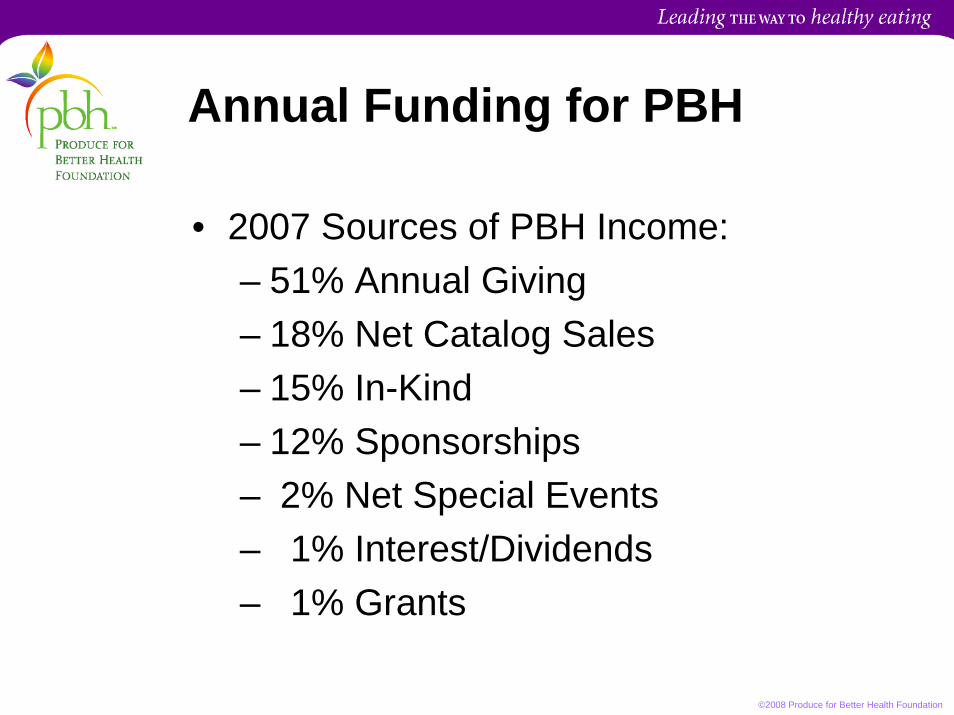
• 2007 Sources of PBH Income:– 51% Annual Giving– 18% Net Catalog Sales– 15% In-Kind– 12% Sponsorships– 2% Net Special Events– 1% Interest/Dividends– 1% Grants
Annual Funding for PBH

©2008 Produce for Better Health Foundation
Sponsorships
• Retail Matters Newsletter• PBH Direct!• Annual Report• Spring Board of Trustees Meeting• Celebration of Life Dinner/Auction/Dance• Produce First American Menus Initiative• Web Streaming Video• Research

©2008 Produce for Better Health Foundation
Education Material Sales

©2008 Produce for Better Health Foundation
Campaign for Children’s Health
• Consumer Web• Educational Materials• Research• National Action Plan• Endowment

©2008 Produce for Better Health Foundation
ABOUT THE BOARD

©2008 Produce for Better Health Foundation
Board/Committee Structure
Executive Committee
Financial Advisory
Consumer Marketing & Communications
Nominating
Development
Audit
Dinner/Auction
Research
Channel Mktg
Membership
Campaign
Board

©2008 Produce for Better Health Foundation
Reading List
• Programs & Activities (Section 2)• 2008 Business Plan (Section 2)• Strategic Plan (Section 2)• By-Laws and Board Policies &
Procedures Manual (Section 10)

©2008 Produce for Better Health Foundation
Committee Participation
• Nominating process• Observer procedure

©2008 Produce for Better Health Foundation
Board Roles and
Responsibilities

©2008 Produce for Better Health Foundation
Key Roles of the Board
• Set Organizational Direction• Provide Oversight• Ensure Necessary Resources

©2008 Produce for Better Health Foundation
Individual Board MemberResponsibilities
Serve as ambassadors to the community
Volunteer services outside of board work
Work on committees, subcommitteesand task forces
Participate in organization governance

©2008 Produce for Better Health Foundation
Participate in Fund-Raising Activities
Make a financial contribution
Provide names of potential donors
Encourage others to join
Attend fundraising events
Act as a resource to development office

©2008 Produce for Better Health Foundation
OUR OPPORTUNITY…

©2008 Produce for Better Health Foundation
Fruit/
Vegetable
Consumption
Healthy Eating & Physical Activity
Disease Prevention
Businesses/Public Health Community
NANA
PBH / Partners / Industry
Change Drivers
PREVENTION
•Don’t Smoke
•Healthy Eating
•Exercise
•Immunizations
•Screening
•Manage stress
•Adequate rest
•Sunscreen
•Seatbelts
•Helmets

©2008 Produce for Better Health Foundation
• Strong Link: Fruits/Vegetables/Health• Aging Population • Obesity Epidemic• Rising Health Care Costs• Nat’l Nutrition Policy Supports F/V’s• International Flavors• Fruits & Veggies—More Matters®
• Industry/Public Health Alliance
Our Opportunity

©2008 Produce for Better Health Foundation
Questions & Discussion
• All forms
• Fruit/vegetable consumption levels
• Focus on Gen X moms
• Retail vs. foodservice

©2008 Produce for Better Health Foundation
Produce for Better Health Foundation5341 Limestone RoadWilmington, DE 19808
Tel. 302-235-2329 Fax 302-235-5555www.5aday.org