Proceedings of the Second Alfred O. Nier Symposium on ...
480
CA9600722 - CA9600749 AECL-11342 Proceedings of the Second Alfred O. Nier Symposium on Inorganic Mass Spectrometry Sponsored by the Los Alamos National Laboratoiy, the Chalk River Laboratory and the Idaho National Engineering Laboratory May 9-12 1994, Durango, Colorado January 1996 Janvier VOL 2 7 f t
Transcript of Proceedings of the Second Alfred O. Nier Symposium on ...

CA9600722 - CA9600749
AECL-11342
Proceedings of the Second Alfred O. Nier Symposiumon Inorganic Mass Spectrometry
Sponsored by the Los Alamos National Laboratoiy,the Chalk River Laboratory and the Idaho NationalEngineering Laboratory
May 9-12 1994, Durango, Colorado
January 1996 JanvierVOL 27f t

AECL-11342
Proceedings of the Second Alfred O. Nier Symposiumon Inorganic Mass Spectrometry
Durango, Colorado1994 May 9-12
compiled and edited byLawrence W. Green
AECLChalk River Laboratory
Chalk River, Ontario KOJ 1J01996 January

Acknowledgements
Symposium Organizing Committee
D.J. RokopJ.E. DelmoreL.W. Green
Symposium Coordination
L HerraraE. RoybalS. Salazar
Word Processing
M. Schwantz

AECL-11342
CONTENTS
The Alfred O. Nier Symposium (L.W. Green) i
Dedication to Alfred O. Nier (J.R. De Laeter) ii
THERMAL IONIZATION MASS SPECTROMETRY 1
Applications 1
New Developments and Applications in Negative Thermal lonization Mass Spectrometry 2(K.G. Neumann)
Tellurium: A Mass Spectrometrist's Delight(J.R. De Laeter, K.J.R. Rosman and R.D. Loss) 8
The Mechanism of Bt Production from Bismuth Borosilicate(T. Huett, J.C. Ingram and J.E. Delmore) 14
Total Evaporation Measurements, a Key to More Accurate Mass Spectrometry? 19(R.K. Fiedler)
Total Evaporation in Thermal lonization Mass Spectrometry 24(E.L. Callis and J.H. Cappis)
Determination of Trace Iron in Zirconium by Isotope Dilution Thermal lonization Mass 27Spectrometry(N.L. Elliot, MA Campbell and LW. Green)
IDMS of FeO(OH) Extracted from Blood Digests for Studies of Iron Metabolism in Humans 30(N.E. Vieira, A.L. Yergey and S.A. Abrams)
Characterization of Uranium in Surface-Waters Collected at the Rocky Flats Facility 34(D.W. Efurd, D.J. Rokop, R.D. Aguilar, F.R. Roensch, R.E. Perrin and J.C. Banar)
Extraction and Measurement of Subpicogram Quantities of Technetium from Geologic 38and Other Matrices(P.R. Dixon, D.J. Rokop, J.T. Fabryka-Martin and D.B. Curtis)
Instrumentation 42
A High Efficiency Thermal lonization Source Adapted to Mass Spectrometers 43(E.P. Chamberlin and J.A. Olivares)

AECL-11342
CONTENTS(continued)
Instrumental Improvements on a Two Stage (B-RPQ) Mass Spectrometer with Very 49High Abundance Sensitivity(J.B. Schwieters and P. Bach)
Performance Indications for TIMS with a Deceleration Lens System and Post- 57Deceleration Detector Selection(P. van Calsteren, D. Wright and S. Turner)
Evaluation of a L.A.N.L Designed Turret 64(J. Banar, R.D. Aguilar, P.R. Dixon, R.E. Perrin and D.J. Rokop)
INDUCTIVELY COUPLED PLASMA AND GLOW DISCHARGE MASS 69SPECTROMETRY
High Accuracy Determination of Trace Elements in NIST Standard Reference 70Materials by Isotope Dilution ICP-MS(P.J. Paulsen and E.S. Beary)
Multi-element Isotope Dilution Analyses Using ICP-MS(A.M. Volpe) 75
ICP Magnetic Sector Multiple Collector Mass Spectrometry and the Precise 80Measurement of Isotopic Compositions using Nebulization of Solutions andLaser Ablation of Solids(A.N. Halliday, D.-C. Lee, J.N. Christensen, W. Yi, CM. Hall, C.E. Jones,D.A.H. Teagle, A.J. Walder and P.A. Freedman)
Application of Glow Discharge Mass Spectrometry to the Measurement of 84Isotope Ratios(L.R. Riciputi, D.C. Duckworth, CM. Barshick and D.H. Smith)
GASES 89
Unconventional Stable Isotope Mass Spectrometry of Fe, Pt and W via Gas Source 90Mass Spectrometry(P.D.P. Taylor, S. Valkiers, P. De Bievre, U. Flegel, and Th. Kruck)
A Hot Vacuum Extraction Mass Spectrometric System for Determination of H&D 95in Zirconium(L.W. Green, G.A. Bickel, P.K. Leeson, M.W.D. James, P.K. Leeson, T.G. Lamarcheand H. Michel)
AECL-11342
CONTENTS(continued)
A High Efficiency Ion Source for Kr and Xe Isotopic Measurements 100(J. Poths and E.P. Chamberlin)
LASER RESONANCE IONIZATION 105
Resonant Laser Ablation: Mechanisms and Applications 106(J.E. Anderson, R. Bodla, G.C. Eiden, N.S. Nogarand C.H. Smith)
Hydrogen Determination in Zirconium Alloys by Laser Ablation and Resonance 111lonization Mass Spectrometry(G.A. Bickel, Z.H. Walker, F.C. Sopchyshyn and LW. Green)
Measurement of Sample Charging during Sputtering of Ill-V Materials and Devices 115(S.W. Downey and A.B. Emerson)
Uftrasensif/ve Detect/on of Krypton-85 Gas using Photon Burst Mass Spectrometry 121(C.S. Hansen, J. Pan, W.M. Fairbank, Jr., H. Oona, E.P. Chamberlin, N.S. Nogarand B.L. Feary)
GENERAL 124
SIMS Studies of the Corrosion of Zirconium 125(R.L. Tapping, P.K. Chan, P.R. Norton and C-S. Zhang)
Accelerator Mass Spectrometry: Practice and Prospects 130(H.R. Andrews)
Isotopes at CEA 136(J.R. Cesario)
SYMPOSIUM SCHEDULE 142

- i - AECL-11342
The Alfred O. Nier Symposium
The Alfred O. Nier Symposium on Inorganic Mass Spectrometry was founded in 1991to bring together scientists in the field of isotope and elemental analysis using massspectrometers. It was named after Al Nier because of his pioneering work andleadership in this field, and attracts scientists from many disciplines: nuclearchemistry, environmental monitoring, geochronology, life sciences, astronomy, andclimatology, all of which Professor Nier made significant contributions to. At the firstsymposium, which was also an 80th birthday celebration for Al, he presented hisretirement project "Helium and Neon Isotopes in Extraterrestrial Dust Particles" and, inthe evening, entertained the audience with an account of his experiences in theManhattan Project. He was delightful to listen to and fondly remembered by all.
Tragically, Al was mortally wounded in a car accident days prior to the secondsymposium. He regained consciousness for the opening address of ihe symposiumand dedication by John De Laeter, which he listened to by telephone from his hospitalbed. He passed away a few days later. Although saddened, the speakers carried onto give excellent scientific presentations, as a tribute to Al Nier, and thesepresentations are summarized herein. Furthermore, some of the speakers decided toprepare full papers which are published in a special memorial issue of InternationalJournal of Mass Spectrometry and Ion Processes, Vols. 146/147, (1995). The nextA.O. Nier Symposium will be in the spring of 1997, and there will be a Nier lecturer,chosen by the organizing committee, at this and subsequent meetings.
Lawrence W. Green

- i i - AECL-11342
Dedication to Alfred O. Nier
John R. De LaeterDepartment of Applied Physics, Curtin University of TechnologyPerth, Western Australia
We all have our personal heroes - Al Nier will always be one of mine. Although I waseducated in a small Physics Department in one of the most isolated cities in the world,the name of Professor Alfred 0 Nier was well known to me, because he was heldin such high esteem by my Ph.D. supervisor, Dr Peter Jeffery, and I quickly learned toadmire him too.
I was in such awe of Professor Nier, that when I first saw him at a Meteoritical SocietyMeeting in Mainz in Germany in 1983, it took me a long time to pluck up enoughcourage to speak to him. But then I discovered, what hundreds of other people havefound, that Al Nier was a humble, easy going, fun-loving human being, generous to afault and eager to help other people. Almost before I realised it, he and his wife Ardishad asked my wife and me to join them for dinner at the Conference Banquet. And sobegan a friendship which I cherish deeply.
Over the years I met him and his family on many occasions, and he was always thesame. His endless enthusiasm for science, his genuine interest in other people, andhis ability to tell a good story, remained unchanged.
I still remember the first story he told me. For many decades there was adisagreement between the chemists and the physicists over the value of atomicweights, due to the fact that the chemical scale was based on elemental oxygen,whilst physicists used oxygen-16 as their base. Al was a newly elected member ofthe International Commission on Atomic Weights when he came up with the idea (in abar in Amsterdam), of using carbon-12 as the common base for atomic weights. Hethen went to the Max Planck Institute at Mainz where he convinced the Director,Professor Josef Mattauch, of the idea. Mattauch was so excited about the possibilityof uniting the two warring factions, that he set off to Paris to convince his physicscolleagues, but forgot his passport and was stopped at the border. Al was dulydespatched with the missing passport to rescue Mattauch, and carbon-12 wassubsequently adopted as the base for the atomic weights table, and is still in usetoday.
In fact it is not generally known that the first absolute measurements of the isotopicabundances of an element were carried out by Al Nier in 1950. He calibrated a massspectrometer using enriched isotopes of argon (which he had produced himself), andthen used this spectrometer to measure the isotopic composition of nine other

-H i - AECL-11342
elements. The atomic weight of argon is still based on this 44 year old measurement,as is the Universal Gas Constant R, which is derived in part from it. The InternationalUnion of Pure and Applied Chemistry still accepts Al Nier's isotopic measurements ofargon, xenon and osmium as the "best measurement" from a single source [1],
He once described himself as "more of a gadgeteer than most physicists". But that isan inappropriate assessment. He was a brjlliant experimental physicist who developedgeneration after generation of mass spectrometers both small and large, withpainstaking improvements in instrumentation based on deceptively simple designs.
His most important design was the 60° sector field mass spectrometer which replacedthe more complicated 180° versions which had previously been used. This simpledesign not only reduced the weight and power consumption of the electromagnet,but enabled the ion source and detector to be removed from the influence of themagnetic field. However, of more significance was the fact that the Nier designtransformed what was essentially a physics research instrument into a machine whichcould be used by a wider group of scientists. And this was achieved against theprevailing opinion of the day, as expressed by Francis Aston, who argued that massspectrometry would die away as an active research field. Subsequent developmentsin mass spectrometric-related fields are testimony to Al's vision, and of the importanceof the two papers that described jthe sector field instrument which has made ourprofessional lives possible [2, 3].'
Yet he was almost lost to science! If it had not been for the great depression hewould probably have become an electrical engineer, but only five of his eightyclassmates found jobs in industry in 1931, and so he remained at the University ofMinnesota to complete a masters degree in engineering, and later a Ph.D. in physics.And what a Ph.D it was! He constructed a 180° deflection mass spectrometer fromspare parts left over by other researchers, and with this instrument he discoveredargon-38 and potassium-40, thus laying the foundation for potassium-argongeochronology.
During his post-doctoral fellowship at Harvard University in 1937 and 1938, he studiedthe isotopic compositions of 19 elements and discovered four new isotopes - 36S, 46Ca,48Ca and 1B4Os. He measured the isotopic composition of lead in a variety of uraniumminerals from the Richards-Baxter collection, and showed that the isotope ratios variedwidely in spite of the near constancy in the atomic weight. He also measured theisotopic abundance of 235u/238U, and wrote a number of papers on the uranium-leadand lead-lead chronometers. Al can therefore be regarded as thefounder of geochronology and isotope geology.

- i v - AECL-11342
Al Nier's many pioneering papers, mostly published in Physical Review, are models ofscientific communication. He was brought up in the tradition in which you used aminimum of words to describe the experiment, and allowed the data to speak forthemselves. He once told me that he found it hard to accept the lengthy journalarticles that are the norm today, and complained that one of his manuscripts hadactually been returned because the editor wanted him to make it longer.
The accuracy of Al's mass spectrometric data is legendary. Even though he mademany isotopic measurements in an era far removed from modern technology, his datahave invariably stood the test of time. Ludolf Schultz tells the story of how hediscovered that the accepted value of 20Ne/21Ne was somewhat higher than a morerecent measurement by Peter Eberhardt. Ludolf approached the then National Bureauof Standards in Washington, but was informed that the value for neon could notpossibly be changed because it had been measured by Al Nier, and it was well-knownthat Nier never made a mistake!
Nier's excellence in data measurements is summed-up by an article on barium byGerry Wasserburg's group at the California Institute of Technology, where the authorsmake the statement that "the isotopic abundances given by Nier in 1938 are, as usual,confirmed to be correct within the error limits that he quotes" [4].
However, the characteristic which has always impressed me the most about Al'sscientific career was his versatility. After his initial work on isotope abundancedeterminations and geochronology, he developed diffusion methods for enrichingcarbon isotopes, and used these enriched isotopes in medical and biologicalapplications. In 1940 he responded to a request by Enrico Fermi to separatenanogram quantities of 235U and 238U. This enabled 235U to be identified as thefissionable uranium isotope by Booth and Dunning at Columbia [5] and hence enabledthe Manhatten District Project to proceed.
In the 1950's Al's attention turned to the measurement of atomic masses, which is anessential base for nuclear physics and atomic weight determinations. With hiscolleagues at Minnesota, he built large, high resolution, double focussing massspectrometers, which enabled him to set new standards in atomic massmeasurements.
But then he turned from the building of large mass spectrometers to small,miniaturised versions, suitable for space research. In the 1970's he was a keymember of the Viking project, whose mission was to land a spaceship on Mars todetermine if life could exist there. Nier-built mass spectrometers sampled the Martian

- v - AECL-11342
atmosphere and were used in a variety of experiments in atmospheric physics. Anumber of them are still in space.
Al Nier retired in 1980 and was appointed Regents Emeritus Professor in Physics atthe University of Minnesota. He continued to work without pay and returned to anearlier research interest, the study of noble gases in extra-terrestrial materials.
At the 53rd Meteoritical Society meeting in Perth in 1990, the session on Noble Gaseswas dedicated to Professor Nier, because it was in his laboratory in the late 1950'sthat a successful investigation was undertaken of the helium isotope distributionin iron meteorites. His recent work on step-wise heating of interplanetary dustparticles to investigate the release pattern of noble gases, is an experimental problemof the highest level of difficulty, one which scientists half his age would hesitateto undertake. To achieve this he adapted the miniaturised mass spectrometers fromspace research to measure helium and neon isotopes in vanishingly small samples ofthis cosmic flux.
John Reynolds, in a lecture entitled "Adventures of Noblemen in Diamonds", paidtribute to Al in the following words:- "His own work in mass spectrometry for more than50 years has resulted in monumental contributions to nuclear physics, nuclear energy,isotopic geochemistry and space physics. Offshoots of his leadership in the field haverevolutionised Earth Science and Meteoritics. His eternal youth and enthusiasm haveinspired us all" [6].
In 1992 Professor Nier was presented with the Bowie Medal of the AmericanGeophysical Union by Professor Don Anderson. Professor Anderson commenced hiscitation by quoting the following words which were written by Sir Charles Lyell in1830:- "Though we are mere sojourners on the surface of the planet, chained to amere point in space, enduring but for a moment in time; the human mind is not onlyenabled to number worlds beyond the unassisted ken of mortal eye, but to trace theevents of indefinite ages before the creation of our race; and is not even withheld frompenetrating into the dark secrets of the ocean or the interior of the solid globe, free,like the spirit which the poet described, as animating the universe".
These words describe the character of Al Nier, who continually searched for the truthwhether it be in a speck of Stardust or in unravelling the "indefinite ages before thecreation of our race".
Before I conclude I would like to refer to an applied aspect of Al Nier's career which isoften forgotten in the light of his outstanding scientific endeavours. I refer to his work
- v i - AECL-11342
with industry during World War II, which he described in an article entitled "SomeReminiscences of Mass Spectrometry and the Manhattan Project" [7].
In the summer of 1942 Al Nier was building a special mass spectrometer for uraniumisotope determinations as requested by Vannever Bush. He was also analysing heavywater samples for Harold Urey, and was evaluating enriched uranium samples fromthe first cascade model of Booth and Dunning. He was also trying to develop thermaldiffusion techniques for isotope separation, and in his spare time assisted E.O.Lawrence at Berkeley in the electromagnetic isotope separation process. But a newproblem, whose importance to the success of the Manhattan Project was of thehighest order, arose. The gaseous diffusion plant being developed at Oak Ridgewould be inoperable if leaks developed in the plant. How were these incredibly smallleaks to be detected? The Kellogg Company turned to Al Nier who, although only 31years old at the time, had already demonstrated his ability as a builder of sensitivemass spectrometers. He had the feeling of instruments in his body, as an artist has inmoulding clay. He had a personal touch for scientific instruments, and his home-builtmass spectrometers constructed in the University of Minnesota Physics workshop,invariably worked with amazing precision.
Al quickly developed a portable leak detector, tuned permanently to helium, with whichthe Oak Ridge engineers could detect invisible pinholes in the labyrinth of pipes, oftotal length over a hundred miles, which was the base of the $500 million gaseousdiffusion plant. It seems impossible to imagine "life" before helium leak detectors, tothose of us who have struggled with vacuum systems, and our thanks go to Al for thisvery practical mass spectrometric invention. He also designed a small "line-recording"mass spectrometer, later manufactured by General Electric, which was used at overfifty points in the Oak Ridge plant to monitor the composition of the gas at anylocation. A central control room, to which the outputs of the mass spectrometers werefed, made engineering history. Without Al's input, the Manhattan Project would neverhave become a reality.
Al points out that this was an example of the underlying importance of basic science tonational defence and welfare, which led, in part, to the Office of Naval Researchsupporting basic science after the war. Perhaps Al's applied research experience ispertinent to the challenges faced by many National Laboratories at the present time.
I would like to conclude with some words from Don Anderson taken from the BowieMedal Citation, to which I referred earlier:- "All-in-all, Professor Alfred 0. Nier is abroad-minded and unselfish scientist, a diplomatic yet decisive leader, and a gentleand likeable person. His colleagues are awed by his experimental prowess and his
- v i i - AECL-11342
collegia! manner of openly sharing all data, ideas and speculations. It is easy tounderstand why this wonderful, softly-spoken scientist is so highly revered by all whocome in contact with him. It has been said that some wise people see further thanothers because they stand on the shoulders of giants. In the case of Al Nier we canall see further because generations of giants have stood on his shoulders".
The scientific community salutes Al Nier, not only because he was a good scientist,but primarily because he was a good person. The spoken word does not describe inproper measure his zest for life, his gregarious nature, his wit and charm. It does notindicate his habit of carrying a magnetic compass with him at all times, so that, forexample, he always knew where he was in the London underground, or of his love of"high tech" photography.
Nor does it explain his skiing exploits at Vail, where he was allowed to ski free-of-charge because he was over the age of seventy years. Nor does it describe his lovefor his wife Ardis and his family. Nor the quality of his many friendships.
The A.O. Nier Symposium on Inorganic Mass Spectrometry was established in 1991 tohonour the "Father of modern mass spectrometry". Long may it continue thatproud tradition!
References
[1] J.R. De Laeter, K.G. Heumann and K.J.R. Rosman, J. Phys. Chem. Ref. Data20,1327, (1991)
[2] A.O. Nier, Rev. Sci. Instrum. 11, 212 (1940).
[3] A.O. Nier, Rev. Sci. Instrum. 18, 398 (1947).
[4] O. Eugster, F. Tera and G.J. Wasserburg, J. Geophys. Res. 74, 3897 (1969).
[5] A.O. Nier, E.T. Booth, J.R. Dunning and A.V. Grosse, Phys. Rev. 57, 546 (1940).
[6] J.H. Reynolds and P. McConville, Proc. A.O. Nier Symp. on Inorganic MassSpectrometry, Los Alamos National Laboratory Report LA-12522-C (1993) p 145.
[7] A.O. Nier, J. Chem. Ed. 66, 385 (1989).

- VIII - AECL-11342
A photograph taken of Professor A.O. Nierin 1990 on a Meteoritical Society field-tripat a mineral sands deposit at Busselton, Westem Australia

- 1 - AECL-11342
THERMAL lONIZATION MASS SPECTROMETRY
Applications
- 2 - AECL-11342
New Developments and Applications in NegativeThermal lonization Mass Spectrometry
Klaus G. HeumannInstitute of Inorganic Chemistry of the University of Regensburg, Universitatsstralie 31,93040 Regensburg, Germany
Introduction
Thermal ionization mass spectrometry can be used in the positive or negative thermalionization mode for precise determinations of isotope ratios. Whereas positive thermalionization mass spectrometry (PTI-MS) was established many years ago, negativethermal ionization mass spectrometry (NTI-MS) is becoming more applied during thelast few years [1]. In NTI-MS the formation of negative thermal ions is preferred byhigh electron affinities of the analyte and low electron work functions of the filaments.In PTI-MS the element to be analysed should have a low first ionization potential andthe filament material used should have a high electron work function. The compoundsto be analysed by NTI-MS must have at least an electron affinity of 2 eV. Atomic ionsM' or oxide ions MO; (x=1-4) are preferably formed for many of the transition metals,non-metals, and semi-metals. A maximum of the ion current is found at a definitivefilament temperature for each compound. To reduce the electron work function ofmost of the filament materials, lanthanum or barium salts are added on the filament'ssurface [2]. One of the main advantages of NTI-MS is the fact that spectroscopicinterferences occur very seldom.
Analytical procedures for the isotope ratio determination by NTI-MS are developed forthe transition metal elements V, Cr, Mo, Tc, W, Re, Os, Ir, and Pt as well as for themain group elements B, C, N, 0, Si, S, Cl, Se, Br, Sb, Te, and I. The followingmodern applications should be mentioned in this connection: Re/Os dating method,exact determinations of isotope abundances, trace element speciation by isotopedilution mass spectrometry (IDMS), and determination of isotope variations in theenvironment for source identification of compounds.
Re/Os Dating Method
Due to the naturally occurring long-lived radioactive 187Re isotope, a Re/Os datingmethod could be established. Before 1989 the application of this method was limitedby the precision and sensitivity of the techniques in use: secondary ion massspectrometry (SIMS) or resonance ionization mass spectrometry (RIMS). In 1989 ourgroup at the University of Regensburg showed for the first time that osmium isotoperatios can be precisely and sensitively measured by NTI-MS [1]. In 1991, twopublications appeared nearly simultaneously on this topic [3,4]. From this time on

- 3 - AECL-11342
many other laboratories in the world adapted the NTI technique for osmiummeasurements.
The current NTI-MS technique in our laboratory for the osmium isotope ratiodetermination uses about 1 ng of osmium as hexachloroosmate(VI) in a double-filament Pt ion source. For the enhancement of the ion formation, Ba(OH)2 is addedon the filament to reduce the electron work function and a continuous oxygen gas flowis introduced into the ion source [5], Under these conditions typical ion currents of10"11 A for the most abundant OsOg ion are obtained at the detector side of the massspectrometer, allowing relative precisions in the range of 0.04-0.01 % in the isotoperatio determination of osmium.
Another problem, which had to be solved in Re/Os dating, was the rhenium blankcontribution from Pt filaments, especially during the measurement of minute samplesof rhenium by NTI-MS. By coating nickel filaments with a thin layer of small V2O5
particles, the blank contribution by the filament material could be reduced to less than1 pg rhenium per measurement [6]. With these developments the Re/Os datingmethod should be applicable in the future for a great number of different geologicaland cosmogenic samples.
Improvement in the Isotope Abundances of the Elements
The relative uncertainty in the atomic weight of more than 20 elements is above0.01 %, which is often due to problems in the mass spectrometric techniques forprecise isotope abundance measurements [7]. By using NTI-MS, an improvement inthe precision of the isotopic composition could be obtained for some elements whichalso resulted in an improvement in the corresponding atomic weight data. In 1991 thiswas done for the elements W and Os [7], and in 1993 for Ir for which the atomicweight, now recommended by IUPAC, could be changed from 192.22 ± 0.03 to192.217 ± 0.003, which means an improvement in the uncertainty by a factor of ten[8].
Selenium Speciation by IDMS
Elemental speciation is one of the most important topics in trace analysis today.Because of its accuracy, IDMS is increasingly used in this field [1,9,10]. Selenite(SeO2,"), selenate (SeO2-), and trimethylselenonium ((CH3)3Se+) have been determinedby our laboratory [11] in urine samples. A double-filament ion source (Re) and anionization filament temperature of 950°C were used for the determination of the80Se/82Se ratio. About 1 ug selenium is necessary for a Se' ion current of about10"11 A at the detector side. For the isotope dilution technique, 82Se enriched spikesolutions of the organic and the two inorganic selenium compounds were applied.
By using the sample treatment schematically shown in Figure 1, all three seleniumspecies could be determined in different urine samples in the range of 2.2-12.2 ng Se
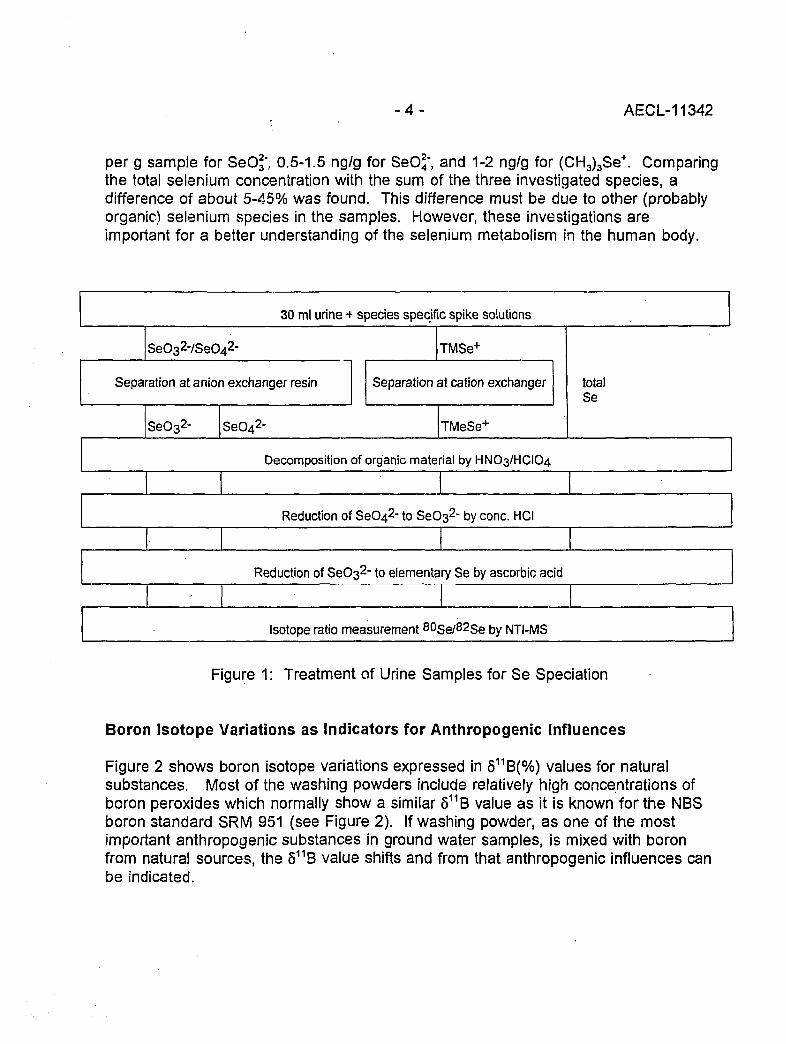
- 4 - AECL-11342
per g sample for SeOg', 0.5-1.5 ng/g for SeO*", and 1-2 ng/g for (CH3)3Se+. Comparingthe total selenium concentration with the sum of the three investigated species, adifference of about 5-45% was found. This difference must be due to other (probablyorganic) selenium species in the samples. However, these investigations areimportant for a better understanding of the selenium metabolism in the human body.
SeO32-/SeO
Separation at anior
SeO32-
30 ml urine + species specif
.2-
i exchanger resin
c spike solutions
TMSe+
Separation at cation exchanger
SeO42- TMeSe+
totalSe
Decomposition of organic material by HNO3/HCIO4
Reduction of SeC>42- to SeO32- by cone. HCI
Reduction of SeO32- to elementary Se by ascorbic ac d
Isotope ratio measurement 80Se/82Se by NTI-MS
Figure 1: Treatment of Urine Samples for Se Speciation
Boron Isotope Variations as Indicators for Anthropogenic Influences
Figure 2 shows boron isotope variations expressed in 511B(%) values for naturalsubstances. Most of the washing powders include relatively high concentrations ofboron peroxides which normally show a similar 811B value as it is known for the NBSboron standard SRM 951 (see Figure 2). If washing powder, as one of the mostimportant anthropogenic substances in ground water samples, is mixed with boronfrom natural sources, the 511B value shifts and from that anthropogenic influences canbe indicated.

- 5 - AECL-11342
Washing| powder
H i l l . Dead Sea
Sea water
Marine evaporite, , minerals
Non-marine evaponte uiiuti«i»minerals
i—i i 1 i—i—i—r—i—r>-30 0 +30 +60
NBS SRM 951 6"B[X.)
Figure 2: Boron Isotope Variations in Different Substances
Different techniques for the boron isotope ratio determination have been developed,up to now. The formation of B+ ions in ICP-MS has the advantage that any boroncompound can be analysed. On the other hand, a low sensitivity and relativestandard deviations of only about 0.7% in the isotope ratio determination aredisadvantages of this method. PTI-MS is applied by detecting Na2BO2 or Cs2BO2ions. The precision of this method is much better, in the range of 0.07-0.2% forNa2BC>2 and of less than 0.05% for CSJBOJ. Disadvantages are the low sensitivity andthat the corresponding alkali salts must be prepared. Interferences can also occur forNa2BO2 by 88Sr+. Extremely high BO:, ion beams are produced in NTI-MS from anyboron compound and the only improbable interference to be taken into considerationcan be due to OCN' ions, possibly formed by organic impurities at higher filamenttemperatures. The precision of the isotope ratio measurement is in the range of 0.08-0.2% [12], which is normally sufficient to be used as an indicator for anthropogenicinfluences.
This was demonstrated by the investigation of different ground water samples in Israelcompared with sewage and the boron isotopic composition of perborate in washingpowder (Figure 3). The diagram significantly shows a decrease in the 511B value ofsamples in the order of uncontaminated, less contaminated, and contaminated groundwater. Sewage, which is closest to the perborate value, has the lowest 811B value.
Conclusion
Negative thermal ionization is an important alternative technique in massspectrometry, which offers certain advantages in the isotopic ratio measurement of anumber of elements. The instrumentation and handling of NTI techniques are

- 6 - AECL-11342
relatively simple and the sample preparation is normally not too complicated. Highsensitivity and high precision can often be obtained for many elements.
to
40
20 —
Boron isotope variation
IIf §
f
§-8
11
2̂ Oo ®
I-5§
CO
CO i.o
a
Figure 3: Boron Isotope Variation in Sewage and Ground Water Samples of the DanRegion in Israel
References
[1] K.G. Heumann, Mass Spectrom. Rev. 11, 41-67 (1991).
[2] K.G. Heumann, in: Inorganic Mass Spectrometry (Eds. F. Adams, R. Gijbels andR. van Grieken), Wiley, New York, 1988, pp. 301-376.
[3] J. Volkening, T. Walczyk and K.G. Heumann, Int. J. Mass Spectrom. Ion Proc.105, 147-159(1991).
[4] R.A. Creaser, D.A. Papanastassiou and G.J. Wasserburg, Geocbim. Cosmochim,Acta 55, 397-401 (1991).
[5] T. Walczyk, E.H. Hebeda and K.G. Heumann, Fresenius J. Anal. Chem. 341,537-541 (1991).
[6] T. Walczyk, E.H. Hebeda and K.G. Heumann, Int. J. Mass Spectrom. Ion Proc.130, 237-241 (1994).
- 7 - AECL-11342
[8] lUPAC Commission on Atomic Weights and Isotopic Abundances, Pure Appl.Chem. 66, 2423-2444 (1994).
[9] K.G. Heumann, Int. J. Mass Spectrom. Ion Proc. 118/119, 575-592 (1992).
[10] K.G. Heumann, in: Metal Speciation in the Environment (Eds. J.A.C. Broekaert,S. Gucer and F. Adams), NATO ASI Series, Vol. G23, Springer, Heidelberg,1980, pp. 153-168.
[11] R. Brotsack, Diplomarbeit, University of Regensburg, 1992.
[12] H. Zeininger and K.G. Heumann, Int. J. Mass Spectrom. Ion Phys. 48, 377-380(1983).
[13] A. Vengosh, K.G. Heumann and S. Juraske, J. Environ. Sci. Technol. 28, 1968-1974 (1994).

- 8 - AECL-11342
Tellurium: A Mass Spectrometrisfs Delight
J.R. De Laeter, K.J.R. Rosman and R.D. LossDept. of Applied Physics, Curtin University of TechnologyPerth, Western Australia, 6001
Introduction
The processes involved in heavy element nucleosynthesis are the slow(s) and rapid(r)neutron capture processes, and the p-process, a reaction which synthesises theneutron-deficient isotopes of the heavy elements. The s-process synthesises thenuclides along the valley of nuclear stability over relatively long time periods during thehelium burning phase of stellar evolution. Because most of the isotopes synthesisedby the s-process are stable, their relevant nuclear parameters can be studiedexperimentally. These parameters are the isotope abundances N8, and the neutroncapture cross-sections a, averaged over a Maxwillian velocity distributioncorresponding to thermal energies around kT = 30 keV. The most important isotopesin s-process nucleosynthesis are those that have been shielded from the r-process bystable isobaric nuclides, since their abundances are identical to the solar abundancesNo except perhaps for minor p-process contributions. The r- and p-processes occurover a much shorter time scale in a cataclysmic, non-equilibrium environment such asoccurs for massive stars that become supernovae. The products of nucleosynthesisare returned to the interstellar medium by supernovae and by mass loss from redgiants and novae.
Tellurium has eight stable isotopes spanning the mass range 120 < A < 130. It is theonly element that has three s-only nuclides 122'123' 124Te, and in addition has a p-onlynuclide 120Te, two r-only nuclides 128130Te, together with two isotopes 125126Te, whichare produced by a combination of the s- and r-processes. Figure 1 shows thenucleosynthetic processes which produced the isotopes of tellurium.
» s - process
52
51
50
49
48
112
106
Cdp
108
C d r110
CdinCd
114
113
112
Cd
115
Snp.«.r
113
Cd
116
Sn
InI14\Cd
117
Sn
\
120
T e r
118
Sn
\
116
Cd
119
Sn
\
122
Te12TS
Sb120\Sn
\
123
Te
\
124
Te123
Sb122
Sn
\
125
Te
\
I26\Te
\124
Sn
\
\
\
\
r- process
128
Te
\ \
130
Te
\rr - process
\s - process
r • process
Figure 1: Nucleosynthetic Processes for Te

- 9 - AECL-11342
Solar System Abundance of Tellurium
Tellurium has a relatively large cosmic abundance [1], since it is located on an r-process peak which results from the magic neutron number N = 82. It is therefore ofno surprise to find that the most abundant of the Te isotopes are the r-only nuclides128Te and 130Te. These two isotopes exhibit double beta decay which causesenrichments in 128Xe and 130Xe respectively for old telluride minerals. It has now beenshown that the half-lives of 128Te and 130Te are approximately 1.4 x 10²¹ and 7 x 10²⁰
years, respectively, which supports the Dirac formalism in which the lepton conserving,two neutrino mode of decay is favoured [2]. This places a stringent upper limit on theMajorana mass of the electron neutrino.
Kappeler et al. [3] evaluated a best set of neutron capture cross sections for a numberof s-process nuclides at astrophysical energies. Using this data and the Solar Systemabundances of Cameron [4], Kappeler et al. [3] evaluated the nuclear parameters forthe classical model of s-process nucleosynthesis for the <JNS curve in the mass region56 < A < 209. The r-process contributions of nuclides that were synthesised by acombination of s- and r- process nucleosynthesis were then calculated by subtractingthe calculated s-process abundance Nsfrom the Solar System abundance No. Usingthis approach Kappeler et al. [3] were able to demonstrate a good correlation betweenthe calculated Nr values for mixed s- and r-process nuclides and the r-only processnuclides, except for Te where the 128Te and 130Te abundances were too high byapproximately 30%. Smith et al. [5] had, in fact, analysed the Orgueil C1 chondriteusing the isotope dilution mass spectrometric (IDMS) technique and obtained a valueof 2.34 ppm which was some 27% lower than the Solar System abundance used byKappeler et al. [3]. This value has subsequently been supported by additional lDMSmeasurements on a number of carbonaceous chondrites by Loss et al. [6], whoobtained a value of 2.24 ± 0.05 ppm for Orgueil. Anders and Grevasse [1] used theIDMS values as the primary source of input data to select a Solar System abundanceof 2.27 ± 0.23 ppm for Te.
Recently Wisshak et al. [7] have measured the neutron capture cross-sections of theSm isotopes with an accuracy of approximately 1%. Together with the cross-sectiondata for Te [8], it is possible to derive a close fit to the <JNS curve using the s-only Smand Te isotopes. This s-process formalism enabled Wisshak et al. [7] to conclude thatthe Solar System abundance of Te of 2.27 ppm is accurate to within 3% rather thanthe 10% uncertainty assigned by Anders and Grevasse [1], a conclusion which isconsistent with the IDMS measurements. The revised abundance of Te not onlyconfirms the validity of s-process nucleosynthesis, but also enables a revised value forXe to be determined. Xenon is a rare gas and its abundance therefore cannot bemeasured from meteoritical material. The revised value for Xe is in good agreementwith an estimate based on s-process systematics [9]. The excellent correlation
- 1 0 - AECL-11342
between nuclear astrophysics and Solar System abundances for Te, demonstrates theremarkable analytical advances that have been made in recent years.
Isotopic Anomalies in Meteorites
Despite the opportunity to exploit the isotopic composition of Te in nucleosyntheticstudies, it was not until 1978 that a mass spectrometric search was made for fcotopicanomalies in meteorites, but no isotopic variations within the limits of experimentalerrors could be found in whole rock samples [10]. Ballad et al. [11] reported theoccurrence of isotopically anomalous Te and Xe in acid-treated samples of the Allendemeteorite. Using a neutron activation analysis technique Ballad et al. [11] reportedanomalies of up to 17% in 130Te with smaller anomalies in 120Te, 122Te and 126Te.However, in a detailed mass spectrometric study of three acid-resistant residues fromAllende, Loss et al. [12] could not detect any isotopic anomalies in the major isotopesof Te, in contrast to the work of Ballad et al. [11]. A search was also made foranomalies in 126Te, the stable daughter of 126Sn, which has a half life of approximately105 a. The absence of excess 126Te in primitive Solar System materials places a lowerlimit of approximately 106 a on the time of formation of the Solar System [13].
Refractory carbonaceous materials in primitive meteorites are known to be the carrierof many isotopically anomalous elements which survived the formation of the SolarSystem and provide valuable information on pre-solar nuclear and chemicalprocesses. One such component is microdiamonds, which contain Xe-HL - anucleogenetically distinct xenon enriched in those isotopes synthesised by the r- andp-processes. This suggests a supernova source for the diamonds. Clayton [14] hasargued that the neutrino burst from the collapsed core in Type II supernovae liberatesfree neutrons which can produce the neutron-rich unshielded isotopes in Xe-H. Theconvective shell above the He-burning zone is the most likely site of the origin of Xe-HL since it is the only zone which has C > 0 at the time of its explosion [14]. It ishypothesised that this anomalous Xe, together with the other elements, would beimplanted in the microdiamonds which now exist in carbonaceous chondrites.Heymann and Dziczkaniec [15], Clayton [14] and Howard et al. [16] all predict largeanomalies in Te co-synthesised with Xe-H, with the most important anomaly being ahigh 13OTe/128Te ratio.
Microdiamonds extracted from the Allende meteorite were converted to a form suitablefor chemical separation by cold combustion in an oxygen plasma. After oxidation, theTe was separated from the other elements by ion exchange chemistry and analysedby solid source mass spectrometry. The data shows positive anomalies for 128Te of4.0 ± 2.2% and 130Te of 9.4 ± 1.0%, after being corrected for mass fractionation bynormalization to 124Te/126Te [17]. The remaining isotopic ratios showed no variationfrom the terrestrial standard. The measured anomalies in 128130Te are smaller than
- 1 1 - AECL-11342
those found in Xe, which indicates that any exotic Te present in the diamond samplehas been diluted by unprocessed supernova and/or solar Te. On the other hand, theanomalous Te and Xe fractions in diamond are of similar magnitude (16 ± 2 pmol/g of130Te versus 4.2 pmol/g 136Xe) due to the Te/Xe weight ratio in diamond. The Te datatherefore qualitatively support the neutron burst model [14,15,16].
The Absolute Composition of Tellurium
Accurate measurements of the neutron capture cross-section ratios for122f123i124Te haverecently been reported by Wisshak et al. [8], who demonstrated that the localapproximation cNs = constant, predicted by the classical model of s-processnucleosynthesis, can be confirmed at the 1% level for these three isotopes. Their dataalso identified the possibility of a p-process contribution to the 122Te abundance. Inestimating the errors to be associated with the 0NS values for the three s-only Teisotopes, Wisshak et al. [8] made the assumption that the isotope abundances of Tewere known to an accuracy of 0.1%. However, a distinction needs to be madebetween "relative" and "absolute" isotope abundances. Isotope abundances which arefree from all known sources of bias are referred to as absolute isotope abundances,and are determined by calibrating a mass spectrometer by means of quantitativesynthetic mixtures of enriched isotopes [18]. The standard Te isotope abundances[19], are based on mass spectrometric measurements in which an electron multiplierwas used in the detecting system because of the difficulty of producing ion beams ofsufficient size to be measured directly with a Faraday cup collector [10]. The electronmultiplier introduces a mass discrimination into the isotope abundances which isapproximately proportional to the square root of the mass ratio. However, thecorrection factor required to convert the observed isotope abundances to absoluteabundances is a multivariate function of a number of biases, of which the electronmultiplier discrimination is but one part (albeit an important one).
Thus the value of the 122Te/124Te ratio adopted by Wisshak et al. [8] needs to bedecreased by approximately 1 % to account for electron multiplier bias. This impliesthat the observed positive anomaly in 122Te, which was interpreted by Wisshak et al.[8] as a potential p-process contribution, largely disappears. The estimated absolutevalues for the s-only tellurium isotopes enable the local approximation of s-processnucleosynthesis to be verified within even smaller uncertainty limits than was possiblein the analysis by Wisshak et al. [8]. The necessity of establishing an accurate set ofabsolute abundances for Te is apparent, not only for nucleosynthetic studies, but alsoto determine the atomic weight of Te, which presently has a relative uncertainty of0.024% [18].
- 1 2 - AECL-11342
Fission Product Studies
Tellurium has also played an essential role in mobility studies of fission productmaterial from the Oklo natural reactor. Curtis et al. [20] have used Te as thereference element for an examination of mobility of Mo, Ru, "Ru and Pd in uraninitesamples from Reactor Zone 9 at Oklo. The well-defined linear correlations of theseelements over concentrations that differ by an order of magnitude is attributed to theprimary retention at the site of production. Curtis et al. [20] argue that the degree ofprimary retention was controlled by phase assemblages in the reactor fuel in responseto microscale conditions of pressure, temperature and composition produced by thenuclear reactions. These studies can be used to evaluate the effectiveness ofanthropogenic spent fuel as a depository for nuclear waste. An examination of therelative cumulative fission yields for Te at Oklo shows that 126Te exhibits considerabledispersion in comparison to the other fission yields [21]. This is due to the mobility of126Sn which was not retained in-situ in the uraninite.
The Mass Spectrometry Laboratory at Curtin University of Technology is supported bythe Australian Research Council.
References
[1] E. Anders and N. Grevasse, Geochim. Cosmochim. Acta, 53, 197 (1989).
[2] O.K. Manuel, Proc. Int. Symp. Nuclear Beta Decays and Neutrinos, Osako,Japan (1986).
[3] F. Kappeler, H. Beer, K. Wisshak, D.D. Clayton, R.L Macklin and R.A. Ward,Astrophys J., 257, 821 (1982).
[4] A.G.W. Cameron, In "Essays in Nuclear Astrophysics" (Edit. C.A. Barnes,D.N. Sch'ramm, and D.D. Clayton) Cambridge Uni. Press (1982).
[5] C.L. Smith, J.R. De Laeter and K.J.R. Rosman, Geochim. Cosmochim. Acta,41,676(1977).
[6] R.D. Loss, K.J.R. Rosman and J.R. De Laeter, Geochim. Cosmochim. Acta, 48,1677 (1984).
[7] K. Wisshak, K. Guber, F. Voss, F. Kappeler and G. Reffo, Phys. Rev. C, 48,1401 (1993).
[8] K. Wisshak, F. Voss, F. Kappeler and G. Reffo, Phys. Rev. C, 45, 2470 (1992).

- 1 3 - AECL-11342
[9] H. Beer, F. Kappeler, G. Reffo and G. Venturini, Astrophys. Space Sci. 97, 95(1983).
[10] C.L. Smith, K.J.R. Rosman and J.R. De Laeter, Int. J. Mass Spect. Ion Phys.,28, 7 (1978).
[11] R.V. Ballad, LL. Oliver, R.G. Downing and O.K. Manuel, Nature, 277, 615(1979).
[12] R.D. Loss, K.J.R. Rosman and J.R. De Laeter, Geochim. Cosmochim. Acta, 54,3525 (1990).
[13] J.R. De Laeter and K.J.R. Rosman, Meteoritics, 19, 217 (1984).
[14] D.D. Clayton, Astrophys. J., 340, 613 (1989).
[15] D. Heymann and M. Dziczkaniec, Geochim. Cosmochim. Acta, 45, 1829 (1981).
[16] W.M. Howard, B.S. Meyer and D.D. Clayton, Meteoritics, 27, 404 (1992).
[17] R. Maas, R.D. Loss, K.J.R. Rosman, J.R. De Laeter, R.S. Lewis, G.R. Huss,E. Anders and G. Lugmair, Astrophys. J. (in press).
[18] J.R. De Laeter, P. De Bievre and H.S. Peiser, Mass Spect. Rev., 11, 193(1992).
[19] J.R. De Laeter, K.G. Heumann and K.J.R. Rosman, J. Phys. Chem. Ref. Data,20, 1327(1991).
[20] D.B. Curtis, T.M. Benjamin, A.J. Gancarz, R.D. Loss, K.J.R. Rosman,J.R. De Laeter, J.E. Delmore and W.J. Maeck, Appl. Geochem., 4, 49 (1989).
[21] J.R. De Laeter, K.J.R. Rosman and R.D. Loss, Proc. A.O. Nier Symp. onInorganic Mass Spectrometry, Los Alamos National Laboratory (1993).

- 1 4 - AECL-11342
The Mechanism of Bi* Production from Bismuth Borosilicate
T. Huett, J.C. Ingram and J.E. Delmore ^>°u !'J r U'J
Idaho National Engineering LaboratoryEG&G, MS 2208, Box 1625, Idaho Falls, Idaho, 83415
Silica gel technology, first reported in 1969 for producing Pb ions [1], has found wideuse in the isotope ratio community for enhancing the production of surface ions fromthermal ionization filaments. The method entails mixing the sample with silica gel andeither phosphoric or boric acid, heating to dryness, mounting in the mass spectrometerand heating to the appropriate temperature (700 to 1400°C, depending on the system).The purpose of the present study was to find a model system which emitted ions andcould be easily used for materials studies so as to better understand those featuresnecessary for good and reproducible ion production. This type of a model system cannever hope to be an exact mimic of an analytically useful system since we deliberatelyadd enough of the element to be ionized to alter the material itself, while ananalytically useful system would have the element in very low concentrations. Themethod used in these studies was adapted from an unpublished Los Alamos method[2] for producing Bi+, and used bismuth nitrate (or Bi metal) with silica gel and boronoxide at an operating temperature of 900°C. Both Re and Ta filaments were tested.Larger amounts of the ion emitting material were prepared and melted in a vacuumfurnace on Re or Ta sheets for subsequent analysis. Analyses of the off gases wereperformed with the material heated to the ion emission temperature. The cooledmaterials were analyzed by dissolution followed by ICP-AES, SEM, XPS and X-raydiffraction.
To the knowledge of the authors, an extensive bibliography of the elements that canbe ionized by silica gel technology has never been compiled. The majority ofelements reported in the literature are a block of elements in the periodic tableranging from a VIB element (Cr) on the left, to a VIA element (Te) on the right, with awide range of variations on the methods reported in [1]. There are also references ofHA ions being formed by this technology [3]. During the course of this work, theperrhenate (ReO4') anion was identified. Thus, it is possible (or probable) that thereare multiple ion emission mechanisms occurring from these complex matrices, ratherthan a single mechanism. There are many elements that have been tested for usewith this technology that cannot be ionized, such as the alkali metals, the actinides,and the lanthanides.
A clue as to the mechanism of ion emission comes from the fact that when thesecomplex matrices are mounted on both Ta and Re filaments, Re provides up to twoorders of magnitude higher sensitivity. The reported work function of Re is about

- 1 5 - AECL-11342
5.0 eV, while Ta is about 4.1 eV [4]. The most obvious explanation for this effect isthat the element migrates from the matrix to the bare filament, from which it is ionized.
In order to test this concept, emission of Bi+ from these complex emitters was imagedusing a new instrument recently completed in our laboratory. Several silica gel typeBi+ ion emitters have been imaged in the past year, and all show ion emission onlyfrom the deposits. With this the case, the work function of the Re filament cannothave a direct effect on ion emission, and the ion emission effects from mounting theion emitter on a Re substrate needs to be re-evaluated. Another feature of theemitters that was readily observed during imaging was the speed with which thefeatures changed, as though the deposit was a viscous liquid.
An experiment was set up with a ~3 mm wire loop loaded with ion emitter, mounted in avacuum system with a viewport. An electric current was passed through the wire,heating the specimen. The material was observed to melt and churn. X-ray diffractionof the cooled material showed no features, indicating it was a glass. Several differentmaterials were melted and examined with X-ray diffraction (after cooling), and allappeared to be glasses. Hence the conclusion is that these materials are moltenglasses at operating temperature and the ions are emitted from the surface of themolten glass.
A clue as to the effect of the Re substrate was the observation of perrhenate (ReO4")in the anion spectrum of an ion emitter prepared from Bi nitrate and melted on Re.Perrhenate was only observed from the samples prepared from Bi nitrate and meltedon Re; the samples prepared from Bi metal and melted on Re did not produceperrhenate. This demonstrates the requirement for an oxidizing agent in order forperrhenate to be observable. Perrhenate anion emission was imaged from thesematerials and the ions came from the deposits; the images of the negative ions couldnot be distinguished from the images of Bi+ ions, except for polarity. In order for Re tobe oxidized to perrhenate (Re in the +7 oxidation state), something in the deposit hadto be reduced. Analysis of the off-gases using an electron impact ion source massspectrometer showed that the only appreciable gasses given off were water andnitrogen oxides. The nitrogen oxides produced from heating the material would havecame at least partially from thermal decomposition of nitrates, but some probably alsocame from nitrate oxidizing Re to perrhenate.
Ion emission was tested from the four liquid glass ion emitter combinations; theemitters prepared from bismuth nitrate and bismuth metal, and both of these materialstested on Ta and Re filaments. Large samples (~100 mg) were melted on therespective substrate, dissolved, and analyzed by ICP/emission. The results aretabulated in Table 1.

-16- AECL-11342
Table 1
Bi as
FilamentRelative IntensitySubstrate in glass (mg/g)B> cone, in mg/g
nitrate
Re100
1.7 (Re)9.8
metal
Re50
1.2 (Re)34.8
metal
Ta10
7.3 (Ta)194
nitrate
Ta1
3.6 (Ta)148
Significant quantities of the substrate are incorporated into the glass, and the samplesmelted on Ta had several times as much of the substrate as the samples melted onRe. The materials melted on Re appeared to be much smoother than those melted onTa, as observed by the SEM on the cooled material, and all four had major differencesin appearance. X-ray diffraction showed that they also all were glasses. Thus, theconclusion is made that the addition of these heavy metals at the few parts perthousand level (from a partial dissolution of the substrate) imparts substantiallydifferent properties to the glasses. It is surmised from the measured ion current thatthis heavy metal content is undesirable. There is not a major difference in the Recontent for the two glass types melted on Re, yet there was over an order ofmagnitude difference in the observed perrhenate anion current, with the materialprepared with excess nitrate giving the high perrhenate current. This indicates thatwhile the Re/Bi metal material had substantial Re in the glass, it must have been in anoxidation state less than +7. At the same time, Bi+ ion emission from the Bi nitrateand metal materials melted on Re differed by only a factor of two, indicating that theoxidation state of Re in the glass did not have a large effect on Bi+ emission.
The four combinations were all blended to have the same concentration of Bi, but ascan be seen from the table, Bi concentration decreased dramatically for the samplesmelted on Re in comparison to the samples melted on Ta. The best Bi+ emitters hadthe lowest Bi content. The Bi either evaporated or alloyed with the substrate. The Reand Ta substrates were not saved, unfortunately, so they could not be analyzed for Bicontent.
There have been reports that rhenium oxide has a very high work function, althoughdefinitive quantitative measurements could not be found in the literature. Smallamounts of barium perrhenate were added to the glasses and observed to severelydepress ion emission, indicating that the excess rhenium oxide poisoned the ionemitting properties of the glass. Thus, if Re oxide does raise the work function of theglass surface, the effect on ion formation is negated by the heavy metal poisoningeffect. This is consistent with the fact that the measured concentrations of Ta (thepoorer ion emitter) were several times higher than the concentrations of Re (the better

- 1 7 - AECL-11342
ion emitter) in the respective materials. The original Los Alamos method called for theuse of Pt filaments. Pt substrates were not tested in this study, but they may havehad less chemical interaction with the molten glass, and consequently less heavymetal content and possibly superior ion emission properties.
XPS analyses were performed on these materials. Appreciable amounts of Bi+3 weremeasured on the samples melted on Ta, while those melted on Re had little Bi+3. Thiscorresponds to the reduced Bi concentration measured in the glasses. Essentially noelemental Bi was observable during the initial phase of XPS analyses on any of thematerials, although it was observed to grow in with X-ray exposure for those sampleshaving Bi+3 on the surface initially.
There are numerous issues that need further study, but there are certain conclusionsthat can be stated. The most certain of these conclusions is that the emitters aremolten and highly viscous glasses at ion emission temperature, and that ions originatefrom the surface of this molten glass. It has been known since the original studies [1]that the filament material was very important for ion formation efficiency, with Refilaments giving superior ion formation to Ta filaments. It was generally assumed thiswas due to the higher work function of Re, and that ions originated from the Resurface. It has been shown that ions do not originate from the filament surface, andthat the reason that Re is a better filament material is that it is less reactive toward themolten glass, and less Re than Ta dissolves in the molten glass. It appears thatheavy metals poison the ion emission process. This heavy metal content can comeeither from the substrate or from the sample itself. It is probable, although not proven,that the concentration of Bi in the glasses of this model system altered the ionemission properties. The element added to the glass from which ions are desiredeither migrates into the filament material in appreciable quantities (particularly Refilaments), or else Bi has a much higher vapor pressure in the more favorablematrices.
Little can be said concerning the actual mechanism of ion production from thesemolten glasses at this time, but it is unlikely that a single mechanism is responsible forthe ion emission for all the types of ions observed from this type of matrix. The XPSdata showed that Bi+3 was the predominant oxidation state of Bi+ in the cooled glasses,but this does not prove that this species is actually responsible for emission of the Bi+
species. The production of Bi+ in the gas phase from Bi+3 in the solid is highlyspeculative, and could involve an inverse Saha-Langmuir ion formation process. Itwould also be a reduction process, which would require a driving force that would bedifficult to explain, especially since perrhenate was observed from the best Bi+ emitter,and perrhenate is a highly oxidized species.
Another result of the experimentation that is not well understood is why ion emissionfrom the glass prepared from bismuth metal is a factor often higher than the glass

- 1 8 - AECL-11342
prepared from bismuth nitrate, when the materials were melted on Ta. The SEMphotos also showed major differences, indicating that the glasses had much differentphysical properties. A possible explanation is the relative oxidative/reductive state ofthe glass. We made no attempt to determine oxygen stoichiometry of these mixtures,but the addition of bismuth as the metal rather than as the nitrate almost certainlywould reduce the oxygen content. Thus, a reduction in oxygen content of the glassappears to enhance ion emission efficiency for the materials on Ta. There is not asimilar major effect with the same materials melted on Re, so generalizationsconcerning these systems are not easily made. The properties of the glass thatchange with elemental composition (oxygen, Ta, Re, Bi etc.) is the probable cause ofthese effects.
[1] A. E. Cameron, D. H. Smith, and R. L Walker, Anal. Chem., 41, 3, 525 (1969).
[2] D. Rokop, Private Communication.
[3] T. Lee, D.A. Papanastassiou and G.J. Wasserburg, Geochim. Cosmochim. Acta41, 1473(1977).
[4] Handbook of Thermionic Properties, V. S. Fomenko and G. V. Samsonov,Plenum Press (1966).
- 1 9 - AECL-11342
Total Evaporation Measurements, a Key to more Accurate Mass Spectrometry?
R.K. Fiedler ~i •-'• ' < -c <:•./<"I.A.E.A./ Safeguards Analytical Laboratory, A-2444 Seibersdorf, Austria
Introduction
The method of the total evaporation measurement was presented first by Romkowskiet al. [1] at an ESARDA meeting in London, 1987. The difference from theconventional method is that the evaporation filament current is steadily increasedduring data collection to consume the whole sample material placed on the filament forthe analysis. One of the major sources of systematic bias in thermal ionization massspectrometric measurement is isotopic fractionation, which can be eliminated when asample is consumed totally during the analysis. The way of data collection and dataevaluation to be used was limited by the software available at this time. Ourlaboratory has the same type of mass spectrometer (Finnigan MAT 261, multi-collectorinstrument) as the ITU (Institute for Transuranium Elements, Karlsruhe). A specialmodule that allows handling the data differently from the software of the manufacturerenabled us to follow a different data evaluation philosophy. The error calculation isperformed using statistics applied to counting techniques. The intention of ITU was touse only small amounts of sample to reduce the radiation hazard to the chemistsdoing the separation and purification work on the samples coming from reprocessingplants. Our own software did not have the limitation to small samples and gave verygood results on all samples, independent of the filament loading. This softwaremodule was taken as a basis for further improvements.
Software
During a scientific visit at CBNM (now IRMM) in Geel, Belgium, the exchange of ideason the best way to do mass spectrometric analysis ended in the preparation of apaper entitled 'Principal Requirements for Accurate Mass SpectrometricMeasurements' [2]. This paper forced the development of software for Finnigan MATmass spectrometers (type MAT 261 and MAT 262) to verify the theory and todemonstrate the possibilities of a new software. The name of this software package isMSSOFT and has been tested for three years and improved wherever shortcomingscould be observed. The following Figure 1 shows the flowchart for a total evaporationmeasurement.

- 2 0 - AECL-11342
STARTFocus &
Peak center
Heat sample(evaporation)
filament
Ionizing filament(rhenium)
add 50 mA
Integrate ind.ion currents
QUIT * •
Find mostintense peak
Peak centerFocus peak
IBaseline
measurement
XIncrement
filament current
Baselinemeasurement
o
o
ooID
/
Q_
o2LU
111
ccen
Figure 1: Simple Flowchart for Filament Heating and Data Taking for Total EvaporationMeasurements
Experimental
Multi-collector instruments
The following tests have been performed on the MAT 262 of IRMM equipped with 7Faraday cups. At the start, mainly standards were analyzed and the total evaporationmethod showed very good results. The element uranium was selected because it hasminor isotopes. The results of measurements (mean of 5 measurements) using differentfilament materials are shown in Table 1.

-21 - AECL-11342
Table 1: NBS-020 Measurement Results
Filament Material
RheniumTungstenTantalumReference
235U/238U
0.0208170.0208180.0208480.02081
sd
0.0000180.000010.000020.00002
%sd
0.0870.0480.10.1
% (meas-ref)/ref
+ 0.034+ 0.038+ 0.183
0
After evaluation of the measurement data of the 3 different filament materials, tantalumwas excluded from further tests as the remaining sample material was high and the resultfor the ratio 235u/238U is biased by 0.18 %.
The next measurements were all done on the MAT 261 of SAL (IAEA), which is equippedwith 9 Faraday collectors with a fixed distance to cover the mass range from 233 to 239for U and 235 to 244 for Pu measurements. Uranium (NBS 010) and plutonium (NBS947) as shown in Figure 2 were used in this test series. As can be seen, the range ofquantity loaded for good analysis is very wide. The shaded area corresponds to theuncertainty of the reference material [3].
Sampleloading
0.1 micro g02 micro g0 5 micro g1.0 micro g2.0 micro g
URANIUM
range
to be used
Ratio 235/238 0.01014
Sampleloading
5nano g10 nano g20 nanog50 nanog100 nano g
PLUTONIUM
range
to be used
Ratio 240/239 024123 (decay corr.)
Figure 2: Influence of Loading Quantity for Uranium (NBS 010) and Plutonium (NBS 947)
Experimental
Quadrupole instrument
At the same time studies were started to use a quadrupole mass spectrometer (THQ fromFinnigan MAT) for total evaporation measurements. The studies are limited to theelement Pu. The amount of sample used in these tests was 50 ng. For the adjustmentof the ion signal at the start of the measurement the secondary electron multiplier (gain

- 2 2 - AECL-11342
10 compared the Faraday cup) is used to save sample for the measurement itself.Contrary to the multi-collector instruments, where the ion signals can be collectedsimultaneously, the data taking must be done by symmetrical peak jumping and in themiddle of the scan a heat-up step must be added. The total evaporation measurementgives acceptable results as long as the ion signal stays within the borders of the linesshown in Figure 3. The best conditions would be if the intensity of the ion beam followsthe dashed line in Figure 3. The data are presented in Table 2 in weight % asSafeguards inspectors have been our clients [4].
FILAMENT CURRENT INCREMENT
238 239 240 241 242 242 241 240 239 238
Figure 3: Scan Scheme for Data Taking for Total Evaporation Measurements on a THQ
Table 2: Reproducibility over 3 Days (in weight %)
Day
123
No. ofFilaments
131213
AverageRsd (%)
238
0.27260.0270.2662
0.2961.2
239
77.658877.666677.6574
77.66090.006
240
18.809418.815418.8233
18.81610.04
241
2.03272.02462.0334
2.03020.24
242
1.21881.221.2194
1.21940.05
Effects of Isobaric Interference and Baseline
U samples which are incompletely separated from Pu and measured by totalevaporation could suffer from interference on the ion intensity of 238U due to thepresence of isobaric 238Pu. For Pu samples the 238Pu intensity can be influenced bythe presence of 238U and the 241Pu intensity can be affected by 241Am [5]. The
- 2 3 - AECL-11342
possibility of over-correction can occur when a dirty sample is measured with the totalevaporation method. This phenomena could be seen on samples which did notreceive any chemical treatment and gave a very reproducible negative value for236Uon "natural" uranium.
Conclusion
The total evaporation method is less susceptible to errors resulting from variations inthe amount of U and Pu loaded on the mass spectrometer filament. Thereproducibility of repeated measurements is also improved by a factor of 2 to 4 whilethe accuracy is at least as good as in the conventional method. However, as with theconventional method, it will be necessary to perform a cup efficiency calibration. Theuse of total evaporation for IDMS analysis offers the maximum improvement inperformance with a minimum risk. Some negative influences when using the totalevaporation method for all mass spectrometric measurements are shown and it isnecessary to further evaluate the sensitivity of the method to isobaric and concomitantelement interference effects.
References
[1] M. Romkowski, S. Franzini and L. Koch Proceed. ESARDA Symp. 12-14May,1987, London.
[2] P. De Bievre, R. Fiedler, P. Hansen, K. Mayer, R. Perrin and P. Taylor PrincipleRequirements for Accurate Mass Spectrometric Measurements, to be published.
[3] R. Fiedler, D. Donohue, G. Grabmueller and A. Kurosawa Report on PreliminaryExperience with Total Evaporation Measurements in Thermal lonization MassSpectrometry, Int. J. Mass Spectrom. Ion Processes, 132, 207-215 (1994).
[4] R. Fiedler, A.Reichart and J. Cappis Total Evaporation Measurements ofPlutonium with a Thermo Quadrupole Mass Spectrometer (THQ), IAEA/AL/020,(March 1989).
[5] R. Fiedler Americium Content Determination Done on a Thermo QuadrupoleMass Spectrometer (THQ) using Total Evaporation Technique,IAEA-SAL/AL/024, (1990).
- 2 4 - AECL-11342
Total Evaporation in Thermal lonization Mass Spectrometry
E. Larry Callis and John H. Cappis ct =>' CT
Los Alamos National Laboratory, Los Alamos, New Mexico 87545
Introduction
The total evaporation method, in which the entire sample is evaporated whileintegrating the signal from each isotope using a multicollector system, has now beenin routine use at our laboratory for uranium and plutonium analyses for several years[1,2]. By integrating out the effects of isotope fractionation, high precision, typically<0.02% relative standard deviation (RSD), is obtained with a minimum of rigor insample loading and treatment schemes. In fact, the advantages of total evaporationbecome more apparent in real-world analysis situations in which the precise quantity ofsample loaded may not be known and sample purity may be questionable. Recently,we have performed tests to demonstrate the effectiveness of the method on actualand impure test samples.
Experimental
In a study conducted with the International Atomic Energy Agency (IAEA) SafeguardsAnalytical Laboratory (SAL) in Seibersdorf, Austria, uranium and plutonium sampleswere prepared and analyzed by SAL using conventional techniques, and a portion wasshipped to Los Alamos for analysis using the total evaporation technique. Averageprecisions (% RSD) obtained on four replicate runs on each of 12 uranium and 12plutonium samples, ranged from <0.01% for 240/239 Pu ratios to <0.02% for233/238 U and 244/239 Pu ratios. These results demonstrated that standard chemicalpurification methods used at SAL were more than adequate for analyses by the totalevaporation method, and that significant improvements in precision and accuracy wereprovided by the total evaporation method. These techniques have since beenimplemented at SAL with good results; see [3] and R. Fiedler's paper in theseproceedings.
Recently, in a continuation of this work, experiments were conducted to assess theeffects of certain impurities on the total evaporation method for uranium. Solutions ofNIST U-500 isotopic standard were spiked with Na, Ca, K, Fe, Zr and Ba (individually)at levels of 1%, 10%, and 100% (by weight) relative to the uranium concentration of1 mg/ml. Four analyses of each of these 18 solutions were performed, interspersedwith analyses of unspiked U-500.

- 2 5 - AECL-11342
Results and Discussion
The results of these analyses are shown in Table 1. It appears that only Fe, andpossibly Na display any discernible effect, and then only at the highest concentrationlevel. Hopefully, this situation is not encountered often in most laboratories! Inaddition, the effect is small, about 0.02%. This is certainly good news for laboratoriesworking with impure materials. Of course, many other impurity elements should bestudied, but it would be surprising if the effects were large.
Table 1: Percentage Deviations of the Average Observed 235/238 U Ratios from theObserved Pure U-500 Value and the Precision Observed on 4 FilamentLoadings
Concentration "
1%
10%
100%
Na
-0.013+0.014
-0.000±0.24
-0.015±0.009
Ca
+0.004±0.010
-0.008±0.017
-0.002±0.021
Impurity
K
+0.010+0.010
+0.010±0.010
+0.010±0.010
Added
Fe
+0.016+0.028
-0.004±0.011
-0.022±0.008
Zr
+0.016+0.033
+0.002±0.011
-0.007±0.006
Ba
-0.002±0.009
+0.011±0.006
+0.004±0.008
Note: The observed value for unspiked U-500 was 0.99991 ± 0.000126 (1s) for N=29. The certifiedvalue is 0.9997 ± 0.001.
In spite of the success of this technique, there are nagging problems which currentlylimit the ultimate precision and accuracy of the method. One of these, of course, isthe determination of the relative efficiencies of the collectors. It appears that aversatile, reliable, and accurate method has not yet been developed. At the presenttime, calibration methods appear to be good to about 0.01%. A method previouslydiscussed by this author [2], applicable to adjustable collector systems, requiresspecial isotope mixtures and is rather time consuming. The method of "peak-jumping"a single stable ion beam to each collector in turn by stepping the magnet, often seemsto give strange results. The efficiencies vary with element and filament loading, welloutside the apparent precision of the data. An explanation for these variations is notreadily apparent, and the calibration problem certainly should be investigated further.

- 2 6 - AECL-11342
Another problem is that of the occasional "odd" result. For uranium, this usuallyappears as a high 235/238 ratio (0.03 to 0.07%) and is accompanied by a high-temperature "tail" on the intensity vs. filament current profile. This may be due to theproduction on the filament of chemical species, perhaps carbides, that are less volatileand hence prevent total evaporation. Further work is planned to try to resolve some ofthese questions.
References
[1] E.L. Callis and R. M. Abernathey, Proceedings of the 36th ASMS Conference onMass Spectrometry and Allied Topics, June 5-10, 1988, San Francisco.
[2] E.L. Callis and R. M. Abernathey, Int. J. Mass Spectrom. Ion Proc. 103, 93(1991).
[3] R. Fiedler, D. Donohue, G. Grabmueller, A. Kurosawa, Int. J. Mass Spectrom. IonProc. 132, 207 (1994).
Acknowledgement
This work was supported by the US D.O.E. through the US Program for TechnicalAssistance to IAEA Safeguards (POTAS) under Task A. 169.

- 2 7 - AECL-11342
Determination of Trace Iron in Zirconium </, .•'-by Isotope Dilution Thermal lonization Mass Spectrometry
N.L. Elliot, M.A. Campbell and L.W. Green !J^ u ° J ( '"AECL Research, Chalk River Laboratories, Chalk River, Ontario, Canada KOJ 1J0
Introduction
Zirconium alloys are used commonly in the construction of in-core components ofnuclear reactors. Trace elements affect the mechanical and irradiation deformationproperties of these zirconium alloys, therefore control of the abundances of impuritiescould lead to stronger, longer-lasting components. The effect of iron on themechanical properties of irradiated zirconium is not well understood. Iron is known toincrease the rate of self-diffusion in a-Zr [1], which would suggest that the irradiationgrowth rate of a-Zr should increase with Fe concentration. However, studies ofpressure tubes varying in Fe content from 100-2000 ppm have shown the opposite.Studies related to corrosion and hydrogen ingress suggest that the iron level should bekept below 500 ppm [2]. Part of the ambiguity comes from the lack of reliableanalytical methods for iron in zirconium, and consequently, a TIMS method for thedetermination of ppm levels of Fe was developed.
Procedure
Separation from the zirconium matrix was necessary in order to obtain sufficientsensitivity, and a two-stage purification procedure was used combining ion-exchangechromatography and micro-scale solvent extraction. In brief, the spiked sample isapplied to an 0.5 mL column of AG1-X8 (100-200 mesh) in 4 M HCI. Iron(lll) isretained by the resin whereas Zr(IV) washes through [3]. Iron is eluted with 5 columnvolumes of 0.25 M HCI, and, after concentration to a small volume, the fraction isfurther purified by equilibration with three tributylphosphate-impregnated XAD-2 resinbeads. A separation factor of approximately 105 is obtained in 4 M HCI [4].Interferences from Ca, K, Ni and Cr are also lessened as they have distributioncoefficients of <10'2 into TBP.
Sub-microgram amounts of the purified iron were loaded on previously outgassedzone-refined Re filaments with a silica gel/boric acid ionization enhancer, and the54/56 ratios were measured at 1170°C. No corrections were necessary for isobaricinterferences, as ^Cr was normally <0.03% of ^Fe. Although iron has a high firstionization potential (7.87 eV), stable Fe+ currents could be obtained from less than10 ng.
- 2 8 - AECL-11342
Results and Discussion
In order to test the procedure, two sets of iron in zirconium standards were prepared:i) solution standards containing 4-100 ppma Fe were prepared by dissolution ofultrapure Fe wire and ultrapure Zr, and ii) metallic standards containing 23-150 ppmaFe were prepared by pressing high-purity Fe wire into ultrapure Zr and annealing for15 days at 948°C, 10"9 torr. The results of the analyses are shown in Table 1.
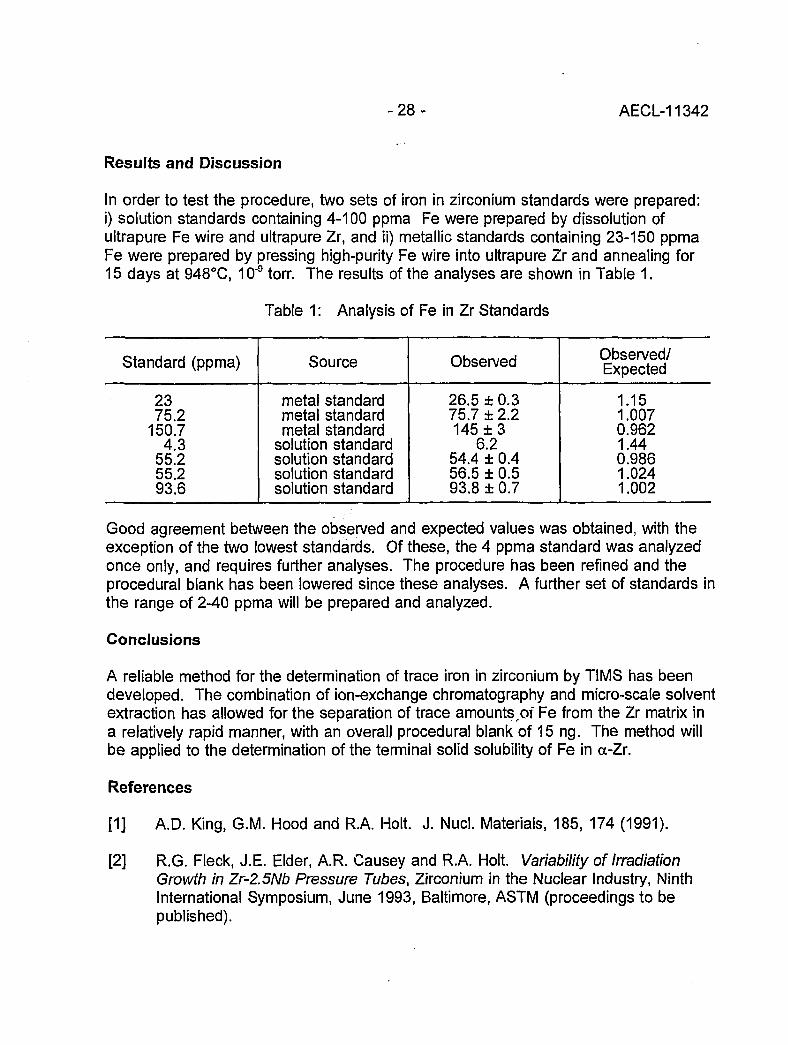
Table 1: Analysis of Fe in Zr Standards
Standard (ppma)
2375.2
150.74.3
55.255.293.6
Source
metal standardmetal standardmetal standard
solution standardsolution standardsolution standardsolution standard
Observed
26.5 ± 0.375.7 ±2.2145 ± 3
6.254.4 ± 0.456.5 ± 0.593.8 ± 0.7
Observed/Expected
1.151.0070.9621.440.9861.0241.002
Good agreement between the observed and expected values was obtained, with theexception of the two lowest standards. Of these, the 4 ppma standard was analyzedonce only, and requires further analyses. The procedure has been refined and theprocedural blank has been lowered since these analyses. A further set of standards inthe range of 2-40 ppma will be prepared and analyzed.
Conclusions
A reliable method for the determination of trace iron in zirconium by TIMS has beendeveloped. The combination of ion-exchange chromatography and micro-scale solventextraction has allowed for the separation of trace amounts pi Fe from the Zr matrix ina relatively rapid manner, with an overall procedural blank of 15 ng. The method willbe applied to the determination of the terminal solid solubility of Fe in cc-Zr.
References
[1] A.D. King, G.M. Hood and R.A. Holt. J. Nucl. Materials, 185, 174 (1991).
[2] R.G. Fleck, J.E. Elder, A.R. Causey and R.A. Holt. Variability of IrradiationGrowth in Zr-2.5Nb Pressure Tubes, Zirconium in the Nuclear Industry, NinthInternational Symposium, June 1993, Baltimore, ASTM (proceedings to bepublished).

- 2 9 - AECL-11342
[3] Comprehensive Analytical Chemistry, ed. G. Svehla, Vol. XIV Ion Exchangers inAnalytical Chemistry, 1982.
[4] J. of Chromatography Library, Vol. 2, Extraction Chromatography, ed. T. Braunand G. Ghersini, 1975.

- 3 0 - AECL-11342
IDMS of FeO(OH) Extracted from Blood Digests forStudies of Iron Metabolism in Humans
N.E. Vieira and A.L. YergeyLaboratory of Theoretical and Physical Biology, National Institute of Child Health and
(i Human Development, 10 Center Drive, Bethesda, MD 20892
S.A. AbramsChildren's Nutrition Research Center, 1100 Bates St., Houston, TX 77030
Introduction
Over the past ten years, interest in the use of metal stable isotopes for the study ofhuman mineral metabolism has increased rapidly. Iron absorption studies reported inthe recent literature use anion exchange column chromatography as a preparativemethod for mass spectrometric analysis. Our interest was to develop a more rapid anddirect isolation procedure. We compared three preparative methods: (1) hydroxideprecipitation, (2) ion exchange chromatography using membrane filters, and (3)untreated matrix evaporated and dissolved in dilute acid. The matrices investigatedwere water and digested human whole blood.
Materials and Methods
Acid washed glassware and plasticware were used for all sample preparation.Reagents used were: J. T. Baker Ultrex II NH4OH, HCI, HNO3, and H3PO4; 'BakerAnalyzed1 absolute methanol; 'Baker Analyzed' Fe Atomic Spectral Standard; anddeionized water (Hydro Services, Rockville, MD). The ion exchange membrane filtersevaluated were the following Bio-Rex 25 mm Sample Preparation Discs (Bio-RadLaboratories, Richmond, CA): (a) AG 50W-X8 Cation Exchange Resin, and ( b)AG 1-X8 Anion Exchange Resin. Isotopic ratios were measured by thermal ionizationmass spectrometry using a silica gel/phosphoric acid technique [1]. Fe isotope ratioswere determined using the Finnigan MAT THQ Thermoquad mass spectrometer in thesingle filament mode with electron multiplier detection. Whole human blood wasdigested in HNO3 using the CEM Microwave Digestion System Model MDS 81D.
Cation membrane filters were loaded with 1 mL water matrix (50 ug/mL Fe) or 2 mLblood digest (15 ug/mL Fe, pH adjusted to >2). Fe was eluted with 5 and 6 mL 3 MHCI for water and digest, respectively. Anion exchange membrane filters were loadedwith 1 mL water matrix (50 ug/mL Fe) or 2 mL digest (20 ug/mL Fe, pH adjusted to<1) and a 0.3 M HCI solution was used for Fe elution.

-31 - AECL-11342
The Fe precipitation was based on the procedure described previously [2].Concentrated NH4OH was added to bring the pH of each sample (Fe-containingmatrices of water, whole blood digest and ion exchange eluent) to 10. A red/brownprecipitate was observed after a 4-hour period. The precipitate was centrifuged at2000 rpm for 10 minutes and the supernatant discarded. The precipitate was dried inan oven for 15 minutes at 100°C and dissolved in 100 uL of 3% HCI.
Standard curves were prepared in water and blood digest matrices by the addition ofaliquots of a 96.44 atom% enriched 54Fe tracer solution. The tracer was allowed toequilibrate in the matrix 1 day at room temperature. Enrichments ranged from 10 to100% excess 54Fe. The equilibrated curves were divided into 3 treatment groups:(1) directly precipitated. (2) cation exchange separation followed by precipitation, and(3) directly evaporated (1.3 mL digest was evaporated using microwave heating andlow power settings over a period of 70 minutes with the remaining liquid dried in anoven at 100°C). All precipitates were dissolved in 100 uL of 3% HCI.
Results
Total Fe recovery for the 3 isolation procedures investigated is shown in Table 1.
Table 1: Percent Recovery of Fe from Water and Whole Blood Digest usingIon Exchange Membrane Filters and Hydroxide Precipitation
Extraction Method
cation:ugFe% recovery
anion:ug Fe% recovery
precipitation:ug Fe% recovery
Water
5072
50no adsorption
13399 ±5
Digest
3091
40observed
40-13039 ± 4
Eluent
—
—
2555*
*(n=1)
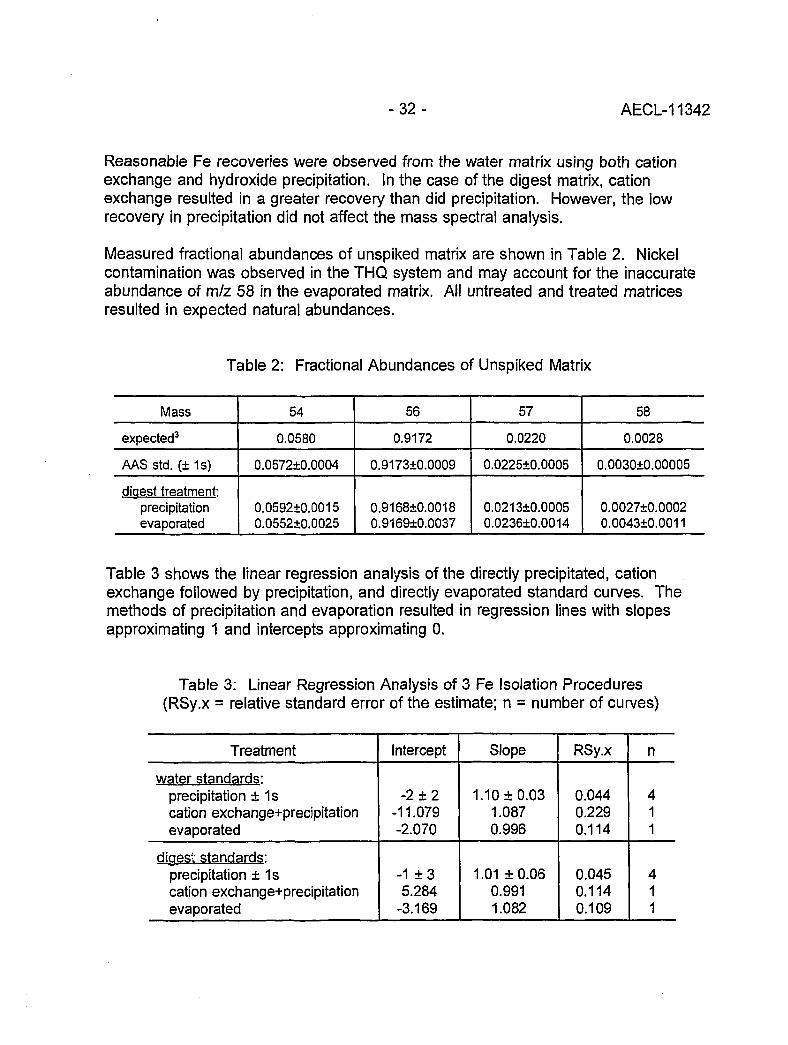
- 3 2 - AECL-11342
Reasonable Fe recoveries were observed from the water matrix using both cationexchange and hydroxide precipitation. In the case of the digest matrix, cationexchange resulted in a greater recovery than did precipitation. However, the lowrecovery in precipitation did not affect the mass spectral analysis.
Measured fractional abundances of unspiked matrix are shown in Table 2. Nickelcontamination was observed in the THQ system and may account for the inaccurateabundance of m/z 58 in the evaporated matrix. All untreated and treated matricesresulted in expected natural abundances.
Table 2: Fractional Abundances of Unspiked Matrix
Mass
expected3
M S std. (± 1s)
diaest treatment:precipitationevaporated
54
0.0580
0.0572±0.0004
0.0592+0.00150.055240.0025
56
0.9172
0.9173±0.0009
0.9168+0.00180.9169±0.0037
57
0.0220
0.0225±0.0005
0.0213±0.00050.0236±0.0014
58
0.0028
0.0030±0.00005
0.0027+0.00020.0043±0.0011
Table 3 shows the linear regression analysis of the directly precipitated, cationexchange followed by precipitation, and directly evaporated standard curves. Themethods of precipitation and evaporation resulted in regression lines with slopesapproximating 1 and intercepts approximating 0.
Table 3: Linear Regression Analysis of 3 Fe Isolation Procedures(RSy.x = relative standard error of the estimate; n = number of curves)
Treatment
water standards:precipitation + 1scation exchange+precipitationevaporated
digest: standards:precipitation ± 1scation exchange+precipitationevaporated
Intercept
-2 ± 2-11.079-2.070
- 1 + 35.284
-3.169
Slope
1.10 ±0.031.0870.996
1.01 ±0.060.9911.082
RSy.x
0.0440.2290.114
0.0450.1140.109
n
411
411

- 3 3 - AECL-11342
Conclusions
Although recovery is better with cation exchange techniques, overall precision ofisotope dilution analysis favors use of the direct precipitation approach. In addition,precipitation is a simple and rapid one-step method not requiring time intensive stepsby the investigator.
References
[1] I.L. Barnes, T.J. Murphy, J.W. GramLich, W.R. Shields, Anal. Chem. 45, 1881(1973).
[2] G. Hagg, General and Inorganic Chemistry (Wiley, New York, 1969), p. 729.
[3] P. De Bievre, I.L. Barnes, Int. J. Mass Spectrom. Ion Processes. 65, 211 (1985).
- 3 4 - AECL-11342
Characterization of Uranium in Surface-WatersCollected at the Rocky Flats Facility
D.W. Efurd, D.J. Rokop, R.D. Aguilar, F.R. Roensch, R.E. Perrin and J.C. Banar, Chemical Science and Technology Division
» Los Alamos National Laboratory, Los Alamos, NM 87544, USA
Introduction
The Rocky Flats Plant (RFP) is a Department of Energy (DOE) facility whereplutonium and uranium were handled. During plant operations radioactivity wasinadvertently released into the environment. This study was initiated to characterizethe uranium present in surface-waters at RFP. Three drainage basins and naturalephemeral streams transverse RFP. The Woman Creek drainage basin traverses anddrains the southern portion of the site. The Rock Creek drainage basin drains thenorthwestern portion of the plant complex. The Walnut Creek drainage basintraverses the western, northern, and northeastern portions of the RFP site. Dams,detention ponds, diversion structures, and ditches have been constructed at RFP tocontrol the release of plant discharges and surface (storm water) runoff. The pondslocated downstream of the plant complex on North Walnut Creek are designated A-1through A-4. Ponds on South Walnut Creek are designated B-1 through B-5. Theponds in the Woman Creek drainage basin are designated C-1 and C-2. Watersamples were collected from each pond and the uranium was characterized by TIMSmeasurement techniques [1].
Results
Table 1 reports the highest uranium concentration measured in the RFP ponds duringthis study. For comparison, the uranium concentrations in three reservoirs near RFPand two wells in Colorado are also reported [2,3,4].
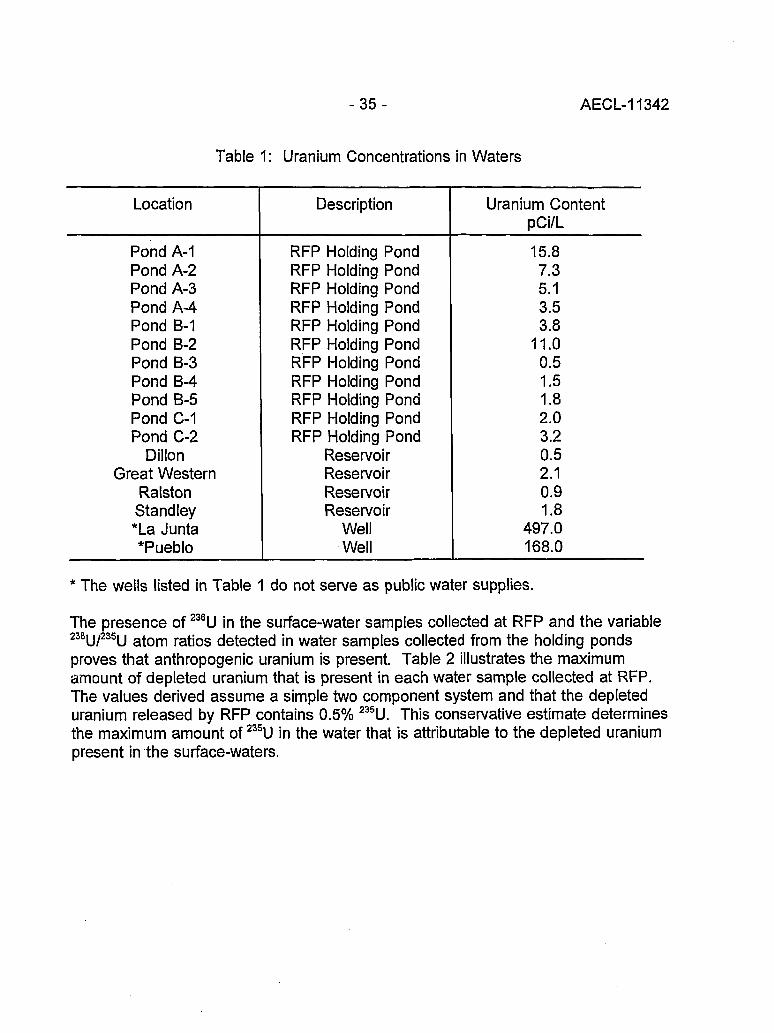
- 3 5 - AECL-11342
Table 1: Uranium Concentrations in Waters
Location
Pond A-1Pond A-2Pond A-3Pond A-4Pond B-1Pond B-2Pond B-3Pond B-4Pond B-5Pond C-1Pond C-2
DillonGreat Western
RalstonStandley*La Junta*Pueblo
Description
RFP Holding PondRFP Holding PondRFP Holding PondRFP Holding PondRFP Holding PondRFP Holding PondRFP Holding PondRFP Holding PondRFP Holding PondRFP Holding PondRFP Holding Pond
ReservoirReservoirReservoirReservoir
WellWell
Uranium ContentpCi/L
15.87.35.13.53.8
11.00.51.51.82.03.20.52.10.91.8
497.0168.0
* The wells listed in Table 1 do not serve as public water supplies.
The presence of 236U in the surface-water samples collected at RFP and the variable238U/23SU atom ratios detected in water samples collected from the holding pondsproves that anthropogenic uranium is present. Table 2 illustrates the maximumamount of depleted uranium that is present in each water sample collected at RFP.The values derived assume a simple two component system and that the depleteduranium released by RFP contains 0.5% 235U. This conservative estimate determinesthe maximum amount of 235U in the water that is attributable to the depleted uraniumpresent in the surface-waters.

- 3 6 - AECL-11342
Table 2: Maximum Percentage of 235U in Water Attributable toRelease of Depleted Uranium at RFP
DateSampled
02/24/9305/12/9308/24/9311/25/9305/12/9302/24/9308/24/9311/25/9202/24/9305/12/9308/24/9310/23/9211/24/9212/14/9201/14/9302/23/9303/17/9304/21/9305/12/9306/15/9307/15/9308/23/9311/25/9205/13/9302/24/9308/24/9311/25/9305/13/9302/24/9308/24/9311/25/9202/24/93
Pond
A1A1A1A2A2A2A2A3A3A3A3A4A4A4A4A4A4A4A4A4A4A4B1B1B1B1B2B2B2B2B3B3
MaximumPercentage
250
10081465066
1005780
1008117414053584945545631142317230
5750561223
DateSampled
05/13/9308/24/9311/25/9205/13/9302/24/9308/24/9310/23/9211/24/9212/14/9201/14/9302/23/9303/17/9304/21/9305/13/9306/15/9307/15/9308/23/9312/03/9205/13/9302/23/9308/23/9310/23/9211/25/9212/14/9201/14/9302/23/9303/17/9304/15/9305/13/9306/15/9307/15/9308/24/93
Pond
B3B3B4B4B4B4B5B5B5B5B5B5B5B5B5B5B5C1C1C1C1C2C2C2C2C2C2C2C2C2C2C2
MaximumPercentage
3536192625191310122118181716461612
1010
6360515851525353465154
- 3 7 - AECL-11342
Conclusions
The upper Ponds A-1, A-2, A-3, B-1, B-2, B-3, and B-4 contain measurable quantitiesof depleted uranium. The uranium concentrations in water samples collected fromthese ponds ranged from 0.2 to 15.8 pCi/L. Essentially 100% of the uranium in PondA-1 and Pond A-2 originated as depleted uranium. All other ponds, except Pond C-1,contain mixtures of naturally occurring and depleted uranium. Approximately half ofthe uranium present in Ponds A-4 and C-2 originated as depleted uranium.Approximately 20% of the uranium in the waters collected from Pond B-5 originated asdepleted uranium. Approximately 50% of the uranium detected in the waters collectedfrom Pond C-2 was anthropogenic.
Acknowledgements
This project was funded by EG&G Rocky Flats Plant under the auspices of contract No.LATO-EG&G-91-022.
References
[1] D.W Efurd, D.J. Rokop and R.E. Perrin, "Characterization of the Radioactivity inSurface-Waters and Sediments Collected at the Rocky Flats Plant," Los AlamosNational Laboratory report LA-UR-93-4373, 1993.
[2] J.D. Parson and R.G. Warren, "Uranium Hydrogeochemical and StreamSediment Reconnaissance of the La Junta NTMS Quadrangle, Colorado,Including Concentrations of Forty-three Additional Elements," Los AlamosNational Laboratory report LA-7343-MS, 1979.
[3] S.S. Shannon, "Uranium Hydrogeochemical and Stream SedimentReconnaissance of the Pueblo NTMS Quadrangle, Colorado, IncludingConcentrations of Forty-two Additional Elements," Los Alamos NationalLaboratory report LA-7541-MS and suppl., 1978.
[4] N.M. Daughtry Ed., "Rocky Flats Site Environmental Report For 1988," RockyFlats report RFP-ENV-88, 1989.
L <e
- 3 8 - AECL-11342
Extraction and Measurement of Subpicogram Quantities of Technetium fromGeologic and Other Matrices
P.R. Dixon, D.J. Rokop, J.T. Fabryka-Martin, and D.B. CurtisLos Alamos National Laboratory, CST, MS-J514, Los Alamos, NM 87545, USA
introduction
The need to measure "Tc in a variety of sample matrices (e.g. soils, rock and water)is becoming increasingly important for detailed tracing of processes related to nuclearwaste disposal, monitoring of contaminated ground water movement, and nuclear non-proliferation activities around the world. This demand has led us to develop a robustmethod for separating and purifying trace amounts (subpicogram/gram) of "Tc fromvarious matrices. This extended abstract describes the extraction methodologies andthe analytical precision and accuracy for small samples.
Approach and Techniques
Previous work
Accurate and precise measurement of subpicogram quantities of technetium in smallenvironmental samples, 1-10 g of solid material and 1-100 of mL water, entails the useof negative thermal ionization mass spectrometry (NTIMS) and ultra clean chemicalseparation techniques. Most of the previous work on extraction, purification andanalysis of technetium has been on large samples, 1 to 1000 L water and 20 g to 1.0kg of biologic or geologic material [1-10], with detection limits between 1 to 500picogram/gram. Most of these analyses were done by inductively coupled plasmamass spectrometry (ICP/MS), with minimal chemistry. Several papers have reportedthe analysis of technetium at the subpicogram level in waters using a NTIMS method[11] and a silica gel /TIMS method [12]. Trautmann [13] claims femtogramdetectability using laser resonance ionization mass spectrometry (RIMS), but presentsno environmental data. In this paper we describe a robust method for the extraction,purification and analysis of technetium at the femtogram level in small water and solidsamples.
Technetium Isolation Procedure
An extraction and purification technique for "Tc from both geologic (uranium ores andsediments) and water samples has been developed at Los Alamos as part of itsnatural analogues research activities. For geologic samples, the technique consists of

- 3 9 - AECL-11342
spiking the sample with 97Tc followed by a sodium peroxide/sodium hydroxide fusion.The fusion cake is then dissolved in de-ionized water, the hydroxide precipitates areremoved, and the Tc is extracted from the aqueous fusion solution into aTPA/chloroform mixture. The Tc is back-extracted from the TPA/chloroform solutionwith 8 M HNO3, then it is further purified through 1-mL and 100-uL anion columnscharged with AG-MP1 resin (100-200 mesh). The final purification step ismicrodistillation in a 5-mL Teflon conical vial. For water samples, the techniqueconsists of adding 97Tc spike to the sample along with H2SO4 and Ce+4to assuresample and spike equilibration. Once equilibration is achieved, the technetium isextracted from the aqueous solution with a TPA/chloroform mixture, and the aboveprocedure is followed.
Total chemistry yields for samples with less than 10 picogram of total Tc are 10 to30%. In samples with more than 10 picogram of total Tc, the chemistry yields are 50to 90%. A small but quantifiable amount of Tc is always lost during chemistry,regardless of sample size, such that large samples always have higher yields thansmall samples.
Mass Spectrometry and Filament Loading
Our analyses of Tc isotopes use the negative ionization configuration (NTIMS) massspectrometry technique reported by Rokop and others [14] to measure 10 to 100 fgfilament loads of Tc. Using this low temperature (1050 ± 5°C) NTIMS method incombination with a lanthanum oxide ionization enhancer on a NBS source filamentassembly, isobaric corrections for Mo and organics have been virtually eliminated.Using standards, we have determined that our detection limit for "Tc is 5x10⁵ atomsor 0.1 femtograms. Our full chemistry/mass spectrometry blank based on 10 analysesis 5.4 femtograms or 3.3x10⁷ atoms. Our measurement limit, defined as 3a of ourblank, is 8.4x10⁷ atoms or 14 femtograms. Our external reproducibility (chemistry andmass spectrometry) using a Canadian uranium ore standard measured 6 times overan 8-month period (BL-5, "Tc concentration = 56.2 ± 0.8 fg/gm) has a precision andaccuracy of ~1.5%.
Initial Data Interpretation
A major application of this Tc work has been evaluation of the feasibility of geologicstorage and disposal of spent nuclear fuel. The abundance of "Tc in natural uraniumminerals can be used to determine alteration/dissolution and radionuclide release ratesunder a variety of natural geochemical conditions that bracket most proposedrepository sites [16-19]. We have developed a model to predict the equilibriumconcentration of "Tc and other radionuclides produced during the fission of naturaluranium [19]. Excesses and depletions of "Tc in both rocks and ground waters from
- 4 0 - AECL-11342
Cigar Lake in Canada and Koongarra in Australia have been used to set limits onuranium mineral alteration and radionuclide release rates at these geochemicallydifferent sites [16-19]. We are now working with Yucca Mountain PerformanceAssessment (YMPA) staff to incorporate relevant information from this research intothe YMPA process to test safety and release scenarios for site licensing.
Conclusions
We have developed a robust method for extracting and purifying picogram andsubpicogram amounts of Tc from geologic, biologic and water samples. Combiningthese extraction and purification technologies with existing NTIMS analysis capabilitiesat Los Alamos, we are able to consistently measure with high precision and accuracysubpicogram amounts of "Tc in a variety of materials. This extreme sensitivity allowsus to study alteration rates of natural uranium minerals, identify the leading edge andextent of radioactive contamination plumes, and monitor nuclear non-proliferationactivities around the world.
References
[1] H. Hidaka, K. Shinotsuka and P. Holliger, Radiochim. Acta 63, 19 (1993).
[2] N. Matsuoka, T. Umata, Okamura, N. Shiraishi, N. Momoshima and Takashima,J. Radioanal. Nucl. Chem., 140, 57 (1990).
[3] T.J. Anderson and R.L Walker, Anal. Chem. 52, 709 (1980).
[4] S. Morita, C.K. Kim, Y. Takaku, R. Seki and N. Ikeda, Appl. Radiat. Isot., 42,531 (1991).
[5] N. Momoshima, M. Sayad and Y. Takashima, Radiochem. Acta, 63, 73 (1993).
[6] K. Tagami and S. Uchida, Radiochem. Acta, 63, 69 (1993).
[7] S. Morita, K. Tobita and M. Kurabayashi, Radiochem. Acta, 63, 63 (1993).
[8] J.S. Crain and D.L. Gallimore, Appl. Spectra., 46, 547 (1992).
[9] D.M. Beals, Determination of Technetium-99 in aqueous samples by isotopedilution inductively coupled plasma mass spectrometry, in Proceedings from the3rd International Conference on Nuclear and Radiochemistry, Vienna, Austria,September, 1992.

- 4 1 - AECL-11342
[10] S. Hirano and M. Matsuba, Radiochim. Acta, 63, 79 (1993).
[11] N.C. Schroeder, D. Morgan, D.J. Rokop and J. Fabryka-Martin, Radiochem.Acta, 63, 203 (1993).
[12] J.M. Pochkowski and D.M. Beals, Determination of subpicogram quantities ofTechnetium-99 in environmental samples by positive thermal ionization massspectrometry, in Proceedings of the 41st ASMS Conference on MassSpectrometry, p.182, 1993.
[13] N. Trautmann, Radiochim. Acta, 63, 37 (1993).
[14] D.J. Rokop, N.C. Schroeder and K. Wolfsberg, Anal. Chem., 62, 1271 (1990).
[15] P.R. Dixon, Curtis, D.B. and J.T. Fabryka-Martin, GSA Astr. with Prog., 25, A-184 (1993).
[16] P.R. Dixon, J.T. Fabryka-Martin, D.B. Curtis, D.J. Rokop, J. Cramer, J. Cornett,L. Kilius and P. Sharma, Modeling and measurements of in-situ producednuclides in uranium minerals: Implications for spent fuel stability, in ProceedingsEighth International Conference of Geochronology and Cosmochronology, andIsotope Geology (ICOG-8), Berkeley, CA, 1994.
[17] D.B. Curtis, J.T. Fabryka-Martin and P.R. Dixon, Natural constraints onradionuclide release rates, in Proceedings of the Natural Analogues WorkingGroup (NAWG-5), Toledo, Spain, 1992.
[18] D.B. Curtis, J.T. Fabryka-Martin, P.R. Dixon, R. Aguilar, D.J. Rokop andJ. Cramer, Radionuclide releases from natural analogues of spent nuclear fuel,in Proceedings Migration-93, Charlotte, NC, 1993.
[19] J. Fabryka-Martin and D.B. Curtis, Geochemistry of 239Pu, 1 2 9 I , "Tc and 36CI, inFinal Report Alligator Rivers Analogue Project, 15, Ed. by Australian NuclearScience and Technology Organization, Report No. ISBN-0-642-59941-6, 1992.

- 4 2 - AECL-11342
THERMAL lONIZATION MASS SPECTROMETRY
Instrumentation

- 4 3 - AECL-11342
A High Efficiency Thermal lonization Source Adapted To Mass Spectrometers
E. Phil Chamberlin and Jose A. Olivares ! ' • w
Los Alamos National Laboratory, Los Alamos, NM 87545, USA
Introduction
The high temperature ion source used on the isotope separators at Los Alamos wasoriginally developed almost simultaneously by Beyer in Dubna [1] and Johnson atLivermore [2]. Some contemporaries of the authors claim that the concept for thesource arose from a discussion between two of the authors at a conference and thatcredit for the work should be shared jointly. During the past ten years we havelearned how to make the source produce reliably and with high throughput.Experience seems to be an important factor in determining what not to do. If reliableoperation of the ion source were as simple as the authors of the two papers implied,this type of ion source might be in wider use today.
There are three requirements for repeatable results with high throughput: a well-engineered physical assembly that will operate at the required high temperatures,contaminant-free chemical preparation of the samples, and a well-understoodoperating procedure. A new user is typically faced with all three of these hurdlessimultaneously, and the challenges can prove daunting. We were fortunate to havefabricated sources on hand similar to that shown in [2]. The chemistry and operationalprocedures followed with time.
Figure 1 indicates the elements for which the source is suitable. Those marginallysuitable are shaded. Both the first ionization potential (through the Saha-Langmuirequation) and the operating temperature (through the vapor pressure of contaminants)affect the ionization efficiency [3,4,5,6]. Using a tungsten crucible that had beenpre-baked to a temperature where thorium could be seen as a contaminant of thetungsten, we achieved an europium ionization efficiency of 72%. Using unbakedcrucibles, 40% efficiencies were the norm. This reflects the results reported in [2].Lutetium has a lower first ionization potential but its vaporization temperature is twicethat of europium. This causes increased vaporization of contaminants includingtungsten, lowering throughputs to 25%. Zirconium is an element having both highionization potential and low vapor pressure and our ionization efficiencies for it rangebetween 2 and 3%.
While experimental and theoretical efforts over the past twenty years have provedfruitful on isotope separators, no one has adapted electron bombardment, cavity typesources to the field of mass spectrometry. The mass spectrometry source most
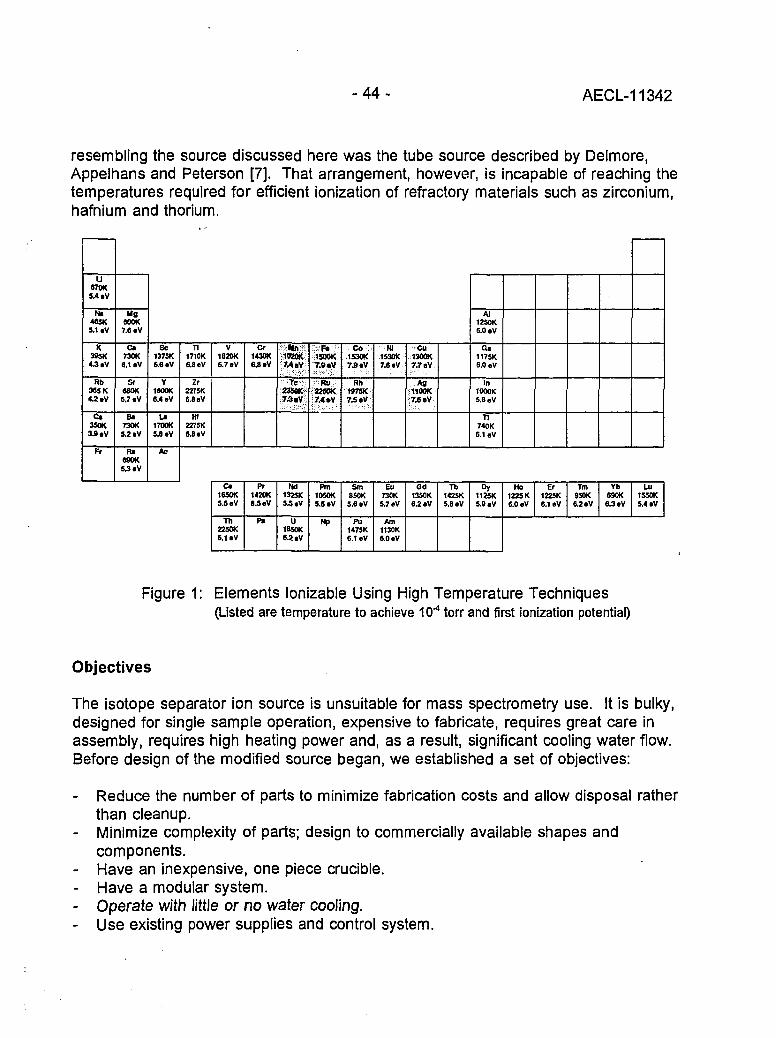
- 4 4 - AECL-11342
resembling the source discussed here was the tube source described by Delmore,Appelhans and Peterson [7]. That arrangement, however, is incapable of reaching thetemperatures required for efficient ionization of refractory materials such as zirconium,hafnium and thorium.
u67OK5.4 .V
46SK5.1 .V
K395K4.3 .V
Rb383K4.2 .V
Ca3S0K3.9 . V
Fr
MOeooK7.6 aV
c>730K6.1 eV
Sf880K5.7 aV
Ba730K5.2 aV
R»S90K5.3 aV
Sc1375K6.6 (V
Y16O0K6.4 aV
U1700K5.8 .V
Ac
Tl1710K6.8 eV
Zr2275K6.8 eV
HI2275K6.8 aV
V1820K6.7 eV
Ca1650K5.5 .V
Th2250K6.1 aV
Cr1430K6.8 aV
Pr1420K5.5 aV
PI
Nit-1«0KMaV
Tc
74.V
Nd132SK54 aV
U1S50K6.2 aV
F*1500KZ » » V
Ru22S0K7.4 »V
Pm1050K5.6 eV
NP
Co1530K7.9 aV
Rh197SK?.SaV
Sm850K5.6 »V
Pu1475K6.1 eV
Nl1530K7.6 aV
Eu730K5.7 eV
Am1130K6.0 aV
Cu1300K7.7 oV
*a1100K7 * B V
Gd1350K6.2 aV
Tb1425K5.8aV
Al1250K6.0 aV
Ga1175K6.0 aV
In1000K5.8 eV
T)740K6.1 eV
Dy112SK5.9 aV
Ho1225 K6.0 aV
Er1225K6.1 aV
Tm95OK6.2 aV
Yb690K6.3 oV
U1550K5.4 aV
Figure 1: Elements lonizable Using High Temperature Techniques(Listed are temperature to achieve 10"4 torr and first ionization potential)
Objectives
The isotope separator ion source is unsuitable for mass spectrometry use. It is bulky,designed for single sample operation, expensive to fabricate, requires great care inassembly, requires high heating power and, as a result, significant cooling water flow.Before design of the modified source began, we established a set of objectives:
- Reduce the number of parts to minimize fabrication costs and allow disposal ratherthan cleanup.
- Minimize complexity of parts; design to commercially available shapes andcomponents.
- Have an inexpensive, one piece crucible.- Have a modular system.- Operate with \itt\e or no water cooling.- Use existing power supplies and control system.
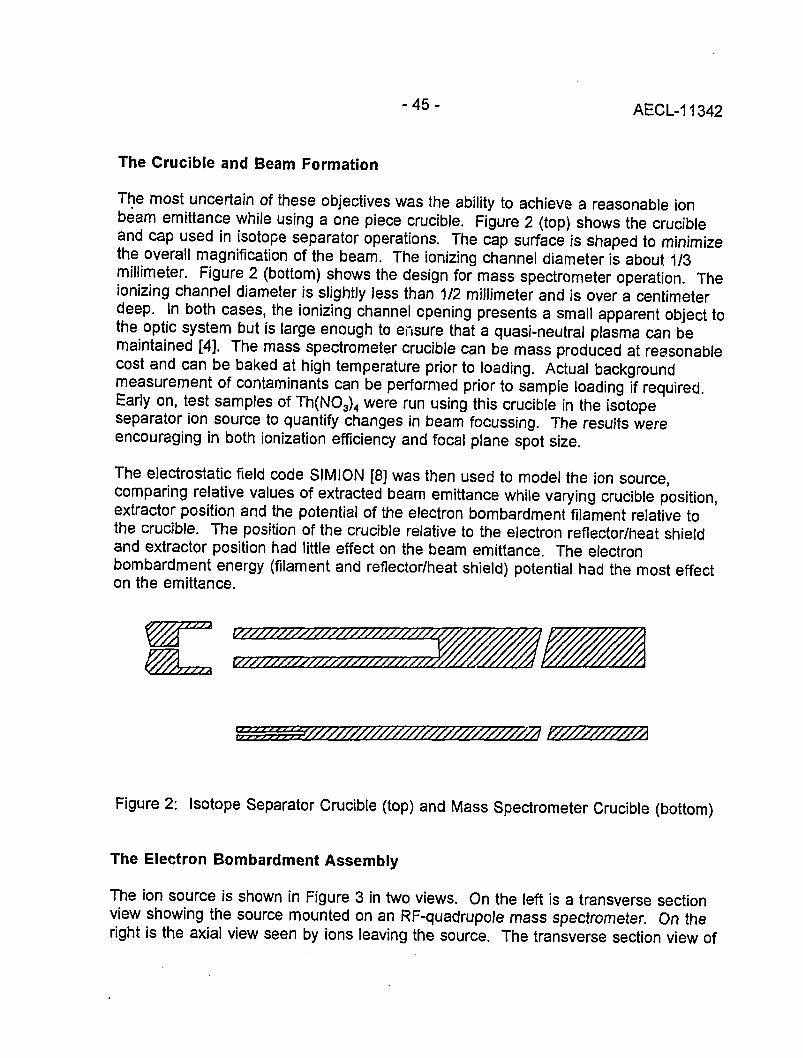
- 4 5 - AECL-11342
The Crucible and Beam Formation
The most uncertain of these objectives was the ability to achieve a reasonable ionbeam emittance while using a one piece crucible. Figure 2 (top) shows the crucibleand cap used in isotope separator operations. The cap surface is shaped to minimizethe overall magnification of the beam. The ionizing channel diameter is about. 1/3millimeter. Figure 2 (bottom) shows the design for mass spectrometer operation. Theionizing channel diameter is slightly less than 1/2 millimeter and is over a centimeterdeep. In both cases, the ionizing channel opening presents a small apparent object tothe optic system but is large enough to ensure that a quasi-neutral plasma can bemaintained [4]. The mass spectrometer crucible can be mass produced at reasonablecost and can be baked at high temperature prior to loading. Actual backgroundmeasurement of contaminants can be performed prior to sample loading if required.Early on, test samples of Th(NO3)4 were run using this crucible in the isotopeseparator ion source to quantify changes in beam focussing. The results wereencouraging in both ionization efficiency and focal plane spot size.
The electrostatic field code SIMION [8] was then used to model the ion source,comparing relative values of extracted beam emittance while varying crucible position,extractor position and the potential of the electron bombardment filament relative tothe crucible. The position of the crucible relative to the electron reflector/heat shieldand extractor position had little effect on the beam emittance. The electronbombardment energy (filament and reflector/heat shield) potential had the most effecton the emittance.
y/0. V///////////////////////////A
JZZZZZZZZZZZZZZZZZZZZZZZZZZZ/.
l j r * * * - * - • * * - Y7////7Z//77/A
Figure 2: Isotope Separator Crucible (top) and Mass Spectrometer Crucible (bottom)
The Electron Bombardment Assembly
The ion source is shown in Figure 3 in two views. On the left is a transverse sectionview showing the source mounted on an RF-quadrupole mass spectrometer. On theright is the axial view seen by ions leaving the source. The transverse section view of

- 4 6 - AECL-11342
the source shows that it consists of three major assemblies: the quadrupole/sourcemounting adapter, the electron bombardment assembly and the crucible holder. Themounting adapter will take a form appropriate to each application. The crucible holdershown is a purely functional item assembled from Conflat vacuum parts together withone machined rod and two set-screws.
U
Figure 3: (Left) The ion source mounted on a quadrupole mass spectrometer.(Right) A coaxial view of the source.
The electron bombardment assembly was designed around a 6 inch diameter,double-sided Conflat blankoff flange. Precise machining operations are minimal andare intended for a numerically-controlled milling machine. Interior parts consist of orare fabricated from easily available commercial components. An alignment jig forfilament fabrication and a necessary welding operation are a part of the design. Thedesign was carried out using AutoCAD-12, making modifications simple when adaptingto specific applications. Cooling water channels have been designed into the systemas shown in the axial view. The flow tubes are arranged laterally on both sides ofeach filament-current electrical feedthrough. These feedthroughs are operated at thefilament bias voltage (up to 2.5 kV) and are a hazard to personnel if not covered. Thewater tubes provide a firm foundation for a clamp-block arrangement which providespersonnel safety protection and a securing post so that the electrical feedthrough doesnot bear the weight of conductors. Without cooling water flowing, the ion source bodymay reach temperatures which could damage adjoining equipment or personnel. Afan directing air onto the source body usually provides sufficient cooling under theseconditions.
Obviously a design which required the operator to break vacuum to introduce eachsample would be less than satisfactory, so there is a multiple crucible system in theinitial design stages.

- 4 7 - AECL-11342
Matching The Ion Beam Into a Sector Type Spectrometer
Figure 4 illustrates a GIOS [9,10], first-order calculation of the proposed matching ofthe ion beam into a 12-inch radius, 90-degree sector type mass spectrometer. Thetop portion of the figure illustrates the beam in the non-dispersive plane and thebottom shows the mass-dispersive plane. The path shown through the system is1.79 meters long. The transverse dimensions shown are ±2 cm. Our objective is tomatch the ion beam into the entrance slit in the dispersive plane and to have a beam
Y
Y-MAX = + / " 0.020 TLU Z - l t tX= 1.790 111)
X-MAX = + / - 0.020 TLU Z-MAX = 1.790 LLU
Figure 4: Calculated ion trajectories from the ion source to the focal plane for 231,232, and 233 amu ions. The top/bottom illustrations are for the non-disperr:; 'e and dispersive planes, respectively.

- 4 8 - AECL-11342
crossover midway through the magnet in the non-dispersive plane. This approachminimizes some aberrations associated with the normal-entrance/normal-exit polepieces of the homogeneous magnet and provides a smaller magnification in thenon-dispersive plane so that the pulse counting apparatus at the focal plane can havea smaller entrance aperture. By not disturbing the entrance slit, exit slit or flight tubeof the existing spectrometers, it should prove expedient to switch between thissource/lens system and the standard thermal ionization arrangement.
The matching system consists of two electrostatic quadrupole doublets arranged in aFD-DF (dispersive plane) geometry. The drift space between the doublets allows foraddition of a pump, emittance defining slits and diagnostic apparatus. The pump willbe required only if a gas-discharge-type source is added at some time in the future. Itis our intent to minimize any increase in the length of the beam matching system sothat the overall length of the system does not become excessive. However, initialsecond and third-order calculations show that too short a drift space between the firstand second quadrupole doublets causes increased aberrations in the non-dispersiveplane. We do not propose achieving short physical length at the cost of beam quality.Therefore, we have deferred finalizing the design of the matching unit until we haveexperimental emittance data in hand.
References
[1] G.J. Beyer, E. Herrmann, A. Piotrowski, V.J. Raiko and H. Tyrroff, Nucl. Instr.Methods 96, 437 (1971).
[2] P.G. Johnson, A. Bolson and CM. Henderson, Nucl. Instr. Methods, 106, 83(1973).
[3] A. Latuszynski and V.I. Raiko, Nucl. Instr. Methods, 125, 61 (1975).
[4] R. Kirchner and A. Piotrowski, Nucl. Instr. Methods, 153, 291 (1978).
[5] M. Huyse, Nucl. Instr. Methods, 215, 1 (1983).
[6] R. Kirchner, Nucl. Instr. Methods, A292, 203 (1990).
[7] J.E. Delmore, A.D. Appelhans and E.S. Peterson, Int. J. Mass Spectrom. IonProcesses, 108, 179 (1991).
[8] D A Dahl and J.E. Delmore, EGG-CS-7233 Rev. 2, Idaho National EngineeringLaboratory, Idaho Falls, 1988.
[9] H. Wollnik, J. Brezina, M. Berz and W. Wendel, Proc. AMCO-7, GSI-ReportTHD-26, 679.
[10] H. Wollnik, Optics of Charged Particles (Academic Press, New York, 1987).
'}- -'-.
CIWJO'
- 4 9 - AECL-11342
Instrumental Improvements on a Two Stage (B-RPQ) Mass Spectrometerwith Very High Abundance Sensitivity
( Johannes B. Schwieters and Peter BachFinnigan MAT GmbH, Barkhausenstr. 2, 228197 Bremen, Germany
Introduction
Because of its high selectivity and extreme stability thermal ionisation massspectrometry (TIMS) reveals information at a very high level of accuracy and precisionthat cannot be achieved by any other technique. The precise and accuratemeasurement of very large isotope ratios is a specific challenge for thisinstrumentation. Conventional mass spectrometers are limited to an abundancesensitivity of 10'6-10"7. For isotope ratios larger than 100,000 this is a serious problemin general, requiring a tandem- or accelerator-ms (AMS) [1,2]. However, these arevery expensive and rather specialized techniques, restricted to a few laboratoriesworldwide.
At the first Alfred O. Nier Symposium we reported on a new and simple instrumentalapproach giving ultra high abundance sensitivity [3]: a thermal ionization singlefocussing magnetic sector instrument combined with a retarding potential quadrupole(RPQ) filter lens. This system has been proven to be capable of measuring isotoperatios up to 1 x 10⁹ [4,5]. In these measurements an abundance sensitivity level of 3 x1o-io (i33Cs/i35Cs ^ w a s achieved. However, the transmission of the first RPQ, RPQ-I, was restricted to about 50%. For many applications the stability of the system wasa problem. This paper reports on significant improvements in transmission andstability and introduces the next generation system, RPQ-II. The performance of thenew system is demonstrated and the limits of accuracy and precision are discussed.
Description of the Instrument
The analyzing magnet of the MAT 262 has inclined field boundaries to ensure efficientfocussing in the X- and Y-directions. Second order image aberration correction (a2) isachieved by a curvature of the entrance and exit pole faces of the magnet. Bothnarrow focussing of the ion beam and correction of image aberrations areindispensable prerequisites for instrumentation with high abundance sensitivity. Also,UHV conditions in the flight tube are required. Any scattering events with the walls ofthe analyzer chamber, residual gas particles or apertures can result in energy lossand/or change of flight direction of the ions and thus reduce the abundance sensitivity.However, even with the most carefully designed ion optics, scattering effects can

- 5 0 - AECL-11342
never be completely avoided. The abundance sensitivity at the first stage of the MAT262 (i.e. the image plane of the magnet) is restricted to about 10"6. At the secondstage behind the RPQ-II filter lens the abundance sensitivity is improved by threeorders of magnitude into the 10'9 range (uranium ±1 amu).
variable Faraday multi-collectorRPQ-FAR*
900 magnetic sector(r=23 cm) SEM
RPQ-SEM
| ^ — aperture
Tl-ion source
• The RPQ-FAR is not integrated into the GAIN CALIBRATION networkof the multi-colleclor-FAR channels. It's exclusive purpose is to separatetransmission from SEM gain effects.
Figure 1: Schematic Drawing of the MAT 262 RPQ-II Instrument
Behind the redesigned RPQ-II filter lens the ion beam can be switched into asecondary electron multiplier (RPQ-SEM) or into a Faraday cup (RPQ-FAR). TheRPQ-FAR is used to demonstrate the ion optical stability and the high transmission ofthe improved RPQ-II filter lens independently of the SEM gain.
Performance
The RPQ-II Filter Lens
The RPQ acts as a very sensitive energy and direction filter lens. Scattered particleswith false flight directions and/or false energies are rejected. Only particles with rightangles and energies are transmitted (see Figures 2 and 3). The energy resolution ofthe RPQ-II lens is R(fwhm) = 10,000 (see Figure 4). Ion optical redesign of the mostcritical region of the RPQ filter lens leads to a dramatic increase in transmission andto a significant improvement in stability.
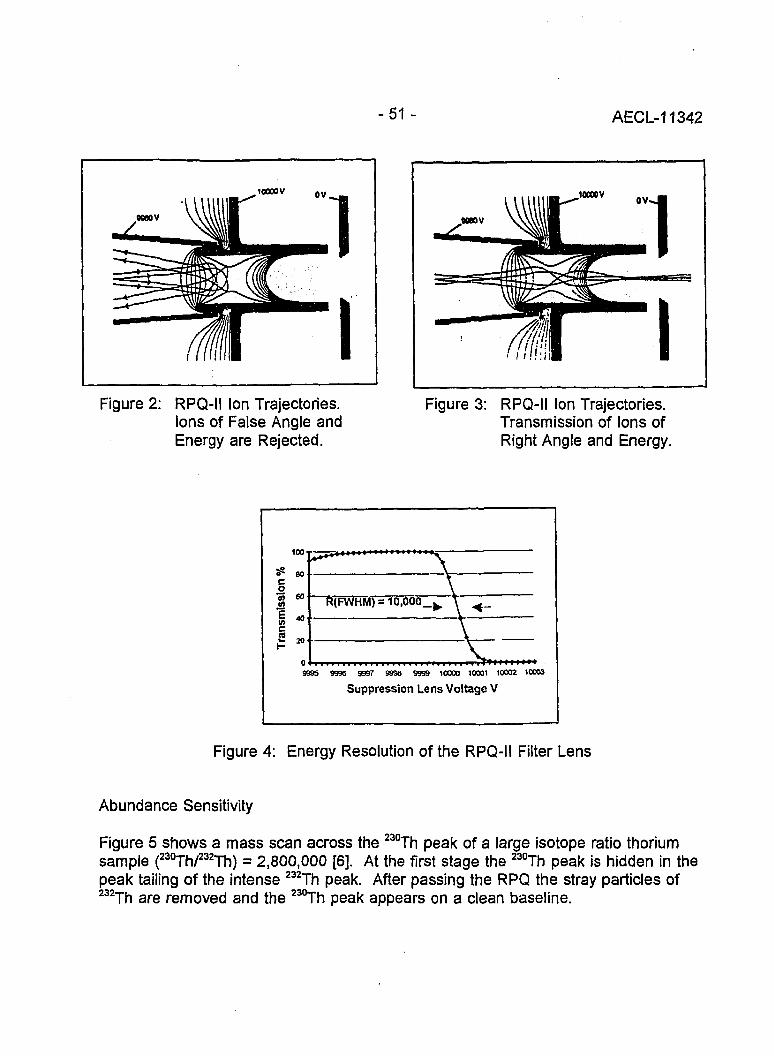
-51 - AECL-11342
Figure 2: RPQ-II Ion Trajectories.Ions of False Angle andEnergy are Rejected.
Figure 3: RPQ-II Ion Trajectories.Transmission of Ions ofRight Angle and Energy.
100
en 60
9995 9996 9997 9993 9999 10000 10001 10002 10003
Suppression Lens Voltage V
Figure 4: Energy Resolution of the RPQ-II Filter Lens
Abundance Sensitivity
Figure 5 shows a mass scan across the 230Th peak of a large isotope ratio thoriumsample (23oTh/232Th) = 2,800,000 [6]. At the first stage the 230Th peak is hidden in thepeak tailing of the intense 232Th peak. After passing the RPQ the stray particles of232Th are removed and the 230Th peak appears on a clean baseline.
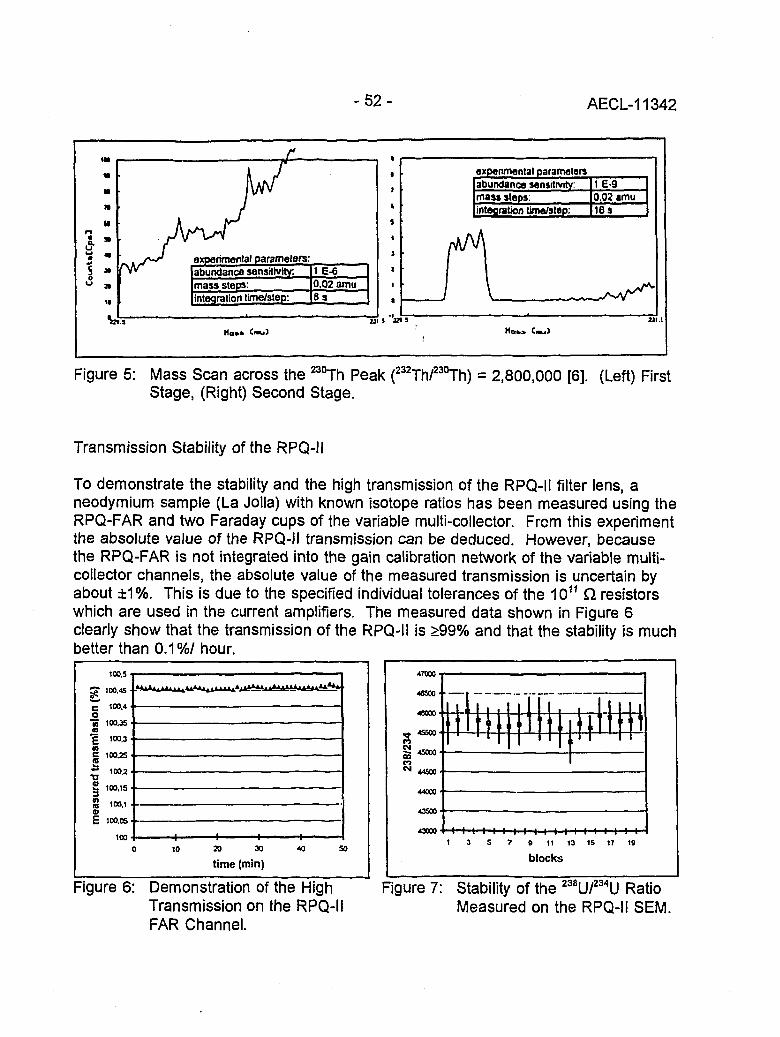
- 5 2 - AECL-11342
experimental parameters:abundance sensitivity:mass steps:integration time/step:
1 E-60,02 amu8s
axpenmantal paramatarsabundance sansitivity:mast steps:integration time/step:
1E-90.02 «mu18s
i.S U 1
Ma»» C-̂ J
Figure 5: Mass Scan across the 230Th Peak (232Th/230Th) = 2,800,000 [6]. (Left) FirstStage, (Right) Second Stage.
Transmission Stability of the RPQ-II
To demonstrate the stability and the high transmission of the RPQ-II filter lens, aneodymium sample (La Jolla) with known isotope ratios has been measured using theRPQ-FAR and two Faraday cups of the variable multi-collector. From this experimentthe absolute value of the RPQ-II transmission can be deduced. However, becausethe RPQ-FAR is not integrated into the gain calibration network of the variable multi-collector channels, the absolute value of the measured transmission is uncertain byabout ±1%. This is due to the specified individual tolerances of the 1011 Q resistorswhich are used in the current amplifiers. The measured data shown in Figure 6clearly show that the transmission of the RPQ-II is >99% and that the stability is muchbetter than 0.1%/ hour.
1C0.5
^ T 100.4S
o"a 100.35
•g 100,3
C 100^5
2- 100^£ 100.15
S 100.1
E 100.05
100-+•
10 20 30
time (min)50
•43000 I I I I I I 1 I I I I |. I I I I I I I I
Figure 6: Demonstration of the HighTransmission on the RPQ-IFAR Channel.
Figure 7: Stability of the 238U/234U RatioMeasured on the RPQ-II SEM.

- 5 3 - AECL-11342
Stability and Linearity of the RPQ-II SEM
The stability, linearity and accuracy of the calibration of the RPQ-II SEM channel isdemonstrated by a simultaneous acquisition of a NIST U005 standard using the RPQ-SEM (mass 234) and two Faraday cups of the variable multi-collector (mass 235 and238). The RPQ-SEM yield (including transmission and counting efficiency of the SEM)has been calibrated at the beginning of the acquisition by switching a 235U beam ofabout 300,000 cps between a Faraday cup of the multi-collector and the RPQ-SEM.The RPQ-SEM yield was measured to be 98.0 ± 0.2%. According to Poisson's law, acounting efficiency of 98% requires per incoming ion in average a release of 4electrons at the first dynode of the SEM, which is a reasonable number for 10 KeVuranium ions.
The acquisition time of the measurement was 2 hours. The acquired data are shownin Fig. 7 and demonstrate the stability of the RPQ-H SEM channel. The measuredisotope ratio is (238U/234U) = 45806.0 ± 0.1% (2cM). It deviates +0.3% from theaverage value recommended by NIST. The specified uncertainty of this isotope ratiois ±1% which means that these measurements fit very well into the limits specified byNIST. The calibration of the RPQ-SEM yield was performed with a beam intensity of300,000 cps. During analysis the intensity of the 234U beam at the RPQ-SEM wasabout 1,400 cps. Because the measured isotope ratio is in good agreement with thespecified value, these measurements also prove the linearity of the RPQ-SEM channelin the range of 1,400 - 300,000 cps.
Dark Noise Level of the RPQ-II SEM Channel
For the measurement of high abundance isotope ratios the dark noise level of theRPQ-SEM has to be extremely low. Because the analyzer region and the housing ofthe RPQ is completely sealed with gold fittings, the detector can be baked at hightemperatures. We found this to be very important to achieve extremely low dark noiselevels at the RPQ-SEM. After baking the SEM the dark noise level dropped fromabout 3 cpm to about 0.3 cpm. This ultra low dark noise level is a very unique andimportant feature of the SEM used in this instrument.
Discussion
Very high abundance sensitivity, high transmission and high stability ion optics,extremely low dark noise level, high linearity of the detection system and sophisticatedsample preparation techniques to minimize molecular interferences and contaminationsof the sample are mandatory to achieve the ultimate precision and accuracy in TIMSmeasurements of very large isotope ratios. To stress the significance of eachindividual point we will discuss the following experiment: an isotope ratio in the range
- 5 4 - AECL-11342
isotope ratio in the range of 100,000 -1,000,000 has to be measured. The major ionbeam intensity is assumed to be 1 pA and the acquisition time is restricted to 1 h(typical conditions for the measurement of Th). The systematic errors due to thelimited abundance sensitivity Err(ABS), the dark noise counts Err(Dc) and the countingstatistics Err(n) can be calculated by the following equations:
limited abundance sensitivity:dark noise error:counting statistics:
Err(ABS)=ABS x IR x 100%Err(Dc)=Dc/n x IR x 100%Err(n)=(IR/nf x 100%
(IR, isotope ratio; n, # of counts of major ion beam accumulated during the acquisitiontime; Dc, # of dark noise counts acquired during analysis; ABS, abundancesensitivity).
0,8 •
0,6 •
0.4 •
0,2 •
0 •
abundancesensitivity
~- ~~ dark noise
countingstatistics
I
/
•^••f " " i \— 1 1100000 300000 500000 700000
isotope ratio
900000
Figure 8: The limits of accuracy andprecision. (y4BS=1E-9,DC=0.01 cps).
In Fig. 8 the different error contributionsare plotted versus the isotope ratio.The instrumental parameters Dc andABS have been set to the numbersachieved by the RPQ-II {ABS =1E-9uranium ±1 amu, Dc=0.01 cps). Thelinearity and stability of the system isabout 0.2%. It can clearly be seen thatunder these experimental conditions theaccuracy and the precision of themeasurement is only determined bycounting statistics. Even for themeasurement of an isotope ratio in therange of 1,000,000 the contribution ofscattered ions of the major ion beam tothe minor isotope intensity is only 0.1%.This clearly falls below the limit ofcounting statistics. However, assuminga level of abundance sensitivity of onlyABS=1 E-7, the error due to the limitedabundance sensitivity would be in therange of 1-10% which is about 15times the limit of counting statistics.
Additionally a dark noise level of 0.1 cps would result in an error in the range of0.16-1.6%, which is about 1-3 times the limit of counting statistics. In principle, onecould try to correct for these inaccuracies by background correction. However, thiswould imply that the abundance sensitivity and the dark noise level must be measured

- 5 5 - AECL-11342
sensitivity. Also the abundance sensitivity correction relies on a certain theoreticalmodel of the peak shape. For the measurement of very large isotope ratios this is nolonger useful.
With the RPQ-II we are limited by counting statistics. Of course increasing the ioncurrent results in a higher precision of the measurement. With conventional TIMS ionsources and favorable elements the ion current can be increased from about 1 pA toabout 100 pA. This would reduce Err(n) by a factor of 10 and Err(Dc) by a factor of100. In this case Dc/n«ABS and Err(Dc) can be neglected. The limit of precision isdetermined by Err(ABS). However, for the measurement of elements with a largerrelative mass difference between the major and the minor isotope (i.e. Cs, Th) theeffective abundance sensitivity of the RPQ-II can be in the 10'10 range [4]. At thispoint again the counting statistics determine the precision of the measurement.
Summary and Conclusion
We have demonstrated the instrumental improvements on the RPQ-II:
increase of transmission from 50% to >98%improvement of ion optical stability from 0.5%/10 min. to <0.1%/himprovement of ion counting stability and linearity to <0.2%/himprovement of dark noise on the RPQ-SEM from 3 cpm to 0.3 cpm.
The abundance sensitivity is 2 x 10'9 (uranium ± 1 amu). For the measurement oflarge isotope ratios, no abundance sensitivity and dark noise corrections have to bemade. Provided that there are no molecular interferences the ultimate precision andaccuracy of the measurement is only determined by counting statistics. New highcurrent Tl ion sources [7] could push TIMS technology to a higher precision for themeasurement of very large isotope ratios.
References
[1] K.H. Purser, P. Williams, A.E. Litherland, J.D. Stein, H.A. Storms, H.E. Grovesand CM. Stevens, Nucl. Instrum. Meth., 186 (1981) 487.
[2] J.J. Stoffel(s), D.R. Ells, L.A. Bond, P.A. Freedman, B.N. Tattersall, C.R.Lagergren, Int. J. Mass Spectrom. Ion Processes, 132 (1994) 217.
[3] K. Habfast and H.J. Laue, Proceedings of the First Alfred O. Nier Symposium onInorganic Mass Spectrometry, Durango, CO, (1991) 75.
- 5 6 - AECL-11342
[4] Typhoon Lee, Teh-Lung Ku, Hsiao-Ling Lu, Ju-Chin Chen, Geochim. Cosmochim.Acta 57 (1993) 3493.
[5] J.I. Wendt, I. Wendt and D. Tuttas, Chemical Geology, 106 (1993) 67.
[6] D. Tuttas, Finnigan MAT Application News No. 4, (1993).
[7] E.P. Chamberlin, see these Proceedings.

- 5 7 - AECL-11342
Performance Indications for TIMS with a Deceleration Lens System andPost-Deceleration Detector Selection
Peter van Calsteren, David Wright and Simon TurnerDepartment of Earth Sciences, Open University, Milton Keynes, MK7 6AA, UK
Introduction
Solid source mass spectrometry is rapidly becoming the technique of choice in U-Thdisequilibrium studies. In the Earth sciences, research topics include melt generationand extraction processes at ocean ridges and the importance of fluid fluxes in thegeneration of melts in island arc settings. The large ratios between decay constants of238U and 232Th compared with 234U and 230Th, generate extreme isotope ratios whichrequire instruments with high abundance sensitivity. We have used a FinniganMAT262-RPQII instrument, which was designed to improve the abundance sensitivityto 20 ppb.
Instrumentation
Compared with earlier versions of the multi-collector Finnigan MAT262-RPQ, theinstrument used here for high abundance sensitivity measurements has a number ofcritical differences. In the filament power supply a potentiometer circuit has beenincorporated that maintains a constant potential on the filaments. Without this circuitthe potential of the mid-point of the filament would change by ~0.5 V for a filamentcurrent change of 1 A. Such changes are necessary to reduce the ion beam intensityfor yield determinations. The resulting change in ion energy at the deceleration lenswould be sufficient to reduce transmission from ~100% to <10%.
In the flight tube between the ion source and the magnet (see Figure 1), a fieldaperture has been installed that can be set at 3 x 5 mm in addition to the usual 3 x10 mm. Beam intensity reduction is less than proportional to the slit opening becausethe cross sectional ion distribution has a 'Gaussian' component to the ideal 'top hat1
profile. At the 3 x 5 mm aperture setting, the peak shape at the collector has steeperslopes and no sign of the sloping 'peak flat1 that is sometimes observed with the largeaperture (Figure 2). Peak shapes are similar to the peak shape at the multi-collectorFaraday cups despite the shaping, deceleration and deflection of the beam and theshape and location of the detectors, some 300 mm behind the natural focal plane ofthe magnet.
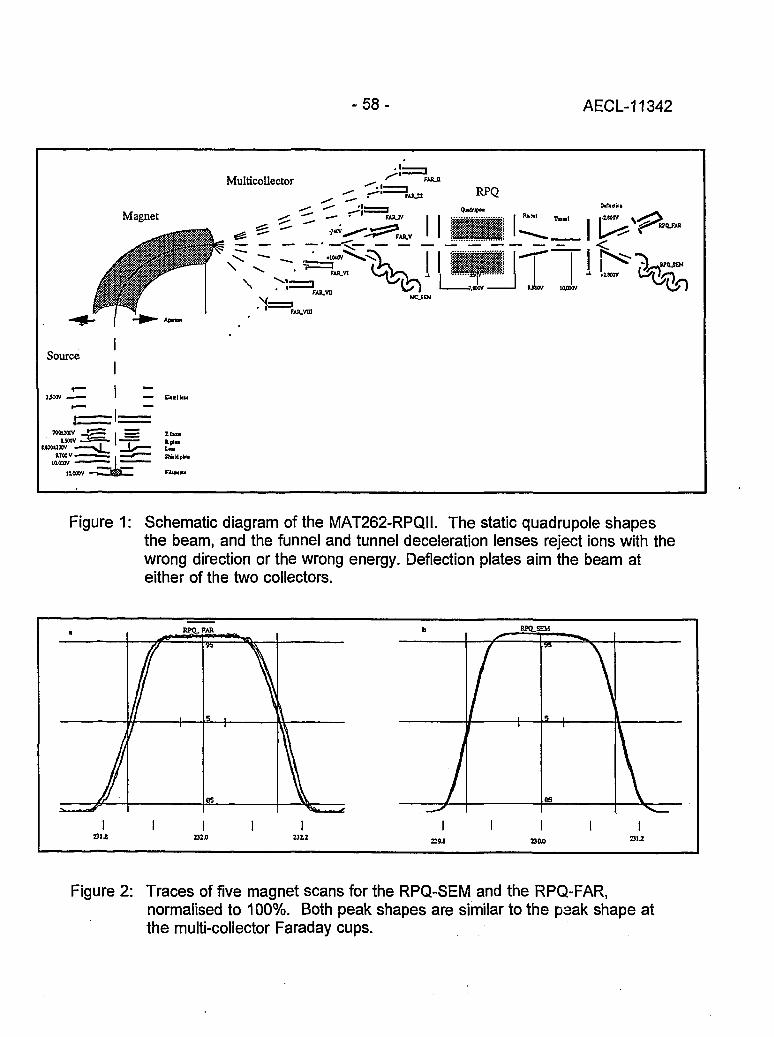
- 5 8 - AECL-11342
Multicollector
Source
7MU0CVisav .
UMUOOV —M00V-*
nooov —
Ztxoi
Figure 1: Schematic diagram of the MAT262-RPQII. The static quadrupoie shapesthe beam, and the funnel and tunnel deceleration lenses reject ions with thewrong direction or the wrong energy. Deflection plates aim the beam ateither of the two collectors.
Figure 2: Traces of five magnet scans for the RPQ-SEM and the RPQ-FAR,normalised to 100%. Both peak shapes are similar to the peak shape atthe multi-collector Faraday cups.
- 5 9 - AECL-11342
Deflection plates are installed to allow the necessary ion beam switching fordetermination of the transmission efficiency of the RPQ and the conversion efficiencyof the secondary electron multiplier (SEM) detector, so that observed ratios may becorrected for these factors. The deceleration lens assembly has been redesignedand gives better transmission at similar abundance sensitivity (Schwieters and Bach,these proceedings). After the RPQ the axial ion beam is transformed from arectangular cross-section to a circuloid cross section using a static quadrupole lens.The circular beam passes through a two stage deceleration assembly consisting offunnel and tunnel lenses and only ions with the inherent thermal ionisation energydistribution pass through the tunnel lens.
Our system is equipped with a pulse counting facility consisting of the standard SEMbut with an ORTEC 9305 pre-amplifier and 9302 amplifier-discriminator, and aHewlett-Packard HP5316B pulse counter. The discrimination level is first set justabove the level of the amplifier noise and at this level the number of intra-dynodalpulses or 'dark noise1 is less than 2 cpm determined repeatedly for more than 15hours. The discrimination level is further adjusted to reduce the occurrence of delayedor 'ghost' pulses to less than one in a thousand.
System Performance
A 187Re+ beam has been used extensively to evaluate system performance indicatorssuch as peak shape when scanned with the magnetic field (see also Figure 2), andpeak top flatness which is better than 2% for mass deviations of 0.1% on either side ofthe peak centre. Beam intensity variation as a function of SEM potential has beendetermined and a potential of 2000 V has been selected which ensures minimaldependence of gain on voltage. Detector intensity profiles when scanning thepotentials of the deflection plates have been determined, and values in the middle ofthe plateau have been selected.
The SEM conversion efficiency is measured by switching an ion beam of -200,000 cpsrepeatedly between the RPQ-FAR and the RPQ-SEM, and the resultant efficienciesare between 93 and 97%. The error on the conversion is down to <0.4% in a fewminutes and the long term stability is - 1 % , and is mainly determined by the error on thebaseline of this Faraday collector which has its amplifier mounted outside the vacuumsystem and without a thermostat. The error on the baseline is a few times higher thanon a multi-collector Faraday cup (MC-FAR), and is a relatively large proportion of asmall (0.02 pA) ion beam. The RPQ transmission is measured by switching an ionbeam of >1 pA between a multi-collector Faraday and the RPQ Faraday. The error onthe transmission is down to <0.1% in a few minutes and the long term stability is ca0.1%. Multiplying the SEM conversion by the RPQ transmission gives the total yieldand the error is dominated by the error on the conversion. There are two other ways

- 6 0 - AECL-11342
to measure the total yield. An ion beam of -200,000 cps can be switched between aMC-FAR and the RPQ-SEM and this method has been used for 23OTh/232Thmeasurements where only one 'stable1 isotope is available. With this method the errorin the yield is down to ~0.2% in a few minutes and the long term stability is <1%.Increasing the ion beam to 400,000 cps results in a better error on the yield but ittakes the SEM many hours to recover to dark noise of <2 cpm. The other methoduses a fixed isotope ratio such as between 235U and 238U. The high abundanceisotope is centred on a MC-FAR and the other isotope on the RPQ-SEM and data arecollected simultaneously. The errors are down to <0.2% in a few minutes andvariations over some hours are <0.5%. This method has a superior stability over thecourse of an analysis and is used for all 234U/238U measurements.
The design aim of the RPQ was to improve abundance sensitivity to ~20 ppb, which isrequired for the determination of 23OTh/232Th ratios in silicates. For present purposes,abundance sensitivity is defined as the relative count rate one mass unit below themajor isotope such as 237/238U or 231/232Th. Abundance sensitivity depends on anumber of factors including the thermal energy distribution of the major isotope in thesource of the mass spectrometer, collisions with neutrals near the filament (e.g.neutrals of the major isotope, the carbon compounds of the loading medium and Refrom the filament) and with residual gas atoms in the flight tube. Apart from thethermal energy distribution, all other factors lead to a reduction in ion energy and,consequently, the abundance sensitivity tail is more pronounced at the low mass sideof a major isotope and less pronounced at lower mass numbers. Abundancesensitivity is determined in static mode with 23BU centred in FAR-IV and the RPQ-SEMat 237 using the NBS 0002 standard with a certified 238U/235U ratio of 5697. Typically,with a 1.4 pA 238U beam and 97% yield, the count rate at 237 is 0.24 cps, with0.03 cps dark noise. This corresponds to an abundance sensitivity of 24 ± 3 ppb.
A magnetic scan between masses 228 and 232 for a Th standard with23oTh/232Th = 6 x 10⁻⁶ j s j | | u s t r a t e d i n Figure 3a and b for the RPQ- and MC-SEM,respectively. The small peaks on the baseline represent individual counts and thehighest point on the 230Th peak represents 45 cps. It is clear that the RPQ greatlyreduces both the general background and the background at 237, even taking intoconsideration that on this scan the apparent abundance sensitivity is high because themajor 232Th isotope is not totally collected in the Faraday cup. At two mass units awayfrom the major isotope the contribution to the minor isotope from the abundancesensitivity is probably less than 10 ppb. When using the NIST 3159 Th concentrationstandard with 23OTh/232Th = 0.34 x 10"6, a major isotope intensity of 1 pA results in acount rate of 2 cps for 230Th and there will be a contribution of ~10% from theabundance and ~1.5% from dark noise.

-61 - AECL-11342
232 229
Figure 3: Magnetic scan of (a) the RPQ-SEM and (b) the MC-SEM. The highestpoint on the 230Th peak is 45 cps.
Results
Within-run data statistics for the analysis of a single Th'u'std (see below) arerepresented in Figure 4. The final result for this analysis is 23OTh/232Th = 6.087 ± 0.020x 10"6. The distribution of the set means around the horizontal indicates that over the25 minute period of this analysis there was no significant effect of interference,fractionation or variation in the yield of the RPQ-SEM.
Figure 4: Within-run data statistics for a single Th'u'std analysis. The vertical barsindicate one standard error on either side of the mean of 10 integrations of8 s each. The tramlines represent one standard error on either side of therunning mean.

- 6 2 - AECL-11342
We have analysed a number of standards over a 6 month period after the initialcommissioning of the Finnigan MAT262-RPQII instrument. We used NBS U0002 withcertified 238U/235U = 5697 and 234U/238U = 1.6 x 10s, and with no isotopes at masses237 and 236 [1]. For thorium there are no certified standards available and we haveprepared our own standard by mixing appropriate amounts of NIST 3159 and a 230Thspike to achieve a 23oTh/232Th ratio of 6 x 10"6, similar to the ratio expected in mostsilicates. This standard is called Th'u'std. Data for the analyses of these standardsare represented in Figure 5. For the U0002 standard (Figure 5a), the RPQ-SEM yieldwas measured by centering 235U on the RPQ-SEM and 238U on FAR-III and measuringthe ratio in static mode relative to the recommended value. The precision with theRPQ-SEM relative to the certified value is greatly improved.
(a)
33a
1.68'
1.66"
1.64"
1.62'
1.60
NBSU0002 A
= i,629 ±0.012
(c) 0A2- NIST 3159 J
3
; t230T h /232Th = 0.344+0.030 xlO-(!
(b)
f
6.4
6 3 '
5.9
Th'u'std «<>Th/232Th =6.131+0.084 x 10"« 3
S 038K
PR 034
I-N 0
026
Figure 5: Data for three solution standards. Thevertical lines represent one standard error oneither side of the analysis mean, thetramlines represent the overall mean withone standard deviation. 21 separateanalyses of (a) NBS U0002, and (b) of ourTh'u'std standard made over a six monthperiod, (c) Data for 7 separate analyses ofNIST 3159 made over a three month period.
20
For the Th'u'std standard (Figure 5b), the RPQ-SEM conversion was measured for thefirst eight analyses by centering a 200,000 cps 187Re beam on the RPQ-SEM and onthe RPQ-FAR, and measuring the SEM conversion by switching the voltage in thedeflection unit. Subsequently, the 187Re beam intensity was increased to 1 pA byincreasing the ionisation filament current and transmission was measured betweenFAR-V and the RPQ-FAR, by switching the deflection voltage at the multi-collector.The yield was obtained by multiplying the conversion and the transmission. Afteranalysis 8, the RPQ-SEM yield was measured by centering a 200,000 cps 232Th beamon the RPQ-SEM and on FAR-V and measuring the ratio by switching the deflectionvoltage at the multi-collector. The results for Th'u'std obtained with either method ofyield calibration appear indistinguishable. The average is 23OTh/232Th = 6.131 ± 0.084 x10"6. The relative error in the Th'u'std measurement is higher than the relative error inthe NBS U0002 measurement despite more favourable counting statistics, and this ismost probably attributable to the different method of yield calibration.
- 6 3 - AECL-11342
Data for 7 separate analyses of NIST 3159 are presented in Figure 5c. Because of itsextremely low 23OTh/232Th ratio, this certified concentration standard could become auseful isotope ratio standard with a 23OTh/232Th ratio similar to young volcanic rocksthat have undergone extreme Th and U fractionation. The RPQ-SEM yield wasmeasured in the same way as the last 13 measurements of Th'u'std. The average is23OTh/232/Th = 0.344 ± 0.030 x 10"6.
Conclusions
Isotope ratios of 1 in 1,000,000 at two and four mass units difference in Th and Ustandards can be measured at 1% precision with the high abundance sensitivity andhigh transmission achieved by the Finnigan MAT262-RPQII. Data on island arc lavasindicate a similar performance and these results are of great importance in petrogenicstudies.
Acknowledgements
Thanks to Janet Dryden and Chris Hawkesworth for help with the preparation of thismanuscript.
Reference
[1] Garner, E.L., Machlan, L.A. and Shields, W.R. Uranium Isotope StandardReference Materials. N.B.S. Spec. Pub. 260-27, 1-150 (1971).

- 6 4 - AECL-11342
Evaluation of a L.A.N.L. Designed Turret
v - •••'/
J. Banar, R.D. Aguilar, P.R. Dixon, R.E. Perrin, D.J. RokopLos Alamos National Laboratory, Box 1663, Los Alamos, NM 87545
Introduction
In 1985, the decision was made to design and build a turret-type rotary sample holderfor the thermal ionization mass spectrometers used by CST-8 at Los Alamos NationalLaboratory. The sample holder (turret) was to be developed as a research anddevelopment tool with a secondary goal of increased sample Inroughput. Two of themajor considerations in the design of the turret were the ioni^ation processes and theion beam focusing. The design philosophy dictated that the sample holder shouldcause no compromise or degradation of the current capability and that it would becompatible with the existing equipment. After 2 years, a prototype was produced andinstalled for testing on a single-sector NBS 12"-90° spectrometer doing actinideanalysis by pulse counting. The prototype was tested for three years, and during thattime the data generated were compared to historical standards data generated by thesame instrument, using the original configuration, to spot any trends.
Background
The mass spectrometric section, CST-7, in the Chemical Science and TechnologyDivision of Los Alamos National Laboratory is primarily concerned with ultra-traceisotopic analysis on complex matrices using thermal ionization mass spectrometry.Precision and accuracy of measurements approaching ±0.10%, are achieved routinely.Analyte concentrations down to 10'12 atoms per gram are not uncommon. Theanalyses are done on National Bureau of Standards designed NBS 12"-90° thermalionization mass spectrometers (TIMS) using either a single or double magnetic sector.These instruments use a Nier thin-lens focusing source and a pulse counting detectionsystem. The bulk of the analyses are done using a single-filament platinumco-plate/overplate sample mounting technique. All of the sample separationschemistry, sample plating, and analyses are done in class 100+ clean rooms.
Using the standard configured NBS 12"-90° instrument, samples can only beintroduced into the source region one at a time. This requires that the source regionbe vented to atmosphere for every sample. A consequence of this is increased ionbeam instability as the water vapor content increases in the source ionizationchamber. Another consequence is the increased possibility of introduction of foreignmaterial which would influence the ionization process. The turret design promised theability to minimize and control these problems.
- 6 5 - AECL-11342
Turret Design
The most important consideration in designing the turret was that it not compromise ordegrade the current analytical capability. This dictated a number of the designdecisions. The materials used in the turret modification were to be the same as thoseused in the standard source configuration. This greatly reduced the possibility ofintroducing unknown effects, in the form of outgasing or reaction surfaces, into thesource region. Using the same materials also meant that the existing cleaning ordecontamination procedures did not change.
The 5-filament rotary design was chosen based on the fact that it was small enoughthat it could be inserted into the source region without a major source or vacuumenvelope modification. The rotary design was also the simplest to adapt to theexisting equipment. Additionally, the smaller size could be handled comfortably byoperators. Five analyses were considered to be the maximum for an operator toperform sequentially.
Compatibility with the existing equipment and the ability to interchange between theturret and the standard source with a minimum of effort was considered paramount.This capability gave us the flexibility to switch between the two configurations to easilyaccommodate any analytical or mechanical situation which might arise.
Testing
Normal protocol for analysis of unknown samples requires that known standards beanalyzed before, during and after a sample series. Until 1991, the standards usedwere the National Bureau of Standards (now NIST) certified uranium series. The initialtesting of the turret was done exclusively with the NBS standards during this period.The first test done was a systems calibration, which consisted of analyzing a set ofNBS standards with ratios ranging from 1000:1 to 1:1000 with approximately 18analyses being performed in a random order.
The performance of the turret was recorded along with the ratio value. All parameterswere then compared against historical performance values from the instrument or withthe certified standards values, lonization / transmission efficiency, fractionation, peakshapes, abundance sensitivity, signal intensity, memory, and reproducibility fromfilament to filament were among the parameters compared.
When initial comparison revealed no immediate observable deviations from standardconfiguration parameters, the turret was put into operation for sample analyses. Anaverage of 2 to 4 standards were run per week concurrently with samples. During thesecond year of testing a second turret was installed on a second single-stage NBS12-90. Testing of the second turret was similar to the first. During 1991 a set ofinternally normalized standards was obtained from the Institute for Reference Materialsand Measurements (formerly C.B.N.M). Since that time, the IRMM standards are usedalmost exclusively in CST-8.

- 6 6 - AECL-11342
Results
The evaluation of the results was broken into three critical areas; analyticalperformance, mechanical performance, and cost. A direct comparison betweenstandard configuration and turret configuration was done using the standardconfiguration performance as a baseline.
Analytical Performance
Rhenium
Peak shapeAbundance sensitivity185/187 ratioSignal intensity @ 2100°C (mass 187)
Turret Configuration
Identical to standard10% improvement0.02% (internal precision)2.6 - 3.0 Volts (standard)12.0-15.0 Volts (turret)
Uranium
lonization/Transmission efficiencyAbsolute fractionation (per mass)Temporal fractionation (at 60 min)Reproducibility (filament to filament)MemoryRuns per day
Standard
0.30%0.1810%>0.26%0.035%<1 in 106
4
Turret
0.30%0.2755%>0.04%0.017%
<1 in 106
7
Plutonium
lonization/Transmission efficiencyAbsolute fractionation (per mass)Temporal fractionation (at 60 min)Reproducibility (filament to filament)MemoryRuns per day
Standard
0.34%0.266%>0.07%0.037%
< 1 in 106
4
Turret
0.34%0.531%>0.04%0.035%
< 1 in 106
7
Mechanical Performance
The mechanical performance comparison examined sample throughput andmechanical operation. Sample throughput was based on five-sample series ofanalyses. Mechanical operations were limited to any operation which would affect theanalytical performance. The most important consideration was the effect of vacuumexposures to atmosphere. Compatibility to change between the two configurationswas also considered to see if any capability was lost.

- 6 7 - AECL-11342
Filament/Sample Analysis Cycle:
Procedures for Sample Analysis
1. Introduction & pump down2. Heating & stabilization3. Baseline reading & data collection4. Cooling & removal
Standard
30303030
Turret
45303045
Filament/Sample Cycle Sequence:
The overlap of steps for the turret indicate simultaneously performed operations.
Cost
Based on total costs
Standard configuration
Turret configuration
Analysis Sequence
sample #1
sample #1sample #2sample #3sample #4sample #5
1>2>3>4
1>2>32>3
2>32>3
2>3>4
Mechanical Operation:
5-Sample Series
Cycle time (total)Throughput per weekVenting (atmosphere)Operating vacuumCompatibility
Standard
10 hours20 samples6 per cycle2x10"7torr
Turret
4.5 hours35 samples2 per cycle5x10"8torr
4 hour to std
Cost, newManufacturing timeInstallation time
Standard
$350,0002 man years30 - 60 days
Turret
$30,0000.25 man years
10 days
- 6 8 - AECL-11342
Conclusions
A comparison between the standard configuration and the turret configuration massspectrometer was done to examine any impact on current analytical capability. Thecomparison was based on the three most critical areas of concern, analyticalperformance, mechanical performance, and cost. The basic criteria for all three areaswas that no loss of current analytical capability occur.
The analytical performance tests indicate no apparent loss of capability and indicatesome advantages. An increase in signal intensity, a lowering of fractionation and betterfilament-to-filament precision are improvements and enhance current capability.
Mechanically the turret has two distinct advantages: (1) lower operating vacuum,consequently less scatter, and (2) an increase in sample throughput. The ability toquickly and easily change between the two configurations is also a distinct advantage.
The total cost of manufacturing and installing the turret modification is favorable whencompared to the cost of a mass spectrometer.
Overall the turret modified configuration is considered to have been successful. Since1991 four of the single sector spectrometers in CST-8 have had turrets installed. Datafrom these turrets have supported the initial testing data and have not revealed anyproblems or trends.

- 6 9 - AECL-11342
INDUCTIVELY COUPLED PLASMA AND GLOWDISCHARGE MASS SPECTROMETRY
- 7 0 - AECL-11342
High Accuracy Determination of Trace Elements in NIST Standard ReferenceMaterials by Isotope Dilution ICP-MS
Paul J. Paulsen and Ellyn S. BearyInorganic Analytical Research DivisionChemical Science and Technology LaboratoryNational Institute of Standards and Technology, Gaithersburg, MD, 20899
Introduction
Isotope dilution mass spectrometry (IDMS) has been used for the certification of StandardReference Materials (SRMs) at the National Institute of Standards and Technology (NIST)for more than 25 years. Since 1986, ICP-MS isotope dilution has had a dominant rolein the certification process. The new generation of ICP mass spectrometers is capableof ratio measurement precisions of about 0.1% rsd.
Optimization of Ratio Measurements
Accuracy in ICP-MS ID equal to the precision of ratio measurement requires attentionto the ion multiplier setup, calibration and use; mass bias drift correction; minimizationof memory from previous samples; and most critically, the removal of interferencescaused by molecular ions.
A generic plot for a continuous dynode multiplier in the ion count mode indicates aconstant gain versus input signal to 10s cps, but shows progressive loss in gain byinput signals of 106 and higher. Even in the pulse counting mode, when the gaindrops, counts will be lost due to the change in efficiency of the detector. In addition,counts are lost to detector deadtime (ion count overlap). Historically, we have usedthe Nd 144/145 ratio (approximately 3/1) over a range of count rates (concentrations)to assess the linearity of corrected data. Figure 1 shows the degree of match when 1,7 and 20 ns deadtimes are used. We select the deadtime that gives the mostconstant ratio across the count range. The maximum count rate is kept below 3 x10⁵ cps for the most accurate ID ratio measurements.

-71 - AECL-11342
144/145 Nd Ratio
Figure 1: 144/145 ratio vs count rate.
Drift in the instrument mass bias occurs during instrument "warm up" and throughoutthe day. Low mass elements are affected more than high mass elements. In therecent certification of Mg in Estuarine Sediment, for example, the mass bias correctionfor Mg 24/26 drifted from 1.0830 to 1.0923 in sixty minutes (0.85%).
Mass bias correction requires a dynamic measurement system with the "isotopiccontrol samples" run at specific time intervals. This imposes a requirement that thememory from a previous sample be washed down 1000 fold within 3 to 4 minutes.Certain elements have notoriously long washout times under routine instrumentalconditions due to adsorption/absorption to plastic, glass or other hardware, in additionto element volatility in the spray chamber. Figure 2 shows a washout study for boronusing a combination of solvents. The mannitol/NH4OH mixture minimizes the boronmemory, which is predominantly due to volatility.
Figure 2: Washout time for boron using HNO3, HCI, NH4OH with or without Mannitol.

- 7 2 - AECL-11342
Using a "natural" isotopic standard as a control to correct "spiked" samples for massbias, drift suffers from a second type of memory problem which applies to allelements. A "spiked" sample has an isotope ratio significantly different from "natural".For example, for indium determinations, a "natural" indium control would have 3 x10⁵ cps for 115ln, and 1.5 x 10⁴ cps for l13ln, while a properly spiked sample wouldhave 3 x 10s cps for both isotopes. The problem arises when measuring a naturalcontrol following a spiked sample where a 0.1% memory at 113ln would be 15 cps.This represents a memory washdown of 20,000 fold from the spiked sample. Ideally,the isotopic control sample should have the same ratio as the spiked samples. Forconvenience, we use a spike calibration solution as the analysis control. The value forthe control is determined by measuring a natural isotope ratio standard several times(to establish mass bias drift), followed by the isotopic control. This establishes theratio of the working standard used to correct for the mass bias drift for the remainingspike calibrations, samples and blanks.
Molecular ion interferences are potential problems for all elements except highconcentration elements and elements at low (Li, B, and Mg) and high mass (Hg, Tl,Pb, Th, and U). Natural materials, such as the current SRMs produced at NIST, aremost susceptible to these problems. Interferences exist if an element in an unspikedsample shows a different isotopic ratio than a reference solution containing only thatelement. The necessary chemical separations schemes for removing interferencescan be rapidly tested with a full element semiquantitative scan on the ICP-MS.ICP-MS has the advantage that only the source of interference needs to be removed.Therefore, separations are flexible and can be specially designed based on the matrixcomposition and the elements of interest. It is not necessary to isolate the analyte asrequired for thermal ionization mass spectrometry.
Analyses by ICP-MS ID
ICP-MS ID has been used in the certification of NIST SRMs for eight years. Asummary of materials analyzed and elements determined are shown in Table 1. Ofthese analyses more than half required chemical separations.
Tablet ICP-MS ID SRM Certifications
Elements
Matrix Types
ElementCertifications
B, Mg, Ti, Cr, Fe.Ni, Cu, Rb, Sr, Mn* Mo, Rh*. Pd, Ag, Cd, Sn, Ba, Nd, Pt,Hg, Pb, Tl, Th, U
Alloys, Autocatalysts, Blood, Cokes, Filters, Flours, Fly Ash, Glass, Leaves,Oils, Ores, Paint, Sediment, Serum, Soils, Tissues, Water
Material X Element
24
32
125
Mononuclidic, internal standard quantification

- 7 3 - AECL-11342
One example of an SRM certification requiring no chemical separations is boron, asinterferences are unlikely for low mass elements. Boron was determined in a numberof NIST leaf SRMs (Apple, Spinach, Tomato and Peach Leaves). Table 2 lists theresults from a recent certification of boron in SRM 1547, Peach Leaves. Because ofthe potential volatility problem during sample preparation, dissolution wasaccomplished in tall Teflon containers and harsh evaporations were avoided. The0.8% rsd is typical, and reflects the heterogeneity of boron in the leaf materialsanalyzed to date. Natural samples often display different levels of homogeneity fordifferent elements.
Table 2: Concentration of Boron in Peach Leaves, SRM 1547 ((jg/g)
29.46 29.31 29.19 29.64 29.79 29.31
Grand Avg. 29.45 |jg/g; 0.8% rsd
Chemical separations were required for the analysis of SRM 2711, Montana II Soil. Asemiquantitative analysis of this complex material confirmed the absence of only fourelements. All of the elements determined by ICP-MS suffered from molecular ioninterferences. Most, but not all, molecular ion interferences involve oxides generatedfrom lower mass elements at higher concentrations than the analyte. The Ag wasseparated from its interference, ZrO+, by electrodeposition of Ag from a dilute acidsolution. The Ni had interferences from oxides of both Ca and Ti. Potassium, Ca andAr oxides fall in the Mo mass region, and the double oxides, as well as Mo oxide,interfere with Cd. A two stage chromatographic separation was used to remove theseinterferences. Chelation chromatography efficiently separates the alkali/alkaline earthelements from the transition metals. In this scheme, Mo was eluted with diluteNH4OH, and the transition metals (including Ni and Cd) were stripped with diluteHNO3. Anion exchange chromatography was used remove the Ti and to separate theNi and Cd. All separated elements gave their true natural ratio indicating that allinterferences had been removed. The Ni, Cd, Mo, and Ag concentrations asdetermined by ICP-MS isotope dilution with chemical separations are shown in Table3. The certified values are based on a statistical combination of results from severaltechniques, according to NIST policy.
Table 3: ICP-MS ID and Certified Values for Ni, Cd, Mo, Ag in SRM 2711, soil
ICPMS
Certified
Ni
20.33 ± 0.06
20.6 ±1.1
Cd
41.74 ±
41.70 +
0.10
0.25
Mo
1.596 + 0.025
(1.6)
4.683
4.63
Ag
± 0.075
+ 0.39
- 7 4 - AECL-11342
Conclusions
ICP-MS ID has certified a wide range of elements in a variety of materials with highaccuracy and precision. Both the chemical preparation and instrumental proceduresare simplified over other ID mass spectrometric techniques. The ICP-MS haspicogram/mL detection limits for most elements using fixed operating parameters.Chemical separations are required only to remove an interference or to preconcentratethe analyte. Since both aspects of the analysis are not as restrained as traditionalmass spectrometry, their flexible integratior. results in high precision and accuracy,simplified chemical procedures, and lower blanks.
References
[1] J.D. Fassett and P.J. Paulsen, Anal. Chem. 61, 643A (1989).
[2] E.S. Beary and P.J. Paulsen, Anal. Chem. 65, 1602 (1993).
[3] Galileo Electro-optics Corp., Channeltron Electron Multiplier Handbook for MassSpectrometry Applications, Sturbridge, MA 01566.

- 7 5 - AECL-11342
/ • ' /
Multi-element Isotope Dilution Analyses Using ICP-MS
A.M. VolpeL-231, Lawrence Livermore National Lab, Livermore, CA 94550
Introduction
Since separated isotopes became commercially available nearly fifty years ago,isotope dilution (ID) mass spectroscopy has provided definitive chemical concentrationanalyses [1-3]. Compared with other standardization methods, ID achieves highanalytical sensitivity, precision and accuracy. It is a critical methodology for researchin biochemistry, nuclear physics and geochemistry. Traditionally, thermal ionizationmass spectroscopy dominated inorganic ID analysis. The emergence of plasmasource, quadrupole mass spectroscopy, ICP-MS, expands the application of isotopedilution methodology [4-6]. Versatile sample introduction, uniform degrees ofionization, and good precision isotope ratio data are key ICP-MS attributes.
Presently, thirty seven elements ranging from light elements (Li, B) through transitionmetals, noble, rare (REE) and heavy elements, to actinide and transuranic (Pu, Am,Cm) elements are measured by isotope dilution at LLNL. Projects range from geologicand hydrologic to biologic. The research goal is to measure accurately manyelements present in diverse matrices at low abundance (<ppb) using isotope dilutionmethods instead of ion intensity calibration and aqueous dilution. This paperdiscusses technical issues and benefits associated with multi-element ID-ICP massspectroscopic measurements.
Caveat
The success of multi-element isotope dilution ICP-MS depends on using massspectrometric techniques that require more instrument set-up and calibration thanroutine ion intensity calibration. Important parameters include detector linearity anddeadtime, mass resolution, mass bias, background, and data acquisition strategy.Thorough review is described elsewhere [7]. Also, available and affordable separatedisotopes are essential and can be the major drawback. Often ID-ICP-MS is used tomeasure very low element abundances (<ppb) in complex matrices such as salineocean water. In this instance, both separation chemistry and cleanroom facilities arenecessary. Clearly, isotope dilution will not supplant other ICP-MS standardizationmethods, nor should it. ID-ICP-MS fills an important niche in inorganic massspectrometry linking high precision mass spectrometry and bulk elemental analyses.

- 7 6 - AECL-11342
Advantages and Concerns
Major advantages of ID methods are accuracy, elimination of ion intensity calibrationinaccuracy due to matrix effects and drift, and quantitation for samples that requirechemical processing. Chemical pre-concentration removes interfering matrices andimproves method detection levels. Isotope dilution reduces the need to quantifychemical yield. Accuracy of ID-ICP-MS methods depends on tracer isotopecalibration, tracer-sample isotopic equilibration, and appropriate background, isobaric,and mass bias corrections. Propagation of isotope ratio error due to improper tracerisotope addition is a major concern with multi-element analyses when abundancesvary widely. Optimization of the amount of tracer isotope requires estimating elementabundance in the sample.
Mass Bias
Isotope ratios measured with ICP-MS deviate from absolute values. Mass bias varieswith instrument type, operating conditions and element analyzed. In general, heavierisotopes are preferentially transmitted to the analyzer. Mass bias is due to plasma gasdynamics and sampling interface space charge effects [8]. Unlike thermal ionizationmass fractionation, ICP-MS mass bias is time independent, provided gas dynamicsand electronic settings are stable, and similar to precision of replicate measurements(<1-2 %/amu). Yet, for multi-element ID-ICP-MS, mass bias uncertainty can be asignificant source of inaccuracy [9]. Figure 1 shows mass bias for solutions withknown isotope abundance that were measured with the ICP-MS optimized for indium.Mass bias for multi-elements varies about 6% from preferential light isotope (i.e., Cu)to heavy isotope (Rb) bias.
Mass bias correction is possible during ICP-MS measurements using external orinternal normalization. Mass bias can be determined using standards with knownisotope abundance, such as NIST SRM's including the uranium isotopic standards. Anexample of routine mass bias determination and correction for U isotopes is shown inFigure 2. Here, mass bias during the analysis period is measured repeatedly usingNIST U-500 standard. Mass bias corrected ratios for another standard, NIST U-005validate accuracy of the approach (Figure 2).
Other correction methods include 1) internal normalization using two isotopes forelements having three or more stable isotopes (i.e., Zn, Ba), 2) internal normalizationusing double spiking techniques, and 3) internal normalization using a surrogateelement with similar mass (i.e., Ga for Zn, and Tl for Pb). The latter correction can bemisleading for quadrupole ICP-MS given mass bias results shown in Figure 1.
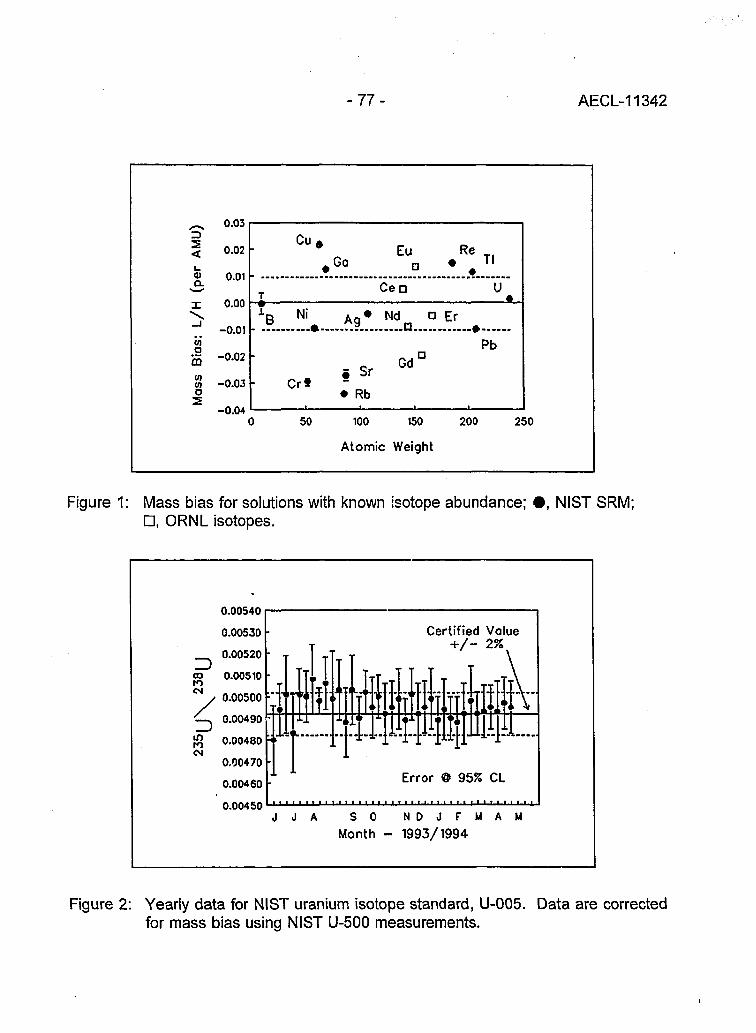
- 7 7 - AECL-11342
0.03
< 0.02 •
£ 0.01 •
I 0.00
T! -°-0 1
OT -0.03o
-0.04
Cr f
Eu Re
T
i B Ni
#Go
Ag
•Cen
• NdQ..
D
*
Er
i
- • -
11
U
Pb
I Sr
• Rb
Gd
50 100 150 200
Atomic Weight
250
Figure 1: Mass bias for solutions with known isotope abundance; • , NIST SRM;D, ORNL isotopes.
COtoCM
<N
0.00540
0.00530
0.00520
0.00510
0.00500
0.00490
0.00480
0.00470
0.00460
0.00450
T
. - I ,„ T(.. ^! . i
J J A
I
r-Jfll1 *'i i * •*•
.. .
S 0rfonth •
Certified Value+ / - 2%^
• V I
Error «
i'.j.IV
9 95% CL
N D J F M A
- 1993/1994M
Figure 2: Yearly data for NIST uranium isotope standard, U-005. Data are correctedfor mass bias using NIST U-500 measurements.

- 7 8 - AECL-11342
Applications
Though ID-ICP-MS plays a significant role in many fields, the clearest applicationsdemonstrating the strength of the method are in marine chemistry (see [10] for review).Nearly fifty elements of interest are present at extremely low concentration, less thanpart-per-billion, in a saline matrix dominated by eleven elements. All saline watermeasurement techniques, AAS to TIMS, require pre-concentration and separationchemistry. The advantages of ID-ICP-MS compared with other techniques areprecision, accuracy, method sensitivity, sample throughput and multi-elementversatility.
We are pursuing active research studies using trace element and isotopecharacterization in various hydrologic and coastal ocean projects. Recently wedeveloped a technique for separating and measuring simultaneously eight rare earthelements (REE) in natural waters using ID-ICP-MS [11]. Typically, REE in open oceanwaters are less than one part-per-trillion. Results for triplicate measurement of salinewaters shown in Figure 3 are similar to data using instrumental neutron activationanalyses (INAA) and ID-TIMS. Precisions for REE abundances between 0.1-1.7 pg/gare 2-10% RSD.
©
T3Cox:oo
~§ 10"*Eo
CO
i Kauai 10m seawater
. .. ,. N. Pacific OceonIndian oceon deBaar et ai.. 1935
Bertram & Elderfield. 1993 {&£ '; ID-TIMS
La Ce Nd Sm Eu Gd Er YbElement
Figure 3: Triplicate REE measurement of N. Pacific seawater compared withID-TIMS and INAA.
- 7 9 - AECL-11342
References
[1] M.G. Ingrahm, Ann. Rev. Nuclear Sci. 4, 81 (1954).
[2] K.G. Heumann, in Inorganic Mass Spectrometry, edited by F. Adams, R.Giijbels and R. Van Grieken, Chemical Analysis Series, 95, 301 (1988).
[3] J.D. Fassett and P.J. Paulsen, Anal. Chem., 61, 643A (1989).
[4] D. Beauchemin, J.W. McLaren, A.P. Mykytiuk and S.S. Berman, Anal. Chem.59,778(1987).
[5] J.R. Garbarino and H.E. Taylor, Anal Chem., 59, 1568 (1987).
[6] A.A. Van Heuzen, T. Hockstra and B. Van Wingerden, J. Anal. At. Spectrom., 4,483 (1989).
[7] G.P. Russ, in Applications of Inductively Coupled Plasma Mass Spectrometry,edited by A.R. Date and A.L. Gray, 90 (1989).
[8] G.R. Gillson et al., Anal. Chem., 60, 1472 (1988).
[9] H.P. Longerich, At. Spectrosc, 10, 112 (1989).
[10] J.W. McLaren et al., Fresenius Z. Anal. Chem, 337, 721 (1990).
[11] B. K. Esser, A.M. Volpe, J.M. Kenneally and D.K. Smith, Anal. Chem., 66, 1736(1994).

- 8 0 - AECL-11342
ICP Magnetic Sector Multiple Collector Mass Spectrometry and the PreciseMeasurement of Isotopic Compositions using Nebulization of Solutions and
Laser Ablation of Solids
A.N. Halliday, D.-C. Lee, J.N. Chrjstensen, W. Yi, CM. Hall, C.E. Jones andDAH. Teagle -/•>"•/6 ^ (-;i^Department of Geological Sciences, University of Michigan, Ann Arbor, Ml 48109,U.S.A.
/V' A.J. WalderFisons Elemental, Winsford, Cheshire, U.K.
,.]•; P.A. FreedmanFisons Instruments, VG Isotech, Middlewich, Cheshire, U.K.
Introduction
Inductively-coupled plasma (ICP) sources offer considerable advantages over thermalsources because the high ionization efficiency facilitates relatively high sensitivitymeasurements for elements such as Hf or Sn, which can be difficult to measure athigh precision with thermal ionization mass spectrometry (TIMS). The massdiscrimination (bias) is larger than for thermal ionization (typically about a percent pera.m.u. for Pb), favors the heavier ions and decreases in magnitude with increasingmass. However, in contrast to TIMS, this discrimination is largely independent of thechemical or physical properties of the element or the duration of the analysis. Thishas been demonstrated to high precision with a double focusing multiple collectormagnetic sector mass spectrometer with an ICP source. This instrument is describedbelow, together with its potential for high precision isotopic measurements of a verybroad range of elements using solution aspiration or laser ablation.
ICP Mass Spectrometry
Plasma source mass spectrometry has seen a bigger increase in utilization andtechnique development over the past few years than any other area of massspectrometry [1-4]. Most inductively-coupled plasma mass spectrometry (ICPMS)developments have utilized quadrupole mass spectrometers. In general, ICPMS hasbeen used to obtain semi-quantitative to quantitative concentration data, particularly forthose trace elements that are difficult to determine by other methods. Relatively littleuse has been made of ICPMS to obtain isotopic compositions, because it is difficult toacquire high precision isotopic data with the peak shapes generally encountered withquadrupole instruments [5]. Indeed, most isotopic work that has been performed byquadrupole ICPMS [6,8] can be performed to superior precision using magnetic sectorthermal ionization mass spectrometry (TIMS).

- 8 1 - AECL-11342
ICP Magnetic Sector Multiple Collector Mass Spectrometry
The ICP magnetic sector multiple collector mass spectrometer (Fisons Plasma 54) is ahigh precision double focusing instrument with extended geometry in which theinstability of the plasma is circumvented by using simultaneous static multiplecollection [9]. The plasma source utilizes Ar as the support gas, in a similar manner tothat commonly deployed in conventional quadrupole ICPMS. The ions are extractedat high voltage and a quadrupole d.c. lens is used to focus the ion beam profile ontothe analyzer entrance slit. An electrostatic analyzer is used to match the energydispersion of the piasma source with that of the magnetic sector analyzer. Theinstrument has a mass resolution of > 400. The magnet provides double dispersionwith effective 54 cm extended geometry and z focusing. The exit pole face isadjustable to rotate the exiting ion beams and produce an ion image perpendicular tothe optic axis. The collector assembly can provide flat topped peaks for thesimultaneous detection of up to nine masses using eight independently adjustableFaraday collectors and a fixtrl axial Faraday collector that can be lowered to allow theion beam access to a Daly detector with pulse counting. The Plasma 54 has a highertransmission efficiency than most quadrupole instruments (> 100 x 106 ions sec"1 ppm"1
indium using conventional aspiration methods). Recently a new wide flight tube andmagnet with an additional Faraday detector located on the high mass side have beendeveloped and commissioned. This can be used to detect U at the same time as Pbis measured using the main collector array (or 7Li at the same time as 6Li) [10]. Thisfacilitates simultaneous U-Pb measurements for spatial resolution work.
The standard method of sample admission utilizes a peristaltic pump to deliverdissolved samples to a pneumatic nebulizer. The nebulizer converts the solution intoan aerosol which is then passed into the plasma source where it is desolvated,dissociated and ionized. The minimum solution volume required is about 1 ml_. AMistral desolvating higher efficiency nebulizer can be incorporated in the plasmasource resulting in significant (factor of 10) increases in signal size [11]. Whereas bythermal ionization it is difficult to obtain high precision concentration and/or isotopicdata for certain elements such as Sn, Hf, W, Pt and Ir, simply because they aredifficult to ionize, high precision (<0.002% RSD) is achievable with 300 ng of Hf [11]using the Plasma 54. The design is currently being modified to increase thetransmission by a factor of >10.
The mass discrimination or "bias" in the source of the Plasma 54 is a relatively simplefunction of mass. For many applications, an exponential law provides the closestapproximation at very high precision. Unlike the case for a thermal source, this bias isindependent of time, the chemical properties of the element, or the admixing of otherelements [6,9,12]. This significant feature of this kind of mass spectrometer contrastswith thermal ionization mass spectrometry in which mass discrimination is a function ofwork function and in some instances, poorly understood reactions that occur on the

- 8 2 - AECL-11342
filament during heating. Thus, using a solution containing a mixture of elements withoverlapping mass ranges, the mass discrimination observed in an element of knownisotopic composition can be used to determine accurately the unknown isotopiccomposition of the other element. The implications of this are far reaching. Normalisotopic compositions, natural fractionations, natural isotopic anomalies and artificialisotopic enrichments can be measured to higher precision. Elements such as Pb, theisotopic compositions of which cannot be normalized with internal normalization, canbe corrected for mass discrimination to high levels of accuracy by admixing a standardsuch as Tl of known isotopic composition and monitoring masses 205TI and 203TI.Isobaric interferences such as 87Rb on 87Sr, 144Sm on 144Nd or 176Lu on 176Hf can becorrected for to higher degrees of accuracy than has hitherto been possible. The Pb,Hf and Nd data generated so far [12] demonstrate a remarkable performance andopen the way for isotopic studies in which the elements of interest cannot beseparated from other isobarically interfering elements, as in laser ablation Sr and Hfisotopic analyses.
Laser Ablation
A Nd-YAG laser has been coupled with a Plasma 54 and the number of Pb ionsdetected per number of Pb atoms ablated in NIST SRM 610 glass was shown to be 1in 450 [13]. Direct micro sampling isotopic analysis for Pb, Sr and Hf in complexmatrices is relatively straightforward. Molecular isobaric interferences are usuallynegligible, since the use of laser ablation and hence a dry plasma (rather thanaqueous aspiration techniques) reduces oxide and hydride formation. Doubly chargedspecies of elements at high concentration and low second ionization potential cancomplicate the mass spectra. For example, laser ablation Sr isotopic measurementssometimes require careful correction for doubly-charged rare earth elements whenanalyzing rare earth rich phases. These features contrast with secondary ionizationmass spectrometry (SIMS) which requires very high mass resolution in order toseparate complex molecular interfering species [14.15].
Applications
It is already apparent that this instrument offers considerable potential for new andimproved isotopic and trace element measurements. The rapid measurement ofprecise isotopic compositions is likely to have widespread application in the nuclearindustry, in making large numbers of environmental measurements and in lifesciences. In the earth sciences the instrument offers greater accuracy for Pb isotopicdata, Rb/Sr ratios, U-Th disequilibrium data and Hf isotopic compositions. Certainisotopic anomalies in meteorites could be measured more precisely. New, challengingchronometers with long half-life and difficult isobaric interferences may be feasible.High precision isotope dilution trace element data for the platinum group elements,high field strength elements and transition metals will be relatively straightforward.

- 8 3 - AECL-11342
Laser ablation in situ measurements of Sr, Hf and Pb isotopic compositions, togetherwith U-Pb ages of accessory minerals can be made. Finally, measurements of naturalisotopic fractionation of low mass elements such as Li, B and Cl should be possiblebut have yet to be evaluated.
References
[1] A.R. Date and A.L. Gray, Applications of Inductively Coupled Plasma MassSpectrometry, Blackie and Sons, Glasgow (1988).
[2] R.S. Houk and J.J. Thompson, Mass Spectrometry Reviews 7, 425 (1988).
[3] K.E. Jarvis, A.L. Gray, and R.S. Houk, Handbook of Inductively CoupledPlasma Mass Spectrometry, Glasgow and London (1992).
[4] D.W. Koppenaal, Anal. Chem. 64, 320R (1992).
[5] M.E. Ketterer, M.J. Peters and P.J. Tisdale, J. Anal. At. Spectrom. 6, 439(1991).
[6] G.P. Russ and J.M. Bazan, Spectrochim. Acta 42B, 49 (1987).
[7] G.R. Gillson, D.J. Douglas, J.E. Fulford, K.W. Hallidan and S.D. Tanner, Anal.Chem. 60X, 1472 (1988).
[8] D.C. Gregoire, Anal. Chem. 62, 141 (1990).
[9] A.J. Walder and P.A. Freedman, J. Anal. Atomic Spect. 7, 571 (1992).
[10] A.N. Halliday, J.N. Christensen, C.E. Jones, A.J. Walder and P.A. Freedman,Trans. Amer. Geophys. Un. 74, 626 (1993).
[11] A.J. Walder, D. Koller, N.M. Reed, R.C. Hutton and P.A. Freedman, J. Anal. At.Spectrom. 8, 1037 (1993).
[12] A.J. Walder, I. Platzner and P.A. Freedman, J. Anal. At. Spectrom. 8, 19(1993).
[13] A.J. Walder, I.D. Abell, P.A. Freedman, and I. Platzner, Spectrochim Acta 48B,397 (1993).
[14] W. Compston, l.S. Williams and S.W. Clemens, Abstr. 30th Ann. Conf. Am.Assoc. Mass Spectrometry, 593 (1982).
[15] N. Shimizu and S.R. Hart, Ann. Rev. Earth Planet. Sci. 10, 483 (1982).

J,-
- 8 4 - AECL-11342
Application of Glow Discharge Mass Spectrometryto the Measurement of Isotope Ratios
t L. R. Riciputi, D. C. Duckworth, C. M. Barshick, and D. H. SmithChemical and Analytical Sciences, Oak Ridge National Laboratory, Oak Ridge, TN37831
In 1991, Donohue and Petek reported measurements of palladium isotopic ratios usingglow discharge mass spectrometry (GDMS) [1]. With essentially no samplepreparation, they obtained relative standard deviations of ±0.03% (1 a) for the majorpeaks. This early experiment provided the inspiration to explore more thoroughly thecapability of GDMS to measure isotope ratios. GDMS is appealing for a number ofreasons, especially when contrasted with conventional isotope ratio measurementsand the time-intensive sample preparation often required. GDMS can analyze mostsolid samples, including those of complex matrix, directly, with no dissolution required.We have analyzed soil in this manner, for example [2].
All of the work reported here was done using a VG-9000 sector mass spectrometer. Itis equipped with both Faraday cup and Daly detectors, providing a dynamic range of109. Argon was the support gas for the discharge. Pressure in the cell was estimatedto be 100-250 Pa; the dc discharge was operated at about 2 milliamps and 1 kV.
Many questions had to be addressed in evaluating GDMS for isotope ratiomeasurements. Among these were:
What is the magnitude of the bias?Does bias vary with mass? With matrix? With glow discharge parameters?Are ratios stable with time? What is internal and external precision? How doesprecision vary with concentration?
To address these and other questions, we analyzed B, Cu, Sr, Ag, Sb, Re, and Pb,using NIST standards where available. Table 1 summarizes the materials used.
Pin electrodes of pure lead and copper were analyzed to evaluate the temporalstability of their measured isotopic ratios. The results are presented graphically inFigures 1 and 2. Aside from the almost monotonic variation in the copper ratio,precision for all ratios except ^Pb /^Pb was ±0.03%; precision for the 204Pb/208Pb was±0.08% @ 1 o , The poorer precision is to be expected because of the relatively lowabundance of 204Pb (204Pb/208Pb = 0.05904). The variation of "Cu/^Cu with time(Figure 1) clearly demanded investigation.

- 8 5 - AECL-11342
Table 1: Materials used for GDMS Isotope Analysis
Element
Cu
Sr
Re
Ag
B
Sb
Material
solid stock Cusolid stock brass
pressed Cu powder
NIST 9987; Sr carbonate
NIST 989; Re ribbon
NIST 981solid Cu
NIST 951, boric acid
solid Cu
Amount (wt%)
100%65%100%
5% and 0.75% in Ag1% in cu powder
100%, wrapped on Pt wire
100%15 ppm, unknown isotope ratio
2.8 wt% in Ag
15 ppm, assumed natural ratio
Investigation revealed that variation in current and voltage could not explain theobserved variation. When the pressure of argon was varied, however, a pronouncedeffect on the ratio was observed, as illustrated in Figure 3. For pressures in thesource region ranging 1.5 - 8.0 x 10'2 Pa, the measured value for ^Cu/^Cu changedfrom 0.451 to 0.455, a difference of about 1%. It is thus clear that carefulmaintenance of constant argon pressure is important in obtaining reproducible results.
The reason for this pressure dependence is not obvious, but one can speculate thatvarying the pressure in the cell alters the shape of the discharge, which in turn effectschanges in the ion population sampled by the mass spectrometer. As is well knownfrom thermal ionization mass spectrometry, even small shifts in the locus of ionformation change isotopic bias.
Isotopic bias for elements virtually spanning the periodic table (boron to lead) showedno discernible trend, as shown in Figure 4. No trend with respect to ionizationpotential was observed, either (Figure 5). These observations are consistent withGDMS's known relatively uniform response to all elements. We speculate that this isdue in part to the separation of the atomization and ionization steps both temporallyand spatially.
As expected, precision deteriorated with declining abundance. For elementalconcentrations of greater than 0.5 weight percent, external precision for major isotopicratios was usually better than ±1%. In no case was precision better than ±0.03%

- 8 6 - AECL-11342
obtained, and in no case did precision reach the limits imposed by counting statistics.These two observations strongly suggest that there is room for improved performance.Our first efforts to realize this will be to regulate the argon pressure more strictly. Anyfluctuation in ion beam intensity always has a negative effect on precision. Having amulti-collector system to provide simultaneous monitoring of all isotopes wouldobviously be highly desirable, but, alas, multi-collectors are not possible on aninstrument of Nier-Johnson geometry. Table 2 summarizes our isotopicmeasurements.
Table 2: Summary of Isotopic Measurements
Element
Cu
Sr
Re
Ag
Pb
Pb
B
Detector
F
F
F
F
F
D
F
Material
Solid CuBrass
Pressed Cu
5% NIST987 in Ag
NIST 989onPt
7.5%NIST978 in Cu
SolidNIST 981
15 ppm insolid Cu
2.8%NIST951 in Ag
Ratio
65/63
87/8688/86
185/187
107/109
208/206207/206204/206
208/206207/206204/206
10/11
Average
0.45320.44790.4495
0.71588.4274
0.5980
1.0689
2.17290.91590.0588
2.08180.84730.0545
0.2455
rsd
0.030.030.06
0.210.09
0.15
0.06
0.030.030.08
1.032.583.00
0.06
AcceptedValue
0.4456
0.710348.37861
1.07638
2.16810.914640.5904
Bias
+0.85%+0.52%+0.43%
+0.77%+0.29%
+0.05%
+0.34%
+0.11%+0.14%+0.17%
unknown
0.2473 +0.73%
F, Faraday Cup; D, Daly detector
We have exploited GDMS's ability to measure isotope ratios in a practical application.One of our jobs is to provide mass spectrometric support for ORNL's IsotopeEnrichment Program. A sample of enriched 68Zn required analysis; zinc has a highionization potential (9.4 eV) and is quite volatile (m.p 420°C), making it a likelycandidate for GDMS. Only 1 mg was available for analysis; the sample was loaded bypressing it in the end of an indium pin. The results we obtained are given in Table 3.
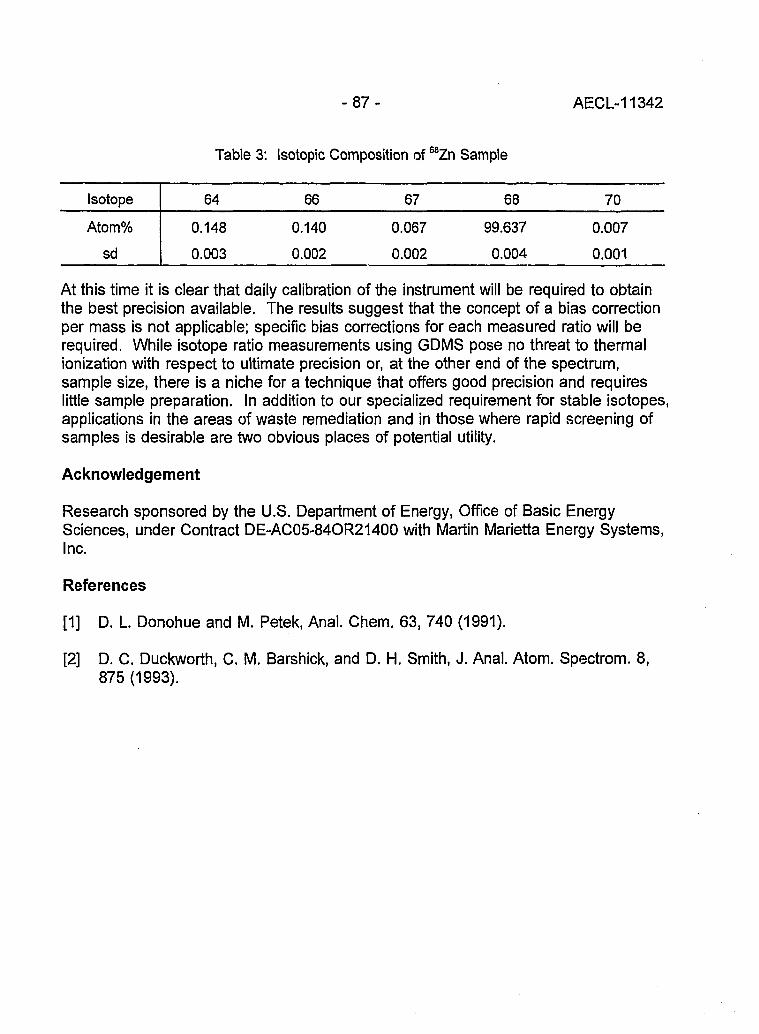
- 8 7 - AECL-11342
Table 3: Isotopic Composition of 68Zn Sample
Isotope
Atom%
sd
64
0.148
0.003
66
0.140
0.002
67
0.067
0.002
68
99.637
0.004
70
0.007
0.001
At this time it is clear that daily calibration of the instrument will be required to obtainthe best precision available. The results suggest that the concept of a bias correctionper mass is not applicable; specific bias corrections for each measured ratio will berequired. While isotope ratio measurements using GDMS pose no threat to thermalionization with respect to ultimate precision or, at the other end of the spectrum,sample size, there is a niche for a technique that offers good precision and requireslittle sample preparation. In addition to our specialized requirement for stable isotopes,applications in the areas of waste remediation and in those where rapid screening ofsamples is desirable are two obvious places of potential utility.
Acknowledgement
Research sponsored by the U.S. Department of Energy, Office of Basic EnergySciences, under Contract DE-AC05-84OR21400 with Martin Marietta Energy Systems,Inc.
References
[1] D. L. Donohue and M. Petek, Anal. Chem. 63, 740 (1991).
[2] D. C. Duckworth, C. M. Barshick, and D. H. Smith, J. Anal. Atom. Spectrom. 8,875 (1993).

AECL-11342
£ DMt
AM
' • • • •
-
•
•
Fig. 1 : Cu Isotope measurements^ P!
• • • • 4 . 4
' « • • » • • • * • •
Solid Cu Pin(1-29-93)
X AM—«^^-PU
TT
j :
Pressed Cu Powder(5-3-93)
(M51
04SS
• * •
g 0453
04SS
Fig. 3: Pressure vs Cu Isotope ratio
Fig. 2: Pb isotope measurements
£ 219
~t 2.18
2.17
2.16
0.920i
0.918
i- 0.916
0.914
0.0600
jQ 0.05S5a.
AcceptedValue
2-3
2-3
AcceptedValue
0.0590
0.0565
0.0580
Acceptedf^f--"'f"-+- x ^ + ^ Value
2-3
1 2 3 4 5 6 7 8 9
mA
A
A
ti
03 04 03 0e 0.7 0J
Prwjtin (ton)
Fig. 4: Mass blaa vs mass
100 -
D OalyDatactor• Faraday
•
o o n
Light
Rs" • •
Sb°
O 0MyDMctcr
/\Q • •
D Sr
• •
D •Findiy Drtsctor
• • • • •
-05 0Mass Bias (%)
•a
I1
lonl
zi
93
g
M
t
73
7
U
e
S3
3
Fig. 5: Mass bias vs ionization potential
o Daly Detector" • Faraday
•
-
ooo o o
Light
B»
o Sr • •
Heavy
MasaBias(%)

- 8 9 - AECL-11342
GASES

- 9 0 - AECL-11342
Unconventional Stable Isotope Mass Spectrometry of Fe, Pt and Wvia Gas Source Mass Spectrometry
P.D.P. Taylor, S. Valkiers, and P. De Bievre, Institute for Reference Materials andMeasurements, Commission of the European Communities-JRC, Geel (Belgium)
U. Flegel and Th. Kruck, University Kbln, Institut Anorganische Chemie, Greinstrasse6, Ko ln ( G e r m a n y ) <. i :;:•<•, ( -• •;-<"] f ( ;' N
;
Introduction
Since the 1950's, there has been a burst in the research in and application of isotopemass spectrometry (MS) for elements such as C, N, O, S and H. Such measurementshave been used to unravel processes in many different areas ranging from medicineto environment, climatology and hydrology. Gas source mass spectrometry hasplayed an important role in this evolution, as it enables researchers to detect muchsmaller isotopic effects (down to fractions of permils) than is possible with solid sourcemass spectrometry.
Obviously, this approach can only be used for elements which have volatilecompounds. For other elements (e.g., Fe), isotopic measurements can only be doneusing solid source MS (thermal ionisation, GDMS) or ICP-MS. Consequently, in thesecases it is often difficult or impossible to measure small isotopic effects. Especially foriron, which is an element for which natural isotopic fractionation could be expected(multiple redox stages, biologically active) and has been observed on one occasion [1],gas source mass spectrometry is an approach which merits investigation, particularlyas Fe is difficult to measure using TIMS or ICP-MS. Recently, Taylor et al. [2]demonstrated the feasibility of using a volatile tri-fluorophosphane compound Fe(PF3)5
to be used for gas source MS.
As a follow-up of this work, new data will be presented for iron, platinum and tungsten.
Theoretical
As far back as the fifties and sixties, inorganic chemists were interested in thecoordination of zero-valent metals, and studied the properties of these M°Ln complexesfor purely theoretical reasons. It was at this time that Kruck et al. described thesynthesis of some transition metal complexes with PF3 ligands [3]. Virtually all ofthese compounds show significantly enhanced volatility. They are produced usinghigh pressure/high temperature reactions (e.g. 200 bar / 200°). As most of thesecompounds are not available commercially, they were synthesised for this study at the

- 9 1 - AECL-11342
University of Koln. Apart from their volatility, the tri-fluorophosphane compounds alsohave an interesting property from a mass spectrometrist's point of view: both P and Fare mono-isotopic. The Fe(PF3)5 forms orange crystals and sublimes at 22°C (atatmospheric pressure), whereas the Pt(PF3)4 is a colourless liquid, which thermallydecomposes at 50°C.
Although the classic synthesis routes for these products were developed forpreparative reasons, typically for 10 g of product, down-scaling for 10 to100 mg levelsis currently being investigated.
Experimental
A Finnigan-MAT 271 magnetic sector spectrometer was used, with a single Faradaycup detector [4]. The gas was expanded to 1.8 L, and introduced by molecular flowthrough a gold membrane with fifteen 20 urn pinholes. About 50 ug of sample isconsumed per run. The operating conditions for the various samples analysed aregiven in Table 1.
Table 1: Operating Conditions for the Finnigan-MAT 271 Mass Spectrometer
metal
Fe
Pt
W
compound
Fe(PF3)5
Pt(PF3)4
WF6
speciesmeasured
Fe+, Fe(PF3)+
Pt+
WF2+
electron E(eV)
90
85
90
T of vessel(°C)
110
27
150
T ampoule atinlet (°C)
70
27
27
Inlet P(mbar)
0.02
0.01
0.009
An aliquot of sample (typically 10 mg) was weighed into a monel ampoule, andsubsequently connected to the gas inlet system. This manipulation was carried out ina glovebox, under a dry nitrogen atmosphere, as these compounds hydrolyse. Thesample was cooled (-20°C), connected to the inlet system and the nitrogen waspumped off over a period of 10 minutes. The relative occurence of the differentspecies and a check for isobaric overlaps was carried out using a Balzers QMG 400quadrupole MS. For each sample, at least 4 independent gas introductions weremade. Each time, magnetic field calibration was carried out, and the isotopeabundance ratios were measured over a period of about 1 hour (including baselinemeasurement). The isotope abundance ratios at the time of gas introduction (t=0)were calculated by an extrapolation procedure. This procedure is similar to the oneused for the silicon isotope abundance ratio meaurements on SiF4, which is used atIRMM in the framework of the redetermination of the Avogadro constant. It has beendemonstrated (e.g., for noble gases, O, C and N) that this procedure results in "near-absolute" isotope abundance ratios at the 10"4 level, without the use of syntheticisotope mixtures [4].

- 9 2 - AECL-11342
Results and Discussion
A typical spectrum for these tri-fluorophosphane compounds can be found in [2] (forFe(PF3)5). The M+ and the different M(PF3)n+ species can be observed and the ioncurrents for the different species decrease with increasing number of ligands. Thisoffers flexibility in the choice of the species to use in the isotopic measurement.
Platinum
Table 2 shows the isotope abundance ratios and isotopic composition of Pt for thesample analysed. The uncertainties on these ratios are typically 1 to 5 x 10'5 relative,which is excellent as these have been obtained using a single collector. Compared tothe measurement which is presently considered by IUPAC to be the best, theuncertainties are decreased by more than two orders of magnitude and the accuracyis within the quoted uncertainty limits.
Table 2: Isotopic Composition of IRMM 1994 as Measured on Gaseous
Isotope
190
192
194
195
196
198
ratio to 195f
0.000403±0.000002
0.023134±0.000001
0.974445±0.000033
1.00000
0.746098+0.000008
0.211740±0.000013
mole%
0.013634±0.000068
0.782659±0.000035
32.96700±0.00077
33.831557±0.000420
25.24166±0.00036
7.16349±0.00042
IUPAC repr.mole%
0.01±0.01
0.79±0.06
32.9±0.6
33.8±0.6
25.3±0.6
7.2±0.2
IUPAC bestmeasuie merit,
molfe%
0.0127±0.0005
0.78±0.01
32.9±0.1
33.8±0.1
25.2±0.1
7.19±0.04
Corresponding Atomic Weight* 195.077793±0.000019
195.080±0.011
195.0791±0.0022
t uncertainty as 1s* IUPAC 1993 Standard Atomic Weight for Pt: 195.08 ± 0.03
Iron
Since the initial feasibility test decribed previously [2], no new Fe(PF3)5 has beenprepared. However the previous batch of material was analysed with the Finnigan-
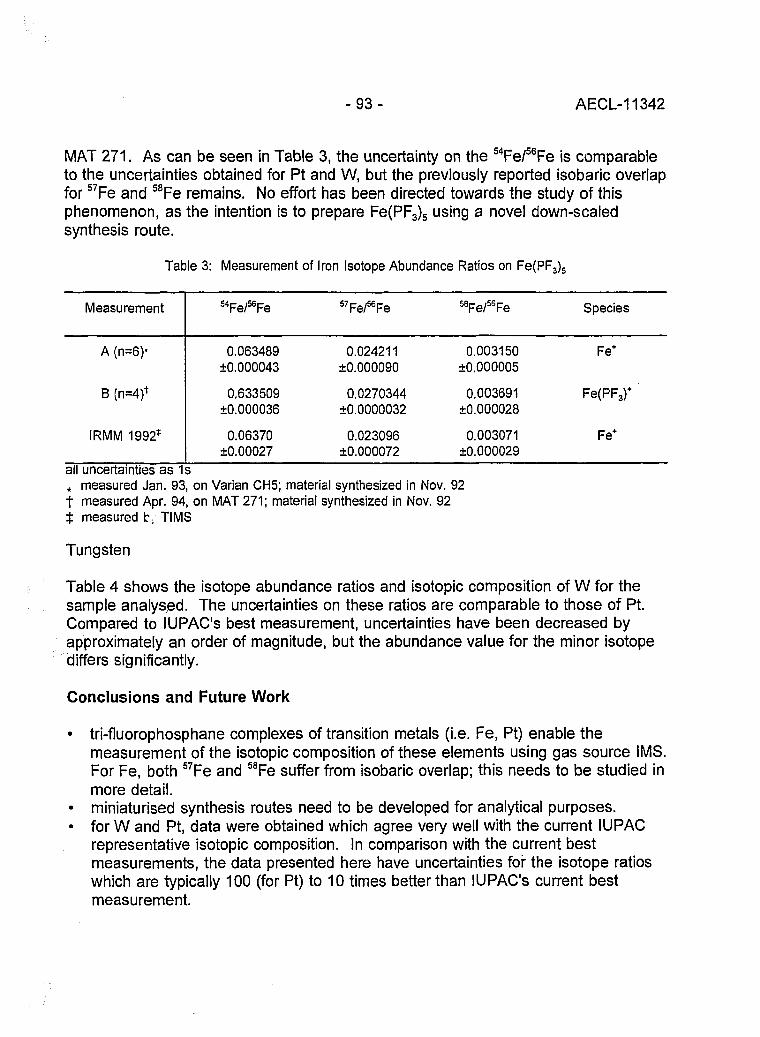
- 9 3 - AECL-11342
MAT 271. As can be seen in Table 3, the uncertainty on the 54Fe/S6Fe is comparableto the uncertainties obtained for Pt and W, but the previously reported isobaric overlapfor 57Fe and 58Fe remains. No effort has been directed towards the study of thisphenomenon, as the intention is to prepare Fe(PF3)5 using a novel down-scaledsynthesis route.
Table 3: Measurement of Iron Isotope Abundance Ratios on Fe(PF3)5
Measurement
A (n=6)-
B (n=4) t
IRMM 1992*
"Fe/^Fe
0.063489±0.000043
0,633509±0.000036
0.06370±0.00027
"Fe/^Fe
0.024211±0.000090
0.0270344±0.0000032
0.023096±0.000072
58Fe/56Fe
0.003150±0.000005
0.003691±0.000028
0.003071±0.000029
Species
Fe+
Fe(PF3)+ '
Fe+
all uncertainties as 1s• measured Jan. 93, on Varian CH5; material synthesized in Nov. 92t measured Apr. 94, on MAT 271; material synthesized in Nov. 92i measured fcv TIMS
Tungsten
Table 4 shows the isotope abundance ratios and isotopic composition of W for thesample analysed. The uncertainties on these ratios are comparable to those of Pt.Compared to ILJPAC's best measurement, uncertainties have been decreased byapproximately an order of magnitude, but the abundance value for the minor isotopediffers significantly.
Conclusions and Future Work
• tri-fluorophosphane complexes of transition metals (i.e. Fe, Pt) enable themeasurement of the isotopic composition of these elements using gas source IMS.For Fe, both 57Fe and 58Fe suffer from isobaric overlap; this needs to be studied inmore detail.
• miniaturised synthesis routes need to be developed for analytical purposes.• for W and Pt, data were obtained which agree very well with the current IUPAC
representative isotopic composition. In comparison with the current bestmeasurements, the data presented here have uncertainties for the isotope ratioswhich are typically 100 (for Pt) to 10 times better than lUPAC's current bestmeasurement.
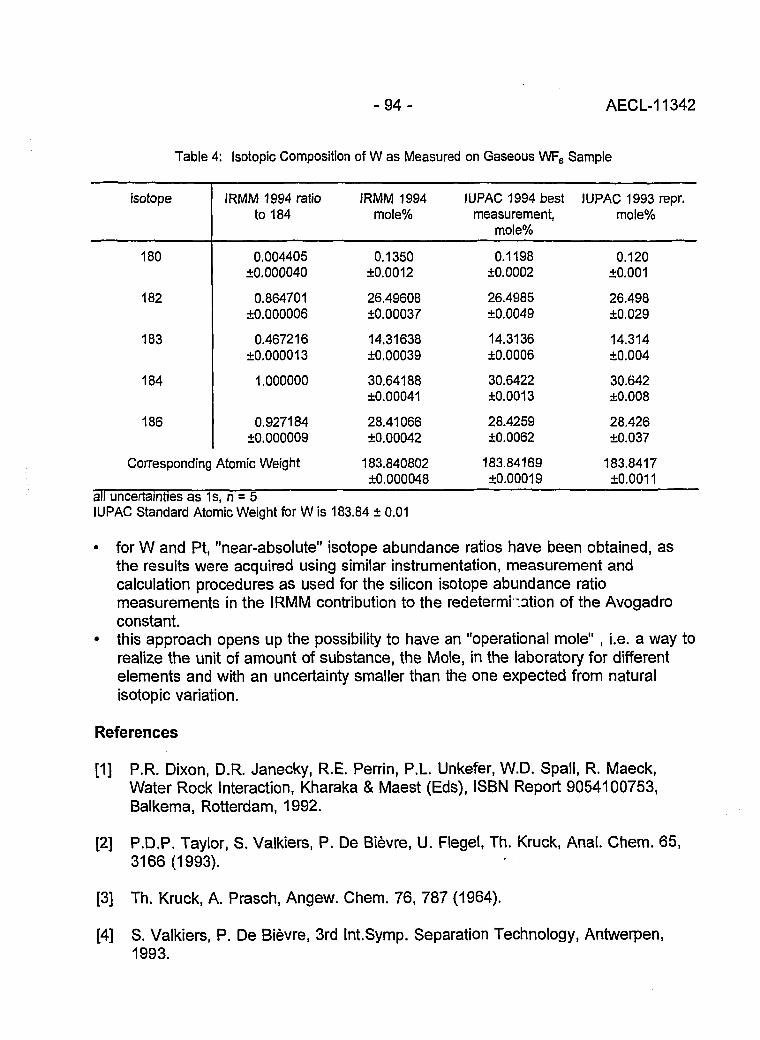
- 9 4 - AECL-11342
Table 4: Isotopic Composition of W as Measured on Gaseous WF6 Sample
isotope
180
182
183
184
186
IRMM 1994 ratioto 184
0.004405±0.000040
0.864701+0.000006
0.467216±0.000013
1.000000
0.927184±0.000009
IRMM 1994mole%
0.1350±0.0012
26.49608±0.00037
14.31638±0.00039
30.64188±0.00041
28.41066±0.00042
IUPAC 1994 bestmeasurement,
mole%
0.1198±0.0002
26.4985±0.0049
14.3136±0.0006
30.6422±0.0013
28.4259±0.0062
IUPAC 1993 repr.mole%
0.120±0.001
26.498±0.029
14.314+0.004
30.642±0.008
28.426±0.037
Corresponding Atomic Weight 183.840802±0.000048
183.84169±0.00019
183.8417+0.0011
all uncertainties as 1s, n = 5IUPAC Standard Atomic Weight for W is 183.84 ± 0.01
• for W and Pt, "near-absolute" isotope abundance ratios have been obtained, asthe results were acquired using similar instrumentation, measurement andcalculation procedures as used for the silicon isotope abundance ratiomeasurements in the IRMM contribution to the redetermhation of the Avogadroconstant.
• this approach opens up the possibility to have an "operational mole" , i.e. a way torealize the unit of amount of substance, the Mole, in the laboratory for differentelements and with an uncertainty smaller than the one expected from naturalisotopic variation.
References
[1] P.R. Dixon, D.R. Janecky, R.E. Perrin, P.L. Unkefer, W.D. Spall, R. Maeck,Water Rock Interaction, Kharaka & Maest (Eds), ISBN Report 9054100753,Balkema, Rotterdam, 1992.
[2] P.D.P. Taylor, S. Valkiers, P. De Bievre, U. Flegel, Th. Kruck, Anal. Chem. 65,3166(1993).
[3] Th. Kruck, A. Prasch, Angew. Chem. 76, 787 (1964).
[4] S. Valkiers, P. De Bievre, 3rd Int.Symp. Separation Technology, Antwerpen,1993.

- 9 5 - AECL-11342
A Hot Vacuum Extraction Mass Spectrometric Systemfor Determination of H and D In Zirconium
L W. Green, G. A. Bickel, P. K. Leeson, M. W. D. James, T. G. Lamarcheand H. Michel ; ( <•'; ooc en.AECL Research, Chalk River Laboratories, Chalk River, Ontario, Canada KOJ 1J0
introduction
Corrosion reactions at the surface of the zirconium alloy tubes used in pressurizedheavy water reactors cause the release of deuterium which accumulates in the alloy.As the deuterium concentration increases, the solubility limit is reached and deuteriumprecipitates as zirconium hydrides, which degrade the fracture toughness of thepressurized tube. The solubility limits vary depending on alloy composition and reactoroperating temperature, but are close to 30 umoles/g. The initial H content and therate of D ingress must be accurately measured to ensure that the pressure tubes arewithin safe operating limits, and to predict their operating lifetime. Accurate methodsfor hydrogen in zirconium determination are also required for mechanistic studies ofhydrogen ingress. A hot vacuum extraction mass spectrometric (HVEMS) method wasadopted and upgraded for these purposes.
Hot Vacuum Extraction Mass Spectrometry with Isotope Dilution
The method is based on complete extraction of the hydrogen gas from a metallicsample followed by quantitative determination of the hydrogen isotopes. The sampleis heated to 1100cC in high vacuum and a 300 Us turbomolecular pump is used totransfer the evolved gases to a large, low-pressure, collection chamber (Figure 1).After the extraction step is complete, the gases are quantitatively analysed by theisotope dilution technique, using pure H2 or D2 as the spike.
The heater is an ellipsoidal spot lamp focussed on the sample. The sample tube ismade from hydroxyl-free quartz, and the remainder of the vacuum system fromstainless steel, to minimize the H background. A powerful extraction pump is neededbecause hydrogen strongly favors the metallic phase and has a vapor pressure of onlya few mtorr at 1100°C. Continual pumping for 8 minutes removes all, or most of, thehydrogen; for some samples a second extraction is necessary. A liquid Hecryosurface has also been used for collecting the evolved gas, and is required forsamples with high hydrogen content for which backstreaming in the turbomolecularpump is a problem.

- 9 6 - AECL-11342
CalibratedSpiking Volumes
Hydrogen HD Deuterium
Figure 1. Hot vacuum extraction mass spectrometry system
The collected gas is leaked to an 8 in. radius magnetic sector mass spectrometer(Vacuum Generators MM 8-80) and the relative ion currents of H*2, HD and Dl aremeasured to determine the isotopic composition of the extracted hydrogen. A spike isprepared in a small, calibrated volume and injected into the collection chamber. Theisotopic composition is measured again and the absolute amounts of H and Dextracted from the sample are determined by the isotope dilution method.Interferences, fractionation and gas consumption are measured and corrected for.
Calibration and Diagnostics
The accuracy of an isotope dilution analysis depends critically on the accuracy of thespike aliquot and the mass sensitivity factors. Small (17 mL) calibrated volumes withintegral capacitance diaphram gauges (10 torr) are used to prepare known aliquots ofgas for the spikes. The volume is calibrated to within an accuracy of 0.5% (2s) andthe pressure of the spike is chosen to fall within the linear response region of thegauge, for which the accuracy and precision are within 0.1%.
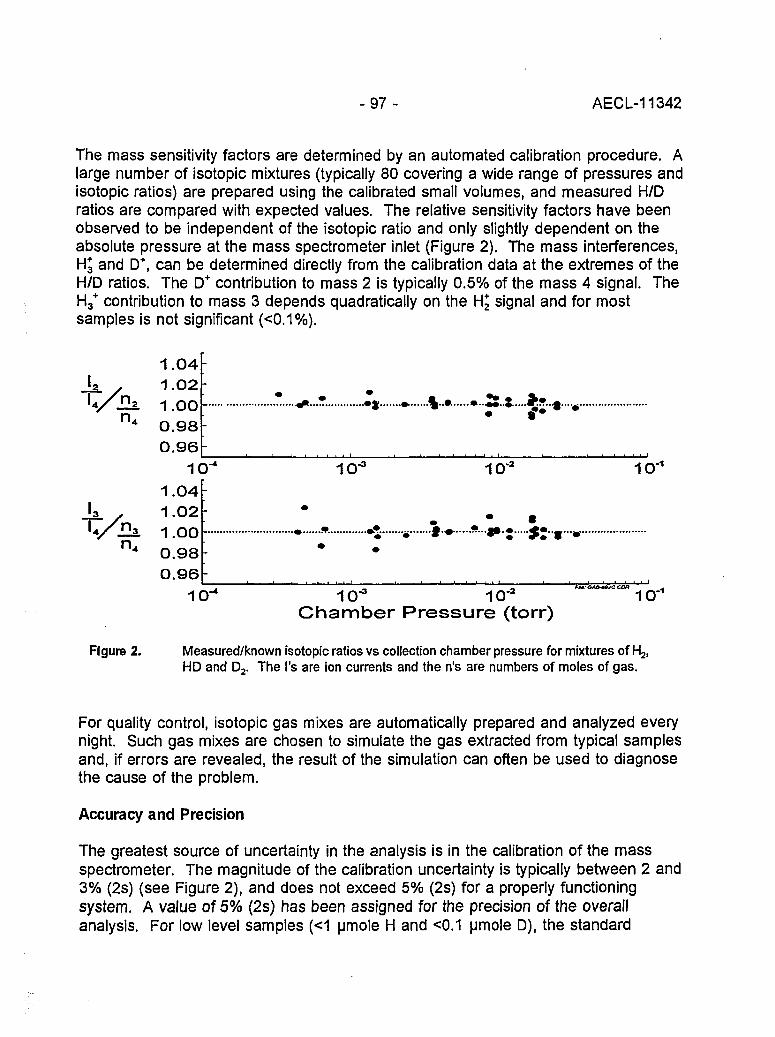
- 9 7 - AECL-11342
The mass sensitivity factors are determined by an automated calibration procedure. Alarge number of isotopic mixtures (typically 80 covering a wide range of pressures andisotopic ratios) are prepared using the calibrated small volumes, and measured H/Dratios are compared with expected values. The relative sensitivity factors have beenobserved to be independent of the isotopic ratio and only slightly dependent on theabsolute pressure at the mass spectrometer inlet (Figure 2). The mass interferences,H3 and D+, can be determined directly from the calibration data at the extremes of theH/D ratios. The D+ contribution to mass 2 is typically 0.5% of the mass 4 signal. TheH3
+ contribution to mass 3 depends quadratically on the H£ signal and for mostsamples is not significant (<0.1%).
Figure 2.
1.04
1.02
1.00
0.98
0.96
10
1.04
1.02
1.OO
0.98
0.96
10"
» •%••* •• .£: .* .
io-
1 o-3 1 o-2
Chamber Pressure (torr)1 0 ,-1
Measured/known isotopic ratios vs collection chamber pressure for mixtures of H2,HD and D2. The I's are ion currents and the n's are numbers of moles of gas.
For quality control, isotopic gas mixes are automatically prepared and analyzed everynight. Such gas mixes are chosen to simulate the gas extracted from typical samplesand, if errors are revealed, the result of the simulation can often be used to diagnosethe cause of the problem.
Accuracy and Precision
The greatest source of uncertainty in the analysis is in the calibration of the massspectrometer. The magnitude of the calibration uncertainty is typically between 2 and3% (2s) (see Figure 2), and does not exceed 5% (2s) for a properly functioningsystem. A value of 5% (2s) has been assigned for the precision of the overallanalysis. For low level samples (<1 umole H and <0.1 umole D), the standard

- 9 8 - AECL-11342
deviation of the blank will contribute significantly to the uncertainty of the analysis andis pooled with the standard deviation of the calibration to determine the totaluncertainty. The detection limits are 0.01 and 0.2 umoles, corresponding to 0.2 and2 ppm by weight in a 100 mg sample, for D and H, respectively.
Standards
The available hydrogen in zirconium standards are limited to a few remaining piecesof NBS wires and controls material supplied by Teledyne Wah Chang Albany (TWCA).Variations in H content have been observed in both types of standards and areattributed to heterogeneity. To avoid heterogeneity problems and to provide standardscontaining both H and D, we have developed a standards preparation procedure whichuses the gettering property of zirconium heated to >900°C. Small, discrete specimensare dosed with known amounts of H and/or D at 1100°C in an apparatus very similarto the HVEMS system. Standards may contain H, D or both isotopes and areroutinely made with an accuracy within 4% (2s) as determined by HVEMS (Table 1).The accuracy of the H result degrades at lower concentration levels due to apersistent H background. Methods to reduce the H background are currently beinginvestigated.
Conclusions
A state-of-the-art hot vacuum extraction mass spectrometric instrument for measuringH and D concentrations in zirconium alloys has been developed in our laboratory.Accuracy and precision are within 5% (2s) for most samples. A second apparatus hasbeen constructed to prepare H, D and H&D in zirconium standards for monitoring theperformance of the HVEMS instrument. These standards are available from theauthors.

- 9 9 - AECL-11342
Table 1: Results of the analysis of Zr standards
Sample
CB-30
CB-31
CB-32
CB-34
CB-43
CB-44
CB-48
CB-54
CB-55
CB-56
CB-76
CB-80
Mean±2s
Deuterium (pg/g)
Expected
22.9
34.1
20.7
22.7
27.7
35.0
36.0
28.2
28.4
33.2
14.6
12.3
Measured
22.6
34.0
20.2
22.9
27.9
33.4
36.1
28.5
27.1
32.6
14.2
12.1
M/E
0.987
0.997
0.976
1.009
1.007
0.954
1.003
1.011
0.954
0.982
0.973
0.984
0.99±0.04
Sample
PL-154
PL-155
PL-156
PL-161
PL-163
PL-171
PL-174
PL-176
PL-180
PL-197
PL-209
PL-226
PL-228
PL-230
PL-232
PL-238
PL-244
Expected
16.2
10.9
5.6
16.0
10.8
11.1
10.9
26.8
42.3
105.2
10.6
52.7
42.1
31.8
11.3
76.5
105.1
Hydrogen (|
Measured
15.2
10.9
5.2
15.3
11.0
11.2
11.1
24.6
41.0
102.8
10.0
53.2
43.7
32.5
11.5
76.5
108.0
jg/g)
M/E
0.938
1.000
0.929
0.956
1.019
1.009
1.018
0.918
0.969
0.977
0.943
1.010
1.038
1.022
1.018
1.037
1.023
0.99±0.08

- 1 0 0 - AECL-11342
A High Efficiency ion Source for Kr and Xe Isotopic Measurements
J. Poths and E.P. Chamberlin ; ' • J
Los Alamos National Laboratory, Los Alamos, New Mexico, 87545
Introduction
We have been exploring the use of a microwave ion source to generate large ionbeams of Kr and Xe (10'10amps), with minimal sample utilization. Our ultimate goal isto construct a mass spectrometer to determine the isotopic compositions of Kr and Xewith high accuracy on small samples. There are numerous potential applications forthis capability. One application is to detect the release and migration of fissiogenicgases from uranium ore deposits that are studied as natural analogues to nuclearwaste repositories.
Our microwave plasma source (Figure 1) is based on a concept by Vorburger et al.[1], and has been refined and tested as an ion source by subsequent workers [2,3].We routinely use it as a high efficiency gas source for isotope separation. It is verysimple, consisting of a ceramic tube 1.3 cm o.d. x 15 cm long surrounded by a 1/4-wave microwave cavity. Gas flows into the back end of the tube from a gas handlingsystem. A minimum gas pressure ("support gas"), which is species dependent, isrequired to sustain the plasma discharge. Ions are extracted at 50 kV out the front ofthe tube through an orifice 0.3 mm diameter into an isotope separator. This orifice isthe only path for gas loss from the source. Gas discharge is initiated in the sourceusing a Tesla coil.
loni
2 4 5 GHzX/4
Cavity
Plasma
p 6 cm »Gw
Flow
Figure 1: Schematic of the Microwave Plasma Ion Source

-101 - AECL-11342
In this paper we discuss our results for testing the microwave ion source for ionizationefficiency, stability, ion beam intensity, and gas consumption for Kr and Xe. We alsoreport a technique for isotopic analysis of Kr and Xe with high sensitivity directly fromair. We believe that our technique combines simplicity, high ionization efficiency, andthe ability to analyze noble gases from air without removing the Ar, and therefore is atrue improvement compared to an electron impact ion source.
Experimental
Our basic goal is to determine the suitability of the microwave ion source for use onan analytical instrument. At the same time, we wish to develop a method to analyzeKr and Xe directly from air. Anticipating that we would use the air Ar as the supportgas for air Kr and Xe ionization, we did a series of experiments on the ionizationefficiency of Kr as a function of the pressure of Ar support gas. Figure 2 shows thegas handling system used in these experiments. The 300 cm3 expansion volume isfilled with pure Ar, which is bled through a motorized valve controlled from thepressure transducer, allowing us to vary the Ar pressure in the system. The Ar mixeswith Kr from a calibrated leak, and flows into the ion source. When the calibrated leakwas new (several years ago), a Kr ion beam of 10"6amps corresponded to 10%ionization efficiency.
CALIBRATED
VALVECONTROLLER
-1 TO - 2 ATM•1 TO »2 ATM
10TORRPRESSURETRANSDUCER
MOTORIZEDVALVE
Figure 2: Schematic of the Gas Handling System used for these Experiments
Next, we modified the procedure to develop analysis of Kr and Xe directly from air.The 300 cm3 volume is filled with room air. Air flows from that volume at a ratecontrolled by the pressure transducer and motorized valve, passes through acommercial noble gas purifier and into the ion source. The purifier removes all of thereactive gases from the air stream, leaving the 1% air Ar, with traces of the othernoble gases (1.14 ppm Kr and 0.09 ppm Xe in air). This process is efficient atremoving reactive gases, as demonstrated by scans over the mass range 12 to 90,where the ion beams of all other species are at least an order of magnitude lower than40Ar. Using this procedure, we adjusted the air flow to find conditions that produce thehighest stable Kr and Xe ion currents. We then determined the gas consumption raterequired to produce these beams. Finally, we measured isotopic ratios for Kr and Xe,

- 1 0 2 - AECL-11342
which are indicative for system stability and will identify any significant isobaricinterferences.
Results and Discussion
Pressure Dependence of lonization Efficiency: We first determined the ion current forKr from the calibrated leak as a function of the Ar support gas pressure (Figure 3).Since we are using a calibrated leak as the source for the Kr, we know that a 1 uA Krion beam corresponds to an ionization efficiency of 1%, assuming no depletion of thecalibrated leak over time. We find that the source will operate down to an Arpressure of approximately 2 millitorr, below which the plasma becomes unstable andthe arc is extinguished. Just before the arc goes out, under non-reproducibleconditions, we see ionization efficiencies as high as 11%. We can routinely achieve5% ionization efficiency at slightly higher Ar pressures (about 3 mtorr), with a stable Krion beam.
Ar Pressure (mTorr)
Figure 3: Krypton Beam Current as a Function of the Ar Support Gas Pressure.1 uA corresponds to a minimum ionization efficiency of 10%.
The behavior of the source fed by noble gases concentrated from air (Kr leak isolated)is similar. Despite the fact that the Kr pressure is decreasing with decreasing airpressure, the highest Kr ion currents occur at the lowest source pressure at which astable plasma can be maintained. We determined that a pressure of 165 mtorr, asmeasured on the pressure transducer ahead of the getter, gives us stable ion beams.Since air contains 1% Ar, this roughly duplicates the lowest Ar pressure for stablesource operation with pure gases.

-103- AECL-11342
Ion Beam Intensities and Gas Consumption Rate: For Kr from the calibrated leak (flowrate of <2.4x10'6 cm3/s) with Ar as the support gas, we get a stable ion beam intensityof about 0.5 uA integrated over all isotopes. For Kr and Xe derived from air, with theair pressure in the gas handling system held at 165 mtorr, we routinely get ioncurrents of 1.5x10"10 A for 84Kr (57% of total Kr), and 9x10"12 A for 132Xe (27% of totalXe).
Having established stable conditions to give us the above Kr and Xe beam currentsfrom air, we next determined the gas consumption rate. This was done bydetermining how long the plasma discharge could be maintained from a known volumeof air. The 300 cm3 expansion bottle (Figure 2) was filled to local atmosphere (3/4 ofstandard atmosphere, 230 cm3 STP), and the pressure in the gas handling systemwas set at 165 mtorr. The source operated at a constant Kr ion current for 37 hoursbefore the gas was depleted and could no longer sustain the plasma. We thenrepeated the experiment with a smaller volume of air, roughly 15 cm3 STP. Thesection of the system between the regulator and expansion bottle (Figure 2) was filledto atmospheric pressure. With this as the feed volume, the ion beam remainedconstant for 53 minutes, which is enough time to collect isotopic data for both Kr andXe. From the experiment with 230 cm3 STP, we calculate that about 7.3x10¹² ions of132Xe were generated from 1.45x10¹⁴ atoms of Xe flowing through the source, or anionization efficiency of 5%. For Kr the calculated efficiency is 3%.
Kr and Xe Isotopic Analyses: We have measured isotopic ratios for Kr and Xe fromair samples to address two other questions regarding use of this source for accurateKr and Xe isotopic analysis. As before, the air flows through the purifier directly intothe source with no further separation. The first question is whether the ion beamremains reasonably constant over the few minutes needed to integrate the intensitiesof several Kr or Xe peaks. Second, does our procedure introduce any significantisobaric interferences in the Kr and Xe mass regions. We used a single Faradaycollector with peak jumping of the magnetic field to measure the major Kr and Xeisotopic ratios. We achieved better than 1% precision, which is adequate to rule outmajor problems in these two areas.
Figure 4 shows the isotopic ratio data for the major isotopes of Kr and Xe, normalizedto the atmospheric isotopic compositions [4,5]. The measured ratios scatter within0.5% about a linear mass fractionation trend fitted through the data. Suchfractionation is expected, and may be affecting both the gas and the extracted ions.This fractionation is about 0.6%/mass unit for Kr and 0.2%/mass unit for Xe, similar tothat for conventional gas mass spectrometry. Once corrected for mass fractionation,the good match between our measurements and the atmospheric compositionindicates that the source produces an ion beam that is stable enough for theseisotopic analyses. The good match also indicates that there are no major (<1%)isobaric interferences at these masses.
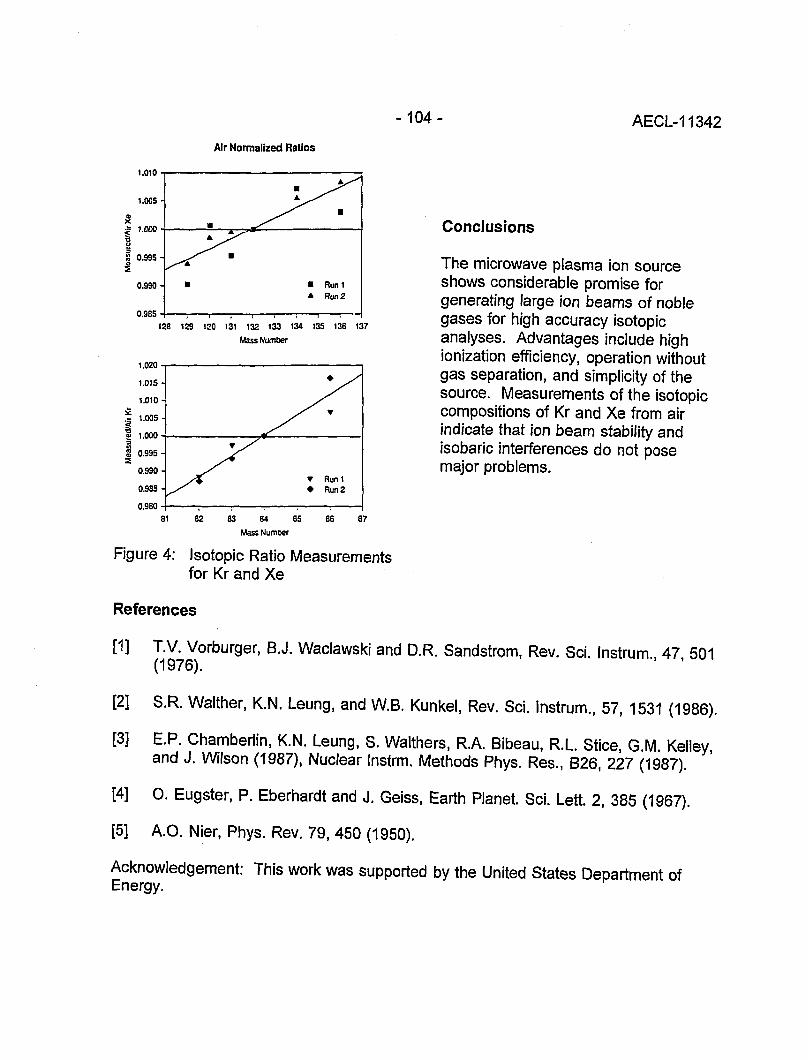
-104-
Air Normalized Ratios
AECL-11342
1.010
0.985
128 129 1?0 131 132 133 134 135 136 137
Mass Number
1.015 -
1.010 -
1.005 -
1.000-
0.995-
0.990-
0.985 -
0.980 -
• s
T Runi• Run 2
Conclusions
The microwave plasma ion sourceshows considerable promise forgenerating large ion beams of noblegases for high accuracy isotopicanalyses. Advantages include highionization efficiency, operation withoutgas separation, and simplicity of thesource. Measurements of the isotopiccompositions of Kr and Xe from airindicate that ion beam stability andisobaric interferences do not posemajor problems.
81 82 83 84 85 86 87
Mass Number
Figure 4: Isotopic Ratio Measurementsfor Kr and Xe
References
[1] T.V. Vorburger, B.J. Waclawski and D.R. Sandstrom, Rev. Sci. Instrum 47 501(1976). " '
[2] S.R. Walther, K.N. Leung, and W.B. Kunkel, Rev. Sci. Instrum., 57, 1531 (1986).
[3] E.P. Chamberlin, K.N. Leung, S. Walthers, R.A. Bibeau, R.L. Stice, G.M. Kelley,and J. Wilson (1987), Nuclear Instrm. Methods Phys. Res., B26, 227 (1987).
[4] O. Eugster, P. Eberhardt and J. Geiss, Earth Planet. Sci. Lett. 2, 385 (1967).
[5] A.O. Nier, Phys. Rev. 79, 450 (1950).
Acknowledgement: This work was supported by the United States Department ofEnergy.
-105- AECL-11342
LASER RESONANCE lONIZATION
-106- AECL-11342
Resonant Laser Ablation: Mechanisms and Applications
J.E. Anderson, R. Bodla, G.C. Eiden, N.S. Nogar and C.H. SmithChemical Science and Technology Division, MS J565Los Alamos National LaboratoryLos Alamos, New Mexico 87545
Introduction
Ever since the first report of laser action, it has been recognized that laser ablation(evaporation/volatilization) may provide a useful sampling mechanism for chemicalanalysis [1,2]. In particular, laser ablation is rapidly gaining popularity as a method ofsample introduction for mass spectrometry [3-5]. While most laser ablation/massspectrometry has been performed with fixed frequency lasers operating at relatively highintensities/fluences (>108 W/cm2, >1 J/cm2), there has been some recent interest in theuse of tunable lasers to enhance the ionization yield of selected components in ananalytical sample. This process has been termed resonant laser ablation (RLA) [6-12],and typically relies on irradiation of a sample in a mass spectrometer with modestintensity laser pulses tuned to a one- or two-photon resonant transition in the analyte ofinterest.
Potential advantages of RLA include: (1) simplification of the mass spectrum, byenhancement of signal from the analyte of interest; (2) improvement of the absolutedetection limits by improving the ionization efficiency, and (3) improvement in relativesensitivity. The sensitivity enhancement results from reduction of spurious signal, andaccompanying noise, in the detection channel. This spurious signal may be due to bleedthrough from adjacent mass channels, or from isobaric interferences. RLA tends toproduce higher mass resolution because of minimal spatial spread in the ion source andsmall space charge effects. In this manuscript we present a survey of RLA attributesand applications.
Results and Discussion
Analysis
Much of the apparatus has been described previously [13,14]. The optical sourceconsisted of an XeCI excimer laser-pumped dye laser. For most of the experimentsdescribed here, the output energy was a few mJ in the blue spectral region («450 nm),in «10 ns pulses, at a repetition rate of 10 to 50 Hz. The dye laser beam was spjit andattenuated prior to striking the sample, so that typical incident pulse energies were 10-100 uJ. The ion detector was a channel electron multiplier whose output was amplified,sent to a boxcar averager or digital oscilloscope, and then transferred to a micro-
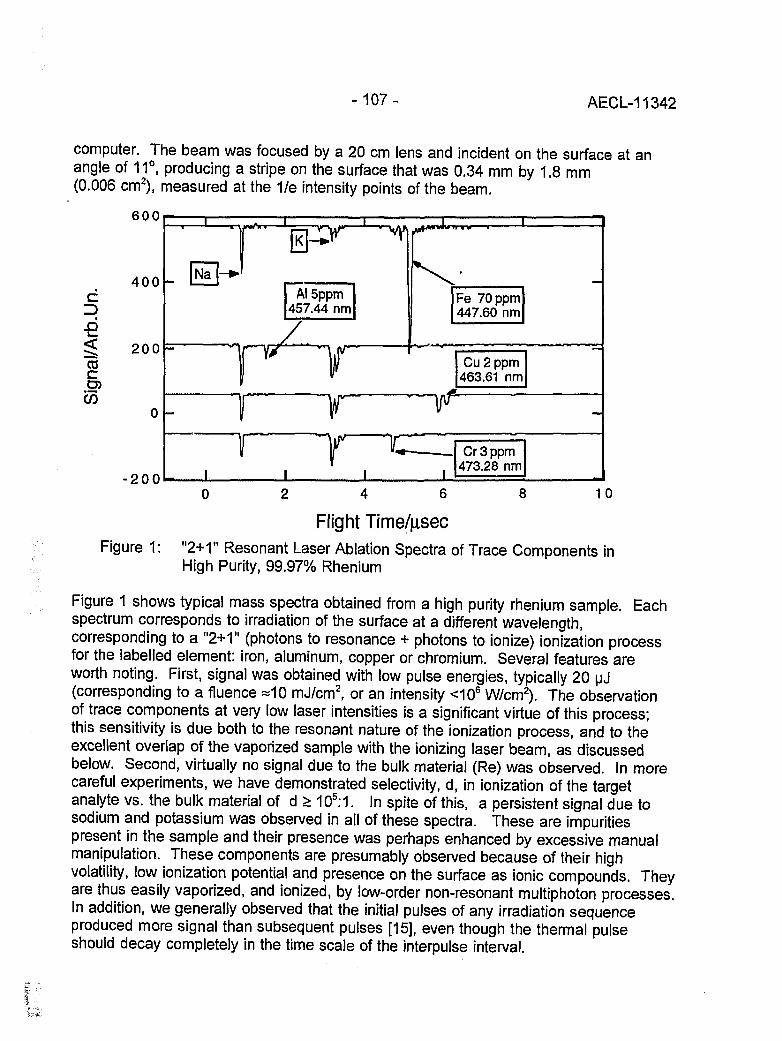
-107 - AECL-11342
computer. The beam was focused by a 20 cm lens and incident on the surface at anangle of 11°, producing a stripe on the surface that was 0.34 mm by 1.8 mm(0.006 cm2), measured at the 1/e intensity points of the beam.
4CO
CD
c/5
6 0 0
4 0 0
2 0 0
- 2 0 0
Al 5ppm457.44 nm
Fe 70 ppm447.60 nm
Cu 2 ppm463.61 nm
Tr Cr 3 ppm
473.28 nm
8 100 2 4 6
Flight Time/|xsecFigure 1: "2+1" Resonant Laser Ablation Spectra of Trace Components in
High Purity, 99.97% Rhenium
Figure 1 shows typical mass spectra obtained from a high purity rhenium sample. Eachspectrum corresponds to irradiation of the surface at a different wavelength,corresponding to a "2+1" (photons to resonance + photons to ionize) ionization processfor the labelled element: iron, aluminum, copper or chromium. Several features areworth noting. First, signal was obtained with low pulse energies, typically 20 uJ(corresponding to a fluence «10 mJ/cm2, or an intensity <106 W/cm2). The observationof trace components at very low laser intensities is a significant virtue of this process;this sensitivity is due both to the resonant nature of the ionization process, and to theexcellent overlap of the vaporized sample with the ionizing laser beam, as discussedbelow. Second, virtually no signal due to the bulk material (Re) was observed. In morecareful experiments, we have demonstrated selectivity, d, in ionization of the targetanalyte vs. the bulk material of d > 105:1. In spite of this, a persistent signal due tosodium and potassium was observed in all of these spectra. These are impuritiespresent in the sample and their presence was perhaps enhanced by excessive manualmanipulation. These components are presumably observed because of their highvolatility, low ionization potential and presence on the surface as ionic compounds. Theyare thus easily vaporized, and ionized, by low-order non-resonant multiphoton processes.In addition, we generally observed that the initial pulses of any irradiation sequenceproduced more signal than subsequent pulses [15], even though the thermal pulseshould decay completely in the time scale of the interpulse interval.
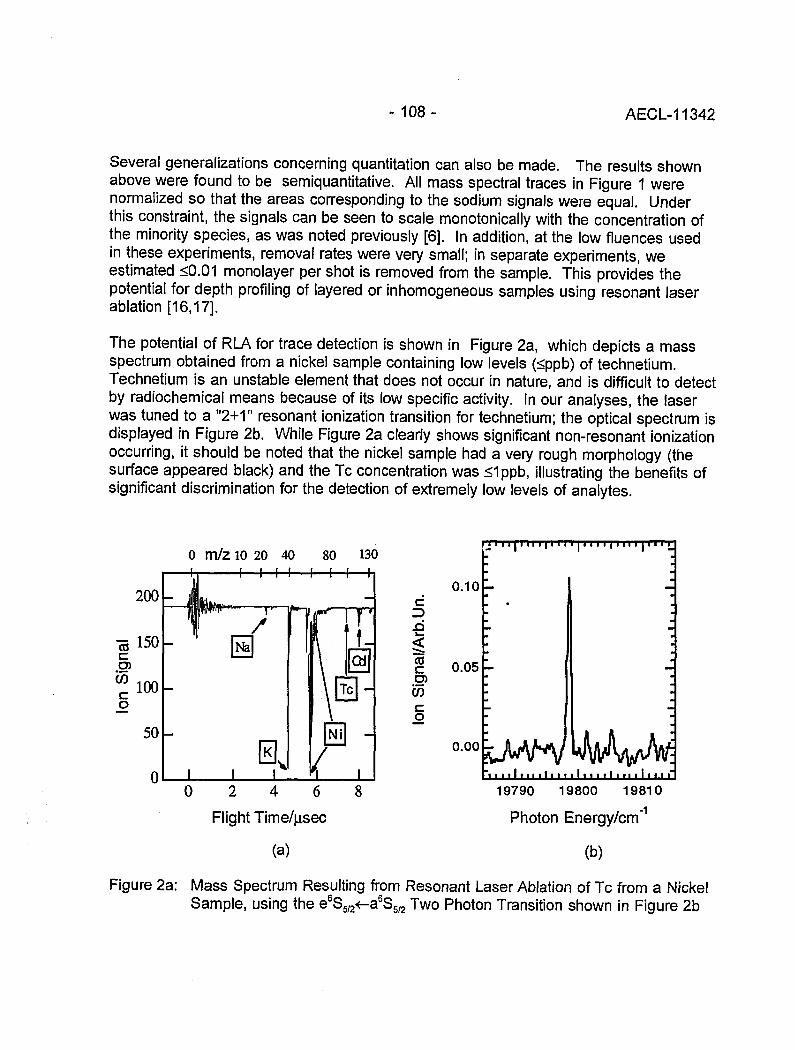
- 108 - AECL-11342
Several generalizations concerning quantitation can also be made. The results shownabove were found to be semiquantitative. All mass spectral traces in Figure 1 werenormalized so that the areas corresponding to the sodium signals were equal. Underthis constraint, the signals can be seen to scale monotonically with the concentration ofthe minority species, as was noted previously [6]. In addition, at the low fluences usedin these experiments, removal rates were very small; in separate experiments, weestimated <0.01 monolayer per shot is removed from the sample. This provides thepotential for depth profiling of layered or inhomogeneous samples using resonant laserablation [16,17].
The potential of RLA for trace detection is shown in Figure 2a, which depicts a massspectrum obtained from a nickel sample containing low levels (<ppb) of technetium.Technetium is an unstable element that does not occur in nature, and is difficult to detectby radiochemical means because of its low specific activity. In our analyses, the laserwas tuned to a "2+1" resonant ionization transition for technetium; the optical spectrum isdisplayed in Figure 2b. While Figure 2a clearly shows significant non-resonant ionizationoccurring, it should be noted that the nickel sample had a very rough morphology (thesurface appeared black) and the Tc concentration was <1ppb, illustrating the benefits ofsignificant discrimination for the detection of extremely low levels of analytes.
0 m/z 10 20 40
0 2 4 6
Flight Time/u,sec
(a)
c
COcD)CO
o
1
0.10
0.05
0.00
—
-
-̂
i •
i •
I t
i i
p I
19790 19800
Photon Energy/cm
(b)
19810-1
Figure 2a: Mass Spectrum Resulting from Resonant Laser Ablation of Tc from a NickelSample, using the e6S5/2<-a6S5/2 Two Photon Transition shown in Figure 2b

-109- AECL-11342
Spectroscopy
We also show the utility of RLA for spectroscopy and surface studies. This workdemonstrates the ease with which high quality atomic spectra can be obtained usingRLA. Figure 3 shows the 2+1 multiphoton ionization spectrum of 56Fe detected by RLAof Re containing 70 ppm Fe.
44625 44650
Two-Photon Energy/cm
(a)
44675-1
40000 40100
Two Photon Energy/cm"1
(b)
Figure 3: (a) "2+1" lonization Spectrum from the Iron Ground State(b) Similar Spectrum from an Excited State
We observe the two-photon D J=0 transition from the a5D ground term to the e5D excitedterm near 44640 cm"1; also observed is the e5F-asF two-photon transition from the firstexcited term near ~1 eV. Each of these multiplets spans a wavelength range of <1 nm,across which the dye laser power is essentially constant. The J'=3 - J"=3 and J'=5 -J"=5 transitions are much stronger than the other lines in the excited state multiplet dueto near resonances with the z5F° term (detunings of 182 cm'1 and 92 cm'1, respectively).
Temperatures can be obtained from these spectra by comparing calculated intensities fora particular temperature with experimental intensities. The agreement between theexperiment and calculation is surprisingly good. A fit of the experimental intensities tothe calculated intensities yielded a straight line (1^=0.96 to 0.99 for three data sets) forthe four lowest lying spin-orbit states in Fe. The observed intensity of the J"=0 - J'=0transition is an order of magnitude larger than calculated, possibly due to quantuminterferences. We obtain a temperature of 1100 ± 200 K for Fe atoms ablated from Reat an intensity of 2 ± 1 x 10⁶ W/cm2. This is in rough agreement with a recent

- 1 1 0 - AECL-11342
measurement [16] of the temperature of a laser desorbed plume several mm above thesurface.
Conclusions
We have shown that RLA is ideally suited for high sensitivity analyses of complex samples.It requires very modest performance from both laser and mass spectrometer, and is suitedfor detection of a wide variety of elements. We have also demonstrated 2+1 ionizationtransitions in Fe detected by RLA. Two-photon transition rates for Fe transitions werecalculated perturbatively and found to agree semi-quantitatively with experimentallyobserved intensities.
References
[1] L. Moenke-Blankenburg, Laser Microanalysis, Eds., John Wiley & Sons, New York, (1989).
[2] L. J. Radziemski, D. A. Cremers, Laser-Induced Plasma and Applications, Eds., MarcelDekker, New York, (1989).
[3] G. Toelg, Analyst (London), 112, 365 (1987).
[4] U. Boesl, J. Phys. Chem., 95, 2949 (1991).
[5] G. C. Eiden, M. E. Cisper, M. L. Alexander, P. H. Hemberger, N. S. Nogar, J. Am. Soc.Mass Spec, 4, 706 (1993).
[6] I. S. Borthwick, K. W. D. Ledingham, R. P. Singhal, Spectrochim. Acta, 47B, 1259 (1992).
[7] G. Krier, F. Verdun, J. F. Muller, Fresenius1 Z. Anal. Chem., 322, 379 (1985).
[8] K. W. D. Ledingham, J. S. Borthwick, R. P. Singhal, Surf. Interface Anal, 18, 576 (1992).
[9] C. J. McLean, et al., Int. J. Mass Spectrom. Ion Process, 96, R1 (1990).
[10] F. R. Verdun, G. Krier, J. F. Muller, Anal. Chem., 59, 1383 (1987).
[11] G. C. Eiden, J. E. Anderson, N. S. Nogar, Microchemical Journal, 50, 289 (1994).
[12] G. C. Eiden, N. S. Nogar, Chem. Phys. Lett., 226, 509 (1994).
[13] S. W. Downey, N. S. Nogar, C. M. Miller, Int. J. Mass Spectrom. Ion Processes, 61, 337(1984).
[14] N. S. Nogar, R. C. Estler, B. L. Fearey, C. M. Miller, S. W. Downey, Nucl. Instrum.Methods Phys. Res., Sect. B, 44, 459 (1990).
[15] X. L Mao, W. T. Chan, M. A. Shannon, R. E. Russo, J. Appl. Phys., 74, 4915 (1993).
[16] T. Gilbert, B. Dubreuil, M. F. Barthe, J. L Debrun, J. Appl. Phys., 74, 3506 (1993).
[17] T.M. Allan, P.B. Kelly, J.E. Anderson, T.N. Taylor and N.S. Nogar, Appl. Phys., A61, 221(1995).
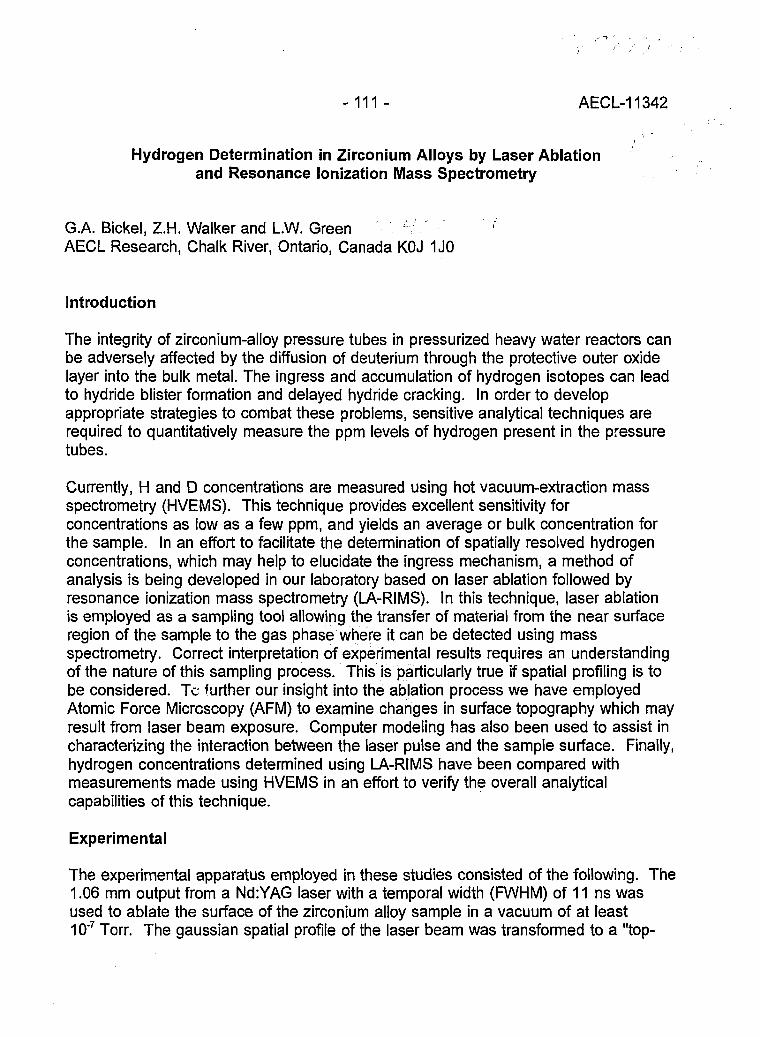
- 1 1 1 - AECL-11342
Hydrogen Determination in Zirconium Alloys by Laser Ablationand Resonance lonization Mass Spectrometry
G.A. Bickel, Z.H. Walker and L.W. GreenAECL Research, Chalk River, Ontario, Canada KOJ 1J0
Introduction
The integrity of zirconium-alloy pressure tubes in pressurized heavy water reactors canbe adversely affected by the diffusion of deuterium through the protective outer oxidelayer into the bulk metal. The ingress and accumulation of hydrogen isotopes can leadto hydride blister formation and delayed hydride cracking. In order to developappropriate strategies to combat these problems, sensitive analytical techniques arerequired to quantitatively measure the ppm levels of hydrogen present in the pressuretubes.
Currently, H and D concentrations are measured using hot vacuum-extraction massspectrometry (HVEMS). This technique provides excellent sensitivity forconcentrations as low as a few ppm, and yields an average or bulk concentration forthe sample. In an effort to facilitate the determination of spatially resolved hydrogenconcentrations, which may help to elucidate the ingress mechanism, a method ofanalysis is being developed in our laboratory based on laser ablation followed byresonance ionization mass spectrometry (LA-RIMS). In this technique, laser ablationis employed as a sampling tool allowing the transfer of material from the near surfaceregion of the sample to the gas phase where it can be detected using massspectrometry. Correct interpretation of experimental results requires an understandingof the nature of this sampling process. This is particularly true if spatial profiling is tobe considered. To further our insight into the ablation process we have employedAtomic Force Microscopy (AFM) to examine changes in surface topography which mayresult from laser beam exposure. Computer modeling has also been used to assist incharacterizing the interaction between the laser pulse and the sample surface. Finally,hydrogen concentrations determined using LA-RIMS have been compared withmeasurements made using HVEMS in an effort to verify the overall analyticalcapabilities of this technique.
Experimental
The experimental apparatus employed in these studies consisted of the following. The1.06 mm output from a Nd:YAG laser with a temporal width (FWHM) of 11 ns wasused to ablate the surface of the zirconium alloy sample in a vacuum of at least10"7 Torr. The gaussian spatial profile of the laser beam was transformed to a "top-
- 1 1 2 - AECL-11342
hat" profile with a spot diameter of 200 mm on the sample surface and a fluence of0.5 J cm"2. At this fluence, there was no evidence of plasma formation above thesample and the majority of species ejected from the surface were charge neutral. The243 nm output from a second laser, namely an excimer-pumped frequency-doubleddye laser, was used to probe the ablation plume. Deuterium atoms in the plume wereselectively ionized via a 2+1 resonance transition by tuning the output of the dye laserto the 1s -> 2s transition. Once ionized, the deuterium ions were extracted into a time-of-flight (TOF) mass spectrometer and detected.
Results and Discussion
Laser ablation rates have been determined previously in our laboratory and the rate fora fluence of 1 J/cm2 is 0.3 nm/pulse. This low removal rate would suggest that a highdegree of depth resolution should be possible with this technique. However,examination of the sample surface after exposure to several thousand laser pulses ata fluence of 0.4 J/cm2 by AFM revealed significant changes in surface topography. Incontrast to the flatness of the unexposed surface, the laser ablated region displayedhills and valleys with height variations of ±600 nm. These changes in topographysuggest that although only a small amount of material is removed per laser pulse, theinfluence of the laser pulse is felt to a much greater depth. If the pulse from theablation laser is resulting in a redistribution of hydrogen species near the surface, thenthe depth profiling capabilities of this technique may be limited.
Computer modeling of the ablation process also supports the premise that melting andfreezing of the near surface region is occurring. Temperature profiles were calculatedusing a finite difference method both as a function of time and distance from thesurface. The model included the temperature dependent specific heat and thermalconductivity values for zirconium alloy as well as the relevant ablation laser properties.In addition to calculating temperatures, ablation rates were also determined using thecalculated surface temperatures and vapour pressure data for zirconium. A maximumtemperature of 3240 K was calculated for a laser fluence of 0.5 J/cm2 with a temporalwidth (FWHM) of 11 ns. This is well above the melting temperature for pure zirconiumof 2125 K. The calculations also predict melting up to a depth of 300 nm from thesurface. Although the simulations rely on material properties that need to beextrapolated to these high temperatures, the general validity of the calculations can beverified by comparing calculated ablation properties with those measuredexperimentally. In particular, the observed threshold fluence is consistent with thefluence predicted for the onset of surface melting and reasonable agreement is seenbetween calculated and experimentally measured ablation rates.
To evaluate the quantitative capabilities of laser ablation, a sample of pressure tubematerial containing varying amounts of deuterium was prepared and analysed. Thesample was prepared by clamping one end in a heat sink and then heating the other

-113 - AECL-11342
end with a spot lamp in the presence of a D2 cover gas. The majority of the D2 wasgettered by the hot end, resulting in a deuterium concentration gradient in thelongitudinal direction. The ablation laser was then rastered across the surface and thedeuterium atoms in the ablation plume were resonantly ionized and detected in theTOF. This data is presented in Figure 1.
Figure 1: Relative D+ Signal Measured as a Function of Position on Sample Surface
The largest signals were obtained, as expected, from the end exposed to the spotlamp. To assess the relative accuracy of these measurements, the sample wassectioned into 2 mm wide strips perpendicular to the concentration gradient andsubmitted for deuterium analysis by HVEMS. The results from these analyses arepresented in Figure 2. For comparison, the D+ signals in Figure 1 have been summedin the lateral direction, normalized and plotted with the HVEMS results in Figure 2.The results from the two techniques show very good agreement.
t ! 10 12U i g l l i d l u l P o l i t i c o ( i n )
Figure 2: Deuterium Concentration as a Function of Longitudinal Position asDetermined by HVEMS Together with the Normalized Laser Ablation D+ Signal
- 114- AECL-11342
One important step in the application of laser ablation for quantitative analysis will bethe preparation of suitable standards to relate the relative deuterium ion signalsmeasured in the TOF to absolute concentrations. To address this requirement, anumber of standards were prepared by dosing zirconium alloy samples with varyingamounts of deuterium. Care was taken to provide uniform heating of the samplesduring the gettering process in order to produce samples with a uniform deuteriumdistribution. The relative D+ ion signals measured in the TOF are plotted vs Dconcentration, as determined by HVEMS, and presented in Figure 3.
- 1 0 0 —
•» B 0 -
£ 6 0 -
2 0 -
0 -
20 30
B i l t D C o i c e a t r i t l O R (ppn)
Figure 3: Relative D+ Signal Measured from Prepared Standards with Varying DContent as Determined by HVEMS
The D+ ion signal does respond linearly with increasing D concentration within theexperimental uncertainty of the data. The uncertainty in the D+ signal is larger thanthat in the D concentrations determined by HVEMS. This is due, for the most part, tothe pulse-to-pulse fluctuations in fluence in both the ablation and ionization lasers.
Conclusions
This study demonstrates the capability of laser ablation combined with resonanceionization mass spectrometry to measure hydrogen isotope concentrations in pressuretube material. H and D are selectively ionized and detected over a range ofconcentrations at ppm levels. Spatial profiling of the sample surface is alsodemonstrated although is currently limited to sub-mm resolution by the ablation laserspot diameter of 100 urn. Work is continuing in our laboratory to assess the potentialof this technique to perform depth profiling of pressure tube samples and in particularsamples containing a ZrO2 overlayer.

-115- AECL-11342
Measurement of Sample Chargingduring Sputtering of Ill-V Materials and Devices
S.W. Downey and A.B. EmersonAT&T Bell Laboratories, 600 Mountain Ave., Murray Hill, NJ USA 07974
Introduction
A common problem in the analysis of non conducting solids using ion bombardment(sputtering) is charging of the sample, which may affect the electrostatics of a massspectrometer's ion source, and hence ion transmission efficiency and reproducibility.The voltage changes induced on samples of GaAs and InGaAsP materials anddevices during sputtering are measured in real time via the Stark Effect in a resonanceionization mass spectrometer. High-lying electronic (Rydberg) levels of sputtered Gaatoms are spectrally shifted by the strong electric field (> 14 kV/cm) present in theinstrument. We use here the spectroscopic selectivity of atomic resonance ionizationin a strong electric field of the mass spectrometer to measure the charging process viathe Stark effect as it occurs under a variety of sputtering conditions. The Stark-shiftedlines are a beneficial diagnostic to probe the ion source's local electric field, whichdepends on the sample's position, potential and charging. Changes corresponding to10 V in the sample's bias can be detected spectrally. Continuous and pulsedsputtering produce different voltage shifts under a variety of incident primary ion types(Xe+ and O2
+), energies and doses. Optimization of sputtering parameters so thatcharging is not problematic, or at least predictable, helps ensure reproducibility ofdepth profiles for devices and materials where high precision is required. Charging ofsemi-insulating GaAs is significant enough at 2 keV to deflect the ion beam out of theanalysis area in the ion source. At 6 keV, the beam is not moved as much eventhough the amount of charging is about the same.
Experimental
Resonance ionization mass spectrometry (RIMS) is a selective and sensitive techniquefor dopant profiling in devices and materials [1, 2]. As in conventional depth profilingtechniques such as secondary ionization mass spectrometry (SIMS), a primary ionbeam is used to slowly and controllably erode layers of materials. The RIMS/SIMSinstrument, is a modified UHV magnetic sector secondary ion mass spectrometer usedpreviously to detect sputtered molecules in Ill-V materials [3]. Samples are sputteredby Xe ions produced in a duoplasmatron ion source operated from 8.2 -12.2 kV. ForRIMS, the sample is held at about 6.2 kV making the net beam energy on target 2 or6 kV. The sample is held about 4 mm from the grounded secondary ion extractor,creating electric fields in excess of 15 kV/cm. The sample/extractor spacing iscontrolled by a micrometer which is used to fine-tune the electric field in the alignment

-116- AECL-11342
process. The sample bias is controlled by a computer-controlled digital-to-analogconverter with voltage steps of 2.5 V. The nominal angle of incidence is about 30°relative to normal, but at low energy, this angle may be greater than 60° - 70°. Beamcurrents of up to 0.5 uA are contained in a spot of about 100 urn (FWHM) diameter.Sample sputtering may be performed with a pulsed or continuous ion beam. In pulsedoperation, the duration of the ion pulse and the timing of the laser firing relative to thepulse is controlled by a digital delay generator. In this way, varying amounts ofprimary ion dose may be delivered to the sample prior to the laser's firing. Themagnitude of the spectral shifts induced by the charging of these samples are reportedas voltage changes based on calibration by sample bias programming.
An excimer-pumped, frequency-doubled pulsed dye laser (25 ns, 40 Hz) is used tophotoionize sputtered Ga atoms. Ga is resonantly excited to Rydberg levels with laserwavelengths around 213 nm. The laser beam is attenuated (< 100 uJ) to keep thepulse energy low so as to not broaden the Ga spectral lines. The beam is focused<100 urn in front of the sample to optimize RIMS detection. The beam diameter isabout 500 urn, which in this geometry, ionizes all atoms in the ion source region whichis approximately 150 urn wide, corresponding to the energy analyzer's 180 eVbandpass. Sample high-voltage bias and time-gated detection are used to select theRIMS ions produced in the gas-phase while rejecting SIMS ions produced at thesurface.
Table 1: GaAs Samples Examined for Charging
Sample type
Semi-insulating
Semiconducting
Semiconducting
Dopant
-
p-type Zn
n-type Si
Concentration
-
1.7x1019cm-3
2 x 1018 cm'3
Results and Discussion
The ionization potential of Ga is 6.0 eV, and light with energy of 5.8 eV/photon canexcite various Rydberg electronic states (principle quantum number, n > 11). Theelectric field in the mass spectrometer is strong enough to split each n level into manystates accessible from the 4p2P,°2 ground state with one photon. Ga+ RIMS signals willbe detected because the extracting electric field in the mass spectrometer is sufficientto field ionize the Rydberg atoms [4]. Because the electric field is large, theidentification of the electronic transitions involved in the Ga Rydberg spectra is not

-117 - AECL-11342
easy due to strong mixing of states. However, the three peaks evident in Figure 1show approximately linear spectral movement as the field is varied. The shifts ofthese peaks can be used to measure sample charging from Ga-containing samples.
10-1acCO
ww
£(0O
a>#̂i2"ooc
8 -
6 -
4 -
2 -/ \
213.64 213.68 213.72Laser Wavelength, nm
i • •
213.76I
213.80
Figure 1: The effect of sample voltage change on Ga Rydberg RIMS signal sputtered fromZn-doped GaAs with 2 keV Xe+. The laser is fired at a 1.5 us delay relative to theonset of sputtering. Traces labelled 1, 2, and 3 are at sample high voltage settingsof 6.2, 6.3, and 6.4 kV, respectively.
The electrostatic geometry of this instrument, and other magnetic sector SIMSinstruments, when detecting positive ions, is based on a sample biased at highpositive voltage with respect to a grounded extraction plane. The energy analyzer isthen set to pass ions within a certain bandwidth set by the sample high voltage bias.In SIMS all ions are formed at the sample surface, the energy bandpass selects ionssputtered with different kinetic energies. In the RIMS mode, ions are created in thegas phase above the sample in a region of space defined by the diameter of the laserbeam. In addition to possessing a range of kinetic energies from the sputtering, ionsfall through different potentials due to their location in the ion source. Therefore, theRIMS ions passed through the energy analyzer are also spatially selected. For a180 eV bandpass, the region is between 100-150 urn. Changes in the field, eitherintentional or unintentional, shift the region in space that corresponds to the energypassed by the analyzer. Likewise, the size (volume) of the ion source passed by theanalyzer expands or shrinks as the slope of the potential (electric field) changes. Thefield and spot size passed are inversely proportional. So for example, if the samplecharges up during sputtering, with all other parameters constant, the atoms ultimatelydetected by the RIMS process will come from a region in the ion source progressivelyfarther from the sample that decreases in size. Most likely, the detected signal willdecrease, and may even vanish if charging is substantial. To approximate the effectof sample charging, the sample bias is varied while keeping the laser wavelength fixedwhile monitoring the RIMS signal. See Figure 2.
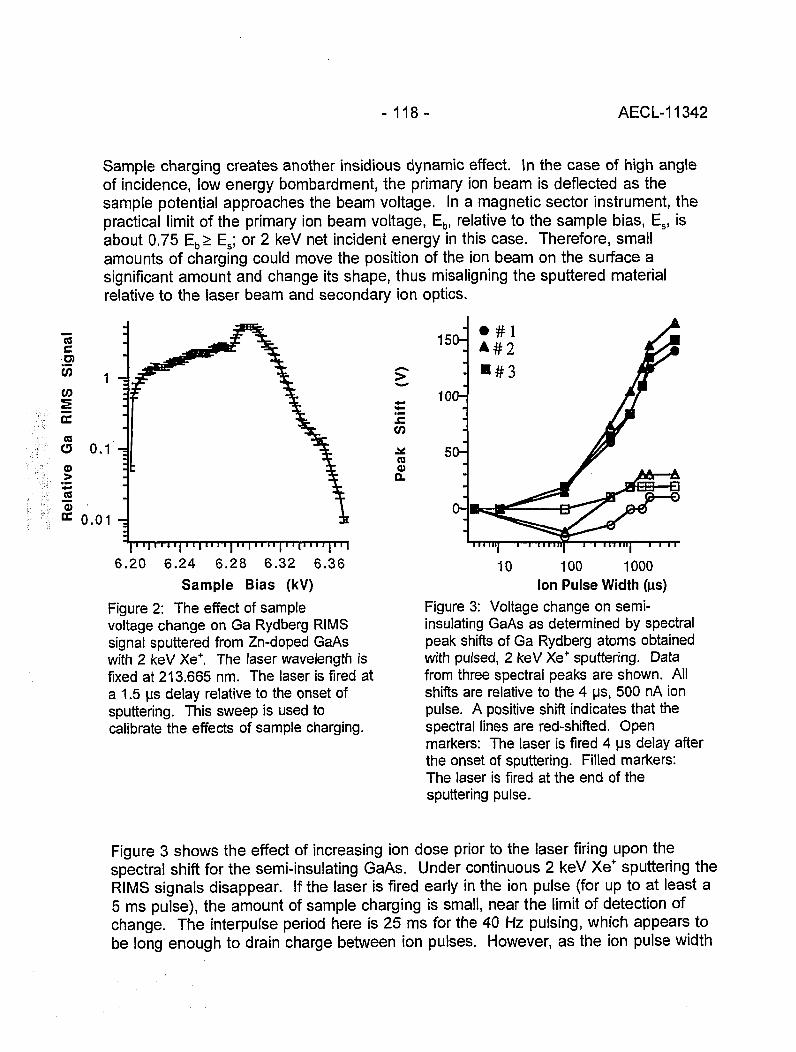
-118- AECL-11342
Sample charging creates another insidious dynamic effect. In the case of high angleof incidence, low energy bombardment, the primary ion beam is deflected as thesample potential approaches the beam voltage. In a magnetic sector instrument, thepractical limit of the primary ion beam voltage, Eb, relative to the sample bias, Es, isabout 0.75 Eb> Es; or 2 keV net incident energy in this case. Therefore, smallamounts of charging could move the position of the ion beam on the surface asignificant amount and change its shape, thus misaligning the sputtered materialrelative to the laser beam and secondary ion optics.
55CO
CO
OCD
1 -
0.1'--
0.01 -d
CO
caa)o.
| .M i . .T | . . , . , . , | . . , . . . . , . . r^rrprr,
6.20 6.24 6.28 6.32 6.36Sample Bias (kV)
Figure 2: The effect of samplevoltage change on Ga Rydberg RIMSsignal sputtered from Zn-doped GaAswith 2 keV Xe+. The laser wavelength isfixed at 213.665 nm. The laser is fired ata 1.5 us delay relative to the onset ofsputtering. This sweep is used tocalibrate the effects of sample charging.
150-
I ' ' """I ^ ' """ I10 100 1000
Ion Pulse Width ((is)
Figure 3: Voltage change on semi-insulating GaAs as determined by spectralpeak shifts of Ga Rydberg atoms obtainedwith pulsed, 2 keV Xe+ sputtering. Datafrom three spectral peaks are shown. Allshifts are relative to the 4 us, 500 nA ionpulse. A positive shift indicates that thespectral lines are red-shifted. Openmarkers: The laser is fired 4 us delay afterthe onset of sputtering. Filled markers:The laser is fired at the end of thesputtering pulse.
Figure 3 shows the effect of increasing ion dose prior to the laser firing upon thespectral shift for the semi-insulating GaAs. Under continuous 2 keV Xe+ sputtering theRIMS signals disappear. If the laser is fired early in the ion pulse (for up to at least a5 ms pulse), the amount of sample charging is small, near the limit of detection ofchange. The interpulse period here is 25 ms for the 40 Hz pulsing, which appears tobe long enough to drain charge between ion pulses. However, as the ion pulse width
-119- AECL-11342
and laser delay increase, adding charge just before measurement, the peaks shiftnoticeably. Data taken with continuous 6 keV Xe+ sputtering also shows verysignificant peak shifts, (approximately +200 V) with continuous and pulsed sputtering,but the spectra are still present. This indicates that at 2 keV, the Xe+ beam isdeflected by a 200 V increase in sample bias that is responsible for the signal lossbecause the sputtered atom cloud is no longer in alignment with the laser beam and/orsecondary ion optics. At higher energy, the lower angle of incidence is not changedmuch by the additional 200 V. The semiconducting GaAs samples exhibit minimalcharging.
Data obtained with O+2 sputtering on the semi-insulating sample exhibited less shift
(50 V) compared to Xe+. A partial explanation for this is that the positive secondaryion yield is enhanced with O+
2 sputtering relative to Xe+. The net charge on the sampleis therefore reduced somewhat as these ions leave the sample for the extractor.Secondary electrons should not contribute significantly to the net charge producedunder any sputtering conditions, because the high extraction potential effectivelysuppresses their emission.
An interesting observation is that greater signals came from craters that were closer tothe sample holder or edge. This can be partially explained by the density ofequipotential lines. In this instrument, ions are passed through a fixed energy windowset to transmit those ions created in the gas-phase by the laser beam just above thesample's surface. Normally, in the case of parallel plane electrode geometry, perhapshalf of the sputtered atoms lay outside the space that defines this window. They arestill ionized by the laser, just not passed through the electrostatic analyzer. Near thediscontinuities of the sample borders, the equipotential lines are spaced farther apart,in effect increasing the solid area passed by the energy analyzer; more atoms aretherefore detected. Away from edge effects, the field lines are closer together, makingsignals much more reproducible, but at the expense of ion transmission.
Conclusions
The spectra of sputtered Ga atoms perturbed by the electric field (Stark effect) presentin a resonance ionization mass spectrometer are used to measure sample bias changes(charging) during ion bombardment of Ill-V materials. Semi-insulating GaAs experiencessubstantial charging (100's of volts) while semiconducting GaAs may exhibit only transientcharging early in depth profiles. Time resolved measurements show how chargingprogresses as a function of ion dose to the sample. Low energy (2 keV) primary ionbeams are affected more by charging than higher energy (6 keV) beams. Edge effectsof the sample and holder significantly affect the reproducibility of RIMS signals. If primaryion beam deflection and sample edge effects are eliminated, the reproducibility is betterthan ±3%.

- 120 - AECL-11342
References
[1] H.F. Arlinghaus, M.T. Sparr and N. Thonnard, J. Vac. Sci. and Technol. A, 8,2318 (1990).
[2] S.W. Downey, A.B. Emerson, R. F. Kopf and J.M. Kuo, Surf, and Interface Anal.,15, 781 (1990).
[3] S.W. Downey, A.B. Emerson and R.F. Kopf, Nucl. Instr. Meth. Phys., B62, 456(1992).
[4] S.W. Downey, A.B. Emerson and T.R. Fullowan, Appl. Spec, 47, 1245 (1993).

- 1 2 1 - AECL-11342
Ultrasensitive Detection of Krypton-85 Gasusing Photon Burst Mass Spectrometry
C.S. Hansen1" J. Pan and W.M. Fairbank, Jr.Physics Dept, Colorado State Univ., Fort Collins, CO 80523H. Oona, E P. Chamberlin, N.S. Nogar and B.L FeareyLos Alamos National Laboratory, P. O. Box 1663, Los Alamos, NM 87545
Introduction
Although long-lived noble gas radioisotopes have been proposed as candidates for anumber of radiochemical dating and environmental monitoring scenarios [1], their usefor these applications has been severely limited due to their incompatibility with currentconventional ultrasensitive isotope detection methods. Photon Burst MassSpectrometry (PBMS), by combining the mass dispersion of an isotope separator withthe isotopically selective photon burst detection, promises to be a viable technique forultrasensitive detection of many isotopes, including noble gases. Results of recentwork with krypton isotopes (including krypton-85) at the current stage of apparatusdevelopment are presented, along with a summary of changes to be implemented inthe next phase of development. A comparison of experimental results with atheoretical model is include i as well as a short discussion of future capabilitiespredicted by this model.
Photon Burst Detection
The detection scheme we use is based on the fact that single atoms or ions with anoptically isolated pair of energy levels can absorb and emit many photons during thetransit time of a detection region (microseconds). Due to loss from the collectors andquantum efficiency of the photomultiplier tubes, only 3-4% of the spontaneousemission is detected. We require this "burst" of detected photons to be a minimumsize before counting it as a real single atom event The photons are produced by alaser beam (811.5 nm) which is aligned anticollinearly with the krypton beam, both ofwhich lie along one focus of an elliptical chamber. Spontaneous emission from theatoms is imaged by the elliptical surface (Au coated) through a slit at the oppositefocus and onto a photomultiplier tube (Hamamatsu R4519). This geometry, along withthe non-invasive nature of the technique, allows us to use multiple detectors in series.By requiring a minimum number of time correlating events in the detectors, we are
+ Current address: LANL, P.O. Box 1663, MS J514, Los Alamos, NM 87545
- 122 - AECL-11342
able to discriminate against random burst-generating events, such as cosmic raysimpinging on a photocathode.
For krypton, the optically isolated system is between the 1s5 (J=2) and the 2p9 (J'=3)energy levels. For odd Kr isotopes it is the F=13/2 and F'=15/2 hyperfine levels. Thefinal atomic beam velocity, ~3 cm/us, introduces a mass dependent artificial (Doppler)isotope shift leaving the nearest isotopic interference more than 90 natural line widthsaway. Thus, the current level of sensitivity is limited not by isotopic interferences butby background levels due to light scattered from the laser beam as well as PMT darkcounts.
Results
The Kr ions are generated in a microwave ion source [2], accelerated through 50 kV,and imaged through a magnetic sector with an abundance sensitivity of about 105.They are decelerated to 500 volts, to increase the interaction time in the detectionregion, and then neutralized in a Rb vapor (IP = 4.18 eV) to efficiently prepare atomsin the correct electronic state. This is followed by the photon burst detection regionand associated detection electronics.
We have observed time correlated photon burst signals from all major and minor Krisotopes as well as from prepared samples of 85Kr. Correlated burst detection hasyielded a dramatic reduction in background levels and improvement in signal-to-background ratios as compared to results obtained by counting the total fluorescencesignal from a single detector. Dynamic range capabilities on the current apparatus of>108 have been demonstrated using signals from both krypton-83 and krypton-85.Experimental results agree well with our theoretical model for different isotopes over arange of conditions. This model is built on a spreadsheet and treats randomprocesses in an average way. It has been shown to produce results in goodagreement with results from a detailed Monte Carlo simulation of the detectionprocess.
Future Work
The next phase of the project includes changes that will reduce the background levelsand increase the detection efficiency. To increase the efficiency we are adding anadditional 6 collectors to the detection region as well as making changes in the ionbeam characteristics to improve spatial and frequency overlap with the laser beam.Noise levels will be reduced by more efficient cooling of PMT's to lower dark countrates and by improving the coupling of the laser beam into the system in order toreduce the amount of light scattering into the collectors. With these improvementstaken into account, the model indicates that krypton-85 can easily be detected atisotopic abundance levels in the 10"11 range with fairly small sample sizes in a

-123 - AECL-11342
reasonable time frame. For example, if we require a detected burst size >1 in at least5 out of the 10 detectors, we can expect a signal of 500 counts per hour and abackground of less than 1 count in that time with an overall efficiency of >10"4
(detected 85Kr atoms/85Kr at source).
References
[1] B.D. Cannon and T.J. Whitaker, Appl. Phys. B 38, 57 (1985), and referencestherein.
[2] E.P. Chamberlin, K.N. Leung, S. Walthers, R.A. Bibeau, R.L. Stice, G.M. Kelleyand J. Wilson, Nucl. Instrum. Methods B 26, 227 (1987).

- 1 2 4 - AECL-11342
GENERAL

- 125 - AECL-11342
SIMS Studies of the Corrosion of Zirconium
R.L. Tapping*, P.K. Chan*, P.R. Norton** and C-S. Zhang**
*System Chemistry & Corrosion Branch, Chalk River LaboratoriesChalk River, Ontario, KOJ 1PO o (rc I;) c c o c A
**lnterface Science Western,.University of Western Ontario( London, Ontario, N6A 5B7
Introduction
The CANDU core typically contains about 400 or more horizontal fuel channels whichcontain the fuel (12 fuel bundles). The fuel channel is comprised of a central pressuretube surrounded by a calandria tube, which separates the pressure tube from theheavy water moderator. Heavy water flows over the fuel inside the pressure tube, andis heated from about 250°C at the fuel channel inlet to about 305°C at the outlet.
Between the pressure tube and the calandria tube is the gas annulus. The annulusgas is now carbon dioxide in all CANDU reactors, although earlier reactors usednitrogen gas.
The pressure tube is fabricated from a zirconium alloy containing 2.5 wt.% niobium,designated here as Zr-2.5Nb, in order to optimize the reactor's neutron economy whilstretaining adequate corrosion resistance and strength.
Some Corrosion Considerations
Zirconium alloys, and particularly Zr-2.5Nb, have excellent corrosion resistance to mostaqueous environments, but exposure to high temperature water under conditionstypical of those in the core of nuclear power reactors leads to reaction of the alloy withthe water:
Zr + 2D2O -> ZrO2 + 2D2
Some of the hydrogen (deuterium) liberated by the corrosion reaction is absorbed bythe zirconium alloy. It is often assumed that this is the only corrosion reaction,although the formation of a protective zirconium oxide film on the surface means thatdirect reaction of the alloy with the water rapidly becomes unlikely, and that furtherreactions that may be responsible for alloy degradation must take place on theoxidized surface.

-126- AECL-11342
Reactions with the CO2 annulus gas, and with hydrogen impurities in the gas, mayalso be important. The principle degradation reaction for zirconium alloys in reactorcores is not oxidation but the adsorption of hydrogen isotopes, either as a result of anoxidation process or independently. Although zirconium has a strong affinity forhydrogen isotopes, and for oxygen, the solubility of hydrogen in zirconium is very low.At room temperature this solubility is less than 0.1 ppm, and at 300°C, isapproximately 50 ppm (by weight). Thus at room temperature any hydrogen in excessof 0.1 ppm is present as solid hydride. Zirconium hydrides are very brittle, and tend toform at areas of high local stress, hence fracture of the hydrides, which appear asplatelets oriented perpendicular to applied or residual stress gradients, can causefailure of the host zirconium alloy structure.
Surface Science and Zirconium Corrosion
Zirconium exposed to water, air, or any oxidizing environment is rapidly covered with adense, adherent, and hence protective, oxide film. An understanding of the propertiesof this film, the reaction of this film with CANDU reactor environments, the factorscontributing to growth, degradation and repair of this oxide, the rates and mechanismsof diffusion of hydrogen isotopes and oxidizing species through the oxide, etc. are allessential if we are to predict the effects of in-reactor corrosion on pressure tubes.Thus it is clear that surface science plays a critical role in developing an adequatemodel of pressure tube corrosion behaviour. It is the intent of this paper to show howvarious surface science techniques, and in particular SIMS, have contributed to ourunderstanding of zirconium alloy corrosion behaviour, and specially the deuteriumingress behaviour of Zr-2.5Nb.
Water Corrosion Studies
Studies in this area have concentrated on the oxidation of Zr-2.5Nb in 300°C water,and the accompanying absorption of hydrogen (deuterium in heavy water). Surface-related studies have concentrated on identifying the species responsible for hydrogeningress. For this paper the example to be discussed here will be SIMS studies ofvarious polycrystalline zirconium-niobium alloys exposed to water (D2O). A zirconium-20 wt.% niobium (Zr-20Nb) alloy was used to simulate the composition of the Nb-richp-phase that surrounds the a-grains, which have a composition approximated by thezirconium-1 wt.% niobium (Zr-1Nb) alloy, in the as-fabricated pressure tube. Theprincipal application of SIMS here has been the use of dynamic SIMS to determine thedistribution of deuterium in the oxides and the substrate, and the relationship of thesedistributions to the diffusion processes that may be taking place.
The SIMS composition versus depth profiles of the water-exposed Zr-20Nb oxide werefound to be significantly different than those measured for the Zr-1Nb oxide. In thecase of the Zr-1 Nb oxide, the deuterium concentration decreased uniformly into theoxide film to a base level typical of that found in the underlying metal substrate. For

-127- AECL-11342
the oxide formed on the Zr-20Nb oxide, the deuterium concentration dropped rapidly tothe detection limit of the instrument, remained at this level throughout the rest of theoxide, then increased through the oxide-metal interface to a constant concentration inthe metal substrate. During the water exposures it was noted that the oxidation(corrosion) rate for the Zr-20Nb alloy was greater than that for Zr-1Nb, but thedeuterium uptake by the Zr-20Nb alloy, measured by hot vacuum extraction massspectrometry, was considerably less. This result coincides with the lower deuteriumintensity found in the SIMS spectra of the Zr-20Nb oxides. The higher deuteriumconcentrations found in the SIMS spectra of the Zr-1Nb oxides may reflect the greaterporosity of these oxides, with the deuterium adsorbed on the pore surfaces. Theseobservations indicate that there are significant differences in the resistance of theoxides grown on these two alloys to deuterium diffusion.
Gas Phase Corrosion Studies
As noted above, the outside of the CANDU pressure tube is exposed to carbondioxide. Recent studies have concentrated on defining the effects of carbon dioxideon the oxide, and on studies of the oxide breakdown and repair process. The recentperception that gas-side deuterium ingress may be more important to pressure tubehydriding is reflected in the increased emphases here on the gas phase work. Thedynamic SIMS studies to be discussed cover the degradation of the oxide as a resultof exposure to non-oxidizing conditions, and the reaction with carbon dioxide, andcarbon dioxide mixtures with deuterium and oxygen. The diffusion of deuteriumthrough the degraded and repaired dioxides is included. These studies have beeneffectively co-ordinated with XPS analyses of oxide stoichiometry. Studies using staticSIMS have concentrated on fundamental studies of the interaction of oxygen andhydrogen isotopes with single crystal zirconium surfaces. These latter studies havedemonstrated that the combination of static SIMS and AES can provide uniqueinsights into the diffusion of hydrogen as a function of crystal orientation.
XPS characterization was carried out to determine the change in zirconium andniobium oxide stoichiometries with various gas phase exposures (to D2, CO2, CO2 +O2, CO2 + O2 + D2 at 593K, following degradation at various temperatures). DynamicSIMS D-profiles, extending from the oxide surface to the underlying metal substrate,indicated a difference in the nature of the oxides (i.e., deuterium permeability) afterthese various treatments. Specimens analyzed by XPS before vacuum degradationhad normal ZrO2 and Nb2O5 oxide surfaces.
It was concluded from these gas phase exposures that: (1) CO2 is weakly oxidizingand will not repair a degraded oxide; (2) deuterium ingress is associated with oxidesubstoichiometry; (3) deuterium enhanced the reduction or degradation of the oxide;and (4) vacuum-degraded oxide can be repaired with O2.

-128- AECL-11342
Surface Kinetics of Hydrogen on Zr
The previous examples used dynamic SIMS at very high beam currents in order todetermine the deuterium distribution through oxides several Mm thick. This requires aprofiling rate sufficiently rapid to profile the oxide in a reasonable time. By contrast, inorder to take advantage of SIMS' ability to detect H or D directly, and also measuresurface H/D concentrations without significant surface disruption, static SIMS,(SSIMS), can be used.
The Bulk Diffusion of Hydrogen in Zr(0001)
The theoretical principles underlying this application rely on the fact that the surfaceconcentration during the segregation of hydrogen on metal (zirconium) surfaces iscontrolled by bulk diffusion and surface desorption of the solute (hydrogen). Heating asample containing surface-absorbed hydrogen resulted in all of the hydrogendissolving uniformly in the bulk (to give a bulk concentration of a few tens of atomicpm). Quenching resulted in segregation of the hydrogen to the surface. A plot of H"yield versus t1/2 provides estimates of the diffusion coefficient as a function oftemperature.
Addition of oxygen to the sample, to generate a surface layer containing 10 to 20%oxygen over a depth of a few tens of nanometres, resulted in an increase in the bulkdiffusion constant. This result is consistent with the dilation of the zirconium lattice bythe presence of oxygen. The results obtained from this segregation method are ingood agreement with those extrapolated from high temperature data.
Hydrogen Ingress Studied by SSIMS
Using SSIMS, the diffusion of H from the bulk to the surface can be measured, and itcan be shown that equilibrium between surface segregation and bulk diffusion isestablished at >260°C. Above 260°C the surface concentration of hydrogen is <0.05monolayers, and the heat of segregation can be derived from a plot of Hn [H'] vs 1/T.A comparison between heating a sample exposed to 0.5 L hydrogen (generating -0.5monolayers coverage) and one that is clean shows that overlap between the Hn [H'] vs1/T curves, which signifies equilibrium, has been achieved at temperatures >260°C.
Again, modification of the surface region by exposure to oxygen has a profound effecton the hydrogen ingress rate, and results in a decrease in the heat of surfacesegregation, in agreement with the dilation of the zirconium lattice by oxygen.
Both these examples show that SSIMS, using knowledge generated from othersurface studies on the same well-controlled surfaces, provides fundamental data onhydrogen isotope behaviour on zirconium surfaces that can be related to surfacecomposition and structures that are believed to control in-reactor behaviour.

- 129 - AECL-11342
Conclusions
Although detailed results were not presented, the intent of the work summarized herewas to show that SIMS, both dynamic and static, is a valuable part of the work neededto understand the mechanisms of hydrogen adsorption by corroding zirconium alloys.Dynamic SIMS studies have indicated that hydrogen ingress in water-corrodedsamples appears to be preferentially via the a-grains in the unaged a-p Z-2.5Nbmicrostructure, although in the aged material ingress is via the p-phase. Gas-phaseexperiments suggest that oxide breakdown is possible in CO2, and this breakdown canresult in hydrogen ingress. Oxide repair, and prevention of hydrogen ingress, can beeffected by adding oxygen to the CO2.
Static SIMS studies have been used to help understand the hydrogen diffusion andadsorption processes, and show that dilation of the zirconium lattice by oxygenincreases hydrogen diffusion and adsorption. This is an important result, since theregion immediately below the oxide contains dissolved oxygen and can therefore actas a window for hydrogen isotope ingress if hydrogen penetrates to this region.Clearly, the formation and bulk dissolution of the oxide formed on zirconium andzirconium alloy surfaces has a marked effect on hydrogen adsorption and predictionand control of the hydrogen absorption will depend on an understanding of the oxide-metal and oxide-environment interfaces.

-130- AECL-11342
Accelerator Mass Spectrometry: Practice and Prospects
H.R. AndrewsAECL Research, Chalk River Laboratories, Chalk River, Ontario, Canada KOJ 1J0
Introduction
Accelerator Mass Spectrometry (AMS) is one of the most significant developments intrace analysis of the last fifteen years. Traditional applications have been themeasurement of various long-lived cosmogenic isotopes at natural concentrations; inrecent years biomedical applications have been of growing importance. AMS can alsobe used for trace elemental analysis, because for every element except indium, atleast one isotope exists for which there is no stable isobar in adjacent elements. Thisapplication of AMS is finding increasing use in semiconductor characterization andmineral analysis, the latter with microbeam ion sources.
The well-established AMS isotopes, their half-lives and stable isobars are given inTable 1. The standard task of AMS is to determine the isotopic ratio of the rareradioactive isotope to the stable isotopes of the same element. Natural values of thisratio vary from ~10"12 to ~10'15. For isotopes such as 14C, 36CI and 1 2 9 I , which are alsobyproducts of nuclear activities, the ratio can be several orders of magnitude higher insamples from contaminated areas. Straightforward techniques based on electric andmagnetic fields can be used to separate the isotopes of the element. The challenge isto discriminate against stable isobars, which, because they are essentially equal inmass, must be separated on the basis of their nuclear charge, and/or atomic,molecular or chemical properties that proceed therefrom.
Table 1: Standard AMS Isotopes
Isotope10Be14C26AI35CI
(41Ca)
(59Ni)129i
Half-life (years)
1.6x10⁶
5730
7.16x10⁵
3.0x10⁵
1.03X10⁵
7.6x10⁴
1.57X10⁷
Stable Isobar10g
14N26Mg
36S ) 36 A r
4 1 K
S9Co129Xe
(41Ca and S9Ni are not measured routinely in large numbers of samples)

- 1 3 1 - AECL-11342
This paper will review current AMS techniques and then recount a number ofextensions to standard practice that could be applied to other, more difficult, isotopesof scientific or industrial interest. Space limitations preclude detailed discussion butreferences containing more information will be given. The paper ends with aSummary and Outlook.
Present Practice
The success of AMS arises from three factors: the use of negative ions at injection,which suppresses isobars in some cases; the stripping process at the acceleratorterminal, which destroys molecular ions; and the high energy of the acceleratedparticles, which permits the use of sensitive particle identification and detectiontechniques developed for nuclear spectroscopy. Details on many systems, large andsmall, can be found in ref. [1] and references cited therein.
Isotopic separations are achieved by magnetic analyses at injection and afteracceleration, augmented by one of electrostatic analysis or velocity analysis (Wiencrossed-field filter or time of flight) to remove or identify weak parasitic fluxes of othermasses with the same magnetic rigidity as the desired species. The primary isobaricseparation is achieved in case-specific ways: non-existence or instability of thenegative ion: 14N, 26Mg, 36Ar, 129Xe; differing ranges in the detector: 10B; andextensive chemical purification plus particle identification techniques: 36S. Othermethods, to be described in the next section, have been used on occasion in somecases, but among these, the only routine use is the gas-filled magnet for 3SS rejectionat Chalk River.
Prospects
There are a number of other isotopes of scientific or industrial interest listed in Table2. They are produced cosmogenically (C) and/or are fission products (F). Theseisotopes are considerably more difficult to determine and it may not be possible toreach the sensitivities and background limits that are obtained for the standardisotopes in Table 1.
There are many additional techniques for isobaric separation and identification. Threethat will not be discussed further here are: (1) Total stripping, applicable where Z is nottoo large and when Z (AMS) > Z (isobar) as in 36CI vs. 36S, 41Ca vs. 41K, and 59Ni vs.59Co. This technique requires very high energies to be efficient; (2) Resonant lonizationCoupled with AMS. 3) Static electric field ionization, applicable to negative ions of verylow electron affinity. A number of other methods with examples are outlined in thefollowing.
- 1 3 2 - AECL-11342
Table 2: Other Isotopes of Scientific or Industrial Interest(Those labelled (C) are produced naturally; (F) denotes fission product)
Isotope53Mn (C)60Fe (C)
79Se (C,F)
" T c (F)107Pd (F)
126Sn135Cs
Half-life (years)
3.7x10⁶
1.5x10⁶
6.5x10⁴
2.1x10⁵
6.5x10⁶
-10 s
2.3x10⁶
Stable Isobar
5 3 C r
S0Ni79Br
"Ru107Ag
126Te, 126Xe135Ba
1. The Gas-Filled Magnet separates isobars because the mean charge state andtherefore the average magnetic rigidity of the ions is a function of their Z as theyundergo collisions in the low pressure gas filling the magnet box. This oldtechnique [2] has been reintroduced to AMS [3] and is used very successfully atChalk River for the suppression of 36S in 36CI measurements [4]. It can beextended to heavier systems through the use of higher energies and higherresolution spectrometers; it is possible that trajectory reconstruction through themagnet (by sensing the particle position at one or more places along its path)might facilitate suppression of the low intensity tails of scattered particles that limitthe sensitivity in some cases. The effect of the tails is minimized when Z (AMS) <Z (isobar) as in 32Si vs. 32S; 79Si vs. 79Br; 126Sn vs. 126Te; and 13SCs vs. 135Ba. Thetails are exacerbated in the opposite situation, e.g. 36CI vs. 36S; 59Ni vs. 59Co; and41Ca vs. 41K.
2. Isobaric laundering is a term coined in the present paper for the reduction ofisobaric interferences by deliberately introducing a small amount of stable isobar-depleted element and then chemically removing it. If isotopic equilibration isachieved, then the reduction factors can be substantial. Table 3 is calculatedassuming the use of separated isotopes actually in stock at Chalk River. Betterresults should be possible with specially depleted materials. This techniqueshould be applicable to conventional mass spectrometry as well as to AMS.
3. Negative molecular ions can be used to discriminate against isobars in some cases.For example, 32SH3 is not stable whereas 32SiHj is [5]. Similarly in the 79Se-79Brsystem the use of 79SeH' could suppress the interference, since 79BrH' is probablynot stable. This method may be applicable in other cases as well.

-133- AECL-11342
Table 3: Isobaric Laundering (with off-the-shelf isotopes)
AMSIsotope
41Ca5 3Mn60Fe79Se
"Tc107pd
126Sn135Cs
StableIsobar
4 1 K
53Cr60Ni79Br
"Ru107Ag126Te135Ba
ReductionFactor
240
120
1860
>25
30
>50
189
>330
4. Laser photodetachment has wide applicability but, as a non-resonant process, itsefficiency is limited by available laser power and duty cycles. Proof-of-principleexperiments have been carried out in the 36CI-36S and 59Ni-59Co systems [6]. Asshown in Table 4, it has wider applicability if negative hydride ions are consideredas well. The process is viable whenever the electron affinity of the desiredspecies exceeds that of the isobaric one. The process would be more efficient ifresonances to autoionizing states exist; these have been predicted [7] but haveyet to be observed.
Table 4: Electron Affinities (eV) of Negative Ions or Negative Hydrides of AMS Isotopesand Their Stable Isobars ("n.s." denotes not stable)
AMS
S3Mn-
MnH"
» N r
^Fe"
FeH-
79Se"
SeH'135Cs"
Isotope
n.s.
0.869
1.156
0.151
0.934
2.02
2.21
0.472
Stable
5 3 C r
CrH"59Co"
eoNi-
NiH"7 9Br
BrJ-T135Ba-
Isobar
0.666
0.563
0.662
1.156
0.481
3.36
n.s.(?)
0.15
-134- AECL-11342
5. The use of K X-ray Identification is a method that is generally applicable butlimited in sensitivity because of inefficiencies in production and detection of the Xrays. This approach is being evaluated in a number of laboratories and someresults have been published (e.g. [8]). The systematics of projectile K-vacancyproduction have been investigated as a function of ion energy and target species[9]. The cross sections increase as a power-law of ion energy. Thus for energies>100 MeV vacancy probabilities can exceed 1%. Because of X ray line structure,high resolution detectors are needed and Doppler broadening must be minimizedby the use of detectors with relatively small solid angle. This technique isprobably most applicable to the determination of fission-product isotopes for whichthe isotopic ratios can be several orders of magnitude higher than those typical ofcosmogenic species.
Summary and Outlook
AMS has become an important analytical tool for the study of a number of natural andman-made long-lived isotopes. The standard techniques are well developed and themeasurements have become routine at many laboratories around the world. Thereare a number of other cases that are of potential interest as natural tracers or in themonitoring of wastes from nuclear activities. These are generally more difficult andrequire new methods or extensions of present techniques. In many cases it is unlikelythat the exquisite sensitivities achieved in the "standard" cases will be attained.
Acknowledgements
The author would like to thank R.J.J. Cornett and V.T. Koslowsky of Chalk River,L.R. Kilius and A.E. Litherland of Isotrace Laboratory, University of Toronto andH.K. Haugen of McMaster University for helpful discussions.
References
[1] Proceedings of the Sixth International Conference on Accelerator MassSpectrometry edited by L.K. Fifield, D. Fink, S.H. Sie and C. Tuniz, Nucl. Instr.and Meth. B92 (1994).
[2] C.B. Fulmer and B.L. Cohen, Phys. Rev. 109, 94 (1958).
[3] M. Paul, B.G. Glagola, W. Henning, J.G. Kelber, W. Kutschera, Z. Liu, K.G.Rehm, B. Schneck and R.H. Siemssen, Nucl. Instr. and Meth. A277, 418 (1989).
[4] H.R. Andrews, G.C. Ball, R.M. Brown, R.J.J. Comett, W.G. Davies, B.F. Greiner,Y. Imahori, V.T. Koslowsky, J.W. McKay, G.M. Milton and J.C.D. Milton, Nucl.Instr. and Meth. B52, 243 (1990).

- 135 - AECL-11342
[5] J. Heinemeier, P. Hornshoj, H.L. Nielsen, N. Rud and M.S. Thomsen, Nucl. Instr.and Meth. B29, 110(1987).
[6] D. Berkovits, E. Boaretto, G. Hollos, W. Kutschera, R. Naaman, M. Paul and Z.Vager, Nucl. Instr. and Meth. A281, 663 (1989) and B52, 378 (1990).
[7] E.V. Vidolova-Angelova, L.N. Ivanov, E.P. Ivanova and V.S. Letokhov, Opt.Spectrosc. (USSR) 54, 350 (1983).
[8] H. Artigalas, J.L Debrun, L Kilius, X.L Zhao, A.E. Litherland, J.L. Pinault, L.Fouillac and C.J. Maggiore, Nucl. Instr. and Meth. f392, 227 (1994).
[9] W.E. Meyerhof, R. Anholt, T.K. Saylor, S.M. Lazarus, A. Little and L.F. Chase,Jr., Phys. Rev. A14, 1653 (1976).

-136- AECL-11342
Isotopes at CEA (France) / , r
Jean R. Cesario '••// c r : /,.<•/Commissariat a I'Energie Atomique, Direction du Cycle du Combustible, C. E. Saclay,91191 - Gif sur Yvette, France.
Introduction
Numerous activities in nuclear R&D induce the use of various mass spectrometricmeasurements ; the choice of methods is determined by considerations such asnature of the material (mineral or organic), radioactivity, availability of the material inlarge or small amounts, precision requirements, ... This extended abstract states somesignificant examples of isotope production and measurement methods.
Isotope Measurements
Nuclear Field
Waste Storage
The nuclear community states that a well designed waste storage is likely to last aslong as a natural ore deposit. This idea has generated many investigations all over theworld around notion of natural analogs.
The Oklo phenomenon is an interesting source of information about long-termunderground storage for nuclear wastes. Among various measurement techniques, ithas been useful to provide a tool for microscopic elemental and isotopicmeasurements on polished Oklo cuttings. Holliger in Cadarache (trad. AECL TR-614,COG-93-345) using a Cameca ion microprobe obtains precise results. New significantdates are consequently established; in the meantime information obtained fromuranium oxide grain studies should make it possible to assess the geochemicalbehavior of numerous elements in a given mineralogical phase (Table I) and toimprove the modeling of transfer processes in radioactive waste disposal sites.
Environmental isotopes can be used as representative tracers of underground waterand salt movements. Recently the use of 36CI formed in the atmosphere by:
40Ar (p, na) - * 36CI t1/2= 3 x 10⁵ a
has been found especially interesting for investigations of large aquifers with slowturnover, as in arid lands. This isotope can only be measured by accelerator massspectrometry. Scientists in CEA work to improve the possibilities of their acceleratormass spectrometer, the Tandetron in Gif sur Yvette.

-137 - AECL-11342
Table 1: Summary of the Behavior of Some Elements in the "Fuel" as Determined with SIMS
Element
Cs
Sr
Ba
Mo
Tc-Ru
Rh-Pd
Te
Bi
Nb
Zr
REE-Y
Pb
Th
Pu
U
Retention
++++
+++++
+++
++++++
++++++
Localredistrib.
++
++++++
++
+++
++++++
Far migration
++++++
++++++
Comments
1| Natural isotopes
| (post-reaction)
11| Metallic inclusions
) (metallic aggreg.:
| Pb, Ru, Bi, As, Te, Pd)
Natural + fission
Pb + met. aggregates
| Superposed
| on 235U
Uranium Enrichment
Boyer and al. (Cogema) have patented an important improvement for UF6 measure-ments, called microfluorination, which increases the sensitivity of traditionalinstruments. It can be done in the source, using a needle loaded with ten microgramsof uranyl nitrate instead of the many grams required for the external conversion.
At Saclay laser spectroscopic methods are being developed for localized isotopicmeasurements inside an AVLIS laser separator and for isotopic monitoring of industrialplants. The required spectral resolution appears to be attainable.
Input Controls in Reprocessing Plants with Total Sample Evaporation
The total sample evaporation method is now extensively used in the industriallaboratories of Cogema in Marcoule, for precise U and Pu assay in spent fuelsolutions and for isotopic measurements in various samples with very low plutoniumcontent: e.g. tar, F.P. concentrates, wastes. The amount required is 5 ng for Pu and30 ng for U. Precision and accuracy (Table 2) are as good as those of the classicalmethod.

- 138 - AECL-11342
Table 2: Total Evaporation Measurements (Source: Cogema - Marcoule)
Sample
Plutonium NBS 947
(1/Jan/94)
Uranium NBS U010
Uranium NBS U500
Ratio
238/239
240/239
241/239
242/239
234/238
235/238
236/238
234/238
235/238
236/238
Rref.
0.00328
0.24118
0.02048
0.0156
0.000055
0.01014
0.000069
0.010422
0.9997
0.001519
Rmeas.
0.00335
0.24115
0.02042
0.01558
0.000058
0.010143
0.000069
0.010424
0.09992
0.001537
Rel.Ext.Repr.f
0.7%
0.002%
0.03%
0.03%
3.0%
0.01%
1.7%
0.02%
0.002%
0.3%
t relative mean standard deviation for 10 measurements
Non-nuclear field
Climatology
Climatology data obtained by CEA come essentially from laboratories co-operated byCEA and CNRS. Surprisingly, a considerable amount of the best results obtainedeven recently are from mass spectrometers designed 20 or more years ago in Saclay,by Roth, Lohez, Chavignol and their fellows.
Fundamental climatology data have been published [1] and concern the Vostock icecore in Antarctica. Continuous recording of deuterium and CO2 content over 2000 mdepth (160 000 years) is interpreted in terms of atmospheric temperature changes.The results support the climatic role of orbital forcing.

-139- AECL-11342
By extending dating capacities with radiogenic argon, Turpin (CFR, Gif sur Yvette) isworking to decrease the required rock sample amount from 30 mg to <1mg. Thisshould lead to dating of young marine sediments for paleoclimatology, connecting K-Arand 14C methods around 3 x 10⁴ years ago.
Archeology
32S is enriched relative to 34S during the reduction of sulfates to sulfides by anaerobicbacteria. One can observe relative variations up to several percent. Cinnabar (HgS) isthe red vermilion pigment used by Mediterranean artists for frescoes in southernFrance (-100 to +100 years around Christ). By measuring 32S/MS ratios in samplesand comparing results with Italian and Spanish cinnabar deposits, we obtainedinformation about trade practices at this period. The pigment appears to come fromSpain as shown in the following table.
Origin
Almaden (Spain)
Amiata (Italy)
fresco sample
d%0
+11,2 + 0,5
+ 1,9 ±0,5
+12,0 ±1,0
Trends
GD-MS
This type of mass spectrometry has been commercialized several years ago by VGwith the VG 9000. C. Blain and colleagues in Saclay are working to couple a glowdischarge source with a Mattauch-Herzog mass spectrometer (Thomson TSN 212),initially equipped with a spark source. This operation aims to allow: comparison ofspark source and glow-discharge without instrumental effects, direct isotopicmeasurements (with electrical detection), and maximum data utilization for tracesanalysis. Unlike machines equipped only with electrical detection, it is here possible touse a photoplate which is a near ideal integrator. Isotopic compositions are easilymeasured. Sample consumption is about 1 mg/h.
ICP-MS
Three machines adapted to the analysis of radioactive materials are running or undersettlement in different locations. The main applications are trace elements in PuO2
(Cogema, La Hague), Np and monoisotopic elements in experimental nuclear fuels(Saclay), isotopic composition and trace elements in spent fuel solutions (even withquadrupoles, precision and accuracy may be good enough to provide data related to

- 140 - AECL-11342
criticality at the input of reprocessing plants), and long lived fi' emitters (107Pd, 1 2 9 I ,237Np) in environmental samples or in leach-waters from experimental waste matrices(CEA Cadarache).
ICR: A Fair Way To Stable Isotope Production
Production of small amounts of separated or enriched isotopes is of specialimportance for spiking and labeling. Among the various methods able to producethese isotopes Ion Cyclotron Resonance seems well suited because of its flexibilityand moderate investment. An important difference between ICR mass spectrometersand isotope separators is that instead of an ion beam a plasma is used. The quasineutral mixture of ions and electrons in the plasma cause space charge effects to bereduced. Important also is the use of microwave heating of electrons in the sourceregion.
Many elements have been submitted to separation experiments: Ca, Cr, Ni, Cu, Zn,Pd, Ba, Gd, and Yb. Experiments done with Ca, Cr, Ba and Yb support estimationsof separation costs performed with the code RICAN. Diagnostics of the plasma havebeen fully completed and it is now considered that new improvements in terms ofenrichment factors (presently varying between 2 and 130 for different elements) andmass flow rate will be obtained only by upgrading of the ERIC machine. In the nearfuture it is planned to increase microwave power so that elements like 48Ca could beavailable in commercial quantities. In a longer term, construction of a newsuperconducting magnet will allow production of separated isotopes for higher masselements such as Gd.
At large scale the cost is expected to be lower by, at least, one order of magnitude ascompared to that for the calutrons.
Conclusion
This modest review is intended to give a partial - and probably biased - presentation oforiginal works in CEA and Cogema laboratories, largely spread over France. It hasbeen possible to notice that among interesting developments, some of the mostremarkable applications are always indebted to Professor Nier's principles.
All people cited hereafter would certainly be happy to come in touch with thoseinterested.

-141 - AECL-11342
Acknowledgements
Subject
Oklo
UF6
AVLIS
TIMS
TIMS
Climate
Frescoes
GD-MS
ICP-MS
ICR
Author
P. Holliger; D. Louvat
R. Boyer, J.P. Joumoux
P. Mauchien et al.
P. Gasnier
J.C. Dubois
J. Jouzel et al.; L. Turpin
G. Guille
C. Blain et al.
P. Bienvenu
P. Louvet et al.
Location
CEA Cadarache
Cogema Pierrelatte
CEA Saclay
Cogema Marcoule
CEA Saclay
CEA Gif sur Yvette
CEA Saclay
CEA Saclay
CEA Cadarache
CEA Saclay
References
[1] Jouzel, J., Lorius, C, Petit, J.R., Genthon, C, Barkov, N.I., Kotlyakov, V.M. andPetrov, V.M., Nature 329, pp. 403-408 (1987).

-142- AECL-11342
SYMPOSIUM SCHEDULE

5:00-8:00 p.m.
7:00-11:00 p.m.
-143-
MONDAY, MAY 9, 1994
Registration
Reception {Hosted by FISONS Instrument)
AECL-11342
FOYER
WINDOM PEAK
TUESDAY, MAY 10, 1994
8:00-8:45 a.m. Registration & Breakfast
Oral Session A: D.B. Curtis, Chairman
8:45 a.m. Welcome
9:00 a.m.
10:40 a.m.
11:00 a.m.
12:00-1:30 p.m.
"Dedication to Alfred O. Nier"
"Total Evaportation Measurements, a Key to MoreAccurate Mass Spectrometry?"
"Unconventional Stable Isotope Mass Spectrometryof Pt and Fe Via Gas-Source Mass Spectrometry"
BREAK
"Isotopes at CEA"
"Extraction and Measurement of SubpicogramQuantities of Technetium from Geologic andOther Matrices"
Catered Lunch
Oral Session B: Lawrence W. Green, Chairman
1:30 p.m. "The Mechanism of Bi+ Production from BismuthBorosilicate"
"Total Evaporation in Thermal lonizalion MassSpectrometry"
FOYER
StLVERTON BALLROOM
Donald J. RokopDavid B. Curtis
Lawrence W. Green
James E. Delmore
John R. De Laeter
Rudolph Fiedler
Philip Taylor
Jean R. Cesario
Paul R. Dixon
WINDOM PEAK
SILVERTON BALLROOM
James E. Delmore
E. Larry Callis

2:40
3:10 p.m.
4:30-7:00 p.m.
7:00-11:00 p.m.
-144-
BREAK
"A High Efficiency Thermal lonization Source Adaptedto Mass Spectrometers"
"SIMS Studies of the Corrosion of Zirconium"
"A High Efficiency Ion Source for Kr and Xe IsotopicMeasurements"
Personal Time
Poster Session and Reception Hosted byFinnigan MAT
AECL-11342
E. Phil Chamberlin
Robert L Tapping
Jane Potts
INNISBROOK BALLROOM
WEDNESDAY, MAY 11,1994
8:00-9:00 a.m. Registration & Breakfast
Oral Session C: James E. Delmore, Chairman
9:00 a.m. "Application of Glow Discharge MassSpectrometry to the Measurement of Isotope Ratios"
"High Accuracy Determination of Trace Elements inNIST Standard Reference Materials by Isotope DilutionICP-MS"
10:20 a.m. BREAK
10:40 a.m. "Multi-element Isotope Dilution Analyses Using ICP-MS"
"Strategy and Tactics for Alleviating Interferences inInductively Coupled Plasma Mass Spectrometry"
FOYER
SILVERTON BALLROOM
David H. Smith
Paul J. Paulsen
A.M. Volpe
R. Sam Houk
12:00-1:30 p.m. Catered Lunch
Oral Session D: John R. De Laeter, Chairman
1:30 p.m. "Inductively Coupled Plasma Magnetic SectorSector Multicollector Mass Spectrometry"
"Accelerator Mass Spectrometry: Practiceand Prospects"
WINDOM PEAK
SILVERTON BALLROOM
Alexander N. Halliday
H. Robert Andrews

- 1 4 5 - AECL-11342
2:40 p.m. BREAK
3:10 p.m. "Accelerator Mass Spectrometry for Dating RockExposure to Cosmic Rays"
"A Hot Vacuum Extraction Mass SpectrometricSystem for Determination of H&D in Zirconium"
"Hydrogen Determination in Zirconium Alloys byLaser Ablation and Resonance lonization MassSpectrometry"
5:00-7:00 p.m. Reception Hosted by Perkin Elmer-SCIEX
7:00-9:00 p.m. BANQUET
Banquet Speaker: Ernest L. Garner, NIST
"The Golden Years in Isotope Mass Spectrometryat NBS"
David Elmore
Grant A. Bickel
Zane H. Walker
ANIMAS
WINDOM PEAK
8:00-9:00 a.m.
THURSDAY, MAY 12, 1994
Registration & Breakfast FOYER
Oral Session E: Donald J. Rokop, Chairman
9:00 a.m.
10:20 a.m.
10:40 a.m.
12:00-1:30 p.m.
"Noble Gas Mass Spectrometry in the Earth Sciences:A Review and Tribute to A.O. Nier"
"New Developments and Applications in NegativeThermal lonization Mass Spectrometry"
BREAK
"Tellurium: A Mass Spectrometrist's Delight"
Catered Lunch
SILVERTON BALLROOM
Mark D. Kurz
Klaus G. Heumann
John R. De Laeter
WINDOM PEAK

AECL-11342
Cat No. /No de cat: CC2-11342EISBN 0-660-16412-4
ISSN 0067-0367To identify individual documents in the series, we have assigned anAECL- number to each.
Please refer to the AECL- number when requesting additional copies ofthis document from:
Scientific Document Distribution Office (SDDO)AECLChalk River, OntarioCanada KOJ1J0
Fax:(613)584-1745 Tel: (613)584-3311ext 4623
Price: D
Pour identifier les rapports individuels faisant partie de cette serie, nousavons affect6 un numeVo AECL- a chacun d'eux.
Veuillez indiquer le numeYo AECL- lorsque vous demandez d'autresexemplaires de ce rapport au:
Service de Distribution des Documents OfficielsEACLChalk River (Ontario)Canada KOJ 1J0
Fax: (613) 584-1745 Tel: (613) 584-3311poste4623
Prix:D
Copyright© Atomic Energy of Canada Limited, 1996

CA9600722 - CA9600749
AECL-11342
Proceedings of the Second Alfred O. Nier Symposiumon Inorganic Mass Spectrometry
Sponsored by the Los Alamos National Laboratoiy,the Chalk River Laboratory and the Idaho NationalEngineering Laboratory
May 9-12 1994, Durango, Colorado
January 1996 JanvierVOL 27f t

AECL-11342
Proceedings of the Second Alfred O. Nier Symposiumon Inorganic Mass Spectrometry
Durango, Colorado1994 May 9-12
compiled and edited byLawrence W. Green
AECLChalk River Laboratory
Chalk River, Ontario KOJ 1J01996 January

Acknowledgements
Symposium Organizing Committee
D.J. RokopJ.E. DelmoreL.W. Green
Symposium Coordination
L HerraraE. RoybalS. Salazar
Word Processing
M. Schwantz

AECL-11342
CONTENTS
The Alfred O. Nier Symposium (L.W. Green) i
Dedication to Alfred O. Nier (J.R. De Laeter) ii
THERMAL IONIZATION MASS SPECTROMETRY 1
Applications 1
New Developments and Applications in Negative Thermal lonization Mass Spectrometry 2(K.G. Neumann)
Tellurium: A Mass Spectrometrist's Delight(J.R. De Laeter, K.J.R. Rosman and R.D. Loss) 8
The Mechanism of Bt Production from Bismuth Borosilicate(T. Huett, J.C. Ingram and J.E. Delmore) 14
Total Evaporation Measurements, a Key to More Accurate Mass Spectrometry? 19(R.K. Fiedler)
Total Evaporation in Thermal lonization Mass Spectrometry 24(E.L. Callis and J.H. Cappis)
Determination of Trace Iron in Zirconium by Isotope Dilution Thermal lonization Mass 27Spectrometry(N.L. Elliot, MA Campbell and LW. Green)
IDMS of FeO(OH) Extracted from Blood Digests for Studies of Iron Metabolism in Humans 30(N.E. Vieira, A.L. Yergey and S.A. Abrams)
Characterization of Uranium in Surface-Waters Collected at the Rocky Flats Facility 34(D.W. Efurd, D.J. Rokop, R.D. Aguilar, F.R. Roensch, R.E. Perrin and J.C. Banar)
Extraction and Measurement of Subpicogram Quantities of Technetium from Geologic 38and Other Matrices(P.R. Dixon, D.J. Rokop, J.T. Fabryka-Martin and D.B. Curtis)
Instrumentation 42
A High Efficiency Thermal lonization Source Adapted to Mass Spectrometers 43(E.P. Chamberlin and J.A. Olivares)
AECL-11342
CONTENTS(continued)
Instrumental Improvements on a Two Stage (B-RPQ) Mass Spectrometer with Very 49High Abundance Sensitivity(J.B. Schwieters and P. Bach)
Performance Indications for TIMS with a Deceleration Lens System and Post- 57Deceleration Detector Selection(P. van Calsteren, D. Wright and S. Turner)
Evaluation of a L.A.N.L Designed Turret 64(J. Banar, R.D. Aguilar, P.R. Dixon, R.E. Perrin and D.J. Rokop)
INDUCTIVELY COUPLED PLASMA AND GLOW DISCHARGE MASS 69SPECTROMETRY
High Accuracy Determination of Trace Elements in NIST Standard Reference 70Materials by Isotope Dilution ICP-MS(P.J. Paulsen and E.S. Beary)
Multi-element Isotope Dilution Analyses Using ICP-MS(A.M. Volpe) 75
ICP Magnetic Sector Multiple Collector Mass Spectrometry and the Precise 80Measurement of Isotopic Compositions using Nebulization of Solutions andLaser Ablation of Solids(A.N. Halliday, D.-C. Lee, J.N. Christensen, W. Yi, CM. Hall, C.E. Jones,D.A.H. Teagle, A.J. Walder and P.A. Freedman)
Application of Glow Discharge Mass Spectrometry to the Measurement of 84Isotope Ratios(L.R. Riciputi, D.C. Duckworth, CM. Barshick and D.H. Smith)
GASES 89
Unconventional Stable Isotope Mass Spectrometry of Fe, Pt and W via Gas Source 90Mass Spectrometry(P.D.P. Taylor, S. Valkiers, P. De Bievre, U. Flegel, and Th. Kruck)
A Hot Vacuum Extraction Mass Spectrometric System for Determination of H&D 95in Zirconium(L.W. Green, G.A. Bickel, P.K. Leeson, M.W.D. James, P.K. Leeson, T.G. Lamarcheand H. Michel)

AECL-11342
CONTENTS(continued)
A High Efficiency Ion Source for Kr and Xe Isotopic Measurements 100(J. Poths and E.P. Chamberlin)
LASER RESONANCE IONIZATION 105
Resonant Laser Ablation: Mechanisms and Applications 106(J.E. Anderson, R. Bodla, G.C. Eiden, N.S. Nogarand C.H. Smith)
Hydrogen Determination in Zirconium Alloys by Laser Ablation and Resonance 111lonization Mass Spectrometry(G.A. Bickel, Z.H. Walker, F.C. Sopchyshyn and LW. Green)
Measurement of Sample Charging during Sputtering of Ill-V Materials and Devices 115(S.W. Downey and A.B. Emerson)
Uftrasensif/ve Detect/on of Krypton-85 Gas using Photon Burst Mass Spectrometry 121(C.S. Hansen, J. Pan, W.M. Fairbank, Jr., H. Oona, E.P. Chamberlin, N.S. Nogarand B.L. Feary)
GENERAL 124
SIMS Studies of the Corrosion of Zirconium 125(R.L. Tapping, P.K. Chan, P.R. Norton and C-S. Zhang)
Accelerator Mass Spectrometry: Practice and Prospects 130(H.R. Andrews)
Isotopes at CEA 136(J.R. Cesario)
SYMPOSIUM SCHEDULE 142

- i - AECL-11342
The Alfred O. Nier Symposium
The Alfred O. Nier Symposium on Inorganic Mass Spectrometry was founded in 1991to bring together scientists in the field of isotope and elemental analysis using massspectrometers. It was named after Al Nier because of his pioneering work andleadership in this field, and attracts scientists from many disciplines: nuclearchemistry, environmental monitoring, geochronology, life sciences, astronomy, andclimatology, all of which Professor Nier made significant contributions to. At the firstsymposium, which was also an 80th birthday celebration for Al, he presented hisretirement project "Helium and Neon Isotopes in Extraterrestrial Dust Particles" and, inthe evening, entertained the audience with an account of his experiences in theManhattan Project. He was delightful to listen to and fondly remembered by all.
Tragically, Al was mortally wounded in a car accident days prior to the secondsymposium. He regained consciousness for the opening address of ihe symposiumand dedication by John De Laeter, which he listened to by telephone from his hospitalbed. He passed away a few days later. Although saddened, the speakers carried onto give excellent scientific presentations, as a tribute to Al Nier, and thesepresentations are summarized herein. Furthermore, some of the speakers decided toprepare full papers which are published in a special memorial issue of InternationalJournal of Mass Spectrometry and Ion Processes, Vols. 146/147, (1995). The nextA.O. Nier Symposium will be in the spring of 1997, and there will be a Nier lecturer,chosen by the organizing committee, at this and subsequent meetings.
Lawrence W. Green
- i i - AECL-11342
Dedication to Alfred O. Nier
John R. De LaeterDepartment of Applied Physics, Curtin University of TechnologyPerth, Western Australia
We all have our personal heroes - Al Nier will always be one of mine. Although I waseducated in a small Physics Department in one of the most isolated cities in the world,the name of Professor Alfred 0 Nier was well known to me, because he was heldin such high esteem by my Ph.D. supervisor, Dr Peter Jeffery, and I quickly learned toadmire him too.
I was in such awe of Professor Nier, that when I first saw him at a Meteoritical SocietyMeeting in Mainz in Germany in 1983, it took me a long time to pluck up enoughcourage to speak to him. But then I discovered, what hundreds of other people havefound, that Al Nier was a humble, easy going, fun-loving human being, generous to afault and eager to help other people. Almost before I realised it, he and his wife Ardishad asked my wife and me to join them for dinner at the Conference Banquet. And sobegan a friendship which I cherish deeply.
Over the years I met him and his family on many occasions, and he was always thesame. His endless enthusiasm for science, his genuine interest in other people, andhis ability to tell a good story, remained unchanged.
I still remember the first story he told me. For many decades there was adisagreement between the chemists and the physicists over the value of atomicweights, due to the fact that the chemical scale was based on elemental oxygen,whilst physicists used oxygen-16 as their base. Al was a newly elected member ofthe International Commission on Atomic Weights when he came up with the idea (in abar in Amsterdam), of using carbon-12 as the common base for atomic weights. Hethen went to the Max Planck Institute at Mainz where he convinced the Director,Professor Josef Mattauch, of the idea. Mattauch was so excited about the possibilityof uniting the two warring factions, that he set off to Paris to convince his physicscolleagues, but forgot his passport and was stopped at the border. Al was dulydespatched with the missing passport to rescue Mattauch, and carbon-12 wassubsequently adopted as the base for the atomic weights table, and is still in usetoday.
In fact it is not generally known that the first absolute measurements of the isotopicabundances of an element were carried out by Al Nier in 1950. He calibrated a massspectrometer using enriched isotopes of argon (which he had produced himself), andthen used this spectrometer to measure the isotopic composition of nine other

-H i - AECL-11342
elements. The atomic weight of argon is still based on this 44 year old measurement,as is the Universal Gas Constant R, which is derived in part from it. The InternationalUnion of Pure and Applied Chemistry still accepts Al Nier's isotopic measurements ofargon, xenon and osmium as the "best measurement" from a single source [1],
He once described himself as "more of a gadgeteer than most physicists". But that isan inappropriate assessment. He was a brjlliant experimental physicist who developedgeneration after generation of mass spectrometers both small and large, withpainstaking improvements in instrumentation based on deceptively simple designs.
His most important design was the 60° sector field mass spectrometer which replacedthe more complicated 180° versions which had previously been used. This simpledesign not only reduced the weight and power consumption of the electromagnet,but enabled the ion source and detector to be removed from the influence of themagnetic field. However, of more significance was the fact that the Nier designtransformed what was essentially a physics research instrument into a machine whichcould be used by a wider group of scientists. And this was achieved against theprevailing opinion of the day, as expressed by Francis Aston, who argued that massspectrometry would die away as an active research field. Subsequent developmentsin mass spectrometric-related fields are testimony to Al's vision, and of the importanceof the two papers that described jthe sector field instrument which has made ourprofessional lives possible [2, 3].'
Yet he was almost lost to science! If it had not been for the great depression hewould probably have become an electrical engineer, but only five of his eightyclassmates found jobs in industry in 1931, and so he remained at the University ofMinnesota to complete a masters degree in engineering, and later a Ph.D. in physics.And what a Ph.D it was! He constructed a 180° deflection mass spectrometer fromspare parts left over by other researchers, and with this instrument he discoveredargon-38 and potassium-40, thus laying the foundation for potassium-argongeochronology.
During his post-doctoral fellowship at Harvard University in 1937 and 1938, he studiedthe isotopic compositions of 19 elements and discovered four new isotopes - 36S, 46Ca,48Ca and 1B4Os. He measured the isotopic composition of lead in a variety of uraniumminerals from the Richards-Baxter collection, and showed that the isotope ratios variedwidely in spite of the near constancy in the atomic weight. He also measured theisotopic abundance of 235u/238U, and wrote a number of papers on the uranium-leadand lead-lead chronometers. Al can therefore be regarded as thefounder of geochronology and isotope geology.

- i v - AECL-11342
Al Nier's many pioneering papers, mostly published in Physical Review, are models ofscientific communication. He was brought up in the tradition in which you used aminimum of words to describe the experiment, and allowed the data to speak forthemselves. He once told me that he found it hard to accept the lengthy journalarticles that are the norm today, and complained that one of his manuscripts hadactually been returned because the editor wanted him to make it longer.
The accuracy of Al's mass spectrometric data is legendary. Even though he mademany isotopic measurements in an era far removed from modern technology, his datahave invariably stood the test of time. Ludolf Schultz tells the story of how hediscovered that the accepted value of 20Ne/21Ne was somewhat higher than a morerecent measurement by Peter Eberhardt. Ludolf approached the then National Bureauof Standards in Washington, but was informed that the value for neon could notpossibly be changed because it had been measured by Al Nier, and it was well-knownthat Nier never made a mistake!
Nier's excellence in data measurements is summed-up by an article on barium byGerry Wasserburg's group at the California Institute of Technology, where the authorsmake the statement that "the isotopic abundances given by Nier in 1938 are, as usual,confirmed to be correct within the error limits that he quotes" [4].
However, the characteristic which has always impressed me the most about Al'sscientific career was his versatility. After his initial work on isotope abundancedeterminations and geochronology, he developed diffusion methods for enrichingcarbon isotopes, and used these enriched isotopes in medical and biologicalapplications. In 1940 he responded to a request by Enrico Fermi to separatenanogram quantities of 235U and 238U. This enabled 235U to be identified as thefissionable uranium isotope by Booth and Dunning at Columbia [5] and hence enabledthe Manhatten District Project to proceed.
In the 1950's Al's attention turned to the measurement of atomic masses, which is anessential base for nuclear physics and atomic weight determinations. With hiscolleagues at Minnesota, he built large, high resolution, double focussing massspectrometers, which enabled him to set new standards in atomic massmeasurements.
But then he turned from the building of large mass spectrometers to small,miniaturised versions, suitable for space research. In the 1970's he was a keymember of the Viking project, whose mission was to land a spaceship on Mars todetermine if life could exist there. Nier-built mass spectrometers sampled the Martian

- v - AECL-11342
atmosphere and were used in a variety of experiments in atmospheric physics. Anumber of them are still in space.
Al Nier retired in 1980 and was appointed Regents Emeritus Professor in Physics atthe University of Minnesota. He continued to work without pay and returned to anearlier research interest, the study of noble gases in extra-terrestrial materials.
At the 53rd Meteoritical Society meeting in Perth in 1990, the session on Noble Gaseswas dedicated to Professor Nier, because it was in his laboratory in the late 1950'sthat a successful investigation was undertaken of the helium isotope distributionin iron meteorites. His recent work on step-wise heating of interplanetary dustparticles to investigate the release pattern of noble gases, is an experimental problemof the highest level of difficulty, one which scientists half his age would hesitateto undertake. To achieve this he adapted the miniaturised mass spectrometers fromspace research to measure helium and neon isotopes in vanishingly small samples ofthis cosmic flux.
John Reynolds, in a lecture entitled "Adventures of Noblemen in Diamonds", paidtribute to Al in the following words:- "His own work in mass spectrometry for more than50 years has resulted in monumental contributions to nuclear physics, nuclear energy,isotopic geochemistry and space physics. Offshoots of his leadership in the field haverevolutionised Earth Science and Meteoritics. His eternal youth and enthusiasm haveinspired us all" [6].
In 1992 Professor Nier was presented with the Bowie Medal of the AmericanGeophysical Union by Professor Don Anderson. Professor Anderson commenced hiscitation by quoting the following words which were written by Sir Charles Lyell in1830:- "Though we are mere sojourners on the surface of the planet, chained to amere point in space, enduring but for a moment in time; the human mind is not onlyenabled to number worlds beyond the unassisted ken of mortal eye, but to trace theevents of indefinite ages before the creation of our race; and is not even withheld frompenetrating into the dark secrets of the ocean or the interior of the solid globe, free,like the spirit which the poet described, as animating the universe".
These words describe the character of Al Nier, who continually searched for the truthwhether it be in a speck of Stardust or in unravelling the "indefinite ages before thecreation of our race".
Before I conclude I would like to refer to an applied aspect of Al Nier's career which isoften forgotten in the light of his outstanding scientific endeavours. I refer to his work

- v i - AECL-11342
with industry during World War II, which he described in an article entitled "SomeReminiscences of Mass Spectrometry and the Manhattan Project" [7].
In the summer of 1942 Al Nier was building a special mass spectrometer for uraniumisotope determinations as requested by Vannever Bush. He was also analysing heavywater samples for Harold Urey, and was evaluating enriched uranium samples fromthe first cascade model of Booth and Dunning. He was also trying to develop thermaldiffusion techniques for isotope separation, and in his spare time assisted E.O.Lawrence at Berkeley in the electromagnetic isotope separation process. But a newproblem, whose importance to the success of the Manhattan Project was of thehighest order, arose. The gaseous diffusion plant being developed at Oak Ridgewould be inoperable if leaks developed in the plant. How were these incredibly smallleaks to be detected? The Kellogg Company turned to Al Nier who, although only 31years old at the time, had already demonstrated his ability as a builder of sensitivemass spectrometers. He had the feeling of instruments in his body, as an artist has inmoulding clay. He had a personal touch for scientific instruments, and his home-builtmass spectrometers constructed in the University of Minnesota Physics workshop,invariably worked with amazing precision.
Al quickly developed a portable leak detector, tuned permanently to helium, with whichthe Oak Ridge engineers could detect invisible pinholes in the labyrinth of pipes, oftotal length over a hundred miles, which was the base of the $500 million gaseousdiffusion plant. It seems impossible to imagine "life" before helium leak detectors, tothose of us who have struggled with vacuum systems, and our thanks go to Al for thisvery practical mass spectrometric invention. He also designed a small "line-recording"mass spectrometer, later manufactured by General Electric, which was used at overfifty points in the Oak Ridge plant to monitor the composition of the gas at anylocation. A central control room, to which the outputs of the mass spectrometers werefed, made engineering history. Without Al's input, the Manhattan Project would neverhave become a reality.
Al points out that this was an example of the underlying importance of basic science tonational defence and welfare, which led, in part, to the Office of Naval Researchsupporting basic science after the war. Perhaps Al's applied research experience ispertinent to the challenges faced by many National Laboratories at the present time.
I would like to conclude with some words from Don Anderson taken from the BowieMedal Citation, to which I referred earlier:- "All-in-all, Professor Alfred 0. Nier is abroad-minded and unselfish scientist, a diplomatic yet decisive leader, and a gentleand likeable person. His colleagues are awed by his experimental prowess and his

- v i i - AECL-11342
collegia! manner of openly sharing all data, ideas and speculations. It is easy tounderstand why this wonderful, softly-spoken scientist is so highly revered by all whocome in contact with him. It has been said that some wise people see further thanothers because they stand on the shoulders of giants. In the case of Al Nier we canall see further because generations of giants have stood on his shoulders".
The scientific community salutes Al Nier, not only because he was a good scientist,but primarily because he was a good person. The spoken word does not describe inproper measure his zest for life, his gregarious nature, his wit and charm. It does notindicate his habit of carrying a magnetic compass with him at all times, so that, forexample, he always knew where he was in the London underground, or of his love of"high tech" photography.
Nor does it explain his skiing exploits at Vail, where he was allowed to ski free-of-charge because he was over the age of seventy years. Nor does it describe his lovefor his wife Ardis and his family. Nor the quality of his many friendships.
The A.O. Nier Symposium on Inorganic Mass Spectrometry was established in 1991 tohonour the "Father of modern mass spectrometry". Long may it continue thatproud tradition!
References
[1] J.R. De Laeter, K.G. Heumann and K.J.R. Rosman, J. Phys. Chem. Ref. Data20,1327, (1991)
[2] A.O. Nier, Rev. Sci. Instrum. 11, 212 (1940).
[3] A.O. Nier, Rev. Sci. Instrum. 18, 398 (1947).
[4] O. Eugster, F. Tera and G.J. Wasserburg, J. Geophys. Res. 74, 3897 (1969).
[5] A.O. Nier, E.T. Booth, J.R. Dunning and A.V. Grosse, Phys. Rev. 57, 546 (1940).
[6] J.H. Reynolds and P. McConville, Proc. A.O. Nier Symp. on Inorganic MassSpectrometry, Los Alamos National Laboratory Report LA-12522-C (1993) p 145.
[7] A.O. Nier, J. Chem. Ed. 66, 385 (1989).

- VIII - AECL-11342
A photograph taken of Professor A.O. Nierin 1990 on a Meteoritical Society field-tripat a mineral sands deposit at Busselton, Westem Australia
- 1 - AECL-11342
THERMAL lONIZATION MASS SPECTROMETRY
Applications

- 2 - AECL-11342
New Developments and Applications in NegativeThermal lonization Mass Spectrometry
Klaus G. HeumannInstitute of Inorganic Chemistry of the University of Regensburg, Universitatsstralie 31,93040 Regensburg, Germany
Introduction
Thermal ionization mass spectrometry can be used in the positive or negative thermalionization mode for precise determinations of isotope ratios. Whereas positive thermalionization mass spectrometry (PTI-MS) was established many years ago, negativethermal ionization mass spectrometry (NTI-MS) is becoming more applied during thelast few years [1]. In NTI-MS the formation of negative thermal ions is preferred byhigh electron affinities of the analyte and low electron work functions of the filaments.In PTI-MS the element to be analysed should have a low first ionization potential andthe filament material used should have a high electron work function. The compoundsto be analysed by NTI-MS must have at least an electron affinity of 2 eV. Atomic ionsM' or oxide ions MO; (x=1-4) are preferably formed for many of the transition metals,non-metals, and semi-metals. A maximum of the ion current is found at a definitivefilament temperature for each compound. To reduce the electron work function ofmost of the filament materials, lanthanum or barium salts are added on the filament'ssurface [2]. One of the main advantages of NTI-MS is the fact that spectroscopicinterferences occur very seldom.
Analytical procedures for the isotope ratio determination by NTI-MS are developed forthe transition metal elements V, Cr, Mo, Tc, W, Re, Os, Ir, and Pt as well as for themain group elements B, C, N, 0, Si, S, Cl, Se, Br, Sb, Te, and I. The followingmodern applications should be mentioned in this connection: Re/Os dating method,exact determinations of isotope abundances, trace element speciation by isotopedilution mass spectrometry (IDMS), and determination of isotope variations in theenvironment for source identification of compounds.
Re/Os Dating Method
Due to the naturally occurring long-lived radioactive 187Re isotope, a Re/Os datingmethod could be established. Before 1989 the application of this method was limitedby the precision and sensitivity of the techniques in use: secondary ion massspectrometry (SIMS) or resonance ionization mass spectrometry (RIMS). In 1989 ourgroup at the University of Regensburg showed for the first time that osmium isotoperatios can be precisely and sensitively measured by NTI-MS [1]. In 1991, twopublications appeared nearly simultaneously on this topic [3,4]. From this time on

- 3 - AECL-11342
many other laboratories in the world adapted the NTI technique for osmiummeasurements.
The current NTI-MS technique in our laboratory for the osmium isotope ratiodetermination uses about 1 ng of osmium as hexachloroosmate(VI) in a double-filament Pt ion source. For the enhancement of the ion formation, Ba(OH)2 is addedon the filament to reduce the electron work function and a continuous oxygen gas flowis introduced into the ion source [5], Under these conditions typical ion currents of10"11 A for the most abundant OsOg ion are obtained at the detector side of the massspectrometer, allowing relative precisions in the range of 0.04-0.01 % in the isotoperatio determination of osmium.
Another problem, which had to be solved in Re/Os dating, was the rhenium blankcontribution from Pt filaments, especially during the measurement of minute samplesof rhenium by NTI-MS. By coating nickel filaments with a thin layer of small V2O5
particles, the blank contribution by the filament material could be reduced to less than1 pg rhenium per measurement [6]. With these developments the Re/Os datingmethod should be applicable in the future for a great number of different geologicaland cosmogenic samples.
Improvement in the Isotope Abundances of the Elements
The relative uncertainty in the atomic weight of more than 20 elements is above0.01 %, which is often due to problems in the mass spectrometric techniques forprecise isotope abundance measurements [7]. By using NTI-MS, an improvement inthe precision of the isotopic composition could be obtained for some elements whichalso resulted in an improvement in the corresponding atomic weight data. In 1991 thiswas done for the elements W and Os [7], and in 1993 for Ir for which the atomicweight, now recommended by IUPAC, could be changed from 192.22 ± 0.03 to192.217 ± 0.003, which means an improvement in the uncertainty by a factor of ten[8].
Selenium Speciation by IDMS
Elemental speciation is one of the most important topics in trace analysis today.Because of its accuracy, IDMS is increasingly used in this field [1,9,10]. Selenite(SeO2,"), selenate (SeO2-), and trimethylselenonium ((CH3)3Se+) have been determinedby our laboratory [11] in urine samples. A double-filament ion source (Re) and anionization filament temperature of 950°C were used for the determination of the80Se/82Se ratio. About 1 ug selenium is necessary for a Se' ion current of about10"11 A at the detector side. For the isotope dilution technique, 82Se enriched spikesolutions of the organic and the two inorganic selenium compounds were applied.
By using the sample treatment schematically shown in Figure 1, all three seleniumspecies could be determined in different urine samples in the range of 2.2-12.2 ng Se

- 4 - AECL-11342
per g sample for SeOg', 0.5-1.5 ng/g for SeO*", and 1-2 ng/g for (CH3)3Se+. Comparingthe total selenium concentration with the sum of the three investigated species, adifference of about 5-45% was found. This difference must be due to other (probablyorganic) selenium species in the samples. However, these investigations areimportant for a better understanding of the selenium metabolism in the human body.
SeO32-/SeO
Separation at anior
SeO32-
30 ml urine + species specif
.2-
i exchanger resin
c spike solutions
TMSe+
Separation at cation exchanger
SeO42- TMeSe+
totalSe
Decomposition of organic material by HNO3/HCIO4
Reduction of SeC>42- to SeO32- by cone. HCI
Reduction of SeO32- to elementary Se by ascorbic ac d
Isotope ratio measurement 80Se/82Se by NTI-MS
Figure 1: Treatment of Urine Samples for Se Speciation
Boron Isotope Variations as Indicators for Anthropogenic Influences
Figure 2 shows boron isotope variations expressed in 511B(%) values for naturalsubstances. Most of the washing powders include relatively high concentrations ofboron peroxides which normally show a similar 811B value as it is known for the NBSboron standard SRM 951 (see Figure 2). If washing powder, as one of the mostimportant anthropogenic substances in ground water samples, is mixed with boronfrom natural sources, the 511B value shifts and from that anthropogenic influences canbe indicated.

- 5 - AECL-11342
Washing| powder
H i l l . Dead Sea
Sea water
Marine evaporite, , minerals
Non-marine evaponte uiiuti«i»minerals
i—i i 1 i—i—i—r—i—r>-30 0 +30 +60
NBS SRM 951 6"B[X.)
Figure 2: Boron Isotope Variations in Different Substances
Different techniques for the boron isotope ratio determination have been developed,up to now. The formation of B+ ions in ICP-MS has the advantage that any boroncompound can be analysed. On the other hand, a low sensitivity and relativestandard deviations of only about 0.7% in the isotope ratio determination aredisadvantages of this method. PTI-MS is applied by detecting Na2BO2 or Cs2BO2ions. The precision of this method is much better, in the range of 0.07-0.2% forNa2BC>2 and of less than 0.05% for CSJBOJ. Disadvantages are the low sensitivity andthat the corresponding alkali salts must be prepared. Interferences can also occur forNa2BO2 by 88Sr+. Extremely high BO:, ion beams are produced in NTI-MS from anyboron compound and the only improbable interference to be taken into considerationcan be due to OCN' ions, possibly formed by organic impurities at higher filamenttemperatures. The precision of the isotope ratio measurement is in the range of 0.08-0.2% [12], which is normally sufficient to be used as an indicator for anthropogenicinfluences.
This was demonstrated by the investigation of different ground water samples in Israelcompared with sewage and the boron isotopic composition of perborate in washingpowder (Figure 3). The diagram significantly shows a decrease in the 511B value ofsamples in the order of uncontaminated, less contaminated, and contaminated groundwater. Sewage, which is closest to the perborate value, has the lowest 811B value.
Conclusion
Negative thermal ionization is an important alternative technique in massspectrometry, which offers certain advantages in the isotopic ratio measurement of anumber of elements. The instrumentation and handling of NTI techniques are
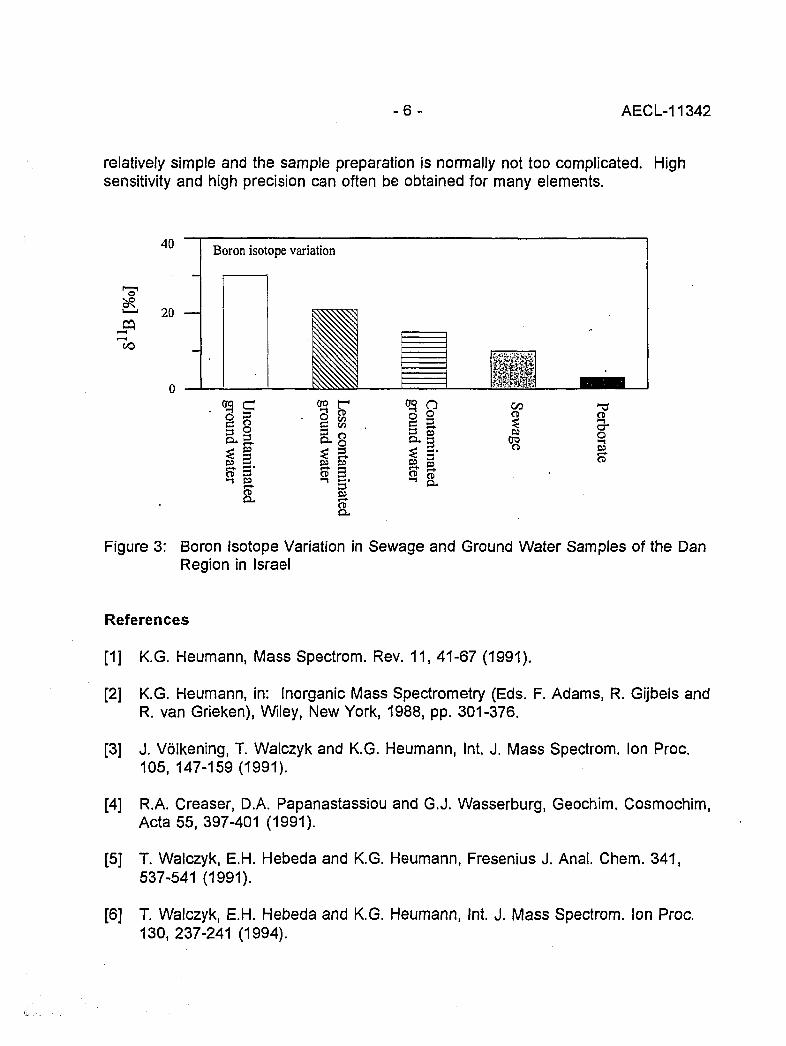
- 6 - AECL-11342
relatively simple and the sample preparation is normally not too complicated. Highsensitivity and high precision can often be obtained for many elements.
to
40
20 —
Boron isotope variation
IIf §
f
§-8
11
2̂ Oo ®
I-5§
CO
CO i.o
a
Figure 3: Boron Isotope Variation in Sewage and Ground Water Samples of the DanRegion in Israel
References
[1] K.G. Heumann, Mass Spectrom. Rev. 11, 41-67 (1991).
[2] K.G. Heumann, in: Inorganic Mass Spectrometry (Eds. F. Adams, R. Gijbels andR. van Grieken), Wiley, New York, 1988, pp. 301-376.
[3] J. Volkening, T. Walczyk and K.G. Heumann, Int. J. Mass Spectrom. Ion Proc.105, 147-159(1991).
[4] R.A. Creaser, D.A. Papanastassiou and G.J. Wasserburg, Geocbim. Cosmochim,Acta 55, 397-401 (1991).
[5] T. Walczyk, E.H. Hebeda and K.G. Heumann, Fresenius J. Anal. Chem. 341,537-541 (1991).
[6] T. Walczyk, E.H. Hebeda and K.G. Heumann, Int. J. Mass Spectrom. Ion Proc.130, 237-241 (1994).

- 7 - AECL-11342
[8] lUPAC Commission on Atomic Weights and Isotopic Abundances, Pure Appl.Chem. 66, 2423-2444 (1994).
[9] K.G. Heumann, Int. J. Mass Spectrom. Ion Proc. 118/119, 575-592 (1992).
[10] K.G. Heumann, in: Metal Speciation in the Environment (Eds. J.A.C. Broekaert,S. Gucer and F. Adams), NATO ASI Series, Vol. G23, Springer, Heidelberg,1980, pp. 153-168.
[11] R. Brotsack, Diplomarbeit, University of Regensburg, 1992.
[12] H. Zeininger and K.G. Heumann, Int. J. Mass Spectrom. Ion Phys. 48, 377-380(1983).
[13] A. Vengosh, K.G. Heumann and S. Juraske, J. Environ. Sci. Technol. 28, 1968-1974 (1994).
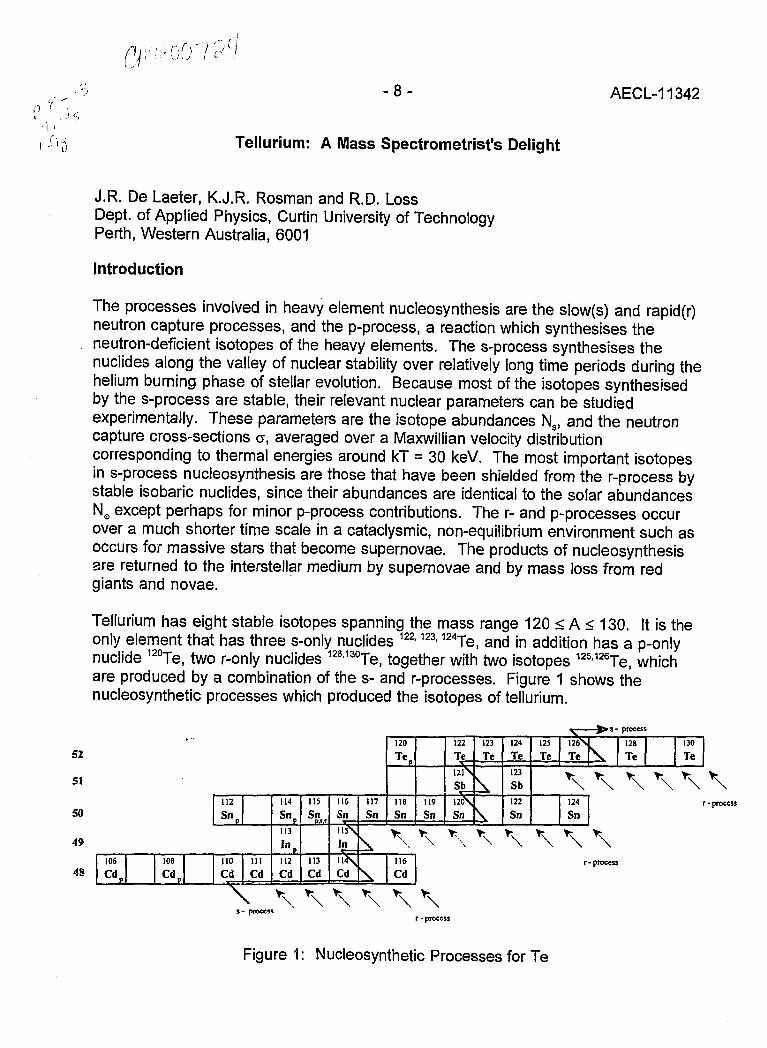
- 8 - AECL-11342
Tellurium: A Mass Spectrometrisfs Delight
J.R. De Laeter, K.J.R. Rosman and R.D. LossDept. of Applied Physics, Curtin University of TechnologyPerth, Western Australia, 6001
Introduction
The processes involved in heavy element nucleosynthesis are the slow(s) and rapid(r)neutron capture processes, and the p-process, a reaction which synthesises theneutron-deficient isotopes of the heavy elements. The s-process synthesises thenuclides along the valley of nuclear stability over relatively long time periods during thehelium burning phase of stellar evolution. Because most of the isotopes synthesisedby the s-process are stable, their relevant nuclear parameters can be studiedexperimentally. These parameters are the isotope abundances N8, and the neutroncapture cross-sections a, averaged over a Maxwillian velocity distributioncorresponding to thermal energies around kT = 30 keV. The most important isotopesin s-process nucleosynthesis are those that have been shielded from the r-process bystable isobaric nuclides, since their abundances are identical to the solar abundancesNo except perhaps for minor p-process contributions. The r- and p-processes occurover a much shorter time scale in a cataclysmic, non-equilibrium environment such asoccurs for massive stars that become supernovae. The products of nucleosynthesisare returned to the interstellar medium by supernovae and by mass loss from redgiants and novae.
Tellurium has eight stable isotopes spanning the mass range 120 < A < 130. It is theonly element that has three s-only nuclides 122'123' 124Te, and in addition has a p-onlynuclide 120Te, two r-only nuclides 128130Te, together with two isotopes 125126Te, whichare produced by a combination of the s- and r-processes. Figure 1 shows thenucleosynthetic processes which produced the isotopes of tellurium.
» s - process
52
51
50
49
48
112
106
Cdp
108
C d r110
CdinCd
114
113
112
Cd
115
Snp.«.r
113
Cd
116
Sn
InI14\Cd
117
Sn
\
120
T e r
118
Sn
\
116
Cd
119
Sn
\
122
Te12TS
Sb120\Sn
\
123
Te
\
124
Te123
Sb122
Sn
\
125
Te
\
I26\Te
\124
Sn
\
\
\
\
r- process
128
Te
\ \
130
Te
\rr - process
\s - process
r • process
Figure 1: Nucleosynthetic Processes for Te

- 9 - AECL-11342
Solar System Abundance of Tellurium
Tellurium has a relatively large cosmic abundance [1], since it is located on an r-process peak which results from the magic neutron number N = 82. It is therefore ofno surprise to find that the most abundant of the Te isotopes are the r-only nuclides128Te and 130Te. These two isotopes exhibit double beta decay which causesenrichments in 128Xe and 130Xe respectively for old telluride minerals. It has now beenshown that the half-lives of 128Te and 130Te are approximately 1.4 x 10²¹ and 7 x 10²⁰
years, respectively, which supports the Dirac formalism in which the lepton conserving,two neutrino mode of decay is favoured [2]. This places a stringent upper limit on theMajorana mass of the electron neutrino.
Kappeler et al. [3] evaluated a best set of neutron capture cross sections for a numberof s-process nuclides at astrophysical energies. Using this data and the Solar Systemabundances of Cameron [4], Kappeler et al. [3] evaluated the nuclear parameters forthe classical model of s-process nucleosynthesis for the <JNS curve in the mass region56 < A < 209. The r-process contributions of nuclides that were synthesised by acombination of s- and r- process nucleosynthesis were then calculated by subtractingthe calculated s-process abundance Nsfrom the Solar System abundance No. Usingthis approach Kappeler et al. [3] were able to demonstrate a good correlation betweenthe calculated Nr values for mixed s- and r-process nuclides and the r-only processnuclides, except for Te where the 128Te and 130Te abundances were too high byapproximately 30%. Smith et al. [5] had, in fact, analysed the Orgueil C1 chondriteusing the isotope dilution mass spectrometric (IDMS) technique and obtained a valueof 2.34 ppm which was some 27% lower than the Solar System abundance used byKappeler et al. [3]. This value has subsequently been supported by additional lDMSmeasurements on a number of carbonaceous chondrites by Loss et al. [6], whoobtained a value of 2.24 ± 0.05 ppm for Orgueil. Anders and Grevasse [1] used theIDMS values as the primary source of input data to select a Solar System abundanceof 2.27 ± 0.23 ppm for Te.
Recently Wisshak et al. [7] have measured the neutron capture cross-sections of theSm isotopes with an accuracy of approximately 1%. Together with the cross-sectiondata for Te [8], it is possible to derive a close fit to the <JNS curve using the s-only Smand Te isotopes. This s-process formalism enabled Wisshak et al. [7] to conclude thatthe Solar System abundance of Te of 2.27 ppm is accurate to within 3% rather thanthe 10% uncertainty assigned by Anders and Grevasse [1], a conclusion which isconsistent with the IDMS measurements. The revised abundance of Te not onlyconfirms the validity of s-process nucleosynthesis, but also enables a revised value forXe to be determined. Xenon is a rare gas and its abundance therefore cannot bemeasured from meteoritical material. The revised value for Xe is in good agreementwith an estimate based on s-process systematics [9]. The excellent correlation

- 1 0 - AECL-11342
between nuclear astrophysics and Solar System abundances for Te, demonstrates theremarkable analytical advances that have been made in recent years.
Isotopic Anomalies in Meteorites
Despite the opportunity to exploit the isotopic composition of Te in nucleosyntheticstudies, it was not until 1978 that a mass spectrometric search was made for fcotopicanomalies in meteorites, but no isotopic variations within the limits of experimentalerrors could be found in whole rock samples [10]. Ballad et al. [11] reported theoccurrence of isotopically anomalous Te and Xe in acid-treated samples of the Allendemeteorite. Using a neutron activation analysis technique Ballad et al. [11] reportedanomalies of up to 17% in 130Te with smaller anomalies in 120Te, 122Te and 126Te.However, in a detailed mass spectrometric study of three acid-resistant residues fromAllende, Loss et al. [12] could not detect any isotopic anomalies in the major isotopesof Te, in contrast to the work of Ballad et al. [11]. A search was also made foranomalies in 126Te, the stable daughter of 126Sn, which has a half life of approximately105 a. The absence of excess 126Te in primitive Solar System materials places a lowerlimit of approximately 106 a on the time of formation of the Solar System [13].
Refractory carbonaceous materials in primitive meteorites are known to be the carrierof many isotopically anomalous elements which survived the formation of the SolarSystem and provide valuable information on pre-solar nuclear and chemicalprocesses. One such component is microdiamonds, which contain Xe-HL - anucleogenetically distinct xenon enriched in those isotopes synthesised by the r- andp-processes. This suggests a supernova source for the diamonds. Clayton [14] hasargued that the neutrino burst from the collapsed core in Type II supernovae liberatesfree neutrons which can produce the neutron-rich unshielded isotopes in Xe-H. Theconvective shell above the He-burning zone is the most likely site of the origin of Xe-HL since it is the only zone which has C > 0 at the time of its explosion [14]. It ishypothesised that this anomalous Xe, together with the other elements, would beimplanted in the microdiamonds which now exist in carbonaceous chondrites.Heymann and Dziczkaniec [15], Clayton [14] and Howard et al. [16] all predict largeanomalies in Te co-synthesised with Xe-H, with the most important anomaly being ahigh 13OTe/128Te ratio.
Microdiamonds extracted from the Allende meteorite were converted to a form suitablefor chemical separation by cold combustion in an oxygen plasma. After oxidation, theTe was separated from the other elements by ion exchange chemistry and analysedby solid source mass spectrometry. The data shows positive anomalies for 128Te of4.0 ± 2.2% and 130Te of 9.4 ± 1.0%, after being corrected for mass fractionation bynormalization to 124Te/126Te [17]. The remaining isotopic ratios showed no variationfrom the terrestrial standard. The measured anomalies in 128130Te are smaller than

- 1 1 - AECL-11342
those found in Xe, which indicates that any exotic Te present in the diamond samplehas been diluted by unprocessed supernova and/or solar Te. On the other hand, theanomalous Te and Xe fractions in diamond are of similar magnitude (16 ± 2 pmol/g of130Te versus 4.2 pmol/g 136Xe) due to the Te/Xe weight ratio in diamond. The Te datatherefore qualitatively support the neutron burst model [14,15,16].
The Absolute Composition of Tellurium
Accurate measurements of the neutron capture cross-section ratios for122f123i124Te haverecently been reported by Wisshak et al. [8], who demonstrated that the localapproximation cNs = constant, predicted by the classical model of s-processnucleosynthesis, can be confirmed at the 1% level for these three isotopes. Their dataalso identified the possibility of a p-process contribution to the 122Te abundance. Inestimating the errors to be associated with the 0NS values for the three s-only Teisotopes, Wisshak et al. [8] made the assumption that the isotope abundances of Tewere known to an accuracy of 0.1%. However, a distinction needs to be madebetween "relative" and "absolute" isotope abundances. Isotope abundances which arefree from all known sources of bias are referred to as absolute isotope abundances,and are determined by calibrating a mass spectrometer by means of quantitativesynthetic mixtures of enriched isotopes [18]. The standard Te isotope abundances[19], are based on mass spectrometric measurements in which an electron multiplierwas used in the detecting system because of the difficulty of producing ion beams ofsufficient size to be measured directly with a Faraday cup collector [10]. The electronmultiplier introduces a mass discrimination into the isotope abundances which isapproximately proportional to the square root of the mass ratio. However, thecorrection factor required to convert the observed isotope abundances to absoluteabundances is a multivariate function of a number of biases, of which the electronmultiplier discrimination is but one part (albeit an important one).
Thus the value of the 122Te/124Te ratio adopted by Wisshak et al. [8] needs to bedecreased by approximately 1 % to account for electron multiplier bias. This impliesthat the observed positive anomaly in 122Te, which was interpreted by Wisshak et al.[8] as a potential p-process contribution, largely disappears. The estimated absolutevalues for the s-only tellurium isotopes enable the local approximation of s-processnucleosynthesis to be verified within even smaller uncertainty limits than was possiblein the analysis by Wisshak et al. [8]. The necessity of establishing an accurate set ofabsolute abundances for Te is apparent, not only for nucleosynthetic studies, but alsoto determine the atomic weight of Te, which presently has a relative uncertainty of0.024% [18].

- 1 2 - AECL-11342
Fission Product Studies
Tellurium has also played an essential role in mobility studies of fission productmaterial from the Oklo natural reactor. Curtis et al. [20] have used Te as thereference element for an examination of mobility of Mo, Ru, "Ru and Pd in uraninitesamples from Reactor Zone 9 at Oklo. The well-defined linear correlations of theseelements over concentrations that differ by an order of magnitude is attributed to theprimary retention at the site of production. Curtis et al. [20] argue that the degree ofprimary retention was controlled by phase assemblages in the reactor fuel in responseto microscale conditions of pressure, temperature and composition produced by thenuclear reactions. These studies can be used to evaluate the effectiveness ofanthropogenic spent fuel as a depository for nuclear waste. An examination of therelative cumulative fission yields for Te at Oklo shows that 126Te exhibits considerabledispersion in comparison to the other fission yields [21]. This is due to the mobility of126Sn which was not retained in-situ in the uraninite.
The Mass Spectrometry Laboratory at Curtin University of Technology is supported bythe Australian Research Council.
References
[1] E. Anders and N. Grevasse, Geochim. Cosmochim. Acta, 53, 197 (1989).
[2] O.K. Manuel, Proc. Int. Symp. Nuclear Beta Decays and Neutrinos, Osako,Japan (1986).
[3] F. Kappeler, H. Beer, K. Wisshak, D.D. Clayton, R.L Macklin and R.A. Ward,Astrophys J., 257, 821 (1982).
[4] A.G.W. Cameron, In "Essays in Nuclear Astrophysics" (Edit. C.A. Barnes,D.N. Sch'ramm, and D.D. Clayton) Cambridge Uni. Press (1982).
[5] C.L. Smith, J.R. De Laeter and K.J.R. Rosman, Geochim. Cosmochim. Acta,41,676(1977).
[6] R.D. Loss, K.J.R. Rosman and J.R. De Laeter, Geochim. Cosmochim. Acta, 48,1677 (1984).
[7] K. Wisshak, K. Guber, F. Voss, F. Kappeler and G. Reffo, Phys. Rev. C, 48,1401 (1993).
[8] K. Wisshak, F. Voss, F. Kappeler and G. Reffo, Phys. Rev. C, 45, 2470 (1992).
- 1 3 - AECL-11342
[9] H. Beer, F. Kappeler, G. Reffo and G. Venturini, Astrophys. Space Sci. 97, 95(1983).
[10] C.L. Smith, K.J.R. Rosman and J.R. De Laeter, Int. J. Mass Spect. Ion Phys.,28, 7 (1978).
[11] R.V. Ballad, LL. Oliver, R.G. Downing and O.K. Manuel, Nature, 277, 615(1979).
[12] R.D. Loss, K.J.R. Rosman and J.R. De Laeter, Geochim. Cosmochim. Acta, 54,3525 (1990).
[13] J.R. De Laeter and K.J.R. Rosman, Meteoritics, 19, 217 (1984).
[14] D.D. Clayton, Astrophys. J., 340, 613 (1989).
[15] D. Heymann and M. Dziczkaniec, Geochim. Cosmochim. Acta, 45, 1829 (1981).
[16] W.M. Howard, B.S. Meyer and D.D. Clayton, Meteoritics, 27, 404 (1992).
[17] R. Maas, R.D. Loss, K.J.R. Rosman, J.R. De Laeter, R.S. Lewis, G.R. Huss,E. Anders and G. Lugmair, Astrophys. J. (in press).
[18] J.R. De Laeter, P. De Bievre and H.S. Peiser, Mass Spect. Rev., 11, 193(1992).
[19] J.R. De Laeter, K.G. Heumann and K.J.R. Rosman, J. Phys. Chem. Ref. Data,20, 1327(1991).
[20] D.B. Curtis, T.M. Benjamin, A.J. Gancarz, R.D. Loss, K.J.R. Rosman,J.R. De Laeter, J.E. Delmore and W.J. Maeck, Appl. Geochem., 4, 49 (1989).
[21] J.R. De Laeter, K.J.R. Rosman and R.D. Loss, Proc. A.O. Nier Symp. onInorganic Mass Spectrometry, Los Alamos National Laboratory (1993).

- 1 4 - AECL-11342
The Mechanism of Bi* Production from Bismuth Borosilicate
T. Huett, J.C. Ingram and J.E. Delmore ^>°u !'J r U'J
Idaho National Engineering LaboratoryEG&G, MS 2208, Box 1625, Idaho Falls, Idaho, 83415
Silica gel technology, first reported in 1969 for producing Pb ions [1], has found wideuse in the isotope ratio community for enhancing the production of surface ions fromthermal ionization filaments. The method entails mixing the sample with silica gel andeither phosphoric or boric acid, heating to dryness, mounting in the mass spectrometerand heating to the appropriate temperature (700 to 1400°C, depending on the system).The purpose of the present study was to find a model system which emitted ions andcould be easily used for materials studies so as to better understand those featuresnecessary for good and reproducible ion production. This type of a model system cannever hope to be an exact mimic of an analytically useful system since we deliberatelyadd enough of the element to be ionized to alter the material itself, while ananalytically useful system would have the element in very low concentrations. Themethod used in these studies was adapted from an unpublished Los Alamos method[2] for producing Bi+, and used bismuth nitrate (or Bi metal) with silica gel and boronoxide at an operating temperature of 900°C. Both Re and Ta filaments were tested.Larger amounts of the ion emitting material were prepared and melted in a vacuumfurnace on Re or Ta sheets for subsequent analysis. Analyses of the off gases wereperformed with the material heated to the ion emission temperature. The cooledmaterials were analyzed by dissolution followed by ICP-AES, SEM, XPS and X-raydiffraction.
To the knowledge of the authors, an extensive bibliography of the elements that canbe ionized by silica gel technology has never been compiled. The majority ofelements reported in the literature are a block of elements in the periodic tableranging from a VIB element (Cr) on the left, to a VIA element (Te) on the right, with awide range of variations on the methods reported in [1]. There are also references ofHA ions being formed by this technology [3]. During the course of this work, theperrhenate (ReO4') anion was identified. Thus, it is possible (or probable) that thereare multiple ion emission mechanisms occurring from these complex matrices, ratherthan a single mechanism. There are many elements that have been tested for usewith this technology that cannot be ionized, such as the alkali metals, the actinides,and the lanthanides.
A clue as to the mechanism of ion emission comes from the fact that when thesecomplex matrices are mounted on both Ta and Re filaments, Re provides up to twoorders of magnitude higher sensitivity. The reported work function of Re is about

- 1 5 - AECL-11342
5.0 eV, while Ta is about 4.1 eV [4]. The most obvious explanation for this effect isthat the element migrates from the matrix to the bare filament, from which it is ionized.
In order to test this concept, emission of Bi+ from these complex emitters was imagedusing a new instrument recently completed in our laboratory. Several silica gel typeBi+ ion emitters have been imaged in the past year, and all show ion emission onlyfrom the deposits. With this the case, the work function of the Re filament cannothave a direct effect on ion emission, and the ion emission effects from mounting theion emitter on a Re substrate needs to be re-evaluated. Another feature of theemitters that was readily observed during imaging was the speed with which thefeatures changed, as though the deposit was a viscous liquid.
An experiment was set up with a ~3 mm wire loop loaded with ion emitter, mounted in avacuum system with a viewport. An electric current was passed through the wire,heating the specimen. The material was observed to melt and churn. X-ray diffractionof the cooled material showed no features, indicating it was a glass. Several differentmaterials were melted and examined with X-ray diffraction (after cooling), and allappeared to be glasses. Hence the conclusion is that these materials are moltenglasses at operating temperature and the ions are emitted from the surface of themolten glass.
A clue as to the effect of the Re substrate was the observation of perrhenate (ReO4")in the anion spectrum of an ion emitter prepared from Bi nitrate and melted on Re.Perrhenate was only observed from the samples prepared from Bi nitrate and meltedon Re; the samples prepared from Bi metal and melted on Re did not produceperrhenate. This demonstrates the requirement for an oxidizing agent in order forperrhenate to be observable. Perrhenate anion emission was imaged from thesematerials and the ions came from the deposits; the images of the negative ions couldnot be distinguished from the images of Bi+ ions, except for polarity. In order for Re tobe oxidized to perrhenate (Re in the +7 oxidation state), something in the deposit hadto be reduced. Analysis of the off-gases using an electron impact ion source massspectrometer showed that the only appreciable gasses given off were water andnitrogen oxides. The nitrogen oxides produced from heating the material would havecame at least partially from thermal decomposition of nitrates, but some probably alsocame from nitrate oxidizing Re to perrhenate.
Ion emission was tested from the four liquid glass ion emitter combinations; theemitters prepared from bismuth nitrate and bismuth metal, and both of these materialstested on Ta and Re filaments. Large samples (~100 mg) were melted on therespective substrate, dissolved, and analyzed by ICP/emission. The results aretabulated in Table 1.

-16- AECL-11342
Table 1
Bi as
FilamentRelative IntensitySubstrate in glass (mg/g)B> cone, in mg/g
nitrate
Re100
1.7 (Re)9.8
metal
Re50
1.2 (Re)34.8
metal
Ta10
7.3 (Ta)194
nitrate
Ta1
3.6 (Ta)148
Significant quantities of the substrate are incorporated into the glass, and the samplesmelted on Ta had several times as much of the substrate as the samples melted onRe. The materials melted on Re appeared to be much smoother than those melted onTa, as observed by the SEM on the cooled material, and all four had major differencesin appearance. X-ray diffraction showed that they also all were glasses. Thus, theconclusion is made that the addition of these heavy metals at the few parts perthousand level (from a partial dissolution of the substrate) imparts substantiallydifferent properties to the glasses. It is surmised from the measured ion current thatthis heavy metal content is undesirable. There is not a major difference in the Recontent for the two glass types melted on Re, yet there was over an order ofmagnitude difference in the observed perrhenate anion current, with the materialprepared with excess nitrate giving the high perrhenate current. This indicates thatwhile the Re/Bi metal material had substantial Re in the glass, it must have been in anoxidation state less than +7. At the same time, Bi+ ion emission from the Bi nitrateand metal materials melted on Re differed by only a factor of two, indicating that theoxidation state of Re in the glass did not have a large effect on Bi+ emission.
The four combinations were all blended to have the same concentration of Bi, but ascan be seen from the table, Bi concentration decreased dramatically for the samplesmelted on Re in comparison to the samples melted on Ta. The best Bi+ emitters hadthe lowest Bi content. The Bi either evaporated or alloyed with the substrate. The Reand Ta substrates were not saved, unfortunately, so they could not be analyzed for Bicontent.
There have been reports that rhenium oxide has a very high work function, althoughdefinitive quantitative measurements could not be found in the literature. Smallamounts of barium perrhenate were added to the glasses and observed to severelydepress ion emission, indicating that the excess rhenium oxide poisoned the ionemitting properties of the glass. Thus, if Re oxide does raise the work function of theglass surface, the effect on ion formation is negated by the heavy metal poisoningeffect. This is consistent with the fact that the measured concentrations of Ta (thepoorer ion emitter) were several times higher than the concentrations of Re (the better

- 1 7 - AECL-11342
ion emitter) in the respective materials. The original Los Alamos method called for theuse of Pt filaments. Pt substrates were not tested in this study, but they may havehad less chemical interaction with the molten glass, and consequently less heavymetal content and possibly superior ion emission properties.
XPS analyses were performed on these materials. Appreciable amounts of Bi+3 weremeasured on the samples melted on Ta, while those melted on Re had little Bi+3. Thiscorresponds to the reduced Bi concentration measured in the glasses. Essentially noelemental Bi was observable during the initial phase of XPS analyses on any of thematerials, although it was observed to grow in with X-ray exposure for those sampleshaving Bi+3 on the surface initially.
There are numerous issues that need further study, but there are certain conclusionsthat can be stated. The most certain of these conclusions is that the emitters aremolten and highly viscous glasses at ion emission temperature, and that ions originatefrom the surface of this molten glass. It has been known since the original studies [1]that the filament material was very important for ion formation efficiency, with Refilaments giving superior ion formation to Ta filaments. It was generally assumed thiswas due to the higher work function of Re, and that ions originated from the Resurface. It has been shown that ions do not originate from the filament surface, andthat the reason that Re is a better filament material is that it is less reactive toward themolten glass, and less Re than Ta dissolves in the molten glass. It appears thatheavy metals poison the ion emission process. This heavy metal content can comeeither from the substrate or from the sample itself. It is probable, although not proven,that the concentration of Bi in the glasses of this model system altered the ionemission properties. The element added to the glass from which ions are desiredeither migrates into the filament material in appreciable quantities (particularly Refilaments), or else Bi has a much higher vapor pressure in the more favorablematrices.
Little can be said concerning the actual mechanism of ion production from thesemolten glasses at this time, but it is unlikely that a single mechanism is responsible forthe ion emission for all the types of ions observed from this type of matrix. The XPSdata showed that Bi+3 was the predominant oxidation state of Bi+ in the cooled glasses,but this does not prove that this species is actually responsible for emission of the Bi+
species. The production of Bi+ in the gas phase from Bi+3 in the solid is highlyspeculative, and could involve an inverse Saha-Langmuir ion formation process. Itwould also be a reduction process, which would require a driving force that would bedifficult to explain, especially since perrhenate was observed from the best Bi+ emitter,and perrhenate is a highly oxidized species.
Another result of the experimentation that is not well understood is why ion emissionfrom the glass prepared from bismuth metal is a factor often higher than the glass
- 1 8 - AECL-11342
prepared from bismuth nitrate, when the materials were melted on Ta. The SEMphotos also showed major differences, indicating that the glasses had much differentphysical properties. A possible explanation is the relative oxidative/reductive state ofthe glass. We made no attempt to determine oxygen stoichiometry of these mixtures,but the addition of bismuth as the metal rather than as the nitrate almost certainlywould reduce the oxygen content. Thus, a reduction in oxygen content of the glassappears to enhance ion emission efficiency for the materials on Ta. There is not asimilar major effect with the same materials melted on Re, so generalizationsconcerning these systems are not easily made. The properties of the glass thatchange with elemental composition (oxygen, Ta, Re, Bi etc.) is the probable cause ofthese effects.
[1] A. E. Cameron, D. H. Smith, and R. L Walker, Anal. Chem., 41, 3, 525 (1969).
[2] D. Rokop, Private Communication.
[3] T. Lee, D.A. Papanastassiou and G.J. Wasserburg, Geochim. Cosmochim. Acta41, 1473(1977).
[4] Handbook of Thermionic Properties, V. S. Fomenko and G. V. Samsonov,Plenum Press (1966).

- 1 9 - AECL-11342
Total Evaporation Measurements, a Key to more Accurate Mass Spectrometry?
R.K. Fiedler ~i •-'• ' < -c <:•./<"I.A.E.A./ Safeguards Analytical Laboratory, A-2444 Seibersdorf, Austria
Introduction
The method of the total evaporation measurement was presented first by Romkowskiet al. [1] at an ESARDA meeting in London, 1987. The difference from theconventional method is that the evaporation filament current is steadily increasedduring data collection to consume the whole sample material placed on the filament forthe analysis. One of the major sources of systematic bias in thermal ionization massspectrometric measurement is isotopic fractionation, which can be eliminated when asample is consumed totally during the analysis. The way of data collection and dataevaluation to be used was limited by the software available at this time. Ourlaboratory has the same type of mass spectrometer (Finnigan MAT 261, multi-collectorinstrument) as the ITU (Institute for Transuranium Elements, Karlsruhe). A specialmodule that allows handling the data differently from the software of the manufacturerenabled us to follow a different data evaluation philosophy. The error calculation isperformed using statistics applied to counting techniques. The intention of ITU was touse only small amounts of sample to reduce the radiation hazard to the chemistsdoing the separation and purification work on the samples coming from reprocessingplants. Our own software did not have the limitation to small samples and gave verygood results on all samples, independent of the filament loading. This softwaremodule was taken as a basis for further improvements.
Software
During a scientific visit at CBNM (now IRMM) in Geel, Belgium, the exchange of ideason the best way to do mass spectrometric analysis ended in the preparation of apaper entitled 'Principal Requirements for Accurate Mass SpectrometricMeasurements' [2]. This paper forced the development of software for Finnigan MATmass spectrometers (type MAT 261 and MAT 262) to verify the theory and todemonstrate the possibilities of a new software. The name of this software package isMSSOFT and has been tested for three years and improved wherever shortcomingscould be observed. The following Figure 1 shows the flowchart for a total evaporationmeasurement.
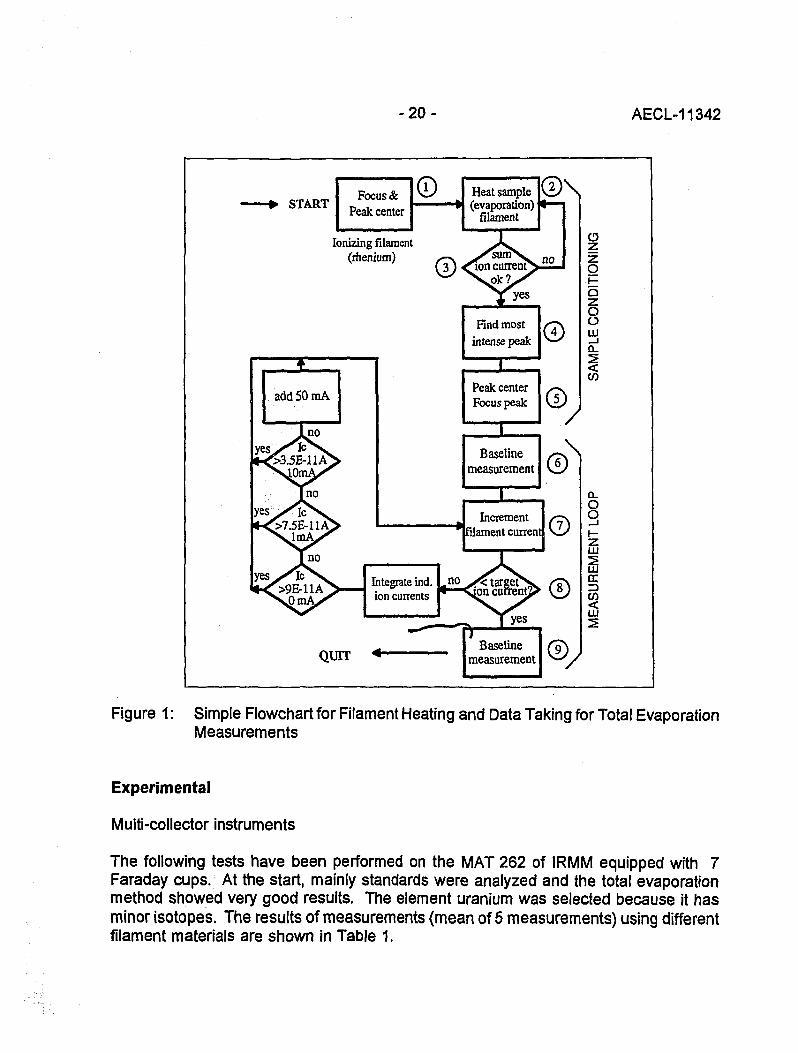
- 2 0 - AECL-11342
STARTFocus &
Peak center
Heat sample(evaporation)
filament
Ionizing filament(rhenium)
add 50 mA
Integrate ind.ion currents
QUIT * •
Find mostintense peak
Peak centerFocus peak
IBaseline
measurement
XIncrement
filament current
Baselinemeasurement
o
o
ooID
/
Q_
o2LU
111
ccen
Figure 1: Simple Flowchart for Filament Heating and Data Taking for Total EvaporationMeasurements
Experimental
Multi-collector instruments
The following tests have been performed on the MAT 262 of IRMM equipped with 7Faraday cups. At the start, mainly standards were analyzed and the total evaporationmethod showed very good results. The element uranium was selected because it hasminor isotopes. The results of measurements (mean of 5 measurements) using differentfilament materials are shown in Table 1.
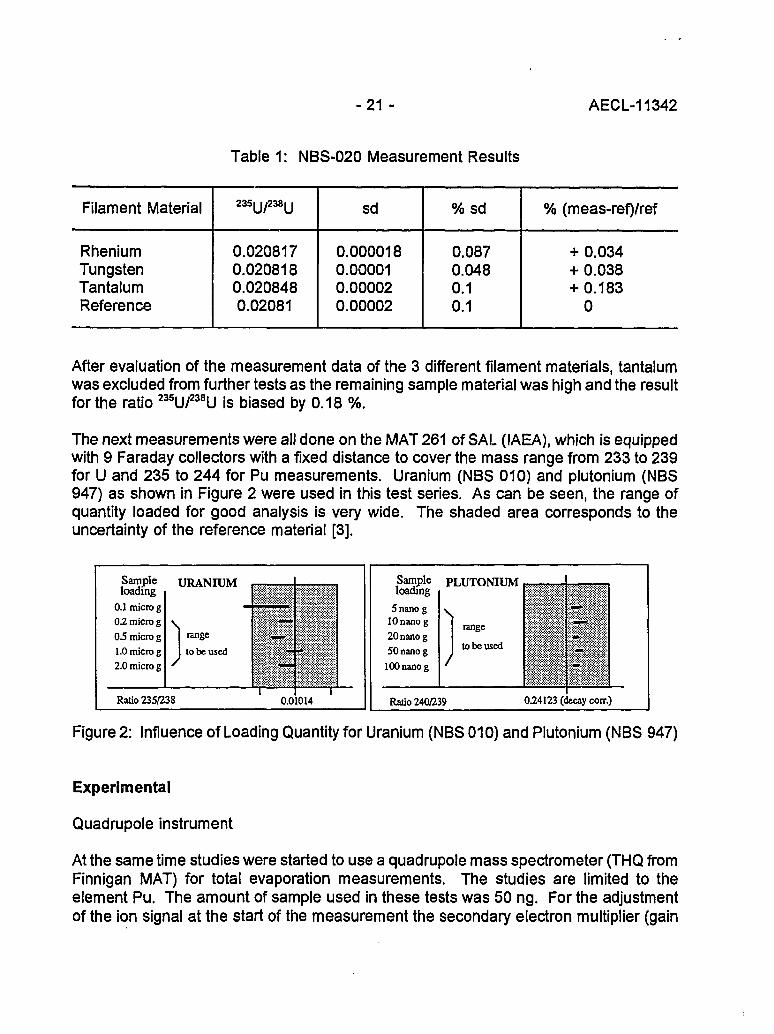
-21 - AECL-11342
Table 1: NBS-020 Measurement Results
Filament Material
RheniumTungstenTantalumReference
235U/238U
0.0208170.0208180.0208480.02081
sd
0.0000180.000010.000020.00002
%sd
0.0870.0480.10.1
% (meas-ref)/ref
+ 0.034+ 0.038+ 0.183
0
After evaluation of the measurement data of the 3 different filament materials, tantalumwas excluded from further tests as the remaining sample material was high and the resultfor the ratio 235u/238U is biased by 0.18 %.
The next measurements were all done on the MAT 261 of SAL (IAEA), which is equippedwith 9 Faraday collectors with a fixed distance to cover the mass range from 233 to 239for U and 235 to 244 for Pu measurements. Uranium (NBS 010) and plutonium (NBS947) as shown in Figure 2 were used in this test series. As can be seen, the range ofquantity loaded for good analysis is very wide. The shaded area corresponds to theuncertainty of the reference material [3].
Sampleloading
0.1 micro g02 micro g0 5 micro g1.0 micro g2.0 micro g
URANIUM
range
to be used
Ratio 235/238 0.01014
Sampleloading
5nano g10 nano g20 nanog50 nanog100 nano g
PLUTONIUM
range
to be used
Ratio 240/239 024123 (decay corr.)
Figure 2: Influence of Loading Quantity for Uranium (NBS 010) and Plutonium (NBS 947)
Experimental
Quadrupole instrument
At the same time studies were started to use a quadrupole mass spectrometer (THQ fromFinnigan MAT) for total evaporation measurements. The studies are limited to theelement Pu. The amount of sample used in these tests was 50 ng. For the adjustmentof the ion signal at the start of the measurement the secondary electron multiplier (gain
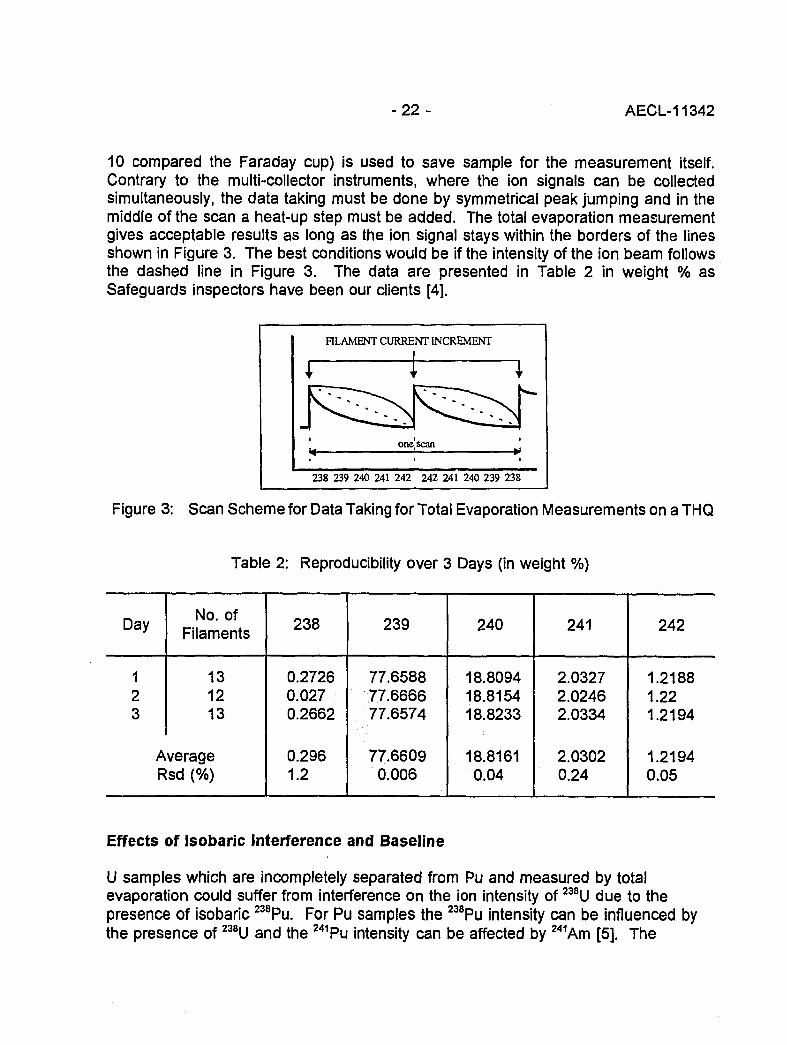
- 2 2 - AECL-11342
10 compared the Faraday cup) is used to save sample for the measurement itself.Contrary to the multi-collector instruments, where the ion signals can be collectedsimultaneously, the data taking must be done by symmetrical peak jumping and in themiddle of the scan a heat-up step must be added. The total evaporation measurementgives acceptable results as long as the ion signal stays within the borders of the linesshown in Figure 3. The best conditions would be if the intensity of the ion beam followsthe dashed line in Figure 3. The data are presented in Table 2 in weight % asSafeguards inspectors have been our clients [4].
FILAMENT CURRENT INCREMENT
238 239 240 241 242 242 241 240 239 238
Figure 3: Scan Scheme for Data Taking for Total Evaporation Measurements on a THQ
Table 2: Reproducibility over 3 Days (in weight %)
Day
123
No. ofFilaments
131213
AverageRsd (%)
238
0.27260.0270.2662
0.2961.2
239
77.658877.666677.6574
77.66090.006
240
18.809418.815418.8233
18.81610.04
241
2.03272.02462.0334
2.03020.24
242
1.21881.221.2194
1.21940.05
Effects of Isobaric Interference and Baseline
U samples which are incompletely separated from Pu and measured by totalevaporation could suffer from interference on the ion intensity of 238U due to thepresence of isobaric 238Pu. For Pu samples the 238Pu intensity can be influenced bythe presence of 238U and the 241Pu intensity can be affected by 241Am [5]. The

- 2 3 - AECL-11342
possibility of over-correction can occur when a dirty sample is measured with the totalevaporation method. This phenomena could be seen on samples which did notreceive any chemical treatment and gave a very reproducible negative value for236Uon "natural" uranium.
Conclusion
The total evaporation method is less susceptible to errors resulting from variations inthe amount of U and Pu loaded on the mass spectrometer filament. Thereproducibility of repeated measurements is also improved by a factor of 2 to 4 whilethe accuracy is at least as good as in the conventional method. However, as with theconventional method, it will be necessary to perform a cup efficiency calibration. Theuse of total evaporation for IDMS analysis offers the maximum improvement inperformance with a minimum risk. Some negative influences when using the totalevaporation method for all mass spectrometric measurements are shown and it isnecessary to further evaluate the sensitivity of the method to isobaric and concomitantelement interference effects.
References
[1] M. Romkowski, S. Franzini and L. Koch Proceed. ESARDA Symp. 12-14May,1987, London.
[2] P. De Bievre, R. Fiedler, P. Hansen, K. Mayer, R. Perrin and P. Taylor PrincipleRequirements for Accurate Mass Spectrometric Measurements, to be published.
[3] R. Fiedler, D. Donohue, G. Grabmueller and A. Kurosawa Report on PreliminaryExperience with Total Evaporation Measurements in Thermal lonization MassSpectrometry, Int. J. Mass Spectrom. Ion Processes, 132, 207-215 (1994).
[4] R. Fiedler, A.Reichart and J. Cappis Total Evaporation Measurements ofPlutonium with a Thermo Quadrupole Mass Spectrometer (THQ), IAEA/AL/020,(March 1989).
[5] R. Fiedler Americium Content Determination Done on a Thermo QuadrupoleMass Spectrometer (THQ) using Total Evaporation Technique,IAEA-SAL/AL/024, (1990).

- 2 4 - AECL-11342
Total Evaporation in Thermal lonization Mass Spectrometry
E. Larry Callis and John H. Cappis ct =>' CT
Los Alamos National Laboratory, Los Alamos, New Mexico 87545
Introduction
The total evaporation method, in which the entire sample is evaporated whileintegrating the signal from each isotope using a multicollector system, has now beenin routine use at our laboratory for uranium and plutonium analyses for several years[1,2]. By integrating out the effects of isotope fractionation, high precision, typically<0.02% relative standard deviation (RSD), is obtained with a minimum of rigor insample loading and treatment schemes. In fact, the advantages of total evaporationbecome more apparent in real-world analysis situations in which the precise quantity ofsample loaded may not be known and sample purity may be questionable. Recently,we have performed tests to demonstrate the effectiveness of the method on actualand impure test samples.
Experimental
In a study conducted with the International Atomic Energy Agency (IAEA) SafeguardsAnalytical Laboratory (SAL) in Seibersdorf, Austria, uranium and plutonium sampleswere prepared and analyzed by SAL using conventional techniques, and a portion wasshipped to Los Alamos for analysis using the total evaporation technique. Averageprecisions (% RSD) obtained on four replicate runs on each of 12 uranium and 12plutonium samples, ranged from <0.01% for 240/239 Pu ratios to <0.02% for233/238 U and 244/239 Pu ratios. These results demonstrated that standard chemicalpurification methods used at SAL were more than adequate for analyses by the totalevaporation method, and that significant improvements in precision and accuracy wereprovided by the total evaporation method. These techniques have since beenimplemented at SAL with good results; see [3] and R. Fiedler's paper in theseproceedings.
Recently, in a continuation of this work, experiments were conducted to assess theeffects of certain impurities on the total evaporation method for uranium. Solutions ofNIST U-500 isotopic standard were spiked with Na, Ca, K, Fe, Zr and Ba (individually)at levels of 1%, 10%, and 100% (by weight) relative to the uranium concentration of1 mg/ml. Four analyses of each of these 18 solutions were performed, interspersedwith analyses of unspiked U-500.
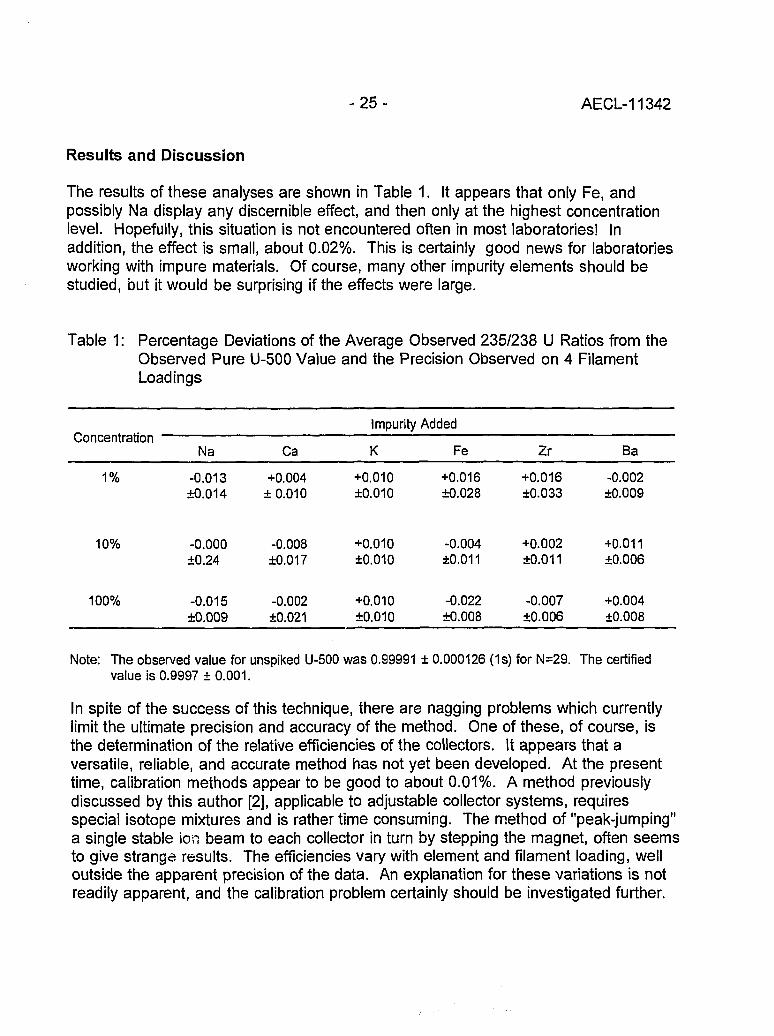
- 2 5 - AECL-11342
Results and Discussion
The results of these analyses are shown in Table 1. It appears that only Fe, andpossibly Na display any discernible effect, and then only at the highest concentrationlevel. Hopefully, this situation is not encountered often in most laboratories! Inaddition, the effect is small, about 0.02%. This is certainly good news for laboratoriesworking with impure materials. Of course, many other impurity elements should bestudied, but it would be surprising if the effects were large.
Table 1: Percentage Deviations of the Average Observed 235/238 U Ratios from theObserved Pure U-500 Value and the Precision Observed on 4 FilamentLoadings
Concentration "
1%
10%
100%
Na
-0.013+0.014
-0.000±0.24
-0.015±0.009
Ca
+0.004±0.010
-0.008±0.017
-0.002±0.021
Impurity
K
+0.010+0.010
+0.010±0.010
+0.010±0.010
Added
Fe
+0.016+0.028
-0.004±0.011
-0.022±0.008
Zr
+0.016+0.033
+0.002±0.011
-0.007±0.006
Ba
-0.002±0.009
+0.011±0.006
+0.004±0.008
Note: The observed value for unspiked U-500 was 0.99991 ± 0.000126 (1s) for N=29. The certifiedvalue is 0.9997 ± 0.001.
In spite of the success of this technique, there are nagging problems which currentlylimit the ultimate precision and accuracy of the method. One of these, of course, isthe determination of the relative efficiencies of the collectors. It appears that aversatile, reliable, and accurate method has not yet been developed. At the presenttime, calibration methods appear to be good to about 0.01%. A method previouslydiscussed by this author [2], applicable to adjustable collector systems, requiresspecial isotope mixtures and is rather time consuming. The method of "peak-jumping"a single stable ion beam to each collector in turn by stepping the magnet, often seemsto give strange results. The efficiencies vary with element and filament loading, welloutside the apparent precision of the data. An explanation for these variations is notreadily apparent, and the calibration problem certainly should be investigated further.
- 2 6 - AECL-11342
Another problem is that of the occasional "odd" result. For uranium, this usuallyappears as a high 235/238 ratio (0.03 to 0.07%) and is accompanied by a high-temperature "tail" on the intensity vs. filament current profile. This may be due to theproduction on the filament of chemical species, perhaps carbides, that are less volatileand hence prevent total evaporation. Further work is planned to try to resolve some ofthese questions.
References
[1] E.L. Callis and R. M. Abernathey, Proceedings of the 36th ASMS Conference onMass Spectrometry and Allied Topics, June 5-10, 1988, San Francisco.
[2] E.L. Callis and R. M. Abernathey, Int. J. Mass Spectrom. Ion Proc. 103, 93(1991).
[3] R. Fiedler, D. Donohue, G. Grabmueller, A. Kurosawa, Int. J. Mass Spectrom. IonProc. 132, 207 (1994).
Acknowledgement
This work was supported by the US D.O.E. through the US Program for TechnicalAssistance to IAEA Safeguards (POTAS) under Task A. 169.

- 2 7 - AECL-11342
Determination of Trace Iron in Zirconium </, .•'-by Isotope Dilution Thermal lonization Mass Spectrometry
N.L. Elliot, M.A. Campbell and L.W. Green !J^ u ° J ( '"AECL Research, Chalk River Laboratories, Chalk River, Ontario, Canada KOJ 1J0
Introduction
Zirconium alloys are used commonly in the construction of in-core components ofnuclear reactors. Trace elements affect the mechanical and irradiation deformationproperties of these zirconium alloys, therefore control of the abundances of impuritiescould lead to stronger, longer-lasting components. The effect of iron on themechanical properties of irradiated zirconium is not well understood. Iron is known toincrease the rate of self-diffusion in a-Zr [1], which would suggest that the irradiationgrowth rate of a-Zr should increase with Fe concentration. However, studies ofpressure tubes varying in Fe content from 100-2000 ppm have shown the opposite.Studies related to corrosion and hydrogen ingress suggest that the iron level should bekept below 500 ppm [2]. Part of the ambiguity comes from the lack of reliableanalytical methods for iron in zirconium, and consequently, a TIMS method for thedetermination of ppm levels of Fe was developed.
Procedure
Separation from the zirconium matrix was necessary in order to obtain sufficientsensitivity, and a two-stage purification procedure was used combining ion-exchangechromatography and micro-scale solvent extraction. In brief, the spiked sample isapplied to an 0.5 mL column of AG1-X8 (100-200 mesh) in 4 M HCI. Iron(lll) isretained by the resin whereas Zr(IV) washes through [3]. Iron is eluted with 5 columnvolumes of 0.25 M HCI, and, after concentration to a small volume, the fraction isfurther purified by equilibration with three tributylphosphate-impregnated XAD-2 resinbeads. A separation factor of approximately 105 is obtained in 4 M HCI [4].Interferences from Ca, K, Ni and Cr are also lessened as they have distributioncoefficients of <10'2 into TBP.
Sub-microgram amounts of the purified iron were loaded on previously outgassedzone-refined Re filaments with a silica gel/boric acid ionization enhancer, and the54/56 ratios were measured at 1170°C. No corrections were necessary for isobaricinterferences, as ^Cr was normally <0.03% of ^Fe. Although iron has a high firstionization potential (7.87 eV), stable Fe+ currents could be obtained from less than10 ng.

- 2 8 - AECL-11342
Results and Discussion
In order to test the procedure, two sets of iron in zirconium standards were prepared:i) solution standards containing 4-100 ppma Fe were prepared by dissolution ofultrapure Fe wire and ultrapure Zr, and ii) metallic standards containing 23-150 ppmaFe were prepared by pressing high-purity Fe wire into ultrapure Zr and annealing for15 days at 948°C, 10"9 torr. The results of the analyses are shown in Table 1.
Table 1: Analysis of Fe in Zr Standards
Standard (ppma)
2375.2
150.74.3
55.255.293.6
Source
metal standardmetal standardmetal standard
solution standardsolution standardsolution standardsolution standard
Observed
26.5 ± 0.375.7 ±2.2145 ± 3
6.254.4 ± 0.456.5 ± 0.593.8 ± 0.7
Observed/Expected
1.151.0070.9621.440.9861.0241.002
Good agreement between the observed and expected values was obtained, with theexception of the two lowest standards. Of these, the 4 ppma standard was analyzedonce only, and requires further analyses. The procedure has been refined and theprocedural blank has been lowered since these analyses. A further set of standards inthe range of 2-40 ppma will be prepared and analyzed.
Conclusions
A reliable method for the determination of trace iron in zirconium by TIMS has beendeveloped. The combination of ion-exchange chromatography and micro-scale solventextraction has allowed for the separation of trace amounts pi Fe from the Zr matrix ina relatively rapid manner, with an overall procedural blank of 15 ng. The method willbe applied to the determination of the terminal solid solubility of Fe in cc-Zr.
References
[1] A.D. King, G.M. Hood and R.A. Holt. J. Nucl. Materials, 185, 174 (1991).
[2] R.G. Fleck, J.E. Elder, A.R. Causey and R.A. Holt. Variability of IrradiationGrowth in Zr-2.5Nb Pressure Tubes, Zirconium in the Nuclear Industry, NinthInternational Symposium, June 1993, Baltimore, ASTM (proceedings to bepublished).

- 2 9 - AECL-11342
[3] Comprehensive Analytical Chemistry, ed. G. Svehla, Vol. XIV Ion Exchangers inAnalytical Chemistry, 1982.
[4] J. of Chromatography Library, Vol. 2, Extraction Chromatography, ed. T. Braunand G. Ghersini, 1975.

- 3 0 - AECL-11342
IDMS of FeO(OH) Extracted from Blood Digests forStudies of Iron Metabolism in Humans
N.E. Vieira and A.L. YergeyLaboratory of Theoretical and Physical Biology, National Institute of Child Health and
(i Human Development, 10 Center Drive, Bethesda, MD 20892
S.A. AbramsChildren's Nutrition Research Center, 1100 Bates St., Houston, TX 77030
Introduction
Over the past ten years, interest in the use of metal stable isotopes for the study ofhuman mineral metabolism has increased rapidly. Iron absorption studies reported inthe recent literature use anion exchange column chromatography as a preparativemethod for mass spectrometric analysis. Our interest was to develop a more rapid anddirect isolation procedure. We compared three preparative methods: (1) hydroxideprecipitation, (2) ion exchange chromatography using membrane filters, and (3)untreated matrix evaporated and dissolved in dilute acid. The matrices investigatedwere water and digested human whole blood.
Materials and Methods
Acid washed glassware and plasticware were used for all sample preparation.Reagents used were: J. T. Baker Ultrex II NH4OH, HCI, HNO3, and H3PO4; 'BakerAnalyzed1 absolute methanol; 'Baker Analyzed' Fe Atomic Spectral Standard; anddeionized water (Hydro Services, Rockville, MD). The ion exchange membrane filtersevaluated were the following Bio-Rex 25 mm Sample Preparation Discs (Bio-RadLaboratories, Richmond, CA): (a) AG 50W-X8 Cation Exchange Resin, and ( b)AG 1-X8 Anion Exchange Resin. Isotopic ratios were measured by thermal ionizationmass spectrometry using a silica gel/phosphoric acid technique [1]. Fe isotope ratioswere determined using the Finnigan MAT THQ Thermoquad mass spectrometer in thesingle filament mode with electron multiplier detection. Whole human blood wasdigested in HNO3 using the CEM Microwave Digestion System Model MDS 81D.
Cation membrane filters were loaded with 1 mL water matrix (50 ug/mL Fe) or 2 mLblood digest (15 ug/mL Fe, pH adjusted to >2). Fe was eluted with 5 and 6 mL 3 MHCI for water and digest, respectively. Anion exchange membrane filters were loadedwith 1 mL water matrix (50 ug/mL Fe) or 2 mL digest (20 ug/mL Fe, pH adjusted to<1) and a 0.3 M HCI solution was used for Fe elution.

-31 - AECL-11342
The Fe precipitation was based on the procedure described previously [2].Concentrated NH4OH was added to bring the pH of each sample (Fe-containingmatrices of water, whole blood digest and ion exchange eluent) to 10. A red/brownprecipitate was observed after a 4-hour period. The precipitate was centrifuged at2000 rpm for 10 minutes and the supernatant discarded. The precipitate was dried inan oven for 15 minutes at 100°C and dissolved in 100 uL of 3% HCI.
Standard curves were prepared in water and blood digest matrices by the addition ofaliquots of a 96.44 atom% enriched 54Fe tracer solution. The tracer was allowed toequilibrate in the matrix 1 day at room temperature. Enrichments ranged from 10 to100% excess 54Fe. The equilibrated curves were divided into 3 treatment groups:(1) directly precipitated. (2) cation exchange separation followed by precipitation, and(3) directly evaporated (1.3 mL digest was evaporated using microwave heating andlow power settings over a period of 70 minutes with the remaining liquid dried in anoven at 100°C). All precipitates were dissolved in 100 uL of 3% HCI.
Results
Total Fe recovery for the 3 isolation procedures investigated is shown in Table 1.
Table 1: Percent Recovery of Fe from Water and Whole Blood Digest usingIon Exchange Membrane Filters and Hydroxide Precipitation
Extraction Method
cation:ugFe% recovery
anion:ug Fe% recovery
precipitation:ug Fe% recovery
Water
5072
50no adsorption
13399 ±5
Digest
3091
40observed
40-13039 ± 4
Eluent
—
—
2555*
*(n=1)

- 3 2 - AECL-11342
Reasonable Fe recoveries were observed from the water matrix using both cationexchange and hydroxide precipitation. In the case of the digest matrix, cationexchange resulted in a greater recovery than did precipitation. However, the lowrecovery in precipitation did not affect the mass spectral analysis.
Measured fractional abundances of unspiked matrix are shown in Table 2. Nickelcontamination was observed in the THQ system and may account for the inaccurateabundance of m/z 58 in the evaporated matrix. All untreated and treated matricesresulted in expected natural abundances.
Table 2: Fractional Abundances of Unspiked Matrix
Mass
expected3
M S std. (± 1s)
diaest treatment:precipitationevaporated
54
0.0580
0.0572±0.0004
0.0592+0.00150.055240.0025
56
0.9172
0.9173±0.0009
0.9168+0.00180.9169±0.0037
57
0.0220
0.0225±0.0005
0.0213±0.00050.0236±0.0014
58
0.0028
0.0030±0.00005
0.0027+0.00020.0043±0.0011
Table 3 shows the linear regression analysis of the directly precipitated, cationexchange followed by precipitation, and directly evaporated standard curves. Themethods of precipitation and evaporation resulted in regression lines with slopesapproximating 1 and intercepts approximating 0.
Table 3: Linear Regression Analysis of 3 Fe Isolation Procedures(RSy.x = relative standard error of the estimate; n = number of curves)
Treatment
water standards:precipitation + 1scation exchange+precipitationevaporated
digest: standards:precipitation ± 1scation exchange+precipitationevaporated
Intercept
-2 ± 2-11.079-2.070
- 1 + 35.284
-3.169
Slope
1.10 ±0.031.0870.996
1.01 ±0.060.9911.082
RSy.x
0.0440.2290.114
0.0450.1140.109
n
411
411
- 3 3 - AECL-11342
Conclusions
Although recovery is better with cation exchange techniques, overall precision ofisotope dilution analysis favors use of the direct precipitation approach. In addition,precipitation is a simple and rapid one-step method not requiring time intensive stepsby the investigator.
References
[1] I.L. Barnes, T.J. Murphy, J.W. GramLich, W.R. Shields, Anal. Chem. 45, 1881(1973).
[2] G. Hagg, General and Inorganic Chemistry (Wiley, New York, 1969), p. 729.
[3] P. De Bievre, I.L. Barnes, Int. J. Mass Spectrom. Ion Processes. 65, 211 (1985).

- 3 4 - AECL-11342
Characterization of Uranium in Surface-WatersCollected at the Rocky Flats Facility
D.W. Efurd, D.J. Rokop, R.D. Aguilar, F.R. Roensch, R.E. Perrin and J.C. Banar, Chemical Science and Technology Division
» Los Alamos National Laboratory, Los Alamos, NM 87544, USA
Introduction
The Rocky Flats Plant (RFP) is a Department of Energy (DOE) facility whereplutonium and uranium were handled. During plant operations radioactivity wasinadvertently released into the environment. This study was initiated to characterizethe uranium present in surface-waters at RFP. Three drainage basins and naturalephemeral streams transverse RFP. The Woman Creek drainage basin traverses anddrains the southern portion of the site. The Rock Creek drainage basin drains thenorthwestern portion of the plant complex. The Walnut Creek drainage basintraverses the western, northern, and northeastern portions of the RFP site. Dams,detention ponds, diversion structures, and ditches have been constructed at RFP tocontrol the release of plant discharges and surface (storm water) runoff. The pondslocated downstream of the plant complex on North Walnut Creek are designated A-1through A-4. Ponds on South Walnut Creek are designated B-1 through B-5. Theponds in the Woman Creek drainage basin are designated C-1 and C-2. Watersamples were collected from each pond and the uranium was characterized by TIMSmeasurement techniques [1].
Results
Table 1 reports the highest uranium concentration measured in the RFP ponds duringthis study. For comparison, the uranium concentrations in three reservoirs near RFPand two wells in Colorado are also reported [2,3,4].

- 3 5 - AECL-11342
Table 1: Uranium Concentrations in Waters
Location
Pond A-1Pond A-2Pond A-3Pond A-4Pond B-1Pond B-2Pond B-3Pond B-4Pond B-5Pond C-1Pond C-2
DillonGreat Western
RalstonStandley*La Junta*Pueblo
Description
RFP Holding PondRFP Holding PondRFP Holding PondRFP Holding PondRFP Holding PondRFP Holding PondRFP Holding PondRFP Holding PondRFP Holding PondRFP Holding PondRFP Holding Pond
ReservoirReservoirReservoirReservoir
WellWell
Uranium ContentpCi/L
15.87.35.13.53.8
11.00.51.51.82.03.20.52.10.91.8
497.0168.0
* The wells listed in Table 1 do not serve as public water supplies.
The presence of 236U in the surface-water samples collected at RFP and the variable238U/23SU atom ratios detected in water samples collected from the holding pondsproves that anthropogenic uranium is present. Table 2 illustrates the maximumamount of depleted uranium that is present in each water sample collected at RFP.The values derived assume a simple two component system and that the depleteduranium released by RFP contains 0.5% 235U. This conservative estimate determinesthe maximum amount of 235U in the water that is attributable to the depleted uraniumpresent in the surface-waters.

- 3 6 - AECL-11342
Table 2: Maximum Percentage of 235U in Water Attributable toRelease of Depleted Uranium at RFP
DateSampled
02/24/9305/12/9308/24/9311/25/9305/12/9302/24/9308/24/9311/25/9202/24/9305/12/9308/24/9310/23/9211/24/9212/14/9201/14/9302/23/9303/17/9304/21/9305/12/9306/15/9307/15/9308/23/9311/25/9205/13/9302/24/9308/24/9311/25/9305/13/9302/24/9308/24/9311/25/9202/24/93
Pond
A1A1A1A2A2A2A2A3A3A3A3A4A4A4A4A4A4A4A4A4A4A4B1B1B1B1B2B2B2B2B3B3
MaximumPercentage
250
10081465066
1005780
1008117414053584945545631142317230
5750561223
DateSampled
05/13/9308/24/9311/25/9205/13/9302/24/9308/24/9310/23/9211/24/9212/14/9201/14/9302/23/9303/17/9304/21/9305/13/9306/15/9307/15/9308/23/9312/03/9205/13/9302/23/9308/23/9310/23/9211/25/9212/14/9201/14/9302/23/9303/17/9304/15/9305/13/9306/15/9307/15/9308/24/93
Pond
B3B3B4B4B4B4B5B5B5B5B5B5B5B5B5B5B5C1C1C1C1C2C2C2C2C2C2C2C2C2C2C2
MaximumPercentage
3536192625191310122118181716461612
1010
6360515851525353465154

- 3 7 - AECL-11342
Conclusions
The upper Ponds A-1, A-2, A-3, B-1, B-2, B-3, and B-4 contain measurable quantitiesof depleted uranium. The uranium concentrations in water samples collected fromthese ponds ranged from 0.2 to 15.8 pCi/L. Essentially 100% of the uranium in PondA-1 and Pond A-2 originated as depleted uranium. All other ponds, except Pond C-1,contain mixtures of naturally occurring and depleted uranium. Approximately half ofthe uranium present in Ponds A-4 and C-2 originated as depleted uranium.Approximately 20% of the uranium in the waters collected from Pond B-5 originated asdepleted uranium. Approximately 50% of the uranium detected in the waters collectedfrom Pond C-2 was anthropogenic.
Acknowledgements
This project was funded by EG&G Rocky Flats Plant under the auspices of contract No.LATO-EG&G-91-022.
References
[1] D.W Efurd, D.J. Rokop and R.E. Perrin, "Characterization of the Radioactivity inSurface-Waters and Sediments Collected at the Rocky Flats Plant," Los AlamosNational Laboratory report LA-UR-93-4373, 1993.
[2] J.D. Parson and R.G. Warren, "Uranium Hydrogeochemical and StreamSediment Reconnaissance of the La Junta NTMS Quadrangle, Colorado,Including Concentrations of Forty-three Additional Elements," Los AlamosNational Laboratory report LA-7343-MS, 1979.
[3] S.S. Shannon, "Uranium Hydrogeochemical and Stream SedimentReconnaissance of the Pueblo NTMS Quadrangle, Colorado, IncludingConcentrations of Forty-two Additional Elements," Los Alamos NationalLaboratory report LA-7541-MS and suppl., 1978.
[4] N.M. Daughtry Ed., "Rocky Flats Site Environmental Report For 1988," RockyFlats report RFP-ENV-88, 1989.

L <e
- 3 8 - AECL-11342
Extraction and Measurement of Subpicogram Quantities of Technetium fromGeologic and Other Matrices
P.R. Dixon, D.J. Rokop, J.T. Fabryka-Martin, and D.B. CurtisLos Alamos National Laboratory, CST, MS-J514, Los Alamos, NM 87545, USA
introduction
The need to measure "Tc in a variety of sample matrices (e.g. soils, rock and water)is becoming increasingly important for detailed tracing of processes related to nuclearwaste disposal, monitoring of contaminated ground water movement, and nuclear non-proliferation activities around the world. This demand has led us to develop a robustmethod for separating and purifying trace amounts (subpicogram/gram) of "Tc fromvarious matrices. This extended abstract describes the extraction methodologies andthe analytical precision and accuracy for small samples.
Approach and Techniques
Previous work
Accurate and precise measurement of subpicogram quantities of technetium in smallenvironmental samples, 1-10 g of solid material and 1-100 of mL water, entails the useof negative thermal ionization mass spectrometry (NTIMS) and ultra clean chemicalseparation techniques. Most of the previous work on extraction, purification andanalysis of technetium has been on large samples, 1 to 1000 L water and 20 g to 1.0kg of biologic or geologic material [1-10], with detection limits between 1 to 500picogram/gram. Most of these analyses were done by inductively coupled plasmamass spectrometry (ICP/MS), with minimal chemistry. Several papers have reportedthe analysis of technetium at the subpicogram level in waters using a NTIMS method[11] and a silica gel /TIMS method [12]. Trautmann [13] claims femtogramdetectability using laser resonance ionization mass spectrometry (RIMS), but presentsno environmental data. In this paper we describe a robust method for the extraction,purification and analysis of technetium at the femtogram level in small water and solidsamples.
Technetium Isolation Procedure
An extraction and purification technique for "Tc from both geologic (uranium ores andsediments) and water samples has been developed at Los Alamos as part of itsnatural analogues research activities. For geologic samples, the technique consists of

- 3 9 - AECL-11342
spiking the sample with 97Tc followed by a sodium peroxide/sodium hydroxide fusion.The fusion cake is then dissolved in de-ionized water, the hydroxide precipitates areremoved, and the Tc is extracted from the aqueous fusion solution into aTPA/chloroform mixture. The Tc is back-extracted from the TPA/chloroform solutionwith 8 M HNO3, then it is further purified through 1-mL and 100-uL anion columnscharged with AG-MP1 resin (100-200 mesh). The final purification step ismicrodistillation in a 5-mL Teflon conical vial. For water samples, the techniqueconsists of adding 97Tc spike to the sample along with H2SO4 and Ce+4to assuresample and spike equilibration. Once equilibration is achieved, the technetium isextracted from the aqueous solution with a TPA/chloroform mixture, and the aboveprocedure is followed.
Total chemistry yields for samples with less than 10 picogram of total Tc are 10 to30%. In samples with more than 10 picogram of total Tc, the chemistry yields are 50to 90%. A small but quantifiable amount of Tc is always lost during chemistry,regardless of sample size, such that large samples always have higher yields thansmall samples.
Mass Spectrometry and Filament Loading
Our analyses of Tc isotopes use the negative ionization configuration (NTIMS) massspectrometry technique reported by Rokop and others [14] to measure 10 to 100 fgfilament loads of Tc. Using this low temperature (1050 ± 5°C) NTIMS method incombination with a lanthanum oxide ionization enhancer on a NBS source filamentassembly, isobaric corrections for Mo and organics have been virtually eliminated.Using standards, we have determined that our detection limit for "Tc is 5x10⁵ atomsor 0.1 femtograms. Our full chemistry/mass spectrometry blank based on 10 analysesis 5.4 femtograms or 3.3x10⁷ atoms. Our measurement limit, defined as 3a of ourblank, is 8.4x10⁷ atoms or 14 femtograms. Our external reproducibility (chemistry andmass spectrometry) using a Canadian uranium ore standard measured 6 times overan 8-month period (BL-5, "Tc concentration = 56.2 ± 0.8 fg/gm) has a precision andaccuracy of ~1.5%.
Initial Data Interpretation
A major application of this Tc work has been evaluation of the feasibility of geologicstorage and disposal of spent nuclear fuel. The abundance of "Tc in natural uraniumminerals can be used to determine alteration/dissolution and radionuclide release ratesunder a variety of natural geochemical conditions that bracket most proposedrepository sites [16-19]. We have developed a model to predict the equilibriumconcentration of "Tc and other radionuclides produced during the fission of naturaluranium [19]. Excesses and depletions of "Tc in both rocks and ground waters from

- 4 0 - AECL-11342
Cigar Lake in Canada and Koongarra in Australia have been used to set limits onuranium mineral alteration and radionuclide release rates at these geochemicallydifferent sites [16-19]. We are now working with Yucca Mountain PerformanceAssessment (YMPA) staff to incorporate relevant information from this research intothe YMPA process to test safety and release scenarios for site licensing.
Conclusions
We have developed a robust method for extracting and purifying picogram andsubpicogram amounts of Tc from geologic, biologic and water samples. Combiningthese extraction and purification technologies with existing NTIMS analysis capabilitiesat Los Alamos, we are able to consistently measure with high precision and accuracysubpicogram amounts of "Tc in a variety of materials. This extreme sensitivity allowsus to study alteration rates of natural uranium minerals, identify the leading edge andextent of radioactive contamination plumes, and monitor nuclear non-proliferationactivities around the world.
References
[1] H. Hidaka, K. Shinotsuka and P. Holliger, Radiochim. Acta 63, 19 (1993).
[2] N. Matsuoka, T. Umata, Okamura, N. Shiraishi, N. Momoshima and Takashima,J. Radioanal. Nucl. Chem., 140, 57 (1990).
[3] T.J. Anderson and R.L Walker, Anal. Chem. 52, 709 (1980).
[4] S. Morita, C.K. Kim, Y. Takaku, R. Seki and N. Ikeda, Appl. Radiat. Isot., 42,531 (1991).
[5] N. Momoshima, M. Sayad and Y. Takashima, Radiochem. Acta, 63, 73 (1993).
[6] K. Tagami and S. Uchida, Radiochem. Acta, 63, 69 (1993).
[7] S. Morita, K. Tobita and M. Kurabayashi, Radiochem. Acta, 63, 63 (1993).
[8] J.S. Crain and D.L. Gallimore, Appl. Spectra., 46, 547 (1992).
[9] D.M. Beals, Determination of Technetium-99 in aqueous samples by isotopedilution inductively coupled plasma mass spectrometry, in Proceedings from the3rd International Conference on Nuclear and Radiochemistry, Vienna, Austria,September, 1992.

- 4 1 - AECL-11342
[10] S. Hirano and M. Matsuba, Radiochim. Acta, 63, 79 (1993).
[11] N.C. Schroeder, D. Morgan, D.J. Rokop and J. Fabryka-Martin, Radiochem.Acta, 63, 203 (1993).
[12] J.M. Pochkowski and D.M. Beals, Determination of subpicogram quantities ofTechnetium-99 in environmental samples by positive thermal ionization massspectrometry, in Proceedings of the 41st ASMS Conference on MassSpectrometry, p.182, 1993.
[13] N. Trautmann, Radiochim. Acta, 63, 37 (1993).
[14] D.J. Rokop, N.C. Schroeder and K. Wolfsberg, Anal. Chem., 62, 1271 (1990).
[15] P.R. Dixon, Curtis, D.B. and J.T. Fabryka-Martin, GSA Astr. with Prog., 25, A-184 (1993).
[16] P.R. Dixon, J.T. Fabryka-Martin, D.B. Curtis, D.J. Rokop, J. Cramer, J. Cornett,L. Kilius and P. Sharma, Modeling and measurements of in-situ producednuclides in uranium minerals: Implications for spent fuel stability, in ProceedingsEighth International Conference of Geochronology and Cosmochronology, andIsotope Geology (ICOG-8), Berkeley, CA, 1994.
[17] D.B. Curtis, J.T. Fabryka-Martin and P.R. Dixon, Natural constraints onradionuclide release rates, in Proceedings of the Natural Analogues WorkingGroup (NAWG-5), Toledo, Spain, 1992.
[18] D.B. Curtis, J.T. Fabryka-Martin, P.R. Dixon, R. Aguilar, D.J. Rokop andJ. Cramer, Radionuclide releases from natural analogues of spent nuclear fuel,in Proceedings Migration-93, Charlotte, NC, 1993.
[19] J. Fabryka-Martin and D.B. Curtis, Geochemistry of 239Pu, 1 2 9 I , "Tc and 36CI, inFinal Report Alligator Rivers Analogue Project, 15, Ed. by Australian NuclearScience and Technology Organization, Report No. ISBN-0-642-59941-6, 1992.
- 4 2 - AECL-11342
THERMAL lONIZATION MASS SPECTROMETRY
Instrumentation
- 4 3 - AECL-11342
A High Efficiency Thermal lonization Source Adapted To Mass Spectrometers
E. Phil Chamberlin and Jose A. Olivares ! ' • w
Los Alamos National Laboratory, Los Alamos, NM 87545, USA
Introduction
The high temperature ion source used on the isotope separators at Los Alamos wasoriginally developed almost simultaneously by Beyer in Dubna [1] and Johnson atLivermore [2]. Some contemporaries of the authors claim that the concept for thesource arose from a discussion between two of the authors at a conference and thatcredit for the work should be shared jointly. During the past ten years we havelearned how to make the source produce reliably and with high throughput.Experience seems to be an important factor in determining what not to do. If reliableoperation of the ion source were as simple as the authors of the two papers implied,this type of ion source might be in wider use today.
There are three requirements for repeatable results with high throughput: a well-engineered physical assembly that will operate at the required high temperatures,contaminant-free chemical preparation of the samples, and a well-understoodoperating procedure. A new user is typically faced with all three of these hurdlessimultaneously, and the challenges can prove daunting. We were fortunate to havefabricated sources on hand similar to that shown in [2]. The chemistry and operationalprocedures followed with time.
Figure 1 indicates the elements for which the source is suitable. Those marginallysuitable are shaded. Both the first ionization potential (through the Saha-Langmuirequation) and the operating temperature (through the vapor pressure of contaminants)affect the ionization efficiency [3,4,5,6]. Using a tungsten crucible that had beenpre-baked to a temperature where thorium could be seen as a contaminant of thetungsten, we achieved an europium ionization efficiency of 72%. Using unbakedcrucibles, 40% efficiencies were the norm. This reflects the results reported in [2].Lutetium has a lower first ionization potential but its vaporization temperature is twicethat of europium. This causes increased vaporization of contaminants includingtungsten, lowering throughputs to 25%. Zirconium is an element having both highionization potential and low vapor pressure and our ionization efficiencies for it rangebetween 2 and 3%.
While experimental and theoretical efforts over the past twenty years have provedfruitful on isotope separators, no one has adapted electron bombardment, cavity typesources to the field of mass spectrometry. The mass spectrometry source most

- 4 4 - AECL-11342
resembling the source discussed here was the tube source described by Delmore,Appelhans and Peterson [7]. That arrangement, however, is incapable of reaching thetemperatures required for efficient ionization of refractory materials such as zirconium,hafnium and thorium.
u67OK5.4 .V
46SK5.1 .V
K395K4.3 .V
Rb383K4.2 .V
Ca3S0K3.9 . V
Fr
MOeooK7.6 aV
c>730K6.1 eV
Sf880K5.7 aV
Ba730K5.2 aV
R»S90K5.3 aV
Sc1375K6.6 (V
Y16O0K6.4 aV
U1700K5.8 .V
Ac
Tl1710K6.8 eV
Zr2275K6.8 eV
HI2275K6.8 aV
V1820K6.7 eV
Ca1650K5.5 .V
Th2250K6.1 aV
Cr1430K6.8 aV
Pr1420K5.5 aV
PI
Nit-1«0KMaV
Tc
74.V
Nd132SK54 aV
U1S50K6.2 aV
F*1500KZ » » V
Ru22S0K7.4 »V
Pm1050K5.6 eV
NP
Co1530K7.9 aV
Rh197SK?.SaV
Sm850K5.6 »V
Pu1475K6.1 eV
Nl1530K7.6 aV
Eu730K5.7 eV
Am1130K6.0 aV
Cu1300K7.7 oV
*a1100K7 * B V
Gd1350K6.2 aV
Tb1425K5.8aV
Al1250K6.0 aV
Ga1175K6.0 aV
In1000K5.8 eV
T)740K6.1 eV
Dy112SK5.9 aV
Ho1225 K6.0 aV
Er1225K6.1 aV
Tm95OK6.2 aV
Yb690K6.3 oV
U1550K5.4 aV
Figure 1: Elements lonizable Using High Temperature Techniques(Listed are temperature to achieve 10"4 torr and first ionization potential)
Objectives
The isotope separator ion source is unsuitable for mass spectrometry use. It is bulky,designed for single sample operation, expensive to fabricate, requires great care inassembly, requires high heating power and, as a result, significant cooling water flow.Before design of the modified source began, we established a set of objectives:
- Reduce the number of parts to minimize fabrication costs and allow disposal ratherthan cleanup.
- Minimize complexity of parts; design to commercially available shapes andcomponents.
- Have an inexpensive, one piece crucible.- Have a modular system.- Operate with \itt\e or no water cooling.- Use existing power supplies and control system.

- 4 5 - AECL-11342
The Crucible and Beam Formation
The most uncertain of these objectives was the ability to achieve a reasonable ionbeam emittance while using a one piece crucible. Figure 2 (top) shows the crucibleand cap used in isotope separator operations. The cap surface is shaped to minimizethe overall magnification of the beam. The ionizing channel diameter is about. 1/3millimeter. Figure 2 (bottom) shows the design for mass spectrometer operation. Theionizing channel diameter is slightly less than 1/2 millimeter and is over a centimeterdeep. In both cases, the ionizing channel opening presents a small apparent object tothe optic system but is large enough to ensure that a quasi-neutral plasma can bemaintained [4]. The mass spectrometer crucible can be mass produced at reasonablecost and can be baked at high temperature prior to loading. Actual backgroundmeasurement of contaminants can be performed prior to sample loading if required.Early on, test samples of Th(NO3)4 were run using this crucible in the isotopeseparator ion source to quantify changes in beam focussing. The results wereencouraging in both ionization efficiency and focal plane spot size.
The electrostatic field code SIMION [8] was then used to model the ion source,comparing relative values of extracted beam emittance while varying crucible position,extractor position and the potential of the electron bombardment filament relative tothe crucible. The position of the crucible relative to the electron reflector/heat shieldand extractor position had little effect on the beam emittance. The electronbombardment energy (filament and reflector/heat shield) potential had the most effecton the emittance.
y/0. V///////////////////////////A
JZZZZZZZZZZZZZZZZZZZZZZZZZZZ/.
l j r * * * - * - • * * - Y7////7Z//77/A
Figure 2: Isotope Separator Crucible (top) and Mass Spectrometer Crucible (bottom)
The Electron Bombardment Assembly
The ion source is shown in Figure 3 in two views. On the left is a transverse sectionview showing the source mounted on an RF-quadrupole mass spectrometer. On theright is the axial view seen by ions leaving the source. The transverse section view of

- 4 6 - AECL-11342
the source shows that it consists of three major assemblies: the quadrupole/sourcemounting adapter, the electron bombardment assembly and the crucible holder. Themounting adapter will take a form appropriate to each application. The crucible holdershown is a purely functional item assembled from Conflat vacuum parts together withone machined rod and two set-screws.
U
Figure 3: (Left) The ion source mounted on a quadrupole mass spectrometer.(Right) A coaxial view of the source.
The electron bombardment assembly was designed around a 6 inch diameter,double-sided Conflat blankoff flange. Precise machining operations are minimal andare intended for a numerically-controlled milling machine. Interior parts consist of orare fabricated from easily available commercial components. An alignment jig forfilament fabrication and a necessary welding operation are a part of the design. Thedesign was carried out using AutoCAD-12, making modifications simple when adaptingto specific applications. Cooling water channels have been designed into the systemas shown in the axial view. The flow tubes are arranged laterally on both sides ofeach filament-current electrical feedthrough. These feedthroughs are operated at thefilament bias voltage (up to 2.5 kV) and are a hazard to personnel if not covered. Thewater tubes provide a firm foundation for a clamp-block arrangement which providespersonnel safety protection and a securing post so that the electrical feedthrough doesnot bear the weight of conductors. Without cooling water flowing, the ion source bodymay reach temperatures which could damage adjoining equipment or personnel. Afan directing air onto the source body usually provides sufficient cooling under theseconditions.
Obviously a design which required the operator to break vacuum to introduce eachsample would be less than satisfactory, so there is a multiple crucible system in theinitial design stages.

- 4 7 - AECL-11342
Matching The Ion Beam Into a Sector Type Spectrometer
Figure 4 illustrates a GIOS [9,10], first-order calculation of the proposed matching ofthe ion beam into a 12-inch radius, 90-degree sector type mass spectrometer. Thetop portion of the figure illustrates the beam in the non-dispersive plane and thebottom shows the mass-dispersive plane. The path shown through the system is1.79 meters long. The transverse dimensions shown are ±2 cm. Our objective is tomatch the ion beam into the entrance slit in the dispersive plane and to have a beam
Y
Y-MAX = + / " 0.020 TLU Z - l t tX= 1.790 111)
X-MAX = + / - 0.020 TLU Z-MAX = 1.790 LLU
Figure 4: Calculated ion trajectories from the ion source to the focal plane for 231,232, and 233 amu ions. The top/bottom illustrations are for the non-disperr:; 'e and dispersive planes, respectively.

- 4 8 - AECL-11342
crossover midway through the magnet in the non-dispersive plane. This approachminimizes some aberrations associated with the normal-entrance/normal-exit polepieces of the homogeneous magnet and provides a smaller magnification in thenon-dispersive plane so that the pulse counting apparatus at the focal plane can havea smaller entrance aperture. By not disturbing the entrance slit, exit slit or flight tubeof the existing spectrometers, it should prove expedient to switch between thissource/lens system and the standard thermal ionization arrangement.
The matching system consists of two electrostatic quadrupole doublets arranged in aFD-DF (dispersive plane) geometry. The drift space between the doublets allows foraddition of a pump, emittance defining slits and diagnostic apparatus. The pump willbe required only if a gas-discharge-type source is added at some time in the future. Itis our intent to minimize any increase in the length of the beam matching system sothat the overall length of the system does not become excessive. However, initialsecond and third-order calculations show that too short a drift space between the firstand second quadrupole doublets causes increased aberrations in the non-dispersiveplane. We do not propose achieving short physical length at the cost of beam quality.Therefore, we have deferred finalizing the design of the matching unit until we haveexperimental emittance data in hand.
References
[1] G.J. Beyer, E. Herrmann, A. Piotrowski, V.J. Raiko and H. Tyrroff, Nucl. Instr.Methods 96, 437 (1971).
[2] P.G. Johnson, A. Bolson and CM. Henderson, Nucl. Instr. Methods, 106, 83(1973).
[3] A. Latuszynski and V.I. Raiko, Nucl. Instr. Methods, 125, 61 (1975).
[4] R. Kirchner and A. Piotrowski, Nucl. Instr. Methods, 153, 291 (1978).
[5] M. Huyse, Nucl. Instr. Methods, 215, 1 (1983).
[6] R. Kirchner, Nucl. Instr. Methods, A292, 203 (1990).
[7] J.E. Delmore, A.D. Appelhans and E.S. Peterson, Int. J. Mass Spectrom. IonProcesses, 108, 179 (1991).
[8] D A Dahl and J.E. Delmore, EGG-CS-7233 Rev. 2, Idaho National EngineeringLaboratory, Idaho Falls, 1988.
[9] H. Wollnik, J. Brezina, M. Berz and W. Wendel, Proc. AMCO-7, GSI-ReportTHD-26, 679.
[10] H. Wollnik, Optics of Charged Particles (Academic Press, New York, 1987).

'}- -'-.
CIWJO'
- 4 9 - AECL-11342
Instrumental Improvements on a Two Stage (B-RPQ) Mass Spectrometerwith Very High Abundance Sensitivity
( Johannes B. Schwieters and Peter BachFinnigan MAT GmbH, Barkhausenstr. 2, 228197 Bremen, Germany
Introduction
Because of its high selectivity and extreme stability thermal ionisation massspectrometry (TIMS) reveals information at a very high level of accuracy and precisionthat cannot be achieved by any other technique. The precise and accuratemeasurement of very large isotope ratios is a specific challenge for thisinstrumentation. Conventional mass spectrometers are limited to an abundancesensitivity of 10'6-10"7. For isotope ratios larger than 100,000 this is a serious problemin general, requiring a tandem- or accelerator-ms (AMS) [1,2]. However, these arevery expensive and rather specialized techniques, restricted to a few laboratoriesworldwide.
At the first Alfred O. Nier Symposium we reported on a new and simple instrumentalapproach giving ultra high abundance sensitivity [3]: a thermal ionization singlefocussing magnetic sector instrument combined with a retarding potential quadrupole(RPQ) filter lens. This system has been proven to be capable of measuring isotoperatios up to 1 x 10⁹ [4,5]. In these measurements an abundance sensitivity level of 3 x1o-io (i33Cs/i35Cs ^ w a s achieved. However, the transmission of the first RPQ, RPQ-I, was restricted to about 50%. For many applications the stability of the system wasa problem. This paper reports on significant improvements in transmission andstability and introduces the next generation system, RPQ-II. The performance of thenew system is demonstrated and the limits of accuracy and precision are discussed.
Description of the Instrument
The analyzing magnet of the MAT 262 has inclined field boundaries to ensure efficientfocussing in the X- and Y-directions. Second order image aberration correction (a2) isachieved by a curvature of the entrance and exit pole faces of the magnet. Bothnarrow focussing of the ion beam and correction of image aberrations areindispensable prerequisites for instrumentation with high abundance sensitivity. Also,UHV conditions in the flight tube are required. Any scattering events with the walls ofthe analyzer chamber, residual gas particles or apertures can result in energy lossand/or change of flight direction of the ions and thus reduce the abundance sensitivity.However, even with the most carefully designed ion optics, scattering effects can

- 5 0 - AECL-11342
never be completely avoided. The abundance sensitivity at the first stage of the MAT262 (i.e. the image plane of the magnet) is restricted to about 10"6. At the secondstage behind the RPQ-II filter lens the abundance sensitivity is improved by threeorders of magnitude into the 10'9 range (uranium ±1 amu).
variable Faraday multi-collectorRPQ-FAR*
900 magnetic sector(r=23 cm) SEM
RPQ-SEM
| ^ — aperture
Tl-ion source
• The RPQ-FAR is not integrated into the GAIN CALIBRATION networkof the multi-colleclor-FAR channels. It's exclusive purpose is to separatetransmission from SEM gain effects.
Figure 1: Schematic Drawing of the MAT 262 RPQ-II Instrument
Behind the redesigned RPQ-II filter lens the ion beam can be switched into asecondary electron multiplier (RPQ-SEM) or into a Faraday cup (RPQ-FAR). TheRPQ-FAR is used to demonstrate the ion optical stability and the high transmission ofthe improved RPQ-II filter lens independently of the SEM gain.
Performance
The RPQ-II Filter Lens
The RPQ acts as a very sensitive energy and direction filter lens. Scattered particleswith false flight directions and/or false energies are rejected. Only particles with rightangles and energies are transmitted (see Figures 2 and 3). The energy resolution ofthe RPQ-II lens is R(fwhm) = 10,000 (see Figure 4). Ion optical redesign of the mostcritical region of the RPQ filter lens leads to a dramatic increase in transmission andto a significant improvement in stability.

-51 - AECL-11342
Figure 2: RPQ-II Ion Trajectories.Ions of False Angle andEnergy are Rejected.
Figure 3: RPQ-II Ion Trajectories.Transmission of Ions ofRight Angle and Energy.
100
en 60
9995 9996 9997 9993 9999 10000 10001 10002 10003
Suppression Lens Voltage V
Figure 4: Energy Resolution of the RPQ-II Filter Lens
Abundance Sensitivity
Figure 5 shows a mass scan across the 230Th peak of a large isotope ratio thoriumsample (23oTh/232Th) = 2,800,000 [6]. At the first stage the 230Th peak is hidden in thepeak tailing of the intense 232Th peak. After passing the RPQ the stray particles of232Th are removed and the 230Th peak appears on a clean baseline.

- 5 2 - AECL-11342
experimental parameters:abundance sensitivity:mass steps:integration time/step:
1 E-60,02 amu8s
axpenmantal paramatarsabundance sansitivity:mast steps:integration time/step:
1E-90.02 «mu18s
i.S U 1
Ma»» C-̂ J
Figure 5: Mass Scan across the 230Th Peak (232Th/230Th) = 2,800,000 [6]. (Left) FirstStage, (Right) Second Stage.
Transmission Stability of the RPQ-II
To demonstrate the stability and the high transmission of the RPQ-II filter lens, aneodymium sample (La Jolla) with known isotope ratios has been measured using theRPQ-FAR and two Faraday cups of the variable multi-collector. From this experimentthe absolute value of the RPQ-II transmission can be deduced. However, becausethe RPQ-FAR is not integrated into the gain calibration network of the variable multi-collector channels, the absolute value of the measured transmission is uncertain byabout ±1%. This is due to the specified individual tolerances of the 1011 Q resistorswhich are used in the current amplifiers. The measured data shown in Figure 6clearly show that the transmission of the RPQ-II is >99% and that the stability is muchbetter than 0.1%/ hour.
1C0.5
^ T 100.4S
o"a 100.35
•g 100,3
C 100^5
2- 100^£ 100.15
S 100.1
E 100.05
100-+•
10 20 30
time (min)50
•43000 I I I I I I 1 I I I I |. I I I I I I I I
Figure 6: Demonstration of the HighTransmission on the RPQ-IFAR Channel.
Figure 7: Stability of the 238U/234U RatioMeasured on the RPQ-II SEM.

- 5 3 - AECL-11342
Stability and Linearity of the RPQ-II SEM
The stability, linearity and accuracy of the calibration of the RPQ-II SEM channel isdemonstrated by a simultaneous acquisition of a NIST U005 standard using the RPQ-SEM (mass 234) and two Faraday cups of the variable multi-collector (mass 235 and238). The RPQ-SEM yield (including transmission and counting efficiency of the SEM)has been calibrated at the beginning of the acquisition by switching a 235U beam ofabout 300,000 cps between a Faraday cup of the multi-collector and the RPQ-SEM.The RPQ-SEM yield was measured to be 98.0 ± 0.2%. According to Poisson's law, acounting efficiency of 98% requires per incoming ion in average a release of 4electrons at the first dynode of the SEM, which is a reasonable number for 10 KeVuranium ions.
The acquisition time of the measurement was 2 hours. The acquired data are shownin Fig. 7 and demonstrate the stability of the RPQ-H SEM channel. The measuredisotope ratio is (238U/234U) = 45806.0 ± 0.1% (2cM). It deviates +0.3% from theaverage value recommended by NIST. The specified uncertainty of this isotope ratiois ±1% which means that these measurements fit very well into the limits specified byNIST. The calibration of the RPQ-SEM yield was performed with a beam intensity of300,000 cps. During analysis the intensity of the 234U beam at the RPQ-SEM wasabout 1,400 cps. Because the measured isotope ratio is in good agreement with thespecified value, these measurements also prove the linearity of the RPQ-SEM channelin the range of 1,400 - 300,000 cps.
Dark Noise Level of the RPQ-II SEM Channel
For the measurement of high abundance isotope ratios the dark noise level of theRPQ-SEM has to be extremely low. Because the analyzer region and the housing ofthe RPQ is completely sealed with gold fittings, the detector can be baked at hightemperatures. We found this to be very important to achieve extremely low dark noiselevels at the RPQ-SEM. After baking the SEM the dark noise level dropped fromabout 3 cpm to about 0.3 cpm. This ultra low dark noise level is a very unique andimportant feature of the SEM used in this instrument.
Discussion
Very high abundance sensitivity, high transmission and high stability ion optics,extremely low dark noise level, high linearity of the detection system and sophisticatedsample preparation techniques to minimize molecular interferences and contaminationsof the sample are mandatory to achieve the ultimate precision and accuracy in TIMSmeasurements of very large isotope ratios. To stress the significance of eachindividual point we will discuss the following experiment: an isotope ratio in the range

- 5 4 - AECL-11342
isotope ratio in the range of 100,000 -1,000,000 has to be measured. The major ionbeam intensity is assumed to be 1 pA and the acquisition time is restricted to 1 h(typical conditions for the measurement of Th). The systematic errors due to thelimited abundance sensitivity Err(ABS), the dark noise counts Err(Dc) and the countingstatistics Err(n) can be calculated by the following equations:
limited abundance sensitivity:dark noise error:counting statistics:
Err(ABS)=ABS x IR x 100%Err(Dc)=Dc/n x IR x 100%Err(n)=(IR/nf x 100%
(IR, isotope ratio; n, # of counts of major ion beam accumulated during the acquisitiontime; Dc, # of dark noise counts acquired during analysis; ABS, abundancesensitivity).
0,8 •
0,6 •
0.4 •
0,2 •
0 •
abundancesensitivity
~- ~~ dark noise
countingstatistics
I
/
•^••f " " i \— 1 1100000 300000 500000 700000
isotope ratio
900000
Figure 8: The limits of accuracy andprecision. (y4BS=1E-9,DC=0.01 cps).
In Fig. 8 the different error contributionsare plotted versus the isotope ratio.The instrumental parameters Dc andABS have been set to the numbersachieved by the RPQ-II {ABS =1E-9uranium ±1 amu, Dc=0.01 cps). Thelinearity and stability of the system isabout 0.2%. It can clearly be seen thatunder these experimental conditions theaccuracy and the precision of themeasurement is only determined bycounting statistics. Even for themeasurement of an isotope ratio in therange of 1,000,000 the contribution ofscattered ions of the major ion beam tothe minor isotope intensity is only 0.1%.This clearly falls below the limit ofcounting statistics. However, assuminga level of abundance sensitivity of onlyABS=1 E-7, the error due to the limitedabundance sensitivity would be in therange of 1-10% which is about 15times the limit of counting statistics.
Additionally a dark noise level of 0.1 cps would result in an error in the range of0.16-1.6%, which is about 1-3 times the limit of counting statistics. In principle, onecould try to correct for these inaccuracies by background correction. However, thiswould imply that the abundance sensitivity and the dark noise level must be measured

- 5 5 - AECL-11342
sensitivity. Also the abundance sensitivity correction relies on a certain theoreticalmodel of the peak shape. For the measurement of very large isotope ratios this is nolonger useful.
With the RPQ-II we are limited by counting statistics. Of course increasing the ioncurrent results in a higher precision of the measurement. With conventional TIMS ionsources and favorable elements the ion current can be increased from about 1 pA toabout 100 pA. This would reduce Err(n) by a factor of 10 and Err(Dc) by a factor of100. In this case Dc/n«ABS and Err(Dc) can be neglected. The limit of precision isdetermined by Err(ABS). However, for the measurement of elements with a largerrelative mass difference between the major and the minor isotope (i.e. Cs, Th) theeffective abundance sensitivity of the RPQ-II can be in the 10'10 range [4]. At thispoint again the counting statistics determine the precision of the measurement.
Summary and Conclusion
We have demonstrated the instrumental improvements on the RPQ-II:
increase of transmission from 50% to >98%improvement of ion optical stability from 0.5%/10 min. to <0.1%/himprovement of ion counting stability and linearity to <0.2%/himprovement of dark noise on the RPQ-SEM from 3 cpm to 0.3 cpm.
The abundance sensitivity is 2 x 10'9 (uranium ± 1 amu). For the measurement oflarge isotope ratios, no abundance sensitivity and dark noise corrections have to bemade. Provided that there are no molecular interferences the ultimate precision andaccuracy of the measurement is only determined by counting statistics. New highcurrent Tl ion sources [7] could push TIMS technology to a higher precision for themeasurement of very large isotope ratios.
References
[1] K.H. Purser, P. Williams, A.E. Litherland, J.D. Stein, H.A. Storms, H.E. Grovesand CM. Stevens, Nucl. Instrum. Meth., 186 (1981) 487.
[2] J.J. Stoffel(s), D.R. Ells, L.A. Bond, P.A. Freedman, B.N. Tattersall, C.R.Lagergren, Int. J. Mass Spectrom. Ion Processes, 132 (1994) 217.
[3] K. Habfast and H.J. Laue, Proceedings of the First Alfred O. Nier Symposium onInorganic Mass Spectrometry, Durango, CO, (1991) 75.

- 5 6 - AECL-11342
[4] Typhoon Lee, Teh-Lung Ku, Hsiao-Ling Lu, Ju-Chin Chen, Geochim. Cosmochim.Acta 57 (1993) 3493.
[5] J.I. Wendt, I. Wendt and D. Tuttas, Chemical Geology, 106 (1993) 67.
[6] D. Tuttas, Finnigan MAT Application News No. 4, (1993).
[7] E.P. Chamberlin, see these Proceedings.

- 5 7 - AECL-11342
Performance Indications for TIMS with a Deceleration Lens System andPost-Deceleration Detector Selection
Peter van Calsteren, David Wright and Simon TurnerDepartment of Earth Sciences, Open University, Milton Keynes, MK7 6AA, UK
Introduction
Solid source mass spectrometry is rapidly becoming the technique of choice in U-Thdisequilibrium studies. In the Earth sciences, research topics include melt generationand extraction processes at ocean ridges and the importance of fluid fluxes in thegeneration of melts in island arc settings. The large ratios between decay constants of238U and 232Th compared with 234U and 230Th, generate extreme isotope ratios whichrequire instruments with high abundance sensitivity. We have used a FinniganMAT262-RPQII instrument, which was designed to improve the abundance sensitivityto 20 ppb.
Instrumentation
Compared with earlier versions of the multi-collector Finnigan MAT262-RPQ, theinstrument used here for high abundance sensitivity measurements has a number ofcritical differences. In the filament power supply a potentiometer circuit has beenincorporated that maintains a constant potential on the filaments. Without this circuitthe potential of the mid-point of the filament would change by ~0.5 V for a filamentcurrent change of 1 A. Such changes are necessary to reduce the ion beam intensityfor yield determinations. The resulting change in ion energy at the deceleration lenswould be sufficient to reduce transmission from ~100% to <10%.
In the flight tube between the ion source and the magnet (see Figure 1), a fieldaperture has been installed that can be set at 3 x 5 mm in addition to the usual 3 x10 mm. Beam intensity reduction is less than proportional to the slit opening becausethe cross sectional ion distribution has a 'Gaussian' component to the ideal 'top hat1
profile. At the 3 x 5 mm aperture setting, the peak shape at the collector has steeperslopes and no sign of the sloping 'peak flat1 that is sometimes observed with the largeaperture (Figure 2). Peak shapes are similar to the peak shape at the multi-collectorFaraday cups despite the shaping, deceleration and deflection of the beam and theshape and location of the detectors, some 300 mm behind the natural focal plane ofthe magnet.

- 5 8 - AECL-11342
Multicollector
Source
7MU0CVisav .
UMUOOV —M00V-*
nooov —
Ztxoi
Figure 1: Schematic diagram of the MAT262-RPQII. The static quadrupoie shapesthe beam, and the funnel and tunnel deceleration lenses reject ions with thewrong direction or the wrong energy. Deflection plates aim the beam ateither of the two collectors.
Figure 2: Traces of five magnet scans for the RPQ-SEM and the RPQ-FAR,normalised to 100%. Both peak shapes are similar to the peak shape atthe multi-collector Faraday cups.

- 5 9 - AECL-11342
Deflection plates are installed to allow the necessary ion beam switching fordetermination of the transmission efficiency of the RPQ and the conversion efficiencyof the secondary electron multiplier (SEM) detector, so that observed ratios may becorrected for these factors. The deceleration lens assembly has been redesignedand gives better transmission at similar abundance sensitivity (Schwieters and Bach,these proceedings). After the RPQ the axial ion beam is transformed from arectangular cross-section to a circuloid cross section using a static quadrupole lens.The circular beam passes through a two stage deceleration assembly consisting offunnel and tunnel lenses and only ions with the inherent thermal ionisation energydistribution pass through the tunnel lens.
Our system is equipped with a pulse counting facility consisting of the standard SEMbut with an ORTEC 9305 pre-amplifier and 9302 amplifier-discriminator, and aHewlett-Packard HP5316B pulse counter. The discrimination level is first set justabove the level of the amplifier noise and at this level the number of intra-dynodalpulses or 'dark noise1 is less than 2 cpm determined repeatedly for more than 15hours. The discrimination level is further adjusted to reduce the occurrence of delayedor 'ghost' pulses to less than one in a thousand.
System Performance
A 187Re+ beam has been used extensively to evaluate system performance indicatorssuch as peak shape when scanned with the magnetic field (see also Figure 2), andpeak top flatness which is better than 2% for mass deviations of 0.1% on either side ofthe peak centre. Beam intensity variation as a function of SEM potential has beendetermined and a potential of 2000 V has been selected which ensures minimaldependence of gain on voltage. Detector intensity profiles when scanning thepotentials of the deflection plates have been determined, and values in the middle ofthe plateau have been selected.
The SEM conversion efficiency is measured by switching an ion beam of -200,000 cpsrepeatedly between the RPQ-FAR and the RPQ-SEM, and the resultant efficienciesare between 93 and 97%. The error on the conversion is down to <0.4% in a fewminutes and the long term stability is - 1 % , and is mainly determined by the error on thebaseline of this Faraday collector which has its amplifier mounted outside the vacuumsystem and without a thermostat. The error on the baseline is a few times higher thanon a multi-collector Faraday cup (MC-FAR), and is a relatively large proportion of asmall (0.02 pA) ion beam. The RPQ transmission is measured by switching an ionbeam of >1 pA between a multi-collector Faraday and the RPQ Faraday. The error onthe transmission is down to <0.1% in a few minutes and the long term stability is ca0.1%. Multiplying the SEM conversion by the RPQ transmission gives the total yieldand the error is dominated by the error on the conversion. There are two other ways

- 6 0 - AECL-11342
to measure the total yield. An ion beam of -200,000 cps can be switched between aMC-FAR and the RPQ-SEM and this method has been used for 23OTh/232Thmeasurements where only one 'stable1 isotope is available. With this method the errorin the yield is down to ~0.2% in a few minutes and the long term stability is <1%.Increasing the ion beam to 400,000 cps results in a better error on the yield but ittakes the SEM many hours to recover to dark noise of <2 cpm. The other methoduses a fixed isotope ratio such as between 235U and 238U. The high abundanceisotope is centred on a MC-FAR and the other isotope on the RPQ-SEM and data arecollected simultaneously. The errors are down to <0.2% in a few minutes andvariations over some hours are <0.5%. This method has a superior stability over thecourse of an analysis and is used for all 234U/238U measurements.
The design aim of the RPQ was to improve abundance sensitivity to ~20 ppb, which isrequired for the determination of 23OTh/232Th ratios in silicates. For present purposes,abundance sensitivity is defined as the relative count rate one mass unit below themajor isotope such as 237/238U or 231/232Th. Abundance sensitivity depends on anumber of factors including the thermal energy distribution of the major isotope in thesource of the mass spectrometer, collisions with neutrals near the filament (e.g.neutrals of the major isotope, the carbon compounds of the loading medium and Refrom the filament) and with residual gas atoms in the flight tube. Apart from thethermal energy distribution, all other factors lead to a reduction in ion energy and,consequently, the abundance sensitivity tail is more pronounced at the low mass sideof a major isotope and less pronounced at lower mass numbers. Abundancesensitivity is determined in static mode with 23BU centred in FAR-IV and the RPQ-SEMat 237 using the NBS 0002 standard with a certified 238U/235U ratio of 5697. Typically,with a 1.4 pA 238U beam and 97% yield, the count rate at 237 is 0.24 cps, with0.03 cps dark noise. This corresponds to an abundance sensitivity of 24 ± 3 ppb.
A magnetic scan between masses 228 and 232 for a Th standard with23oTh/232Th = 6 x 10⁻⁶ j s j | | u s t r a t e d i n Figure 3a and b for the RPQ- and MC-SEM,respectively. The small peaks on the baseline represent individual counts and thehighest point on the 230Th peak represents 45 cps. It is clear that the RPQ greatlyreduces both the general background and the background at 237, even taking intoconsideration that on this scan the apparent abundance sensitivity is high because themajor 232Th isotope is not totally collected in the Faraday cup. At two mass units awayfrom the major isotope the contribution to the minor isotope from the abundancesensitivity is probably less than 10 ppb. When using the NIST 3159 Th concentrationstandard with 23OTh/232Th = 0.34 x 10"6, a major isotope intensity of 1 pA results in acount rate of 2 cps for 230Th and there will be a contribution of ~10% from theabundance and ~1.5% from dark noise.

-61 - AECL-11342
232 229
Figure 3: Magnetic scan of (a) the RPQ-SEM and (b) the MC-SEM. The highestpoint on the 230Th peak is 45 cps.
Results
Within-run data statistics for the analysis of a single Th'u'std (see below) arerepresented in Figure 4. The final result for this analysis is 23OTh/232Th = 6.087 ± 0.020x 10"6. The distribution of the set means around the horizontal indicates that over the25 minute period of this analysis there was no significant effect of interference,fractionation or variation in the yield of the RPQ-SEM.
Figure 4: Within-run data statistics for a single Th'u'std analysis. The vertical barsindicate one standard error on either side of the mean of 10 integrations of8 s each. The tramlines represent one standard error on either side of therunning mean.
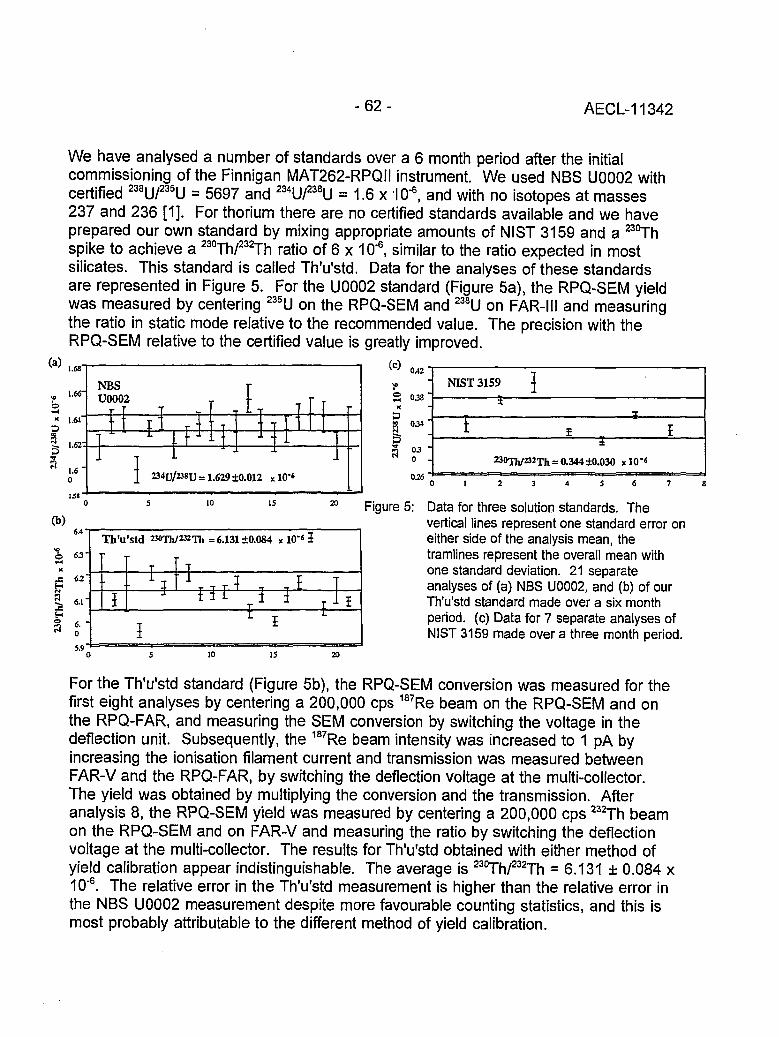
- 6 2 - AECL-11342
We have analysed a number of standards over a 6 month period after the initialcommissioning of the Finnigan MAT262-RPQII instrument. We used NBS U0002 withcertified 238U/235U = 5697 and 234U/238U = 1.6 x 10s, and with no isotopes at masses237 and 236 [1]. For thorium there are no certified standards available and we haveprepared our own standard by mixing appropriate amounts of NIST 3159 and a 230Thspike to achieve a 23oTh/232Th ratio of 6 x 10"6, similar to the ratio expected in mostsilicates. This standard is called Th'u'std. Data for the analyses of these standardsare represented in Figure 5. For the U0002 standard (Figure 5a), the RPQ-SEM yieldwas measured by centering 235U on the RPQ-SEM and 238U on FAR-III and measuringthe ratio in static mode relative to the recommended value. The precision with theRPQ-SEM relative to the certified value is greatly improved.
(a)
33a
1.68'
1.66"
1.64"
1.62'
1.60
NBSU0002 A
= i,629 ±0.012
(c) 0A2- NIST 3159 J
3
; t230T h /232Th = 0.344+0.030 xlO-(!
(b)
f
6.4
6 3 '
5.9
Th'u'std «<>Th/232Th =6.131+0.084 x 10"« 3
S 038K
PR 034
I-N 0
026
Figure 5: Data for three solution standards. Thevertical lines represent one standard error oneither side of the analysis mean, thetramlines represent the overall mean withone standard deviation. 21 separateanalyses of (a) NBS U0002, and (b) of ourTh'u'std standard made over a six monthperiod, (c) Data for 7 separate analyses ofNIST 3159 made over a three month period.
20
For the Th'u'std standard (Figure 5b), the RPQ-SEM conversion was measured for thefirst eight analyses by centering a 200,000 cps 187Re beam on the RPQ-SEM and onthe RPQ-FAR, and measuring the SEM conversion by switching the voltage in thedeflection unit. Subsequently, the 187Re beam intensity was increased to 1 pA byincreasing the ionisation filament current and transmission was measured betweenFAR-V and the RPQ-FAR, by switching the deflection voltage at the multi-collector.The yield was obtained by multiplying the conversion and the transmission. Afteranalysis 8, the RPQ-SEM yield was measured by centering a 200,000 cps 232Th beamon the RPQ-SEM and on FAR-V and measuring the ratio by switching the deflectionvoltage at the multi-collector. The results for Th'u'std obtained with either method ofyield calibration appear indistinguishable. The average is 23OTh/232Th = 6.131 ± 0.084 x10"6. The relative error in the Th'u'std measurement is higher than the relative error inthe NBS U0002 measurement despite more favourable counting statistics, and this ismost probably attributable to the different method of yield calibration.

- 6 3 - AECL-11342
Data for 7 separate analyses of NIST 3159 are presented in Figure 5c. Because of itsextremely low 23OTh/232Th ratio, this certified concentration standard could become auseful isotope ratio standard with a 23OTh/232Th ratio similar to young volcanic rocksthat have undergone extreme Th and U fractionation. The RPQ-SEM yield wasmeasured in the same way as the last 13 measurements of Th'u'std. The average is23OTh/232/Th = 0.344 ± 0.030 x 10"6.
Conclusions
Isotope ratios of 1 in 1,000,000 at two and four mass units difference in Th and Ustandards can be measured at 1% precision with the high abundance sensitivity andhigh transmission achieved by the Finnigan MAT262-RPQII. Data on island arc lavasindicate a similar performance and these results are of great importance in petrogenicstudies.
Acknowledgements
Thanks to Janet Dryden and Chris Hawkesworth for help with the preparation of thismanuscript.
Reference
[1] Garner, E.L., Machlan, L.A. and Shields, W.R. Uranium Isotope StandardReference Materials. N.B.S. Spec. Pub. 260-27, 1-150 (1971).

- 6 4 - AECL-11342
Evaluation of a L.A.N.L. Designed Turret
v - •••'/
J. Banar, R.D. Aguilar, P.R. Dixon, R.E. Perrin, D.J. RokopLos Alamos National Laboratory, Box 1663, Los Alamos, NM 87545
Introduction
In 1985, the decision was made to design and build a turret-type rotary sample holderfor the thermal ionization mass spectrometers used by CST-8 at Los Alamos NationalLaboratory. The sample holder (turret) was to be developed as a research anddevelopment tool with a secondary goal of increased sample Inroughput. Two of themajor considerations in the design of the turret were the ioni^ation processes and theion beam focusing. The design philosophy dictated that the sample holder shouldcause no compromise or degradation of the current capability and that it would becompatible with the existing equipment. After 2 years, a prototype was produced andinstalled for testing on a single-sector NBS 12"-90° spectrometer doing actinideanalysis by pulse counting. The prototype was tested for three years, and during thattime the data generated were compared to historical standards data generated by thesame instrument, using the original configuration, to spot any trends.
Background
The mass spectrometric section, CST-7, in the Chemical Science and TechnologyDivision of Los Alamos National Laboratory is primarily concerned with ultra-traceisotopic analysis on complex matrices using thermal ionization mass spectrometry.Precision and accuracy of measurements approaching ±0.10%, are achieved routinely.Analyte concentrations down to 10'12 atoms per gram are not uncommon. Theanalyses are done on National Bureau of Standards designed NBS 12"-90° thermalionization mass spectrometers (TIMS) using either a single or double magnetic sector.These instruments use a Nier thin-lens focusing source and a pulse counting detectionsystem. The bulk of the analyses are done using a single-filament platinumco-plate/overplate sample mounting technique. All of the sample separationschemistry, sample plating, and analyses are done in class 100+ clean rooms.
Using the standard configured NBS 12"-90° instrument, samples can only beintroduced into the source region one at a time. This requires that the source regionbe vented to atmosphere for every sample. A consequence of this is increased ionbeam instability as the water vapor content increases in the source ionizationchamber. Another consequence is the increased possibility of introduction of foreignmaterial which would influence the ionization process. The turret design promised theability to minimize and control these problems.

- 6 5 - AECL-11342
Turret Design
The most important consideration in designing the turret was that it not compromise ordegrade the current analytical capability. This dictated a number of the designdecisions. The materials used in the turret modification were to be the same as thoseused in the standard source configuration. This greatly reduced the possibility ofintroducing unknown effects, in the form of outgasing or reaction surfaces, into thesource region. Using the same materials also meant that the existing cleaning ordecontamination procedures did not change.
The 5-filament rotary design was chosen based on the fact that it was small enoughthat it could be inserted into the source region without a major source or vacuumenvelope modification. The rotary design was also the simplest to adapt to theexisting equipment. Additionally, the smaller size could be handled comfortably byoperators. Five analyses were considered to be the maximum for an operator toperform sequentially.
Compatibility with the existing equipment and the ability to interchange between theturret and the standard source with a minimum of effort was considered paramount.This capability gave us the flexibility to switch between the two configurations to easilyaccommodate any analytical or mechanical situation which might arise.
Testing
Normal protocol for analysis of unknown samples requires that known standards beanalyzed before, during and after a sample series. Until 1991, the standards usedwere the National Bureau of Standards (now NIST) certified uranium series. The initialtesting of the turret was done exclusively with the NBS standards during this period.The first test done was a systems calibration, which consisted of analyzing a set ofNBS standards with ratios ranging from 1000:1 to 1:1000 with approximately 18analyses being performed in a random order.
The performance of the turret was recorded along with the ratio value. All parameterswere then compared against historical performance values from the instrument or withthe certified standards values, lonization / transmission efficiency, fractionation, peakshapes, abundance sensitivity, signal intensity, memory, and reproducibility fromfilament to filament were among the parameters compared.
When initial comparison revealed no immediate observable deviations from standardconfiguration parameters, the turret was put into operation for sample analyses. Anaverage of 2 to 4 standards were run per week concurrently with samples. During thesecond year of testing a second turret was installed on a second single-stage NBS12-90. Testing of the second turret was similar to the first. During 1991 a set ofinternally normalized standards was obtained from the Institute for Reference Materialsand Measurements (formerly C.B.N.M). Since that time, the IRMM standards are usedalmost exclusively in CST-8.

- 6 6 - AECL-11342
Results
The evaluation of the results was broken into three critical areas; analyticalperformance, mechanical performance, and cost. A direct comparison betweenstandard configuration and turret configuration was done using the standardconfiguration performance as a baseline.
Analytical Performance
Rhenium
Peak shapeAbundance sensitivity185/187 ratioSignal intensity @ 2100°C (mass 187)
Turret Configuration
Identical to standard10% improvement0.02% (internal precision)2.6 - 3.0 Volts (standard)12.0-15.0 Volts (turret)
Uranium
lonization/Transmission efficiencyAbsolute fractionation (per mass)Temporal fractionation (at 60 min)Reproducibility (filament to filament)MemoryRuns per day
Standard
0.30%0.1810%>0.26%0.035%<1 in 106
4
Turret
0.30%0.2755%>0.04%0.017%
<1 in 106
7
Plutonium
lonization/Transmission efficiencyAbsolute fractionation (per mass)Temporal fractionation (at 60 min)Reproducibility (filament to filament)MemoryRuns per day
Standard
0.34%0.266%>0.07%0.037%
< 1 in 106
4
Turret
0.34%0.531%>0.04%0.035%
< 1 in 106
7
Mechanical Performance
The mechanical performance comparison examined sample throughput andmechanical operation. Sample throughput was based on five-sample series ofanalyses. Mechanical operations were limited to any operation which would affect theanalytical performance. The most important consideration was the effect of vacuumexposures to atmosphere. Compatibility to change between the two configurationswas also considered to see if any capability was lost.
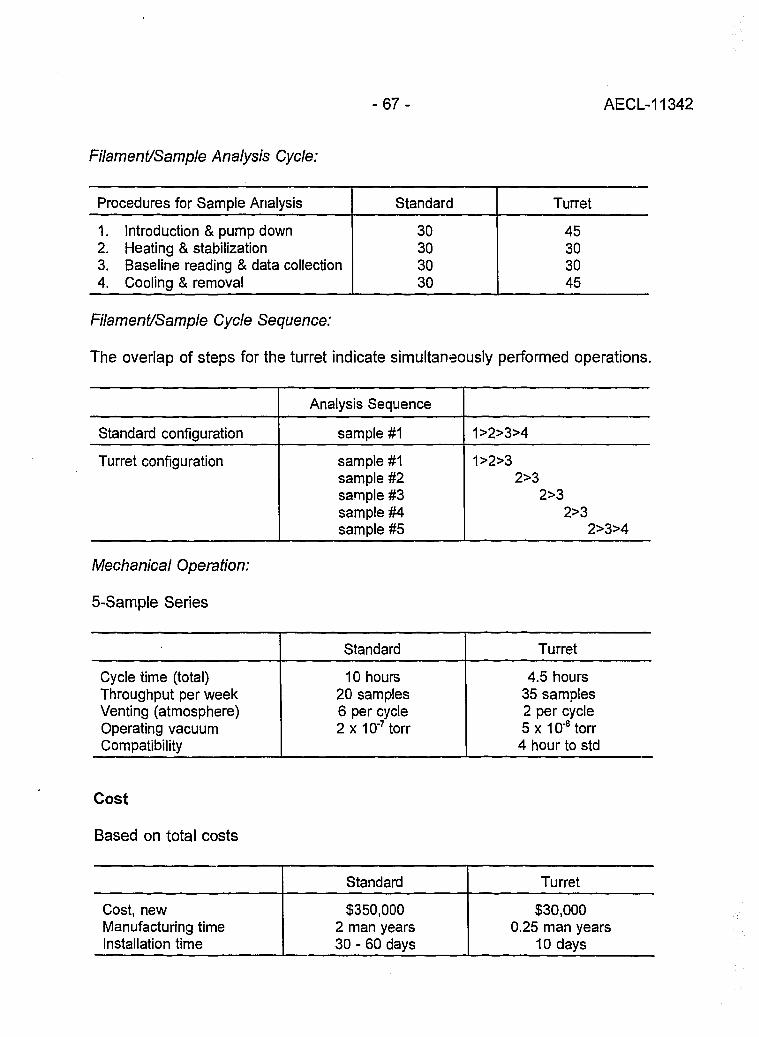
- 6 7 - AECL-11342
Filament/Sample Analysis Cycle:
Procedures for Sample Analysis
1. Introduction & pump down2. Heating & stabilization3. Baseline reading & data collection4. Cooling & removal
Standard
30303030
Turret
45303045
Filament/Sample Cycle Sequence:
The overlap of steps for the turret indicate simultaneously performed operations.
Cost
Based on total costs
Standard configuration
Turret configuration
Analysis Sequence
sample #1
sample #1sample #2sample #3sample #4sample #5
1>2>3>4
1>2>32>3
2>32>3
2>3>4
Mechanical Operation:
5-Sample Series
Cycle time (total)Throughput per weekVenting (atmosphere)Operating vacuumCompatibility
Standard
10 hours20 samples6 per cycle2x10"7torr
Turret
4.5 hours35 samples2 per cycle5x10"8torr
4 hour to std
Cost, newManufacturing timeInstallation time
Standard
$350,0002 man years30 - 60 days
Turret
$30,0000.25 man years
10 days

- 6 8 - AECL-11342
Conclusions
A comparison between the standard configuration and the turret configuration massspectrometer was done to examine any impact on current analytical capability. Thecomparison was based on the three most critical areas of concern, analyticalperformance, mechanical performance, and cost. The basic criteria for all three areaswas that no loss of current analytical capability occur.
The analytical performance tests indicate no apparent loss of capability and indicatesome advantages. An increase in signal intensity, a lowering of fractionation and betterfilament-to-filament precision are improvements and enhance current capability.
Mechanically the turret has two distinct advantages: (1) lower operating vacuum,consequently less scatter, and (2) an increase in sample throughput. The ability toquickly and easily change between the two configurations is also a distinct advantage.
The total cost of manufacturing and installing the turret modification is favorable whencompared to the cost of a mass spectrometer.
Overall the turret modified configuration is considered to have been successful. Since1991 four of the single sector spectrometers in CST-8 have had turrets installed. Datafrom these turrets have supported the initial testing data and have not revealed anyproblems or trends.

- 6 9 - AECL-11342
INDUCTIVELY COUPLED PLASMA AND GLOWDISCHARGE MASS SPECTROMETRY

- 7 0 - AECL-11342
High Accuracy Determination of Trace Elements in NIST Standard ReferenceMaterials by Isotope Dilution ICP-MS
Paul J. Paulsen and Ellyn S. BearyInorganic Analytical Research DivisionChemical Science and Technology LaboratoryNational Institute of Standards and Technology, Gaithersburg, MD, 20899
Introduction
Isotope dilution mass spectrometry (IDMS) has been used for the certification of StandardReference Materials (SRMs) at the National Institute of Standards and Technology (NIST)for more than 25 years. Since 1986, ICP-MS isotope dilution has had a dominant rolein the certification process. The new generation of ICP mass spectrometers is capableof ratio measurement precisions of about 0.1% rsd.
Optimization of Ratio Measurements
Accuracy in ICP-MS ID equal to the precision of ratio measurement requires attentionto the ion multiplier setup, calibration and use; mass bias drift correction; minimizationof memory from previous samples; and most critically, the removal of interferencescaused by molecular ions.
A generic plot for a continuous dynode multiplier in the ion count mode indicates aconstant gain versus input signal to 10s cps, but shows progressive loss in gain byinput signals of 106 and higher. Even in the pulse counting mode, when the gaindrops, counts will be lost due to the change in efficiency of the detector. In addition,counts are lost to detector deadtime (ion count overlap). Historically, we have usedthe Nd 144/145 ratio (approximately 3/1) over a range of count rates (concentrations)to assess the linearity of corrected data. Figure 1 shows the degree of match when 1,7 and 20 ns deadtimes are used. We select the deadtime that gives the mostconstant ratio across the count range. The maximum count rate is kept below 3 x10⁵ cps for the most accurate ID ratio measurements.
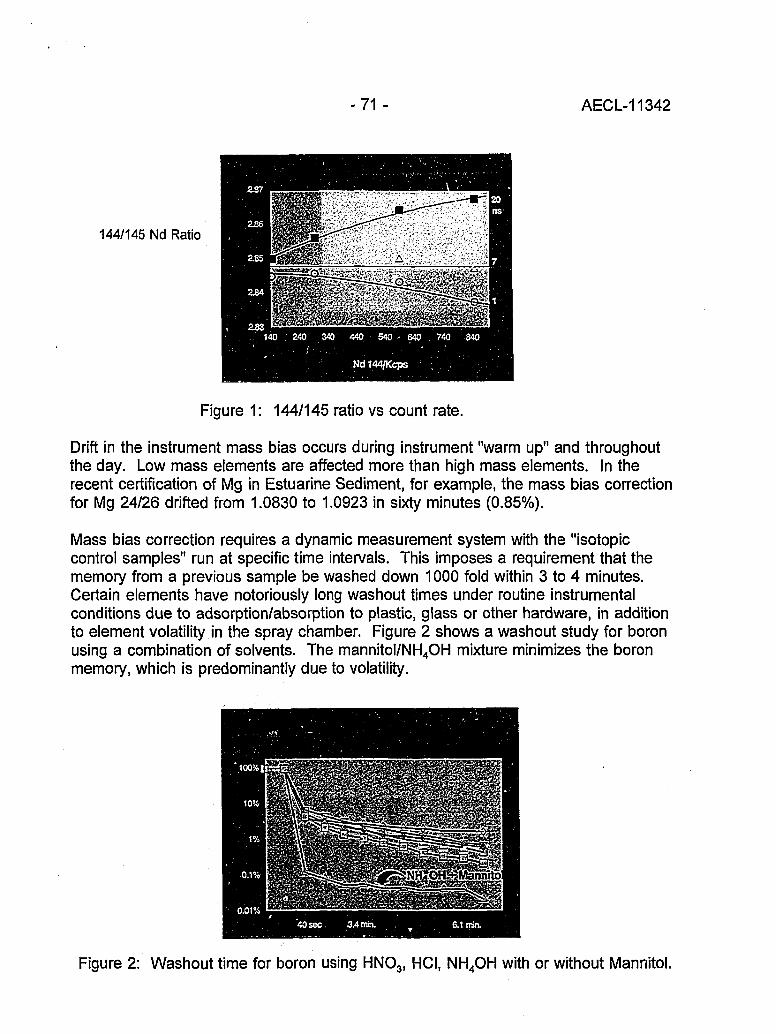
-71 - AECL-11342
144/145 Nd Ratio
Figure 1: 144/145 ratio vs count rate.
Drift in the instrument mass bias occurs during instrument "warm up" and throughoutthe day. Low mass elements are affected more than high mass elements. In therecent certification of Mg in Estuarine Sediment, for example, the mass bias correctionfor Mg 24/26 drifted from 1.0830 to 1.0923 in sixty minutes (0.85%).
Mass bias correction requires a dynamic measurement system with the "isotopiccontrol samples" run at specific time intervals. This imposes a requirement that thememory from a previous sample be washed down 1000 fold within 3 to 4 minutes.Certain elements have notoriously long washout times under routine instrumentalconditions due to adsorption/absorption to plastic, glass or other hardware, in additionto element volatility in the spray chamber. Figure 2 shows a washout study for boronusing a combination of solvents. The mannitol/NH4OH mixture minimizes the boronmemory, which is predominantly due to volatility.
Figure 2: Washout time for boron using HNO3, HCI, NH4OH with or without Mannitol.

- 7 2 - AECL-11342
Using a "natural" isotopic standard as a control to correct "spiked" samples for massbias, drift suffers from a second type of memory problem which applies to allelements. A "spiked" sample has an isotope ratio significantly different from "natural".For example, for indium determinations, a "natural" indium control would have 3 x10⁵ cps for 115ln, and 1.5 x 10⁴ cps for l13ln, while a properly spiked sample wouldhave 3 x 10s cps for both isotopes. The problem arises when measuring a naturalcontrol following a spiked sample where a 0.1% memory at 113ln would be 15 cps.This represents a memory washdown of 20,000 fold from the spiked sample. Ideally,the isotopic control sample should have the same ratio as the spiked samples. Forconvenience, we use a spike calibration solution as the analysis control. The value forthe control is determined by measuring a natural isotope ratio standard several times(to establish mass bias drift), followed by the isotopic control. This establishes theratio of the working standard used to correct for the mass bias drift for the remainingspike calibrations, samples and blanks.
Molecular ion interferences are potential problems for all elements except highconcentration elements and elements at low (Li, B, and Mg) and high mass (Hg, Tl,Pb, Th, and U). Natural materials, such as the current SRMs produced at NIST, aremost susceptible to these problems. Interferences exist if an element in an unspikedsample shows a different isotopic ratio than a reference solution containing only thatelement. The necessary chemical separations schemes for removing interferencescan be rapidly tested with a full element semiquantitative scan on the ICP-MS.ICP-MS has the advantage that only the source of interference needs to be removed.Therefore, separations are flexible and can be specially designed based on the matrixcomposition and the elements of interest. It is not necessary to isolate the analyte asrequired for thermal ionization mass spectrometry.
Analyses by ICP-MS ID
ICP-MS ID has been used in the certification of NIST SRMs for eight years. Asummary of materials analyzed and elements determined are shown in Table 1. Ofthese analyses more than half required chemical separations.
Tablet ICP-MS ID SRM Certifications
Elements
Matrix Types
ElementCertifications
B, Mg, Ti, Cr, Fe.Ni, Cu, Rb, Sr, Mn* Mo, Rh*. Pd, Ag, Cd, Sn, Ba, Nd, Pt,Hg, Pb, Tl, Th, U
Alloys, Autocatalysts, Blood, Cokes, Filters, Flours, Fly Ash, Glass, Leaves,Oils, Ores, Paint, Sediment, Serum, Soils, Tissues, Water
Material X Element
24
32
125
Mononuclidic, internal standard quantification

- 7 3 - AECL-11342
One example of an SRM certification requiring no chemical separations is boron, asinterferences are unlikely for low mass elements. Boron was determined in a numberof NIST leaf SRMs (Apple, Spinach, Tomato and Peach Leaves). Table 2 lists theresults from a recent certification of boron in SRM 1547, Peach Leaves. Because ofthe potential volatility problem during sample preparation, dissolution wasaccomplished in tall Teflon containers and harsh evaporations were avoided. The0.8% rsd is typical, and reflects the heterogeneity of boron in the leaf materialsanalyzed to date. Natural samples often display different levels of homogeneity fordifferent elements.
Table 2: Concentration of Boron in Peach Leaves, SRM 1547 ((jg/g)
29.46 29.31 29.19 29.64 29.79 29.31
Grand Avg. 29.45 |jg/g; 0.8% rsd
Chemical separations were required for the analysis of SRM 2711, Montana II Soil. Asemiquantitative analysis of this complex material confirmed the absence of only fourelements. All of the elements determined by ICP-MS suffered from molecular ioninterferences. Most, but not all, molecular ion interferences involve oxides generatedfrom lower mass elements at higher concentrations than the analyte. The Ag wasseparated from its interference, ZrO+, by electrodeposition of Ag from a dilute acidsolution. The Ni had interferences from oxides of both Ca and Ti. Potassium, Ca andAr oxides fall in the Mo mass region, and the double oxides, as well as Mo oxide,interfere with Cd. A two stage chromatographic separation was used to remove theseinterferences. Chelation chromatography efficiently separates the alkali/alkaline earthelements from the transition metals. In this scheme, Mo was eluted with diluteNH4OH, and the transition metals (including Ni and Cd) were stripped with diluteHNO3. Anion exchange chromatography was used remove the Ti and to separate theNi and Cd. All separated elements gave their true natural ratio indicating that allinterferences had been removed. The Ni, Cd, Mo, and Ag concentrations asdetermined by ICP-MS isotope dilution with chemical separations are shown in Table3. The certified values are based on a statistical combination of results from severaltechniques, according to NIST policy.
Table 3: ICP-MS ID and Certified Values for Ni, Cd, Mo, Ag in SRM 2711, soil
ICPMS
Certified
Ni
20.33 ± 0.06
20.6 ±1.1
Cd
41.74 ±
41.70 +
0.10
0.25
Mo
1.596 + 0.025
(1.6)
4.683
4.63
Ag
± 0.075
+ 0.39

- 7 4 - AECL-11342
Conclusions
ICP-MS ID has certified a wide range of elements in a variety of materials with highaccuracy and precision. Both the chemical preparation and instrumental proceduresare simplified over other ID mass spectrometric techniques. The ICP-MS haspicogram/mL detection limits for most elements using fixed operating parameters.Chemical separations are required only to remove an interference or to preconcentratethe analyte. Since both aspects of the analysis are not as restrained as traditionalmass spectrometry, their flexible integratior. results in high precision and accuracy,simplified chemical procedures, and lower blanks.
References
[1] J.D. Fassett and P.J. Paulsen, Anal. Chem. 61, 643A (1989).
[2] E.S. Beary and P.J. Paulsen, Anal. Chem. 65, 1602 (1993).
[3] Galileo Electro-optics Corp., Channeltron Electron Multiplier Handbook for MassSpectrometry Applications, Sturbridge, MA 01566.

- 7 5 - AECL-11342
/ • ' /
Multi-element Isotope Dilution Analyses Using ICP-MS
A.M. VolpeL-231, Lawrence Livermore National Lab, Livermore, CA 94550
Introduction
Since separated isotopes became commercially available nearly fifty years ago,isotope dilution (ID) mass spectroscopy has provided definitive chemical concentrationanalyses [1-3]. Compared with other standardization methods, ID achieves highanalytical sensitivity, precision and accuracy. It is a critical methodology for researchin biochemistry, nuclear physics and geochemistry. Traditionally, thermal ionizationmass spectroscopy dominated inorganic ID analysis. The emergence of plasmasource, quadrupole mass spectroscopy, ICP-MS, expands the application of isotopedilution methodology [4-6]. Versatile sample introduction, uniform degrees ofionization, and good precision isotope ratio data are key ICP-MS attributes.
Presently, thirty seven elements ranging from light elements (Li, B) through transitionmetals, noble, rare (REE) and heavy elements, to actinide and transuranic (Pu, Am,Cm) elements are measured by isotope dilution at LLNL. Projects range from geologicand hydrologic to biologic. The research goal is to measure accurately manyelements present in diverse matrices at low abundance (<ppb) using isotope dilutionmethods instead of ion intensity calibration and aqueous dilution. This paperdiscusses technical issues and benefits associated with multi-element ID-ICP massspectroscopic measurements.
Caveat
The success of multi-element isotope dilution ICP-MS depends on using massspectrometric techniques that require more instrument set-up and calibration thanroutine ion intensity calibration. Important parameters include detector linearity anddeadtime, mass resolution, mass bias, background, and data acquisition strategy.Thorough review is described elsewhere [7]. Also, available and affordable separatedisotopes are essential and can be the major drawback. Often ID-ICP-MS is used tomeasure very low element abundances (<ppb) in complex matrices such as salineocean water. In this instance, both separation chemistry and cleanroom facilities arenecessary. Clearly, isotope dilution will not supplant other ICP-MS standardizationmethods, nor should it. ID-ICP-MS fills an important niche in inorganic massspectrometry linking high precision mass spectrometry and bulk elemental analyses.
- 7 6 - AECL-11342
Advantages and Concerns
Major advantages of ID methods are accuracy, elimination of ion intensity calibrationinaccuracy due to matrix effects and drift, and quantitation for samples that requirechemical processing. Chemical pre-concentration removes interfering matrices andimproves method detection levels. Isotope dilution reduces the need to quantifychemical yield. Accuracy of ID-ICP-MS methods depends on tracer isotopecalibration, tracer-sample isotopic equilibration, and appropriate background, isobaric,and mass bias corrections. Propagation of isotope ratio error due to improper tracerisotope addition is a major concern with multi-element analyses when abundancesvary widely. Optimization of the amount of tracer isotope requires estimating elementabundance in the sample.
Mass Bias
Isotope ratios measured with ICP-MS deviate from absolute values. Mass bias varieswith instrument type, operating conditions and element analyzed. In general, heavierisotopes are preferentially transmitted to the analyzer. Mass bias is due to plasma gasdynamics and sampling interface space charge effects [8]. Unlike thermal ionizationmass fractionation, ICP-MS mass bias is time independent, provided gas dynamicsand electronic settings are stable, and similar to precision of replicate measurements(<1-2 %/amu). Yet, for multi-element ID-ICP-MS, mass bias uncertainty can be asignificant source of inaccuracy [9]. Figure 1 shows mass bias for solutions withknown isotope abundance that were measured with the ICP-MS optimized for indium.Mass bias for multi-elements varies about 6% from preferential light isotope (i.e., Cu)to heavy isotope (Rb) bias.
Mass bias correction is possible during ICP-MS measurements using external orinternal normalization. Mass bias can be determined using standards with knownisotope abundance, such as NIST SRM's including the uranium isotopic standards. Anexample of routine mass bias determination and correction for U isotopes is shown inFigure 2. Here, mass bias during the analysis period is measured repeatedly usingNIST U-500 standard. Mass bias corrected ratios for another standard, NIST U-005validate accuracy of the approach (Figure 2).
Other correction methods include 1) internal normalization using two isotopes forelements having three or more stable isotopes (i.e., Zn, Ba), 2) internal normalizationusing double spiking techniques, and 3) internal normalization using a surrogateelement with similar mass (i.e., Ga for Zn, and Tl for Pb). The latter correction can bemisleading for quadrupole ICP-MS given mass bias results shown in Figure 1.

- 7 7 - AECL-11342
0.03
< 0.02 •
£ 0.01 •
I 0.00
T! -°-0 1
OT -0.03o
-0.04
Cr f
Eu Re
T
i B Ni
#Go
Ag
•Cen
• NdQ..
D
*
Er
i
- • -
11
U
Pb
I Sr
• Rb
Gd
50 100 150 200
Atomic Weight
250
Figure 1: Mass bias for solutions with known isotope abundance; • , NIST SRM;D, ORNL isotopes.
COtoCM
<N
0.00540
0.00530
0.00520
0.00510
0.00500
0.00490
0.00480
0.00470
0.00460
0.00450
T
. - I ,„ T(.. ^! . i
J J A
I
r-Jfll1 *'i i * •*•
.. .
S 0rfonth •
Certified Value+ / - 2%^
• V I
Error «
i'.j.IV
9 95% CL
N D J F M A
- 1993/1994M
Figure 2: Yearly data for NIST uranium isotope standard, U-005. Data are correctedfor mass bias using NIST U-500 measurements.

- 7 8 - AECL-11342
Applications
Though ID-ICP-MS plays a significant role in many fields, the clearest applicationsdemonstrating the strength of the method are in marine chemistry (see [10] for review).Nearly fifty elements of interest are present at extremely low concentration, less thanpart-per-billion, in a saline matrix dominated by eleven elements. All saline watermeasurement techniques, AAS to TIMS, require pre-concentration and separationchemistry. The advantages of ID-ICP-MS compared with other techniques areprecision, accuracy, method sensitivity, sample throughput and multi-elementversatility.
We are pursuing active research studies using trace element and isotopecharacterization in various hydrologic and coastal ocean projects. Recently wedeveloped a technique for separating and measuring simultaneously eight rare earthelements (REE) in natural waters using ID-ICP-MS [11]. Typically, REE in open oceanwaters are less than one part-per-trillion. Results for triplicate measurement of salinewaters shown in Figure 3 are similar to data using instrumental neutron activationanalyses (INAA) and ID-TIMS. Precisions for REE abundances between 0.1-1.7 pg/gare 2-10% RSD.
©
T3Cox:oo
~§ 10"*Eo
CO
i Kauai 10m seawater
. .. ,. N. Pacific OceonIndian oceon deBaar et ai.. 1935
Bertram & Elderfield. 1993 {&£ '; ID-TIMS
La Ce Nd Sm Eu Gd Er YbElement
Figure 3: Triplicate REE measurement of N. Pacific seawater compared withID-TIMS and INAA.

- 7 9 - AECL-11342
References
[1] M.G. Ingrahm, Ann. Rev. Nuclear Sci. 4, 81 (1954).
[2] K.G. Heumann, in Inorganic Mass Spectrometry, edited by F. Adams, R.Giijbels and R. Van Grieken, Chemical Analysis Series, 95, 301 (1988).
[3] J.D. Fassett and P.J. Paulsen, Anal. Chem., 61, 643A (1989).
[4] D. Beauchemin, J.W. McLaren, A.P. Mykytiuk and S.S. Berman, Anal. Chem.59,778(1987).
[5] J.R. Garbarino and H.E. Taylor, Anal Chem., 59, 1568 (1987).
[6] A.A. Van Heuzen, T. Hockstra and B. Van Wingerden, J. Anal. At. Spectrom., 4,483 (1989).
[7] G.P. Russ, in Applications of Inductively Coupled Plasma Mass Spectrometry,edited by A.R. Date and A.L. Gray, 90 (1989).
[8] G.R. Gillson et al., Anal. Chem., 60, 1472 (1988).
[9] H.P. Longerich, At. Spectrosc, 10, 112 (1989).
[10] J.W. McLaren et al., Fresenius Z. Anal. Chem, 337, 721 (1990).
[11] B. K. Esser, A.M. Volpe, J.M. Kenneally and D.K. Smith, Anal. Chem., 66, 1736(1994).

- 8 0 - AECL-11342
ICP Magnetic Sector Multiple Collector Mass Spectrometry and the PreciseMeasurement of Isotopic Compositions using Nebulization of Solutions and
Laser Ablation of Solids
A.N. Halliday, D.-C. Lee, J.N. Chrjstensen, W. Yi, CM. Hall, C.E. Jones andDAH. Teagle -/•>"•/6 ^ (-;i^Department of Geological Sciences, University of Michigan, Ann Arbor, Ml 48109,U.S.A.
/V' A.J. WalderFisons Elemental, Winsford, Cheshire, U.K.
,.]•; P.A. FreedmanFisons Instruments, VG Isotech, Middlewich, Cheshire, U.K.
Introduction
Inductively-coupled plasma (ICP) sources offer considerable advantages over thermalsources because the high ionization efficiency facilitates relatively high sensitivitymeasurements for elements such as Hf or Sn, which can be difficult to measure athigh precision with thermal ionization mass spectrometry (TIMS). The massdiscrimination (bias) is larger than for thermal ionization (typically about a percent pera.m.u. for Pb), favors the heavier ions and decreases in magnitude with increasingmass. However, in contrast to TIMS, this discrimination is largely independent of thechemical or physical properties of the element or the duration of the analysis. Thishas been demonstrated to high precision with a double focusing multiple collectormagnetic sector mass spectrometer with an ICP source. This instrument is describedbelow, together with its potential for high precision isotopic measurements of a verybroad range of elements using solution aspiration or laser ablation.
ICP Mass Spectrometry
Plasma source mass spectrometry has seen a bigger increase in utilization andtechnique development over the past few years than any other area of massspectrometry [1-4]. Most inductively-coupled plasma mass spectrometry (ICPMS)developments have utilized quadrupole mass spectrometers. In general, ICPMS hasbeen used to obtain semi-quantitative to quantitative concentration data, particularly forthose trace elements that are difficult to determine by other methods. Relatively littleuse has been made of ICPMS to obtain isotopic compositions, because it is difficult toacquire high precision isotopic data with the peak shapes generally encountered withquadrupole instruments [5]. Indeed, most isotopic work that has been performed byquadrupole ICPMS [6,8] can be performed to superior precision using magnetic sectorthermal ionization mass spectrometry (TIMS).

- 8 1 - AECL-11342
ICP Magnetic Sector Multiple Collector Mass Spectrometry
The ICP magnetic sector multiple collector mass spectrometer (Fisons Plasma 54) is ahigh precision double focusing instrument with extended geometry in which theinstability of the plasma is circumvented by using simultaneous static multiplecollection [9]. The plasma source utilizes Ar as the support gas, in a similar manner tothat commonly deployed in conventional quadrupole ICPMS. The ions are extractedat high voltage and a quadrupole d.c. lens is used to focus the ion beam profile ontothe analyzer entrance slit. An electrostatic analyzer is used to match the energydispersion of the piasma source with that of the magnetic sector analyzer. Theinstrument has a mass resolution of > 400. The magnet provides double dispersionwith effective 54 cm extended geometry and z focusing. The exit pole face isadjustable to rotate the exiting ion beams and produce an ion image perpendicular tothe optic axis. The collector assembly can provide flat topped peaks for thesimultaneous detection of up to nine masses using eight independently adjustableFaraday collectors and a fixtrl axial Faraday collector that can be lowered to allow theion beam access to a Daly detector with pulse counting. The Plasma 54 has a highertransmission efficiency than most quadrupole instruments (> 100 x 106 ions sec"1 ppm"1
indium using conventional aspiration methods). Recently a new wide flight tube andmagnet with an additional Faraday detector located on the high mass side have beendeveloped and commissioned. This can be used to detect U at the same time as Pbis measured using the main collector array (or 7Li at the same time as 6Li) [10]. Thisfacilitates simultaneous U-Pb measurements for spatial resolution work.
The standard method of sample admission utilizes a peristaltic pump to deliverdissolved samples to a pneumatic nebulizer. The nebulizer converts the solution intoan aerosol which is then passed into the plasma source where it is desolvated,dissociated and ionized. The minimum solution volume required is about 1 ml_. AMistral desolvating higher efficiency nebulizer can be incorporated in the plasmasource resulting in significant (factor of 10) increases in signal size [11]. Whereas bythermal ionization it is difficult to obtain high precision concentration and/or isotopicdata for certain elements such as Sn, Hf, W, Pt and Ir, simply because they aredifficult to ionize, high precision (<0.002% RSD) is achievable with 300 ng of Hf [11]using the Plasma 54. The design is currently being modified to increase thetransmission by a factor of >10.
The mass discrimination or "bias" in the source of the Plasma 54 is a relatively simplefunction of mass. For many applications, an exponential law provides the closestapproximation at very high precision. Unlike the case for a thermal source, this bias isindependent of time, the chemical properties of the element, or the admixing of otherelements [6,9,12]. This significant feature of this kind of mass spectrometer contrastswith thermal ionization mass spectrometry in which mass discrimination is a function ofwork function and in some instances, poorly understood reactions that occur on the

- 8 2 - AECL-11342
filament during heating. Thus, using a solution containing a mixture of elements withoverlapping mass ranges, the mass discrimination observed in an element of knownisotopic composition can be used to determine accurately the unknown isotopiccomposition of the other element. The implications of this are far reaching. Normalisotopic compositions, natural fractionations, natural isotopic anomalies and artificialisotopic enrichments can be measured to higher precision. Elements such as Pb, theisotopic compositions of which cannot be normalized with internal normalization, canbe corrected for mass discrimination to high levels of accuracy by admixing a standardsuch as Tl of known isotopic composition and monitoring masses 205TI and 203TI.Isobaric interferences such as 87Rb on 87Sr, 144Sm on 144Nd or 176Lu on 176Hf can becorrected for to higher degrees of accuracy than has hitherto been possible. The Pb,Hf and Nd data generated so far [12] demonstrate a remarkable performance andopen the way for isotopic studies in which the elements of interest cannot beseparated from other isobarically interfering elements, as in laser ablation Sr and Hfisotopic analyses.
Laser Ablation
A Nd-YAG laser has been coupled with a Plasma 54 and the number of Pb ionsdetected per number of Pb atoms ablated in NIST SRM 610 glass was shown to be 1in 450 [13]. Direct micro sampling isotopic analysis for Pb, Sr and Hf in complexmatrices is relatively straightforward. Molecular isobaric interferences are usuallynegligible, since the use of laser ablation and hence a dry plasma (rather thanaqueous aspiration techniques) reduces oxide and hydride formation. Doubly chargedspecies of elements at high concentration and low second ionization potential cancomplicate the mass spectra. For example, laser ablation Sr isotopic measurementssometimes require careful correction for doubly-charged rare earth elements whenanalyzing rare earth rich phases. These features contrast with secondary ionizationmass spectrometry (SIMS) which requires very high mass resolution in order toseparate complex molecular interfering species [14.15].
Applications
It is already apparent that this instrument offers considerable potential for new andimproved isotopic and trace element measurements. The rapid measurement ofprecise isotopic compositions is likely to have widespread application in the nuclearindustry, in making large numbers of environmental measurements and in lifesciences. In the earth sciences the instrument offers greater accuracy for Pb isotopicdata, Rb/Sr ratios, U-Th disequilibrium data and Hf isotopic compositions. Certainisotopic anomalies in meteorites could be measured more precisely. New, challengingchronometers with long half-life and difficult isobaric interferences may be feasible.High precision isotope dilution trace element data for the platinum group elements,high field strength elements and transition metals will be relatively straightforward.

- 8 3 - AECL-11342
Laser ablation in situ measurements of Sr, Hf and Pb isotopic compositions, togetherwith U-Pb ages of accessory minerals can be made. Finally, measurements of naturalisotopic fractionation of low mass elements such as Li, B and Cl should be possiblebut have yet to be evaluated.
References
[1] A.R. Date and A.L. Gray, Applications of Inductively Coupled Plasma MassSpectrometry, Blackie and Sons, Glasgow (1988).
[2] R.S. Houk and J.J. Thompson, Mass Spectrometry Reviews 7, 425 (1988).
[3] K.E. Jarvis, A.L. Gray, and R.S. Houk, Handbook of Inductively CoupledPlasma Mass Spectrometry, Glasgow and London (1992).
[4] D.W. Koppenaal, Anal. Chem. 64, 320R (1992).
[5] M.E. Ketterer, M.J. Peters and P.J. Tisdale, J. Anal. At. Spectrom. 6, 439(1991).
[6] G.P. Russ and J.M. Bazan, Spectrochim. Acta 42B, 49 (1987).
[7] G.R. Gillson, D.J. Douglas, J.E. Fulford, K.W. Hallidan and S.D. Tanner, Anal.Chem. 60X, 1472 (1988).
[8] D.C. Gregoire, Anal. Chem. 62, 141 (1990).
[9] A.J. Walder and P.A. Freedman, J. Anal. Atomic Spect. 7, 571 (1992).
[10] A.N. Halliday, J.N. Christensen, C.E. Jones, A.J. Walder and P.A. Freedman,Trans. Amer. Geophys. Un. 74, 626 (1993).
[11] A.J. Walder, D. Koller, N.M. Reed, R.C. Hutton and P.A. Freedman, J. Anal. At.Spectrom. 8, 1037 (1993).
[12] A.J. Walder, I. Platzner and P.A. Freedman, J. Anal. At. Spectrom. 8, 19(1993).
[13] A.J. Walder, I.D. Abell, P.A. Freedman, and I. Platzner, Spectrochim Acta 48B,397 (1993).
[14] W. Compston, l.S. Williams and S.W. Clemens, Abstr. 30th Ann. Conf. Am.Assoc. Mass Spectrometry, 593 (1982).
[15] N. Shimizu and S.R. Hart, Ann. Rev. Earth Planet. Sci. 10, 483 (1982).

J,-
- 8 4 - AECL-11342
Application of Glow Discharge Mass Spectrometryto the Measurement of Isotope Ratios
t L. R. Riciputi, D. C. Duckworth, C. M. Barshick, and D. H. SmithChemical and Analytical Sciences, Oak Ridge National Laboratory, Oak Ridge, TN37831
In 1991, Donohue and Petek reported measurements of palladium isotopic ratios usingglow discharge mass spectrometry (GDMS) [1]. With essentially no samplepreparation, they obtained relative standard deviations of ±0.03% (1 a) for the majorpeaks. This early experiment provided the inspiration to explore more thoroughly thecapability of GDMS to measure isotope ratios. GDMS is appealing for a number ofreasons, especially when contrasted with conventional isotope ratio measurementsand the time-intensive sample preparation often required. GDMS can analyze mostsolid samples, including those of complex matrix, directly, with no dissolution required.We have analyzed soil in this manner, for example [2].
All of the work reported here was done using a VG-9000 sector mass spectrometer. Itis equipped with both Faraday cup and Daly detectors, providing a dynamic range of109. Argon was the support gas for the discharge. Pressure in the cell was estimatedto be 100-250 Pa; the dc discharge was operated at about 2 milliamps and 1 kV.
Many questions had to be addressed in evaluating GDMS for isotope ratiomeasurements. Among these were:
What is the magnitude of the bias?Does bias vary with mass? With matrix? With glow discharge parameters?Are ratios stable with time? What is internal and external precision? How doesprecision vary with concentration?
To address these and other questions, we analyzed B, Cu, Sr, Ag, Sb, Re, and Pb,using NIST standards where available. Table 1 summarizes the materials used.
Pin electrodes of pure lead and copper were analyzed to evaluate the temporalstability of their measured isotopic ratios. The results are presented graphically inFigures 1 and 2. Aside from the almost monotonic variation in the copper ratio,precision for all ratios except ^Pb /^Pb was ±0.03%; precision for the 204Pb/208Pb was±0.08% @ 1 o , The poorer precision is to be expected because of the relatively lowabundance of 204Pb (204Pb/208Pb = 0.05904). The variation of "Cu/^Cu with time(Figure 1) clearly demanded investigation.

- 8 5 - AECL-11342
Table 1: Materials used for GDMS Isotope Analysis
Element
Cu
Sr
Re
Ag
B
Sb
Material
solid stock Cusolid stock brass
pressed Cu powder
NIST 9987; Sr carbonate
NIST 989; Re ribbon
NIST 981solid Cu
NIST 951, boric acid
solid Cu
Amount (wt%)
100%65%100%
5% and 0.75% in Ag1% in cu powder
100%, wrapped on Pt wire
100%15 ppm, unknown isotope ratio
2.8 wt% in Ag
15 ppm, assumed natural ratio
Investigation revealed that variation in current and voltage could not explain theobserved variation. When the pressure of argon was varied, however, a pronouncedeffect on the ratio was observed, as illustrated in Figure 3. For pressures in thesource region ranging 1.5 - 8.0 x 10'2 Pa, the measured value for ^Cu/^Cu changedfrom 0.451 to 0.455, a difference of about 1%. It is thus clear that carefulmaintenance of constant argon pressure is important in obtaining reproducible results.
The reason for this pressure dependence is not obvious, but one can speculate thatvarying the pressure in the cell alters the shape of the discharge, which in turn effectschanges in the ion population sampled by the mass spectrometer. As is well knownfrom thermal ionization mass spectrometry, even small shifts in the locus of ionformation change isotopic bias.
Isotopic bias for elements virtually spanning the periodic table (boron to lead) showedno discernible trend, as shown in Figure 4. No trend with respect to ionizationpotential was observed, either (Figure 5). These observations are consistent withGDMS's known relatively uniform response to all elements. We speculate that this isdue in part to the separation of the atomization and ionization steps both temporallyand spatially.
As expected, precision deteriorated with declining abundance. For elementalconcentrations of greater than 0.5 weight percent, external precision for major isotopicratios was usually better than ±1%. In no case was precision better than ±0.03%

- 8 6 - AECL-11342
obtained, and in no case did precision reach the limits imposed by counting statistics.These two observations strongly suggest that there is room for improved performance.Our first efforts to realize this will be to regulate the argon pressure more strictly. Anyfluctuation in ion beam intensity always has a negative effect on precision. Having amulti-collector system to provide simultaneous monitoring of all isotopes wouldobviously be highly desirable, but, alas, multi-collectors are not possible on aninstrument of Nier-Johnson geometry. Table 2 summarizes our isotopicmeasurements.
Table 2: Summary of Isotopic Measurements
Element
Cu
Sr
Re
Ag
Pb
Pb
B
Detector
F
F
F
F
F
D
F
Material
Solid CuBrass
Pressed Cu
5% NIST987 in Ag
NIST 989onPt
7.5%NIST978 in Cu
SolidNIST 981
15 ppm insolid Cu
2.8%NIST951 in Ag
Ratio
65/63
87/8688/86
185/187
107/109
208/206207/206204/206
208/206207/206204/206
10/11
Average
0.45320.44790.4495
0.71588.4274
0.5980
1.0689
2.17290.91590.0588
2.08180.84730.0545
0.2455
rsd
0.030.030.06
0.210.09
0.15
0.06
0.030.030.08
1.032.583.00
0.06
AcceptedValue
0.4456
0.710348.37861
1.07638
2.16810.914640.5904
Bias
+0.85%+0.52%+0.43%
+0.77%+0.29%
+0.05%
+0.34%
+0.11%+0.14%+0.17%
unknown
0.2473 +0.73%
F, Faraday Cup; D, Daly detector
We have exploited GDMS's ability to measure isotope ratios in a practical application.One of our jobs is to provide mass spectrometric support for ORNL's IsotopeEnrichment Program. A sample of enriched 68Zn required analysis; zinc has a highionization potential (9.4 eV) and is quite volatile (m.p 420°C), making it a likelycandidate for GDMS. Only 1 mg was available for analysis; the sample was loaded bypressing it in the end of an indium pin. The results we obtained are given in Table 3.

- 8 7 - AECL-11342
Table 3: Isotopic Composition of 68Zn Sample
Isotope
Atom%
sd
64
0.148
0.003
66
0.140
0.002
67
0.067
0.002
68
99.637
0.004
70
0.007
0.001
At this time it is clear that daily calibration of the instrument will be required to obtainthe best precision available. The results suggest that the concept of a bias correctionper mass is not applicable; specific bias corrections for each measured ratio will berequired. While isotope ratio measurements using GDMS pose no threat to thermalionization with respect to ultimate precision or, at the other end of the spectrum,sample size, there is a niche for a technique that offers good precision and requireslittle sample preparation. In addition to our specialized requirement for stable isotopes,applications in the areas of waste remediation and in those where rapid screening ofsamples is desirable are two obvious places of potential utility.
Acknowledgement
Research sponsored by the U.S. Department of Energy, Office of Basic EnergySciences, under Contract DE-AC05-84OR21400 with Martin Marietta Energy Systems,Inc.
References
[1] D. L. Donohue and M. Petek, Anal. Chem. 63, 740 (1991).
[2] D. C. Duckworth, C. M. Barshick, and D. H. Smith, J. Anal. Atom. Spectrom. 8,875 (1993).

AECL-11342
£ DMt
AM
' • • • •
-
•
•
Fig. 1 : Cu Isotope measurements^ P!
• • • • 4 . 4
' « • • » • • • * • •
Solid Cu Pin(1-29-93)
X AM—«^^-PU
TT
j :
Pressed Cu Powder(5-3-93)
(M51
04SS
• * •
g 0453
04SS
Fig. 3: Pressure vs Cu Isotope ratio
Fig. 2: Pb isotope measurements
£ 219
~t 2.18
2.17
2.16
0.920i
0.918
i- 0.916
0.914
0.0600
jQ 0.05S5a.
AcceptedValue
2-3
2-3
AcceptedValue
0.0590
0.0565
0.0580
Acceptedf^f--"'f"-+- x ^ + ^ Value
2-3
1 2 3 4 5 6 7 8 9
mA
A
A
ti
03 04 03 0e 0.7 0J
Prwjtin (ton)
Fig. 4: Mass blaa vs mass
100 -
D OalyDatactor• Faraday
•
o o n
Light
Rs" • •
Sb°
O 0MyDMctcr
/\Q • •
D Sr
• •
D •Findiy Drtsctor
• • • • •
-05 0Mass Bias (%)
•a
I1
lonl
zi
93
g
M
t
73
7
U
e
S3
3
Fig. 5: Mass bias vs ionization potential
o Daly Detector" • Faraday
•
-
ooo o o
Light
B»
o Sr • •
Heavy
MasaBias(%)

- 8 9 - AECL-11342
GASES
- 9 0 - AECL-11342
Unconventional Stable Isotope Mass Spectrometry of Fe, Pt and Wvia Gas Source Mass Spectrometry
P.D.P. Taylor, S. Valkiers, and P. De Bievre, Institute for Reference Materials andMeasurements, Commission of the European Communities-JRC, Geel (Belgium)
U. Flegel and Th. Kruck, University Kbln, Institut Anorganische Chemie, Greinstrasse6, Ko ln ( G e r m a n y ) <. i :;:•<•, ( -• •;-<"] f ( ;' N
;
Introduction
Since the 1950's, there has been a burst in the research in and application of isotopemass spectrometry (MS) for elements such as C, N, O, S and H. Such measurementshave been used to unravel processes in many different areas ranging from medicineto environment, climatology and hydrology. Gas source mass spectrometry hasplayed an important role in this evolution, as it enables researchers to detect muchsmaller isotopic effects (down to fractions of permils) than is possible with solid sourcemass spectrometry.
Obviously, this approach can only be used for elements which have volatilecompounds. For other elements (e.g., Fe), isotopic measurements can only be doneusing solid source MS (thermal ionisation, GDMS) or ICP-MS. Consequently, in thesecases it is often difficult or impossible to measure small isotopic effects. Especially foriron, which is an element for which natural isotopic fractionation could be expected(multiple redox stages, biologically active) and has been observed on one occasion [1],gas source mass spectrometry is an approach which merits investigation, particularlyas Fe is difficult to measure using TIMS or ICP-MS. Recently, Taylor et al. [2]demonstrated the feasibility of using a volatile tri-fluorophosphane compound Fe(PF3)5
to be used for gas source MS.
As a follow-up of this work, new data will be presented for iron, platinum and tungsten.
Theoretical
As far back as the fifties and sixties, inorganic chemists were interested in thecoordination of zero-valent metals, and studied the properties of these M°Ln complexesfor purely theoretical reasons. It was at this time that Kruck et al. described thesynthesis of some transition metal complexes with PF3 ligands [3]. Virtually all ofthese compounds show significantly enhanced volatility. They are produced usinghigh pressure/high temperature reactions (e.g. 200 bar / 200°). As most of thesecompounds are not available commercially, they were synthesised for this study at the

- 9 1 - AECL-11342
University of Koln. Apart from their volatility, the tri-fluorophosphane compounds alsohave an interesting property from a mass spectrometrist's point of view: both P and Fare mono-isotopic. The Fe(PF3)5 forms orange crystals and sublimes at 22°C (atatmospheric pressure), whereas the Pt(PF3)4 is a colourless liquid, which thermallydecomposes at 50°C.
Although the classic synthesis routes for these products were developed forpreparative reasons, typically for 10 g of product, down-scaling for 10 to100 mg levelsis currently being investigated.
Experimental
A Finnigan-MAT 271 magnetic sector spectrometer was used, with a single Faradaycup detector [4]. The gas was expanded to 1.8 L, and introduced by molecular flowthrough a gold membrane with fifteen 20 urn pinholes. About 50 ug of sample isconsumed per run. The operating conditions for the various samples analysed aregiven in Table 1.
Table 1: Operating Conditions for the Finnigan-MAT 271 Mass Spectrometer
metal
Fe
Pt
W
compound
Fe(PF3)5
Pt(PF3)4
WF6
speciesmeasured
Fe+, Fe(PF3)+
Pt+
WF2+
electron E(eV)
90
85
90
T of vessel(°C)
110
27
150
T ampoule atinlet (°C)
70
27
27
Inlet P(mbar)
0.02
0.01
0.009
An aliquot of sample (typically 10 mg) was weighed into a monel ampoule, andsubsequently connected to the gas inlet system. This manipulation was carried out ina glovebox, under a dry nitrogen atmosphere, as these compounds hydrolyse. Thesample was cooled (-20°C), connected to the inlet system and the nitrogen waspumped off over a period of 10 minutes. The relative occurence of the differentspecies and a check for isobaric overlaps was carried out using a Balzers QMG 400quadrupole MS. For each sample, at least 4 independent gas introductions weremade. Each time, magnetic field calibration was carried out, and the isotopeabundance ratios were measured over a period of about 1 hour (including baselinemeasurement). The isotope abundance ratios at the time of gas introduction (t=0)were calculated by an extrapolation procedure. This procedure is similar to the oneused for the silicon isotope abundance ratio meaurements on SiF4, which is used atIRMM in the framework of the redetermination of the Avogadro constant. It has beendemonstrated (e.g., for noble gases, O, C and N) that this procedure results in "near-absolute" isotope abundance ratios at the 10"4 level, without the use of syntheticisotope mixtures [4].
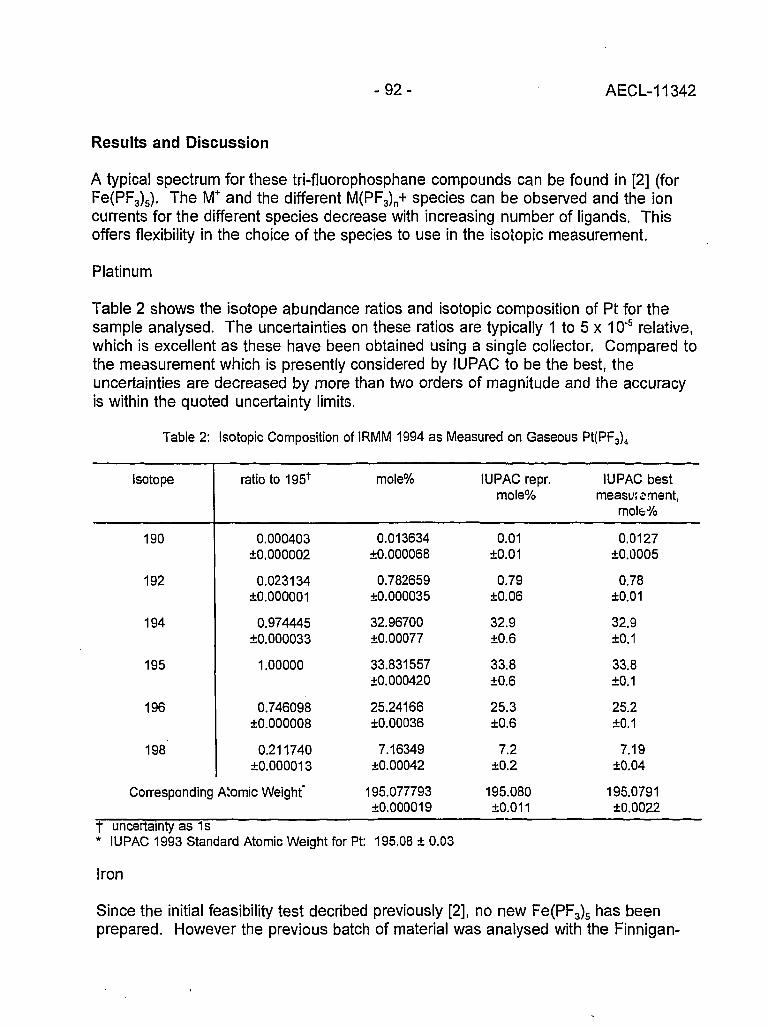
- 9 2 - AECL-11342
Results and Discussion
A typical spectrum for these tri-fluorophosphane compounds can be found in [2] (forFe(PF3)5). The M+ and the different M(PF3)n+ species can be observed and the ioncurrents for the different species decrease with increasing number of ligands. Thisoffers flexibility in the choice of the species to use in the isotopic measurement.
Platinum
Table 2 shows the isotope abundance ratios and isotopic composition of Pt for thesample analysed. The uncertainties on these ratios are typically 1 to 5 x 10'5 relative,which is excellent as these have been obtained using a single collector. Compared tothe measurement which is presently considered by IUPAC to be the best, theuncertainties are decreased by more than two orders of magnitude and the accuracyis within the quoted uncertainty limits.
Table 2: Isotopic Composition of IRMM 1994 as Measured on Gaseous
Isotope
190
192
194
195
196
198
ratio to 195f
0.000403±0.000002
0.023134±0.000001
0.974445±0.000033
1.00000
0.746098+0.000008
0.211740±0.000013
mole%
0.013634±0.000068
0.782659±0.000035
32.96700±0.00077
33.831557±0.000420
25.24166±0.00036
7.16349±0.00042
IUPAC repr.mole%
0.01±0.01
0.79±0.06
32.9±0.6
33.8±0.6
25.3±0.6
7.2±0.2
IUPAC bestmeasuie merit,
molfe%
0.0127±0.0005
0.78±0.01
32.9±0.1
33.8±0.1
25.2±0.1
7.19±0.04
Corresponding Atomic Weight* 195.077793±0.000019
195.080±0.011
195.0791±0.0022
t uncertainty as 1s* IUPAC 1993 Standard Atomic Weight for Pt: 195.08 ± 0.03
Iron
Since the initial feasibility test decribed previously [2], no new Fe(PF3)5 has beenprepared. However the previous batch of material was analysed with the Finnigan-

- 9 3 - AECL-11342
MAT 271. As can be seen in Table 3, the uncertainty on the 54Fe/S6Fe is comparableto the uncertainties obtained for Pt and W, but the previously reported isobaric overlapfor 57Fe and 58Fe remains. No effort has been directed towards the study of thisphenomenon, as the intention is to prepare Fe(PF3)5 using a novel down-scaledsynthesis route.
Table 3: Measurement of Iron Isotope Abundance Ratios on Fe(PF3)5
Measurement
A (n=6)-
B (n=4) t
IRMM 1992*
"Fe/^Fe
0.063489±0.000043
0,633509±0.000036
0.06370±0.00027
"Fe/^Fe
0.024211±0.000090
0.0270344±0.0000032
0.023096±0.000072
58Fe/56Fe
0.003150±0.000005
0.003691±0.000028
0.003071±0.000029
Species
Fe+
Fe(PF3)+ '
Fe+
all uncertainties as 1s• measured Jan. 93, on Varian CH5; material synthesized in Nov. 92t measured Apr. 94, on MAT 271; material synthesized in Nov. 92i measured fcv TIMS
Tungsten
Table 4 shows the isotope abundance ratios and isotopic composition of W for thesample analysed. The uncertainties on these ratios are comparable to those of Pt.Compared to ILJPAC's best measurement, uncertainties have been decreased byapproximately an order of magnitude, but the abundance value for the minor isotopediffers significantly.
Conclusions and Future Work
• tri-fluorophosphane complexes of transition metals (i.e. Fe, Pt) enable themeasurement of the isotopic composition of these elements using gas source IMS.For Fe, both 57Fe and 58Fe suffer from isobaric overlap; this needs to be studied inmore detail.
• miniaturised synthesis routes need to be developed for analytical purposes.• for W and Pt, data were obtained which agree very well with the current IUPAC
representative isotopic composition. In comparison with the current bestmeasurements, the data presented here have uncertainties for the isotope ratioswhich are typically 100 (for Pt) to 10 times better than lUPAC's current bestmeasurement.

- 9 4 - AECL-11342
Table 4: Isotopic Composition of W as Measured on Gaseous WF6 Sample
isotope
180
182
183
184
186
IRMM 1994 ratioto 184
0.004405±0.000040
0.864701+0.000006
0.467216±0.000013
1.000000
0.927184±0.000009
IRMM 1994mole%
0.1350±0.0012
26.49608±0.00037
14.31638±0.00039
30.64188±0.00041
28.41066±0.00042
IUPAC 1994 bestmeasurement,
mole%
0.1198±0.0002
26.4985±0.0049
14.3136±0.0006
30.6422±0.0013
28.4259±0.0062
IUPAC 1993 repr.mole%
0.120±0.001
26.498±0.029
14.314+0.004
30.642±0.008
28.426±0.037
Corresponding Atomic Weight 183.840802±0.000048
183.84169±0.00019
183.8417+0.0011
all uncertainties as 1s, n = 5IUPAC Standard Atomic Weight for W is 183.84 ± 0.01
• for W and Pt, "near-absolute" isotope abundance ratios have been obtained, asthe results were acquired using similar instrumentation, measurement andcalculation procedures as used for the silicon isotope abundance ratiomeasurements in the IRMM contribution to the redetermhation of the Avogadroconstant.
• this approach opens up the possibility to have an "operational mole" , i.e. a way torealize the unit of amount of substance, the Mole, in the laboratory for differentelements and with an uncertainty smaller than the one expected from naturalisotopic variation.
References
[1] P.R. Dixon, D.R. Janecky, R.E. Perrin, P.L. Unkefer, W.D. Spall, R. Maeck,Water Rock Interaction, Kharaka & Maest (Eds), ISBN Report 9054100753,Balkema, Rotterdam, 1992.
[2] P.D.P. Taylor, S. Valkiers, P. De Bievre, U. Flegel, Th. Kruck, Anal. Chem. 65,3166(1993).
[3] Th. Kruck, A. Prasch, Angew. Chem. 76, 787 (1964).
[4] S. Valkiers, P. De Bievre, 3rd Int.Symp. Separation Technology, Antwerpen,1993.

- 9 5 - AECL-11342
A Hot Vacuum Extraction Mass Spectrometric Systemfor Determination of H and D In Zirconium
L W. Green, G. A. Bickel, P. K. Leeson, M. W. D. James, T. G. Lamarcheand H. Michel ; ( <•'; ooc en.AECL Research, Chalk River Laboratories, Chalk River, Ontario, Canada KOJ 1J0
introduction
Corrosion reactions at the surface of the zirconium alloy tubes used in pressurizedheavy water reactors cause the release of deuterium which accumulates in the alloy.As the deuterium concentration increases, the solubility limit is reached and deuteriumprecipitates as zirconium hydrides, which degrade the fracture toughness of thepressurized tube. The solubility limits vary depending on alloy composition and reactoroperating temperature, but are close to 30 umoles/g. The initial H content and therate of D ingress must be accurately measured to ensure that the pressure tubes arewithin safe operating limits, and to predict their operating lifetime. Accurate methodsfor hydrogen in zirconium determination are also required for mechanistic studies ofhydrogen ingress. A hot vacuum extraction mass spectrometric (HVEMS) method wasadopted and upgraded for these purposes.
Hot Vacuum Extraction Mass Spectrometry with Isotope Dilution
The method is based on complete extraction of the hydrogen gas from a metallicsample followed by quantitative determination of the hydrogen isotopes. The sampleis heated to 1100cC in high vacuum and a 300 Us turbomolecular pump is used totransfer the evolved gases to a large, low-pressure, collection chamber (Figure 1).After the extraction step is complete, the gases are quantitatively analysed by theisotope dilution technique, using pure H2 or D2 as the spike.
The heater is an ellipsoidal spot lamp focussed on the sample. The sample tube ismade from hydroxyl-free quartz, and the remainder of the vacuum system fromstainless steel, to minimize the H background. A powerful extraction pump is neededbecause hydrogen strongly favors the metallic phase and has a vapor pressure of onlya few mtorr at 1100°C. Continual pumping for 8 minutes removes all, or most of, thehydrogen; for some samples a second extraction is necessary. A liquid Hecryosurface has also been used for collecting the evolved gas, and is required forsamples with high hydrogen content for which backstreaming in the turbomolecularpump is a problem.

- 9 6 - AECL-11342
CalibratedSpiking Volumes
Hydrogen HD Deuterium
Figure 1. Hot vacuum extraction mass spectrometry system
The collected gas is leaked to an 8 in. radius magnetic sector mass spectrometer(Vacuum Generators MM 8-80) and the relative ion currents of H*2, HD and Dl aremeasured to determine the isotopic composition of the extracted hydrogen. A spike isprepared in a small, calibrated volume and injected into the collection chamber. Theisotopic composition is measured again and the absolute amounts of H and Dextracted from the sample are determined by the isotope dilution method.Interferences, fractionation and gas consumption are measured and corrected for.
Calibration and Diagnostics
The accuracy of an isotope dilution analysis depends critically on the accuracy of thespike aliquot and the mass sensitivity factors. Small (17 mL) calibrated volumes withintegral capacitance diaphram gauges (10 torr) are used to prepare known aliquots ofgas for the spikes. The volume is calibrated to within an accuracy of 0.5% (2s) andthe pressure of the spike is chosen to fall within the linear response region of thegauge, for which the accuracy and precision are within 0.1%.

- 9 7 - AECL-11342
The mass sensitivity factors are determined by an automated calibration procedure. Alarge number of isotopic mixtures (typically 80 covering a wide range of pressures andisotopic ratios) are prepared using the calibrated small volumes, and measured H/Dratios are compared with expected values. The relative sensitivity factors have beenobserved to be independent of the isotopic ratio and only slightly dependent on theabsolute pressure at the mass spectrometer inlet (Figure 2). The mass interferences,H3 and D+, can be determined directly from the calibration data at the extremes of theH/D ratios. The D+ contribution to mass 2 is typically 0.5% of the mass 4 signal. TheH3
+ contribution to mass 3 depends quadratically on the H£ signal and for mostsamples is not significant (<0.1%).
Figure 2.
1.04
1.02
1.00
0.98
0.96
10
1.04
1.02
1.OO
0.98
0.96
10"
» •%••* •• .£: .* .
io-
1 o-3 1 o-2
Chamber Pressure (torr)1 0 ,-1
Measured/known isotopic ratios vs collection chamber pressure for mixtures of H2,HD and D2. The I's are ion currents and the n's are numbers of moles of gas.
For quality control, isotopic gas mixes are automatically prepared and analyzed everynight. Such gas mixes are chosen to simulate the gas extracted from typical samplesand, if errors are revealed, the result of the simulation can often be used to diagnosethe cause of the problem.
Accuracy and Precision
The greatest source of uncertainty in the analysis is in the calibration of the massspectrometer. The magnitude of the calibration uncertainty is typically between 2 and3% (2s) (see Figure 2), and does not exceed 5% (2s) for a properly functioningsystem. A value of 5% (2s) has been assigned for the precision of the overallanalysis. For low level samples (<1 umole H and <0.1 umole D), the standard
- 9 8 - AECL-11342
deviation of the blank will contribute significantly to the uncertainty of the analysis andis pooled with the standard deviation of the calibration to determine the totaluncertainty. The detection limits are 0.01 and 0.2 umoles, corresponding to 0.2 and2 ppm by weight in a 100 mg sample, for D and H, respectively.
Standards
The available hydrogen in zirconium standards are limited to a few remaining piecesof NBS wires and controls material supplied by Teledyne Wah Chang Albany (TWCA).Variations in H content have been observed in both types of standards and areattributed to heterogeneity. To avoid heterogeneity problems and to provide standardscontaining both H and D, we have developed a standards preparation procedure whichuses the gettering property of zirconium heated to >900°C. Small, discrete specimensare dosed with known amounts of H and/or D at 1100°C in an apparatus very similarto the HVEMS system. Standards may contain H, D or both isotopes and areroutinely made with an accuracy within 4% (2s) as determined by HVEMS (Table 1).The accuracy of the H result degrades at lower concentration levels due to apersistent H background. Methods to reduce the H background are currently beinginvestigated.
Conclusions
A state-of-the-art hot vacuum extraction mass spectrometric instrument for measuringH and D concentrations in zirconium alloys has been developed in our laboratory.Accuracy and precision are within 5% (2s) for most samples. A second apparatus hasbeen constructed to prepare H, D and H&D in zirconium standards for monitoring theperformance of the HVEMS instrument. These standards are available from theauthors.

- 9 9 - AECL-11342
Table 1: Results of the analysis of Zr standards
Sample
CB-30
CB-31
CB-32
CB-34
CB-43
CB-44
CB-48
CB-54
CB-55
CB-56
CB-76
CB-80
Mean±2s
Deuterium (pg/g)
Expected
22.9
34.1
20.7
22.7
27.7
35.0
36.0
28.2
28.4
33.2
14.6
12.3
Measured
22.6
34.0
20.2
22.9
27.9
33.4
36.1
28.5
27.1
32.6
14.2
12.1
M/E
0.987
0.997
0.976
1.009
1.007
0.954
1.003
1.011
0.954
0.982
0.973
0.984
0.99±0.04
Sample
PL-154
PL-155
PL-156
PL-161
PL-163
PL-171
PL-174
PL-176
PL-180
PL-197
PL-209
PL-226
PL-228
PL-230
PL-232
PL-238
PL-244
Expected
16.2
10.9
5.6
16.0
10.8
11.1
10.9
26.8
42.3
105.2
10.6
52.7
42.1
31.8
11.3
76.5
105.1
Hydrogen (|
Measured
15.2
10.9
5.2
15.3
11.0
11.2
11.1
24.6
41.0
102.8
10.0
53.2
43.7
32.5
11.5
76.5
108.0
jg/g)
M/E
0.938
1.000
0.929
0.956
1.019
1.009
1.018
0.918
0.969
0.977
0.943
1.010
1.038
1.022
1.018
1.037
1.023
0.99±0.08

- 1 0 0 - AECL-11342
A High Efficiency ion Source for Kr and Xe Isotopic Measurements
J. Poths and E.P. Chamberlin ; ' • J
Los Alamos National Laboratory, Los Alamos, New Mexico, 87545
Introduction
We have been exploring the use of a microwave ion source to generate large ionbeams of Kr and Xe (10'10amps), with minimal sample utilization. Our ultimate goal isto construct a mass spectrometer to determine the isotopic compositions of Kr and Xewith high accuracy on small samples. There are numerous potential applications forthis capability. One application is to detect the release and migration of fissiogenicgases from uranium ore deposits that are studied as natural analogues to nuclearwaste repositories.
Our microwave plasma source (Figure 1) is based on a concept by Vorburger et al.[1], and has been refined and tested as an ion source by subsequent workers [2,3].We routinely use it as a high efficiency gas source for isotope separation. It is verysimple, consisting of a ceramic tube 1.3 cm o.d. x 15 cm long surrounded by a 1/4-wave microwave cavity. Gas flows into the back end of the tube from a gas handlingsystem. A minimum gas pressure ("support gas"), which is species dependent, isrequired to sustain the plasma discharge. Ions are extracted at 50 kV out the front ofthe tube through an orifice 0.3 mm diameter into an isotope separator. This orifice isthe only path for gas loss from the source. Gas discharge is initiated in the sourceusing a Tesla coil.
loni
2 4 5 GHzX/4
Cavity
Plasma
p 6 cm »Gw
Flow
Figure 1: Schematic of the Microwave Plasma Ion Source

-101 - AECL-11342
In this paper we discuss our results for testing the microwave ion source for ionizationefficiency, stability, ion beam intensity, and gas consumption for Kr and Xe. We alsoreport a technique for isotopic analysis of Kr and Xe with high sensitivity directly fromair. We believe that our technique combines simplicity, high ionization efficiency, andthe ability to analyze noble gases from air without removing the Ar, and therefore is atrue improvement compared to an electron impact ion source.
Experimental
Our basic goal is to determine the suitability of the microwave ion source for use onan analytical instrument. At the same time, we wish to develop a method to analyzeKr and Xe directly from air. Anticipating that we would use the air Ar as the supportgas for air Kr and Xe ionization, we did a series of experiments on the ionizationefficiency of Kr as a function of the pressure of Ar support gas. Figure 2 shows thegas handling system used in these experiments. The 300 cm3 expansion volume isfilled with pure Ar, which is bled through a motorized valve controlled from thepressure transducer, allowing us to vary the Ar pressure in the system. The Ar mixeswith Kr from a calibrated leak, and flows into the ion source. When the calibrated leakwas new (several years ago), a Kr ion beam of 10"6amps corresponded to 10%ionization efficiency.
CALIBRATED
VALVECONTROLLER
-1 TO - 2 ATM•1 TO »2 ATM
10TORRPRESSURETRANSDUCER
MOTORIZEDVALVE
Figure 2: Schematic of the Gas Handling System used for these Experiments
Next, we modified the procedure to develop analysis of Kr and Xe directly from air.The 300 cm3 volume is filled with room air. Air flows from that volume at a ratecontrolled by the pressure transducer and motorized valve, passes through acommercial noble gas purifier and into the ion source. The purifier removes all of thereactive gases from the air stream, leaving the 1% air Ar, with traces of the othernoble gases (1.14 ppm Kr and 0.09 ppm Xe in air). This process is efficient atremoving reactive gases, as demonstrated by scans over the mass range 12 to 90,where the ion beams of all other species are at least an order of magnitude lower than40Ar. Using this procedure, we adjusted the air flow to find conditions that produce thehighest stable Kr and Xe ion currents. We then determined the gas consumption raterequired to produce these beams. Finally, we measured isotopic ratios for Kr and Xe,
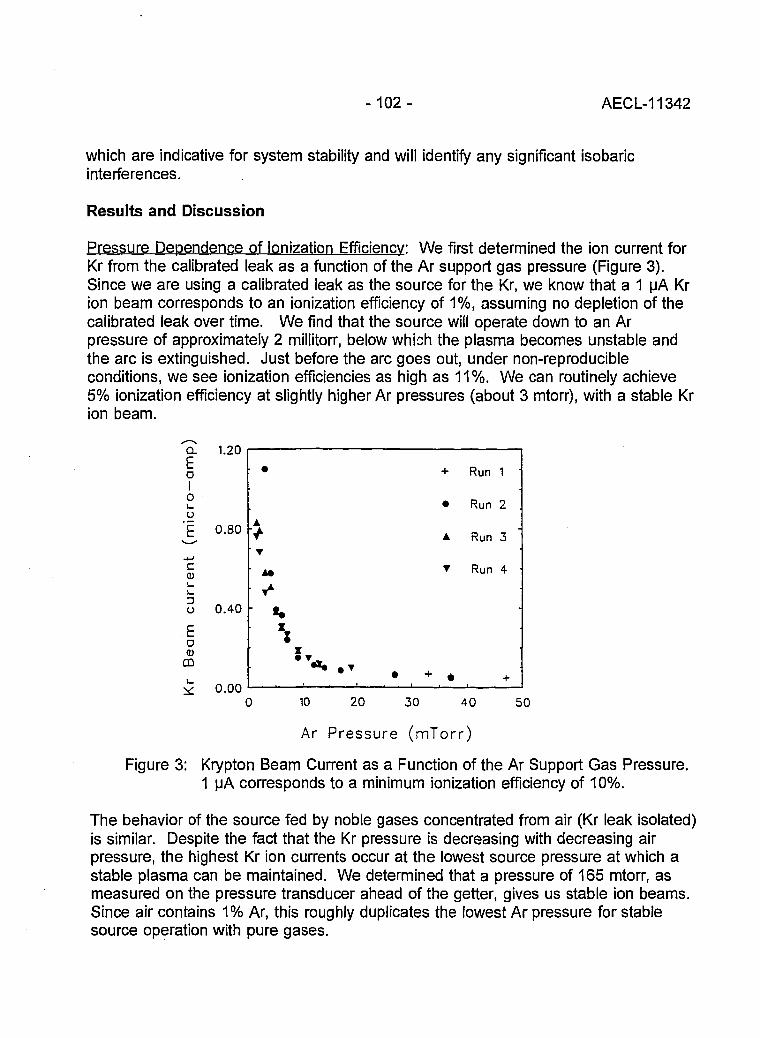
- 1 0 2 - AECL-11342
which are indicative for system stability and will identify any significant isobaricinterferences.
Results and Discussion
Pressure Dependence of lonization Efficiency: We first determined the ion current forKr from the calibrated leak as a function of the Ar support gas pressure (Figure 3).Since we are using a calibrated leak as the source for the Kr, we know that a 1 uA Krion beam corresponds to an ionization efficiency of 1%, assuming no depletion of thecalibrated leak over time. We find that the source will operate down to an Arpressure of approximately 2 millitorr, below which the plasma becomes unstable andthe arc is extinguished. Just before the arc goes out, under non-reproducibleconditions, we see ionization efficiencies as high as 11%. We can routinely achieve5% ionization efficiency at slightly higher Ar pressures (about 3 mtorr), with a stable Krion beam.
Ar Pressure (mTorr)
Figure 3: Krypton Beam Current as a Function of the Ar Support Gas Pressure.1 uA corresponds to a minimum ionization efficiency of 10%.
The behavior of the source fed by noble gases concentrated from air (Kr leak isolated)is similar. Despite the fact that the Kr pressure is decreasing with decreasing airpressure, the highest Kr ion currents occur at the lowest source pressure at which astable plasma can be maintained. We determined that a pressure of 165 mtorr, asmeasured on the pressure transducer ahead of the getter, gives us stable ion beams.Since air contains 1% Ar, this roughly duplicates the lowest Ar pressure for stablesource operation with pure gases.

-103- AECL-11342
Ion Beam Intensities and Gas Consumption Rate: For Kr from the calibrated leak (flowrate of <2.4x10'6 cm3/s) with Ar as the support gas, we get a stable ion beam intensityof about 0.5 uA integrated over all isotopes. For Kr and Xe derived from air, with theair pressure in the gas handling system held at 165 mtorr, we routinely get ioncurrents of 1.5x10"10 A for 84Kr (57% of total Kr), and 9x10"12 A for 132Xe (27% of totalXe).
Having established stable conditions to give us the above Kr and Xe beam currentsfrom air, we next determined the gas consumption rate. This was done bydetermining how long the plasma discharge could be maintained from a known volumeof air. The 300 cm3 expansion bottle (Figure 2) was filled to local atmosphere (3/4 ofstandard atmosphere, 230 cm3 STP), and the pressure in the gas handling systemwas set at 165 mtorr. The source operated at a constant Kr ion current for 37 hoursbefore the gas was depleted and could no longer sustain the plasma. We thenrepeated the experiment with a smaller volume of air, roughly 15 cm3 STP. Thesection of the system between the regulator and expansion bottle (Figure 2) was filledto atmospheric pressure. With this as the feed volume, the ion beam remainedconstant for 53 minutes, which is enough time to collect isotopic data for both Kr andXe. From the experiment with 230 cm3 STP, we calculate that about 7.3x10¹² ions of132Xe were generated from 1.45x10¹⁴ atoms of Xe flowing through the source, or anionization efficiency of 5%. For Kr the calculated efficiency is 3%.
Kr and Xe Isotopic Analyses: We have measured isotopic ratios for Kr and Xe fromair samples to address two other questions regarding use of this source for accurateKr and Xe isotopic analysis. As before, the air flows through the purifier directly intothe source with no further separation. The first question is whether the ion beamremains reasonably constant over the few minutes needed to integrate the intensitiesof several Kr or Xe peaks. Second, does our procedure introduce any significantisobaric interferences in the Kr and Xe mass regions. We used a single Faradaycollector with peak jumping of the magnetic field to measure the major Kr and Xeisotopic ratios. We achieved better than 1% precision, which is adequate to rule outmajor problems in these two areas.
Figure 4 shows the isotopic ratio data for the major isotopes of Kr and Xe, normalizedto the atmospheric isotopic compositions [4,5]. The measured ratios scatter within0.5% about a linear mass fractionation trend fitted through the data. Suchfractionation is expected, and may be affecting both the gas and the extracted ions.This fractionation is about 0.6%/mass unit for Kr and 0.2%/mass unit for Xe, similar tothat for conventional gas mass spectrometry. Once corrected for mass fractionation,the good match between our measurements and the atmospheric compositionindicates that the source produces an ion beam that is stable enough for theseisotopic analyses. The good match also indicates that there are no major (<1%)isobaric interferences at these masses.

-104-
Air Normalized Ratios
AECL-11342
1.010
0.985
128 129 1?0 131 132 133 134 135 136 137
Mass Number
1.015 -
1.010 -
1.005 -
1.000-
0.995-
0.990-
0.985 -
0.980 -
• s
T Runi• Run 2
Conclusions
The microwave plasma ion sourceshows considerable promise forgenerating large ion beams of noblegases for high accuracy isotopicanalyses. Advantages include highionization efficiency, operation withoutgas separation, and simplicity of thesource. Measurements of the isotopiccompositions of Kr and Xe from airindicate that ion beam stability andisobaric interferences do not posemajor problems.
81 82 83 84 85 86 87
Mass Number
Figure 4: Isotopic Ratio Measurementsfor Kr and Xe
References
[1] T.V. Vorburger, B.J. Waclawski and D.R. Sandstrom, Rev. Sci. Instrum 47 501(1976). " '
[2] S.R. Walther, K.N. Leung, and W.B. Kunkel, Rev. Sci. Instrum., 57, 1531 (1986).
[3] E.P. Chamberlin, K.N. Leung, S. Walthers, R.A. Bibeau, R.L. Stice, G.M. Kelley,and J. Wilson (1987), Nuclear Instrm. Methods Phys. Res., B26, 227 (1987).
[4] O. Eugster, P. Eberhardt and J. Geiss, Earth Planet. Sci. Lett. 2, 385 (1967).
[5] A.O. Nier, Phys. Rev. 79, 450 (1950).
Acknowledgement: This work was supported by the United States Department ofEnergy.

-105- AECL-11342
LASER RESONANCE lONIZATION

-106- AECL-11342
Resonant Laser Ablation: Mechanisms and Applications
J.E. Anderson, R. Bodla, G.C. Eiden, N.S. Nogar and C.H. SmithChemical Science and Technology Division, MS J565Los Alamos National LaboratoryLos Alamos, New Mexico 87545
Introduction
Ever since the first report of laser action, it has been recognized that laser ablation(evaporation/volatilization) may provide a useful sampling mechanism for chemicalanalysis [1,2]. In particular, laser ablation is rapidly gaining popularity as a method ofsample introduction for mass spectrometry [3-5]. While most laser ablation/massspectrometry has been performed with fixed frequency lasers operating at relatively highintensities/fluences (>108 W/cm2, >1 J/cm2), there has been some recent interest in theuse of tunable lasers to enhance the ionization yield of selected components in ananalytical sample. This process has been termed resonant laser ablation (RLA) [6-12],and typically relies on irradiation of a sample in a mass spectrometer with modestintensity laser pulses tuned to a one- or two-photon resonant transition in the analyte ofinterest.
Potential advantages of RLA include: (1) simplification of the mass spectrum, byenhancement of signal from the analyte of interest; (2) improvement of the absolutedetection limits by improving the ionization efficiency, and (3) improvement in relativesensitivity. The sensitivity enhancement results from reduction of spurious signal, andaccompanying noise, in the detection channel. This spurious signal may be due to bleedthrough from adjacent mass channels, or from isobaric interferences. RLA tends toproduce higher mass resolution because of minimal spatial spread in the ion source andsmall space charge effects. In this manuscript we present a survey of RLA attributesand applications.
Results and Discussion
Analysis
Much of the apparatus has been described previously [13,14]. The optical sourceconsisted of an XeCI excimer laser-pumped dye laser. For most of the experimentsdescribed here, the output energy was a few mJ in the blue spectral region («450 nm),in «10 ns pulses, at a repetition rate of 10 to 50 Hz. The dye laser beam was spjit andattenuated prior to striking the sample, so that typical incident pulse energies were 10-100 uJ. The ion detector was a channel electron multiplier whose output was amplified,sent to a boxcar averager or digital oscilloscope, and then transferred to a micro-

-107 - AECL-11342
computer. The beam was focused by a 20 cm lens and incident on the surface at anangle of 11°, producing a stripe on the surface that was 0.34 mm by 1.8 mm(0.006 cm2), measured at the 1/e intensity points of the beam.
4CO
CD
c/5
6 0 0
4 0 0
2 0 0
- 2 0 0
Al 5ppm457.44 nm
Fe 70 ppm447.60 nm
Cu 2 ppm463.61 nm
Tr Cr 3 ppm
473.28 nm
8 100 2 4 6
Flight Time/|xsecFigure 1: "2+1" Resonant Laser Ablation Spectra of Trace Components in
High Purity, 99.97% Rhenium
Figure 1 shows typical mass spectra obtained from a high purity rhenium sample. Eachspectrum corresponds to irradiation of the surface at a different wavelength,corresponding to a "2+1" (photons to resonance + photons to ionize) ionization processfor the labelled element: iron, aluminum, copper or chromium. Several features areworth noting. First, signal was obtained with low pulse energies, typically 20 uJ(corresponding to a fluence «10 mJ/cm2, or an intensity <106 W/cm2). The observationof trace components at very low laser intensities is a significant virtue of this process;this sensitivity is due both to the resonant nature of the ionization process, and to theexcellent overlap of the vaporized sample with the ionizing laser beam, as discussedbelow. Second, virtually no signal due to the bulk material (Re) was observed. In morecareful experiments, we have demonstrated selectivity, d, in ionization of the targetanalyte vs. the bulk material of d > 105:1. In spite of this, a persistent signal due tosodium and potassium was observed in all of these spectra. These are impuritiespresent in the sample and their presence was perhaps enhanced by excessive manualmanipulation. These components are presumably observed because of their highvolatility, low ionization potential and presence on the surface as ionic compounds. Theyare thus easily vaporized, and ionized, by low-order non-resonant multiphoton processes.In addition, we generally observed that the initial pulses of any irradiation sequenceproduced more signal than subsequent pulses [15], even though the thermal pulseshould decay completely in the time scale of the interpulse interval.

- 108 - AECL-11342
Several generalizations concerning quantitation can also be made. The results shownabove were found to be semiquantitative. All mass spectral traces in Figure 1 werenormalized so that the areas corresponding to the sodium signals were equal. Underthis constraint, the signals can be seen to scale monotonically with the concentration ofthe minority species, as was noted previously [6]. In addition, at the low fluences usedin these experiments, removal rates were very small; in separate experiments, weestimated <0.01 monolayer per shot is removed from the sample. This provides thepotential for depth profiling of layered or inhomogeneous samples using resonant laserablation [16,17].
The potential of RLA for trace detection is shown in Figure 2a, which depicts a massspectrum obtained from a nickel sample containing low levels (<ppb) of technetium.Technetium is an unstable element that does not occur in nature, and is difficult to detectby radiochemical means because of its low specific activity. In our analyses, the laserwas tuned to a "2+1" resonant ionization transition for technetium; the optical spectrum isdisplayed in Figure 2b. While Figure 2a clearly shows significant non-resonant ionizationoccurring, it should be noted that the nickel sample had a very rough morphology (thesurface appeared black) and the Tc concentration was <1ppb, illustrating the benefits ofsignificant discrimination for the detection of extremely low levels of analytes.
0 m/z 10 20 40
0 2 4 6
Flight Time/u,sec
(a)
c
COcD)CO
o
1
0.10
0.05
0.00
—
-
-̂
i •
i •
I t
i i
p I
19790 19800
Photon Energy/cm
(b)
19810-1
Figure 2a: Mass Spectrum Resulting from Resonant Laser Ablation of Tc from a NickelSample, using the e6S5/2<-a6S5/2 Two Photon Transition shown in Figure 2b
-109- AECL-11342
Spectroscopy
We also show the utility of RLA for spectroscopy and surface studies. This workdemonstrates the ease with which high quality atomic spectra can be obtained usingRLA. Figure 3 shows the 2+1 multiphoton ionization spectrum of 56Fe detected by RLAof Re containing 70 ppm Fe.
44625 44650
Two-Photon Energy/cm
(a)
44675-1
40000 40100
Two Photon Energy/cm"1
(b)
Figure 3: (a) "2+1" lonization Spectrum from the Iron Ground State(b) Similar Spectrum from an Excited State
We observe the two-photon D J=0 transition from the a5D ground term to the e5D excitedterm near 44640 cm"1; also observed is the e5F-asF two-photon transition from the firstexcited term near ~1 eV. Each of these multiplets spans a wavelength range of <1 nm,across which the dye laser power is essentially constant. The J'=3 - J"=3 and J'=5 -J"=5 transitions are much stronger than the other lines in the excited state multiplet dueto near resonances with the z5F° term (detunings of 182 cm'1 and 92 cm'1, respectively).
Temperatures can be obtained from these spectra by comparing calculated intensities fora particular temperature with experimental intensities. The agreement between theexperiment and calculation is surprisingly good. A fit of the experimental intensities tothe calculated intensities yielded a straight line (1^=0.96 to 0.99 for three data sets) forthe four lowest lying spin-orbit states in Fe. The observed intensity of the J"=0 - J'=0transition is an order of magnitude larger than calculated, possibly due to quantuminterferences. We obtain a temperature of 1100 ± 200 K for Fe atoms ablated from Reat an intensity of 2 ± 1 x 10⁶ W/cm2. This is in rough agreement with a recent

- 1 1 0 - AECL-11342
measurement [16] of the temperature of a laser desorbed plume several mm above thesurface.
Conclusions
We have shown that RLA is ideally suited for high sensitivity analyses of complex samples.It requires very modest performance from both laser and mass spectrometer, and is suitedfor detection of a wide variety of elements. We have also demonstrated 2+1 ionizationtransitions in Fe detected by RLA. Two-photon transition rates for Fe transitions werecalculated perturbatively and found to agree semi-quantitatively with experimentallyobserved intensities.
References
[1] L. Moenke-Blankenburg, Laser Microanalysis, Eds., John Wiley & Sons, New York, (1989).
[2] L. J. Radziemski, D. A. Cremers, Laser-Induced Plasma and Applications, Eds., MarcelDekker, New York, (1989).
[3] G. Toelg, Analyst (London), 112, 365 (1987).
[4] U. Boesl, J. Phys. Chem., 95, 2949 (1991).
[5] G. C. Eiden, M. E. Cisper, M. L. Alexander, P. H. Hemberger, N. S. Nogar, J. Am. Soc.Mass Spec, 4, 706 (1993).
[6] I. S. Borthwick, K. W. D. Ledingham, R. P. Singhal, Spectrochim. Acta, 47B, 1259 (1992).
[7] G. Krier, F. Verdun, J. F. Muller, Fresenius1 Z. Anal. Chem., 322, 379 (1985).
[8] K. W. D. Ledingham, J. S. Borthwick, R. P. Singhal, Surf. Interface Anal, 18, 576 (1992).
[9] C. J. McLean, et al., Int. J. Mass Spectrom. Ion Process, 96, R1 (1990).
[10] F. R. Verdun, G. Krier, J. F. Muller, Anal. Chem., 59, 1383 (1987).
[11] G. C. Eiden, J. E. Anderson, N. S. Nogar, Microchemical Journal, 50, 289 (1994).
[12] G. C. Eiden, N. S. Nogar, Chem. Phys. Lett., 226, 509 (1994).
[13] S. W. Downey, N. S. Nogar, C. M. Miller, Int. J. Mass Spectrom. Ion Processes, 61, 337(1984).
[14] N. S. Nogar, R. C. Estler, B. L. Fearey, C. M. Miller, S. W. Downey, Nucl. Instrum.Methods Phys. Res., Sect. B, 44, 459 (1990).
[15] X. L Mao, W. T. Chan, M. A. Shannon, R. E. Russo, J. Appl. Phys., 74, 4915 (1993).
[16] T. Gilbert, B. Dubreuil, M. F. Barthe, J. L Debrun, J. Appl. Phys., 74, 3506 (1993).
[17] T.M. Allan, P.B. Kelly, J.E. Anderson, T.N. Taylor and N.S. Nogar, Appl. Phys., A61, 221(1995).

- 1 1 1 - AECL-11342
Hydrogen Determination in Zirconium Alloys by Laser Ablationand Resonance lonization Mass Spectrometry
G.A. Bickel, Z.H. Walker and L.W. GreenAECL Research, Chalk River, Ontario, Canada KOJ 1J0
Introduction
The integrity of zirconium-alloy pressure tubes in pressurized heavy water reactors canbe adversely affected by the diffusion of deuterium through the protective outer oxidelayer into the bulk metal. The ingress and accumulation of hydrogen isotopes can leadto hydride blister formation and delayed hydride cracking. In order to developappropriate strategies to combat these problems, sensitive analytical techniques arerequired to quantitatively measure the ppm levels of hydrogen present in the pressuretubes.
Currently, H and D concentrations are measured using hot vacuum-extraction massspectrometry (HVEMS). This technique provides excellent sensitivity forconcentrations as low as a few ppm, and yields an average or bulk concentration forthe sample. In an effort to facilitate the determination of spatially resolved hydrogenconcentrations, which may help to elucidate the ingress mechanism, a method ofanalysis is being developed in our laboratory based on laser ablation followed byresonance ionization mass spectrometry (LA-RIMS). In this technique, laser ablationis employed as a sampling tool allowing the transfer of material from the near surfaceregion of the sample to the gas phase where it can be detected using massspectrometry. Correct interpretation of experimental results requires an understandingof the nature of this sampling process. This is particularly true if spatial profiling is tobe considered. To further our insight into the ablation process we have employedAtomic Force Microscopy (AFM) to examine changes in surface topography which mayresult from laser beam exposure. Computer modeling has also been used to assist incharacterizing the interaction between the laser pulse and the sample surface. Finally,hydrogen concentrations determined using LA-RIMS have been compared withmeasurements made using HVEMS in an effort to verify the overall analyticalcapabilities of this technique.
Experimental
The experimental apparatus employed in these studies consisted of the following. The1.06 mm output from a Nd:YAG laser with a temporal width (FWHM) of 11 ns wasused to ablate the surface of the zirconium alloy sample in a vacuum of at least10"7 Torr. The gaussian spatial profile of the laser beam was transformed to a "top-

- 1 1 2 - AECL-11342
hat" profile with a spot diameter of 200 mm on the sample surface and a fluence of0.5 J cm"2. At this fluence, there was no evidence of plasma formation above thesample and the majority of species ejected from the surface were charge neutral. The243 nm output from a second laser, namely an excimer-pumped frequency-doubleddye laser, was used to probe the ablation plume. Deuterium atoms in the plume wereselectively ionized via a 2+1 resonance transition by tuning the output of the dye laserto the 1s -> 2s transition. Once ionized, the deuterium ions were extracted into a time-of-flight (TOF) mass spectrometer and detected.
Results and Discussion
Laser ablation rates have been determined previously in our laboratory and the rate fora fluence of 1 J/cm2 is 0.3 nm/pulse. This low removal rate would suggest that a highdegree of depth resolution should be possible with this technique. However,examination of the sample surface after exposure to several thousand laser pulses ata fluence of 0.4 J/cm2 by AFM revealed significant changes in surface topography. Incontrast to the flatness of the unexposed surface, the laser ablated region displayedhills and valleys with height variations of ±600 nm. These changes in topographysuggest that although only a small amount of material is removed per laser pulse, theinfluence of the laser pulse is felt to a much greater depth. If the pulse from theablation laser is resulting in a redistribution of hydrogen species near the surface, thenthe depth profiling capabilities of this technique may be limited.
Computer modeling of the ablation process also supports the premise that melting andfreezing of the near surface region is occurring. Temperature profiles were calculatedusing a finite difference method both as a function of time and distance from thesurface. The model included the temperature dependent specific heat and thermalconductivity values for zirconium alloy as well as the relevant ablation laser properties.In addition to calculating temperatures, ablation rates were also determined using thecalculated surface temperatures and vapour pressure data for zirconium. A maximumtemperature of 3240 K was calculated for a laser fluence of 0.5 J/cm2 with a temporalwidth (FWHM) of 11 ns. This is well above the melting temperature for pure zirconiumof 2125 K. The calculations also predict melting up to a depth of 300 nm from thesurface. Although the simulations rely on material properties that need to beextrapolated to these high temperatures, the general validity of the calculations can beverified by comparing calculated ablation properties with those measuredexperimentally. In particular, the observed threshold fluence is consistent with thefluence predicted for the onset of surface melting and reasonable agreement is seenbetween calculated and experimentally measured ablation rates.
To evaluate the quantitative capabilities of laser ablation, a sample of pressure tubematerial containing varying amounts of deuterium was prepared and analysed. Thesample was prepared by clamping one end in a heat sink and then heating the other
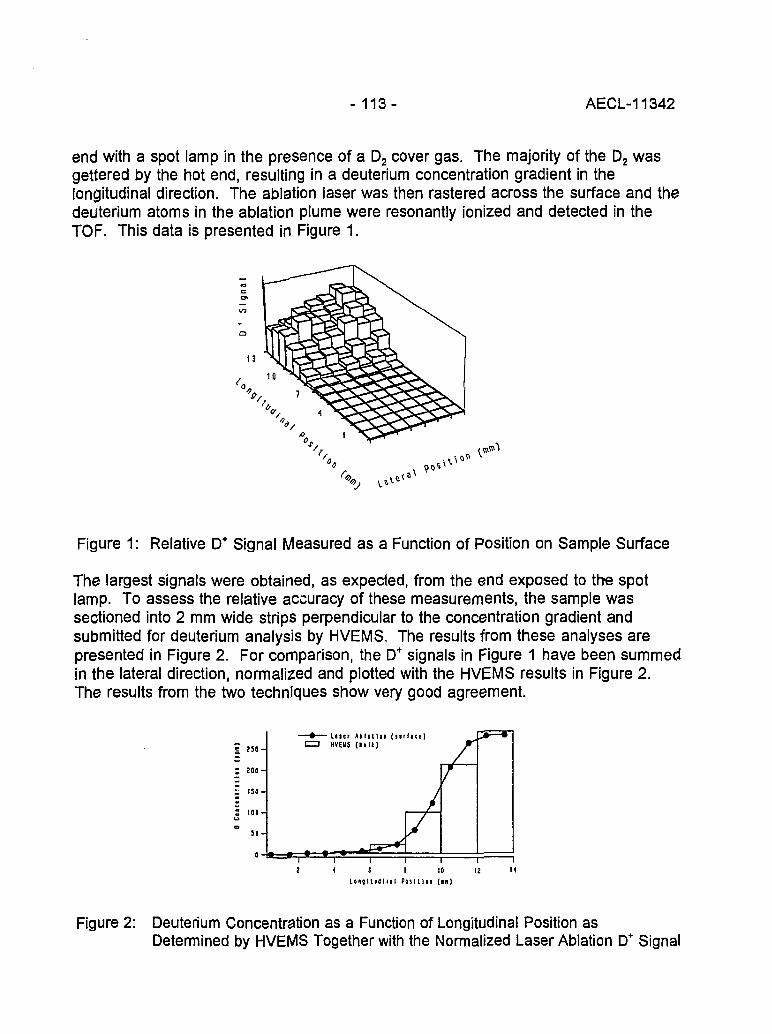
-113 - AECL-11342
end with a spot lamp in the presence of a D2 cover gas. The majority of the D2 wasgettered by the hot end, resulting in a deuterium concentration gradient in thelongitudinal direction. The ablation laser was then rastered across the surface and thedeuterium atoms in the ablation plume were resonantly ionized and detected in theTOF. This data is presented in Figure 1.
Figure 1: Relative D+ Signal Measured as a Function of Position on Sample Surface
The largest signals were obtained, as expected, from the end exposed to the spotlamp. To assess the relative accuracy of these measurements, the sample wassectioned into 2 mm wide strips perpendicular to the concentration gradient andsubmitted for deuterium analysis by HVEMS. The results from these analyses arepresented in Figure 2. For comparison, the D+ signals in Figure 1 have been summedin the lateral direction, normalized and plotted with the HVEMS results in Figure 2.The results from the two techniques show very good agreement.
t ! 10 12U i g l l i d l u l P o l i t i c o ( i n )
Figure 2: Deuterium Concentration as a Function of Longitudinal Position asDetermined by HVEMS Together with the Normalized Laser Ablation D+ Signal

- 114- AECL-11342
One important step in the application of laser ablation for quantitative analysis will bethe preparation of suitable standards to relate the relative deuterium ion signalsmeasured in the TOF to absolute concentrations. To address this requirement, anumber of standards were prepared by dosing zirconium alloy samples with varyingamounts of deuterium. Care was taken to provide uniform heating of the samplesduring the gettering process in order to produce samples with a uniform deuteriumdistribution. The relative D+ ion signals measured in the TOF are plotted vs Dconcentration, as determined by HVEMS, and presented in Figure 3.
- 1 0 0 —
•» B 0 -
£ 6 0 -
2 0 -
0 -
20 30
B i l t D C o i c e a t r i t l O R (ppn)
Figure 3: Relative D+ Signal Measured from Prepared Standards with Varying DContent as Determined by HVEMS
The D+ ion signal does respond linearly with increasing D concentration within theexperimental uncertainty of the data. The uncertainty in the D+ signal is larger thanthat in the D concentrations determined by HVEMS. This is due, for the most part, tothe pulse-to-pulse fluctuations in fluence in both the ablation and ionization lasers.
Conclusions
This study demonstrates the capability of laser ablation combined with resonanceionization mass spectrometry to measure hydrogen isotope concentrations in pressuretube material. H and D are selectively ionized and detected over a range ofconcentrations at ppm levels. Spatial profiling of the sample surface is alsodemonstrated although is currently limited to sub-mm resolution by the ablation laserspot diameter of 100 urn. Work is continuing in our laboratory to assess the potentialof this technique to perform depth profiling of pressure tube samples and in particularsamples containing a ZrO2 overlayer.
-115- AECL-11342
Measurement of Sample Chargingduring Sputtering of Ill-V Materials and Devices
S.W. Downey and A.B. EmersonAT&T Bell Laboratories, 600 Mountain Ave., Murray Hill, NJ USA 07974
Introduction
A common problem in the analysis of non conducting solids using ion bombardment(sputtering) is charging of the sample, which may affect the electrostatics of a massspectrometer's ion source, and hence ion transmission efficiency and reproducibility.The voltage changes induced on samples of GaAs and InGaAsP materials anddevices during sputtering are measured in real time via the Stark Effect in a resonanceionization mass spectrometer. High-lying electronic (Rydberg) levels of sputtered Gaatoms are spectrally shifted by the strong electric field (> 14 kV/cm) present in theinstrument. We use here the spectroscopic selectivity of atomic resonance ionizationin a strong electric field of the mass spectrometer to measure the charging process viathe Stark effect as it occurs under a variety of sputtering conditions. The Stark-shiftedlines are a beneficial diagnostic to probe the ion source's local electric field, whichdepends on the sample's position, potential and charging. Changes corresponding to10 V in the sample's bias can be detected spectrally. Continuous and pulsedsputtering produce different voltage shifts under a variety of incident primary ion types(Xe+ and O2
+), energies and doses. Optimization of sputtering parameters so thatcharging is not problematic, or at least predictable, helps ensure reproducibility ofdepth profiles for devices and materials where high precision is required. Charging ofsemi-insulating GaAs is significant enough at 2 keV to deflect the ion beam out of theanalysis area in the ion source. At 6 keV, the beam is not moved as much eventhough the amount of charging is about the same.
Experimental
Resonance ionization mass spectrometry (RIMS) is a selective and sensitive techniquefor dopant profiling in devices and materials [1, 2]. As in conventional depth profilingtechniques such as secondary ionization mass spectrometry (SIMS), a primary ionbeam is used to slowly and controllably erode layers of materials. The RIMS/SIMSinstrument, is a modified UHV magnetic sector secondary ion mass spectrometer usedpreviously to detect sputtered molecules in Ill-V materials [3]. Samples are sputteredby Xe ions produced in a duoplasmatron ion source operated from 8.2 -12.2 kV. ForRIMS, the sample is held at about 6.2 kV making the net beam energy on target 2 or6 kV. The sample is held about 4 mm from the grounded secondary ion extractor,creating electric fields in excess of 15 kV/cm. The sample/extractor spacing iscontrolled by a micrometer which is used to fine-tune the electric field in the alignment

-116- AECL-11342
process. The sample bias is controlled by a computer-controlled digital-to-analogconverter with voltage steps of 2.5 V. The nominal angle of incidence is about 30°relative to normal, but at low energy, this angle may be greater than 60° - 70°. Beamcurrents of up to 0.5 uA are contained in a spot of about 100 urn (FWHM) diameter.Sample sputtering may be performed with a pulsed or continuous ion beam. In pulsedoperation, the duration of the ion pulse and the timing of the laser firing relative to thepulse is controlled by a digital delay generator. In this way, varying amounts ofprimary ion dose may be delivered to the sample prior to the laser's firing. Themagnitude of the spectral shifts induced by the charging of these samples are reportedas voltage changes based on calibration by sample bias programming.
An excimer-pumped, frequency-doubled pulsed dye laser (25 ns, 40 Hz) is used tophotoionize sputtered Ga atoms. Ga is resonantly excited to Rydberg levels with laserwavelengths around 213 nm. The laser beam is attenuated (< 100 uJ) to keep thepulse energy low so as to not broaden the Ga spectral lines. The beam is focused<100 urn in front of the sample to optimize RIMS detection. The beam diameter isabout 500 urn, which in this geometry, ionizes all atoms in the ion source region whichis approximately 150 urn wide, corresponding to the energy analyzer's 180 eVbandpass. Sample high-voltage bias and time-gated detection are used to select theRIMS ions produced in the gas-phase while rejecting SIMS ions produced at thesurface.
Table 1: GaAs Samples Examined for Charging
Sample type
Semi-insulating
Semiconducting
Semiconducting
Dopant
-
p-type Zn
n-type Si
Concentration
-
1.7x1019cm-3
2 x 1018 cm'3
Results and Discussion
The ionization potential of Ga is 6.0 eV, and light with energy of 5.8 eV/photon canexcite various Rydberg electronic states (principle quantum number, n > 11). Theelectric field in the mass spectrometer is strong enough to split each n level into manystates accessible from the 4p2P,°2 ground state with one photon. Ga+ RIMS signals willbe detected because the extracting electric field in the mass spectrometer is sufficientto field ionize the Rydberg atoms [4]. Because the electric field is large, theidentification of the electronic transitions involved in the Ga Rydberg spectra is not

-117 - AECL-11342
easy due to strong mixing of states. However, the three peaks evident in Figure 1show approximately linear spectral movement as the field is varied. The shifts ofthese peaks can be used to measure sample charging from Ga-containing samples.
10-1acCO
ww
£(0O
a>#̂i2"ooc
8 -
6 -
4 -
2 -/ \
213.64 213.68 213.72Laser Wavelength, nm
i • •
213.76I
213.80
Figure 1: The effect of sample voltage change on Ga Rydberg RIMS signal sputtered fromZn-doped GaAs with 2 keV Xe+. The laser is fired at a 1.5 us delay relative to theonset of sputtering. Traces labelled 1, 2, and 3 are at sample high voltage settingsof 6.2, 6.3, and 6.4 kV, respectively.
The electrostatic geometry of this instrument, and other magnetic sector SIMSinstruments, when detecting positive ions, is based on a sample biased at highpositive voltage with respect to a grounded extraction plane. The energy analyzer isthen set to pass ions within a certain bandwidth set by the sample high voltage bias.In SIMS all ions are formed at the sample surface, the energy bandpass selects ionssputtered with different kinetic energies. In the RIMS mode, ions are created in thegas phase above the sample in a region of space defined by the diameter of the laserbeam. In addition to possessing a range of kinetic energies from the sputtering, ionsfall through different potentials due to their location in the ion source. Therefore, theRIMS ions passed through the energy analyzer are also spatially selected. For a180 eV bandpass, the region is between 100-150 urn. Changes in the field, eitherintentional or unintentional, shift the region in space that corresponds to the energypassed by the analyzer. Likewise, the size (volume) of the ion source passed by theanalyzer expands or shrinks as the slope of the potential (electric field) changes. Thefield and spot size passed are inversely proportional. So for example, if the samplecharges up during sputtering, with all other parameters constant, the atoms ultimatelydetected by the RIMS process will come from a region in the ion source progressivelyfarther from the sample that decreases in size. Most likely, the detected signal willdecrease, and may even vanish if charging is substantial. To approximate the effectof sample charging, the sample bias is varied while keeping the laser wavelength fixedwhile monitoring the RIMS signal. See Figure 2.

-118- AECL-11342
Sample charging creates another insidious dynamic effect. In the case of high angleof incidence, low energy bombardment, the primary ion beam is deflected as thesample potential approaches the beam voltage. In a magnetic sector instrument, thepractical limit of the primary ion beam voltage, Eb, relative to the sample bias, Es, isabout 0.75 Eb> Es; or 2 keV net incident energy in this case. Therefore, smallamounts of charging could move the position of the ion beam on the surface asignificant amount and change its shape, thus misaligning the sputtered materialrelative to the laser beam and secondary ion optics.
55CO
CO
OCD
1 -
0.1'--
0.01 -d
CO
caa)o.
| .M i . .T | . . , . , . , | . . , . . . . , . . r^rrprr,
6.20 6.24 6.28 6.32 6.36Sample Bias (kV)
Figure 2: The effect of samplevoltage change on Ga Rydberg RIMSsignal sputtered from Zn-doped GaAswith 2 keV Xe+. The laser wavelength isfixed at 213.665 nm. The laser is fired ata 1.5 us delay relative to the onset ofsputtering. This sweep is used tocalibrate the effects of sample charging.
150-
I ' ' """I ^ ' """ I10 100 1000
Ion Pulse Width ((is)
Figure 3: Voltage change on semi-insulating GaAs as determined by spectralpeak shifts of Ga Rydberg atoms obtainedwith pulsed, 2 keV Xe+ sputtering. Datafrom three spectral peaks are shown. Allshifts are relative to the 4 us, 500 nA ionpulse. A positive shift indicates that thespectral lines are red-shifted. Openmarkers: The laser is fired 4 us delay afterthe onset of sputtering. Filled markers:The laser is fired at the end of thesputtering pulse.
Figure 3 shows the effect of increasing ion dose prior to the laser firing upon thespectral shift for the semi-insulating GaAs. Under continuous 2 keV Xe+ sputtering theRIMS signals disappear. If the laser is fired early in the ion pulse (for up to at least a5 ms pulse), the amount of sample charging is small, near the limit of detection ofchange. The interpulse period here is 25 ms for the 40 Hz pulsing, which appears tobe long enough to drain charge between ion pulses. However, as the ion pulse width

-119- AECL-11342
and laser delay increase, adding charge just before measurement, the peaks shiftnoticeably. Data taken with continuous 6 keV Xe+ sputtering also shows verysignificant peak shifts, (approximately +200 V) with continuous and pulsed sputtering,but the spectra are still present. This indicates that at 2 keV, the Xe+ beam isdeflected by a 200 V increase in sample bias that is responsible for the signal lossbecause the sputtered atom cloud is no longer in alignment with the laser beam and/orsecondary ion optics. At higher energy, the lower angle of incidence is not changedmuch by the additional 200 V. The semiconducting GaAs samples exhibit minimalcharging.
Data obtained with O+2 sputtering on the semi-insulating sample exhibited less shift
(50 V) compared to Xe+. A partial explanation for this is that the positive secondaryion yield is enhanced with O+
2 sputtering relative to Xe+. The net charge on the sampleis therefore reduced somewhat as these ions leave the sample for the extractor.Secondary electrons should not contribute significantly to the net charge producedunder any sputtering conditions, because the high extraction potential effectivelysuppresses their emission.
An interesting observation is that greater signals came from craters that were closer tothe sample holder or edge. This can be partially explained by the density ofequipotential lines. In this instrument, ions are passed through a fixed energy windowset to transmit those ions created in the gas-phase by the laser beam just above thesample's surface. Normally, in the case of parallel plane electrode geometry, perhapshalf of the sputtered atoms lay outside the space that defines this window. They arestill ionized by the laser, just not passed through the electrostatic analyzer. Near thediscontinuities of the sample borders, the equipotential lines are spaced farther apart,in effect increasing the solid area passed by the energy analyzer; more atoms aretherefore detected. Away from edge effects, the field lines are closer together, makingsignals much more reproducible, but at the expense of ion transmission.
Conclusions
The spectra of sputtered Ga atoms perturbed by the electric field (Stark effect) presentin a resonance ionization mass spectrometer are used to measure sample bias changes(charging) during ion bombardment of Ill-V materials. Semi-insulating GaAs experiencessubstantial charging (100's of volts) while semiconducting GaAs may exhibit only transientcharging early in depth profiles. Time resolved measurements show how chargingprogresses as a function of ion dose to the sample. Low energy (2 keV) primary ionbeams are affected more by charging than higher energy (6 keV) beams. Edge effectsof the sample and holder significantly affect the reproducibility of RIMS signals. If primaryion beam deflection and sample edge effects are eliminated, the reproducibility is betterthan ±3%.

- 120 - AECL-11342
References
[1] H.F. Arlinghaus, M.T. Sparr and N. Thonnard, J. Vac. Sci. and Technol. A, 8,2318 (1990).
[2] S.W. Downey, A.B. Emerson, R. F. Kopf and J.M. Kuo, Surf, and Interface Anal.,15, 781 (1990).
[3] S.W. Downey, A.B. Emerson and R.F. Kopf, Nucl. Instr. Meth. Phys., B62, 456(1992).
[4] S.W. Downey, A.B. Emerson and T.R. Fullowan, Appl. Spec, 47, 1245 (1993).
- 1 2 1 - AECL-11342
Ultrasensitive Detection of Krypton-85 Gasusing Photon Burst Mass Spectrometry
C.S. Hansen1" J. Pan and W.M. Fairbank, Jr.Physics Dept, Colorado State Univ., Fort Collins, CO 80523H. Oona, E P. Chamberlin, N.S. Nogar and B.L FeareyLos Alamos National Laboratory, P. O. Box 1663, Los Alamos, NM 87545
Introduction
Although long-lived noble gas radioisotopes have been proposed as candidates for anumber of radiochemical dating and environmental monitoring scenarios [1], their usefor these applications has been severely limited due to their incompatibility with currentconventional ultrasensitive isotope detection methods. Photon Burst MassSpectrometry (PBMS), by combining the mass dispersion of an isotope separator withthe isotopically selective photon burst detection, promises to be a viable technique forultrasensitive detection of many isotopes, including noble gases. Results of recentwork with krypton isotopes (including krypton-85) at the current stage of apparatusdevelopment are presented, along with a summary of changes to be implemented inthe next phase of development. A comparison of experimental results with atheoretical model is include i as well as a short discussion of future capabilitiespredicted by this model.
Photon Burst Detection
The detection scheme we use is based on the fact that single atoms or ions with anoptically isolated pair of energy levels can absorb and emit many photons during thetransit time of a detection region (microseconds). Due to loss from the collectors andquantum efficiency of the photomultiplier tubes, only 3-4% of the spontaneousemission is detected. We require this "burst" of detected photons to be a minimumsize before counting it as a real single atom event The photons are produced by alaser beam (811.5 nm) which is aligned anticollinearly with the krypton beam, both ofwhich lie along one focus of an elliptical chamber. Spontaneous emission from theatoms is imaged by the elliptical surface (Au coated) through a slit at the oppositefocus and onto a photomultiplier tube (Hamamatsu R4519). This geometry, along withthe non-invasive nature of the technique, allows us to use multiple detectors in series.By requiring a minimum number of time correlating events in the detectors, we are
+ Current address: LANL, P.O. Box 1663, MS J514, Los Alamos, NM 87545

- 122 - AECL-11342
able to discriminate against random burst-generating events, such as cosmic raysimpinging on a photocathode.
For krypton, the optically isolated system is between the 1s5 (J=2) and the 2p9 (J'=3)energy levels. For odd Kr isotopes it is the F=13/2 and F'=15/2 hyperfine levels. Thefinal atomic beam velocity, ~3 cm/us, introduces a mass dependent artificial (Doppler)isotope shift leaving the nearest isotopic interference more than 90 natural line widthsaway. Thus, the current level of sensitivity is limited not by isotopic interferences butby background levels due to light scattered from the laser beam as well as PMT darkcounts.
Results
The Kr ions are generated in a microwave ion source [2], accelerated through 50 kV,and imaged through a magnetic sector with an abundance sensitivity of about 105.They are decelerated to 500 volts, to increase the interaction time in the detectionregion, and then neutralized in a Rb vapor (IP = 4.18 eV) to efficiently prepare atomsin the correct electronic state. This is followed by the photon burst detection regionand associated detection electronics.
We have observed time correlated photon burst signals from all major and minor Krisotopes as well as from prepared samples of 85Kr. Correlated burst detection hasyielded a dramatic reduction in background levels and improvement in signal-to-background ratios as compared to results obtained by counting the total fluorescencesignal from a single detector. Dynamic range capabilities on the current apparatus of>108 have been demonstrated using signals from both krypton-83 and krypton-85.Experimental results agree well with our theoretical model for different isotopes over arange of conditions. This model is built on a spreadsheet and treats randomprocesses in an average way. It has been shown to produce results in goodagreement with results from a detailed Monte Carlo simulation of the detectionprocess.
Future Work
The next phase of the project includes changes that will reduce the background levelsand increase the detection efficiency. To increase the efficiency we are adding anadditional 6 collectors to the detection region as well as making changes in the ionbeam characteristics to improve spatial and frequency overlap with the laser beam.Noise levels will be reduced by more efficient cooling of PMT's to lower dark countrates and by improving the coupling of the laser beam into the system in order toreduce the amount of light scattering into the collectors. With these improvementstaken into account, the model indicates that krypton-85 can easily be detected atisotopic abundance levels in the 10"11 range with fairly small sample sizes in a
-123 - AECL-11342
reasonable time frame. For example, if we require a detected burst size >1 in at least5 out of the 10 detectors, we can expect a signal of 500 counts per hour and abackground of less than 1 count in that time with an overall efficiency of >10"4
(detected 85Kr atoms/85Kr at source).
References
[1] B.D. Cannon and T.J. Whitaker, Appl. Phys. B 38, 57 (1985), and referencestherein.
[2] E.P. Chamberlin, K.N. Leung, S. Walthers, R.A. Bibeau, R.L. Stice, G.M. Kelleyand J. Wilson, Nucl. Instrum. Methods B 26, 227 (1987).
- 1 2 4 - AECL-11342
GENERAL
- 125 - AECL-11342
SIMS Studies of the Corrosion of Zirconium
R.L. Tapping*, P.K. Chan*, P.R. Norton** and C-S. Zhang**
*System Chemistry & Corrosion Branch, Chalk River LaboratoriesChalk River, Ontario, KOJ 1PO o (rc I;) c c o c A
**lnterface Science Western,.University of Western Ontario( London, Ontario, N6A 5B7
Introduction
The CANDU core typically contains about 400 or more horizontal fuel channels whichcontain the fuel (12 fuel bundles). The fuel channel is comprised of a central pressuretube surrounded by a calandria tube, which separates the pressure tube from theheavy water moderator. Heavy water flows over the fuel inside the pressure tube, andis heated from about 250°C at the fuel channel inlet to about 305°C at the outlet.
Between the pressure tube and the calandria tube is the gas annulus. The annulusgas is now carbon dioxide in all CANDU reactors, although earlier reactors usednitrogen gas.
The pressure tube is fabricated from a zirconium alloy containing 2.5 wt.% niobium,designated here as Zr-2.5Nb, in order to optimize the reactor's neutron economy whilstretaining adequate corrosion resistance and strength.
Some Corrosion Considerations
Zirconium alloys, and particularly Zr-2.5Nb, have excellent corrosion resistance to mostaqueous environments, but exposure to high temperature water under conditionstypical of those in the core of nuclear power reactors leads to reaction of the alloy withthe water:
Zr + 2D2O -> ZrO2 + 2D2
Some of the hydrogen (deuterium) liberated by the corrosion reaction is absorbed bythe zirconium alloy. It is often assumed that this is the only corrosion reaction,although the formation of a protective zirconium oxide film on the surface means thatdirect reaction of the alloy with the water rapidly becomes unlikely, and that furtherreactions that may be responsible for alloy degradation must take place on theoxidized surface.

-126- AECL-11342
Reactions with the CO2 annulus gas, and with hydrogen impurities in the gas, mayalso be important. The principle degradation reaction for zirconium alloys in reactorcores is not oxidation but the adsorption of hydrogen isotopes, either as a result of anoxidation process or independently. Although zirconium has a strong affinity forhydrogen isotopes, and for oxygen, the solubility of hydrogen in zirconium is very low.At room temperature this solubility is less than 0.1 ppm, and at 300°C, isapproximately 50 ppm (by weight). Thus at room temperature any hydrogen in excessof 0.1 ppm is present as solid hydride. Zirconium hydrides are very brittle, and tend toform at areas of high local stress, hence fracture of the hydrides, which appear asplatelets oriented perpendicular to applied or residual stress gradients, can causefailure of the host zirconium alloy structure.
Surface Science and Zirconium Corrosion
Zirconium exposed to water, air, or any oxidizing environment is rapidly covered with adense, adherent, and hence protective, oxide film. An understanding of the propertiesof this film, the reaction of this film with CANDU reactor environments, the factorscontributing to growth, degradation and repair of this oxide, the rates and mechanismsof diffusion of hydrogen isotopes and oxidizing species through the oxide, etc. are allessential if we are to predict the effects of in-reactor corrosion on pressure tubes.Thus it is clear that surface science plays a critical role in developing an adequatemodel of pressure tube corrosion behaviour. It is the intent of this paper to show howvarious surface science techniques, and in particular SIMS, have contributed to ourunderstanding of zirconium alloy corrosion behaviour, and specially the deuteriumingress behaviour of Zr-2.5Nb.
Water Corrosion Studies
Studies in this area have concentrated on the oxidation of Zr-2.5Nb in 300°C water,and the accompanying absorption of hydrogen (deuterium in heavy water). Surface-related studies have concentrated on identifying the species responsible for hydrogeningress. For this paper the example to be discussed here will be SIMS studies ofvarious polycrystalline zirconium-niobium alloys exposed to water (D2O). A zirconium-20 wt.% niobium (Zr-20Nb) alloy was used to simulate the composition of the Nb-richp-phase that surrounds the a-grains, which have a composition approximated by thezirconium-1 wt.% niobium (Zr-1Nb) alloy, in the as-fabricated pressure tube. Theprincipal application of SIMS here has been the use of dynamic SIMS to determine thedistribution of deuterium in the oxides and the substrate, and the relationship of thesedistributions to the diffusion processes that may be taking place.
The SIMS composition versus depth profiles of the water-exposed Zr-20Nb oxide werefound to be significantly different than those measured for the Zr-1Nb oxide. In thecase of the Zr-1 Nb oxide, the deuterium concentration decreased uniformly into theoxide film to a base level typical of that found in the underlying metal substrate. For
-127- AECL-11342
the oxide formed on the Zr-20Nb oxide, the deuterium concentration dropped rapidly tothe detection limit of the instrument, remained at this level throughout the rest of theoxide, then increased through the oxide-metal interface to a constant concentration inthe metal substrate. During the water exposures it was noted that the oxidation(corrosion) rate for the Zr-20Nb alloy was greater than that for Zr-1Nb, but thedeuterium uptake by the Zr-20Nb alloy, measured by hot vacuum extraction massspectrometry, was considerably less. This result coincides with the lower deuteriumintensity found in the SIMS spectra of the Zr-20Nb oxides. The higher deuteriumconcentrations found in the SIMS spectra of the Zr-1Nb oxides may reflect the greaterporosity of these oxides, with the deuterium adsorbed on the pore surfaces. Theseobservations indicate that there are significant differences in the resistance of theoxides grown on these two alloys to deuterium diffusion.
Gas Phase Corrosion Studies
As noted above, the outside of the CANDU pressure tube is exposed to carbondioxide. Recent studies have concentrated on defining the effects of carbon dioxideon the oxide, and on studies of the oxide breakdown and repair process. The recentperception that gas-side deuterium ingress may be more important to pressure tubehydriding is reflected in the increased emphases here on the gas phase work. Thedynamic SIMS studies to be discussed cover the degradation of the oxide as a resultof exposure to non-oxidizing conditions, and the reaction with carbon dioxide, andcarbon dioxide mixtures with deuterium and oxygen. The diffusion of deuteriumthrough the degraded and repaired dioxides is included. These studies have beeneffectively co-ordinated with XPS analyses of oxide stoichiometry. Studies using staticSIMS have concentrated on fundamental studies of the interaction of oxygen andhydrogen isotopes with single crystal zirconium surfaces. These latter studies havedemonstrated that the combination of static SIMS and AES can provide uniqueinsights into the diffusion of hydrogen as a function of crystal orientation.
XPS characterization was carried out to determine the change in zirconium andniobium oxide stoichiometries with various gas phase exposures (to D2, CO2, CO2 +O2, CO2 + O2 + D2 at 593K, following degradation at various temperatures). DynamicSIMS D-profiles, extending from the oxide surface to the underlying metal substrate,indicated a difference in the nature of the oxides (i.e., deuterium permeability) afterthese various treatments. Specimens analyzed by XPS before vacuum degradationhad normal ZrO2 and Nb2O5 oxide surfaces.
It was concluded from these gas phase exposures that: (1) CO2 is weakly oxidizingand will not repair a degraded oxide; (2) deuterium ingress is associated with oxidesubstoichiometry; (3) deuterium enhanced the reduction or degradation of the oxide;and (4) vacuum-degraded oxide can be repaired with O2.
-128- AECL-11342
Surface Kinetics of Hydrogen on Zr
The previous examples used dynamic SIMS at very high beam currents in order todetermine the deuterium distribution through oxides several Mm thick. This requires aprofiling rate sufficiently rapid to profile the oxide in a reasonable time. By contrast, inorder to take advantage of SIMS' ability to detect H or D directly, and also measuresurface H/D concentrations without significant surface disruption, static SIMS,(SSIMS), can be used.
The Bulk Diffusion of Hydrogen in Zr(0001)
The theoretical principles underlying this application rely on the fact that the surfaceconcentration during the segregation of hydrogen on metal (zirconium) surfaces iscontrolled by bulk diffusion and surface desorption of the solute (hydrogen). Heating asample containing surface-absorbed hydrogen resulted in all of the hydrogendissolving uniformly in the bulk (to give a bulk concentration of a few tens of atomicpm). Quenching resulted in segregation of the hydrogen to the surface. A plot of H"yield versus t1/2 provides estimates of the diffusion coefficient as a function oftemperature.
Addition of oxygen to the sample, to generate a surface layer containing 10 to 20%oxygen over a depth of a few tens of nanometres, resulted in an increase in the bulkdiffusion constant. This result is consistent with the dilation of the zirconium lattice bythe presence of oxygen. The results obtained from this segregation method are ingood agreement with those extrapolated from high temperature data.
Hydrogen Ingress Studied by SSIMS
Using SSIMS, the diffusion of H from the bulk to the surface can be measured, and itcan be shown that equilibrium between surface segregation and bulk diffusion isestablished at >260°C. Above 260°C the surface concentration of hydrogen is <0.05monolayers, and the heat of segregation can be derived from a plot of Hn [H'] vs 1/T.A comparison between heating a sample exposed to 0.5 L hydrogen (generating -0.5monolayers coverage) and one that is clean shows that overlap between the Hn [H'] vs1/T curves, which signifies equilibrium, has been achieved at temperatures >260°C.
Again, modification of the surface region by exposure to oxygen has a profound effecton the hydrogen ingress rate, and results in a decrease in the heat of surfacesegregation, in agreement with the dilation of the zirconium lattice by oxygen.
Both these examples show that SSIMS, using knowledge generated from othersurface studies on the same well-controlled surfaces, provides fundamental data onhydrogen isotope behaviour on zirconium surfaces that can be related to surfacecomposition and structures that are believed to control in-reactor behaviour.
- 129 - AECL-11342
Conclusions
Although detailed results were not presented, the intent of the work summarized herewas to show that SIMS, both dynamic and static, is a valuable part of the work neededto understand the mechanisms of hydrogen adsorption by corroding zirconium alloys.Dynamic SIMS studies have indicated that hydrogen ingress in water-corrodedsamples appears to be preferentially via the a-grains in the unaged a-p Z-2.5Nbmicrostructure, although in the aged material ingress is via the p-phase. Gas-phaseexperiments suggest that oxide breakdown is possible in CO2, and this breakdown canresult in hydrogen ingress. Oxide repair, and prevention of hydrogen ingress, can beeffected by adding oxygen to the CO2.
Static SIMS studies have been used to help understand the hydrogen diffusion andadsorption processes, and show that dilation of the zirconium lattice by oxygenincreases hydrogen diffusion and adsorption. This is an important result, since theregion immediately below the oxide contains dissolved oxygen and can therefore actas a window for hydrogen isotope ingress if hydrogen penetrates to this region.Clearly, the formation and bulk dissolution of the oxide formed on zirconium andzirconium alloy surfaces has a marked effect on hydrogen adsorption and predictionand control of the hydrogen absorption will depend on an understanding of the oxide-metal and oxide-environment interfaces.

-130- AECL-11342
Accelerator Mass Spectrometry: Practice and Prospects
H.R. AndrewsAECL Research, Chalk River Laboratories, Chalk River, Ontario, Canada KOJ 1J0
Introduction
Accelerator Mass Spectrometry (AMS) is one of the most significant developments intrace analysis of the last fifteen years. Traditional applications have been themeasurement of various long-lived cosmogenic isotopes at natural concentrations; inrecent years biomedical applications have been of growing importance. AMS can alsobe used for trace elemental analysis, because for every element except indium, atleast one isotope exists for which there is no stable isobar in adjacent elements. Thisapplication of AMS is finding increasing use in semiconductor characterization andmineral analysis, the latter with microbeam ion sources.
The well-established AMS isotopes, their half-lives and stable isobars are given inTable 1. The standard task of AMS is to determine the isotopic ratio of the rareradioactive isotope to the stable isotopes of the same element. Natural values of thisratio vary from ~10"12 to ~10'15. For isotopes such as 14C, 36CI and 1 2 9 I , which are alsobyproducts of nuclear activities, the ratio can be several orders of magnitude higher insamples from contaminated areas. Straightforward techniques based on electric andmagnetic fields can be used to separate the isotopes of the element. The challenge isto discriminate against stable isobars, which, because they are essentially equal inmass, must be separated on the basis of their nuclear charge, and/or atomic,molecular or chemical properties that proceed therefrom.
Table 1: Standard AMS Isotopes
Isotope10Be14C26AI35CI
(41Ca)
(59Ni)129i
Half-life (years)
1.6x10⁶
5730
7.16x10⁵
3.0x10⁵
1.03X10⁵
7.6x10⁴
1.57X10⁷
Stable Isobar10g
14N26Mg
36S ) 36 A r
4 1 K
S9Co129Xe
(41Ca and S9Ni are not measured routinely in large numbers of samples)

- 1 3 1 - AECL-11342
This paper will review current AMS techniques and then recount a number ofextensions to standard practice that could be applied to other, more difficult, isotopesof scientific or industrial interest. Space limitations preclude detailed discussion butreferences containing more information will be given. The paper ends with aSummary and Outlook.
Present Practice
The success of AMS arises from three factors: the use of negative ions at injection,which suppresses isobars in some cases; the stripping process at the acceleratorterminal, which destroys molecular ions; and the high energy of the acceleratedparticles, which permits the use of sensitive particle identification and detectiontechniques developed for nuclear spectroscopy. Details on many systems, large andsmall, can be found in ref. [1] and references cited therein.
Isotopic separations are achieved by magnetic analyses at injection and afteracceleration, augmented by one of electrostatic analysis or velocity analysis (Wiencrossed-field filter or time of flight) to remove or identify weak parasitic fluxes of othermasses with the same magnetic rigidity as the desired species. The primary isobaricseparation is achieved in case-specific ways: non-existence or instability of thenegative ion: 14N, 26Mg, 36Ar, 129Xe; differing ranges in the detector: 10B; andextensive chemical purification plus particle identification techniques: 36S. Othermethods, to be described in the next section, have been used on occasion in somecases, but among these, the only routine use is the gas-filled magnet for 3SS rejectionat Chalk River.
Prospects
There are a number of other isotopes of scientific or industrial interest listed in Table2. They are produced cosmogenically (C) and/or are fission products (F). Theseisotopes are considerably more difficult to determine and it may not be possible toreach the sensitivities and background limits that are obtained for the standardisotopes in Table 1.
There are many additional techniques for isobaric separation and identification. Threethat will not be discussed further here are: (1) Total stripping, applicable where Z is nottoo large and when Z (AMS) > Z (isobar) as in 36CI vs. 36S, 41Ca vs. 41K, and 59Ni vs.59Co. This technique requires very high energies to be efficient; (2) Resonant lonizationCoupled with AMS. 3) Static electric field ionization, applicable to negative ions of verylow electron affinity. A number of other methods with examples are outlined in thefollowing.

- 1 3 2 - AECL-11342
Table 2: Other Isotopes of Scientific or Industrial Interest(Those labelled (C) are produced naturally; (F) denotes fission product)
Isotope53Mn (C)60Fe (C)
79Se (C,F)
" T c (F)107Pd (F)
126Sn135Cs
Half-life (years)
3.7x10⁶
1.5x10⁶
6.5x10⁴
2.1x10⁵
6.5x10⁶
-10 s
2.3x10⁶
Stable Isobar
5 3 C r
S0Ni79Br
"Ru107Ag
126Te, 126Xe135Ba
1. The Gas-Filled Magnet separates isobars because the mean charge state andtherefore the average magnetic rigidity of the ions is a function of their Z as theyundergo collisions in the low pressure gas filling the magnet box. This oldtechnique [2] has been reintroduced to AMS [3] and is used very successfully atChalk River for the suppression of 36S in 36CI measurements [4]. It can beextended to heavier systems through the use of higher energies and higherresolution spectrometers; it is possible that trajectory reconstruction through themagnet (by sensing the particle position at one or more places along its path)might facilitate suppression of the low intensity tails of scattered particles that limitthe sensitivity in some cases. The effect of the tails is minimized when Z (AMS) <Z (isobar) as in 32Si vs. 32S; 79Si vs. 79Br; 126Sn vs. 126Te; and 13SCs vs. 135Ba. Thetails are exacerbated in the opposite situation, e.g. 36CI vs. 36S; 59Ni vs. 59Co; and41Ca vs. 41K.
2. Isobaric laundering is a term coined in the present paper for the reduction ofisobaric interferences by deliberately introducing a small amount of stable isobar-depleted element and then chemically removing it. If isotopic equilibration isachieved, then the reduction factors can be substantial. Table 3 is calculatedassuming the use of separated isotopes actually in stock at Chalk River. Betterresults should be possible with specially depleted materials. This techniqueshould be applicable to conventional mass spectrometry as well as to AMS.
3. Negative molecular ions can be used to discriminate against isobars in some cases.For example, 32SH3 is not stable whereas 32SiHj is [5]. Similarly in the 79Se-79Brsystem the use of 79SeH' could suppress the interference, since 79BrH' is probablynot stable. This method may be applicable in other cases as well.
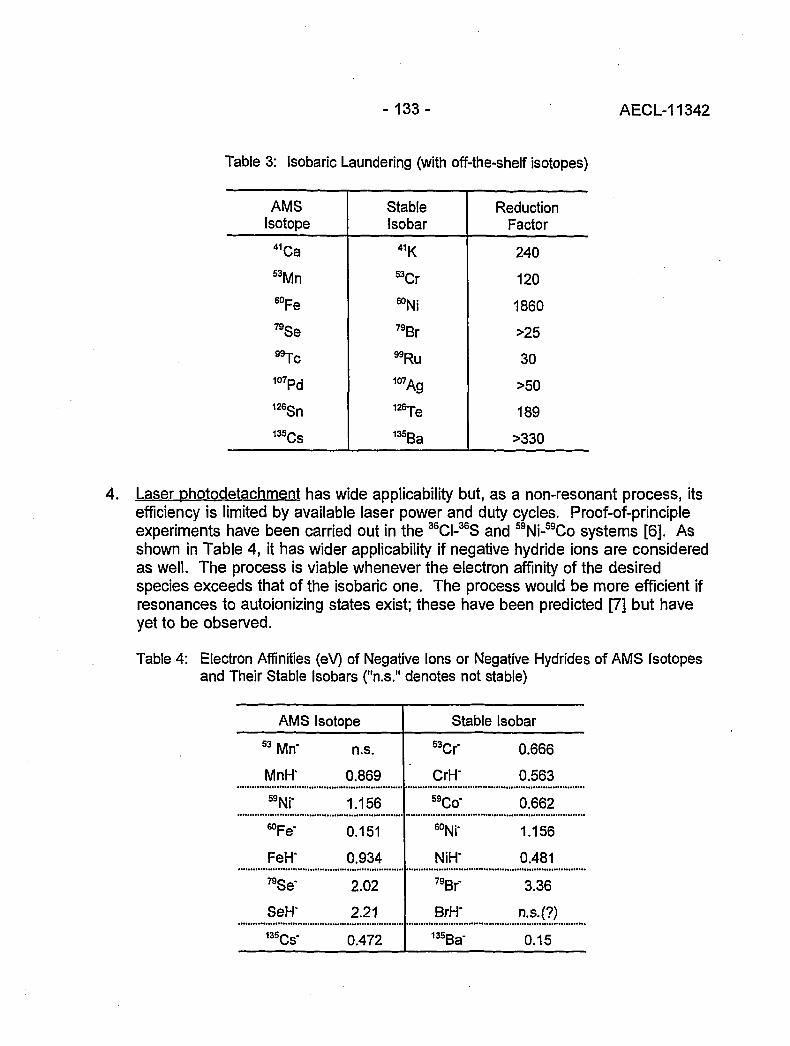
-133- AECL-11342
Table 3: Isobaric Laundering (with off-the-shelf isotopes)
AMSIsotope
41Ca5 3Mn60Fe79Se
"Tc107pd
126Sn135Cs
StableIsobar
4 1 K
53Cr60Ni79Br
"Ru107Ag126Te135Ba
ReductionFactor
240
120
1860
>25
30
>50
189
>330
4. Laser photodetachment has wide applicability but, as a non-resonant process, itsefficiency is limited by available laser power and duty cycles. Proof-of-principleexperiments have been carried out in the 36CI-36S and 59Ni-59Co systems [6]. Asshown in Table 4, it has wider applicability if negative hydride ions are consideredas well. The process is viable whenever the electron affinity of the desiredspecies exceeds that of the isobaric one. The process would be more efficient ifresonances to autoionizing states exist; these have been predicted [7] but haveyet to be observed.
Table 4: Electron Affinities (eV) of Negative Ions or Negative Hydrides of AMS Isotopesand Their Stable Isobars ("n.s." denotes not stable)
AMS
S3Mn-
MnH"
» N r
^Fe"
FeH-
79Se"
SeH'135Cs"
Isotope
n.s.
0.869
1.156
0.151
0.934
2.02
2.21
0.472
Stable
5 3 C r
CrH"59Co"
eoNi-
NiH"7 9Br
BrJ-T135Ba-
Isobar
0.666
0.563
0.662
1.156
0.481
3.36
n.s.(?)
0.15

-134- AECL-11342
5. The use of K X-ray Identification is a method that is generally applicable butlimited in sensitivity because of inefficiencies in production and detection of the Xrays. This approach is being evaluated in a number of laboratories and someresults have been published (e.g. [8]). The systematics of projectile K-vacancyproduction have been investigated as a function of ion energy and target species[9]. The cross sections increase as a power-law of ion energy. Thus for energies>100 MeV vacancy probabilities can exceed 1%. Because of X ray line structure,high resolution detectors are needed and Doppler broadening must be minimizedby the use of detectors with relatively small solid angle. This technique isprobably most applicable to the determination of fission-product isotopes for whichthe isotopic ratios can be several orders of magnitude higher than those typical ofcosmogenic species.
Summary and Outlook
AMS has become an important analytical tool for the study of a number of natural andman-made long-lived isotopes. The standard techniques are well developed and themeasurements have become routine at many laboratories around the world. Thereare a number of other cases that are of potential interest as natural tracers or in themonitoring of wastes from nuclear activities. These are generally more difficult andrequire new methods or extensions of present techniques. In many cases it is unlikelythat the exquisite sensitivities achieved in the "standard" cases will be attained.
Acknowledgements
The author would like to thank R.J.J. Cornett and V.T. Koslowsky of Chalk River,L.R. Kilius and A.E. Litherland of Isotrace Laboratory, University of Toronto andH.K. Haugen of McMaster University for helpful discussions.
References
[1] Proceedings of the Sixth International Conference on Accelerator MassSpectrometry edited by L.K. Fifield, D. Fink, S.H. Sie and C. Tuniz, Nucl. Instr.and Meth. B92 (1994).
[2] C.B. Fulmer and B.L. Cohen, Phys. Rev. 109, 94 (1958).
[3] M. Paul, B.G. Glagola, W. Henning, J.G. Kelber, W. Kutschera, Z. Liu, K.G.Rehm, B. Schneck and R.H. Siemssen, Nucl. Instr. and Meth. A277, 418 (1989).
[4] H.R. Andrews, G.C. Ball, R.M. Brown, R.J.J. Comett, W.G. Davies, B.F. Greiner,Y. Imahori, V.T. Koslowsky, J.W. McKay, G.M. Milton and J.C.D. Milton, Nucl.Instr. and Meth. B52, 243 (1990).
- 135 - AECL-11342
[5] J. Heinemeier, P. Hornshoj, H.L. Nielsen, N. Rud and M.S. Thomsen, Nucl. Instr.and Meth. B29, 110(1987).
[6] D. Berkovits, E. Boaretto, G. Hollos, W. Kutschera, R. Naaman, M. Paul and Z.Vager, Nucl. Instr. and Meth. A281, 663 (1989) and B52, 378 (1990).
[7] E.V. Vidolova-Angelova, L.N. Ivanov, E.P. Ivanova and V.S. Letokhov, Opt.Spectrosc. (USSR) 54, 350 (1983).
[8] H. Artigalas, J.L Debrun, L Kilius, X.L Zhao, A.E. Litherland, J.L. Pinault, L.Fouillac and C.J. Maggiore, Nucl. Instr. and Meth. f392, 227 (1994).
[9] W.E. Meyerhof, R. Anholt, T.K. Saylor, S.M. Lazarus, A. Little and L.F. Chase,Jr., Phys. Rev. A14, 1653 (1976).

-136- AECL-11342
Isotopes at CEA (France) / , r
Jean R. Cesario '••// c r : /,.<•/Commissariat a I'Energie Atomique, Direction du Cycle du Combustible, C. E. Saclay,91191 - Gif sur Yvette, France.
Introduction
Numerous activities in nuclear R&D induce the use of various mass spectrometricmeasurements ; the choice of methods is determined by considerations such asnature of the material (mineral or organic), radioactivity, availability of the material inlarge or small amounts, precision requirements, ... This extended abstract states somesignificant examples of isotope production and measurement methods.
Isotope Measurements
Nuclear Field
Waste Storage
The nuclear community states that a well designed waste storage is likely to last aslong as a natural ore deposit. This idea has generated many investigations all over theworld around notion of natural analogs.
The Oklo phenomenon is an interesting source of information about long-termunderground storage for nuclear wastes. Among various measurement techniques, ithas been useful to provide a tool for microscopic elemental and isotopicmeasurements on polished Oklo cuttings. Holliger in Cadarache (trad. AECL TR-614,COG-93-345) using a Cameca ion microprobe obtains precise results. New significantdates are consequently established; in the meantime information obtained fromuranium oxide grain studies should make it possible to assess the geochemicalbehavior of numerous elements in a given mineralogical phase (Table I) and toimprove the modeling of transfer processes in radioactive waste disposal sites.
Environmental isotopes can be used as representative tracers of underground waterand salt movements. Recently the use of 36CI formed in the atmosphere by:
40Ar (p, na) - * 36CI t1/2= 3 x 10⁵ a
has been found especially interesting for investigations of large aquifers with slowturnover, as in arid lands. This isotope can only be measured by accelerator massspectrometry. Scientists in CEA work to improve the possibilities of their acceleratormass spectrometer, the Tandetron in Gif sur Yvette.
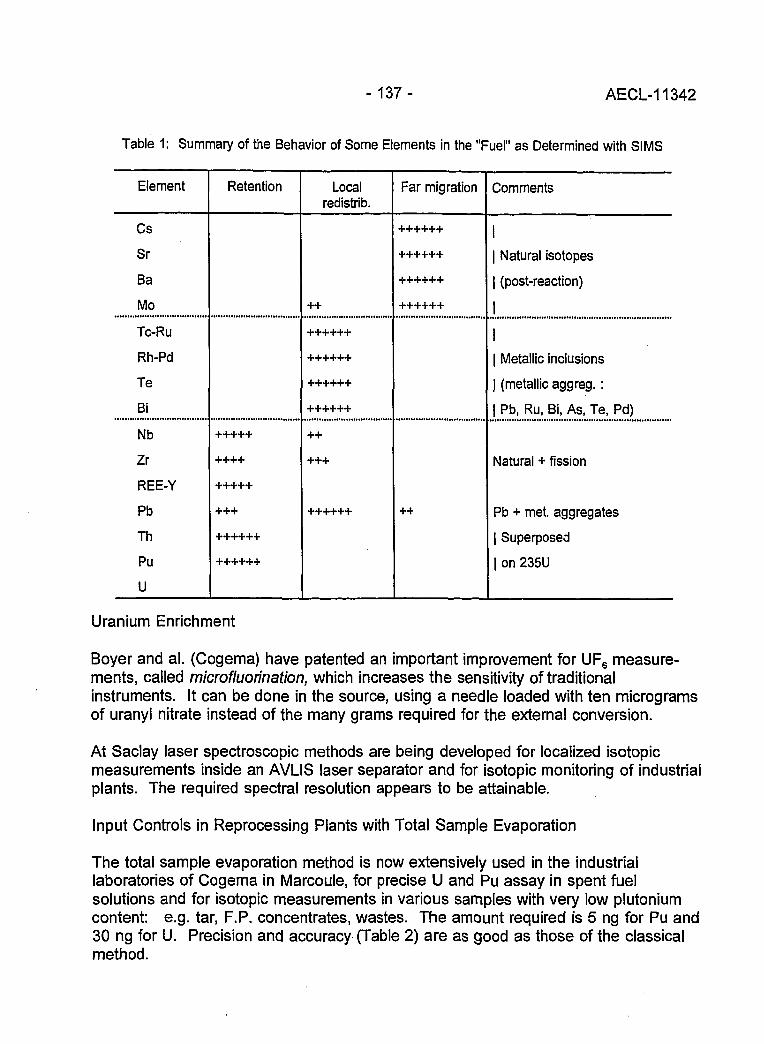
-137 - AECL-11342
Table 1: Summary of the Behavior of Some Elements in the "Fuel" as Determined with SIMS
Element
Cs
Sr
Ba
Mo
Tc-Ru
Rh-Pd
Te
Bi
Nb
Zr
REE-Y
Pb
Th
Pu
U
Retention
++++
+++++
+++
++++++
++++++
Localredistrib.
++
++++++
++
+++
++++++
Far migration
++++++
++++++
Comments
1| Natural isotopes
| (post-reaction)
11| Metallic inclusions
) (metallic aggreg.:
| Pb, Ru, Bi, As, Te, Pd)
Natural + fission
Pb + met. aggregates
| Superposed
| on 235U
Uranium Enrichment
Boyer and al. (Cogema) have patented an important improvement for UF6 measure-ments, called microfluorination, which increases the sensitivity of traditionalinstruments. It can be done in the source, using a needle loaded with ten microgramsof uranyl nitrate instead of the many grams required for the external conversion.
At Saclay laser spectroscopic methods are being developed for localized isotopicmeasurements inside an AVLIS laser separator and for isotopic monitoring of industrialplants. The required spectral resolution appears to be attainable.
Input Controls in Reprocessing Plants with Total Sample Evaporation
The total sample evaporation method is now extensively used in the industriallaboratories of Cogema in Marcoule, for precise U and Pu assay in spent fuelsolutions and for isotopic measurements in various samples with very low plutoniumcontent: e.g. tar, F.P. concentrates, wastes. The amount required is 5 ng for Pu and30 ng for U. Precision and accuracy (Table 2) are as good as those of the classicalmethod.

- 138 - AECL-11342
Table 2: Total Evaporation Measurements (Source: Cogema - Marcoule)
Sample
Plutonium NBS 947
(1/Jan/94)
Uranium NBS U010
Uranium NBS U500
Ratio
238/239
240/239
241/239
242/239
234/238
235/238
236/238
234/238
235/238
236/238
Rref.
0.00328
0.24118
0.02048
0.0156
0.000055
0.01014
0.000069
0.010422
0.9997
0.001519
Rmeas.
0.00335
0.24115
0.02042
0.01558
0.000058
0.010143
0.000069
0.010424
0.09992
0.001537
Rel.Ext.Repr.f
0.7%
0.002%
0.03%
0.03%
3.0%
0.01%
1.7%
0.02%
0.002%
0.3%
t relative mean standard deviation for 10 measurements
Non-nuclear field
Climatology
Climatology data obtained by CEA come essentially from laboratories co-operated byCEA and CNRS. Surprisingly, a considerable amount of the best results obtainedeven recently are from mass spectrometers designed 20 or more years ago in Saclay,by Roth, Lohez, Chavignol and their fellows.
Fundamental climatology data have been published [1] and concern the Vostock icecore in Antarctica. Continuous recording of deuterium and CO2 content over 2000 mdepth (160 000 years) is interpreted in terms of atmospheric temperature changes.The results support the climatic role of orbital forcing.

-139- AECL-11342
By extending dating capacities with radiogenic argon, Turpin (CFR, Gif sur Yvette) isworking to decrease the required rock sample amount from 30 mg to <1mg. Thisshould lead to dating of young marine sediments for paleoclimatology, connecting K-Arand 14C methods around 3 x 10⁴ years ago.
Archeology
32S is enriched relative to 34S during the reduction of sulfates to sulfides by anaerobicbacteria. One can observe relative variations up to several percent. Cinnabar (HgS) isthe red vermilion pigment used by Mediterranean artists for frescoes in southernFrance (-100 to +100 years around Christ). By measuring 32S/MS ratios in samplesand comparing results with Italian and Spanish cinnabar deposits, we obtainedinformation about trade practices at this period. The pigment appears to come fromSpain as shown in the following table.
Origin
Almaden (Spain)
Amiata (Italy)
fresco sample
d%0
+11,2 + 0,5
+ 1,9 ±0,5
+12,0 ±1,0
Trends
GD-MS
This type of mass spectrometry has been commercialized several years ago by VGwith the VG 9000. C. Blain and colleagues in Saclay are working to couple a glowdischarge source with a Mattauch-Herzog mass spectrometer (Thomson TSN 212),initially equipped with a spark source. This operation aims to allow: comparison ofspark source and glow-discharge without instrumental effects, direct isotopicmeasurements (with electrical detection), and maximum data utilization for tracesanalysis. Unlike machines equipped only with electrical detection, it is here possible touse a photoplate which is a near ideal integrator. Isotopic compositions are easilymeasured. Sample consumption is about 1 mg/h.
ICP-MS
Three machines adapted to the analysis of radioactive materials are running or undersettlement in different locations. The main applications are trace elements in PuO2
(Cogema, La Hague), Np and monoisotopic elements in experimental nuclear fuels(Saclay), isotopic composition and trace elements in spent fuel solutions (even withquadrupoles, precision and accuracy may be good enough to provide data related to

- 140 - AECL-11342
criticality at the input of reprocessing plants), and long lived fi' emitters (107Pd, 1 2 9 I ,237Np) in environmental samples or in leach-waters from experimental waste matrices(CEA Cadarache).
ICR: A Fair Way To Stable Isotope Production
Production of small amounts of separated or enriched isotopes is of specialimportance for spiking and labeling. Among the various methods able to producethese isotopes Ion Cyclotron Resonance seems well suited because of its flexibilityand moderate investment. An important difference between ICR mass spectrometersand isotope separators is that instead of an ion beam a plasma is used. The quasineutral mixture of ions and electrons in the plasma cause space charge effects to bereduced. Important also is the use of microwave heating of electrons in the sourceregion.
Many elements have been submitted to separation experiments: Ca, Cr, Ni, Cu, Zn,Pd, Ba, Gd, and Yb. Experiments done with Ca, Cr, Ba and Yb support estimationsof separation costs performed with the code RICAN. Diagnostics of the plasma havebeen fully completed and it is now considered that new improvements in terms ofenrichment factors (presently varying between 2 and 130 for different elements) andmass flow rate will be obtained only by upgrading of the ERIC machine. In the nearfuture it is planned to increase microwave power so that elements like 48Ca could beavailable in commercial quantities. In a longer term, construction of a newsuperconducting magnet will allow production of separated isotopes for higher masselements such as Gd.
At large scale the cost is expected to be lower by, at least, one order of magnitude ascompared to that for the calutrons.
Conclusion
This modest review is intended to give a partial - and probably biased - presentation oforiginal works in CEA and Cogema laboratories, largely spread over France. It hasbeen possible to notice that among interesting developments, some of the mostremarkable applications are always indebted to Professor Nier's principles.
All people cited hereafter would certainly be happy to come in touch with thoseinterested.
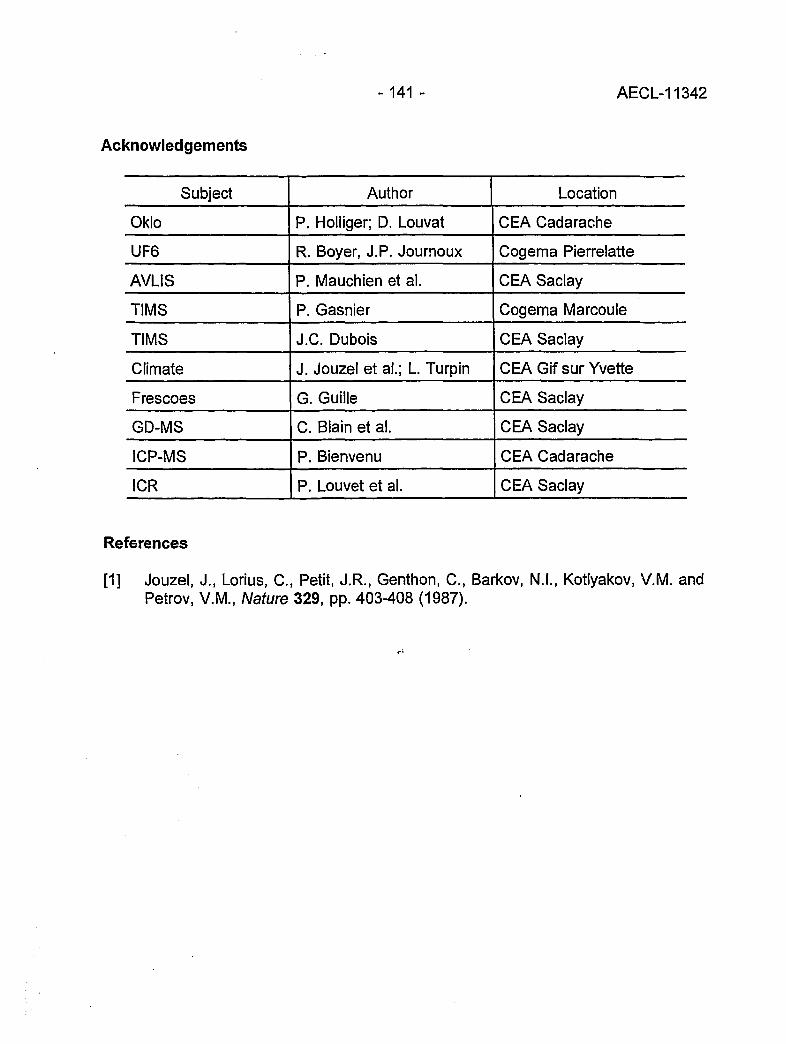
-141 - AECL-11342
Acknowledgements
Subject
Oklo
UF6
AVLIS
TIMS
TIMS
Climate
Frescoes
GD-MS
ICP-MS
ICR
Author
P. Holliger; D. Louvat
R. Boyer, J.P. Joumoux
P. Mauchien et al.
P. Gasnier
J.C. Dubois
J. Jouzel et al.; L. Turpin
G. Guille
C. Blain et al.
P. Bienvenu
P. Louvet et al.
Location
CEA Cadarache
Cogema Pierrelatte
CEA Saclay
Cogema Marcoule
CEA Saclay
CEA Gif sur Yvette
CEA Saclay
CEA Saclay
CEA Cadarache
CEA Saclay
References
[1] Jouzel, J., Lorius, C, Petit, J.R., Genthon, C, Barkov, N.I., Kotlyakov, V.M. andPetrov, V.M., Nature 329, pp. 403-408 (1987).

-142- AECL-11342
SYMPOSIUM SCHEDULE
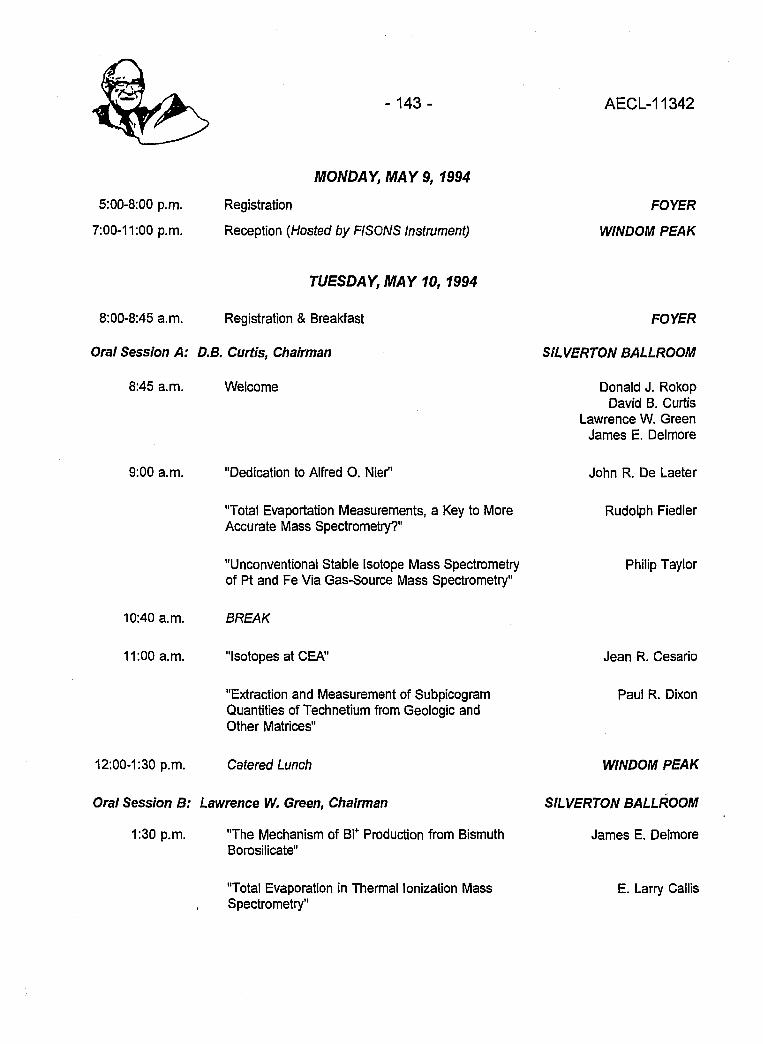
5:00-8:00 p.m.
7:00-11:00 p.m.
-143-
MONDAY, MAY 9, 1994
Registration
Reception {Hosted by FISONS Instrument)
AECL-11342
FOYER
WINDOM PEAK
TUESDAY, MAY 10, 1994
8:00-8:45 a.m. Registration & Breakfast
Oral Session A: D.B. Curtis, Chairman
8:45 a.m. Welcome
9:00 a.m.
10:40 a.m.
11:00 a.m.
12:00-1:30 p.m.
"Dedication to Alfred O. Nier"
"Total Evaportation Measurements, a Key to MoreAccurate Mass Spectrometry?"
"Unconventional Stable Isotope Mass Spectrometryof Pt and Fe Via Gas-Source Mass Spectrometry"
BREAK
"Isotopes at CEA"
"Extraction and Measurement of SubpicogramQuantities of Technetium from Geologic andOther Matrices"
Catered Lunch
Oral Session B: Lawrence W. Green, Chairman
1:30 p.m. "The Mechanism of Bi+ Production from BismuthBorosilicate"
"Total Evaporation in Thermal lonizalion MassSpectrometry"
FOYER
StLVERTON BALLROOM
Donald J. RokopDavid B. Curtis
Lawrence W. Green
James E. Delmore
John R. De Laeter
Rudolph Fiedler
Philip Taylor
Jean R. Cesario
Paul R. Dixon
WINDOM PEAK
SILVERTON BALLROOM
James E. Delmore
E. Larry Callis
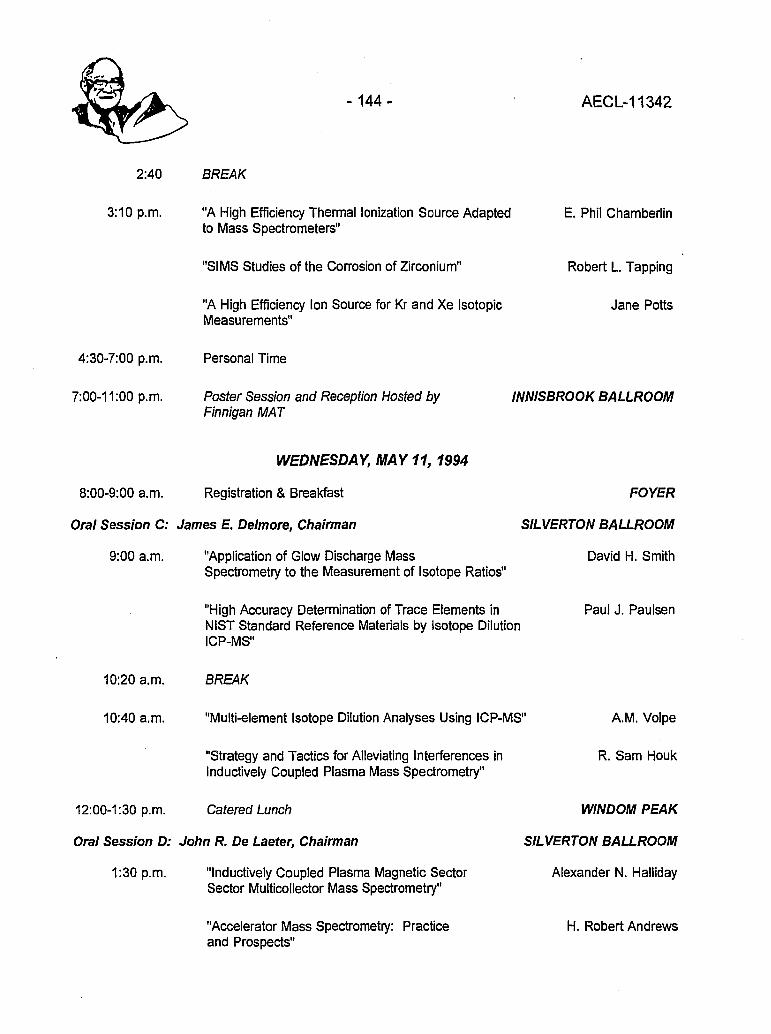
2:40
3:10 p.m.
4:30-7:00 p.m.
7:00-11:00 p.m.
-144-
BREAK
"A High Efficiency Thermal lonization Source Adaptedto Mass Spectrometers"
"SIMS Studies of the Corrosion of Zirconium"
"A High Efficiency Ion Source for Kr and Xe IsotopicMeasurements"
Personal Time
Poster Session and Reception Hosted byFinnigan MAT
AECL-11342
E. Phil Chamberlin
Robert L Tapping
Jane Potts
INNISBROOK BALLROOM
WEDNESDAY, MAY 11,1994
8:00-9:00 a.m. Registration & Breakfast
Oral Session C: James E. Delmore, Chairman
9:00 a.m. "Application of Glow Discharge MassSpectrometry to the Measurement of Isotope Ratios"
"High Accuracy Determination of Trace Elements inNIST Standard Reference Materials by Isotope DilutionICP-MS"
10:20 a.m. BREAK
10:40 a.m. "Multi-element Isotope Dilution Analyses Using ICP-MS"
"Strategy and Tactics for Alleviating Interferences inInductively Coupled Plasma Mass Spectrometry"
FOYER
SILVERTON BALLROOM
David H. Smith
Paul J. Paulsen
A.M. Volpe
R. Sam Houk
12:00-1:30 p.m. Catered Lunch
Oral Session D: John R. De Laeter, Chairman
1:30 p.m. "Inductively Coupled Plasma Magnetic SectorSector Multicollector Mass Spectrometry"
"Accelerator Mass Spectrometry: Practiceand Prospects"
WINDOM PEAK
SILVERTON BALLROOM
Alexander N. Halliday
H. Robert Andrews
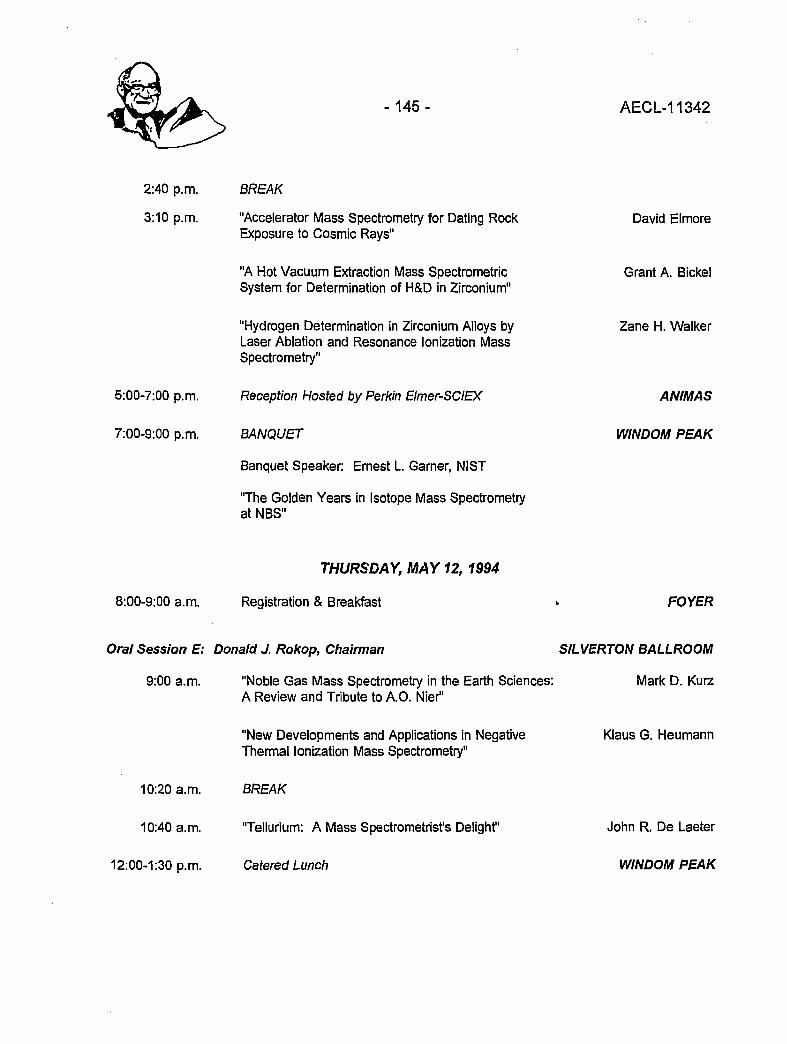
- 1 4 5 - AECL-11342
2:40 p.m. BREAK
3:10 p.m. "Accelerator Mass Spectrometry for Dating RockExposure to Cosmic Rays"
"A Hot Vacuum Extraction Mass SpectrometricSystem for Determination of H&D in Zirconium"
"Hydrogen Determination in Zirconium Alloys byLaser Ablation and Resonance lonization MassSpectrometry"
5:00-7:00 p.m. Reception Hosted by Perkin Elmer-SCIEX
7:00-9:00 p.m. BANQUET
Banquet Speaker: Ernest L. Garner, NIST
"The Golden Years in Isotope Mass Spectrometryat NBS"
David Elmore
Grant A. Bickel
Zane H. Walker
ANIMAS
WINDOM PEAK
8:00-9:00 a.m.
THURSDAY, MAY 12, 1994
Registration & Breakfast FOYER
Oral Session E: Donald J. Rokop, Chairman
9:00 a.m.
10:20 a.m.
10:40 a.m.
12:00-1:30 p.m.
"Noble Gas Mass Spectrometry in the Earth Sciences:A Review and Tribute to A.O. Nier"
"New Developments and Applications in NegativeThermal lonization Mass Spectrometry"
BREAK
"Tellurium: A Mass Spectrometrist's Delight"
Catered Lunch
SILVERTON BALLROOM
Mark D. Kurz
Klaus G. Heumann
John R. De Laeter
WINDOM PEAK

AECL-11342
Cat No. /No de cat: CC2-11342EISBN 0-660-16412-4
ISSN 0067-0367To identify individual documents in the series, we have assigned anAECL- number to each.
Please refer to the AECL- number when requesting additional copies ofthis document from:
Scientific Document Distribution Office (SDDO)AECLChalk River, OntarioCanada KOJ1J0
Fax:(613)584-1745 Tel: (613)584-3311ext 4623
Price: D
Pour identifier les rapports individuels faisant partie de cette serie, nousavons affect6 un numeVo AECL- a chacun d'eux.
Veuillez indiquer le numeYo AECL- lorsque vous demandez d'autresexemplaires de ce rapport au:
Service de Distribution des Documents OfficielsEACLChalk River (Ontario)Canada KOJ 1J0
Fax: (613) 584-1745 Tel: (613) 584-3311poste4623
Prix:D
Copyright© Atomic Energy of Canada Limited, 1996
CA9600722 - CA9600749
AECL-11342
Proceedings of the Second Alfred O. Nier Symposiumon Inorganic Mass Spectrometry
Sponsored by the Los Alamos National Laboratoiy,the Chalk River Laboratory and the Idaho NationalEngineering Laboratory
May 9-12 1994, Durango, Colorado
January 1996 JanvierVOL 27f t
AECL-11342
Proceedings of the Second Alfred O. Nier Symposiumon Inorganic Mass Spectrometry
Durango, Colorado1994 May 9-12
compiled and edited byLawrence W. Green
AECLChalk River Laboratory
Chalk River, Ontario KOJ 1J01996 January
Acknowledgements
Symposium Organizing Committee
D.J. RokopJ.E. DelmoreL.W. Green
Symposium Coordination
L HerraraE. RoybalS. Salazar
Word Processing
M. Schwantz
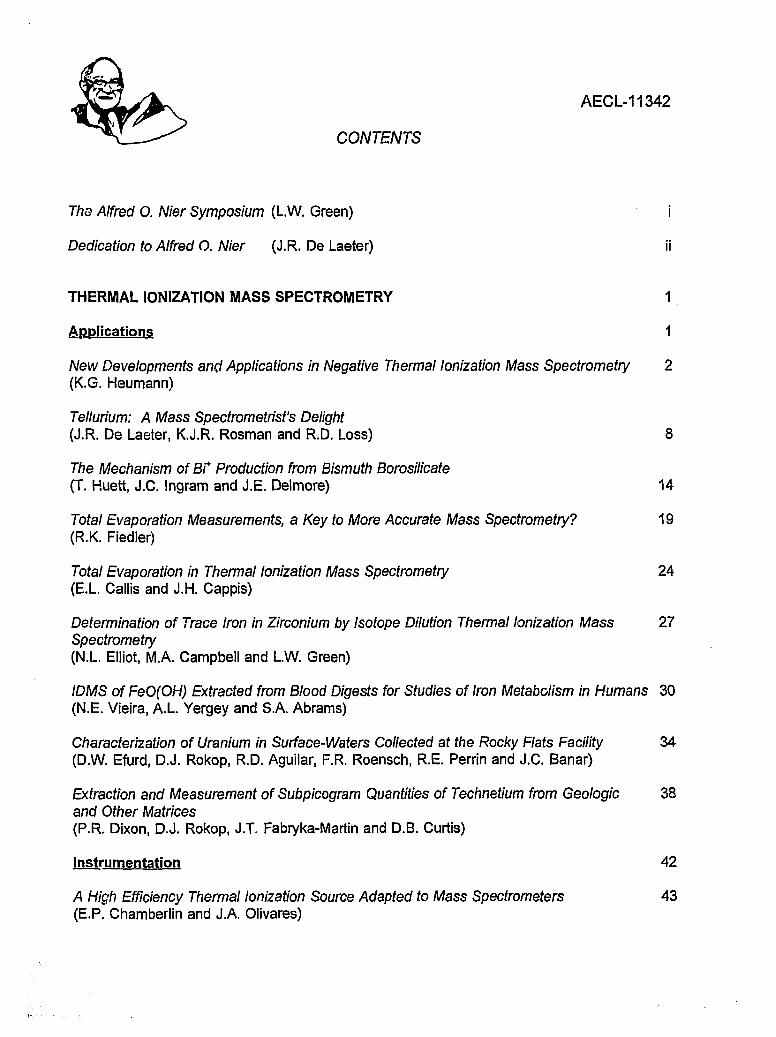
AECL-11342
CONTENTS
The Alfred O. Nier Symposium (L.W. Green) i
Dedication to Alfred O. Nier (J.R. De Laeter) ii
THERMAL IONIZATION MASS SPECTROMETRY 1
Applications 1
New Developments and Applications in Negative Thermal lonization Mass Spectrometry 2(K.G. Neumann)
Tellurium: A Mass Spectrometrist's Delight(J.R. De Laeter, K.J.R. Rosman and R.D. Loss) 8
The Mechanism of Bt Production from Bismuth Borosilicate(T. Huett, J.C. Ingram and J.E. Delmore) 14
Total Evaporation Measurements, a Key to More Accurate Mass Spectrometry? 19(R.K. Fiedler)
Total Evaporation in Thermal lonization Mass Spectrometry 24(E.L. Callis and J.H. Cappis)
Determination of Trace Iron in Zirconium by Isotope Dilution Thermal lonization Mass 27Spectrometry(N.L. Elliot, MA Campbell and LW. Green)
IDMS of FeO(OH) Extracted from Blood Digests for Studies of Iron Metabolism in Humans 30(N.E. Vieira, A.L. Yergey and S.A. Abrams)
Characterization of Uranium in Surface-Waters Collected at the Rocky Flats Facility 34(D.W. Efurd, D.J. Rokop, R.D. Aguilar, F.R. Roensch, R.E. Perrin and J.C. Banar)
Extraction and Measurement of Subpicogram Quantities of Technetium from Geologic 38and Other Matrices(P.R. Dixon, D.J. Rokop, J.T. Fabryka-Martin and D.B. Curtis)
Instrumentation 42
A High Efficiency Thermal lonization Source Adapted to Mass Spectrometers 43(E.P. Chamberlin and J.A. Olivares)

AECL-11342
CONTENTS(continued)
Instrumental Improvements on a Two Stage (B-RPQ) Mass Spectrometer with Very 49High Abundance Sensitivity(J.B. Schwieters and P. Bach)
Performance Indications for TIMS with a Deceleration Lens System and Post- 57Deceleration Detector Selection(P. van Calsteren, D. Wright and S. Turner)
Evaluation of a L.A.N.L Designed Turret 64(J. Banar, R.D. Aguilar, P.R. Dixon, R.E. Perrin and D.J. Rokop)
INDUCTIVELY COUPLED PLASMA AND GLOW DISCHARGE MASS 69SPECTROMETRY
High Accuracy Determination of Trace Elements in NIST Standard Reference 70Materials by Isotope Dilution ICP-MS(P.J. Paulsen and E.S. Beary)
Multi-element Isotope Dilution Analyses Using ICP-MS(A.M. Volpe) 75
ICP Magnetic Sector Multiple Collector Mass Spectrometry and the Precise 80Measurement of Isotopic Compositions using Nebulization of Solutions andLaser Ablation of Solids(A.N. Halliday, D.-C. Lee, J.N. Christensen, W. Yi, CM. Hall, C.E. Jones,D.A.H. Teagle, A.J. Walder and P.A. Freedman)
Application of Glow Discharge Mass Spectrometry to the Measurement of 84Isotope Ratios(L.R. Riciputi, D.C. Duckworth, CM. Barshick and D.H. Smith)
GASES 89
Unconventional Stable Isotope Mass Spectrometry of Fe, Pt and W via Gas Source 90Mass Spectrometry(P.D.P. Taylor, S. Valkiers, P. De Bievre, U. Flegel, and Th. Kruck)
A Hot Vacuum Extraction Mass Spectrometric System for Determination of H&D 95in Zirconium(L.W. Green, G.A. Bickel, P.K. Leeson, M.W.D. James, P.K. Leeson, T.G. Lamarcheand H. Michel)

AECL-11342
CONTENTS(continued)
A High Efficiency Ion Source for Kr and Xe Isotopic Measurements 100(J. Poths and E.P. Chamberlin)
LASER RESONANCE IONIZATION 105
Resonant Laser Ablation: Mechanisms and Applications 106(J.E. Anderson, R. Bodla, G.C. Eiden, N.S. Nogarand C.H. Smith)
Hydrogen Determination in Zirconium Alloys by Laser Ablation and Resonance 111lonization Mass Spectrometry(G.A. Bickel, Z.H. Walker, F.C. Sopchyshyn and LW. Green)
Measurement of Sample Charging during Sputtering of Ill-V Materials and Devices 115(S.W. Downey and A.B. Emerson)
Uftrasensif/ve Detect/on of Krypton-85 Gas using Photon Burst Mass Spectrometry 121(C.S. Hansen, J. Pan, W.M. Fairbank, Jr., H. Oona, E.P. Chamberlin, N.S. Nogarand B.L. Feary)
GENERAL 124
SIMS Studies of the Corrosion of Zirconium 125(R.L. Tapping, P.K. Chan, P.R. Norton and C-S. Zhang)
Accelerator Mass Spectrometry: Practice and Prospects 130(H.R. Andrews)
Isotopes at CEA 136(J.R. Cesario)
SYMPOSIUM SCHEDULE 142
- i - AECL-11342
The Alfred O. Nier Symposium
The Alfred O. Nier Symposium on Inorganic Mass Spectrometry was founded in 1991to bring together scientists in the field of isotope and elemental analysis using massspectrometers. It was named after Al Nier because of his pioneering work andleadership in this field, and attracts scientists from many disciplines: nuclearchemistry, environmental monitoring, geochronology, life sciences, astronomy, andclimatology, all of which Professor Nier made significant contributions to. At the firstsymposium, which was also an 80th birthday celebration for Al, he presented hisretirement project "Helium and Neon Isotopes in Extraterrestrial Dust Particles" and, inthe evening, entertained the audience with an account of his experiences in theManhattan Project. He was delightful to listen to and fondly remembered by all.
Tragically, Al was mortally wounded in a car accident days prior to the secondsymposium. He regained consciousness for the opening address of ihe symposiumand dedication by John De Laeter, which he listened to by telephone from his hospitalbed. He passed away a few days later. Although saddened, the speakers carried onto give excellent scientific presentations, as a tribute to Al Nier, and thesepresentations are summarized herein. Furthermore, some of the speakers decided toprepare full papers which are published in a special memorial issue of InternationalJournal of Mass Spectrometry and Ion Processes, Vols. 146/147, (1995). The nextA.O. Nier Symposium will be in the spring of 1997, and there will be a Nier lecturer,chosen by the organizing committee, at this and subsequent meetings.
Lawrence W. Green

- i i - AECL-11342
Dedication to Alfred O. Nier
John R. De LaeterDepartment of Applied Physics, Curtin University of TechnologyPerth, Western Australia
We all have our personal heroes - Al Nier will always be one of mine. Although I waseducated in a small Physics Department in one of the most isolated cities in the world,the name of Professor Alfred 0 Nier was well known to me, because he was heldin such high esteem by my Ph.D. supervisor, Dr Peter Jeffery, and I quickly learned toadmire him too.
I was in such awe of Professor Nier, that when I first saw him at a Meteoritical SocietyMeeting in Mainz in Germany in 1983, it took me a long time to pluck up enoughcourage to speak to him. But then I discovered, what hundreds of other people havefound, that Al Nier was a humble, easy going, fun-loving human being, generous to afault and eager to help other people. Almost before I realised it, he and his wife Ardishad asked my wife and me to join them for dinner at the Conference Banquet. And sobegan a friendship which I cherish deeply.
Over the years I met him and his family on many occasions, and he was always thesame. His endless enthusiasm for science, his genuine interest in other people, andhis ability to tell a good story, remained unchanged.
I still remember the first story he told me. For many decades there was adisagreement between the chemists and the physicists over the value of atomicweights, due to the fact that the chemical scale was based on elemental oxygen,whilst physicists used oxygen-16 as their base. Al was a newly elected member ofthe International Commission on Atomic Weights when he came up with the idea (in abar in Amsterdam), of using carbon-12 as the common base for atomic weights. Hethen went to the Max Planck Institute at Mainz where he convinced the Director,Professor Josef Mattauch, of the idea. Mattauch was so excited about the possibilityof uniting the two warring factions, that he set off to Paris to convince his physicscolleagues, but forgot his passport and was stopped at the border. Al was dulydespatched with the missing passport to rescue Mattauch, and carbon-12 wassubsequently adopted as the base for the atomic weights table, and is still in usetoday.
In fact it is not generally known that the first absolute measurements of the isotopicabundances of an element were carried out by Al Nier in 1950. He calibrated a massspectrometer using enriched isotopes of argon (which he had produced himself), andthen used this spectrometer to measure the isotopic composition of nine other

-H i - AECL-11342
elements. The atomic weight of argon is still based on this 44 year old measurement,as is the Universal Gas Constant R, which is derived in part from it. The InternationalUnion of Pure and Applied Chemistry still accepts Al Nier's isotopic measurements ofargon, xenon and osmium as the "best measurement" from a single source [1],
He once described himself as "more of a gadgeteer than most physicists". But that isan inappropriate assessment. He was a brjlliant experimental physicist who developedgeneration after generation of mass spectrometers both small and large, withpainstaking improvements in instrumentation based on deceptively simple designs.
His most important design was the 60° sector field mass spectrometer which replacedthe more complicated 180° versions which had previously been used. This simpledesign not only reduced the weight and power consumption of the electromagnet,but enabled the ion source and detector to be removed from the influence of themagnetic field. However, of more significance was the fact that the Nier designtransformed what was essentially a physics research instrument into a machine whichcould be used by a wider group of scientists. And this was achieved against theprevailing opinion of the day, as expressed by Francis Aston, who argued that massspectrometry would die away as an active research field. Subsequent developmentsin mass spectrometric-related fields are testimony to Al's vision, and of the importanceof the two papers that described jthe sector field instrument which has made ourprofessional lives possible [2, 3].'
Yet he was almost lost to science! If it had not been for the great depression hewould probably have become an electrical engineer, but only five of his eightyclassmates found jobs in industry in 1931, and so he remained at the University ofMinnesota to complete a masters degree in engineering, and later a Ph.D. in physics.And what a Ph.D it was! He constructed a 180° deflection mass spectrometer fromspare parts left over by other researchers, and with this instrument he discoveredargon-38 and potassium-40, thus laying the foundation for potassium-argongeochronology.
During his post-doctoral fellowship at Harvard University in 1937 and 1938, he studiedthe isotopic compositions of 19 elements and discovered four new isotopes - 36S, 46Ca,48Ca and 1B4Os. He measured the isotopic composition of lead in a variety of uraniumminerals from the Richards-Baxter collection, and showed that the isotope ratios variedwidely in spite of the near constancy in the atomic weight. He also measured theisotopic abundance of 235u/238U, and wrote a number of papers on the uranium-leadand lead-lead chronometers. Al can therefore be regarded as thefounder of geochronology and isotope geology.

- i v - AECL-11342
Al Nier's many pioneering papers, mostly published in Physical Review, are models ofscientific communication. He was brought up in the tradition in which you used aminimum of words to describe the experiment, and allowed the data to speak forthemselves. He once told me that he found it hard to accept the lengthy journalarticles that are the norm today, and complained that one of his manuscripts hadactually been returned because the editor wanted him to make it longer.
The accuracy of Al's mass spectrometric data is legendary. Even though he mademany isotopic measurements in an era far removed from modern technology, his datahave invariably stood the test of time. Ludolf Schultz tells the story of how hediscovered that the accepted value of 20Ne/21Ne was somewhat higher than a morerecent measurement by Peter Eberhardt. Ludolf approached the then National Bureauof Standards in Washington, but was informed that the value for neon could notpossibly be changed because it had been measured by Al Nier, and it was well-knownthat Nier never made a mistake!
Nier's excellence in data measurements is summed-up by an article on barium byGerry Wasserburg's group at the California Institute of Technology, where the authorsmake the statement that "the isotopic abundances given by Nier in 1938 are, as usual,confirmed to be correct within the error limits that he quotes" [4].
However, the characteristic which has always impressed me the most about Al'sscientific career was his versatility. After his initial work on isotope abundancedeterminations and geochronology, he developed diffusion methods for enrichingcarbon isotopes, and used these enriched isotopes in medical and biologicalapplications. In 1940 he responded to a request by Enrico Fermi to separatenanogram quantities of 235U and 238U. This enabled 235U to be identified as thefissionable uranium isotope by Booth and Dunning at Columbia [5] and hence enabledthe Manhatten District Project to proceed.
In the 1950's Al's attention turned to the measurement of atomic masses, which is anessential base for nuclear physics and atomic weight determinations. With hiscolleagues at Minnesota, he built large, high resolution, double focussing massspectrometers, which enabled him to set new standards in atomic massmeasurements.
But then he turned from the building of large mass spectrometers to small,miniaturised versions, suitable for space research. In the 1970's he was a keymember of the Viking project, whose mission was to land a spaceship on Mars todetermine if life could exist there. Nier-built mass spectrometers sampled the Martian

- v - AECL-11342
atmosphere and were used in a variety of experiments in atmospheric physics. Anumber of them are still in space.
Al Nier retired in 1980 and was appointed Regents Emeritus Professor in Physics atthe University of Minnesota. He continued to work without pay and returned to anearlier research interest, the study of noble gases in extra-terrestrial materials.
At the 53rd Meteoritical Society meeting in Perth in 1990, the session on Noble Gaseswas dedicated to Professor Nier, because it was in his laboratory in the late 1950'sthat a successful investigation was undertaken of the helium isotope distributionin iron meteorites. His recent work on step-wise heating of interplanetary dustparticles to investigate the release pattern of noble gases, is an experimental problemof the highest level of difficulty, one which scientists half his age would hesitateto undertake. To achieve this he adapted the miniaturised mass spectrometers fromspace research to measure helium and neon isotopes in vanishingly small samples ofthis cosmic flux.
John Reynolds, in a lecture entitled "Adventures of Noblemen in Diamonds", paidtribute to Al in the following words:- "His own work in mass spectrometry for more than50 years has resulted in monumental contributions to nuclear physics, nuclear energy,isotopic geochemistry and space physics. Offshoots of his leadership in the field haverevolutionised Earth Science and Meteoritics. His eternal youth and enthusiasm haveinspired us all" [6].
In 1992 Professor Nier was presented with the Bowie Medal of the AmericanGeophysical Union by Professor Don Anderson. Professor Anderson commenced hiscitation by quoting the following words which were written by Sir Charles Lyell in1830:- "Though we are mere sojourners on the surface of the planet, chained to amere point in space, enduring but for a moment in time; the human mind is not onlyenabled to number worlds beyond the unassisted ken of mortal eye, but to trace theevents of indefinite ages before the creation of our race; and is not even withheld frompenetrating into the dark secrets of the ocean or the interior of the solid globe, free,like the spirit which the poet described, as animating the universe".
These words describe the character of Al Nier, who continually searched for the truthwhether it be in a speck of Stardust or in unravelling the "indefinite ages before thecreation of our race".
Before I conclude I would like to refer to an applied aspect of Al Nier's career which isoften forgotten in the light of his outstanding scientific endeavours. I refer to his work

- v i - AECL-11342
with industry during World War II, which he described in an article entitled "SomeReminiscences of Mass Spectrometry and the Manhattan Project" [7].
In the summer of 1942 Al Nier was building a special mass spectrometer for uraniumisotope determinations as requested by Vannever Bush. He was also analysing heavywater samples for Harold Urey, and was evaluating enriched uranium samples fromthe first cascade model of Booth and Dunning. He was also trying to develop thermaldiffusion techniques for isotope separation, and in his spare time assisted E.O.Lawrence at Berkeley in the electromagnetic isotope separation process. But a newproblem, whose importance to the success of the Manhattan Project was of thehighest order, arose. The gaseous diffusion plant being developed at Oak Ridgewould be inoperable if leaks developed in the plant. How were these incredibly smallleaks to be detected? The Kellogg Company turned to Al Nier who, although only 31years old at the time, had already demonstrated his ability as a builder of sensitivemass spectrometers. He had the feeling of instruments in his body, as an artist has inmoulding clay. He had a personal touch for scientific instruments, and his home-builtmass spectrometers constructed in the University of Minnesota Physics workshop,invariably worked with amazing precision.
Al quickly developed a portable leak detector, tuned permanently to helium, with whichthe Oak Ridge engineers could detect invisible pinholes in the labyrinth of pipes, oftotal length over a hundred miles, which was the base of the $500 million gaseousdiffusion plant. It seems impossible to imagine "life" before helium leak detectors, tothose of us who have struggled with vacuum systems, and our thanks go to Al for thisvery practical mass spectrometric invention. He also designed a small "line-recording"mass spectrometer, later manufactured by General Electric, which was used at overfifty points in the Oak Ridge plant to monitor the composition of the gas at anylocation. A central control room, to which the outputs of the mass spectrometers werefed, made engineering history. Without Al's input, the Manhattan Project would neverhave become a reality.
Al points out that this was an example of the underlying importance of basic science tonational defence and welfare, which led, in part, to the Office of Naval Researchsupporting basic science after the war. Perhaps Al's applied research experience ispertinent to the challenges faced by many National Laboratories at the present time.
I would like to conclude with some words from Don Anderson taken from the BowieMedal Citation, to which I referred earlier:- "All-in-all, Professor Alfred 0. Nier is abroad-minded and unselfish scientist, a diplomatic yet decisive leader, and a gentleand likeable person. His colleagues are awed by his experimental prowess and his

- v i i - AECL-11342
collegia! manner of openly sharing all data, ideas and speculations. It is easy tounderstand why this wonderful, softly-spoken scientist is so highly revered by all whocome in contact with him. It has been said that some wise people see further thanothers because they stand on the shoulders of giants. In the case of Al Nier we canall see further because generations of giants have stood on his shoulders".
The scientific community salutes Al Nier, not only because he was a good scientist,but primarily because he was a good person. The spoken word does not describe inproper measure his zest for life, his gregarious nature, his wit and charm. It does notindicate his habit of carrying a magnetic compass with him at all times, so that, forexample, he always knew where he was in the London underground, or of his love of"high tech" photography.
Nor does it explain his skiing exploits at Vail, where he was allowed to ski free-of-charge because he was over the age of seventy years. Nor does it describe his lovefor his wife Ardis and his family. Nor the quality of his many friendships.
The A.O. Nier Symposium on Inorganic Mass Spectrometry was established in 1991 tohonour the "Father of modern mass spectrometry". Long may it continue thatproud tradition!
References
[1] J.R. De Laeter, K.G. Heumann and K.J.R. Rosman, J. Phys. Chem. Ref. Data20,1327, (1991)
[2] A.O. Nier, Rev. Sci. Instrum. 11, 212 (1940).
[3] A.O. Nier, Rev. Sci. Instrum. 18, 398 (1947).
[4] O. Eugster, F. Tera and G.J. Wasserburg, J. Geophys. Res. 74, 3897 (1969).
[5] A.O. Nier, E.T. Booth, J.R. Dunning and A.V. Grosse, Phys. Rev. 57, 546 (1940).
[6] J.H. Reynolds and P. McConville, Proc. A.O. Nier Symp. on Inorganic MassSpectrometry, Los Alamos National Laboratory Report LA-12522-C (1993) p 145.
[7] A.O. Nier, J. Chem. Ed. 66, 385 (1989).
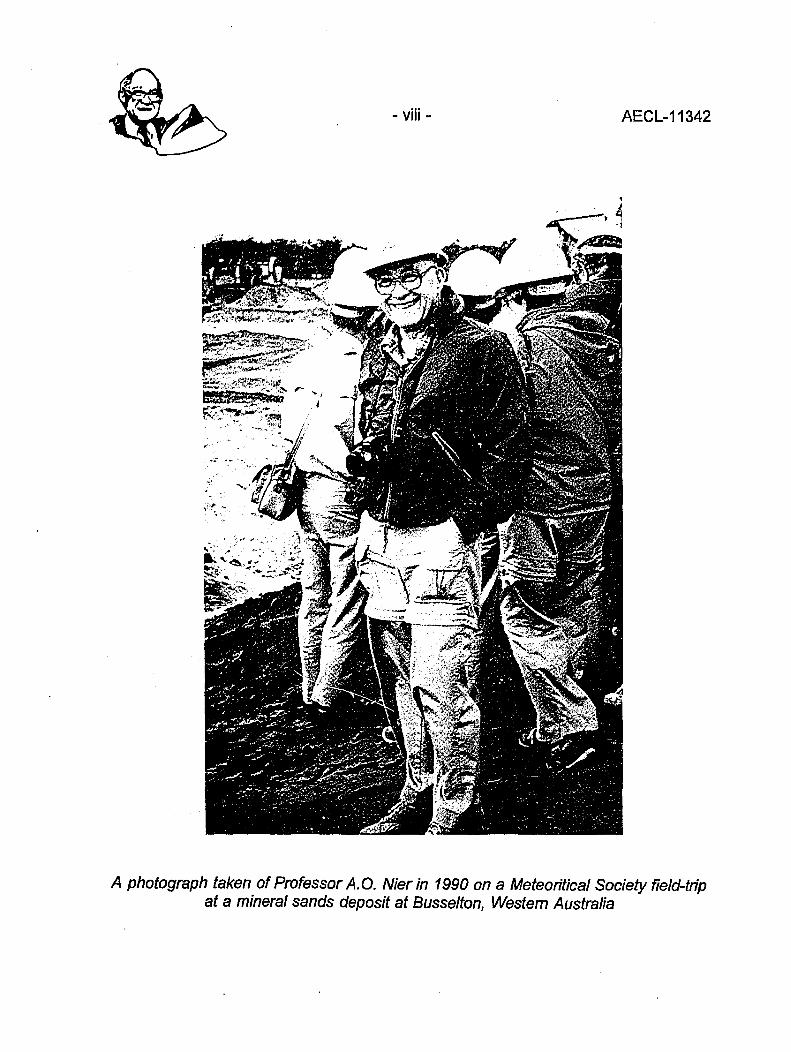
- VIII - AECL-11342
A photograph taken of Professor A.O. Nierin 1990 on a Meteoritical Society field-tripat a mineral sands deposit at Busselton, Westem Australia

- 1 - AECL-11342
THERMAL lONIZATION MASS SPECTROMETRY
Applications

- 2 - AECL-11342
New Developments and Applications in NegativeThermal lonization Mass Spectrometry
Klaus G. HeumannInstitute of Inorganic Chemistry of the University of Regensburg, Universitatsstralie 31,93040 Regensburg, Germany
Introduction
Thermal ionization mass spectrometry can be used in the positive or negative thermalionization mode for precise determinations of isotope ratios. Whereas positive thermalionization mass spectrometry (PTI-MS) was established many years ago, negativethermal ionization mass spectrometry (NTI-MS) is becoming more applied during thelast few years [1]. In NTI-MS the formation of negative thermal ions is preferred byhigh electron affinities of the analyte and low electron work functions of the filaments.In PTI-MS the element to be analysed should have a low first ionization potential andthe filament material used should have a high electron work function. The compoundsto be analysed by NTI-MS must have at least an electron affinity of 2 eV. Atomic ionsM' or oxide ions MO; (x=1-4) are preferably formed for many of the transition metals,non-metals, and semi-metals. A maximum of the ion current is found at a definitivefilament temperature for each compound. To reduce the electron work function ofmost of the filament materials, lanthanum or barium salts are added on the filament'ssurface [2]. One of the main advantages of NTI-MS is the fact that spectroscopicinterferences occur very seldom.
Analytical procedures for the isotope ratio determination by NTI-MS are developed forthe transition metal elements V, Cr, Mo, Tc, W, Re, Os, Ir, and Pt as well as for themain group elements B, C, N, 0, Si, S, Cl, Se, Br, Sb, Te, and I. The followingmodern applications should be mentioned in this connection: Re/Os dating method,exact determinations of isotope abundances, trace element speciation by isotopedilution mass spectrometry (IDMS), and determination of isotope variations in theenvironment for source identification of compounds.
Re/Os Dating Method
Due to the naturally occurring long-lived radioactive 187Re isotope, a Re/Os datingmethod could be established. Before 1989 the application of this method was limitedby the precision and sensitivity of the techniques in use: secondary ion massspectrometry (SIMS) or resonance ionization mass spectrometry (RIMS). In 1989 ourgroup at the University of Regensburg showed for the first time that osmium isotoperatios can be precisely and sensitively measured by NTI-MS [1]. In 1991, twopublications appeared nearly simultaneously on this topic [3,4]. From this time on
- 3 - AECL-11342
many other laboratories in the world adapted the NTI technique for osmiummeasurements.
The current NTI-MS technique in our laboratory for the osmium isotope ratiodetermination uses about 1 ng of osmium as hexachloroosmate(VI) in a double-filament Pt ion source. For the enhancement of the ion formation, Ba(OH)2 is addedon the filament to reduce the electron work function and a continuous oxygen gas flowis introduced into the ion source [5], Under these conditions typical ion currents of10"11 A for the most abundant OsOg ion are obtained at the detector side of the massspectrometer, allowing relative precisions in the range of 0.04-0.01 % in the isotoperatio determination of osmium.
Another problem, which had to be solved in Re/Os dating, was the rhenium blankcontribution from Pt filaments, especially during the measurement of minute samplesof rhenium by NTI-MS. By coating nickel filaments with a thin layer of small V2O5
particles, the blank contribution by the filament material could be reduced to less than1 pg rhenium per measurement [6]. With these developments the Re/Os datingmethod should be applicable in the future for a great number of different geologicaland cosmogenic samples.
Improvement in the Isotope Abundances of the Elements
The relative uncertainty in the atomic weight of more than 20 elements is above0.01 %, which is often due to problems in the mass spectrometric techniques forprecise isotope abundance measurements [7]. By using NTI-MS, an improvement inthe precision of the isotopic composition could be obtained for some elements whichalso resulted in an improvement in the corresponding atomic weight data. In 1991 thiswas done for the elements W and Os [7], and in 1993 for Ir for which the atomicweight, now recommended by IUPAC, could be changed from 192.22 ± 0.03 to192.217 ± 0.003, which means an improvement in the uncertainty by a factor of ten[8].
Selenium Speciation by IDMS
Elemental speciation is one of the most important topics in trace analysis today.Because of its accuracy, IDMS is increasingly used in this field [1,9,10]. Selenite(SeO2,"), selenate (SeO2-), and trimethylselenonium ((CH3)3Se+) have been determinedby our laboratory [11] in urine samples. A double-filament ion source (Re) and anionization filament temperature of 950°C were used for the determination of the80Se/82Se ratio. About 1 ug selenium is necessary for a Se' ion current of about10"11 A at the detector side. For the isotope dilution technique, 82Se enriched spikesolutions of the organic and the two inorganic selenium compounds were applied.
By using the sample treatment schematically shown in Figure 1, all three seleniumspecies could be determined in different urine samples in the range of 2.2-12.2 ng Se

- 4 - AECL-11342
per g sample for SeOg', 0.5-1.5 ng/g for SeO*", and 1-2 ng/g for (CH3)3Se+. Comparingthe total selenium concentration with the sum of the three investigated species, adifference of about 5-45% was found. This difference must be due to other (probablyorganic) selenium species in the samples. However, these investigations areimportant for a better understanding of the selenium metabolism in the human body.
SeO32-/SeO
Separation at anior
SeO32-
30 ml urine + species specif
.2-
i exchanger resin
c spike solutions
TMSe+
Separation at cation exchanger
SeO42- TMeSe+
totalSe
Decomposition of organic material by HNO3/HCIO4
Reduction of SeC>42- to SeO32- by cone. HCI
Reduction of SeO32- to elementary Se by ascorbic ac d
Isotope ratio measurement 80Se/82Se by NTI-MS
Figure 1: Treatment of Urine Samples for Se Speciation
Boron Isotope Variations as Indicators for Anthropogenic Influences
Figure 2 shows boron isotope variations expressed in 511B(%) values for naturalsubstances. Most of the washing powders include relatively high concentrations ofboron peroxides which normally show a similar 811B value as it is known for the NBSboron standard SRM 951 (see Figure 2). If washing powder, as one of the mostimportant anthropogenic substances in ground water samples, is mixed with boronfrom natural sources, the 511B value shifts and from that anthropogenic influences canbe indicated.
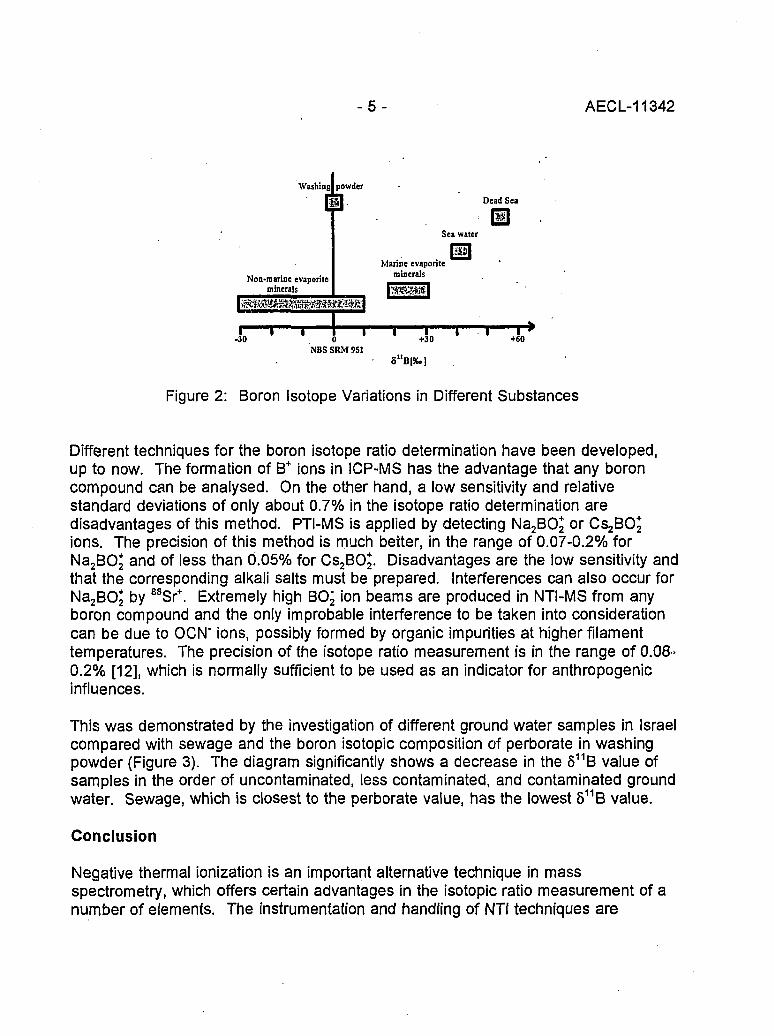
- 5 - AECL-11342
Washing| powder
H i l l . Dead Sea
Sea water
Marine evaporite, , minerals
Non-marine evaponte uiiuti«i»minerals
i—i i 1 i—i—i—r—i—r>-30 0 +30 +60
NBS SRM 951 6"B[X.)
Figure 2: Boron Isotope Variations in Different Substances
Different techniques for the boron isotope ratio determination have been developed,up to now. The formation of B+ ions in ICP-MS has the advantage that any boroncompound can be analysed. On the other hand, a low sensitivity and relativestandard deviations of only about 0.7% in the isotope ratio determination aredisadvantages of this method. PTI-MS is applied by detecting Na2BO2 or Cs2BO2ions. The precision of this method is much better, in the range of 0.07-0.2% forNa2BC>2 and of less than 0.05% for CSJBOJ. Disadvantages are the low sensitivity andthat the corresponding alkali salts must be prepared. Interferences can also occur forNa2BO2 by 88Sr+. Extremely high BO:, ion beams are produced in NTI-MS from anyboron compound and the only improbable interference to be taken into considerationcan be due to OCN' ions, possibly formed by organic impurities at higher filamenttemperatures. The precision of the isotope ratio measurement is in the range of 0.08-0.2% [12], which is normally sufficient to be used as an indicator for anthropogenicinfluences.
This was demonstrated by the investigation of different ground water samples in Israelcompared with sewage and the boron isotopic composition of perborate in washingpowder (Figure 3). The diagram significantly shows a decrease in the 511B value ofsamples in the order of uncontaminated, less contaminated, and contaminated groundwater. Sewage, which is closest to the perborate value, has the lowest 811B value.
Conclusion
Negative thermal ionization is an important alternative technique in massspectrometry, which offers certain advantages in the isotopic ratio measurement of anumber of elements. The instrumentation and handling of NTI techniques are

- 6 - AECL-11342
relatively simple and the sample preparation is normally not too complicated. Highsensitivity and high precision can often be obtained for many elements.
to
40
20 —
Boron isotope variation
IIf §
f
§-8
11
2̂ Oo ®
I-5§
CO
CO i.o
a
Figure 3: Boron Isotope Variation in Sewage and Ground Water Samples of the DanRegion in Israel
References
[1] K.G. Heumann, Mass Spectrom. Rev. 11, 41-67 (1991).
[2] K.G. Heumann, in: Inorganic Mass Spectrometry (Eds. F. Adams, R. Gijbels andR. van Grieken), Wiley, New York, 1988, pp. 301-376.
[3] J. Volkening, T. Walczyk and K.G. Heumann, Int. J. Mass Spectrom. Ion Proc.105, 147-159(1991).
[4] R.A. Creaser, D.A. Papanastassiou and G.J. Wasserburg, Geocbim. Cosmochim,Acta 55, 397-401 (1991).
[5] T. Walczyk, E.H. Hebeda and K.G. Heumann, Fresenius J. Anal. Chem. 341,537-541 (1991).
[6] T. Walczyk, E.H. Hebeda and K.G. Heumann, Int. J. Mass Spectrom. Ion Proc.130, 237-241 (1994).

- 7 - AECL-11342
[8] lUPAC Commission on Atomic Weights and Isotopic Abundances, Pure Appl.Chem. 66, 2423-2444 (1994).
[9] K.G. Heumann, Int. J. Mass Spectrom. Ion Proc. 118/119, 575-592 (1992).
[10] K.G. Heumann, in: Metal Speciation in the Environment (Eds. J.A.C. Broekaert,S. Gucer and F. Adams), NATO ASI Series, Vol. G23, Springer, Heidelberg,1980, pp. 153-168.
[11] R. Brotsack, Diplomarbeit, University of Regensburg, 1992.
[12] H. Zeininger and K.G. Heumann, Int. J. Mass Spectrom. Ion Phys. 48, 377-380(1983).
[13] A. Vengosh, K.G. Heumann and S. Juraske, J. Environ. Sci. Technol. 28, 1968-1974 (1994).

- 8 - AECL-11342
Tellurium: A Mass Spectrometrisfs Delight
J.R. De Laeter, K.J.R. Rosman and R.D. LossDept. of Applied Physics, Curtin University of TechnologyPerth, Western Australia, 6001
Introduction
The processes involved in heavy element nucleosynthesis are the slow(s) and rapid(r)neutron capture processes, and the p-process, a reaction which synthesises theneutron-deficient isotopes of the heavy elements. The s-process synthesises thenuclides along the valley of nuclear stability over relatively long time periods during thehelium burning phase of stellar evolution. Because most of the isotopes synthesisedby the s-process are stable, their relevant nuclear parameters can be studiedexperimentally. These parameters are the isotope abundances N8, and the neutroncapture cross-sections a, averaged over a Maxwillian velocity distributioncorresponding to thermal energies around kT = 30 keV. The most important isotopesin s-process nucleosynthesis are those that have been shielded from the r-process bystable isobaric nuclides, since their abundances are identical to the solar abundancesNo except perhaps for minor p-process contributions. The r- and p-processes occurover a much shorter time scale in a cataclysmic, non-equilibrium environment such asoccurs for massive stars that become supernovae. The products of nucleosynthesisare returned to the interstellar medium by supernovae and by mass loss from redgiants and novae.
Tellurium has eight stable isotopes spanning the mass range 120 < A < 130. It is theonly element that has three s-only nuclides 122'123' 124Te, and in addition has a p-onlynuclide 120Te, two r-only nuclides 128130Te, together with two isotopes 125126Te, whichare produced by a combination of the s- and r-processes. Figure 1 shows thenucleosynthetic processes which produced the isotopes of tellurium.
» s - process
52
51
50
49
48
112
106
Cdp
108
C d r110
CdinCd
114
113
112
Cd
115
Snp.«.r
113
Cd
116
Sn
InI14\Cd
117
Sn
\
120
T e r
118
Sn
\
116
Cd
119
Sn
\
122
Te12TS
Sb120\Sn
\
123
Te
\
124
Te123
Sb122
Sn
\
125
Te
\
I26\Te
\124
Sn
\
\
\
\
r- process
128
Te
\ \
130
Te
\rr - process
\s - process
r • process
Figure 1: Nucleosynthetic Processes for Te

- 9 - AECL-11342
Solar System Abundance of Tellurium
Tellurium has a relatively large cosmic abundance [1], since it is located on an r-process peak which results from the magic neutron number N = 82. It is therefore ofno surprise to find that the most abundant of the Te isotopes are the r-only nuclides128Te and 130Te. These two isotopes exhibit double beta decay which causesenrichments in 128Xe and 130Xe respectively for old telluride minerals. It has now beenshown that the half-lives of 128Te and 130Te are approximately 1.4 x 10²¹ and 7 x 10²⁰
years, respectively, which supports the Dirac formalism in which the lepton conserving,two neutrino mode of decay is favoured [2]. This places a stringent upper limit on theMajorana mass of the electron neutrino.
Kappeler et al. [3] evaluated a best set of neutron capture cross sections for a numberof s-process nuclides at astrophysical energies. Using this data and the Solar Systemabundances of Cameron [4], Kappeler et al. [3] evaluated the nuclear parameters forthe classical model of s-process nucleosynthesis for the <JNS curve in the mass region56 < A < 209. The r-process contributions of nuclides that were synthesised by acombination of s- and r- process nucleosynthesis were then calculated by subtractingthe calculated s-process abundance Nsfrom the Solar System abundance No. Usingthis approach Kappeler et al. [3] were able to demonstrate a good correlation betweenthe calculated Nr values for mixed s- and r-process nuclides and the r-only processnuclides, except for Te where the 128Te and 130Te abundances were too high byapproximately 30%. Smith et al. [5] had, in fact, analysed the Orgueil C1 chondriteusing the isotope dilution mass spectrometric (IDMS) technique and obtained a valueof 2.34 ppm which was some 27% lower than the Solar System abundance used byKappeler et al. [3]. This value has subsequently been supported by additional lDMSmeasurements on a number of carbonaceous chondrites by Loss et al. [6], whoobtained a value of 2.24 ± 0.05 ppm for Orgueil. Anders and Grevasse [1] used theIDMS values as the primary source of input data to select a Solar System abundanceof 2.27 ± 0.23 ppm for Te.
Recently Wisshak et al. [7] have measured the neutron capture cross-sections of theSm isotopes with an accuracy of approximately 1%. Together with the cross-sectiondata for Te [8], it is possible to derive a close fit to the <JNS curve using the s-only Smand Te isotopes. This s-process formalism enabled Wisshak et al. [7] to conclude thatthe Solar System abundance of Te of 2.27 ppm is accurate to within 3% rather thanthe 10% uncertainty assigned by Anders and Grevasse [1], a conclusion which isconsistent with the IDMS measurements. The revised abundance of Te not onlyconfirms the validity of s-process nucleosynthesis, but also enables a revised value forXe to be determined. Xenon is a rare gas and its abundance therefore cannot bemeasured from meteoritical material. The revised value for Xe is in good agreementwith an estimate based on s-process systematics [9]. The excellent correlation

- 1 0 - AECL-11342
between nuclear astrophysics and Solar System abundances for Te, demonstrates theremarkable analytical advances that have been made in recent years.
Isotopic Anomalies in Meteorites
Despite the opportunity to exploit the isotopic composition of Te in nucleosyntheticstudies, it was not until 1978 that a mass spectrometric search was made for fcotopicanomalies in meteorites, but no isotopic variations within the limits of experimentalerrors could be found in whole rock samples [10]. Ballad et al. [11] reported theoccurrence of isotopically anomalous Te and Xe in acid-treated samples of the Allendemeteorite. Using a neutron activation analysis technique Ballad et al. [11] reportedanomalies of up to 17% in 130Te with smaller anomalies in 120Te, 122Te and 126Te.However, in a detailed mass spectrometric study of three acid-resistant residues fromAllende, Loss et al. [12] could not detect any isotopic anomalies in the major isotopesof Te, in contrast to the work of Ballad et al. [11]. A search was also made foranomalies in 126Te, the stable daughter of 126Sn, which has a half life of approximately105 a. The absence of excess 126Te in primitive Solar System materials places a lowerlimit of approximately 106 a on the time of formation of the Solar System [13].
Refractory carbonaceous materials in primitive meteorites are known to be the carrierof many isotopically anomalous elements which survived the formation of the SolarSystem and provide valuable information on pre-solar nuclear and chemicalprocesses. One such component is microdiamonds, which contain Xe-HL - anucleogenetically distinct xenon enriched in those isotopes synthesised by the r- andp-processes. This suggests a supernova source for the diamonds. Clayton [14] hasargued that the neutrino burst from the collapsed core in Type II supernovae liberatesfree neutrons which can produce the neutron-rich unshielded isotopes in Xe-H. Theconvective shell above the He-burning zone is the most likely site of the origin of Xe-HL since it is the only zone which has C > 0 at the time of its explosion [14]. It ishypothesised that this anomalous Xe, together with the other elements, would beimplanted in the microdiamonds which now exist in carbonaceous chondrites.Heymann and Dziczkaniec [15], Clayton [14] and Howard et al. [16] all predict largeanomalies in Te co-synthesised with Xe-H, with the most important anomaly being ahigh 13OTe/128Te ratio.
Microdiamonds extracted from the Allende meteorite were converted to a form suitablefor chemical separation by cold combustion in an oxygen plasma. After oxidation, theTe was separated from the other elements by ion exchange chemistry and analysedby solid source mass spectrometry. The data shows positive anomalies for 128Te of4.0 ± 2.2% and 130Te of 9.4 ± 1.0%, after being corrected for mass fractionation bynormalization to 124Te/126Te [17]. The remaining isotopic ratios showed no variationfrom the terrestrial standard. The measured anomalies in 128130Te are smaller than

- 1 1 - AECL-11342
those found in Xe, which indicates that any exotic Te present in the diamond samplehas been diluted by unprocessed supernova and/or solar Te. On the other hand, theanomalous Te and Xe fractions in diamond are of similar magnitude (16 ± 2 pmol/g of130Te versus 4.2 pmol/g 136Xe) due to the Te/Xe weight ratio in diamond. The Te datatherefore qualitatively support the neutron burst model [14,15,16].
The Absolute Composition of Tellurium
Accurate measurements of the neutron capture cross-section ratios for122f123i124Te haverecently been reported by Wisshak et al. [8], who demonstrated that the localapproximation cNs = constant, predicted by the classical model of s-processnucleosynthesis, can be confirmed at the 1% level for these three isotopes. Their dataalso identified the possibility of a p-process contribution to the 122Te abundance. Inestimating the errors to be associated with the 0NS values for the three s-only Teisotopes, Wisshak et al. [8] made the assumption that the isotope abundances of Tewere known to an accuracy of 0.1%. However, a distinction needs to be madebetween "relative" and "absolute" isotope abundances. Isotope abundances which arefree from all known sources of bias are referred to as absolute isotope abundances,and are determined by calibrating a mass spectrometer by means of quantitativesynthetic mixtures of enriched isotopes [18]. The standard Te isotope abundances[19], are based on mass spectrometric measurements in which an electron multiplierwas used in the detecting system because of the difficulty of producing ion beams ofsufficient size to be measured directly with a Faraday cup collector [10]. The electronmultiplier introduces a mass discrimination into the isotope abundances which isapproximately proportional to the square root of the mass ratio. However, thecorrection factor required to convert the observed isotope abundances to absoluteabundances is a multivariate function of a number of biases, of which the electronmultiplier discrimination is but one part (albeit an important one).
Thus the value of the 122Te/124Te ratio adopted by Wisshak et al. [8] needs to bedecreased by approximately 1 % to account for electron multiplier bias. This impliesthat the observed positive anomaly in 122Te, which was interpreted by Wisshak et al.[8] as a potential p-process contribution, largely disappears. The estimated absolutevalues for the s-only tellurium isotopes enable the local approximation of s-processnucleosynthesis to be verified within even smaller uncertainty limits than was possiblein the analysis by Wisshak et al. [8]. The necessity of establishing an accurate set ofabsolute abundances for Te is apparent, not only for nucleosynthetic studies, but alsoto determine the atomic weight of Te, which presently has a relative uncertainty of0.024% [18].

- 1 2 - AECL-11342
Fission Product Studies
Tellurium has also played an essential role in mobility studies of fission productmaterial from the Oklo natural reactor. Curtis et al. [20] have used Te as thereference element for an examination of mobility of Mo, Ru, "Ru and Pd in uraninitesamples from Reactor Zone 9 at Oklo. The well-defined linear correlations of theseelements over concentrations that differ by an order of magnitude is attributed to theprimary retention at the site of production. Curtis et al. [20] argue that the degree ofprimary retention was controlled by phase assemblages in the reactor fuel in responseto microscale conditions of pressure, temperature and composition produced by thenuclear reactions. These studies can be used to evaluate the effectiveness ofanthropogenic spent fuel as a depository for nuclear waste. An examination of therelative cumulative fission yields for Te at Oklo shows that 126Te exhibits considerabledispersion in comparison to the other fission yields [21]. This is due to the mobility of126Sn which was not retained in-situ in the uraninite.
The Mass Spectrometry Laboratory at Curtin University of Technology is supported bythe Australian Research Council.
References
[1] E. Anders and N. Grevasse, Geochim. Cosmochim. Acta, 53, 197 (1989).
[2] O.K. Manuel, Proc. Int. Symp. Nuclear Beta Decays and Neutrinos, Osako,Japan (1986).
[3] F. Kappeler, H. Beer, K. Wisshak, D.D. Clayton, R.L Macklin and R.A. Ward,Astrophys J., 257, 821 (1982).
[4] A.G.W. Cameron, In "Essays in Nuclear Astrophysics" (Edit. C.A. Barnes,D.N. Sch'ramm, and D.D. Clayton) Cambridge Uni. Press (1982).
[5] C.L. Smith, J.R. De Laeter and K.J.R. Rosman, Geochim. Cosmochim. Acta,41,676(1977).
[6] R.D. Loss, K.J.R. Rosman and J.R. De Laeter, Geochim. Cosmochim. Acta, 48,1677 (1984).
[7] K. Wisshak, K. Guber, F. Voss, F. Kappeler and G. Reffo, Phys. Rev. C, 48,1401 (1993).
[8] K. Wisshak, F. Voss, F. Kappeler and G. Reffo, Phys. Rev. C, 45, 2470 (1992).

- 1 3 - AECL-11342
[9] H. Beer, F. Kappeler, G. Reffo and G. Venturini, Astrophys. Space Sci. 97, 95(1983).
[10] C.L. Smith, K.J.R. Rosman and J.R. De Laeter, Int. J. Mass Spect. Ion Phys.,28, 7 (1978).
[11] R.V. Ballad, LL. Oliver, R.G. Downing and O.K. Manuel, Nature, 277, 615(1979).
[12] R.D. Loss, K.J.R. Rosman and J.R. De Laeter, Geochim. Cosmochim. Acta, 54,3525 (1990).
[13] J.R. De Laeter and K.J.R. Rosman, Meteoritics, 19, 217 (1984).
[14] D.D. Clayton, Astrophys. J., 340, 613 (1989).
[15] D. Heymann and M. Dziczkaniec, Geochim. Cosmochim. Acta, 45, 1829 (1981).
[16] W.M. Howard, B.S. Meyer and D.D. Clayton, Meteoritics, 27, 404 (1992).
[17] R. Maas, R.D. Loss, K.J.R. Rosman, J.R. De Laeter, R.S. Lewis, G.R. Huss,E. Anders and G. Lugmair, Astrophys. J. (in press).
[18] J.R. De Laeter, P. De Bievre and H.S. Peiser, Mass Spect. Rev., 11, 193(1992).
[19] J.R. De Laeter, K.G. Heumann and K.J.R. Rosman, J. Phys. Chem. Ref. Data,20, 1327(1991).
[20] D.B. Curtis, T.M. Benjamin, A.J. Gancarz, R.D. Loss, K.J.R. Rosman,J.R. De Laeter, J.E. Delmore and W.J. Maeck, Appl. Geochem., 4, 49 (1989).
[21] J.R. De Laeter, K.J.R. Rosman and R.D. Loss, Proc. A.O. Nier Symp. onInorganic Mass Spectrometry, Los Alamos National Laboratory (1993).
- 1 4 - AECL-11342
The Mechanism of Bi* Production from Bismuth Borosilicate
T. Huett, J.C. Ingram and J.E. Delmore ^>°u !'J r U'J
Idaho National Engineering LaboratoryEG&G, MS 2208, Box 1625, Idaho Falls, Idaho, 83415
Silica gel technology, first reported in 1969 for producing Pb ions [1], has found wideuse in the isotope ratio community for enhancing the production of surface ions fromthermal ionization filaments. The method entails mixing the sample with silica gel andeither phosphoric or boric acid, heating to dryness, mounting in the mass spectrometerand heating to the appropriate temperature (700 to 1400°C, depending on the system).The purpose of the present study was to find a model system which emitted ions andcould be easily used for materials studies so as to better understand those featuresnecessary for good and reproducible ion production. This type of a model system cannever hope to be an exact mimic of an analytically useful system since we deliberatelyadd enough of the element to be ionized to alter the material itself, while ananalytically useful system would have the element in very low concentrations. Themethod used in these studies was adapted from an unpublished Los Alamos method[2] for producing Bi+, and used bismuth nitrate (or Bi metal) with silica gel and boronoxide at an operating temperature of 900°C. Both Re and Ta filaments were tested.Larger amounts of the ion emitting material were prepared and melted in a vacuumfurnace on Re or Ta sheets for subsequent analysis. Analyses of the off gases wereperformed with the material heated to the ion emission temperature. The cooledmaterials were analyzed by dissolution followed by ICP-AES, SEM, XPS and X-raydiffraction.
To the knowledge of the authors, an extensive bibliography of the elements that canbe ionized by silica gel technology has never been compiled. The majority ofelements reported in the literature are a block of elements in the periodic tableranging from a VIB element (Cr) on the left, to a VIA element (Te) on the right, with awide range of variations on the methods reported in [1]. There are also references ofHA ions being formed by this technology [3]. During the course of this work, theperrhenate (ReO4') anion was identified. Thus, it is possible (or probable) that thereare multiple ion emission mechanisms occurring from these complex matrices, ratherthan a single mechanism. There are many elements that have been tested for usewith this technology that cannot be ionized, such as the alkali metals, the actinides,and the lanthanides.
A clue as to the mechanism of ion emission comes from the fact that when thesecomplex matrices are mounted on both Ta and Re filaments, Re provides up to twoorders of magnitude higher sensitivity. The reported work function of Re is about
- 1 5 - AECL-11342
5.0 eV, while Ta is about 4.1 eV [4]. The most obvious explanation for this effect isthat the element migrates from the matrix to the bare filament, from which it is ionized.
In order to test this concept, emission of Bi+ from these complex emitters was imagedusing a new instrument recently completed in our laboratory. Several silica gel typeBi+ ion emitters have been imaged in the past year, and all show ion emission onlyfrom the deposits. With this the case, the work function of the Re filament cannothave a direct effect on ion emission, and the ion emission effects from mounting theion emitter on a Re substrate needs to be re-evaluated. Another feature of theemitters that was readily observed during imaging was the speed with which thefeatures changed, as though the deposit was a viscous liquid.
An experiment was set up with a ~3 mm wire loop loaded with ion emitter, mounted in avacuum system with a viewport. An electric current was passed through the wire,heating the specimen. The material was observed to melt and churn. X-ray diffractionof the cooled material showed no features, indicating it was a glass. Several differentmaterials were melted and examined with X-ray diffraction (after cooling), and allappeared to be glasses. Hence the conclusion is that these materials are moltenglasses at operating temperature and the ions are emitted from the surface of themolten glass.
A clue as to the effect of the Re substrate was the observation of perrhenate (ReO4")in the anion spectrum of an ion emitter prepared from Bi nitrate and melted on Re.Perrhenate was only observed from the samples prepared from Bi nitrate and meltedon Re; the samples prepared from Bi metal and melted on Re did not produceperrhenate. This demonstrates the requirement for an oxidizing agent in order forperrhenate to be observable. Perrhenate anion emission was imaged from thesematerials and the ions came from the deposits; the images of the negative ions couldnot be distinguished from the images of Bi+ ions, except for polarity. In order for Re tobe oxidized to perrhenate (Re in the +7 oxidation state), something in the deposit hadto be reduced. Analysis of the off-gases using an electron impact ion source massspectrometer showed that the only appreciable gasses given off were water andnitrogen oxides. The nitrogen oxides produced from heating the material would havecame at least partially from thermal decomposition of nitrates, but some probably alsocame from nitrate oxidizing Re to perrhenate.
Ion emission was tested from the four liquid glass ion emitter combinations; theemitters prepared from bismuth nitrate and bismuth metal, and both of these materialstested on Ta and Re filaments. Large samples (~100 mg) were melted on therespective substrate, dissolved, and analyzed by ICP/emission. The results aretabulated in Table 1.
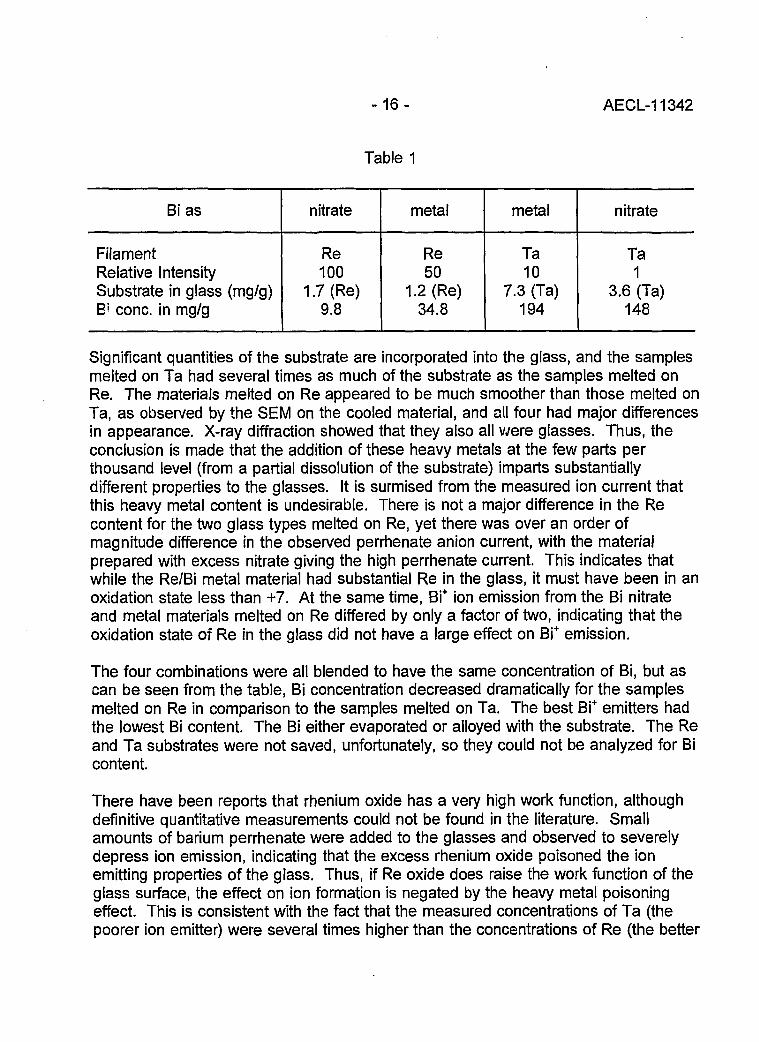
-16- AECL-11342
Table 1
Bi as
FilamentRelative IntensitySubstrate in glass (mg/g)B> cone, in mg/g
nitrate
Re100
1.7 (Re)9.8
metal
Re50
1.2 (Re)34.8
metal
Ta10
7.3 (Ta)194
nitrate
Ta1
3.6 (Ta)148
Significant quantities of the substrate are incorporated into the glass, and the samplesmelted on Ta had several times as much of the substrate as the samples melted onRe. The materials melted on Re appeared to be much smoother than those melted onTa, as observed by the SEM on the cooled material, and all four had major differencesin appearance. X-ray diffraction showed that they also all were glasses. Thus, theconclusion is made that the addition of these heavy metals at the few parts perthousand level (from a partial dissolution of the substrate) imparts substantiallydifferent properties to the glasses. It is surmised from the measured ion current thatthis heavy metal content is undesirable. There is not a major difference in the Recontent for the two glass types melted on Re, yet there was over an order ofmagnitude difference in the observed perrhenate anion current, with the materialprepared with excess nitrate giving the high perrhenate current. This indicates thatwhile the Re/Bi metal material had substantial Re in the glass, it must have been in anoxidation state less than +7. At the same time, Bi+ ion emission from the Bi nitrateand metal materials melted on Re differed by only a factor of two, indicating that theoxidation state of Re in the glass did not have a large effect on Bi+ emission.
The four combinations were all blended to have the same concentration of Bi, but ascan be seen from the table, Bi concentration decreased dramatically for the samplesmelted on Re in comparison to the samples melted on Ta. The best Bi+ emitters hadthe lowest Bi content. The Bi either evaporated or alloyed with the substrate. The Reand Ta substrates were not saved, unfortunately, so they could not be analyzed for Bicontent.
There have been reports that rhenium oxide has a very high work function, althoughdefinitive quantitative measurements could not be found in the literature. Smallamounts of barium perrhenate were added to the glasses and observed to severelydepress ion emission, indicating that the excess rhenium oxide poisoned the ionemitting properties of the glass. Thus, if Re oxide does raise the work function of theglass surface, the effect on ion formation is negated by the heavy metal poisoningeffect. This is consistent with the fact that the measured concentrations of Ta (thepoorer ion emitter) were several times higher than the concentrations of Re (the better
- 1 7 - AECL-11342
ion emitter) in the respective materials. The original Los Alamos method called for theuse of Pt filaments. Pt substrates were not tested in this study, but they may havehad less chemical interaction with the molten glass, and consequently less heavymetal content and possibly superior ion emission properties.
XPS analyses were performed on these materials. Appreciable amounts of Bi+3 weremeasured on the samples melted on Ta, while those melted on Re had little Bi+3. Thiscorresponds to the reduced Bi concentration measured in the glasses. Essentially noelemental Bi was observable during the initial phase of XPS analyses on any of thematerials, although it was observed to grow in with X-ray exposure for those sampleshaving Bi+3 on the surface initially.
There are numerous issues that need further study, but there are certain conclusionsthat can be stated. The most certain of these conclusions is that the emitters aremolten and highly viscous glasses at ion emission temperature, and that ions originatefrom the surface of this molten glass. It has been known since the original studies [1]that the filament material was very important for ion formation efficiency, with Refilaments giving superior ion formation to Ta filaments. It was generally assumed thiswas due to the higher work function of Re, and that ions originated from the Resurface. It has been shown that ions do not originate from the filament surface, andthat the reason that Re is a better filament material is that it is less reactive toward themolten glass, and less Re than Ta dissolves in the molten glass. It appears thatheavy metals poison the ion emission process. This heavy metal content can comeeither from the substrate or from the sample itself. It is probable, although not proven,that the concentration of Bi in the glasses of this model system altered the ionemission properties. The element added to the glass from which ions are desiredeither migrates into the filament material in appreciable quantities (particularly Refilaments), or else Bi has a much higher vapor pressure in the more favorablematrices.
Little can be said concerning the actual mechanism of ion production from thesemolten glasses at this time, but it is unlikely that a single mechanism is responsible forthe ion emission for all the types of ions observed from this type of matrix. The XPSdata showed that Bi+3 was the predominant oxidation state of Bi+ in the cooled glasses,but this does not prove that this species is actually responsible for emission of the Bi+
species. The production of Bi+ in the gas phase from Bi+3 in the solid is highlyspeculative, and could involve an inverse Saha-Langmuir ion formation process. Itwould also be a reduction process, which would require a driving force that would bedifficult to explain, especially since perrhenate was observed from the best Bi+ emitter,and perrhenate is a highly oxidized species.
Another result of the experimentation that is not well understood is why ion emissionfrom the glass prepared from bismuth metal is a factor often higher than the glass

- 1 8 - AECL-11342
prepared from bismuth nitrate, when the materials were melted on Ta. The SEMphotos also showed major differences, indicating that the glasses had much differentphysical properties. A possible explanation is the relative oxidative/reductive state ofthe glass. We made no attempt to determine oxygen stoichiometry of these mixtures,but the addition of bismuth as the metal rather than as the nitrate almost certainlywould reduce the oxygen content. Thus, a reduction in oxygen content of the glassappears to enhance ion emission efficiency for the materials on Ta. There is not asimilar major effect with the same materials melted on Re, so generalizationsconcerning these systems are not easily made. The properties of the glass thatchange with elemental composition (oxygen, Ta, Re, Bi etc.) is the probable cause ofthese effects.
[1] A. E. Cameron, D. H. Smith, and R. L Walker, Anal. Chem., 41, 3, 525 (1969).
[2] D. Rokop, Private Communication.
[3] T. Lee, D.A. Papanastassiou and G.J. Wasserburg, Geochim. Cosmochim. Acta41, 1473(1977).
[4] Handbook of Thermionic Properties, V. S. Fomenko and G. V. Samsonov,Plenum Press (1966).

- 1 9 - AECL-11342
Total Evaporation Measurements, a Key to more Accurate Mass Spectrometry?
R.K. Fiedler ~i •-'• ' < -c <:•./<"I.A.E.A./ Safeguards Analytical Laboratory, A-2444 Seibersdorf, Austria
Introduction
The method of the total evaporation measurement was presented first by Romkowskiet al. [1] at an ESARDA meeting in London, 1987. The difference from theconventional method is that the evaporation filament current is steadily increasedduring data collection to consume the whole sample material placed on the filament forthe analysis. One of the major sources of systematic bias in thermal ionization massspectrometric measurement is isotopic fractionation, which can be eliminated when asample is consumed totally during the analysis. The way of data collection and dataevaluation to be used was limited by the software available at this time. Ourlaboratory has the same type of mass spectrometer (Finnigan MAT 261, multi-collectorinstrument) as the ITU (Institute for Transuranium Elements, Karlsruhe). A specialmodule that allows handling the data differently from the software of the manufacturerenabled us to follow a different data evaluation philosophy. The error calculation isperformed using statistics applied to counting techniques. The intention of ITU was touse only small amounts of sample to reduce the radiation hazard to the chemistsdoing the separation and purification work on the samples coming from reprocessingplants. Our own software did not have the limitation to small samples and gave verygood results on all samples, independent of the filament loading. This softwaremodule was taken as a basis for further improvements.
Software
During a scientific visit at CBNM (now IRMM) in Geel, Belgium, the exchange of ideason the best way to do mass spectrometric analysis ended in the preparation of apaper entitled 'Principal Requirements for Accurate Mass SpectrometricMeasurements' [2]. This paper forced the development of software for Finnigan MATmass spectrometers (type MAT 261 and MAT 262) to verify the theory and todemonstrate the possibilities of a new software. The name of this software package isMSSOFT and has been tested for three years and improved wherever shortcomingscould be observed. The following Figure 1 shows the flowchart for a total evaporationmeasurement.

- 2 0 - AECL-11342
STARTFocus &
Peak center
Heat sample(evaporation)
filament
Ionizing filament(rhenium)
add 50 mA
Integrate ind.ion currents
QUIT * •
Find mostintense peak
Peak centerFocus peak
IBaseline
measurement
XIncrement
filament current
Baselinemeasurement
o
o
ooID
/
Q_
o2LU
111
ccen
Figure 1: Simple Flowchart for Filament Heating and Data Taking for Total EvaporationMeasurements
Experimental
Multi-collector instruments
The following tests have been performed on the MAT 262 of IRMM equipped with 7Faraday cups. At the start, mainly standards were analyzed and the total evaporationmethod showed very good results. The element uranium was selected because it hasminor isotopes. The results of measurements (mean of 5 measurements) using differentfilament materials are shown in Table 1.

-21 - AECL-11342
Table 1: NBS-020 Measurement Results
Filament Material
RheniumTungstenTantalumReference
235U/238U
0.0208170.0208180.0208480.02081
sd
0.0000180.000010.000020.00002
%sd
0.0870.0480.10.1
% (meas-ref)/ref
+ 0.034+ 0.038+ 0.183
0
After evaluation of the measurement data of the 3 different filament materials, tantalumwas excluded from further tests as the remaining sample material was high and the resultfor the ratio 235u/238U is biased by 0.18 %.
The next measurements were all done on the MAT 261 of SAL (IAEA), which is equippedwith 9 Faraday collectors with a fixed distance to cover the mass range from 233 to 239for U and 235 to 244 for Pu measurements. Uranium (NBS 010) and plutonium (NBS947) as shown in Figure 2 were used in this test series. As can be seen, the range ofquantity loaded for good analysis is very wide. The shaded area corresponds to theuncertainty of the reference material [3].
Sampleloading
0.1 micro g02 micro g0 5 micro g1.0 micro g2.0 micro g
URANIUM
range
to be used
Ratio 235/238 0.01014
Sampleloading
5nano g10 nano g20 nanog50 nanog100 nano g
PLUTONIUM
range
to be used
Ratio 240/239 024123 (decay corr.)
Figure 2: Influence of Loading Quantity for Uranium (NBS 010) and Plutonium (NBS 947)
Experimental
Quadrupole instrument
At the same time studies were started to use a quadrupole mass spectrometer (THQ fromFinnigan MAT) for total evaporation measurements. The studies are limited to theelement Pu. The amount of sample used in these tests was 50 ng. For the adjustmentof the ion signal at the start of the measurement the secondary electron multiplier (gain

- 2 2 - AECL-11342
10 compared the Faraday cup) is used to save sample for the measurement itself.Contrary to the multi-collector instruments, where the ion signals can be collectedsimultaneously, the data taking must be done by symmetrical peak jumping and in themiddle of the scan a heat-up step must be added. The total evaporation measurementgives acceptable results as long as the ion signal stays within the borders of the linesshown in Figure 3. The best conditions would be if the intensity of the ion beam followsthe dashed line in Figure 3. The data are presented in Table 2 in weight % asSafeguards inspectors have been our clients [4].
FILAMENT CURRENT INCREMENT
238 239 240 241 242 242 241 240 239 238
Figure 3: Scan Scheme for Data Taking for Total Evaporation Measurements on a THQ
Table 2: Reproducibility over 3 Days (in weight %)
Day
123
No. ofFilaments
131213
AverageRsd (%)
238
0.27260.0270.2662
0.2961.2
239
77.658877.666677.6574
77.66090.006
240
18.809418.815418.8233
18.81610.04
241
2.03272.02462.0334
2.03020.24
242
1.21881.221.2194
1.21940.05
Effects of Isobaric Interference and Baseline
U samples which are incompletely separated from Pu and measured by totalevaporation could suffer from interference on the ion intensity of 238U due to thepresence of isobaric 238Pu. For Pu samples the 238Pu intensity can be influenced bythe presence of 238U and the 241Pu intensity can be affected by 241Am [5]. The

- 2 3 - AECL-11342
possibility of over-correction can occur when a dirty sample is measured with the totalevaporation method. This phenomena could be seen on samples which did notreceive any chemical treatment and gave a very reproducible negative value for236Uon "natural" uranium.
Conclusion
The total evaporation method is less susceptible to errors resulting from variations inthe amount of U and Pu loaded on the mass spectrometer filament. Thereproducibility of repeated measurements is also improved by a factor of 2 to 4 whilethe accuracy is at least as good as in the conventional method. However, as with theconventional method, it will be necessary to perform a cup efficiency calibration. Theuse of total evaporation for IDMS analysis offers the maximum improvement inperformance with a minimum risk. Some negative influences when using the totalevaporation method for all mass spectrometric measurements are shown and it isnecessary to further evaluate the sensitivity of the method to isobaric and concomitantelement interference effects.
References
[1] M. Romkowski, S. Franzini and L. Koch Proceed. ESARDA Symp. 12-14May,1987, London.
[2] P. De Bievre, R. Fiedler, P. Hansen, K. Mayer, R. Perrin and P. Taylor PrincipleRequirements for Accurate Mass Spectrometric Measurements, to be published.
[3] R. Fiedler, D. Donohue, G. Grabmueller and A. Kurosawa Report on PreliminaryExperience with Total Evaporation Measurements in Thermal lonization MassSpectrometry, Int. J. Mass Spectrom. Ion Processes, 132, 207-215 (1994).
[4] R. Fiedler, A.Reichart and J. Cappis Total Evaporation Measurements ofPlutonium with a Thermo Quadrupole Mass Spectrometer (THQ), IAEA/AL/020,(March 1989).
[5] R. Fiedler Americium Content Determination Done on a Thermo QuadrupoleMass Spectrometer (THQ) using Total Evaporation Technique,IAEA-SAL/AL/024, (1990).

- 2 4 - AECL-11342
Total Evaporation in Thermal lonization Mass Spectrometry
E. Larry Callis and John H. Cappis ct =>' CT
Los Alamos National Laboratory, Los Alamos, New Mexico 87545
Introduction
The total evaporation method, in which the entire sample is evaporated whileintegrating the signal from each isotope using a multicollector system, has now beenin routine use at our laboratory for uranium and plutonium analyses for several years[1,2]. By integrating out the effects of isotope fractionation, high precision, typically<0.02% relative standard deviation (RSD), is obtained with a minimum of rigor insample loading and treatment schemes. In fact, the advantages of total evaporationbecome more apparent in real-world analysis situations in which the precise quantity ofsample loaded may not be known and sample purity may be questionable. Recently,we have performed tests to demonstrate the effectiveness of the method on actualand impure test samples.
Experimental
In a study conducted with the International Atomic Energy Agency (IAEA) SafeguardsAnalytical Laboratory (SAL) in Seibersdorf, Austria, uranium and plutonium sampleswere prepared and analyzed by SAL using conventional techniques, and a portion wasshipped to Los Alamos for analysis using the total evaporation technique. Averageprecisions (% RSD) obtained on four replicate runs on each of 12 uranium and 12plutonium samples, ranged from <0.01% for 240/239 Pu ratios to <0.02% for233/238 U and 244/239 Pu ratios. These results demonstrated that standard chemicalpurification methods used at SAL were more than adequate for analyses by the totalevaporation method, and that significant improvements in precision and accuracy wereprovided by the total evaporation method. These techniques have since beenimplemented at SAL with good results; see [3] and R. Fiedler's paper in theseproceedings.
Recently, in a continuation of this work, experiments were conducted to assess theeffects of certain impurities on the total evaporation method for uranium. Solutions ofNIST U-500 isotopic standard were spiked with Na, Ca, K, Fe, Zr and Ba (individually)at levels of 1%, 10%, and 100% (by weight) relative to the uranium concentration of1 mg/ml. Four analyses of each of these 18 solutions were performed, interspersedwith analyses of unspiked U-500.

- 2 5 - AECL-11342
Results and Discussion
The results of these analyses are shown in Table 1. It appears that only Fe, andpossibly Na display any discernible effect, and then only at the highest concentrationlevel. Hopefully, this situation is not encountered often in most laboratories! Inaddition, the effect is small, about 0.02%. This is certainly good news for laboratoriesworking with impure materials. Of course, many other impurity elements should bestudied, but it would be surprising if the effects were large.
Table 1: Percentage Deviations of the Average Observed 235/238 U Ratios from theObserved Pure U-500 Value and the Precision Observed on 4 FilamentLoadings
Concentration "
1%
10%
100%
Na
-0.013+0.014
-0.000±0.24
-0.015±0.009
Ca
+0.004±0.010
-0.008±0.017
-0.002±0.021
Impurity
K
+0.010+0.010
+0.010±0.010
+0.010±0.010
Added
Fe
+0.016+0.028
-0.004±0.011
-0.022±0.008
Zr
+0.016+0.033
+0.002±0.011
-0.007±0.006
Ba
-0.002±0.009
+0.011±0.006
+0.004±0.008
Note: The observed value for unspiked U-500 was 0.99991 ± 0.000126 (1s) for N=29. The certifiedvalue is 0.9997 ± 0.001.
In spite of the success of this technique, there are nagging problems which currentlylimit the ultimate precision and accuracy of the method. One of these, of course, isthe determination of the relative efficiencies of the collectors. It appears that aversatile, reliable, and accurate method has not yet been developed. At the presenttime, calibration methods appear to be good to about 0.01%. A method previouslydiscussed by this author [2], applicable to adjustable collector systems, requiresspecial isotope mixtures and is rather time consuming. The method of "peak-jumping"a single stable ion beam to each collector in turn by stepping the magnet, often seemsto give strange results. The efficiencies vary with element and filament loading, welloutside the apparent precision of the data. An explanation for these variations is notreadily apparent, and the calibration problem certainly should be investigated further.

- 2 6 - AECL-11342
Another problem is that of the occasional "odd" result. For uranium, this usuallyappears as a high 235/238 ratio (0.03 to 0.07%) and is accompanied by a high-temperature "tail" on the intensity vs. filament current profile. This may be due to theproduction on the filament of chemical species, perhaps carbides, that are less volatileand hence prevent total evaporation. Further work is planned to try to resolve some ofthese questions.
References
[1] E.L. Callis and R. M. Abernathey, Proceedings of the 36th ASMS Conference onMass Spectrometry and Allied Topics, June 5-10, 1988, San Francisco.
[2] E.L. Callis and R. M. Abernathey, Int. J. Mass Spectrom. Ion Proc. 103, 93(1991).
[3] R. Fiedler, D. Donohue, G. Grabmueller, A. Kurosawa, Int. J. Mass Spectrom. IonProc. 132, 207 (1994).
Acknowledgement
This work was supported by the US D.O.E. through the US Program for TechnicalAssistance to IAEA Safeguards (POTAS) under Task A. 169.

- 2 7 - AECL-11342
Determination of Trace Iron in Zirconium </, .•'-by Isotope Dilution Thermal lonization Mass Spectrometry
N.L. Elliot, M.A. Campbell and L.W. Green !J^ u ° J ( '"AECL Research, Chalk River Laboratories, Chalk River, Ontario, Canada KOJ 1J0
Introduction
Zirconium alloys are used commonly in the construction of in-core components ofnuclear reactors. Trace elements affect the mechanical and irradiation deformationproperties of these zirconium alloys, therefore control of the abundances of impuritiescould lead to stronger, longer-lasting components. The effect of iron on themechanical properties of irradiated zirconium is not well understood. Iron is known toincrease the rate of self-diffusion in a-Zr [1], which would suggest that the irradiationgrowth rate of a-Zr should increase with Fe concentration. However, studies ofpressure tubes varying in Fe content from 100-2000 ppm have shown the opposite.Studies related to corrosion and hydrogen ingress suggest that the iron level should bekept below 500 ppm [2]. Part of the ambiguity comes from the lack of reliableanalytical methods for iron in zirconium, and consequently, a TIMS method for thedetermination of ppm levels of Fe was developed.
Procedure
Separation from the zirconium matrix was necessary in order to obtain sufficientsensitivity, and a two-stage purification procedure was used combining ion-exchangechromatography and micro-scale solvent extraction. In brief, the spiked sample isapplied to an 0.5 mL column of AG1-X8 (100-200 mesh) in 4 M HCI. Iron(lll) isretained by the resin whereas Zr(IV) washes through [3]. Iron is eluted with 5 columnvolumes of 0.25 M HCI, and, after concentration to a small volume, the fraction isfurther purified by equilibration with three tributylphosphate-impregnated XAD-2 resinbeads. A separation factor of approximately 105 is obtained in 4 M HCI [4].Interferences from Ca, K, Ni and Cr are also lessened as they have distributioncoefficients of <10'2 into TBP.
Sub-microgram amounts of the purified iron were loaded on previously outgassedzone-refined Re filaments with a silica gel/boric acid ionization enhancer, and the54/56 ratios were measured at 1170°C. No corrections were necessary for isobaricinterferences, as ^Cr was normally <0.03% of ^Fe. Although iron has a high firstionization potential (7.87 eV), stable Fe+ currents could be obtained from less than10 ng.

- 2 8 - AECL-11342
Results and Discussion
In order to test the procedure, two sets of iron in zirconium standards were prepared:i) solution standards containing 4-100 ppma Fe were prepared by dissolution ofultrapure Fe wire and ultrapure Zr, and ii) metallic standards containing 23-150 ppmaFe were prepared by pressing high-purity Fe wire into ultrapure Zr and annealing for15 days at 948°C, 10"9 torr. The results of the analyses are shown in Table 1.
Table 1: Analysis of Fe in Zr Standards
Standard (ppma)
2375.2
150.74.3
55.255.293.6
Source
metal standardmetal standardmetal standard
solution standardsolution standardsolution standardsolution standard
Observed
26.5 ± 0.375.7 ±2.2145 ± 3
6.254.4 ± 0.456.5 ± 0.593.8 ± 0.7
Observed/Expected
1.151.0070.9621.440.9861.0241.002
Good agreement between the observed and expected values was obtained, with theexception of the two lowest standards. Of these, the 4 ppma standard was analyzedonce only, and requires further analyses. The procedure has been refined and theprocedural blank has been lowered since these analyses. A further set of standards inthe range of 2-40 ppma will be prepared and analyzed.
Conclusions
A reliable method for the determination of trace iron in zirconium by TIMS has beendeveloped. The combination of ion-exchange chromatography and micro-scale solventextraction has allowed for the separation of trace amounts pi Fe from the Zr matrix ina relatively rapid manner, with an overall procedural blank of 15 ng. The method willbe applied to the determination of the terminal solid solubility of Fe in cc-Zr.
References
[1] A.D. King, G.M. Hood and R.A. Holt. J. Nucl. Materials, 185, 174 (1991).
[2] R.G. Fleck, J.E. Elder, A.R. Causey and R.A. Holt. Variability of IrradiationGrowth in Zr-2.5Nb Pressure Tubes, Zirconium in the Nuclear Industry, NinthInternational Symposium, June 1993, Baltimore, ASTM (proceedings to bepublished).

- 2 9 - AECL-11342
[3] Comprehensive Analytical Chemistry, ed. G. Svehla, Vol. XIV Ion Exchangers inAnalytical Chemistry, 1982.
[4] J. of Chromatography Library, Vol. 2, Extraction Chromatography, ed. T. Braunand G. Ghersini, 1975.
- 3 0 - AECL-11342
IDMS of FeO(OH) Extracted from Blood Digests forStudies of Iron Metabolism in Humans
N.E. Vieira and A.L. YergeyLaboratory of Theoretical and Physical Biology, National Institute of Child Health and
(i Human Development, 10 Center Drive, Bethesda, MD 20892
S.A. AbramsChildren's Nutrition Research Center, 1100 Bates St., Houston, TX 77030
Introduction
Over the past ten years, interest in the use of metal stable isotopes for the study ofhuman mineral metabolism has increased rapidly. Iron absorption studies reported inthe recent literature use anion exchange column chromatography as a preparativemethod for mass spectrometric analysis. Our interest was to develop a more rapid anddirect isolation procedure. We compared three preparative methods: (1) hydroxideprecipitation, (2) ion exchange chromatography using membrane filters, and (3)untreated matrix evaporated and dissolved in dilute acid. The matrices investigatedwere water and digested human whole blood.
Materials and Methods
Acid washed glassware and plasticware were used for all sample preparation.Reagents used were: J. T. Baker Ultrex II NH4OH, HCI, HNO3, and H3PO4; 'BakerAnalyzed1 absolute methanol; 'Baker Analyzed' Fe Atomic Spectral Standard; anddeionized water (Hydro Services, Rockville, MD). The ion exchange membrane filtersevaluated were the following Bio-Rex 25 mm Sample Preparation Discs (Bio-RadLaboratories, Richmond, CA): (a) AG 50W-X8 Cation Exchange Resin, and ( b)AG 1-X8 Anion Exchange Resin. Isotopic ratios were measured by thermal ionizationmass spectrometry using a silica gel/phosphoric acid technique [1]. Fe isotope ratioswere determined using the Finnigan MAT THQ Thermoquad mass spectrometer in thesingle filament mode with electron multiplier detection. Whole human blood wasdigested in HNO3 using the CEM Microwave Digestion System Model MDS 81D.
Cation membrane filters were loaded with 1 mL water matrix (50 ug/mL Fe) or 2 mLblood digest (15 ug/mL Fe, pH adjusted to >2). Fe was eluted with 5 and 6 mL 3 MHCI for water and digest, respectively. Anion exchange membrane filters were loadedwith 1 mL water matrix (50 ug/mL Fe) or 2 mL digest (20 ug/mL Fe, pH adjusted to<1) and a 0.3 M HCI solution was used for Fe elution.

-31 - AECL-11342
The Fe precipitation was based on the procedure described previously [2].Concentrated NH4OH was added to bring the pH of each sample (Fe-containingmatrices of water, whole blood digest and ion exchange eluent) to 10. A red/brownprecipitate was observed after a 4-hour period. The precipitate was centrifuged at2000 rpm for 10 minutes and the supernatant discarded. The precipitate was dried inan oven for 15 minutes at 100°C and dissolved in 100 uL of 3% HCI.
Standard curves were prepared in water and blood digest matrices by the addition ofaliquots of a 96.44 atom% enriched 54Fe tracer solution. The tracer was allowed toequilibrate in the matrix 1 day at room temperature. Enrichments ranged from 10 to100% excess 54Fe. The equilibrated curves were divided into 3 treatment groups:(1) directly precipitated. (2) cation exchange separation followed by precipitation, and(3) directly evaporated (1.3 mL digest was evaporated using microwave heating andlow power settings over a period of 70 minutes with the remaining liquid dried in anoven at 100°C). All precipitates were dissolved in 100 uL of 3% HCI.
Results
Total Fe recovery for the 3 isolation procedures investigated is shown in Table 1.
Table 1: Percent Recovery of Fe from Water and Whole Blood Digest usingIon Exchange Membrane Filters and Hydroxide Precipitation
Extraction Method
cation:ugFe% recovery
anion:ug Fe% recovery
precipitation:ug Fe% recovery
Water
5072
50no adsorption
13399 ±5
Digest
3091
40observed
40-13039 ± 4
Eluent
—
—
2555*
*(n=1)

- 3 2 - AECL-11342
Reasonable Fe recoveries were observed from the water matrix using both cationexchange and hydroxide precipitation. In the case of the digest matrix, cationexchange resulted in a greater recovery than did precipitation. However, the lowrecovery in precipitation did not affect the mass spectral analysis.
Measured fractional abundances of unspiked matrix are shown in Table 2. Nickelcontamination was observed in the THQ system and may account for the inaccurateabundance of m/z 58 in the evaporated matrix. All untreated and treated matricesresulted in expected natural abundances.
Table 2: Fractional Abundances of Unspiked Matrix
Mass
expected3
M S std. (± 1s)
diaest treatment:precipitationevaporated
54
0.0580
0.0572±0.0004
0.0592+0.00150.055240.0025
56
0.9172
0.9173±0.0009
0.9168+0.00180.9169±0.0037
57
0.0220
0.0225±0.0005
0.0213±0.00050.0236±0.0014
58
0.0028
0.0030±0.00005
0.0027+0.00020.0043±0.0011
Table 3 shows the linear regression analysis of the directly precipitated, cationexchange followed by precipitation, and directly evaporated standard curves. Themethods of precipitation and evaporation resulted in regression lines with slopesapproximating 1 and intercepts approximating 0.
Table 3: Linear Regression Analysis of 3 Fe Isolation Procedures(RSy.x = relative standard error of the estimate; n = number of curves)
Treatment
water standards:precipitation + 1scation exchange+precipitationevaporated
digest: standards:precipitation ± 1scation exchange+precipitationevaporated
Intercept
-2 ± 2-11.079-2.070
- 1 + 35.284
-3.169
Slope
1.10 ±0.031.0870.996
1.01 ±0.060.9911.082
RSy.x
0.0440.2290.114
0.0450.1140.109
n
411
411

- 3 3 - AECL-11342
Conclusions
Although recovery is better with cation exchange techniques, overall precision ofisotope dilution analysis favors use of the direct precipitation approach. In addition,precipitation is a simple and rapid one-step method not requiring time intensive stepsby the investigator.
References
[1] I.L. Barnes, T.J. Murphy, J.W. GramLich, W.R. Shields, Anal. Chem. 45, 1881(1973).
[2] G. Hagg, General and Inorganic Chemistry (Wiley, New York, 1969), p. 729.
[3] P. De Bievre, I.L. Barnes, Int. J. Mass Spectrom. Ion Processes. 65, 211 (1985).

- 3 4 - AECL-11342
Characterization of Uranium in Surface-WatersCollected at the Rocky Flats Facility
D.W. Efurd, D.J. Rokop, R.D. Aguilar, F.R. Roensch, R.E. Perrin and J.C. Banar, Chemical Science and Technology Division
» Los Alamos National Laboratory, Los Alamos, NM 87544, USA
Introduction
The Rocky Flats Plant (RFP) is a Department of Energy (DOE) facility whereplutonium and uranium were handled. During plant operations radioactivity wasinadvertently released into the environment. This study was initiated to characterizethe uranium present in surface-waters at RFP. Three drainage basins and naturalephemeral streams transverse RFP. The Woman Creek drainage basin traverses anddrains the southern portion of the site. The Rock Creek drainage basin drains thenorthwestern portion of the plant complex. The Walnut Creek drainage basintraverses the western, northern, and northeastern portions of the RFP site. Dams,detention ponds, diversion structures, and ditches have been constructed at RFP tocontrol the release of plant discharges and surface (storm water) runoff. The pondslocated downstream of the plant complex on North Walnut Creek are designated A-1through A-4. Ponds on South Walnut Creek are designated B-1 through B-5. Theponds in the Woman Creek drainage basin are designated C-1 and C-2. Watersamples were collected from each pond and the uranium was characterized by TIMSmeasurement techniques [1].
Results
Table 1 reports the highest uranium concentration measured in the RFP ponds duringthis study. For comparison, the uranium concentrations in three reservoirs near RFPand two wells in Colorado are also reported [2,3,4].

- 3 5 - AECL-11342
Table 1: Uranium Concentrations in Waters
Location
Pond A-1Pond A-2Pond A-3Pond A-4Pond B-1Pond B-2Pond B-3Pond B-4Pond B-5Pond C-1Pond C-2
DillonGreat Western
RalstonStandley*La Junta*Pueblo
Description
RFP Holding PondRFP Holding PondRFP Holding PondRFP Holding PondRFP Holding PondRFP Holding PondRFP Holding PondRFP Holding PondRFP Holding PondRFP Holding PondRFP Holding Pond
ReservoirReservoirReservoirReservoir
WellWell
Uranium ContentpCi/L
15.87.35.13.53.8
11.00.51.51.82.03.20.52.10.91.8
497.0168.0
* The wells listed in Table 1 do not serve as public water supplies.
The presence of 236U in the surface-water samples collected at RFP and the variable238U/23SU atom ratios detected in water samples collected from the holding pondsproves that anthropogenic uranium is present. Table 2 illustrates the maximumamount of depleted uranium that is present in each water sample collected at RFP.The values derived assume a simple two component system and that the depleteduranium released by RFP contains 0.5% 235U. This conservative estimate determinesthe maximum amount of 235U in the water that is attributable to the depleted uraniumpresent in the surface-waters.

- 3 6 - AECL-11342
Table 2: Maximum Percentage of 235U in Water Attributable toRelease of Depleted Uranium at RFP
DateSampled
02/24/9305/12/9308/24/9311/25/9305/12/9302/24/9308/24/9311/25/9202/24/9305/12/9308/24/9310/23/9211/24/9212/14/9201/14/9302/23/9303/17/9304/21/9305/12/9306/15/9307/15/9308/23/9311/25/9205/13/9302/24/9308/24/9311/25/9305/13/9302/24/9308/24/9311/25/9202/24/93
Pond
A1A1A1A2A2A2A2A3A3A3A3A4A4A4A4A4A4A4A4A4A4A4B1B1B1B1B2B2B2B2B3B3
MaximumPercentage
250
10081465066
1005780
1008117414053584945545631142317230
5750561223
DateSampled
05/13/9308/24/9311/25/9205/13/9302/24/9308/24/9310/23/9211/24/9212/14/9201/14/9302/23/9303/17/9304/21/9305/13/9306/15/9307/15/9308/23/9312/03/9205/13/9302/23/9308/23/9310/23/9211/25/9212/14/9201/14/9302/23/9303/17/9304/15/9305/13/9306/15/9307/15/9308/24/93
Pond
B3B3B4B4B4B4B5B5B5B5B5B5B5B5B5B5B5C1C1C1C1C2C2C2C2C2C2C2C2C2C2C2
MaximumPercentage
3536192625191310122118181716461612
1010
6360515851525353465154

- 3 7 - AECL-11342
Conclusions
The upper Ponds A-1, A-2, A-3, B-1, B-2, B-3, and B-4 contain measurable quantitiesof depleted uranium. The uranium concentrations in water samples collected fromthese ponds ranged from 0.2 to 15.8 pCi/L. Essentially 100% of the uranium in PondA-1 and Pond A-2 originated as depleted uranium. All other ponds, except Pond C-1,contain mixtures of naturally occurring and depleted uranium. Approximately half ofthe uranium present in Ponds A-4 and C-2 originated as depleted uranium.Approximately 20% of the uranium in the waters collected from Pond B-5 originated asdepleted uranium. Approximately 50% of the uranium detected in the waters collectedfrom Pond C-2 was anthropogenic.
Acknowledgements
This project was funded by EG&G Rocky Flats Plant under the auspices of contract No.LATO-EG&G-91-022.
References
[1] D.W Efurd, D.J. Rokop and R.E. Perrin, "Characterization of the Radioactivity inSurface-Waters and Sediments Collected at the Rocky Flats Plant," Los AlamosNational Laboratory report LA-UR-93-4373, 1993.
[2] J.D. Parson and R.G. Warren, "Uranium Hydrogeochemical and StreamSediment Reconnaissance of the La Junta NTMS Quadrangle, Colorado,Including Concentrations of Forty-three Additional Elements," Los AlamosNational Laboratory report LA-7343-MS, 1979.
[3] S.S. Shannon, "Uranium Hydrogeochemical and Stream SedimentReconnaissance of the Pueblo NTMS Quadrangle, Colorado, IncludingConcentrations of Forty-two Additional Elements," Los Alamos NationalLaboratory report LA-7541-MS and suppl., 1978.
[4] N.M. Daughtry Ed., "Rocky Flats Site Environmental Report For 1988," RockyFlats report RFP-ENV-88, 1989.

L <e
- 3 8 - AECL-11342
Extraction and Measurement of Subpicogram Quantities of Technetium fromGeologic and Other Matrices
P.R. Dixon, D.J. Rokop, J.T. Fabryka-Martin, and D.B. CurtisLos Alamos National Laboratory, CST, MS-J514, Los Alamos, NM 87545, USA
introduction
The need to measure "Tc in a variety of sample matrices (e.g. soils, rock and water)is becoming increasingly important for detailed tracing of processes related to nuclearwaste disposal, monitoring of contaminated ground water movement, and nuclear non-proliferation activities around the world. This demand has led us to develop a robustmethod for separating and purifying trace amounts (subpicogram/gram) of "Tc fromvarious matrices. This extended abstract describes the extraction methodologies andthe analytical precision and accuracy for small samples.
Approach and Techniques
Previous work
Accurate and precise measurement of subpicogram quantities of technetium in smallenvironmental samples, 1-10 g of solid material and 1-100 of mL water, entails the useof negative thermal ionization mass spectrometry (NTIMS) and ultra clean chemicalseparation techniques. Most of the previous work on extraction, purification andanalysis of technetium has been on large samples, 1 to 1000 L water and 20 g to 1.0kg of biologic or geologic material [1-10], with detection limits between 1 to 500picogram/gram. Most of these analyses were done by inductively coupled plasmamass spectrometry (ICP/MS), with minimal chemistry. Several papers have reportedthe analysis of technetium at the subpicogram level in waters using a NTIMS method[11] and a silica gel /TIMS method [12]. Trautmann [13] claims femtogramdetectability using laser resonance ionization mass spectrometry (RIMS), but presentsno environmental data. In this paper we describe a robust method for the extraction,purification and analysis of technetium at the femtogram level in small water and solidsamples.
Technetium Isolation Procedure
An extraction and purification technique for "Tc from both geologic (uranium ores andsediments) and water samples has been developed at Los Alamos as part of itsnatural analogues research activities. For geologic samples, the technique consists of
- 3 9 - AECL-11342
spiking the sample with 97Tc followed by a sodium peroxide/sodium hydroxide fusion.The fusion cake is then dissolved in de-ionized water, the hydroxide precipitates areremoved, and the Tc is extracted from the aqueous fusion solution into aTPA/chloroform mixture. The Tc is back-extracted from the TPA/chloroform solutionwith 8 M HNO3, then it is further purified through 1-mL and 100-uL anion columnscharged with AG-MP1 resin (100-200 mesh). The final purification step ismicrodistillation in a 5-mL Teflon conical vial. For water samples, the techniqueconsists of adding 97Tc spike to the sample along with H2SO4 and Ce+4to assuresample and spike equilibration. Once equilibration is achieved, the technetium isextracted from the aqueous solution with a TPA/chloroform mixture, and the aboveprocedure is followed.
Total chemistry yields for samples with less than 10 picogram of total Tc are 10 to30%. In samples with more than 10 picogram of total Tc, the chemistry yields are 50to 90%. A small but quantifiable amount of Tc is always lost during chemistry,regardless of sample size, such that large samples always have higher yields thansmall samples.
Mass Spectrometry and Filament Loading
Our analyses of Tc isotopes use the negative ionization configuration (NTIMS) massspectrometry technique reported by Rokop and others [14] to measure 10 to 100 fgfilament loads of Tc. Using this low temperature (1050 ± 5°C) NTIMS method incombination with a lanthanum oxide ionization enhancer on a NBS source filamentassembly, isobaric corrections for Mo and organics have been virtually eliminated.Using standards, we have determined that our detection limit for "Tc is 5x10⁵ atomsor 0.1 femtograms. Our full chemistry/mass spectrometry blank based on 10 analysesis 5.4 femtograms or 3.3x10⁷ atoms. Our measurement limit, defined as 3a of ourblank, is 8.4x10⁷ atoms or 14 femtograms. Our external reproducibility (chemistry andmass spectrometry) using a Canadian uranium ore standard measured 6 times overan 8-month period (BL-5, "Tc concentration = 56.2 ± 0.8 fg/gm) has a precision andaccuracy of ~1.5%.
Initial Data Interpretation
A major application of this Tc work has been evaluation of the feasibility of geologicstorage and disposal of spent nuclear fuel. The abundance of "Tc in natural uraniumminerals can be used to determine alteration/dissolution and radionuclide release ratesunder a variety of natural geochemical conditions that bracket most proposedrepository sites [16-19]. We have developed a model to predict the equilibriumconcentration of "Tc and other radionuclides produced during the fission of naturaluranium [19]. Excesses and depletions of "Tc in both rocks and ground waters from

- 4 0 - AECL-11342
Cigar Lake in Canada and Koongarra in Australia have been used to set limits onuranium mineral alteration and radionuclide release rates at these geochemicallydifferent sites [16-19]. We are now working with Yucca Mountain PerformanceAssessment (YMPA) staff to incorporate relevant information from this research intothe YMPA process to test safety and release scenarios for site licensing.
Conclusions
We have developed a robust method for extracting and purifying picogram andsubpicogram amounts of Tc from geologic, biologic and water samples. Combiningthese extraction and purification technologies with existing NTIMS analysis capabilitiesat Los Alamos, we are able to consistently measure with high precision and accuracysubpicogram amounts of "Tc in a variety of materials. This extreme sensitivity allowsus to study alteration rates of natural uranium minerals, identify the leading edge andextent of radioactive contamination plumes, and monitor nuclear non-proliferationactivities around the world.
References
[1] H. Hidaka, K. Shinotsuka and P. Holliger, Radiochim. Acta 63, 19 (1993).
[2] N. Matsuoka, T. Umata, Okamura, N. Shiraishi, N. Momoshima and Takashima,J. Radioanal. Nucl. Chem., 140, 57 (1990).
[3] T.J. Anderson and R.L Walker, Anal. Chem. 52, 709 (1980).
[4] S. Morita, C.K. Kim, Y. Takaku, R. Seki and N. Ikeda, Appl. Radiat. Isot., 42,531 (1991).
[5] N. Momoshima, M. Sayad and Y. Takashima, Radiochem. Acta, 63, 73 (1993).
[6] K. Tagami and S. Uchida, Radiochem. Acta, 63, 69 (1993).
[7] S. Morita, K. Tobita and M. Kurabayashi, Radiochem. Acta, 63, 63 (1993).
[8] J.S. Crain and D.L. Gallimore, Appl. Spectra., 46, 547 (1992).
[9] D.M. Beals, Determination of Technetium-99 in aqueous samples by isotopedilution inductively coupled plasma mass spectrometry, in Proceedings from the3rd International Conference on Nuclear and Radiochemistry, Vienna, Austria,September, 1992.

- 4 1 - AECL-11342
[10] S. Hirano and M. Matsuba, Radiochim. Acta, 63, 79 (1993).
[11] N.C. Schroeder, D. Morgan, D.J. Rokop and J. Fabryka-Martin, Radiochem.Acta, 63, 203 (1993).
[12] J.M. Pochkowski and D.M. Beals, Determination of subpicogram quantities ofTechnetium-99 in environmental samples by positive thermal ionization massspectrometry, in Proceedings of the 41st ASMS Conference on MassSpectrometry, p.182, 1993.
[13] N. Trautmann, Radiochim. Acta, 63, 37 (1993).
[14] D.J. Rokop, N.C. Schroeder and K. Wolfsberg, Anal. Chem., 62, 1271 (1990).
[15] P.R. Dixon, Curtis, D.B. and J.T. Fabryka-Martin, GSA Astr. with Prog., 25, A-184 (1993).
[16] P.R. Dixon, J.T. Fabryka-Martin, D.B. Curtis, D.J. Rokop, J. Cramer, J. Cornett,L. Kilius and P. Sharma, Modeling and measurements of in-situ producednuclides in uranium minerals: Implications for spent fuel stability, in ProceedingsEighth International Conference of Geochronology and Cosmochronology, andIsotope Geology (ICOG-8), Berkeley, CA, 1994.
[17] D.B. Curtis, J.T. Fabryka-Martin and P.R. Dixon, Natural constraints onradionuclide release rates, in Proceedings of the Natural Analogues WorkingGroup (NAWG-5), Toledo, Spain, 1992.
[18] D.B. Curtis, J.T. Fabryka-Martin, P.R. Dixon, R. Aguilar, D.J. Rokop andJ. Cramer, Radionuclide releases from natural analogues of spent nuclear fuel,in Proceedings Migration-93, Charlotte, NC, 1993.
[19] J. Fabryka-Martin and D.B. Curtis, Geochemistry of 239Pu, 1 2 9 I , "Tc and 36CI, inFinal Report Alligator Rivers Analogue Project, 15, Ed. by Australian NuclearScience and Technology Organization, Report No. ISBN-0-642-59941-6, 1992.

- 4 2 - AECL-11342
THERMAL lONIZATION MASS SPECTROMETRY
Instrumentation

- 4 3 - AECL-11342
A High Efficiency Thermal lonization Source Adapted To Mass Spectrometers
E. Phil Chamberlin and Jose A. Olivares ! ' • w
Los Alamos National Laboratory, Los Alamos, NM 87545, USA
Introduction
The high temperature ion source used on the isotope separators at Los Alamos wasoriginally developed almost simultaneously by Beyer in Dubna [1] and Johnson atLivermore [2]. Some contemporaries of the authors claim that the concept for thesource arose from a discussion between two of the authors at a conference and thatcredit for the work should be shared jointly. During the past ten years we havelearned how to make the source produce reliably and with high throughput.Experience seems to be an important factor in determining what not to do. If reliableoperation of the ion source were as simple as the authors of the two papers implied,this type of ion source might be in wider use today.
There are three requirements for repeatable results with high throughput: a well-engineered physical assembly that will operate at the required high temperatures,contaminant-free chemical preparation of the samples, and a well-understoodoperating procedure. A new user is typically faced with all three of these hurdlessimultaneously, and the challenges can prove daunting. We were fortunate to havefabricated sources on hand similar to that shown in [2]. The chemistry and operationalprocedures followed with time.
Figure 1 indicates the elements for which the source is suitable. Those marginallysuitable are shaded. Both the first ionization potential (through the Saha-Langmuirequation) and the operating temperature (through the vapor pressure of contaminants)affect the ionization efficiency [3,4,5,6]. Using a tungsten crucible that had beenpre-baked to a temperature where thorium could be seen as a contaminant of thetungsten, we achieved an europium ionization efficiency of 72%. Using unbakedcrucibles, 40% efficiencies were the norm. This reflects the results reported in [2].Lutetium has a lower first ionization potential but its vaporization temperature is twicethat of europium. This causes increased vaporization of contaminants includingtungsten, lowering throughputs to 25%. Zirconium is an element having both highionization potential and low vapor pressure and our ionization efficiencies for it rangebetween 2 and 3%.
While experimental and theoretical efforts over the past twenty years have provedfruitful on isotope separators, no one has adapted electron bombardment, cavity typesources to the field of mass spectrometry. The mass spectrometry source most

- 4 4 - AECL-11342
resembling the source discussed here was the tube source described by Delmore,Appelhans and Peterson [7]. That arrangement, however, is incapable of reaching thetemperatures required for efficient ionization of refractory materials such as zirconium,hafnium and thorium.
u67OK5.4 .V
46SK5.1 .V
K395K4.3 .V
Rb383K4.2 .V
Ca3S0K3.9 . V
Fr
MOeooK7.6 aV
c>730K6.1 eV
Sf880K5.7 aV
Ba730K5.2 aV
R»S90K5.3 aV
Sc1375K6.6 (V
Y16O0K6.4 aV
U1700K5.8 .V
Ac
Tl1710K6.8 eV
Zr2275K6.8 eV
HI2275K6.8 aV
V1820K6.7 eV
Ca1650K5.5 .V
Th2250K6.1 aV
Cr1430K6.8 aV
Pr1420K5.5 aV
PI
Nit-1«0KMaV
Tc
74.V
Nd132SK54 aV
U1S50K6.2 aV
F*1500KZ » » V
Ru22S0K7.4 »V
Pm1050K5.6 eV
NP
Co1530K7.9 aV
Rh197SK?.SaV
Sm850K5.6 »V
Pu1475K6.1 eV
Nl1530K7.6 aV
Eu730K5.7 eV
Am1130K6.0 aV
Cu1300K7.7 oV
*a1100K7 * B V
Gd1350K6.2 aV
Tb1425K5.8aV
Al1250K6.0 aV
Ga1175K6.0 aV
In1000K5.8 eV
T)740K6.1 eV
Dy112SK5.9 aV
Ho1225 K6.0 aV
Er1225K6.1 aV
Tm95OK6.2 aV
Yb690K6.3 oV
U1550K5.4 aV
Figure 1: Elements lonizable Using High Temperature Techniques(Listed are temperature to achieve 10"4 torr and first ionization potential)
Objectives
The isotope separator ion source is unsuitable for mass spectrometry use. It is bulky,designed for single sample operation, expensive to fabricate, requires great care inassembly, requires high heating power and, as a result, significant cooling water flow.Before design of the modified source began, we established a set of objectives:
- Reduce the number of parts to minimize fabrication costs and allow disposal ratherthan cleanup.
- Minimize complexity of parts; design to commercially available shapes andcomponents.
- Have an inexpensive, one piece crucible.- Have a modular system.- Operate with \itt\e or no water cooling.- Use existing power supplies and control system.

- 4 5 - AECL-11342
The Crucible and Beam Formation
The most uncertain of these objectives was the ability to achieve a reasonable ionbeam emittance while using a one piece crucible. Figure 2 (top) shows the crucibleand cap used in isotope separator operations. The cap surface is shaped to minimizethe overall magnification of the beam. The ionizing channel diameter is about. 1/3millimeter. Figure 2 (bottom) shows the design for mass spectrometer operation. Theionizing channel diameter is slightly less than 1/2 millimeter and is over a centimeterdeep. In both cases, the ionizing channel opening presents a small apparent object tothe optic system but is large enough to ensure that a quasi-neutral plasma can bemaintained [4]. The mass spectrometer crucible can be mass produced at reasonablecost and can be baked at high temperature prior to loading. Actual backgroundmeasurement of contaminants can be performed prior to sample loading if required.Early on, test samples of Th(NO3)4 were run using this crucible in the isotopeseparator ion source to quantify changes in beam focussing. The results wereencouraging in both ionization efficiency and focal plane spot size.
The electrostatic field code SIMION [8] was then used to model the ion source,comparing relative values of extracted beam emittance while varying crucible position,extractor position and the potential of the electron bombardment filament relative tothe crucible. The position of the crucible relative to the electron reflector/heat shieldand extractor position had little effect on the beam emittance. The electronbombardment energy (filament and reflector/heat shield) potential had the most effecton the emittance.
y/0. V///////////////////////////A
JZZZZZZZZZZZZZZZZZZZZZZZZZZZ/.
l j r * * * - * - • * * - Y7////7Z//77/A
Figure 2: Isotope Separator Crucible (top) and Mass Spectrometer Crucible (bottom)
The Electron Bombardment Assembly
The ion source is shown in Figure 3 in two views. On the left is a transverse sectionview showing the source mounted on an RF-quadrupole mass spectrometer. On theright is the axial view seen by ions leaving the source. The transverse section view of

- 4 6 - AECL-11342
the source shows that it consists of three major assemblies: the quadrupole/sourcemounting adapter, the electron bombardment assembly and the crucible holder. Themounting adapter will take a form appropriate to each application. The crucible holdershown is a purely functional item assembled from Conflat vacuum parts together withone machined rod and two set-screws.
U
Figure 3: (Left) The ion source mounted on a quadrupole mass spectrometer.(Right) A coaxial view of the source.
The electron bombardment assembly was designed around a 6 inch diameter,double-sided Conflat blankoff flange. Precise machining operations are minimal andare intended for a numerically-controlled milling machine. Interior parts consist of orare fabricated from easily available commercial components. An alignment jig forfilament fabrication and a necessary welding operation are a part of the design. Thedesign was carried out using AutoCAD-12, making modifications simple when adaptingto specific applications. Cooling water channels have been designed into the systemas shown in the axial view. The flow tubes are arranged laterally on both sides ofeach filament-current electrical feedthrough. These feedthroughs are operated at thefilament bias voltage (up to 2.5 kV) and are a hazard to personnel if not covered. Thewater tubes provide a firm foundation for a clamp-block arrangement which providespersonnel safety protection and a securing post so that the electrical feedthrough doesnot bear the weight of conductors. Without cooling water flowing, the ion source bodymay reach temperatures which could damage adjoining equipment or personnel. Afan directing air onto the source body usually provides sufficient cooling under theseconditions.
Obviously a design which required the operator to break vacuum to introduce eachsample would be less than satisfactory, so there is a multiple crucible system in theinitial design stages.
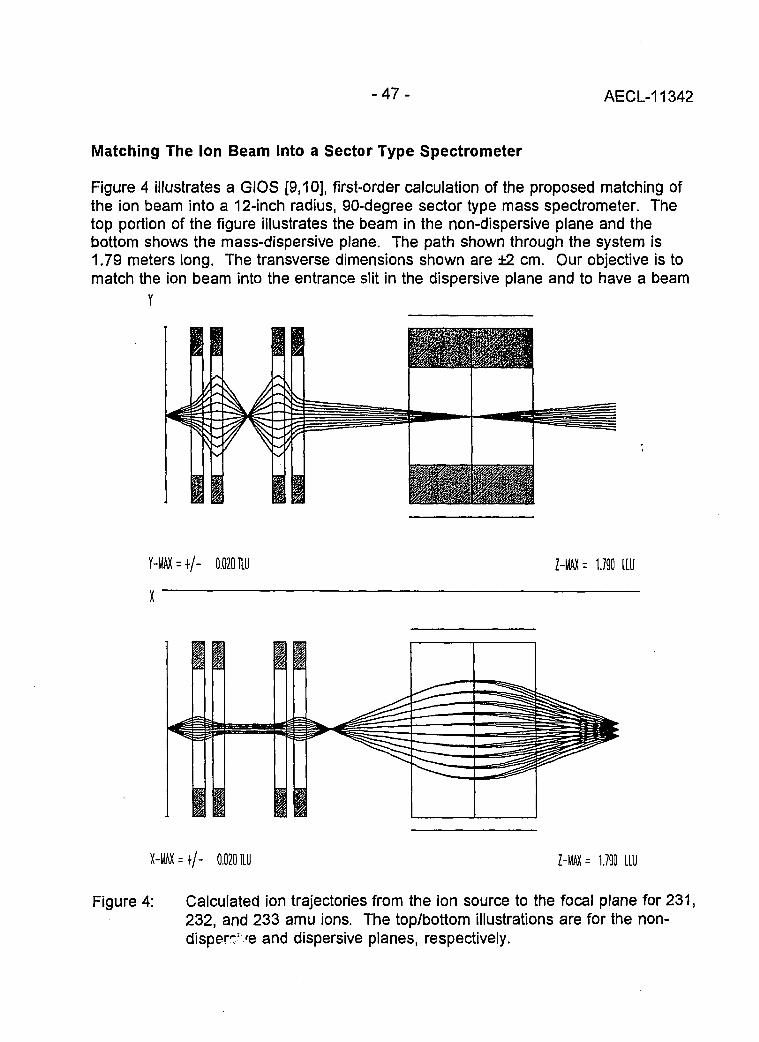
- 4 7 - AECL-11342
Matching The Ion Beam Into a Sector Type Spectrometer
Figure 4 illustrates a GIOS [9,10], first-order calculation of the proposed matching ofthe ion beam into a 12-inch radius, 90-degree sector type mass spectrometer. Thetop portion of the figure illustrates the beam in the non-dispersive plane and thebottom shows the mass-dispersive plane. The path shown through the system is1.79 meters long. The transverse dimensions shown are ±2 cm. Our objective is tomatch the ion beam into the entrance slit in the dispersive plane and to have a beam
Y
Y-MAX = + / " 0.020 TLU Z - l t tX= 1.790 111)
X-MAX = + / - 0.020 TLU Z-MAX = 1.790 LLU
Figure 4: Calculated ion trajectories from the ion source to the focal plane for 231,232, and 233 amu ions. The top/bottom illustrations are for the non-disperr:; 'e and dispersive planes, respectively.
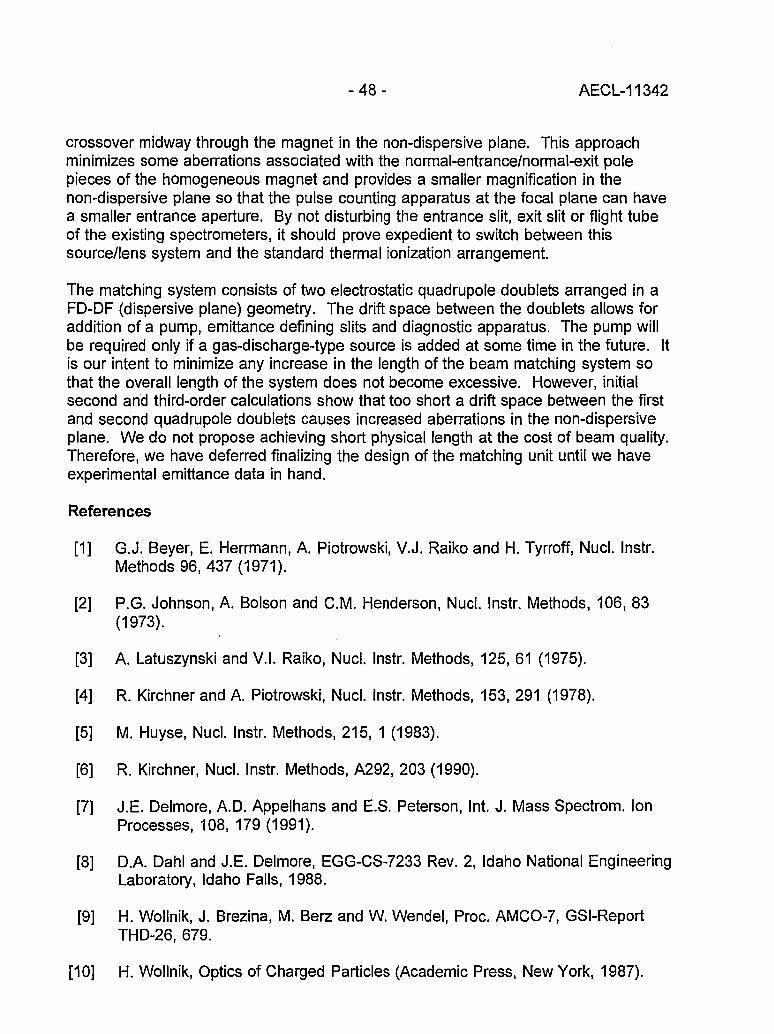
- 4 8 - AECL-11342
crossover midway through the magnet in the non-dispersive plane. This approachminimizes some aberrations associated with the normal-entrance/normal-exit polepieces of the homogeneous magnet and provides a smaller magnification in thenon-dispersive plane so that the pulse counting apparatus at the focal plane can havea smaller entrance aperture. By not disturbing the entrance slit, exit slit or flight tubeof the existing spectrometers, it should prove expedient to switch between thissource/lens system and the standard thermal ionization arrangement.
The matching system consists of two electrostatic quadrupole doublets arranged in aFD-DF (dispersive plane) geometry. The drift space between the doublets allows foraddition of a pump, emittance defining slits and diagnostic apparatus. The pump willbe required only if a gas-discharge-type source is added at some time in the future. Itis our intent to minimize any increase in the length of the beam matching system sothat the overall length of the system does not become excessive. However, initialsecond and third-order calculations show that too short a drift space between the firstand second quadrupole doublets causes increased aberrations in the non-dispersiveplane. We do not propose achieving short physical length at the cost of beam quality.Therefore, we have deferred finalizing the design of the matching unit until we haveexperimental emittance data in hand.
References
[1] G.J. Beyer, E. Herrmann, A. Piotrowski, V.J. Raiko and H. Tyrroff, Nucl. Instr.Methods 96, 437 (1971).
[2] P.G. Johnson, A. Bolson and CM. Henderson, Nucl. Instr. Methods, 106, 83(1973).
[3] A. Latuszynski and V.I. Raiko, Nucl. Instr. Methods, 125, 61 (1975).
[4] R. Kirchner and A. Piotrowski, Nucl. Instr. Methods, 153, 291 (1978).
[5] M. Huyse, Nucl. Instr. Methods, 215, 1 (1983).
[6] R. Kirchner, Nucl. Instr. Methods, A292, 203 (1990).
[7] J.E. Delmore, A.D. Appelhans and E.S. Peterson, Int. J. Mass Spectrom. IonProcesses, 108, 179 (1991).
[8] D A Dahl and J.E. Delmore, EGG-CS-7233 Rev. 2, Idaho National EngineeringLaboratory, Idaho Falls, 1988.
[9] H. Wollnik, J. Brezina, M. Berz and W. Wendel, Proc. AMCO-7, GSI-ReportTHD-26, 679.
[10] H. Wollnik, Optics of Charged Particles (Academic Press, New York, 1987).

'}- -'-.
CIWJO'
- 4 9 - AECL-11342
Instrumental Improvements on a Two Stage (B-RPQ) Mass Spectrometerwith Very High Abundance Sensitivity
( Johannes B. Schwieters and Peter BachFinnigan MAT GmbH, Barkhausenstr. 2, 228197 Bremen, Germany
Introduction
Because of its high selectivity and extreme stability thermal ionisation massspectrometry (TIMS) reveals information at a very high level of accuracy and precisionthat cannot be achieved by any other technique. The precise and accuratemeasurement of very large isotope ratios is a specific challenge for thisinstrumentation. Conventional mass spectrometers are limited to an abundancesensitivity of 10'6-10"7. For isotope ratios larger than 100,000 this is a serious problemin general, requiring a tandem- or accelerator-ms (AMS) [1,2]. However, these arevery expensive and rather specialized techniques, restricted to a few laboratoriesworldwide.
At the first Alfred O. Nier Symposium we reported on a new and simple instrumentalapproach giving ultra high abundance sensitivity [3]: a thermal ionization singlefocussing magnetic sector instrument combined with a retarding potential quadrupole(RPQ) filter lens. This system has been proven to be capable of measuring isotoperatios up to 1 x 10⁹ [4,5]. In these measurements an abundance sensitivity level of 3 x1o-io (i33Cs/i35Cs ^ w a s achieved. However, the transmission of the first RPQ, RPQ-I, was restricted to about 50%. For many applications the stability of the system wasa problem. This paper reports on significant improvements in transmission andstability and introduces the next generation system, RPQ-II. The performance of thenew system is demonstrated and the limits of accuracy and precision are discussed.
Description of the Instrument
The analyzing magnet of the MAT 262 has inclined field boundaries to ensure efficientfocussing in the X- and Y-directions. Second order image aberration correction (a2) isachieved by a curvature of the entrance and exit pole faces of the magnet. Bothnarrow focussing of the ion beam and correction of image aberrations areindispensable prerequisites for instrumentation with high abundance sensitivity. Also,UHV conditions in the flight tube are required. Any scattering events with the walls ofthe analyzer chamber, residual gas particles or apertures can result in energy lossand/or change of flight direction of the ions and thus reduce the abundance sensitivity.However, even with the most carefully designed ion optics, scattering effects can
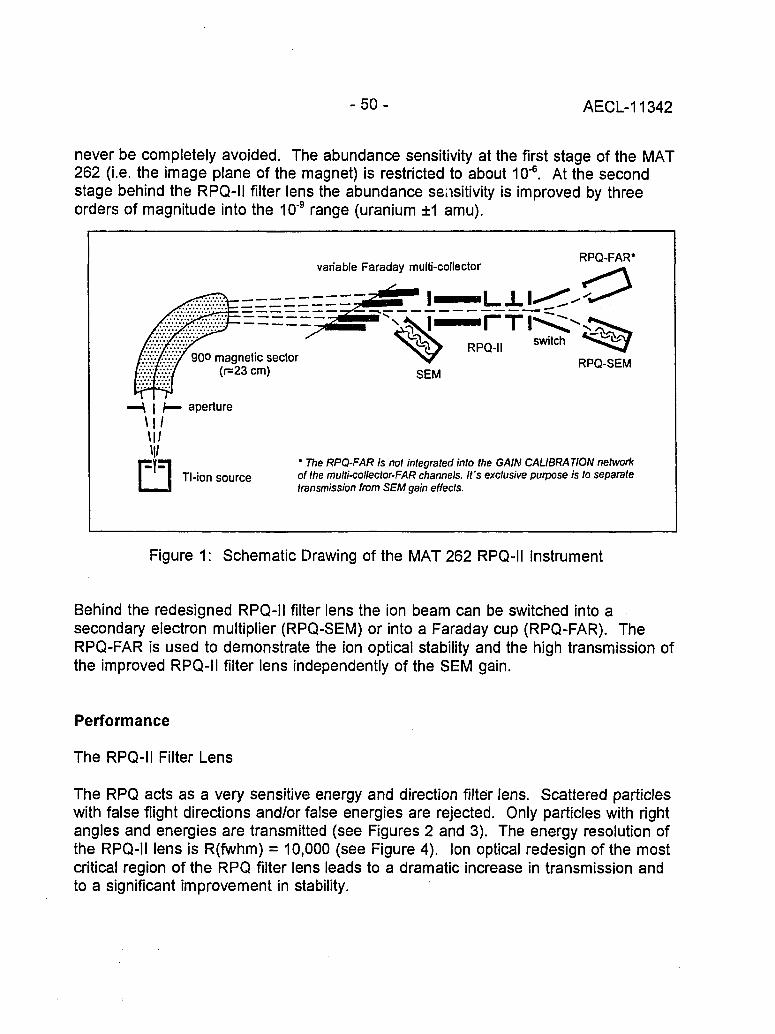
- 5 0 - AECL-11342
never be completely avoided. The abundance sensitivity at the first stage of the MAT262 (i.e. the image plane of the magnet) is restricted to about 10"6. At the secondstage behind the RPQ-II filter lens the abundance sensitivity is improved by threeorders of magnitude into the 10'9 range (uranium ±1 amu).
variable Faraday multi-collectorRPQ-FAR*
900 magnetic sector(r=23 cm) SEM
RPQ-SEM
| ^ — aperture
Tl-ion source
• The RPQ-FAR is not integrated into the GAIN CALIBRATION networkof the multi-colleclor-FAR channels. It's exclusive purpose is to separatetransmission from SEM gain effects.
Figure 1: Schematic Drawing of the MAT 262 RPQ-II Instrument
Behind the redesigned RPQ-II filter lens the ion beam can be switched into asecondary electron multiplier (RPQ-SEM) or into a Faraday cup (RPQ-FAR). TheRPQ-FAR is used to demonstrate the ion optical stability and the high transmission ofthe improved RPQ-II filter lens independently of the SEM gain.
Performance
The RPQ-II Filter Lens
The RPQ acts as a very sensitive energy and direction filter lens. Scattered particleswith false flight directions and/or false energies are rejected. Only particles with rightangles and energies are transmitted (see Figures 2 and 3). The energy resolution ofthe RPQ-II lens is R(fwhm) = 10,000 (see Figure 4). Ion optical redesign of the mostcritical region of the RPQ filter lens leads to a dramatic increase in transmission andto a significant improvement in stability.

-51 - AECL-11342
Figure 2: RPQ-II Ion Trajectories.Ions of False Angle andEnergy are Rejected.
Figure 3: RPQ-II Ion Trajectories.Transmission of Ions ofRight Angle and Energy.
100
en 60
9995 9996 9997 9993 9999 10000 10001 10002 10003
Suppression Lens Voltage V
Figure 4: Energy Resolution of the RPQ-II Filter Lens
Abundance Sensitivity
Figure 5 shows a mass scan across the 230Th peak of a large isotope ratio thoriumsample (23oTh/232Th) = 2,800,000 [6]. At the first stage the 230Th peak is hidden in thepeak tailing of the intense 232Th peak. After passing the RPQ the stray particles of232Th are removed and the 230Th peak appears on a clean baseline.

- 5 2 - AECL-11342
experimental parameters:abundance sensitivity:mass steps:integration time/step:
1 E-60,02 amu8s
axpenmantal paramatarsabundance sansitivity:mast steps:integration time/step:
1E-90.02 «mu18s
i.S U 1
Ma»» C-̂ J
Figure 5: Mass Scan across the 230Th Peak (232Th/230Th) = 2,800,000 [6]. (Left) FirstStage, (Right) Second Stage.
Transmission Stability of the RPQ-II
To demonstrate the stability and the high transmission of the RPQ-II filter lens, aneodymium sample (La Jolla) with known isotope ratios has been measured using theRPQ-FAR and two Faraday cups of the variable multi-collector. From this experimentthe absolute value of the RPQ-II transmission can be deduced. However, becausethe RPQ-FAR is not integrated into the gain calibration network of the variable multi-collector channels, the absolute value of the measured transmission is uncertain byabout ±1%. This is due to the specified individual tolerances of the 1011 Q resistorswhich are used in the current amplifiers. The measured data shown in Figure 6clearly show that the transmission of the RPQ-II is >99% and that the stability is muchbetter than 0.1%/ hour.
1C0.5
^ T 100.4S
o"a 100.35
•g 100,3
C 100^5
2- 100^£ 100.15
S 100.1
E 100.05
100-+•
10 20 30
time (min)50
•43000 I I I I I I 1 I I I I |. I I I I I I I I
Figure 6: Demonstration of the HighTransmission on the RPQ-IFAR Channel.
Figure 7: Stability of the 238U/234U RatioMeasured on the RPQ-II SEM.
- 5 3 - AECL-11342
Stability and Linearity of the RPQ-II SEM
The stability, linearity and accuracy of the calibration of the RPQ-II SEM channel isdemonstrated by a simultaneous acquisition of a NIST U005 standard using the RPQ-SEM (mass 234) and two Faraday cups of the variable multi-collector (mass 235 and238). The RPQ-SEM yield (including transmission and counting efficiency of the SEM)has been calibrated at the beginning of the acquisition by switching a 235U beam ofabout 300,000 cps between a Faraday cup of the multi-collector and the RPQ-SEM.The RPQ-SEM yield was measured to be 98.0 ± 0.2%. According to Poisson's law, acounting efficiency of 98% requires per incoming ion in average a release of 4electrons at the first dynode of the SEM, which is a reasonable number for 10 KeVuranium ions.
The acquisition time of the measurement was 2 hours. The acquired data are shownin Fig. 7 and demonstrate the stability of the RPQ-H SEM channel. The measuredisotope ratio is (238U/234U) = 45806.0 ± 0.1% (2cM). It deviates +0.3% from theaverage value recommended by NIST. The specified uncertainty of this isotope ratiois ±1% which means that these measurements fit very well into the limits specified byNIST. The calibration of the RPQ-SEM yield was performed with a beam intensity of300,000 cps. During analysis the intensity of the 234U beam at the RPQ-SEM wasabout 1,400 cps. Because the measured isotope ratio is in good agreement with thespecified value, these measurements also prove the linearity of the RPQ-SEM channelin the range of 1,400 - 300,000 cps.
Dark Noise Level of the RPQ-II SEM Channel
For the measurement of high abundance isotope ratios the dark noise level of theRPQ-SEM has to be extremely low. Because the analyzer region and the housing ofthe RPQ is completely sealed with gold fittings, the detector can be baked at hightemperatures. We found this to be very important to achieve extremely low dark noiselevels at the RPQ-SEM. After baking the SEM the dark noise level dropped fromabout 3 cpm to about 0.3 cpm. This ultra low dark noise level is a very unique andimportant feature of the SEM used in this instrument.
Discussion
Very high abundance sensitivity, high transmission and high stability ion optics,extremely low dark noise level, high linearity of the detection system and sophisticatedsample preparation techniques to minimize molecular interferences and contaminationsof the sample are mandatory to achieve the ultimate precision and accuracy in TIMSmeasurements of very large isotope ratios. To stress the significance of eachindividual point we will discuss the following experiment: an isotope ratio in the range

- 5 4 - AECL-11342
isotope ratio in the range of 100,000 -1,000,000 has to be measured. The major ionbeam intensity is assumed to be 1 pA and the acquisition time is restricted to 1 h(typical conditions for the measurement of Th). The systematic errors due to thelimited abundance sensitivity Err(ABS), the dark noise counts Err(Dc) and the countingstatistics Err(n) can be calculated by the following equations:
limited abundance sensitivity:dark noise error:counting statistics:
Err(ABS)=ABS x IR x 100%Err(Dc)=Dc/n x IR x 100%Err(n)=(IR/nf x 100%
(IR, isotope ratio; n, # of counts of major ion beam accumulated during the acquisitiontime; Dc, # of dark noise counts acquired during analysis; ABS, abundancesensitivity).
0,8 •
0,6 •
0.4 •
0,2 •
0 •
abundancesensitivity
~- ~~ dark noise
countingstatistics
I
/
•^••f " " i \— 1 1100000 300000 500000 700000
isotope ratio
900000
Figure 8: The limits of accuracy andprecision. (y4BS=1E-9,DC=0.01 cps).
In Fig. 8 the different error contributionsare plotted versus the isotope ratio.The instrumental parameters Dc andABS have been set to the numbersachieved by the RPQ-II {ABS =1E-9uranium ±1 amu, Dc=0.01 cps). Thelinearity and stability of the system isabout 0.2%. It can clearly be seen thatunder these experimental conditions theaccuracy and the precision of themeasurement is only determined bycounting statistics. Even for themeasurement of an isotope ratio in therange of 1,000,000 the contribution ofscattered ions of the major ion beam tothe minor isotope intensity is only 0.1%.This clearly falls below the limit ofcounting statistics. However, assuminga level of abundance sensitivity of onlyABS=1 E-7, the error due to the limitedabundance sensitivity would be in therange of 1-10% which is about 15times the limit of counting statistics.
Additionally a dark noise level of 0.1 cps would result in an error in the range of0.16-1.6%, which is about 1-3 times the limit of counting statistics. In principle, onecould try to correct for these inaccuracies by background correction. However, thiswould imply that the abundance sensitivity and the dark noise level must be measured
- 5 5 - AECL-11342
sensitivity. Also the abundance sensitivity correction relies on a certain theoreticalmodel of the peak shape. For the measurement of very large isotope ratios this is nolonger useful.
With the RPQ-II we are limited by counting statistics. Of course increasing the ioncurrent results in a higher precision of the measurement. With conventional TIMS ionsources and favorable elements the ion current can be increased from about 1 pA toabout 100 pA. This would reduce Err(n) by a factor of 10 and Err(Dc) by a factor of100. In this case Dc/n«ABS and Err(Dc) can be neglected. The limit of precision isdetermined by Err(ABS). However, for the measurement of elements with a largerrelative mass difference between the major and the minor isotope (i.e. Cs, Th) theeffective abundance sensitivity of the RPQ-II can be in the 10'10 range [4]. At thispoint again the counting statistics determine the precision of the measurement.
Summary and Conclusion
We have demonstrated the instrumental improvements on the RPQ-II:
increase of transmission from 50% to >98%improvement of ion optical stability from 0.5%/10 min. to <0.1%/himprovement of ion counting stability and linearity to <0.2%/himprovement of dark noise on the RPQ-SEM from 3 cpm to 0.3 cpm.
The abundance sensitivity is 2 x 10'9 (uranium ± 1 amu). For the measurement oflarge isotope ratios, no abundance sensitivity and dark noise corrections have to bemade. Provided that there are no molecular interferences the ultimate precision andaccuracy of the measurement is only determined by counting statistics. New highcurrent Tl ion sources [7] could push TIMS technology to a higher precision for themeasurement of very large isotope ratios.
References
[1] K.H. Purser, P. Williams, A.E. Litherland, J.D. Stein, H.A. Storms, H.E. Grovesand CM. Stevens, Nucl. Instrum. Meth., 186 (1981) 487.
[2] J.J. Stoffel(s), D.R. Ells, L.A. Bond, P.A. Freedman, B.N. Tattersall, C.R.Lagergren, Int. J. Mass Spectrom. Ion Processes, 132 (1994) 217.
[3] K. Habfast and H.J. Laue, Proceedings of the First Alfred O. Nier Symposium onInorganic Mass Spectrometry, Durango, CO, (1991) 75.

- 5 6 - AECL-11342
[4] Typhoon Lee, Teh-Lung Ku, Hsiao-Ling Lu, Ju-Chin Chen, Geochim. Cosmochim.Acta 57 (1993) 3493.
[5] J.I. Wendt, I. Wendt and D. Tuttas, Chemical Geology, 106 (1993) 67.
[6] D. Tuttas, Finnigan MAT Application News No. 4, (1993).
[7] E.P. Chamberlin, see these Proceedings.

- 5 7 - AECL-11342
Performance Indications for TIMS with a Deceleration Lens System andPost-Deceleration Detector Selection
Peter van Calsteren, David Wright and Simon TurnerDepartment of Earth Sciences, Open University, Milton Keynes, MK7 6AA, UK
Introduction
Solid source mass spectrometry is rapidly becoming the technique of choice in U-Thdisequilibrium studies. In the Earth sciences, research topics include melt generationand extraction processes at ocean ridges and the importance of fluid fluxes in thegeneration of melts in island arc settings. The large ratios between decay constants of238U and 232Th compared with 234U and 230Th, generate extreme isotope ratios whichrequire instruments with high abundance sensitivity. We have used a FinniganMAT262-RPQII instrument, which was designed to improve the abundance sensitivityto 20 ppb.
Instrumentation
Compared with earlier versions of the multi-collector Finnigan MAT262-RPQ, theinstrument used here for high abundance sensitivity measurements has a number ofcritical differences. In the filament power supply a potentiometer circuit has beenincorporated that maintains a constant potential on the filaments. Without this circuitthe potential of the mid-point of the filament would change by ~0.5 V for a filamentcurrent change of 1 A. Such changes are necessary to reduce the ion beam intensityfor yield determinations. The resulting change in ion energy at the deceleration lenswould be sufficient to reduce transmission from ~100% to <10%.
In the flight tube between the ion source and the magnet (see Figure 1), a fieldaperture has been installed that can be set at 3 x 5 mm in addition to the usual 3 x10 mm. Beam intensity reduction is less than proportional to the slit opening becausethe cross sectional ion distribution has a 'Gaussian' component to the ideal 'top hat1
profile. At the 3 x 5 mm aperture setting, the peak shape at the collector has steeperslopes and no sign of the sloping 'peak flat1 that is sometimes observed with the largeaperture (Figure 2). Peak shapes are similar to the peak shape at the multi-collectorFaraday cups despite the shaping, deceleration and deflection of the beam and theshape and location of the detectors, some 300 mm behind the natural focal plane ofthe magnet.

- 5 8 - AECL-11342
Multicollector
Source
7MU0CVisav .
UMUOOV —M00V-*
nooov —
Ztxoi
Figure 1: Schematic diagram of the MAT262-RPQII. The static quadrupoie shapesthe beam, and the funnel and tunnel deceleration lenses reject ions with thewrong direction or the wrong energy. Deflection plates aim the beam ateither of the two collectors.
Figure 2: Traces of five magnet scans for the RPQ-SEM and the RPQ-FAR,normalised to 100%. Both peak shapes are similar to the peak shape atthe multi-collector Faraday cups.

- 5 9 - AECL-11342
Deflection plates are installed to allow the necessary ion beam switching fordetermination of the transmission efficiency of the RPQ and the conversion efficiencyof the secondary electron multiplier (SEM) detector, so that observed ratios may becorrected for these factors. The deceleration lens assembly has been redesignedand gives better transmission at similar abundance sensitivity (Schwieters and Bach,these proceedings). After the RPQ the axial ion beam is transformed from arectangular cross-section to a circuloid cross section using a static quadrupole lens.The circular beam passes through a two stage deceleration assembly consisting offunnel and tunnel lenses and only ions with the inherent thermal ionisation energydistribution pass through the tunnel lens.
Our system is equipped with a pulse counting facility consisting of the standard SEMbut with an ORTEC 9305 pre-amplifier and 9302 amplifier-discriminator, and aHewlett-Packard HP5316B pulse counter. The discrimination level is first set justabove the level of the amplifier noise and at this level the number of intra-dynodalpulses or 'dark noise1 is less than 2 cpm determined repeatedly for more than 15hours. The discrimination level is further adjusted to reduce the occurrence of delayedor 'ghost' pulses to less than one in a thousand.
System Performance
A 187Re+ beam has been used extensively to evaluate system performance indicatorssuch as peak shape when scanned with the magnetic field (see also Figure 2), andpeak top flatness which is better than 2% for mass deviations of 0.1% on either side ofthe peak centre. Beam intensity variation as a function of SEM potential has beendetermined and a potential of 2000 V has been selected which ensures minimaldependence of gain on voltage. Detector intensity profiles when scanning thepotentials of the deflection plates have been determined, and values in the middle ofthe plateau have been selected.
The SEM conversion efficiency is measured by switching an ion beam of -200,000 cpsrepeatedly between the RPQ-FAR and the RPQ-SEM, and the resultant efficienciesare between 93 and 97%. The error on the conversion is down to <0.4% in a fewminutes and the long term stability is - 1 % , and is mainly determined by the error on thebaseline of this Faraday collector which has its amplifier mounted outside the vacuumsystem and without a thermostat. The error on the baseline is a few times higher thanon a multi-collector Faraday cup (MC-FAR), and is a relatively large proportion of asmall (0.02 pA) ion beam. The RPQ transmission is measured by switching an ionbeam of >1 pA between a multi-collector Faraday and the RPQ Faraday. The error onthe transmission is down to <0.1% in a few minutes and the long term stability is ca0.1%. Multiplying the SEM conversion by the RPQ transmission gives the total yieldand the error is dominated by the error on the conversion. There are two other ways

- 6 0 - AECL-11342
to measure the total yield. An ion beam of -200,000 cps can be switched between aMC-FAR and the RPQ-SEM and this method has been used for 23OTh/232Thmeasurements where only one 'stable1 isotope is available. With this method the errorin the yield is down to ~0.2% in a few minutes and the long term stability is <1%.Increasing the ion beam to 400,000 cps results in a better error on the yield but ittakes the SEM many hours to recover to dark noise of <2 cpm. The other methoduses a fixed isotope ratio such as between 235U and 238U. The high abundanceisotope is centred on a MC-FAR and the other isotope on the RPQ-SEM and data arecollected simultaneously. The errors are down to <0.2% in a few minutes andvariations over some hours are <0.5%. This method has a superior stability over thecourse of an analysis and is used for all 234U/238U measurements.
The design aim of the RPQ was to improve abundance sensitivity to ~20 ppb, which isrequired for the determination of 23OTh/232Th ratios in silicates. For present purposes,abundance sensitivity is defined as the relative count rate one mass unit below themajor isotope such as 237/238U or 231/232Th. Abundance sensitivity depends on anumber of factors including the thermal energy distribution of the major isotope in thesource of the mass spectrometer, collisions with neutrals near the filament (e.g.neutrals of the major isotope, the carbon compounds of the loading medium and Refrom the filament) and with residual gas atoms in the flight tube. Apart from thethermal energy distribution, all other factors lead to a reduction in ion energy and,consequently, the abundance sensitivity tail is more pronounced at the low mass sideof a major isotope and less pronounced at lower mass numbers. Abundancesensitivity is determined in static mode with 23BU centred in FAR-IV and the RPQ-SEMat 237 using the NBS 0002 standard with a certified 238U/235U ratio of 5697. Typically,with a 1.4 pA 238U beam and 97% yield, the count rate at 237 is 0.24 cps, with0.03 cps dark noise. This corresponds to an abundance sensitivity of 24 ± 3 ppb.
A magnetic scan between masses 228 and 232 for a Th standard with23oTh/232Th = 6 x 10⁻⁶ j s j | | u s t r a t e d i n Figure 3a and b for the RPQ- and MC-SEM,respectively. The small peaks on the baseline represent individual counts and thehighest point on the 230Th peak represents 45 cps. It is clear that the RPQ greatlyreduces both the general background and the background at 237, even taking intoconsideration that on this scan the apparent abundance sensitivity is high because themajor 232Th isotope is not totally collected in the Faraday cup. At two mass units awayfrom the major isotope the contribution to the minor isotope from the abundancesensitivity is probably less than 10 ppb. When using the NIST 3159 Th concentrationstandard with 23OTh/232Th = 0.34 x 10"6, a major isotope intensity of 1 pA results in acount rate of 2 cps for 230Th and there will be a contribution of ~10% from theabundance and ~1.5% from dark noise.
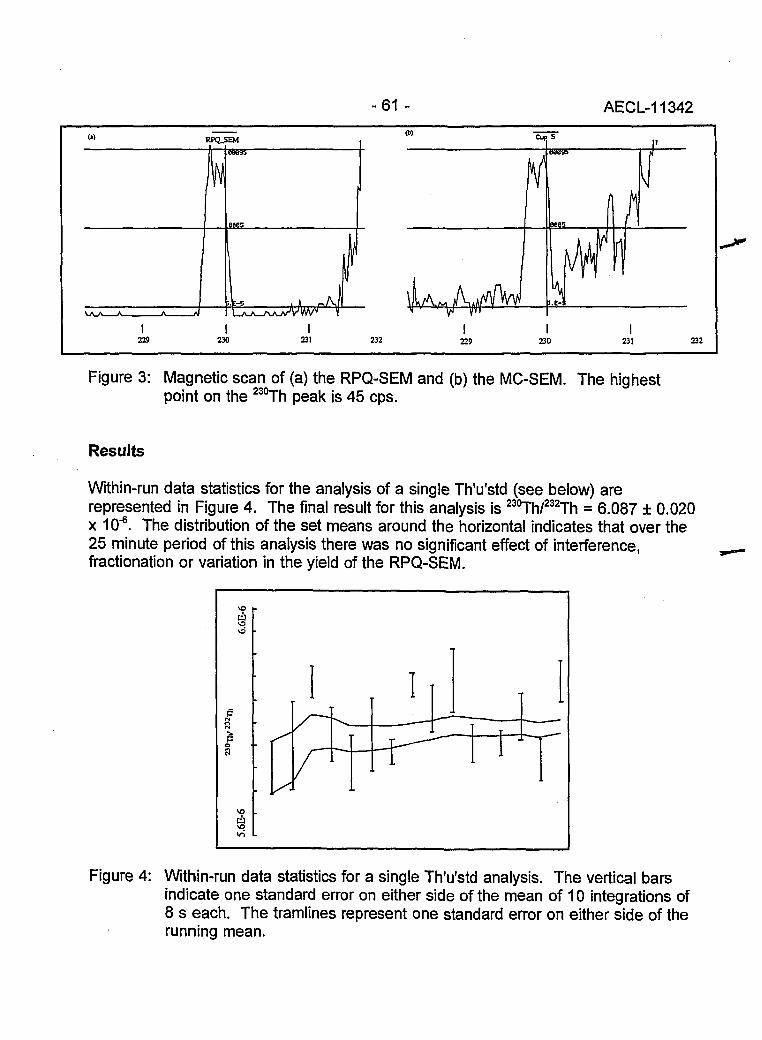
-61 - AECL-11342
232 229
Figure 3: Magnetic scan of (a) the RPQ-SEM and (b) the MC-SEM. The highestpoint on the 230Th peak is 45 cps.
Results
Within-run data statistics for the analysis of a single Th'u'std (see below) arerepresented in Figure 4. The final result for this analysis is 23OTh/232Th = 6.087 ± 0.020x 10"6. The distribution of the set means around the horizontal indicates that over the25 minute period of this analysis there was no significant effect of interference,fractionation or variation in the yield of the RPQ-SEM.
Figure 4: Within-run data statistics for a single Th'u'std analysis. The vertical barsindicate one standard error on either side of the mean of 10 integrations of8 s each. The tramlines represent one standard error on either side of therunning mean.

- 6 2 - AECL-11342
We have analysed a number of standards over a 6 month period after the initialcommissioning of the Finnigan MAT262-RPQII instrument. We used NBS U0002 withcertified 238U/235U = 5697 and 234U/238U = 1.6 x 10s, and with no isotopes at masses237 and 236 [1]. For thorium there are no certified standards available and we haveprepared our own standard by mixing appropriate amounts of NIST 3159 and a 230Thspike to achieve a 23oTh/232Th ratio of 6 x 10"6, similar to the ratio expected in mostsilicates. This standard is called Th'u'std. Data for the analyses of these standardsare represented in Figure 5. For the U0002 standard (Figure 5a), the RPQ-SEM yieldwas measured by centering 235U on the RPQ-SEM and 238U on FAR-III and measuringthe ratio in static mode relative to the recommended value. The precision with theRPQ-SEM relative to the certified value is greatly improved.
(a)
33a
1.68'
1.66"
1.64"
1.62'
1.60
NBSU0002 A
= i,629 ±0.012
(c) 0A2- NIST 3159 J
3
; t230T h /232Th = 0.344+0.030 xlO-(!
(b)
f
6.4
6 3 '
5.9
Th'u'std «<>Th/232Th =6.131+0.084 x 10"« 3
S 038K
PR 034
I-N 0
026
Figure 5: Data for three solution standards. Thevertical lines represent one standard error oneither side of the analysis mean, thetramlines represent the overall mean withone standard deviation. 21 separateanalyses of (a) NBS U0002, and (b) of ourTh'u'std standard made over a six monthperiod, (c) Data for 7 separate analyses ofNIST 3159 made over a three month period.
20
For the Th'u'std standard (Figure 5b), the RPQ-SEM conversion was measured for thefirst eight analyses by centering a 200,000 cps 187Re beam on the RPQ-SEM and onthe RPQ-FAR, and measuring the SEM conversion by switching the voltage in thedeflection unit. Subsequently, the 187Re beam intensity was increased to 1 pA byincreasing the ionisation filament current and transmission was measured betweenFAR-V and the RPQ-FAR, by switching the deflection voltage at the multi-collector.The yield was obtained by multiplying the conversion and the transmission. Afteranalysis 8, the RPQ-SEM yield was measured by centering a 200,000 cps 232Th beamon the RPQ-SEM and on FAR-V and measuring the ratio by switching the deflectionvoltage at the multi-collector. The results for Th'u'std obtained with either method ofyield calibration appear indistinguishable. The average is 23OTh/232Th = 6.131 ± 0.084 x10"6. The relative error in the Th'u'std measurement is higher than the relative error inthe NBS U0002 measurement despite more favourable counting statistics, and this ismost probably attributable to the different method of yield calibration.

- 6 3 - AECL-11342
Data for 7 separate analyses of NIST 3159 are presented in Figure 5c. Because of itsextremely low 23OTh/232Th ratio, this certified concentration standard could become auseful isotope ratio standard with a 23OTh/232Th ratio similar to young volcanic rocksthat have undergone extreme Th and U fractionation. The RPQ-SEM yield wasmeasured in the same way as the last 13 measurements of Th'u'std. The average is23OTh/232/Th = 0.344 ± 0.030 x 10"6.
Conclusions
Isotope ratios of 1 in 1,000,000 at two and four mass units difference in Th and Ustandards can be measured at 1% precision with the high abundance sensitivity andhigh transmission achieved by the Finnigan MAT262-RPQII. Data on island arc lavasindicate a similar performance and these results are of great importance in petrogenicstudies.
Acknowledgements
Thanks to Janet Dryden and Chris Hawkesworth for help with the preparation of thismanuscript.
Reference
[1] Garner, E.L., Machlan, L.A. and Shields, W.R. Uranium Isotope StandardReference Materials. N.B.S. Spec. Pub. 260-27, 1-150 (1971).

- 6 4 - AECL-11342
Evaluation of a L.A.N.L. Designed Turret
v - •••'/
J. Banar, R.D. Aguilar, P.R. Dixon, R.E. Perrin, D.J. RokopLos Alamos National Laboratory, Box 1663, Los Alamos, NM 87545
Introduction
In 1985, the decision was made to design and build a turret-type rotary sample holderfor the thermal ionization mass spectrometers used by CST-8 at Los Alamos NationalLaboratory. The sample holder (turret) was to be developed as a research anddevelopment tool with a secondary goal of increased sample Inroughput. Two of themajor considerations in the design of the turret were the ioni^ation processes and theion beam focusing. The design philosophy dictated that the sample holder shouldcause no compromise or degradation of the current capability and that it would becompatible with the existing equipment. After 2 years, a prototype was produced andinstalled for testing on a single-sector NBS 12"-90° spectrometer doing actinideanalysis by pulse counting. The prototype was tested for three years, and during thattime the data generated were compared to historical standards data generated by thesame instrument, using the original configuration, to spot any trends.
Background
The mass spectrometric section, CST-7, in the Chemical Science and TechnologyDivision of Los Alamos National Laboratory is primarily concerned with ultra-traceisotopic analysis on complex matrices using thermal ionization mass spectrometry.Precision and accuracy of measurements approaching ±0.10%, are achieved routinely.Analyte concentrations down to 10'12 atoms per gram are not uncommon. Theanalyses are done on National Bureau of Standards designed NBS 12"-90° thermalionization mass spectrometers (TIMS) using either a single or double magnetic sector.These instruments use a Nier thin-lens focusing source and a pulse counting detectionsystem. The bulk of the analyses are done using a single-filament platinumco-plate/overplate sample mounting technique. All of the sample separationschemistry, sample plating, and analyses are done in class 100+ clean rooms.
Using the standard configured NBS 12"-90° instrument, samples can only beintroduced into the source region one at a time. This requires that the source regionbe vented to atmosphere for every sample. A consequence of this is increased ionbeam instability as the water vapor content increases in the source ionizationchamber. Another consequence is the increased possibility of introduction of foreignmaterial which would influence the ionization process. The turret design promised theability to minimize and control these problems.

- 6 5 - AECL-11342
Turret Design
The most important consideration in designing the turret was that it not compromise ordegrade the current analytical capability. This dictated a number of the designdecisions. The materials used in the turret modification were to be the same as thoseused in the standard source configuration. This greatly reduced the possibility ofintroducing unknown effects, in the form of outgasing or reaction surfaces, into thesource region. Using the same materials also meant that the existing cleaning ordecontamination procedures did not change.
The 5-filament rotary design was chosen based on the fact that it was small enoughthat it could be inserted into the source region without a major source or vacuumenvelope modification. The rotary design was also the simplest to adapt to theexisting equipment. Additionally, the smaller size could be handled comfortably byoperators. Five analyses were considered to be the maximum for an operator toperform sequentially.
Compatibility with the existing equipment and the ability to interchange between theturret and the standard source with a minimum of effort was considered paramount.This capability gave us the flexibility to switch between the two configurations to easilyaccommodate any analytical or mechanical situation which might arise.
Testing
Normal protocol for analysis of unknown samples requires that known standards beanalyzed before, during and after a sample series. Until 1991, the standards usedwere the National Bureau of Standards (now NIST) certified uranium series. The initialtesting of the turret was done exclusively with the NBS standards during this period.The first test done was a systems calibration, which consisted of analyzing a set ofNBS standards with ratios ranging from 1000:1 to 1:1000 with approximately 18analyses being performed in a random order.
The performance of the turret was recorded along with the ratio value. All parameterswere then compared against historical performance values from the instrument or withthe certified standards values, lonization / transmission efficiency, fractionation, peakshapes, abundance sensitivity, signal intensity, memory, and reproducibility fromfilament to filament were among the parameters compared.
When initial comparison revealed no immediate observable deviations from standardconfiguration parameters, the turret was put into operation for sample analyses. Anaverage of 2 to 4 standards were run per week concurrently with samples. During thesecond year of testing a second turret was installed on a second single-stage NBS12-90. Testing of the second turret was similar to the first. During 1991 a set ofinternally normalized standards was obtained from the Institute for Reference Materialsand Measurements (formerly C.B.N.M). Since that time, the IRMM standards are usedalmost exclusively in CST-8.

- 6 6 - AECL-11342
Results
The evaluation of the results was broken into three critical areas; analyticalperformance, mechanical performance, and cost. A direct comparison betweenstandard configuration and turret configuration was done using the standardconfiguration performance as a baseline.
Analytical Performance
Rhenium
Peak shapeAbundance sensitivity185/187 ratioSignal intensity @ 2100°C (mass 187)
Turret Configuration
Identical to standard10% improvement0.02% (internal precision)2.6 - 3.0 Volts (standard)12.0-15.0 Volts (turret)
Uranium
lonization/Transmission efficiencyAbsolute fractionation (per mass)Temporal fractionation (at 60 min)Reproducibility (filament to filament)MemoryRuns per day
Standard
0.30%0.1810%>0.26%0.035%<1 in 106
4
Turret
0.30%0.2755%>0.04%0.017%
<1 in 106
7
Plutonium
lonization/Transmission efficiencyAbsolute fractionation (per mass)Temporal fractionation (at 60 min)Reproducibility (filament to filament)MemoryRuns per day
Standard
0.34%0.266%>0.07%0.037%
< 1 in 106
4
Turret
0.34%0.531%>0.04%0.035%
< 1 in 106
7
Mechanical Performance
The mechanical performance comparison examined sample throughput andmechanical operation. Sample throughput was based on five-sample series ofanalyses. Mechanical operations were limited to any operation which would affect theanalytical performance. The most important consideration was the effect of vacuumexposures to atmosphere. Compatibility to change between the two configurationswas also considered to see if any capability was lost.

- 6 7 - AECL-11342
Filament/Sample Analysis Cycle:
Procedures for Sample Analysis
1. Introduction & pump down2. Heating & stabilization3. Baseline reading & data collection4. Cooling & removal
Standard
30303030
Turret
45303045
Filament/Sample Cycle Sequence:
The overlap of steps for the turret indicate simultaneously performed operations.
Cost
Based on total costs
Standard configuration
Turret configuration
Analysis Sequence
sample #1
sample #1sample #2sample #3sample #4sample #5
1>2>3>4
1>2>32>3
2>32>3
2>3>4
Mechanical Operation:
5-Sample Series
Cycle time (total)Throughput per weekVenting (atmosphere)Operating vacuumCompatibility
Standard
10 hours20 samples6 per cycle2x10"7torr
Turret
4.5 hours35 samples2 per cycle5x10"8torr
4 hour to std
Cost, newManufacturing timeInstallation time
Standard
$350,0002 man years30 - 60 days
Turret
$30,0000.25 man years
10 days

- 6 8 - AECL-11342
Conclusions
A comparison between the standard configuration and the turret configuration massspectrometer was done to examine any impact on current analytical capability. Thecomparison was based on the three most critical areas of concern, analyticalperformance, mechanical performance, and cost. The basic criteria for all three areaswas that no loss of current analytical capability occur.
The analytical performance tests indicate no apparent loss of capability and indicatesome advantages. An increase in signal intensity, a lowering of fractionation and betterfilament-to-filament precision are improvements and enhance current capability.
Mechanically the turret has two distinct advantages: (1) lower operating vacuum,consequently less scatter, and (2) an increase in sample throughput. The ability toquickly and easily change between the two configurations is also a distinct advantage.
The total cost of manufacturing and installing the turret modification is favorable whencompared to the cost of a mass spectrometer.
Overall the turret modified configuration is considered to have been successful. Since1991 four of the single sector spectrometers in CST-8 have had turrets installed. Datafrom these turrets have supported the initial testing data and have not revealed anyproblems or trends.
- 6 9 - AECL-11342
INDUCTIVELY COUPLED PLASMA AND GLOWDISCHARGE MASS SPECTROMETRY

- 7 0 - AECL-11342
High Accuracy Determination of Trace Elements in NIST Standard ReferenceMaterials by Isotope Dilution ICP-MS
Paul J. Paulsen and Ellyn S. BearyInorganic Analytical Research DivisionChemical Science and Technology LaboratoryNational Institute of Standards and Technology, Gaithersburg, MD, 20899
Introduction
Isotope dilution mass spectrometry (IDMS) has been used for the certification of StandardReference Materials (SRMs) at the National Institute of Standards and Technology (NIST)for more than 25 years. Since 1986, ICP-MS isotope dilution has had a dominant rolein the certification process. The new generation of ICP mass spectrometers is capableof ratio measurement precisions of about 0.1% rsd.
Optimization of Ratio Measurements
Accuracy in ICP-MS ID equal to the precision of ratio measurement requires attentionto the ion multiplier setup, calibration and use; mass bias drift correction; minimizationof memory from previous samples; and most critically, the removal of interferencescaused by molecular ions.
A generic plot for a continuous dynode multiplier in the ion count mode indicates aconstant gain versus input signal to 10s cps, but shows progressive loss in gain byinput signals of 106 and higher. Even in the pulse counting mode, when the gaindrops, counts will be lost due to the change in efficiency of the detector. In addition,counts are lost to detector deadtime (ion count overlap). Historically, we have usedthe Nd 144/145 ratio (approximately 3/1) over a range of count rates (concentrations)to assess the linearity of corrected data. Figure 1 shows the degree of match when 1,7 and 20 ns deadtimes are used. We select the deadtime that gives the mostconstant ratio across the count range. The maximum count rate is kept below 3 x10⁵ cps for the most accurate ID ratio measurements.

-71 - AECL-11342
144/145 Nd Ratio
Figure 1: 144/145 ratio vs count rate.
Drift in the instrument mass bias occurs during instrument "warm up" and throughoutthe day. Low mass elements are affected more than high mass elements. In therecent certification of Mg in Estuarine Sediment, for example, the mass bias correctionfor Mg 24/26 drifted from 1.0830 to 1.0923 in sixty minutes (0.85%).
Mass bias correction requires a dynamic measurement system with the "isotopiccontrol samples" run at specific time intervals. This imposes a requirement that thememory from a previous sample be washed down 1000 fold within 3 to 4 minutes.Certain elements have notoriously long washout times under routine instrumentalconditions due to adsorption/absorption to plastic, glass or other hardware, in additionto element volatility in the spray chamber. Figure 2 shows a washout study for boronusing a combination of solvents. The mannitol/NH4OH mixture minimizes the boronmemory, which is predominantly due to volatility.
Figure 2: Washout time for boron using HNO3, HCI, NH4OH with or without Mannitol.
- 7 2 - AECL-11342
Using a "natural" isotopic standard as a control to correct "spiked" samples for massbias, drift suffers from a second type of memory problem which applies to allelements. A "spiked" sample has an isotope ratio significantly different from "natural".For example, for indium determinations, a "natural" indium control would have 3 x10⁵ cps for 115ln, and 1.5 x 10⁴ cps for l13ln, while a properly spiked sample wouldhave 3 x 10s cps for both isotopes. The problem arises when measuring a naturalcontrol following a spiked sample where a 0.1% memory at 113ln would be 15 cps.This represents a memory washdown of 20,000 fold from the spiked sample. Ideally,the isotopic control sample should have the same ratio as the spiked samples. Forconvenience, we use a spike calibration solution as the analysis control. The value forthe control is determined by measuring a natural isotope ratio standard several times(to establish mass bias drift), followed by the isotopic control. This establishes theratio of the working standard used to correct for the mass bias drift for the remainingspike calibrations, samples and blanks.
Molecular ion interferences are potential problems for all elements except highconcentration elements and elements at low (Li, B, and Mg) and high mass (Hg, Tl,Pb, Th, and U). Natural materials, such as the current SRMs produced at NIST, aremost susceptible to these problems. Interferences exist if an element in an unspikedsample shows a different isotopic ratio than a reference solution containing only thatelement. The necessary chemical separations schemes for removing interferencescan be rapidly tested with a full element semiquantitative scan on the ICP-MS.ICP-MS has the advantage that only the source of interference needs to be removed.Therefore, separations are flexible and can be specially designed based on the matrixcomposition and the elements of interest. It is not necessary to isolate the analyte asrequired for thermal ionization mass spectrometry.
Analyses by ICP-MS ID
ICP-MS ID has been used in the certification of NIST SRMs for eight years. Asummary of materials analyzed and elements determined are shown in Table 1. Ofthese analyses more than half required chemical separations.
Tablet ICP-MS ID SRM Certifications
Elements
Matrix Types
ElementCertifications
B, Mg, Ti, Cr, Fe.Ni, Cu, Rb, Sr, Mn* Mo, Rh*. Pd, Ag, Cd, Sn, Ba, Nd, Pt,Hg, Pb, Tl, Th, U
Alloys, Autocatalysts, Blood, Cokes, Filters, Flours, Fly Ash, Glass, Leaves,Oils, Ores, Paint, Sediment, Serum, Soils, Tissues, Water
Material X Element
24
32
125
Mononuclidic, internal standard quantification

- 7 3 - AECL-11342
One example of an SRM certification requiring no chemical separations is boron, asinterferences are unlikely for low mass elements. Boron was determined in a numberof NIST leaf SRMs (Apple, Spinach, Tomato and Peach Leaves). Table 2 lists theresults from a recent certification of boron in SRM 1547, Peach Leaves. Because ofthe potential volatility problem during sample preparation, dissolution wasaccomplished in tall Teflon containers and harsh evaporations were avoided. The0.8% rsd is typical, and reflects the heterogeneity of boron in the leaf materialsanalyzed to date. Natural samples often display different levels of homogeneity fordifferent elements.
Table 2: Concentration of Boron in Peach Leaves, SRM 1547 ((jg/g)
29.46 29.31 29.19 29.64 29.79 29.31
Grand Avg. 29.45 |jg/g; 0.8% rsd
Chemical separations were required for the analysis of SRM 2711, Montana II Soil. Asemiquantitative analysis of this complex material confirmed the absence of only fourelements. All of the elements determined by ICP-MS suffered from molecular ioninterferences. Most, but not all, molecular ion interferences involve oxides generatedfrom lower mass elements at higher concentrations than the analyte. The Ag wasseparated from its interference, ZrO+, by electrodeposition of Ag from a dilute acidsolution. The Ni had interferences from oxides of both Ca and Ti. Potassium, Ca andAr oxides fall in the Mo mass region, and the double oxides, as well as Mo oxide,interfere with Cd. A two stage chromatographic separation was used to remove theseinterferences. Chelation chromatography efficiently separates the alkali/alkaline earthelements from the transition metals. In this scheme, Mo was eluted with diluteNH4OH, and the transition metals (including Ni and Cd) were stripped with diluteHNO3. Anion exchange chromatography was used remove the Ti and to separate theNi and Cd. All separated elements gave their true natural ratio indicating that allinterferences had been removed. The Ni, Cd, Mo, and Ag concentrations asdetermined by ICP-MS isotope dilution with chemical separations are shown in Table3. The certified values are based on a statistical combination of results from severaltechniques, according to NIST policy.
Table 3: ICP-MS ID and Certified Values for Ni, Cd, Mo, Ag in SRM 2711, soil
ICPMS
Certified
Ni
20.33 ± 0.06
20.6 ±1.1
Cd
41.74 ±
41.70 +
0.10
0.25
Mo
1.596 + 0.025
(1.6)
4.683
4.63
Ag
± 0.075
+ 0.39

- 7 4 - AECL-11342
Conclusions
ICP-MS ID has certified a wide range of elements in a variety of materials with highaccuracy and precision. Both the chemical preparation and instrumental proceduresare simplified over other ID mass spectrometric techniques. The ICP-MS haspicogram/mL detection limits for most elements using fixed operating parameters.Chemical separations are required only to remove an interference or to preconcentratethe analyte. Since both aspects of the analysis are not as restrained as traditionalmass spectrometry, their flexible integratior. results in high precision and accuracy,simplified chemical procedures, and lower blanks.
References
[1] J.D. Fassett and P.J. Paulsen, Anal. Chem. 61, 643A (1989).
[2] E.S. Beary and P.J. Paulsen, Anal. Chem. 65, 1602 (1993).
[3] Galileo Electro-optics Corp., Channeltron Electron Multiplier Handbook for MassSpectrometry Applications, Sturbridge, MA 01566.

- 7 5 - AECL-11342
/ • ' /
Multi-element Isotope Dilution Analyses Using ICP-MS
A.M. VolpeL-231, Lawrence Livermore National Lab, Livermore, CA 94550
Introduction
Since separated isotopes became commercially available nearly fifty years ago,isotope dilution (ID) mass spectroscopy has provided definitive chemical concentrationanalyses [1-3]. Compared with other standardization methods, ID achieves highanalytical sensitivity, precision and accuracy. It is a critical methodology for researchin biochemistry, nuclear physics and geochemistry. Traditionally, thermal ionizationmass spectroscopy dominated inorganic ID analysis. The emergence of plasmasource, quadrupole mass spectroscopy, ICP-MS, expands the application of isotopedilution methodology [4-6]. Versatile sample introduction, uniform degrees ofionization, and good precision isotope ratio data are key ICP-MS attributes.
Presently, thirty seven elements ranging from light elements (Li, B) through transitionmetals, noble, rare (REE) and heavy elements, to actinide and transuranic (Pu, Am,Cm) elements are measured by isotope dilution at LLNL. Projects range from geologicand hydrologic to biologic. The research goal is to measure accurately manyelements present in diverse matrices at low abundance (<ppb) using isotope dilutionmethods instead of ion intensity calibration and aqueous dilution. This paperdiscusses technical issues and benefits associated with multi-element ID-ICP massspectroscopic measurements.
Caveat
The success of multi-element isotope dilution ICP-MS depends on using massspectrometric techniques that require more instrument set-up and calibration thanroutine ion intensity calibration. Important parameters include detector linearity anddeadtime, mass resolution, mass bias, background, and data acquisition strategy.Thorough review is described elsewhere [7]. Also, available and affordable separatedisotopes are essential and can be the major drawback. Often ID-ICP-MS is used tomeasure very low element abundances (<ppb) in complex matrices such as salineocean water. In this instance, both separation chemistry and cleanroom facilities arenecessary. Clearly, isotope dilution will not supplant other ICP-MS standardizationmethods, nor should it. ID-ICP-MS fills an important niche in inorganic massspectrometry linking high precision mass spectrometry and bulk elemental analyses.

- 7 6 - AECL-11342
Advantages and Concerns
Major advantages of ID methods are accuracy, elimination of ion intensity calibrationinaccuracy due to matrix effects and drift, and quantitation for samples that requirechemical processing. Chemical pre-concentration removes interfering matrices andimproves method detection levels. Isotope dilution reduces the need to quantifychemical yield. Accuracy of ID-ICP-MS methods depends on tracer isotopecalibration, tracer-sample isotopic equilibration, and appropriate background, isobaric,and mass bias corrections. Propagation of isotope ratio error due to improper tracerisotope addition is a major concern with multi-element analyses when abundancesvary widely. Optimization of the amount of tracer isotope requires estimating elementabundance in the sample.
Mass Bias
Isotope ratios measured with ICP-MS deviate from absolute values. Mass bias varieswith instrument type, operating conditions and element analyzed. In general, heavierisotopes are preferentially transmitted to the analyzer. Mass bias is due to plasma gasdynamics and sampling interface space charge effects [8]. Unlike thermal ionizationmass fractionation, ICP-MS mass bias is time independent, provided gas dynamicsand electronic settings are stable, and similar to precision of replicate measurements(<1-2 %/amu). Yet, for multi-element ID-ICP-MS, mass bias uncertainty can be asignificant source of inaccuracy [9]. Figure 1 shows mass bias for solutions withknown isotope abundance that were measured with the ICP-MS optimized for indium.Mass bias for multi-elements varies about 6% from preferential light isotope (i.e., Cu)to heavy isotope (Rb) bias.
Mass bias correction is possible during ICP-MS measurements using external orinternal normalization. Mass bias can be determined using standards with knownisotope abundance, such as NIST SRM's including the uranium isotopic standards. Anexample of routine mass bias determination and correction for U isotopes is shown inFigure 2. Here, mass bias during the analysis period is measured repeatedly usingNIST U-500 standard. Mass bias corrected ratios for another standard, NIST U-005validate accuracy of the approach (Figure 2).
Other correction methods include 1) internal normalization using two isotopes forelements having three or more stable isotopes (i.e., Zn, Ba), 2) internal normalizationusing double spiking techniques, and 3) internal normalization using a surrogateelement with similar mass (i.e., Ga for Zn, and Tl for Pb). The latter correction can bemisleading for quadrupole ICP-MS given mass bias results shown in Figure 1.

- 7 7 - AECL-11342
0.03
< 0.02 •
£ 0.01 •
I 0.00
T! -°-0 1
OT -0.03o
-0.04
Cr f
Eu Re
T
i B Ni
#Go
Ag
•Cen
• NdQ..
D
*
Er
i
- • -
11
U
Pb
I Sr
• Rb
Gd
50 100 150 200
Atomic Weight
250
Figure 1: Mass bias for solutions with known isotope abundance; • , NIST SRM;D, ORNL isotopes.
COtoCM
<N
0.00540
0.00530
0.00520
0.00510
0.00500
0.00490
0.00480
0.00470
0.00460
0.00450
T
. - I ,„ T(.. ^! . i
J J A
I
r-Jfll1 *'i i * •*•
.. .
S 0rfonth •
Certified Value+ / - 2%^
• V I
Error «
i'.j.IV
9 95% CL
N D J F M A
- 1993/1994M
Figure 2: Yearly data for NIST uranium isotope standard, U-005. Data are correctedfor mass bias using NIST U-500 measurements.
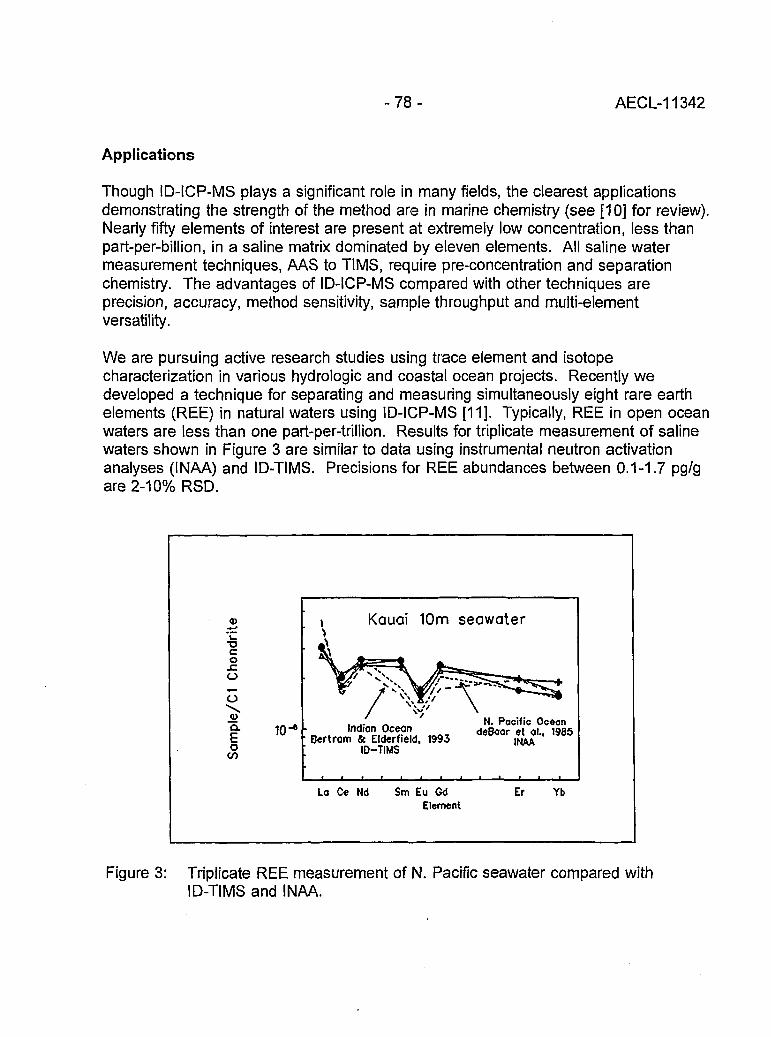
- 7 8 - AECL-11342
Applications
Though ID-ICP-MS plays a significant role in many fields, the clearest applicationsdemonstrating the strength of the method are in marine chemistry (see [10] for review).Nearly fifty elements of interest are present at extremely low concentration, less thanpart-per-billion, in a saline matrix dominated by eleven elements. All saline watermeasurement techniques, AAS to TIMS, require pre-concentration and separationchemistry. The advantages of ID-ICP-MS compared with other techniques areprecision, accuracy, method sensitivity, sample throughput and multi-elementversatility.
We are pursuing active research studies using trace element and isotopecharacterization in various hydrologic and coastal ocean projects. Recently wedeveloped a technique for separating and measuring simultaneously eight rare earthelements (REE) in natural waters using ID-ICP-MS [11]. Typically, REE in open oceanwaters are less than one part-per-trillion. Results for triplicate measurement of salinewaters shown in Figure 3 are similar to data using instrumental neutron activationanalyses (INAA) and ID-TIMS. Precisions for REE abundances between 0.1-1.7 pg/gare 2-10% RSD.
©
T3Cox:oo
~§ 10"*Eo
CO
i Kauai 10m seawater
. .. ,. N. Pacific OceonIndian oceon deBaar et ai.. 1935
Bertram & Elderfield. 1993 {&£ '; ID-TIMS
La Ce Nd Sm Eu Gd Er YbElement
Figure 3: Triplicate REE measurement of N. Pacific seawater compared withID-TIMS and INAA.

- 7 9 - AECL-11342
References
[1] M.G. Ingrahm, Ann. Rev. Nuclear Sci. 4, 81 (1954).
[2] K.G. Heumann, in Inorganic Mass Spectrometry, edited by F. Adams, R.Giijbels and R. Van Grieken, Chemical Analysis Series, 95, 301 (1988).
[3] J.D. Fassett and P.J. Paulsen, Anal. Chem., 61, 643A (1989).
[4] D. Beauchemin, J.W. McLaren, A.P. Mykytiuk and S.S. Berman, Anal. Chem.59,778(1987).
[5] J.R. Garbarino and H.E. Taylor, Anal Chem., 59, 1568 (1987).
[6] A.A. Van Heuzen, T. Hockstra and B. Van Wingerden, J. Anal. At. Spectrom., 4,483 (1989).
[7] G.P. Russ, in Applications of Inductively Coupled Plasma Mass Spectrometry,edited by A.R. Date and A.L. Gray, 90 (1989).
[8] G.R. Gillson et al., Anal. Chem., 60, 1472 (1988).
[9] H.P. Longerich, At. Spectrosc, 10, 112 (1989).
[10] J.W. McLaren et al., Fresenius Z. Anal. Chem, 337, 721 (1990).
[11] B. K. Esser, A.M. Volpe, J.M. Kenneally and D.K. Smith, Anal. Chem., 66, 1736(1994).

- 8 0 - AECL-11342
ICP Magnetic Sector Multiple Collector Mass Spectrometry and the PreciseMeasurement of Isotopic Compositions using Nebulization of Solutions and
Laser Ablation of Solids
A.N. Halliday, D.-C. Lee, J.N. Chrjstensen, W. Yi, CM. Hall, C.E. Jones andDAH. Teagle -/•>"•/6 ^ (-;i^Department of Geological Sciences, University of Michigan, Ann Arbor, Ml 48109,U.S.A.
/V' A.J. WalderFisons Elemental, Winsford, Cheshire, U.K.
,.]•; P.A. FreedmanFisons Instruments, VG Isotech, Middlewich, Cheshire, U.K.
Introduction
Inductively-coupled plasma (ICP) sources offer considerable advantages over thermalsources because the high ionization efficiency facilitates relatively high sensitivitymeasurements for elements such as Hf or Sn, which can be difficult to measure athigh precision with thermal ionization mass spectrometry (TIMS). The massdiscrimination (bias) is larger than for thermal ionization (typically about a percent pera.m.u. for Pb), favors the heavier ions and decreases in magnitude with increasingmass. However, in contrast to TIMS, this discrimination is largely independent of thechemical or physical properties of the element or the duration of the analysis. Thishas been demonstrated to high precision with a double focusing multiple collectormagnetic sector mass spectrometer with an ICP source. This instrument is describedbelow, together with its potential for high precision isotopic measurements of a verybroad range of elements using solution aspiration or laser ablation.
ICP Mass Spectrometry
Plasma source mass spectrometry has seen a bigger increase in utilization andtechnique development over the past few years than any other area of massspectrometry [1-4]. Most inductively-coupled plasma mass spectrometry (ICPMS)developments have utilized quadrupole mass spectrometers. In general, ICPMS hasbeen used to obtain semi-quantitative to quantitative concentration data, particularly forthose trace elements that are difficult to determine by other methods. Relatively littleuse has been made of ICPMS to obtain isotopic compositions, because it is difficult toacquire high precision isotopic data with the peak shapes generally encountered withquadrupole instruments [5]. Indeed, most isotopic work that has been performed byquadrupole ICPMS [6,8] can be performed to superior precision using magnetic sectorthermal ionization mass spectrometry (TIMS).

- 8 1 - AECL-11342
ICP Magnetic Sector Multiple Collector Mass Spectrometry
The ICP magnetic sector multiple collector mass spectrometer (Fisons Plasma 54) is ahigh precision double focusing instrument with extended geometry in which theinstability of the plasma is circumvented by using simultaneous static multiplecollection [9]. The plasma source utilizes Ar as the support gas, in a similar manner tothat commonly deployed in conventional quadrupole ICPMS. The ions are extractedat high voltage and a quadrupole d.c. lens is used to focus the ion beam profile ontothe analyzer entrance slit. An electrostatic analyzer is used to match the energydispersion of the piasma source with that of the magnetic sector analyzer. Theinstrument has a mass resolution of > 400. The magnet provides double dispersionwith effective 54 cm extended geometry and z focusing. The exit pole face isadjustable to rotate the exiting ion beams and produce an ion image perpendicular tothe optic axis. The collector assembly can provide flat topped peaks for thesimultaneous detection of up to nine masses using eight independently adjustableFaraday collectors and a fixtrl axial Faraday collector that can be lowered to allow theion beam access to a Daly detector with pulse counting. The Plasma 54 has a highertransmission efficiency than most quadrupole instruments (> 100 x 106 ions sec"1 ppm"1
indium using conventional aspiration methods). Recently a new wide flight tube andmagnet with an additional Faraday detector located on the high mass side have beendeveloped and commissioned. This can be used to detect U at the same time as Pbis measured using the main collector array (or 7Li at the same time as 6Li) [10]. Thisfacilitates simultaneous U-Pb measurements for spatial resolution work.
The standard method of sample admission utilizes a peristaltic pump to deliverdissolved samples to a pneumatic nebulizer. The nebulizer converts the solution intoan aerosol which is then passed into the plasma source where it is desolvated,dissociated and ionized. The minimum solution volume required is about 1 ml_. AMistral desolvating higher efficiency nebulizer can be incorporated in the plasmasource resulting in significant (factor of 10) increases in signal size [11]. Whereas bythermal ionization it is difficult to obtain high precision concentration and/or isotopicdata for certain elements such as Sn, Hf, W, Pt and Ir, simply because they aredifficult to ionize, high precision (<0.002% RSD) is achievable with 300 ng of Hf [11]using the Plasma 54. The design is currently being modified to increase thetransmission by a factor of >10.
The mass discrimination or "bias" in the source of the Plasma 54 is a relatively simplefunction of mass. For many applications, an exponential law provides the closestapproximation at very high precision. Unlike the case for a thermal source, this bias isindependent of time, the chemical properties of the element, or the admixing of otherelements [6,9,12]. This significant feature of this kind of mass spectrometer contrastswith thermal ionization mass spectrometry in which mass discrimination is a function ofwork function and in some instances, poorly understood reactions that occur on the
- 8 2 - AECL-11342
filament during heating. Thus, using a solution containing a mixture of elements withoverlapping mass ranges, the mass discrimination observed in an element of knownisotopic composition can be used to determine accurately the unknown isotopiccomposition of the other element. The implications of this are far reaching. Normalisotopic compositions, natural fractionations, natural isotopic anomalies and artificialisotopic enrichments can be measured to higher precision. Elements such as Pb, theisotopic compositions of which cannot be normalized with internal normalization, canbe corrected for mass discrimination to high levels of accuracy by admixing a standardsuch as Tl of known isotopic composition and monitoring masses 205TI and 203TI.Isobaric interferences such as 87Rb on 87Sr, 144Sm on 144Nd or 176Lu on 176Hf can becorrected for to higher degrees of accuracy than has hitherto been possible. The Pb,Hf and Nd data generated so far [12] demonstrate a remarkable performance andopen the way for isotopic studies in which the elements of interest cannot beseparated from other isobarically interfering elements, as in laser ablation Sr and Hfisotopic analyses.
Laser Ablation
A Nd-YAG laser has been coupled with a Plasma 54 and the number of Pb ionsdetected per number of Pb atoms ablated in NIST SRM 610 glass was shown to be 1in 450 [13]. Direct micro sampling isotopic analysis for Pb, Sr and Hf in complexmatrices is relatively straightforward. Molecular isobaric interferences are usuallynegligible, since the use of laser ablation and hence a dry plasma (rather thanaqueous aspiration techniques) reduces oxide and hydride formation. Doubly chargedspecies of elements at high concentration and low second ionization potential cancomplicate the mass spectra. For example, laser ablation Sr isotopic measurementssometimes require careful correction for doubly-charged rare earth elements whenanalyzing rare earth rich phases. These features contrast with secondary ionizationmass spectrometry (SIMS) which requires very high mass resolution in order toseparate complex molecular interfering species [14.15].
Applications
It is already apparent that this instrument offers considerable potential for new andimproved isotopic and trace element measurements. The rapid measurement ofprecise isotopic compositions is likely to have widespread application in the nuclearindustry, in making large numbers of environmental measurements and in lifesciences. In the earth sciences the instrument offers greater accuracy for Pb isotopicdata, Rb/Sr ratios, U-Th disequilibrium data and Hf isotopic compositions. Certainisotopic anomalies in meteorites could be measured more precisely. New, challengingchronometers with long half-life and difficult isobaric interferences may be feasible.High precision isotope dilution trace element data for the platinum group elements,high field strength elements and transition metals will be relatively straightforward.
- 8 3 - AECL-11342
Laser ablation in situ measurements of Sr, Hf and Pb isotopic compositions, togetherwith U-Pb ages of accessory minerals can be made. Finally, measurements of naturalisotopic fractionation of low mass elements such as Li, B and Cl should be possiblebut have yet to be evaluated.
References
[1] A.R. Date and A.L. Gray, Applications of Inductively Coupled Plasma MassSpectrometry, Blackie and Sons, Glasgow (1988).
[2] R.S. Houk and J.J. Thompson, Mass Spectrometry Reviews 7, 425 (1988).
[3] K.E. Jarvis, A.L. Gray, and R.S. Houk, Handbook of Inductively CoupledPlasma Mass Spectrometry, Glasgow and London (1992).
[4] D.W. Koppenaal, Anal. Chem. 64, 320R (1992).
[5] M.E. Ketterer, M.J. Peters and P.J. Tisdale, J. Anal. At. Spectrom. 6, 439(1991).
[6] G.P. Russ and J.M. Bazan, Spectrochim. Acta 42B, 49 (1987).
[7] G.R. Gillson, D.J. Douglas, J.E. Fulford, K.W. Hallidan and S.D. Tanner, Anal.Chem. 60X, 1472 (1988).
[8] D.C. Gregoire, Anal. Chem. 62, 141 (1990).
[9] A.J. Walder and P.A. Freedman, J. Anal. Atomic Spect. 7, 571 (1992).
[10] A.N. Halliday, J.N. Christensen, C.E. Jones, A.J. Walder and P.A. Freedman,Trans. Amer. Geophys. Un. 74, 626 (1993).
[11] A.J. Walder, D. Koller, N.M. Reed, R.C. Hutton and P.A. Freedman, J. Anal. At.Spectrom. 8, 1037 (1993).
[12] A.J. Walder, I. Platzner and P.A. Freedman, J. Anal. At. Spectrom. 8, 19(1993).
[13] A.J. Walder, I.D. Abell, P.A. Freedman, and I. Platzner, Spectrochim Acta 48B,397 (1993).
[14] W. Compston, l.S. Williams and S.W. Clemens, Abstr. 30th Ann. Conf. Am.Assoc. Mass Spectrometry, 593 (1982).
[15] N. Shimizu and S.R. Hart, Ann. Rev. Earth Planet. Sci. 10, 483 (1982).

J,-
- 8 4 - AECL-11342
Application of Glow Discharge Mass Spectrometryto the Measurement of Isotope Ratios
t L. R. Riciputi, D. C. Duckworth, C. M. Barshick, and D. H. SmithChemical and Analytical Sciences, Oak Ridge National Laboratory, Oak Ridge, TN37831
In 1991, Donohue and Petek reported measurements of palladium isotopic ratios usingglow discharge mass spectrometry (GDMS) [1]. With essentially no samplepreparation, they obtained relative standard deviations of ±0.03% (1 a) for the majorpeaks. This early experiment provided the inspiration to explore more thoroughly thecapability of GDMS to measure isotope ratios. GDMS is appealing for a number ofreasons, especially when contrasted with conventional isotope ratio measurementsand the time-intensive sample preparation often required. GDMS can analyze mostsolid samples, including those of complex matrix, directly, with no dissolution required.We have analyzed soil in this manner, for example [2].
All of the work reported here was done using a VG-9000 sector mass spectrometer. Itis equipped with both Faraday cup and Daly detectors, providing a dynamic range of109. Argon was the support gas for the discharge. Pressure in the cell was estimatedto be 100-250 Pa; the dc discharge was operated at about 2 milliamps and 1 kV.
Many questions had to be addressed in evaluating GDMS for isotope ratiomeasurements. Among these were:
What is the magnitude of the bias?Does bias vary with mass? With matrix? With glow discharge parameters?Are ratios stable with time? What is internal and external precision? How doesprecision vary with concentration?
To address these and other questions, we analyzed B, Cu, Sr, Ag, Sb, Re, and Pb,using NIST standards where available. Table 1 summarizes the materials used.
Pin electrodes of pure lead and copper were analyzed to evaluate the temporalstability of their measured isotopic ratios. The results are presented graphically inFigures 1 and 2. Aside from the almost monotonic variation in the copper ratio,precision for all ratios except ^Pb /^Pb was ±0.03%; precision for the 204Pb/208Pb was±0.08% @ 1 o , The poorer precision is to be expected because of the relatively lowabundance of 204Pb (204Pb/208Pb = 0.05904). The variation of "Cu/^Cu with time(Figure 1) clearly demanded investigation.

- 8 5 - AECL-11342
Table 1: Materials used for GDMS Isotope Analysis
Element
Cu
Sr
Re
Ag
B
Sb
Material
solid stock Cusolid stock brass
pressed Cu powder
NIST 9987; Sr carbonate
NIST 989; Re ribbon
NIST 981solid Cu
NIST 951, boric acid
solid Cu
Amount (wt%)
100%65%100%
5% and 0.75% in Ag1% in cu powder
100%, wrapped on Pt wire
100%15 ppm, unknown isotope ratio
2.8 wt% in Ag
15 ppm, assumed natural ratio
Investigation revealed that variation in current and voltage could not explain theobserved variation. When the pressure of argon was varied, however, a pronouncedeffect on the ratio was observed, as illustrated in Figure 3. For pressures in thesource region ranging 1.5 - 8.0 x 10'2 Pa, the measured value for ^Cu/^Cu changedfrom 0.451 to 0.455, a difference of about 1%. It is thus clear that carefulmaintenance of constant argon pressure is important in obtaining reproducible results.
The reason for this pressure dependence is not obvious, but one can speculate thatvarying the pressure in the cell alters the shape of the discharge, which in turn effectschanges in the ion population sampled by the mass spectrometer. As is well knownfrom thermal ionization mass spectrometry, even small shifts in the locus of ionformation change isotopic bias.
Isotopic bias for elements virtually spanning the periodic table (boron to lead) showedno discernible trend, as shown in Figure 4. No trend with respect to ionizationpotential was observed, either (Figure 5). These observations are consistent withGDMS's known relatively uniform response to all elements. We speculate that this isdue in part to the separation of the atomization and ionization steps both temporallyand spatially.
As expected, precision deteriorated with declining abundance. For elementalconcentrations of greater than 0.5 weight percent, external precision for major isotopicratios was usually better than ±1%. In no case was precision better than ±0.03%

- 8 6 - AECL-11342
obtained, and in no case did precision reach the limits imposed by counting statistics.These two observations strongly suggest that there is room for improved performance.Our first efforts to realize this will be to regulate the argon pressure more strictly. Anyfluctuation in ion beam intensity always has a negative effect on precision. Having amulti-collector system to provide simultaneous monitoring of all isotopes wouldobviously be highly desirable, but, alas, multi-collectors are not possible on aninstrument of Nier-Johnson geometry. Table 2 summarizes our isotopicmeasurements.
Table 2: Summary of Isotopic Measurements
Element
Cu
Sr
Re
Ag
Pb
Pb
B
Detector
F
F
F
F
F
D
F
Material
Solid CuBrass
Pressed Cu
5% NIST987 in Ag
NIST 989onPt
7.5%NIST978 in Cu
SolidNIST 981
15 ppm insolid Cu
2.8%NIST951 in Ag
Ratio
65/63
87/8688/86
185/187
107/109
208/206207/206204/206
208/206207/206204/206
10/11
Average
0.45320.44790.4495
0.71588.4274
0.5980
1.0689
2.17290.91590.0588
2.08180.84730.0545
0.2455
rsd
0.030.030.06
0.210.09
0.15
0.06
0.030.030.08
1.032.583.00
0.06
AcceptedValue
0.4456
0.710348.37861
1.07638
2.16810.914640.5904
Bias
+0.85%+0.52%+0.43%
+0.77%+0.29%
+0.05%
+0.34%
+0.11%+0.14%+0.17%
unknown
0.2473 +0.73%
F, Faraday Cup; D, Daly detector
We have exploited GDMS's ability to measure isotope ratios in a practical application.One of our jobs is to provide mass spectrometric support for ORNL's IsotopeEnrichment Program. A sample of enriched 68Zn required analysis; zinc has a highionization potential (9.4 eV) and is quite volatile (m.p 420°C), making it a likelycandidate for GDMS. Only 1 mg was available for analysis; the sample was loaded bypressing it in the end of an indium pin. The results we obtained are given in Table 3.

- 8 7 - AECL-11342
Table 3: Isotopic Composition of 68Zn Sample
Isotope
Atom%
sd
64
0.148
0.003
66
0.140
0.002
67
0.067
0.002
68
99.637
0.004
70
0.007
0.001
At this time it is clear that daily calibration of the instrument will be required to obtainthe best precision available. The results suggest that the concept of a bias correctionper mass is not applicable; specific bias corrections for each measured ratio will berequired. While isotope ratio measurements using GDMS pose no threat to thermalionization with respect to ultimate precision or, at the other end of the spectrum,sample size, there is a niche for a technique that offers good precision and requireslittle sample preparation. In addition to our specialized requirement for stable isotopes,applications in the areas of waste remediation and in those where rapid screening ofsamples is desirable are two obvious places of potential utility.
Acknowledgement
Research sponsored by the U.S. Department of Energy, Office of Basic EnergySciences, under Contract DE-AC05-84OR21400 with Martin Marietta Energy Systems,Inc.
References
[1] D. L. Donohue and M. Petek, Anal. Chem. 63, 740 (1991).
[2] D. C. Duckworth, C. M. Barshick, and D. H. Smith, J. Anal. Atom. Spectrom. 8,875 (1993).

AECL-11342
£ DMt
AM
' • • • •
-
•
•
Fig. 1 : Cu Isotope measurements^ P!
• • • • 4 . 4
' « • • » • • • * • •
Solid Cu Pin(1-29-93)
X AM—«^^-PU
TT
j :
Pressed Cu Powder(5-3-93)
(M51
04SS
• * •
g 0453
04SS
Fig. 3: Pressure vs Cu Isotope ratio
Fig. 2: Pb isotope measurements
£ 219
~t 2.18
2.17
2.16
0.920i
0.918
i- 0.916
0.914
0.0600
jQ 0.05S5a.
AcceptedValue
2-3
2-3
AcceptedValue
0.0590
0.0565
0.0580
Acceptedf^f--"'f"-+- x ^ + ^ Value
2-3
1 2 3 4 5 6 7 8 9
mA
A
A
ti
03 04 03 0e 0.7 0J
Prwjtin (ton)
Fig. 4: Mass blaa vs mass
100 -
D OalyDatactor• Faraday
•
o o n
Light
Rs" • •
Sb°
O 0MyDMctcr
/\Q • •
D Sr
• •
D •Findiy Drtsctor
• • • • •
-05 0Mass Bias (%)
•a
I1
lonl
zi
93
g
M
t
73
7
U
e
S3
3
Fig. 5: Mass bias vs ionization potential
o Daly Detector" • Faraday
•
-
ooo o o
Light
B»
o Sr • •
Heavy
MasaBias(%)

- 8 9 - AECL-11342
GASES

- 9 0 - AECL-11342
Unconventional Stable Isotope Mass Spectrometry of Fe, Pt and Wvia Gas Source Mass Spectrometry
P.D.P. Taylor, S. Valkiers, and P. De Bievre, Institute for Reference Materials andMeasurements, Commission of the European Communities-JRC, Geel (Belgium)
U. Flegel and Th. Kruck, University Kbln, Institut Anorganische Chemie, Greinstrasse6, Ko ln ( G e r m a n y ) <. i :;:•<•, ( -• •;-<"] f ( ;' N
;
Introduction
Since the 1950's, there has been a burst in the research in and application of isotopemass spectrometry (MS) for elements such as C, N, O, S and H. Such measurementshave been used to unravel processes in many different areas ranging from medicineto environment, climatology and hydrology. Gas source mass spectrometry hasplayed an important role in this evolution, as it enables researchers to detect muchsmaller isotopic effects (down to fractions of permils) than is possible with solid sourcemass spectrometry.
Obviously, this approach can only be used for elements which have volatilecompounds. For other elements (e.g., Fe), isotopic measurements can only be doneusing solid source MS (thermal ionisation, GDMS) or ICP-MS. Consequently, in thesecases it is often difficult or impossible to measure small isotopic effects. Especially foriron, which is an element for which natural isotopic fractionation could be expected(multiple redox stages, biologically active) and has been observed on one occasion [1],gas source mass spectrometry is an approach which merits investigation, particularlyas Fe is difficult to measure using TIMS or ICP-MS. Recently, Taylor et al. [2]demonstrated the feasibility of using a volatile tri-fluorophosphane compound Fe(PF3)5
to be used for gas source MS.
As a follow-up of this work, new data will be presented for iron, platinum and tungsten.
Theoretical
As far back as the fifties and sixties, inorganic chemists were interested in thecoordination of zero-valent metals, and studied the properties of these M°Ln complexesfor purely theoretical reasons. It was at this time that Kruck et al. described thesynthesis of some transition metal complexes with PF3 ligands [3]. Virtually all ofthese compounds show significantly enhanced volatility. They are produced usinghigh pressure/high temperature reactions (e.g. 200 bar / 200°). As most of thesecompounds are not available commercially, they were synthesised for this study at the

- 9 1 - AECL-11342
University of Koln. Apart from their volatility, the tri-fluorophosphane compounds alsohave an interesting property from a mass spectrometrist's point of view: both P and Fare mono-isotopic. The Fe(PF3)5 forms orange crystals and sublimes at 22°C (atatmospheric pressure), whereas the Pt(PF3)4 is a colourless liquid, which thermallydecomposes at 50°C.
Although the classic synthesis routes for these products were developed forpreparative reasons, typically for 10 g of product, down-scaling for 10 to100 mg levelsis currently being investigated.
Experimental
A Finnigan-MAT 271 magnetic sector spectrometer was used, with a single Faradaycup detector [4]. The gas was expanded to 1.8 L, and introduced by molecular flowthrough a gold membrane with fifteen 20 urn pinholes. About 50 ug of sample isconsumed per run. The operating conditions for the various samples analysed aregiven in Table 1.
Table 1: Operating Conditions for the Finnigan-MAT 271 Mass Spectrometer
metal
Fe
Pt
W
compound
Fe(PF3)5
Pt(PF3)4
WF6
speciesmeasured
Fe+, Fe(PF3)+
Pt+
WF2+
electron E(eV)
90
85
90
T of vessel(°C)
110
27
150
T ampoule atinlet (°C)
70
27
27
Inlet P(mbar)
0.02
0.01
0.009
An aliquot of sample (typically 10 mg) was weighed into a monel ampoule, andsubsequently connected to the gas inlet system. This manipulation was carried out ina glovebox, under a dry nitrogen atmosphere, as these compounds hydrolyse. Thesample was cooled (-20°C), connected to the inlet system and the nitrogen waspumped off over a period of 10 minutes. The relative occurence of the differentspecies and a check for isobaric overlaps was carried out using a Balzers QMG 400quadrupole MS. For each sample, at least 4 independent gas introductions weremade. Each time, magnetic field calibration was carried out, and the isotopeabundance ratios were measured over a period of about 1 hour (including baselinemeasurement). The isotope abundance ratios at the time of gas introduction (t=0)were calculated by an extrapolation procedure. This procedure is similar to the oneused for the silicon isotope abundance ratio meaurements on SiF4, which is used atIRMM in the framework of the redetermination of the Avogadro constant. It has beendemonstrated (e.g., for noble gases, O, C and N) that this procedure results in "near-absolute" isotope abundance ratios at the 10"4 level, without the use of syntheticisotope mixtures [4].

- 9 2 - AECL-11342
Results and Discussion
A typical spectrum for these tri-fluorophosphane compounds can be found in [2] (forFe(PF3)5). The M+ and the different M(PF3)n+ species can be observed and the ioncurrents for the different species decrease with increasing number of ligands. Thisoffers flexibility in the choice of the species to use in the isotopic measurement.
Platinum
Table 2 shows the isotope abundance ratios and isotopic composition of Pt for thesample analysed. The uncertainties on these ratios are typically 1 to 5 x 10'5 relative,which is excellent as these have been obtained using a single collector. Compared tothe measurement which is presently considered by IUPAC to be the best, theuncertainties are decreased by more than two orders of magnitude and the accuracyis within the quoted uncertainty limits.
Table 2: Isotopic Composition of IRMM 1994 as Measured on Gaseous
Isotope
190
192
194
195
196
198
ratio to 195f
0.000403±0.000002
0.023134±0.000001
0.974445±0.000033
1.00000
0.746098+0.000008
0.211740±0.000013
mole%
0.013634±0.000068
0.782659±0.000035
32.96700±0.00077
33.831557±0.000420
25.24166±0.00036
7.16349±0.00042
IUPAC repr.mole%
0.01±0.01
0.79±0.06
32.9±0.6
33.8±0.6
25.3±0.6
7.2±0.2
IUPAC bestmeasuie merit,
molfe%
0.0127±0.0005
0.78±0.01
32.9±0.1
33.8±0.1
25.2±0.1
7.19±0.04
Corresponding Atomic Weight* 195.077793±0.000019
195.080±0.011
195.0791±0.0022
t uncertainty as 1s* IUPAC 1993 Standard Atomic Weight for Pt: 195.08 ± 0.03
Iron
Since the initial feasibility test decribed previously [2], no new Fe(PF3)5 has beenprepared. However the previous batch of material was analysed with the Finnigan-

- 9 3 - AECL-11342
MAT 271. As can be seen in Table 3, the uncertainty on the 54Fe/S6Fe is comparableto the uncertainties obtained for Pt and W, but the previously reported isobaric overlapfor 57Fe and 58Fe remains. No effort has been directed towards the study of thisphenomenon, as the intention is to prepare Fe(PF3)5 using a novel down-scaledsynthesis route.
Table 3: Measurement of Iron Isotope Abundance Ratios on Fe(PF3)5
Measurement
A (n=6)-
B (n=4) t
IRMM 1992*
"Fe/^Fe
0.063489±0.000043
0,633509±0.000036
0.06370±0.00027
"Fe/^Fe
0.024211±0.000090
0.0270344±0.0000032
0.023096±0.000072
58Fe/56Fe
0.003150±0.000005
0.003691±0.000028
0.003071±0.000029
Species
Fe+
Fe(PF3)+ '
Fe+
all uncertainties as 1s• measured Jan. 93, on Varian CH5; material synthesized in Nov. 92t measured Apr. 94, on MAT 271; material synthesized in Nov. 92i measured fcv TIMS
Tungsten
Table 4 shows the isotope abundance ratios and isotopic composition of W for thesample analysed. The uncertainties on these ratios are comparable to those of Pt.Compared to ILJPAC's best measurement, uncertainties have been decreased byapproximately an order of magnitude, but the abundance value for the minor isotopediffers significantly.
Conclusions and Future Work
• tri-fluorophosphane complexes of transition metals (i.e. Fe, Pt) enable themeasurement of the isotopic composition of these elements using gas source IMS.For Fe, both 57Fe and 58Fe suffer from isobaric overlap; this needs to be studied inmore detail.
• miniaturised synthesis routes need to be developed for analytical purposes.• for W and Pt, data were obtained which agree very well with the current IUPAC
representative isotopic composition. In comparison with the current bestmeasurements, the data presented here have uncertainties for the isotope ratioswhich are typically 100 (for Pt) to 10 times better than lUPAC's current bestmeasurement.

- 9 4 - AECL-11342
Table 4: Isotopic Composition of W as Measured on Gaseous WF6 Sample
isotope
180
182
183
184
186
IRMM 1994 ratioto 184
0.004405±0.000040
0.864701+0.000006
0.467216±0.000013
1.000000
0.927184±0.000009
IRMM 1994mole%
0.1350±0.0012
26.49608±0.00037
14.31638±0.00039
30.64188±0.00041
28.41066±0.00042
IUPAC 1994 bestmeasurement,
mole%
0.1198±0.0002
26.4985±0.0049
14.3136±0.0006
30.6422±0.0013
28.4259±0.0062
IUPAC 1993 repr.mole%
0.120±0.001
26.498±0.029
14.314+0.004
30.642±0.008
28.426±0.037
Corresponding Atomic Weight 183.840802±0.000048
183.84169±0.00019
183.8417+0.0011
all uncertainties as 1s, n = 5IUPAC Standard Atomic Weight for W is 183.84 ± 0.01
• for W and Pt, "near-absolute" isotope abundance ratios have been obtained, asthe results were acquired using similar instrumentation, measurement andcalculation procedures as used for the silicon isotope abundance ratiomeasurements in the IRMM contribution to the redetermhation of the Avogadroconstant.
• this approach opens up the possibility to have an "operational mole" , i.e. a way torealize the unit of amount of substance, the Mole, in the laboratory for differentelements and with an uncertainty smaller than the one expected from naturalisotopic variation.
References
[1] P.R. Dixon, D.R. Janecky, R.E. Perrin, P.L. Unkefer, W.D. Spall, R. Maeck,Water Rock Interaction, Kharaka & Maest (Eds), ISBN Report 9054100753,Balkema, Rotterdam, 1992.
[2] P.D.P. Taylor, S. Valkiers, P. De Bievre, U. Flegel, Th. Kruck, Anal. Chem. 65,3166(1993).
[3] Th. Kruck, A. Prasch, Angew. Chem. 76, 787 (1964).
[4] S. Valkiers, P. De Bievre, 3rd Int.Symp. Separation Technology, Antwerpen,1993.
- 9 5 - AECL-11342
A Hot Vacuum Extraction Mass Spectrometric Systemfor Determination of H and D In Zirconium
L W. Green, G. A. Bickel, P. K. Leeson, M. W. D. James, T. G. Lamarcheand H. Michel ; ( <•'; ooc en.AECL Research, Chalk River Laboratories, Chalk River, Ontario, Canada KOJ 1J0
introduction
Corrosion reactions at the surface of the zirconium alloy tubes used in pressurizedheavy water reactors cause the release of deuterium which accumulates in the alloy.As the deuterium concentration increases, the solubility limit is reached and deuteriumprecipitates as zirconium hydrides, which degrade the fracture toughness of thepressurized tube. The solubility limits vary depending on alloy composition and reactoroperating temperature, but are close to 30 umoles/g. The initial H content and therate of D ingress must be accurately measured to ensure that the pressure tubes arewithin safe operating limits, and to predict their operating lifetime. Accurate methodsfor hydrogen in zirconium determination are also required for mechanistic studies ofhydrogen ingress. A hot vacuum extraction mass spectrometric (HVEMS) method wasadopted and upgraded for these purposes.
Hot Vacuum Extraction Mass Spectrometry with Isotope Dilution
The method is based on complete extraction of the hydrogen gas from a metallicsample followed by quantitative determination of the hydrogen isotopes. The sampleis heated to 1100cC in high vacuum and a 300 Us turbomolecular pump is used totransfer the evolved gases to a large, low-pressure, collection chamber (Figure 1).After the extraction step is complete, the gases are quantitatively analysed by theisotope dilution technique, using pure H2 or D2 as the spike.
The heater is an ellipsoidal spot lamp focussed on the sample. The sample tube ismade from hydroxyl-free quartz, and the remainder of the vacuum system fromstainless steel, to minimize the H background. A powerful extraction pump is neededbecause hydrogen strongly favors the metallic phase and has a vapor pressure of onlya few mtorr at 1100°C. Continual pumping for 8 minutes removes all, or most of, thehydrogen; for some samples a second extraction is necessary. A liquid Hecryosurface has also been used for collecting the evolved gas, and is required forsamples with high hydrogen content for which backstreaming in the turbomolecularpump is a problem.

- 9 6 - AECL-11342
CalibratedSpiking Volumes
Hydrogen HD Deuterium
Figure 1. Hot vacuum extraction mass spectrometry system
The collected gas is leaked to an 8 in. radius magnetic sector mass spectrometer(Vacuum Generators MM 8-80) and the relative ion currents of H*2, HD and Dl aremeasured to determine the isotopic composition of the extracted hydrogen. A spike isprepared in a small, calibrated volume and injected into the collection chamber. Theisotopic composition is measured again and the absolute amounts of H and Dextracted from the sample are determined by the isotope dilution method.Interferences, fractionation and gas consumption are measured and corrected for.
Calibration and Diagnostics
The accuracy of an isotope dilution analysis depends critically on the accuracy of thespike aliquot and the mass sensitivity factors. Small (17 mL) calibrated volumes withintegral capacitance diaphram gauges (10 torr) are used to prepare known aliquots ofgas for the spikes. The volume is calibrated to within an accuracy of 0.5% (2s) andthe pressure of the spike is chosen to fall within the linear response region of thegauge, for which the accuracy and precision are within 0.1%.

- 9 7 - AECL-11342
The mass sensitivity factors are determined by an automated calibration procedure. Alarge number of isotopic mixtures (typically 80 covering a wide range of pressures andisotopic ratios) are prepared using the calibrated small volumes, and measured H/Dratios are compared with expected values. The relative sensitivity factors have beenobserved to be independent of the isotopic ratio and only slightly dependent on theabsolute pressure at the mass spectrometer inlet (Figure 2). The mass interferences,H3 and D+, can be determined directly from the calibration data at the extremes of theH/D ratios. The D+ contribution to mass 2 is typically 0.5% of the mass 4 signal. TheH3
+ contribution to mass 3 depends quadratically on the H£ signal and for mostsamples is not significant (<0.1%).
Figure 2.
1.04
1.02
1.00
0.98
0.96
10
1.04
1.02
1.OO
0.98
0.96
10"
» •%••* •• .£: .* .
io-
1 o-3 1 o-2
Chamber Pressure (torr)1 0 ,-1
Measured/known isotopic ratios vs collection chamber pressure for mixtures of H2,HD and D2. The I's are ion currents and the n's are numbers of moles of gas.
For quality control, isotopic gas mixes are automatically prepared and analyzed everynight. Such gas mixes are chosen to simulate the gas extracted from typical samplesand, if errors are revealed, the result of the simulation can often be used to diagnosethe cause of the problem.
Accuracy and Precision
The greatest source of uncertainty in the analysis is in the calibration of the massspectrometer. The magnitude of the calibration uncertainty is typically between 2 and3% (2s) (see Figure 2), and does not exceed 5% (2s) for a properly functioningsystem. A value of 5% (2s) has been assigned for the precision of the overallanalysis. For low level samples (<1 umole H and <0.1 umole D), the standard

- 9 8 - AECL-11342
deviation of the blank will contribute significantly to the uncertainty of the analysis andis pooled with the standard deviation of the calibration to determine the totaluncertainty. The detection limits are 0.01 and 0.2 umoles, corresponding to 0.2 and2 ppm by weight in a 100 mg sample, for D and H, respectively.
Standards
The available hydrogen in zirconium standards are limited to a few remaining piecesof NBS wires and controls material supplied by Teledyne Wah Chang Albany (TWCA).Variations in H content have been observed in both types of standards and areattributed to heterogeneity. To avoid heterogeneity problems and to provide standardscontaining both H and D, we have developed a standards preparation procedure whichuses the gettering property of zirconium heated to >900°C. Small, discrete specimensare dosed with known amounts of H and/or D at 1100°C in an apparatus very similarto the HVEMS system. Standards may contain H, D or both isotopes and areroutinely made with an accuracy within 4% (2s) as determined by HVEMS (Table 1).The accuracy of the H result degrades at lower concentration levels due to apersistent H background. Methods to reduce the H background are currently beinginvestigated.
Conclusions
A state-of-the-art hot vacuum extraction mass spectrometric instrument for measuringH and D concentrations in zirconium alloys has been developed in our laboratory.Accuracy and precision are within 5% (2s) for most samples. A second apparatus hasbeen constructed to prepare H, D and H&D in zirconium standards for monitoring theperformance of the HVEMS instrument. These standards are available from theauthors.

- 9 9 - AECL-11342
Table 1: Results of the analysis of Zr standards
Sample
CB-30
CB-31
CB-32
CB-34
CB-43
CB-44
CB-48
CB-54
CB-55
CB-56
CB-76
CB-80
Mean±2s
Deuterium (pg/g)
Expected
22.9
34.1
20.7
22.7
27.7
35.0
36.0
28.2
28.4
33.2
14.6
12.3
Measured
22.6
34.0
20.2
22.9
27.9
33.4
36.1
28.5
27.1
32.6
14.2
12.1
M/E
0.987
0.997
0.976
1.009
1.007
0.954
1.003
1.011
0.954
0.982
0.973
0.984
0.99±0.04
Sample
PL-154
PL-155
PL-156
PL-161
PL-163
PL-171
PL-174
PL-176
PL-180
PL-197
PL-209
PL-226
PL-228
PL-230
PL-232
PL-238
PL-244
Expected
16.2
10.9
5.6
16.0
10.8
11.1
10.9
26.8
42.3
105.2
10.6
52.7
42.1
31.8
11.3
76.5
105.1
Hydrogen (|
Measured
15.2
10.9
5.2
15.3
11.0
11.2
11.1
24.6
41.0
102.8
10.0
53.2
43.7
32.5
11.5
76.5
108.0
jg/g)
M/E
0.938
1.000
0.929
0.956
1.019
1.009
1.018
0.918
0.969
0.977
0.943
1.010
1.038
1.022
1.018
1.037
1.023
0.99±0.08
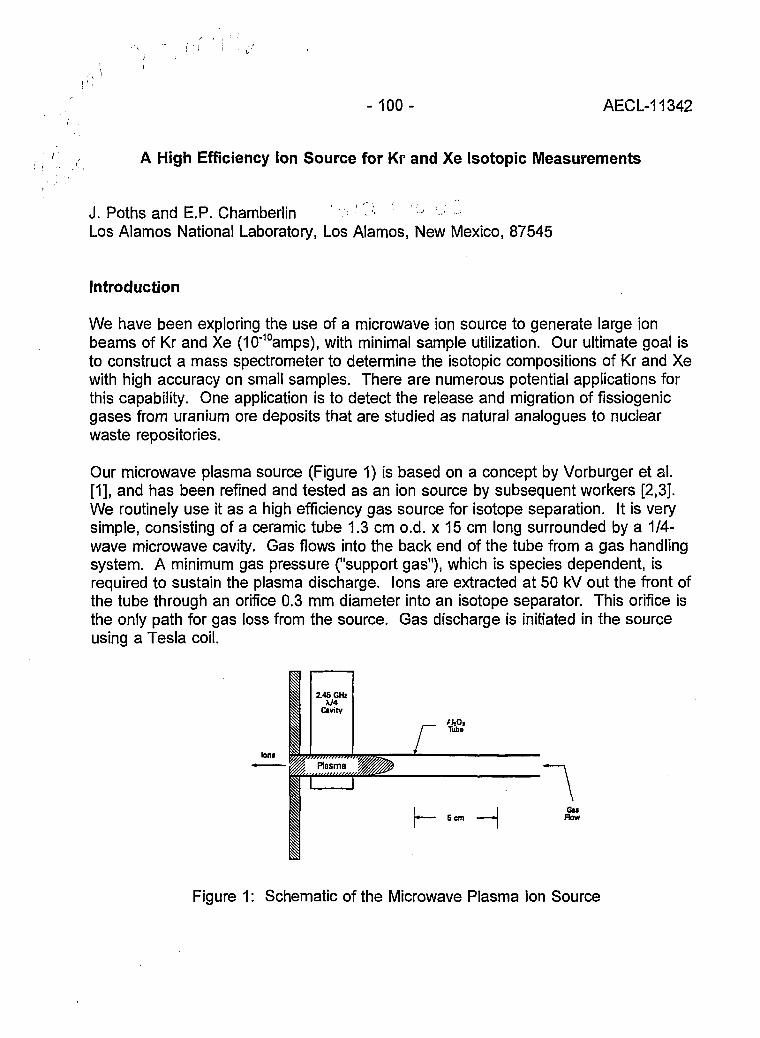
- 1 0 0 - AECL-11342
A High Efficiency ion Source for Kr and Xe Isotopic Measurements
J. Poths and E.P. Chamberlin ; ' • J
Los Alamos National Laboratory, Los Alamos, New Mexico, 87545
Introduction
We have been exploring the use of a microwave ion source to generate large ionbeams of Kr and Xe (10'10amps), with minimal sample utilization. Our ultimate goal isto construct a mass spectrometer to determine the isotopic compositions of Kr and Xewith high accuracy on small samples. There are numerous potential applications forthis capability. One application is to detect the release and migration of fissiogenicgases from uranium ore deposits that are studied as natural analogues to nuclearwaste repositories.
Our microwave plasma source (Figure 1) is based on a concept by Vorburger et al.[1], and has been refined and tested as an ion source by subsequent workers [2,3].We routinely use it as a high efficiency gas source for isotope separation. It is verysimple, consisting of a ceramic tube 1.3 cm o.d. x 15 cm long surrounded by a 1/4-wave microwave cavity. Gas flows into the back end of the tube from a gas handlingsystem. A minimum gas pressure ("support gas"), which is species dependent, isrequired to sustain the plasma discharge. Ions are extracted at 50 kV out the front ofthe tube through an orifice 0.3 mm diameter into an isotope separator. This orifice isthe only path for gas loss from the source. Gas discharge is initiated in the sourceusing a Tesla coil.
loni
2 4 5 GHzX/4
Cavity
Plasma
p 6 cm »Gw
Flow
Figure 1: Schematic of the Microwave Plasma Ion Source

-101 - AECL-11342
In this paper we discuss our results for testing the microwave ion source for ionizationefficiency, stability, ion beam intensity, and gas consumption for Kr and Xe. We alsoreport a technique for isotopic analysis of Kr and Xe with high sensitivity directly fromair. We believe that our technique combines simplicity, high ionization efficiency, andthe ability to analyze noble gases from air without removing the Ar, and therefore is atrue improvement compared to an electron impact ion source.
Experimental
Our basic goal is to determine the suitability of the microwave ion source for use onan analytical instrument. At the same time, we wish to develop a method to analyzeKr and Xe directly from air. Anticipating that we would use the air Ar as the supportgas for air Kr and Xe ionization, we did a series of experiments on the ionizationefficiency of Kr as a function of the pressure of Ar support gas. Figure 2 shows thegas handling system used in these experiments. The 300 cm3 expansion volume isfilled with pure Ar, which is bled through a motorized valve controlled from thepressure transducer, allowing us to vary the Ar pressure in the system. The Ar mixeswith Kr from a calibrated leak, and flows into the ion source. When the calibrated leakwas new (several years ago), a Kr ion beam of 10"6amps corresponded to 10%ionization efficiency.
CALIBRATED
VALVECONTROLLER
-1 TO - 2 ATM•1 TO »2 ATM
10TORRPRESSURETRANSDUCER
MOTORIZEDVALVE
Figure 2: Schematic of the Gas Handling System used for these Experiments
Next, we modified the procedure to develop analysis of Kr and Xe directly from air.The 300 cm3 volume is filled with room air. Air flows from that volume at a ratecontrolled by the pressure transducer and motorized valve, passes through acommercial noble gas purifier and into the ion source. The purifier removes all of thereactive gases from the air stream, leaving the 1% air Ar, with traces of the othernoble gases (1.14 ppm Kr and 0.09 ppm Xe in air). This process is efficient atremoving reactive gases, as demonstrated by scans over the mass range 12 to 90,where the ion beams of all other species are at least an order of magnitude lower than40Ar. Using this procedure, we adjusted the air flow to find conditions that produce thehighest stable Kr and Xe ion currents. We then determined the gas consumption raterequired to produce these beams. Finally, we measured isotopic ratios for Kr and Xe,

- 1 0 2 - AECL-11342
which are indicative for system stability and will identify any significant isobaricinterferences.
Results and Discussion
Pressure Dependence of lonization Efficiency: We first determined the ion current forKr from the calibrated leak as a function of the Ar support gas pressure (Figure 3).Since we are using a calibrated leak as the source for the Kr, we know that a 1 uA Krion beam corresponds to an ionization efficiency of 1%, assuming no depletion of thecalibrated leak over time. We find that the source will operate down to an Arpressure of approximately 2 millitorr, below which the plasma becomes unstable andthe arc is extinguished. Just before the arc goes out, under non-reproducibleconditions, we see ionization efficiencies as high as 11%. We can routinely achieve5% ionization efficiency at slightly higher Ar pressures (about 3 mtorr), with a stable Krion beam.
Ar Pressure (mTorr)
Figure 3: Krypton Beam Current as a Function of the Ar Support Gas Pressure.1 uA corresponds to a minimum ionization efficiency of 10%.
The behavior of the source fed by noble gases concentrated from air (Kr leak isolated)is similar. Despite the fact that the Kr pressure is decreasing with decreasing airpressure, the highest Kr ion currents occur at the lowest source pressure at which astable plasma can be maintained. We determined that a pressure of 165 mtorr, asmeasured on the pressure transducer ahead of the getter, gives us stable ion beams.Since air contains 1% Ar, this roughly duplicates the lowest Ar pressure for stablesource operation with pure gases.

-103- AECL-11342
Ion Beam Intensities and Gas Consumption Rate: For Kr from the calibrated leak (flowrate of <2.4x10'6 cm3/s) with Ar as the support gas, we get a stable ion beam intensityof about 0.5 uA integrated over all isotopes. For Kr and Xe derived from air, with theair pressure in the gas handling system held at 165 mtorr, we routinely get ioncurrents of 1.5x10"10 A for 84Kr (57% of total Kr), and 9x10"12 A for 132Xe (27% of totalXe).
Having established stable conditions to give us the above Kr and Xe beam currentsfrom air, we next determined the gas consumption rate. This was done bydetermining how long the plasma discharge could be maintained from a known volumeof air. The 300 cm3 expansion bottle (Figure 2) was filled to local atmosphere (3/4 ofstandard atmosphere, 230 cm3 STP), and the pressure in the gas handling systemwas set at 165 mtorr. The source operated at a constant Kr ion current for 37 hoursbefore the gas was depleted and could no longer sustain the plasma. We thenrepeated the experiment with a smaller volume of air, roughly 15 cm3 STP. Thesection of the system between the regulator and expansion bottle (Figure 2) was filledto atmospheric pressure. With this as the feed volume, the ion beam remainedconstant for 53 minutes, which is enough time to collect isotopic data for both Kr andXe. From the experiment with 230 cm3 STP, we calculate that about 7.3x10¹² ions of132Xe were generated from 1.45x10¹⁴ atoms of Xe flowing through the source, or anionization efficiency of 5%. For Kr the calculated efficiency is 3%.
Kr and Xe Isotopic Analyses: We have measured isotopic ratios for Kr and Xe fromair samples to address two other questions regarding use of this source for accurateKr and Xe isotopic analysis. As before, the air flows through the purifier directly intothe source with no further separation. The first question is whether the ion beamremains reasonably constant over the few minutes needed to integrate the intensitiesof several Kr or Xe peaks. Second, does our procedure introduce any significantisobaric interferences in the Kr and Xe mass regions. We used a single Faradaycollector with peak jumping of the magnetic field to measure the major Kr and Xeisotopic ratios. We achieved better than 1% precision, which is adequate to rule outmajor problems in these two areas.
Figure 4 shows the isotopic ratio data for the major isotopes of Kr and Xe, normalizedto the atmospheric isotopic compositions [4,5]. The measured ratios scatter within0.5% about a linear mass fractionation trend fitted through the data. Suchfractionation is expected, and may be affecting both the gas and the extracted ions.This fractionation is about 0.6%/mass unit for Kr and 0.2%/mass unit for Xe, similar tothat for conventional gas mass spectrometry. Once corrected for mass fractionation,the good match between our measurements and the atmospheric compositionindicates that the source produces an ion beam that is stable enough for theseisotopic analyses. The good match also indicates that there are no major (<1%)isobaric interferences at these masses.

-104-
Air Normalized Ratios
AECL-11342
1.010
0.985
128 129 1?0 131 132 133 134 135 136 137
Mass Number
1.015 -
1.010 -
1.005 -
1.000-
0.995-
0.990-
0.985 -
0.980 -
• s
T Runi• Run 2
Conclusions
The microwave plasma ion sourceshows considerable promise forgenerating large ion beams of noblegases for high accuracy isotopicanalyses. Advantages include highionization efficiency, operation withoutgas separation, and simplicity of thesource. Measurements of the isotopiccompositions of Kr and Xe from airindicate that ion beam stability andisobaric interferences do not posemajor problems.
81 82 83 84 85 86 87
Mass Number
Figure 4: Isotopic Ratio Measurementsfor Kr and Xe
References
[1] T.V. Vorburger, B.J. Waclawski and D.R. Sandstrom, Rev. Sci. Instrum 47 501(1976). " '
[2] S.R. Walther, K.N. Leung, and W.B. Kunkel, Rev. Sci. Instrum., 57, 1531 (1986).
[3] E.P. Chamberlin, K.N. Leung, S. Walthers, R.A. Bibeau, R.L. Stice, G.M. Kelley,and J. Wilson (1987), Nuclear Instrm. Methods Phys. Res., B26, 227 (1987).
[4] O. Eugster, P. Eberhardt and J. Geiss, Earth Planet. Sci. Lett. 2, 385 (1967).
[5] A.O. Nier, Phys. Rev. 79, 450 (1950).
Acknowledgement: This work was supported by the United States Department ofEnergy.

-105- AECL-11342
LASER RESONANCE lONIZATION

-106- AECL-11342
Resonant Laser Ablation: Mechanisms and Applications
J.E. Anderson, R. Bodla, G.C. Eiden, N.S. Nogar and C.H. SmithChemical Science and Technology Division, MS J565Los Alamos National LaboratoryLos Alamos, New Mexico 87545
Introduction
Ever since the first report of laser action, it has been recognized that laser ablation(evaporation/volatilization) may provide a useful sampling mechanism for chemicalanalysis [1,2]. In particular, laser ablation is rapidly gaining popularity as a method ofsample introduction for mass spectrometry [3-5]. While most laser ablation/massspectrometry has been performed with fixed frequency lasers operating at relatively highintensities/fluences (>108 W/cm2, >1 J/cm2), there has been some recent interest in theuse of tunable lasers to enhance the ionization yield of selected components in ananalytical sample. This process has been termed resonant laser ablation (RLA) [6-12],and typically relies on irradiation of a sample in a mass spectrometer with modestintensity laser pulses tuned to a one- or two-photon resonant transition in the analyte ofinterest.
Potential advantages of RLA include: (1) simplification of the mass spectrum, byenhancement of signal from the analyte of interest; (2) improvement of the absolutedetection limits by improving the ionization efficiency, and (3) improvement in relativesensitivity. The sensitivity enhancement results from reduction of spurious signal, andaccompanying noise, in the detection channel. This spurious signal may be due to bleedthrough from adjacent mass channels, or from isobaric interferences. RLA tends toproduce higher mass resolution because of minimal spatial spread in the ion source andsmall space charge effects. In this manuscript we present a survey of RLA attributesand applications.
Results and Discussion
Analysis
Much of the apparatus has been described previously [13,14]. The optical sourceconsisted of an XeCI excimer laser-pumped dye laser. For most of the experimentsdescribed here, the output energy was a few mJ in the blue spectral region («450 nm),in «10 ns pulses, at a repetition rate of 10 to 50 Hz. The dye laser beam was spjit andattenuated prior to striking the sample, so that typical incident pulse energies were 10-100 uJ. The ion detector was a channel electron multiplier whose output was amplified,sent to a boxcar averager or digital oscilloscope, and then transferred to a micro-

-107 - AECL-11342
computer. The beam was focused by a 20 cm lens and incident on the surface at anangle of 11°, producing a stripe on the surface that was 0.34 mm by 1.8 mm(0.006 cm2), measured at the 1/e intensity points of the beam.
4CO
CD
c/5
6 0 0
4 0 0
2 0 0
- 2 0 0
Al 5ppm457.44 nm
Fe 70 ppm447.60 nm
Cu 2 ppm463.61 nm
Tr Cr 3 ppm
473.28 nm
8 100 2 4 6
Flight Time/|xsecFigure 1: "2+1" Resonant Laser Ablation Spectra of Trace Components in
High Purity, 99.97% Rhenium
Figure 1 shows typical mass spectra obtained from a high purity rhenium sample. Eachspectrum corresponds to irradiation of the surface at a different wavelength,corresponding to a "2+1" (photons to resonance + photons to ionize) ionization processfor the labelled element: iron, aluminum, copper or chromium. Several features areworth noting. First, signal was obtained with low pulse energies, typically 20 uJ(corresponding to a fluence «10 mJ/cm2, or an intensity <106 W/cm2). The observationof trace components at very low laser intensities is a significant virtue of this process;this sensitivity is due both to the resonant nature of the ionization process, and to theexcellent overlap of the vaporized sample with the ionizing laser beam, as discussedbelow. Second, virtually no signal due to the bulk material (Re) was observed. In morecareful experiments, we have demonstrated selectivity, d, in ionization of the targetanalyte vs. the bulk material of d > 105:1. In spite of this, a persistent signal due tosodium and potassium was observed in all of these spectra. These are impuritiespresent in the sample and their presence was perhaps enhanced by excessive manualmanipulation. These components are presumably observed because of their highvolatility, low ionization potential and presence on the surface as ionic compounds. Theyare thus easily vaporized, and ionized, by low-order non-resonant multiphoton processes.In addition, we generally observed that the initial pulses of any irradiation sequenceproduced more signal than subsequent pulses [15], even though the thermal pulseshould decay completely in the time scale of the interpulse interval.

- 108 - AECL-11342
Several generalizations concerning quantitation can also be made. The results shownabove were found to be semiquantitative. All mass spectral traces in Figure 1 werenormalized so that the areas corresponding to the sodium signals were equal. Underthis constraint, the signals can be seen to scale monotonically with the concentration ofthe minority species, as was noted previously [6]. In addition, at the low fluences usedin these experiments, removal rates were very small; in separate experiments, weestimated <0.01 monolayer per shot is removed from the sample. This provides thepotential for depth profiling of layered or inhomogeneous samples using resonant laserablation [16,17].
The potential of RLA for trace detection is shown in Figure 2a, which depicts a massspectrum obtained from a nickel sample containing low levels (<ppb) of technetium.Technetium is an unstable element that does not occur in nature, and is difficult to detectby radiochemical means because of its low specific activity. In our analyses, the laserwas tuned to a "2+1" resonant ionization transition for technetium; the optical spectrum isdisplayed in Figure 2b. While Figure 2a clearly shows significant non-resonant ionizationoccurring, it should be noted that the nickel sample had a very rough morphology (thesurface appeared black) and the Tc concentration was <1ppb, illustrating the benefits ofsignificant discrimination for the detection of extremely low levels of analytes.
0 m/z 10 20 40
0 2 4 6
Flight Time/u,sec
(a)
c
COcD)CO
o
1
0.10
0.05
0.00
—
-
-̂
i •
i •
I t
i i
p I
19790 19800
Photon Energy/cm
(b)
19810-1
Figure 2a: Mass Spectrum Resulting from Resonant Laser Ablation of Tc from a NickelSample, using the e6S5/2<-a6S5/2 Two Photon Transition shown in Figure 2b

-109- AECL-11342
Spectroscopy
We also show the utility of RLA for spectroscopy and surface studies. This workdemonstrates the ease with which high quality atomic spectra can be obtained usingRLA. Figure 3 shows the 2+1 multiphoton ionization spectrum of 56Fe detected by RLAof Re containing 70 ppm Fe.
44625 44650
Two-Photon Energy/cm
(a)
44675-1
40000 40100
Two Photon Energy/cm"1
(b)
Figure 3: (a) "2+1" lonization Spectrum from the Iron Ground State(b) Similar Spectrum from an Excited State
We observe the two-photon D J=0 transition from the a5D ground term to the e5D excitedterm near 44640 cm"1; also observed is the e5F-asF two-photon transition from the firstexcited term near ~1 eV. Each of these multiplets spans a wavelength range of <1 nm,across which the dye laser power is essentially constant. The J'=3 - J"=3 and J'=5 -J"=5 transitions are much stronger than the other lines in the excited state multiplet dueto near resonances with the z5F° term (detunings of 182 cm'1 and 92 cm'1, respectively).
Temperatures can be obtained from these spectra by comparing calculated intensities fora particular temperature with experimental intensities. The agreement between theexperiment and calculation is surprisingly good. A fit of the experimental intensities tothe calculated intensities yielded a straight line (1^=0.96 to 0.99 for three data sets) forthe four lowest lying spin-orbit states in Fe. The observed intensity of the J"=0 - J'=0transition is an order of magnitude larger than calculated, possibly due to quantuminterferences. We obtain a temperature of 1100 ± 200 K for Fe atoms ablated from Reat an intensity of 2 ± 1 x 10⁶ W/cm2. This is in rough agreement with a recent
- 1 1 0 - AECL-11342
measurement [16] of the temperature of a laser desorbed plume several mm above thesurface.
Conclusions
We have shown that RLA is ideally suited for high sensitivity analyses of complex samples.It requires very modest performance from both laser and mass spectrometer, and is suitedfor detection of a wide variety of elements. We have also demonstrated 2+1 ionizationtransitions in Fe detected by RLA. Two-photon transition rates for Fe transitions werecalculated perturbatively and found to agree semi-quantitatively with experimentallyobserved intensities.
References
[1] L. Moenke-Blankenburg, Laser Microanalysis, Eds., John Wiley & Sons, New York, (1989).
[2] L. J. Radziemski, D. A. Cremers, Laser-Induced Plasma and Applications, Eds., MarcelDekker, New York, (1989).
[3] G. Toelg, Analyst (London), 112, 365 (1987).
[4] U. Boesl, J. Phys. Chem., 95, 2949 (1991).
[5] G. C. Eiden, M. E. Cisper, M. L. Alexander, P. H. Hemberger, N. S. Nogar, J. Am. Soc.Mass Spec, 4, 706 (1993).
[6] I. S. Borthwick, K. W. D. Ledingham, R. P. Singhal, Spectrochim. Acta, 47B, 1259 (1992).
[7] G. Krier, F. Verdun, J. F. Muller, Fresenius1 Z. Anal. Chem., 322, 379 (1985).
[8] K. W. D. Ledingham, J. S. Borthwick, R. P. Singhal, Surf. Interface Anal, 18, 576 (1992).
[9] C. J. McLean, et al., Int. J. Mass Spectrom. Ion Process, 96, R1 (1990).
[10] F. R. Verdun, G. Krier, J. F. Muller, Anal. Chem., 59, 1383 (1987).
[11] G. C. Eiden, J. E. Anderson, N. S. Nogar, Microchemical Journal, 50, 289 (1994).
[12] G. C. Eiden, N. S. Nogar, Chem. Phys. Lett., 226, 509 (1994).
[13] S. W. Downey, N. S. Nogar, C. M. Miller, Int. J. Mass Spectrom. Ion Processes, 61, 337(1984).
[14] N. S. Nogar, R. C. Estler, B. L. Fearey, C. M. Miller, S. W. Downey, Nucl. Instrum.Methods Phys. Res., Sect. B, 44, 459 (1990).
[15] X. L Mao, W. T. Chan, M. A. Shannon, R. E. Russo, J. Appl. Phys., 74, 4915 (1993).
[16] T. Gilbert, B. Dubreuil, M. F. Barthe, J. L Debrun, J. Appl. Phys., 74, 3506 (1993).
[17] T.M. Allan, P.B. Kelly, J.E. Anderson, T.N. Taylor and N.S. Nogar, Appl. Phys., A61, 221(1995).

- 1 1 1 - AECL-11342
Hydrogen Determination in Zirconium Alloys by Laser Ablationand Resonance lonization Mass Spectrometry
G.A. Bickel, Z.H. Walker and L.W. GreenAECL Research, Chalk River, Ontario, Canada KOJ 1J0
Introduction
The integrity of zirconium-alloy pressure tubes in pressurized heavy water reactors canbe adversely affected by the diffusion of deuterium through the protective outer oxidelayer into the bulk metal. The ingress and accumulation of hydrogen isotopes can leadto hydride blister formation and delayed hydride cracking. In order to developappropriate strategies to combat these problems, sensitive analytical techniques arerequired to quantitatively measure the ppm levels of hydrogen present in the pressuretubes.
Currently, H and D concentrations are measured using hot vacuum-extraction massspectrometry (HVEMS). This technique provides excellent sensitivity forconcentrations as low as a few ppm, and yields an average or bulk concentration forthe sample. In an effort to facilitate the determination of spatially resolved hydrogenconcentrations, which may help to elucidate the ingress mechanism, a method ofanalysis is being developed in our laboratory based on laser ablation followed byresonance ionization mass spectrometry (LA-RIMS). In this technique, laser ablationis employed as a sampling tool allowing the transfer of material from the near surfaceregion of the sample to the gas phase where it can be detected using massspectrometry. Correct interpretation of experimental results requires an understandingof the nature of this sampling process. This is particularly true if spatial profiling is tobe considered. To further our insight into the ablation process we have employedAtomic Force Microscopy (AFM) to examine changes in surface topography which mayresult from laser beam exposure. Computer modeling has also been used to assist incharacterizing the interaction between the laser pulse and the sample surface. Finally,hydrogen concentrations determined using LA-RIMS have been compared withmeasurements made using HVEMS in an effort to verify the overall analyticalcapabilities of this technique.
Experimental
The experimental apparatus employed in these studies consisted of the following. The1.06 mm output from a Nd:YAG laser with a temporal width (FWHM) of 11 ns wasused to ablate the surface of the zirconium alloy sample in a vacuum of at least10"7 Torr. The gaussian spatial profile of the laser beam was transformed to a "top-

- 1 1 2 - AECL-11342
hat" profile with a spot diameter of 200 mm on the sample surface and a fluence of0.5 J cm"2. At this fluence, there was no evidence of plasma formation above thesample and the majority of species ejected from the surface were charge neutral. The243 nm output from a second laser, namely an excimer-pumped frequency-doubleddye laser, was used to probe the ablation plume. Deuterium atoms in the plume wereselectively ionized via a 2+1 resonance transition by tuning the output of the dye laserto the 1s -> 2s transition. Once ionized, the deuterium ions were extracted into a time-of-flight (TOF) mass spectrometer and detected.
Results and Discussion
Laser ablation rates have been determined previously in our laboratory and the rate fora fluence of 1 J/cm2 is 0.3 nm/pulse. This low removal rate would suggest that a highdegree of depth resolution should be possible with this technique. However,examination of the sample surface after exposure to several thousand laser pulses ata fluence of 0.4 J/cm2 by AFM revealed significant changes in surface topography. Incontrast to the flatness of the unexposed surface, the laser ablated region displayedhills and valleys with height variations of ±600 nm. These changes in topographysuggest that although only a small amount of material is removed per laser pulse, theinfluence of the laser pulse is felt to a much greater depth. If the pulse from theablation laser is resulting in a redistribution of hydrogen species near the surface, thenthe depth profiling capabilities of this technique may be limited.
Computer modeling of the ablation process also supports the premise that melting andfreezing of the near surface region is occurring. Temperature profiles were calculatedusing a finite difference method both as a function of time and distance from thesurface. The model included the temperature dependent specific heat and thermalconductivity values for zirconium alloy as well as the relevant ablation laser properties.In addition to calculating temperatures, ablation rates were also determined using thecalculated surface temperatures and vapour pressure data for zirconium. A maximumtemperature of 3240 K was calculated for a laser fluence of 0.5 J/cm2 with a temporalwidth (FWHM) of 11 ns. This is well above the melting temperature for pure zirconiumof 2125 K. The calculations also predict melting up to a depth of 300 nm from thesurface. Although the simulations rely on material properties that need to beextrapolated to these high temperatures, the general validity of the calculations can beverified by comparing calculated ablation properties with those measuredexperimentally. In particular, the observed threshold fluence is consistent with thefluence predicted for the onset of surface melting and reasonable agreement is seenbetween calculated and experimentally measured ablation rates.
To evaluate the quantitative capabilities of laser ablation, a sample of pressure tubematerial containing varying amounts of deuterium was prepared and analysed. Thesample was prepared by clamping one end in a heat sink and then heating the other

-113 - AECL-11342
end with a spot lamp in the presence of a D2 cover gas. The majority of the D2 wasgettered by the hot end, resulting in a deuterium concentration gradient in thelongitudinal direction. The ablation laser was then rastered across the surface and thedeuterium atoms in the ablation plume were resonantly ionized and detected in theTOF. This data is presented in Figure 1.
Figure 1: Relative D+ Signal Measured as a Function of Position on Sample Surface
The largest signals were obtained, as expected, from the end exposed to the spotlamp. To assess the relative accuracy of these measurements, the sample wassectioned into 2 mm wide strips perpendicular to the concentration gradient andsubmitted for deuterium analysis by HVEMS. The results from these analyses arepresented in Figure 2. For comparison, the D+ signals in Figure 1 have been summedin the lateral direction, normalized and plotted with the HVEMS results in Figure 2.The results from the two techniques show very good agreement.
t ! 10 12U i g l l i d l u l P o l i t i c o ( i n )
Figure 2: Deuterium Concentration as a Function of Longitudinal Position asDetermined by HVEMS Together with the Normalized Laser Ablation D+ Signal

- 114- AECL-11342
One important step in the application of laser ablation for quantitative analysis will bethe preparation of suitable standards to relate the relative deuterium ion signalsmeasured in the TOF to absolute concentrations. To address this requirement, anumber of standards were prepared by dosing zirconium alloy samples with varyingamounts of deuterium. Care was taken to provide uniform heating of the samplesduring the gettering process in order to produce samples with a uniform deuteriumdistribution. The relative D+ ion signals measured in the TOF are plotted vs Dconcentration, as determined by HVEMS, and presented in Figure 3.
- 1 0 0 —
•» B 0 -
£ 6 0 -
2 0 -
0 -
20 30
B i l t D C o i c e a t r i t l O R (ppn)
Figure 3: Relative D+ Signal Measured from Prepared Standards with Varying DContent as Determined by HVEMS
The D+ ion signal does respond linearly with increasing D concentration within theexperimental uncertainty of the data. The uncertainty in the D+ signal is larger thanthat in the D concentrations determined by HVEMS. This is due, for the most part, tothe pulse-to-pulse fluctuations in fluence in both the ablation and ionization lasers.
Conclusions
This study demonstrates the capability of laser ablation combined with resonanceionization mass spectrometry to measure hydrogen isotope concentrations in pressuretube material. H and D are selectively ionized and detected over a range ofconcentrations at ppm levels. Spatial profiling of the sample surface is alsodemonstrated although is currently limited to sub-mm resolution by the ablation laserspot diameter of 100 urn. Work is continuing in our laboratory to assess the potentialof this technique to perform depth profiling of pressure tube samples and in particularsamples containing a ZrO2 overlayer.

-115- AECL-11342
Measurement of Sample Chargingduring Sputtering of Ill-V Materials and Devices
S.W. Downey and A.B. EmersonAT&T Bell Laboratories, 600 Mountain Ave., Murray Hill, NJ USA 07974
Introduction
A common problem in the analysis of non conducting solids using ion bombardment(sputtering) is charging of the sample, which may affect the electrostatics of a massspectrometer's ion source, and hence ion transmission efficiency and reproducibility.The voltage changes induced on samples of GaAs and InGaAsP materials anddevices during sputtering are measured in real time via the Stark Effect in a resonanceionization mass spectrometer. High-lying electronic (Rydberg) levels of sputtered Gaatoms are spectrally shifted by the strong electric field (> 14 kV/cm) present in theinstrument. We use here the spectroscopic selectivity of atomic resonance ionizationin a strong electric field of the mass spectrometer to measure the charging process viathe Stark effect as it occurs under a variety of sputtering conditions. The Stark-shiftedlines are a beneficial diagnostic to probe the ion source's local electric field, whichdepends on the sample's position, potential and charging. Changes corresponding to10 V in the sample's bias can be detected spectrally. Continuous and pulsedsputtering produce different voltage shifts under a variety of incident primary ion types(Xe+ and O2
+), energies and doses. Optimization of sputtering parameters so thatcharging is not problematic, or at least predictable, helps ensure reproducibility ofdepth profiles for devices and materials where high precision is required. Charging ofsemi-insulating GaAs is significant enough at 2 keV to deflect the ion beam out of theanalysis area in the ion source. At 6 keV, the beam is not moved as much eventhough the amount of charging is about the same.
Experimental
Resonance ionization mass spectrometry (RIMS) is a selective and sensitive techniquefor dopant profiling in devices and materials [1, 2]. As in conventional depth profilingtechniques such as secondary ionization mass spectrometry (SIMS), a primary ionbeam is used to slowly and controllably erode layers of materials. The RIMS/SIMSinstrument, is a modified UHV magnetic sector secondary ion mass spectrometer usedpreviously to detect sputtered molecules in Ill-V materials [3]. Samples are sputteredby Xe ions produced in a duoplasmatron ion source operated from 8.2 -12.2 kV. ForRIMS, the sample is held at about 6.2 kV making the net beam energy on target 2 or6 kV. The sample is held about 4 mm from the grounded secondary ion extractor,creating electric fields in excess of 15 kV/cm. The sample/extractor spacing iscontrolled by a micrometer which is used to fine-tune the electric field in the alignment

-116- AECL-11342
process. The sample bias is controlled by a computer-controlled digital-to-analogconverter with voltage steps of 2.5 V. The nominal angle of incidence is about 30°relative to normal, but at low energy, this angle may be greater than 60° - 70°. Beamcurrents of up to 0.5 uA are contained in a spot of about 100 urn (FWHM) diameter.Sample sputtering may be performed with a pulsed or continuous ion beam. In pulsedoperation, the duration of the ion pulse and the timing of the laser firing relative to thepulse is controlled by a digital delay generator. In this way, varying amounts ofprimary ion dose may be delivered to the sample prior to the laser's firing. Themagnitude of the spectral shifts induced by the charging of these samples are reportedas voltage changes based on calibration by sample bias programming.
An excimer-pumped, frequency-doubled pulsed dye laser (25 ns, 40 Hz) is used tophotoionize sputtered Ga atoms. Ga is resonantly excited to Rydberg levels with laserwavelengths around 213 nm. The laser beam is attenuated (< 100 uJ) to keep thepulse energy low so as to not broaden the Ga spectral lines. The beam is focused<100 urn in front of the sample to optimize RIMS detection. The beam diameter isabout 500 urn, which in this geometry, ionizes all atoms in the ion source region whichis approximately 150 urn wide, corresponding to the energy analyzer's 180 eVbandpass. Sample high-voltage bias and time-gated detection are used to select theRIMS ions produced in the gas-phase while rejecting SIMS ions produced at thesurface.
Table 1: GaAs Samples Examined for Charging
Sample type
Semi-insulating
Semiconducting
Semiconducting
Dopant
-
p-type Zn
n-type Si
Concentration
-
1.7x1019cm-3
2 x 1018 cm'3
Results and Discussion
The ionization potential of Ga is 6.0 eV, and light with energy of 5.8 eV/photon canexcite various Rydberg electronic states (principle quantum number, n > 11). Theelectric field in the mass spectrometer is strong enough to split each n level into manystates accessible from the 4p2P,°2 ground state with one photon. Ga+ RIMS signals willbe detected because the extracting electric field in the mass spectrometer is sufficientto field ionize the Rydberg atoms [4]. Because the electric field is large, theidentification of the electronic transitions involved in the Ga Rydberg spectra is not

-117 - AECL-11342
easy due to strong mixing of states. However, the three peaks evident in Figure 1show approximately linear spectral movement as the field is varied. The shifts ofthese peaks can be used to measure sample charging from Ga-containing samples.
10-1acCO
ww
£(0O
a>#̂i2"ooc
8 -
6 -
4 -
2 -/ \
213.64 213.68 213.72Laser Wavelength, nm
i • •
213.76I
213.80
Figure 1: The effect of sample voltage change on Ga Rydberg RIMS signal sputtered fromZn-doped GaAs with 2 keV Xe+. The laser is fired at a 1.5 us delay relative to theonset of sputtering. Traces labelled 1, 2, and 3 are at sample high voltage settingsof 6.2, 6.3, and 6.4 kV, respectively.
The electrostatic geometry of this instrument, and other magnetic sector SIMSinstruments, when detecting positive ions, is based on a sample biased at highpositive voltage with respect to a grounded extraction plane. The energy analyzer isthen set to pass ions within a certain bandwidth set by the sample high voltage bias.In SIMS all ions are formed at the sample surface, the energy bandpass selects ionssputtered with different kinetic energies. In the RIMS mode, ions are created in thegas phase above the sample in a region of space defined by the diameter of the laserbeam. In addition to possessing a range of kinetic energies from the sputtering, ionsfall through different potentials due to their location in the ion source. Therefore, theRIMS ions passed through the energy analyzer are also spatially selected. For a180 eV bandpass, the region is between 100-150 urn. Changes in the field, eitherintentional or unintentional, shift the region in space that corresponds to the energypassed by the analyzer. Likewise, the size (volume) of the ion source passed by theanalyzer expands or shrinks as the slope of the potential (electric field) changes. Thefield and spot size passed are inversely proportional. So for example, if the samplecharges up during sputtering, with all other parameters constant, the atoms ultimatelydetected by the RIMS process will come from a region in the ion source progressivelyfarther from the sample that decreases in size. Most likely, the detected signal willdecrease, and may even vanish if charging is substantial. To approximate the effectof sample charging, the sample bias is varied while keeping the laser wavelength fixedwhile monitoring the RIMS signal. See Figure 2.

-118- AECL-11342
Sample charging creates another insidious dynamic effect. In the case of high angleof incidence, low energy bombardment, the primary ion beam is deflected as thesample potential approaches the beam voltage. In a magnetic sector instrument, thepractical limit of the primary ion beam voltage, Eb, relative to the sample bias, Es, isabout 0.75 Eb> Es; or 2 keV net incident energy in this case. Therefore, smallamounts of charging could move the position of the ion beam on the surface asignificant amount and change its shape, thus misaligning the sputtered materialrelative to the laser beam and secondary ion optics.
55CO
CO
OCD
1 -
0.1'--
0.01 -d
CO
caa)o.
| .M i . .T | . . , . , . , | . . , . . . . , . . r^rrprr,
6.20 6.24 6.28 6.32 6.36Sample Bias (kV)
Figure 2: The effect of samplevoltage change on Ga Rydberg RIMSsignal sputtered from Zn-doped GaAswith 2 keV Xe+. The laser wavelength isfixed at 213.665 nm. The laser is fired ata 1.5 us delay relative to the onset ofsputtering. This sweep is used tocalibrate the effects of sample charging.
150-
I ' ' """I ^ ' """ I10 100 1000
Ion Pulse Width ((is)
Figure 3: Voltage change on semi-insulating GaAs as determined by spectralpeak shifts of Ga Rydberg atoms obtainedwith pulsed, 2 keV Xe+ sputtering. Datafrom three spectral peaks are shown. Allshifts are relative to the 4 us, 500 nA ionpulse. A positive shift indicates that thespectral lines are red-shifted. Openmarkers: The laser is fired 4 us delay afterthe onset of sputtering. Filled markers:The laser is fired at the end of thesputtering pulse.
Figure 3 shows the effect of increasing ion dose prior to the laser firing upon thespectral shift for the semi-insulating GaAs. Under continuous 2 keV Xe+ sputtering theRIMS signals disappear. If the laser is fired early in the ion pulse (for up to at least a5 ms pulse), the amount of sample charging is small, near the limit of detection ofchange. The interpulse period here is 25 ms for the 40 Hz pulsing, which appears tobe long enough to drain charge between ion pulses. However, as the ion pulse width

-119- AECL-11342
and laser delay increase, adding charge just before measurement, the peaks shiftnoticeably. Data taken with continuous 6 keV Xe+ sputtering also shows verysignificant peak shifts, (approximately +200 V) with continuous and pulsed sputtering,but the spectra are still present. This indicates that at 2 keV, the Xe+ beam isdeflected by a 200 V increase in sample bias that is responsible for the signal lossbecause the sputtered atom cloud is no longer in alignment with the laser beam and/orsecondary ion optics. At higher energy, the lower angle of incidence is not changedmuch by the additional 200 V. The semiconducting GaAs samples exhibit minimalcharging.
Data obtained with O+2 sputtering on the semi-insulating sample exhibited less shift
(50 V) compared to Xe+. A partial explanation for this is that the positive secondaryion yield is enhanced with O+
2 sputtering relative to Xe+. The net charge on the sampleis therefore reduced somewhat as these ions leave the sample for the extractor.Secondary electrons should not contribute significantly to the net charge producedunder any sputtering conditions, because the high extraction potential effectivelysuppresses their emission.
An interesting observation is that greater signals came from craters that were closer tothe sample holder or edge. This can be partially explained by the density ofequipotential lines. In this instrument, ions are passed through a fixed energy windowset to transmit those ions created in the gas-phase by the laser beam just above thesample's surface. Normally, in the case of parallel plane electrode geometry, perhapshalf of the sputtered atoms lay outside the space that defines this window. They arestill ionized by the laser, just not passed through the electrostatic analyzer. Near thediscontinuities of the sample borders, the equipotential lines are spaced farther apart,in effect increasing the solid area passed by the energy analyzer; more atoms aretherefore detected. Away from edge effects, the field lines are closer together, makingsignals much more reproducible, but at the expense of ion transmission.
Conclusions
The spectra of sputtered Ga atoms perturbed by the electric field (Stark effect) presentin a resonance ionization mass spectrometer are used to measure sample bias changes(charging) during ion bombardment of Ill-V materials. Semi-insulating GaAs experiencessubstantial charging (100's of volts) while semiconducting GaAs may exhibit only transientcharging early in depth profiles. Time resolved measurements show how chargingprogresses as a function of ion dose to the sample. Low energy (2 keV) primary ionbeams are affected more by charging than higher energy (6 keV) beams. Edge effectsof the sample and holder significantly affect the reproducibility of RIMS signals. If primaryion beam deflection and sample edge effects are eliminated, the reproducibility is betterthan ±3%.

- 120 - AECL-11342
References
[1] H.F. Arlinghaus, M.T. Sparr and N. Thonnard, J. Vac. Sci. and Technol. A, 8,2318 (1990).
[2] S.W. Downey, A.B. Emerson, R. F. Kopf and J.M. Kuo, Surf, and Interface Anal.,15, 781 (1990).
[3] S.W. Downey, A.B. Emerson and R.F. Kopf, Nucl. Instr. Meth. Phys., B62, 456(1992).
[4] S.W. Downey, A.B. Emerson and T.R. Fullowan, Appl. Spec, 47, 1245 (1993).

- 1 2 1 - AECL-11342
Ultrasensitive Detection of Krypton-85 Gasusing Photon Burst Mass Spectrometry
C.S. Hansen1" J. Pan and W.M. Fairbank, Jr.Physics Dept, Colorado State Univ., Fort Collins, CO 80523H. Oona, E P. Chamberlin, N.S. Nogar and B.L FeareyLos Alamos National Laboratory, P. O. Box 1663, Los Alamos, NM 87545
Introduction
Although long-lived noble gas radioisotopes have been proposed as candidates for anumber of radiochemical dating and environmental monitoring scenarios [1], their usefor these applications has been severely limited due to their incompatibility with currentconventional ultrasensitive isotope detection methods. Photon Burst MassSpectrometry (PBMS), by combining the mass dispersion of an isotope separator withthe isotopically selective photon burst detection, promises to be a viable technique forultrasensitive detection of many isotopes, including noble gases. Results of recentwork with krypton isotopes (including krypton-85) at the current stage of apparatusdevelopment are presented, along with a summary of changes to be implemented inthe next phase of development. A comparison of experimental results with atheoretical model is include i as well as a short discussion of future capabilitiespredicted by this model.
Photon Burst Detection
The detection scheme we use is based on the fact that single atoms or ions with anoptically isolated pair of energy levels can absorb and emit many photons during thetransit time of a detection region (microseconds). Due to loss from the collectors andquantum efficiency of the photomultiplier tubes, only 3-4% of the spontaneousemission is detected. We require this "burst" of detected photons to be a minimumsize before counting it as a real single atom event The photons are produced by alaser beam (811.5 nm) which is aligned anticollinearly with the krypton beam, both ofwhich lie along one focus of an elliptical chamber. Spontaneous emission from theatoms is imaged by the elliptical surface (Au coated) through a slit at the oppositefocus and onto a photomultiplier tube (Hamamatsu R4519). This geometry, along withthe non-invasive nature of the technique, allows us to use multiple detectors in series.By requiring a minimum number of time correlating events in the detectors, we are
+ Current address: LANL, P.O. Box 1663, MS J514, Los Alamos, NM 87545

- 122 - AECL-11342
able to discriminate against random burst-generating events, such as cosmic raysimpinging on a photocathode.
For krypton, the optically isolated system is between the 1s5 (J=2) and the 2p9 (J'=3)energy levels. For odd Kr isotopes it is the F=13/2 and F'=15/2 hyperfine levels. Thefinal atomic beam velocity, ~3 cm/us, introduces a mass dependent artificial (Doppler)isotope shift leaving the nearest isotopic interference more than 90 natural line widthsaway. Thus, the current level of sensitivity is limited not by isotopic interferences butby background levels due to light scattered from the laser beam as well as PMT darkcounts.
Results
The Kr ions are generated in a microwave ion source [2], accelerated through 50 kV,and imaged through a magnetic sector with an abundance sensitivity of about 105.They are decelerated to 500 volts, to increase the interaction time in the detectionregion, and then neutralized in a Rb vapor (IP = 4.18 eV) to efficiently prepare atomsin the correct electronic state. This is followed by the photon burst detection regionand associated detection electronics.
We have observed time correlated photon burst signals from all major and minor Krisotopes as well as from prepared samples of 85Kr. Correlated burst detection hasyielded a dramatic reduction in background levels and improvement in signal-to-background ratios as compared to results obtained by counting the total fluorescencesignal from a single detector. Dynamic range capabilities on the current apparatus of>108 have been demonstrated using signals from both krypton-83 and krypton-85.Experimental results agree well with our theoretical model for different isotopes over arange of conditions. This model is built on a spreadsheet and treats randomprocesses in an average way. It has been shown to produce results in goodagreement with results from a detailed Monte Carlo simulation of the detectionprocess.
Future Work
The next phase of the project includes changes that will reduce the background levelsand increase the detection efficiency. To increase the efficiency we are adding anadditional 6 collectors to the detection region as well as making changes in the ionbeam characteristics to improve spatial and frequency overlap with the laser beam.Noise levels will be reduced by more efficient cooling of PMT's to lower dark countrates and by improving the coupling of the laser beam into the system in order toreduce the amount of light scattering into the collectors. With these improvementstaken into account, the model indicates that krypton-85 can easily be detected atisotopic abundance levels in the 10"11 range with fairly small sample sizes in a

-123 - AECL-11342
reasonable time frame. For example, if we require a detected burst size >1 in at least5 out of the 10 detectors, we can expect a signal of 500 counts per hour and abackground of less than 1 count in that time with an overall efficiency of >10"4
(detected 85Kr atoms/85Kr at source).
References
[1] B.D. Cannon and T.J. Whitaker, Appl. Phys. B 38, 57 (1985), and referencestherein.
[2] E.P. Chamberlin, K.N. Leung, S. Walthers, R.A. Bibeau, R.L. Stice, G.M. Kelleyand J. Wilson, Nucl. Instrum. Methods B 26, 227 (1987).

- 1 2 4 - AECL-11342
GENERAL

- 125 - AECL-11342
SIMS Studies of the Corrosion of Zirconium
R.L. Tapping*, P.K. Chan*, P.R. Norton** and C-S. Zhang**
*System Chemistry & Corrosion Branch, Chalk River LaboratoriesChalk River, Ontario, KOJ 1PO o (rc I;) c c o c A
**lnterface Science Western,.University of Western Ontario( London, Ontario, N6A 5B7
Introduction
The CANDU core typically contains about 400 or more horizontal fuel channels whichcontain the fuel (12 fuel bundles). The fuel channel is comprised of a central pressuretube surrounded by a calandria tube, which separates the pressure tube from theheavy water moderator. Heavy water flows over the fuel inside the pressure tube, andis heated from about 250°C at the fuel channel inlet to about 305°C at the outlet.
Between the pressure tube and the calandria tube is the gas annulus. The annulusgas is now carbon dioxide in all CANDU reactors, although earlier reactors usednitrogen gas.
The pressure tube is fabricated from a zirconium alloy containing 2.5 wt.% niobium,designated here as Zr-2.5Nb, in order to optimize the reactor's neutron economy whilstretaining adequate corrosion resistance and strength.
Some Corrosion Considerations
Zirconium alloys, and particularly Zr-2.5Nb, have excellent corrosion resistance to mostaqueous environments, but exposure to high temperature water under conditionstypical of those in the core of nuclear power reactors leads to reaction of the alloy withthe water:
Zr + 2D2O -> ZrO2 + 2D2
Some of the hydrogen (deuterium) liberated by the corrosion reaction is absorbed bythe zirconium alloy. It is often assumed that this is the only corrosion reaction,although the formation of a protective zirconium oxide film on the surface means thatdirect reaction of the alloy with the water rapidly becomes unlikely, and that furtherreactions that may be responsible for alloy degradation must take place on theoxidized surface.
-126- AECL-11342
Reactions with the CO2 annulus gas, and with hydrogen impurities in the gas, mayalso be important. The principle degradation reaction for zirconium alloys in reactorcores is not oxidation but the adsorption of hydrogen isotopes, either as a result of anoxidation process or independently. Although zirconium has a strong affinity forhydrogen isotopes, and for oxygen, the solubility of hydrogen in zirconium is very low.At room temperature this solubility is less than 0.1 ppm, and at 300°C, isapproximately 50 ppm (by weight). Thus at room temperature any hydrogen in excessof 0.1 ppm is present as solid hydride. Zirconium hydrides are very brittle, and tend toform at areas of high local stress, hence fracture of the hydrides, which appear asplatelets oriented perpendicular to applied or residual stress gradients, can causefailure of the host zirconium alloy structure.
Surface Science and Zirconium Corrosion
Zirconium exposed to water, air, or any oxidizing environment is rapidly covered with adense, adherent, and hence protective, oxide film. An understanding of the propertiesof this film, the reaction of this film with CANDU reactor environments, the factorscontributing to growth, degradation and repair of this oxide, the rates and mechanismsof diffusion of hydrogen isotopes and oxidizing species through the oxide, etc. are allessential if we are to predict the effects of in-reactor corrosion on pressure tubes.Thus it is clear that surface science plays a critical role in developing an adequatemodel of pressure tube corrosion behaviour. It is the intent of this paper to show howvarious surface science techniques, and in particular SIMS, have contributed to ourunderstanding of zirconium alloy corrosion behaviour, and specially the deuteriumingress behaviour of Zr-2.5Nb.
Water Corrosion Studies
Studies in this area have concentrated on the oxidation of Zr-2.5Nb in 300°C water,and the accompanying absorption of hydrogen (deuterium in heavy water). Surface-related studies have concentrated on identifying the species responsible for hydrogeningress. For this paper the example to be discussed here will be SIMS studies ofvarious polycrystalline zirconium-niobium alloys exposed to water (D2O). A zirconium-20 wt.% niobium (Zr-20Nb) alloy was used to simulate the composition of the Nb-richp-phase that surrounds the a-grains, which have a composition approximated by thezirconium-1 wt.% niobium (Zr-1Nb) alloy, in the as-fabricated pressure tube. Theprincipal application of SIMS here has been the use of dynamic SIMS to determine thedistribution of deuterium in the oxides and the substrate, and the relationship of thesedistributions to the diffusion processes that may be taking place.
The SIMS composition versus depth profiles of the water-exposed Zr-20Nb oxide werefound to be significantly different than those measured for the Zr-1Nb oxide. In thecase of the Zr-1 Nb oxide, the deuterium concentration decreased uniformly into theoxide film to a base level typical of that found in the underlying metal substrate. For

-127- AECL-11342
the oxide formed on the Zr-20Nb oxide, the deuterium concentration dropped rapidly tothe detection limit of the instrument, remained at this level throughout the rest of theoxide, then increased through the oxide-metal interface to a constant concentration inthe metal substrate. During the water exposures it was noted that the oxidation(corrosion) rate for the Zr-20Nb alloy was greater than that for Zr-1Nb, but thedeuterium uptake by the Zr-20Nb alloy, measured by hot vacuum extraction massspectrometry, was considerably less. This result coincides with the lower deuteriumintensity found in the SIMS spectra of the Zr-20Nb oxides. The higher deuteriumconcentrations found in the SIMS spectra of the Zr-1Nb oxides may reflect the greaterporosity of these oxides, with the deuterium adsorbed on the pore surfaces. Theseobservations indicate that there are significant differences in the resistance of theoxides grown on these two alloys to deuterium diffusion.
Gas Phase Corrosion Studies
As noted above, the outside of the CANDU pressure tube is exposed to carbondioxide. Recent studies have concentrated on defining the effects of carbon dioxideon the oxide, and on studies of the oxide breakdown and repair process. The recentperception that gas-side deuterium ingress may be more important to pressure tubehydriding is reflected in the increased emphases here on the gas phase work. Thedynamic SIMS studies to be discussed cover the degradation of the oxide as a resultof exposure to non-oxidizing conditions, and the reaction with carbon dioxide, andcarbon dioxide mixtures with deuterium and oxygen. The diffusion of deuteriumthrough the degraded and repaired dioxides is included. These studies have beeneffectively co-ordinated with XPS analyses of oxide stoichiometry. Studies using staticSIMS have concentrated on fundamental studies of the interaction of oxygen andhydrogen isotopes with single crystal zirconium surfaces. These latter studies havedemonstrated that the combination of static SIMS and AES can provide uniqueinsights into the diffusion of hydrogen as a function of crystal orientation.
XPS characterization was carried out to determine the change in zirconium andniobium oxide stoichiometries with various gas phase exposures (to D2, CO2, CO2 +O2, CO2 + O2 + D2 at 593K, following degradation at various temperatures). DynamicSIMS D-profiles, extending from the oxide surface to the underlying metal substrate,indicated a difference in the nature of the oxides (i.e., deuterium permeability) afterthese various treatments. Specimens analyzed by XPS before vacuum degradationhad normal ZrO2 and Nb2O5 oxide surfaces.
It was concluded from these gas phase exposures that: (1) CO2 is weakly oxidizingand will not repair a degraded oxide; (2) deuterium ingress is associated with oxidesubstoichiometry; (3) deuterium enhanced the reduction or degradation of the oxide;and (4) vacuum-degraded oxide can be repaired with O2.

-128- AECL-11342
Surface Kinetics of Hydrogen on Zr
The previous examples used dynamic SIMS at very high beam currents in order todetermine the deuterium distribution through oxides several Mm thick. This requires aprofiling rate sufficiently rapid to profile the oxide in a reasonable time. By contrast, inorder to take advantage of SIMS' ability to detect H or D directly, and also measuresurface H/D concentrations without significant surface disruption, static SIMS,(SSIMS), can be used.
The Bulk Diffusion of Hydrogen in Zr(0001)
The theoretical principles underlying this application rely on the fact that the surfaceconcentration during the segregation of hydrogen on metal (zirconium) surfaces iscontrolled by bulk diffusion and surface desorption of the solute (hydrogen). Heating asample containing surface-absorbed hydrogen resulted in all of the hydrogendissolving uniformly in the bulk (to give a bulk concentration of a few tens of atomicpm). Quenching resulted in segregation of the hydrogen to the surface. A plot of H"yield versus t1/2 provides estimates of the diffusion coefficient as a function oftemperature.
Addition of oxygen to the sample, to generate a surface layer containing 10 to 20%oxygen over a depth of a few tens of nanometres, resulted in an increase in the bulkdiffusion constant. This result is consistent with the dilation of the zirconium lattice bythe presence of oxygen. The results obtained from this segregation method are ingood agreement with those extrapolated from high temperature data.
Hydrogen Ingress Studied by SSIMS
Using SSIMS, the diffusion of H from the bulk to the surface can be measured, and itcan be shown that equilibrium between surface segregation and bulk diffusion isestablished at >260°C. Above 260°C the surface concentration of hydrogen is <0.05monolayers, and the heat of segregation can be derived from a plot of Hn [H'] vs 1/T.A comparison between heating a sample exposed to 0.5 L hydrogen (generating -0.5monolayers coverage) and one that is clean shows that overlap between the Hn [H'] vs1/T curves, which signifies equilibrium, has been achieved at temperatures >260°C.
Again, modification of the surface region by exposure to oxygen has a profound effecton the hydrogen ingress rate, and results in a decrease in the heat of surfacesegregation, in agreement with the dilation of the zirconium lattice by oxygen.
Both these examples show that SSIMS, using knowledge generated from othersurface studies on the same well-controlled surfaces, provides fundamental data onhydrogen isotope behaviour on zirconium surfaces that can be related to surfacecomposition and structures that are believed to control in-reactor behaviour.

- 129 - AECL-11342
Conclusions
Although detailed results were not presented, the intent of the work summarized herewas to show that SIMS, both dynamic and static, is a valuable part of the work neededto understand the mechanisms of hydrogen adsorption by corroding zirconium alloys.Dynamic SIMS studies have indicated that hydrogen ingress in water-corrodedsamples appears to be preferentially via the a-grains in the unaged a-p Z-2.5Nbmicrostructure, although in the aged material ingress is via the p-phase. Gas-phaseexperiments suggest that oxide breakdown is possible in CO2, and this breakdown canresult in hydrogen ingress. Oxide repair, and prevention of hydrogen ingress, can beeffected by adding oxygen to the CO2.
Static SIMS studies have been used to help understand the hydrogen diffusion andadsorption processes, and show that dilation of the zirconium lattice by oxygenincreases hydrogen diffusion and adsorption. This is an important result, since theregion immediately below the oxide contains dissolved oxygen and can therefore actas a window for hydrogen isotope ingress if hydrogen penetrates to this region.Clearly, the formation and bulk dissolution of the oxide formed on zirconium andzirconium alloy surfaces has a marked effect on hydrogen adsorption and predictionand control of the hydrogen absorption will depend on an understanding of the oxide-metal and oxide-environment interfaces.
-130- AECL-11342
Accelerator Mass Spectrometry: Practice and Prospects
H.R. AndrewsAECL Research, Chalk River Laboratories, Chalk River, Ontario, Canada KOJ 1J0
Introduction
Accelerator Mass Spectrometry (AMS) is one of the most significant developments intrace analysis of the last fifteen years. Traditional applications have been themeasurement of various long-lived cosmogenic isotopes at natural concentrations; inrecent years biomedical applications have been of growing importance. AMS can alsobe used for trace elemental analysis, because for every element except indium, atleast one isotope exists for which there is no stable isobar in adjacent elements. Thisapplication of AMS is finding increasing use in semiconductor characterization andmineral analysis, the latter with microbeam ion sources.
The well-established AMS isotopes, their half-lives and stable isobars are given inTable 1. The standard task of AMS is to determine the isotopic ratio of the rareradioactive isotope to the stable isotopes of the same element. Natural values of thisratio vary from ~10"12 to ~10'15. For isotopes such as 14C, 36CI and 1 2 9 I , which are alsobyproducts of nuclear activities, the ratio can be several orders of magnitude higher insamples from contaminated areas. Straightforward techniques based on electric andmagnetic fields can be used to separate the isotopes of the element. The challenge isto discriminate against stable isobars, which, because they are essentially equal inmass, must be separated on the basis of their nuclear charge, and/or atomic,molecular or chemical properties that proceed therefrom.
Table 1: Standard AMS Isotopes
Isotope10Be14C26AI35CI
(41Ca)
(59Ni)129i
Half-life (years)
1.6x10⁶
5730
7.16x10⁵
3.0x10⁵
1.03X10⁵
7.6x10⁴
1.57X10⁷
Stable Isobar10g
14N26Mg
36S ) 36 A r
4 1 K
S9Co129Xe
(41Ca and S9Ni are not measured routinely in large numbers of samples)

- 1 3 1 - AECL-11342
This paper will review current AMS techniques and then recount a number ofextensions to standard practice that could be applied to other, more difficult, isotopesof scientific or industrial interest. Space limitations preclude detailed discussion butreferences containing more information will be given. The paper ends with aSummary and Outlook.
Present Practice
The success of AMS arises from three factors: the use of negative ions at injection,which suppresses isobars in some cases; the stripping process at the acceleratorterminal, which destroys molecular ions; and the high energy of the acceleratedparticles, which permits the use of sensitive particle identification and detectiontechniques developed for nuclear spectroscopy. Details on many systems, large andsmall, can be found in ref. [1] and references cited therein.
Isotopic separations are achieved by magnetic analyses at injection and afteracceleration, augmented by one of electrostatic analysis or velocity analysis (Wiencrossed-field filter or time of flight) to remove or identify weak parasitic fluxes of othermasses with the same magnetic rigidity as the desired species. The primary isobaricseparation is achieved in case-specific ways: non-existence or instability of thenegative ion: 14N, 26Mg, 36Ar, 129Xe; differing ranges in the detector: 10B; andextensive chemical purification plus particle identification techniques: 36S. Othermethods, to be described in the next section, have been used on occasion in somecases, but among these, the only routine use is the gas-filled magnet for 3SS rejectionat Chalk River.
Prospects
There are a number of other isotopes of scientific or industrial interest listed in Table2. They are produced cosmogenically (C) and/or are fission products (F). Theseisotopes are considerably more difficult to determine and it may not be possible toreach the sensitivities and background limits that are obtained for the standardisotopes in Table 1.
There are many additional techniques for isobaric separation and identification. Threethat will not be discussed further here are: (1) Total stripping, applicable where Z is nottoo large and when Z (AMS) > Z (isobar) as in 36CI vs. 36S, 41Ca vs. 41K, and 59Ni vs.59Co. This technique requires very high energies to be efficient; (2) Resonant lonizationCoupled with AMS. 3) Static electric field ionization, applicable to negative ions of verylow electron affinity. A number of other methods with examples are outlined in thefollowing.

- 1 3 2 - AECL-11342
Table 2: Other Isotopes of Scientific or Industrial Interest(Those labelled (C) are produced naturally; (F) denotes fission product)
Isotope53Mn (C)60Fe (C)
79Se (C,F)
" T c (F)107Pd (F)
126Sn135Cs
Half-life (years)
3.7x10⁶
1.5x10⁶
6.5x10⁴
2.1x10⁵
6.5x10⁶
-10 s
2.3x10⁶
Stable Isobar
5 3 C r
S0Ni79Br
"Ru107Ag
126Te, 126Xe135Ba
1. The Gas-Filled Magnet separates isobars because the mean charge state andtherefore the average magnetic rigidity of the ions is a function of their Z as theyundergo collisions in the low pressure gas filling the magnet box. This oldtechnique [2] has been reintroduced to AMS [3] and is used very successfully atChalk River for the suppression of 36S in 36CI measurements [4]. It can beextended to heavier systems through the use of higher energies and higherresolution spectrometers; it is possible that trajectory reconstruction through themagnet (by sensing the particle position at one or more places along its path)might facilitate suppression of the low intensity tails of scattered particles that limitthe sensitivity in some cases. The effect of the tails is minimized when Z (AMS) <Z (isobar) as in 32Si vs. 32S; 79Si vs. 79Br; 126Sn vs. 126Te; and 13SCs vs. 135Ba. Thetails are exacerbated in the opposite situation, e.g. 36CI vs. 36S; 59Ni vs. 59Co; and41Ca vs. 41K.
2. Isobaric laundering is a term coined in the present paper for the reduction ofisobaric interferences by deliberately introducing a small amount of stable isobar-depleted element and then chemically removing it. If isotopic equilibration isachieved, then the reduction factors can be substantial. Table 3 is calculatedassuming the use of separated isotopes actually in stock at Chalk River. Betterresults should be possible with specially depleted materials. This techniqueshould be applicable to conventional mass spectrometry as well as to AMS.
3. Negative molecular ions can be used to discriminate against isobars in some cases.For example, 32SH3 is not stable whereas 32SiHj is [5]. Similarly in the 79Se-79Brsystem the use of 79SeH' could suppress the interference, since 79BrH' is probablynot stable. This method may be applicable in other cases as well.

-133- AECL-11342
Table 3: Isobaric Laundering (with off-the-shelf isotopes)
AMSIsotope
41Ca5 3Mn60Fe79Se
"Tc107pd
126Sn135Cs
StableIsobar
4 1 K
53Cr60Ni79Br
"Ru107Ag126Te135Ba
ReductionFactor
240
120
1860
>25
30
>50
189
>330
4. Laser photodetachment has wide applicability but, as a non-resonant process, itsefficiency is limited by available laser power and duty cycles. Proof-of-principleexperiments have been carried out in the 36CI-36S and 59Ni-59Co systems [6]. Asshown in Table 4, it has wider applicability if negative hydride ions are consideredas well. The process is viable whenever the electron affinity of the desiredspecies exceeds that of the isobaric one. The process would be more efficient ifresonances to autoionizing states exist; these have been predicted [7] but haveyet to be observed.
Table 4: Electron Affinities (eV) of Negative Ions or Negative Hydrides of AMS Isotopesand Their Stable Isobars ("n.s." denotes not stable)
AMS
S3Mn-
MnH"
» N r
^Fe"
FeH-
79Se"
SeH'135Cs"
Isotope
n.s.
0.869
1.156
0.151
0.934
2.02
2.21
0.472
Stable
5 3 C r
CrH"59Co"
eoNi-
NiH"7 9Br
BrJ-T135Ba-
Isobar
0.666
0.563
0.662
1.156
0.481
3.36
n.s.(?)
0.15

-134- AECL-11342
5. The use of K X-ray Identification is a method that is generally applicable butlimited in sensitivity because of inefficiencies in production and detection of the Xrays. This approach is being evaluated in a number of laboratories and someresults have been published (e.g. [8]). The systematics of projectile K-vacancyproduction have been investigated as a function of ion energy and target species[9]. The cross sections increase as a power-law of ion energy. Thus for energies>100 MeV vacancy probabilities can exceed 1%. Because of X ray line structure,high resolution detectors are needed and Doppler broadening must be minimizedby the use of detectors with relatively small solid angle. This technique isprobably most applicable to the determination of fission-product isotopes for whichthe isotopic ratios can be several orders of magnitude higher than those typical ofcosmogenic species.
Summary and Outlook
AMS has become an important analytical tool for the study of a number of natural andman-made long-lived isotopes. The standard techniques are well developed and themeasurements have become routine at many laboratories around the world. Thereare a number of other cases that are of potential interest as natural tracers or in themonitoring of wastes from nuclear activities. These are generally more difficult andrequire new methods or extensions of present techniques. In many cases it is unlikelythat the exquisite sensitivities achieved in the "standard" cases will be attained.
Acknowledgements
The author would like to thank R.J.J. Cornett and V.T. Koslowsky of Chalk River,L.R. Kilius and A.E. Litherland of Isotrace Laboratory, University of Toronto andH.K. Haugen of McMaster University for helpful discussions.
References
[1] Proceedings of the Sixth International Conference on Accelerator MassSpectrometry edited by L.K. Fifield, D. Fink, S.H. Sie and C. Tuniz, Nucl. Instr.and Meth. B92 (1994).
[2] C.B. Fulmer and B.L. Cohen, Phys. Rev. 109, 94 (1958).
[3] M. Paul, B.G. Glagola, W. Henning, J.G. Kelber, W. Kutschera, Z. Liu, K.G.Rehm, B. Schneck and R.H. Siemssen, Nucl. Instr. and Meth. A277, 418 (1989).
[4] H.R. Andrews, G.C. Ball, R.M. Brown, R.J.J. Comett, W.G. Davies, B.F. Greiner,Y. Imahori, V.T. Koslowsky, J.W. McKay, G.M. Milton and J.C.D. Milton, Nucl.Instr. and Meth. B52, 243 (1990).

- 135 - AECL-11342
[5] J. Heinemeier, P. Hornshoj, H.L. Nielsen, N. Rud and M.S. Thomsen, Nucl. Instr.and Meth. B29, 110(1987).
[6] D. Berkovits, E. Boaretto, G. Hollos, W. Kutschera, R. Naaman, M. Paul and Z.Vager, Nucl. Instr. and Meth. A281, 663 (1989) and B52, 378 (1990).
[7] E.V. Vidolova-Angelova, L.N. Ivanov, E.P. Ivanova and V.S. Letokhov, Opt.Spectrosc. (USSR) 54, 350 (1983).
[8] H. Artigalas, J.L Debrun, L Kilius, X.L Zhao, A.E. Litherland, J.L. Pinault, L.Fouillac and C.J. Maggiore, Nucl. Instr. and Meth. f392, 227 (1994).
[9] W.E. Meyerhof, R. Anholt, T.K. Saylor, S.M. Lazarus, A. Little and L.F. Chase,Jr., Phys. Rev. A14, 1653 (1976).
-136- AECL-11342
Isotopes at CEA (France) / , r
Jean R. Cesario '••// c r : /,.<•/Commissariat a I'Energie Atomique, Direction du Cycle du Combustible, C. E. Saclay,91191 - Gif sur Yvette, France.
Introduction
Numerous activities in nuclear R&D induce the use of various mass spectrometricmeasurements ; the choice of methods is determined by considerations such asnature of the material (mineral or organic), radioactivity, availability of the material inlarge or small amounts, precision requirements, ... This extended abstract states somesignificant examples of isotope production and measurement methods.
Isotope Measurements
Nuclear Field
Waste Storage
The nuclear community states that a well designed waste storage is likely to last aslong as a natural ore deposit. This idea has generated many investigations all over theworld around notion of natural analogs.
The Oklo phenomenon is an interesting source of information about long-termunderground storage for nuclear wastes. Among various measurement techniques, ithas been useful to provide a tool for microscopic elemental and isotopicmeasurements on polished Oklo cuttings. Holliger in Cadarache (trad. AECL TR-614,COG-93-345) using a Cameca ion microprobe obtains precise results. New significantdates are consequently established; in the meantime information obtained fromuranium oxide grain studies should make it possible to assess the geochemicalbehavior of numerous elements in a given mineralogical phase (Table I) and toimprove the modeling of transfer processes in radioactive waste disposal sites.
Environmental isotopes can be used as representative tracers of underground waterand salt movements. Recently the use of 36CI formed in the atmosphere by:
40Ar (p, na) - * 36CI t1/2= 3 x 10⁵ a
has been found especially interesting for investigations of large aquifers with slowturnover, as in arid lands. This isotope can only be measured by accelerator massspectrometry. Scientists in CEA work to improve the possibilities of their acceleratormass spectrometer, the Tandetron in Gif sur Yvette.

-137 - AECL-11342
Table 1: Summary of the Behavior of Some Elements in the "Fuel" as Determined with SIMS
Element
Cs
Sr
Ba
Mo
Tc-Ru
Rh-Pd
Te
Bi
Nb
Zr
REE-Y
Pb
Th
Pu
U
Retention
++++
+++++
+++
++++++
++++++
Localredistrib.
++
++++++
++
+++
++++++
Far migration
++++++
++++++
Comments
1| Natural isotopes
| (post-reaction)
11| Metallic inclusions
) (metallic aggreg.:
| Pb, Ru, Bi, As, Te, Pd)
Natural + fission
Pb + met. aggregates
| Superposed
| on 235U
Uranium Enrichment
Boyer and al. (Cogema) have patented an important improvement for UF6 measure-ments, called microfluorination, which increases the sensitivity of traditionalinstruments. It can be done in the source, using a needle loaded with ten microgramsof uranyl nitrate instead of the many grams required for the external conversion.
At Saclay laser spectroscopic methods are being developed for localized isotopicmeasurements inside an AVLIS laser separator and for isotopic monitoring of industrialplants. The required spectral resolution appears to be attainable.
Input Controls in Reprocessing Plants with Total Sample Evaporation
The total sample evaporation method is now extensively used in the industriallaboratories of Cogema in Marcoule, for precise U and Pu assay in spent fuelsolutions and for isotopic measurements in various samples with very low plutoniumcontent: e.g. tar, F.P. concentrates, wastes. The amount required is 5 ng for Pu and30 ng for U. Precision and accuracy (Table 2) are as good as those of the classicalmethod.
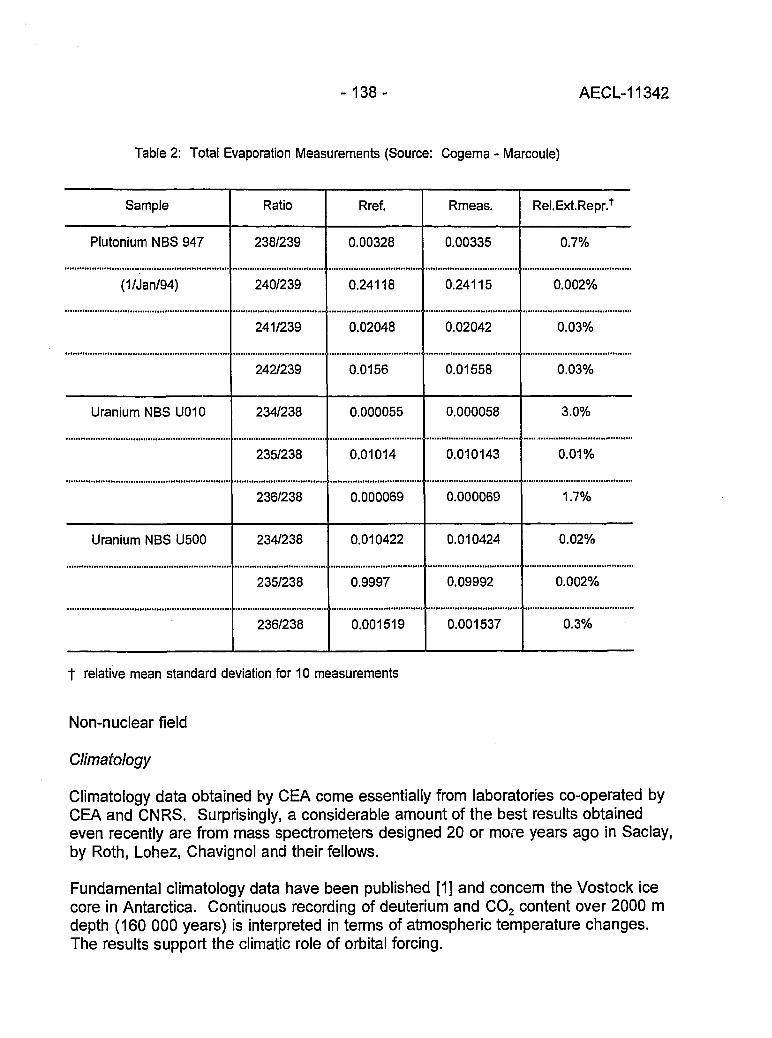
- 138 - AECL-11342
Table 2: Total Evaporation Measurements (Source: Cogema - Marcoule)
Sample
Plutonium NBS 947
(1/Jan/94)
Uranium NBS U010
Uranium NBS U500
Ratio
238/239
240/239
241/239
242/239
234/238
235/238
236/238
234/238
235/238
236/238
Rref.
0.00328
0.24118
0.02048
0.0156
0.000055
0.01014
0.000069
0.010422
0.9997
0.001519
Rmeas.
0.00335
0.24115
0.02042
0.01558
0.000058
0.010143
0.000069
0.010424
0.09992
0.001537
Rel.Ext.Repr.f
0.7%
0.002%
0.03%
0.03%
3.0%
0.01%
1.7%
0.02%
0.002%
0.3%
t relative mean standard deviation for 10 measurements
Non-nuclear field
Climatology
Climatology data obtained by CEA come essentially from laboratories co-operated byCEA and CNRS. Surprisingly, a considerable amount of the best results obtainedeven recently are from mass spectrometers designed 20 or more years ago in Saclay,by Roth, Lohez, Chavignol and their fellows.
Fundamental climatology data have been published [1] and concern the Vostock icecore in Antarctica. Continuous recording of deuterium and CO2 content over 2000 mdepth (160 000 years) is interpreted in terms of atmospheric temperature changes.The results support the climatic role of orbital forcing.

-139- AECL-11342
By extending dating capacities with radiogenic argon, Turpin (CFR, Gif sur Yvette) isworking to decrease the required rock sample amount from 30 mg to <1mg. Thisshould lead to dating of young marine sediments for paleoclimatology, connecting K-Arand 14C methods around 3 x 10⁴ years ago.
Archeology
32S is enriched relative to 34S during the reduction of sulfates to sulfides by anaerobicbacteria. One can observe relative variations up to several percent. Cinnabar (HgS) isthe red vermilion pigment used by Mediterranean artists for frescoes in southernFrance (-100 to +100 years around Christ). By measuring 32S/MS ratios in samplesand comparing results with Italian and Spanish cinnabar deposits, we obtainedinformation about trade practices at this period. The pigment appears to come fromSpain as shown in the following table.
Origin
Almaden (Spain)
Amiata (Italy)
fresco sample
d%0
+11,2 + 0,5
+ 1,9 ±0,5
+12,0 ±1,0
Trends
GD-MS
This type of mass spectrometry has been commercialized several years ago by VGwith the VG 9000. C. Blain and colleagues in Saclay are working to couple a glowdischarge source with a Mattauch-Herzog mass spectrometer (Thomson TSN 212),initially equipped with a spark source. This operation aims to allow: comparison ofspark source and glow-discharge without instrumental effects, direct isotopicmeasurements (with electrical detection), and maximum data utilization for tracesanalysis. Unlike machines equipped only with electrical detection, it is here possible touse a photoplate which is a near ideal integrator. Isotopic compositions are easilymeasured. Sample consumption is about 1 mg/h.
ICP-MS
Three machines adapted to the analysis of radioactive materials are running or undersettlement in different locations. The main applications are trace elements in PuO2
(Cogema, La Hague), Np and monoisotopic elements in experimental nuclear fuels(Saclay), isotopic composition and trace elements in spent fuel solutions (even withquadrupoles, precision and accuracy may be good enough to provide data related to

- 140 - AECL-11342
criticality at the input of reprocessing plants), and long lived fi' emitters (107Pd, 1 2 9 I ,237Np) in environmental samples or in leach-waters from experimental waste matrices(CEA Cadarache).
ICR: A Fair Way To Stable Isotope Production
Production of small amounts of separated or enriched isotopes is of specialimportance for spiking and labeling. Among the various methods able to producethese isotopes Ion Cyclotron Resonance seems well suited because of its flexibilityand moderate investment. An important difference between ICR mass spectrometersand isotope separators is that instead of an ion beam a plasma is used. The quasineutral mixture of ions and electrons in the plasma cause space charge effects to bereduced. Important also is the use of microwave heating of electrons in the sourceregion.
Many elements have been submitted to separation experiments: Ca, Cr, Ni, Cu, Zn,Pd, Ba, Gd, and Yb. Experiments done with Ca, Cr, Ba and Yb support estimationsof separation costs performed with the code RICAN. Diagnostics of the plasma havebeen fully completed and it is now considered that new improvements in terms ofenrichment factors (presently varying between 2 and 130 for different elements) andmass flow rate will be obtained only by upgrading of the ERIC machine. In the nearfuture it is planned to increase microwave power so that elements like 48Ca could beavailable in commercial quantities. In a longer term, construction of a newsuperconducting magnet will allow production of separated isotopes for higher masselements such as Gd.
At large scale the cost is expected to be lower by, at least, one order of magnitude ascompared to that for the calutrons.
Conclusion
This modest review is intended to give a partial - and probably biased - presentation oforiginal works in CEA and Cogema laboratories, largely spread over France. It hasbeen possible to notice that among interesting developments, some of the mostremarkable applications are always indebted to Professor Nier's principles.
All people cited hereafter would certainly be happy to come in touch with thoseinterested.

-141 - AECL-11342
Acknowledgements
Subject
Oklo
UF6
AVLIS
TIMS
TIMS
Climate
Frescoes
GD-MS
ICP-MS
ICR
Author
P. Holliger; D. Louvat
R. Boyer, J.P. Joumoux
P. Mauchien et al.
P. Gasnier
J.C. Dubois
J. Jouzel et al.; L. Turpin
G. Guille
C. Blain et al.
P. Bienvenu
P. Louvet et al.
Location
CEA Cadarache
Cogema Pierrelatte
CEA Saclay
Cogema Marcoule
CEA Saclay
CEA Gif sur Yvette
CEA Saclay
CEA Saclay
CEA Cadarache
CEA Saclay
References
[1] Jouzel, J., Lorius, C, Petit, J.R., Genthon, C, Barkov, N.I., Kotlyakov, V.M. andPetrov, V.M., Nature 329, pp. 403-408 (1987).

-142- AECL-11342
SYMPOSIUM SCHEDULE

5:00-8:00 p.m.
7:00-11:00 p.m.
-143-
MONDAY, MAY 9, 1994
Registration
Reception {Hosted by FISONS Instrument)
AECL-11342
FOYER
WINDOM PEAK
TUESDAY, MAY 10, 1994
8:00-8:45 a.m. Registration & Breakfast
Oral Session A: D.B. Curtis, Chairman
8:45 a.m. Welcome
9:00 a.m.
10:40 a.m.
11:00 a.m.
12:00-1:30 p.m.
"Dedication to Alfred O. Nier"
"Total Evaportation Measurements, a Key to MoreAccurate Mass Spectrometry?"
"Unconventional Stable Isotope Mass Spectrometryof Pt and Fe Via Gas-Source Mass Spectrometry"
BREAK
"Isotopes at CEA"
"Extraction and Measurement of SubpicogramQuantities of Technetium from Geologic andOther Matrices"
Catered Lunch
Oral Session B: Lawrence W. Green, Chairman
1:30 p.m. "The Mechanism of Bi+ Production from BismuthBorosilicate"
"Total Evaporation in Thermal lonizalion MassSpectrometry"
FOYER
StLVERTON BALLROOM
Donald J. RokopDavid B. Curtis
Lawrence W. Green
James E. Delmore
John R. De Laeter
Rudolph Fiedler
Philip Taylor
Jean R. Cesario
Paul R. Dixon
WINDOM PEAK
SILVERTON BALLROOM
James E. Delmore
E. Larry Callis

2:40
3:10 p.m.
4:30-7:00 p.m.
7:00-11:00 p.m.
-144-
BREAK
"A High Efficiency Thermal lonization Source Adaptedto Mass Spectrometers"
"SIMS Studies of the Corrosion of Zirconium"
"A High Efficiency Ion Source for Kr and Xe IsotopicMeasurements"
Personal Time
Poster Session and Reception Hosted byFinnigan MAT
AECL-11342
E. Phil Chamberlin
Robert L Tapping
Jane Potts
INNISBROOK BALLROOM
WEDNESDAY, MAY 11,1994
8:00-9:00 a.m. Registration & Breakfast
Oral Session C: James E. Delmore, Chairman
9:00 a.m. "Application of Glow Discharge MassSpectrometry to the Measurement of Isotope Ratios"
"High Accuracy Determination of Trace Elements inNIST Standard Reference Materials by Isotope DilutionICP-MS"
10:20 a.m. BREAK
10:40 a.m. "Multi-element Isotope Dilution Analyses Using ICP-MS"
"Strategy and Tactics for Alleviating Interferences inInductively Coupled Plasma Mass Spectrometry"
FOYER
SILVERTON BALLROOM
David H. Smith
Paul J. Paulsen
A.M. Volpe
R. Sam Houk
12:00-1:30 p.m. Catered Lunch
Oral Session D: John R. De Laeter, Chairman
1:30 p.m. "Inductively Coupled Plasma Magnetic SectorSector Multicollector Mass Spectrometry"
"Accelerator Mass Spectrometry: Practiceand Prospects"
WINDOM PEAK
SILVERTON BALLROOM
Alexander N. Halliday
H. Robert Andrews

- 1 4 5 - AECL-11342
2:40 p.m. BREAK
3:10 p.m. "Accelerator Mass Spectrometry for Dating RockExposure to Cosmic Rays"
"A Hot Vacuum Extraction Mass SpectrometricSystem for Determination of H&D in Zirconium"
"Hydrogen Determination in Zirconium Alloys byLaser Ablation and Resonance lonization MassSpectrometry"
5:00-7:00 p.m. Reception Hosted by Perkin Elmer-SCIEX
7:00-9:00 p.m. BANQUET
Banquet Speaker: Ernest L. Garner, NIST
"The Golden Years in Isotope Mass Spectrometryat NBS"
David Elmore
Grant A. Bickel
Zane H. Walker
ANIMAS
WINDOM PEAK
8:00-9:00 a.m.
THURSDAY, MAY 12, 1994
Registration & Breakfast FOYER
Oral Session E: Donald J. Rokop, Chairman
9:00 a.m.
10:20 a.m.
10:40 a.m.
12:00-1:30 p.m.
"Noble Gas Mass Spectrometry in the Earth Sciences:A Review and Tribute to A.O. Nier"
"New Developments and Applications in NegativeThermal lonization Mass Spectrometry"
BREAK
"Tellurium: A Mass Spectrometrist's Delight"
Catered Lunch
SILVERTON BALLROOM
Mark D. Kurz
Klaus G. Heumann
John R. De Laeter
WINDOM PEAK
AECL-11342
Cat No. /No de cat: CC2-11342EISBN 0-660-16412-4
ISSN 0067-0367To identify individual documents in the series, we have assigned anAECL- number to each.
Please refer to the AECL- number when requesting additional copies ofthis document from:
Scientific Document Distribution Office (SDDO)AECLChalk River, OntarioCanada KOJ1J0
Fax:(613)584-1745 Tel: (613)584-3311ext 4623
Price: D
Pour identifier les rapports individuels faisant partie de cette serie, nousavons affect6 un numeVo AECL- a chacun d'eux.
Veuillez indiquer le numeYo AECL- lorsque vous demandez d'autresexemplaires de ce rapport au:
Service de Distribution des Documents OfficielsEACLChalk River (Ontario)Canada KOJ 1J0
Fax: (613) 584-1745 Tel: (613) 584-3311poste4623
Prix:D
Copyright© Atomic Energy of Canada Limited, 1996