Proceedings of the 2006 Naxos International Conference on...
373
Proceedings of the 2006 Naxos International Conference on Sustainable Management and Development of Mountainous and Island Areas Editor: Dr Evangelos I. Manolas, Assistant Professor, Department of Forestry and Management of the Environment and Natural Resources, Democritus University of Thrace Printed by: University of Crete ISBN: 960-89345-0-8 Volume II: 960-89345-2-4 First printing: Heraklion-Crete, Greece, September 2006 Copyright © 2006 Department of Forestry and Management of the Environment and Natural Resources, Democritus University of Thrace All rights reserved.
-
Upload
nguyendiep -
Category
Documents
-
view
215 -
download
0
Transcript of Proceedings of the 2006 Naxos International Conference on...

Proceedings of the 2006 Naxos International Conference on Sustainable
Management and Development of Mountainous and Island Areas
Editor:Dr Evangelos I. Manolas, Assistant Professor, Department of Forestry and Management of the Environment and Natural Resources, Democritus University of Thrace
Printed by:
University of Crete
ISBN: 960-89345-0-8 Volume II: 960-89345-2-4
First printing: Heraklion-Crete, Greece, September 2006
Copyright © 2006
Department of Forestry and Management of the Environment and Natural
Resources, Democritus University of Thrace
All rights reserved.

P r e f a c e
The papers in these Proceedings were presented at the 2006 Naxos International Conference on Sustainable Management and Development of Mountainous and Island Areas, organized by the Department of Forestry and Management of the Environment and Natural Resources, Democritus University of Thrace, and co-organized by the Geotechnical Chamber of Greece, the Municipality of Naxos, the Municipality of Drimalia and the Cultural Organization of Koronos.
The conference sought to bring together an international and interdisciplinary audience, and in particular, researchers, government officials, company representatives or environmental activists. The aims of the conference were to tackle many of the issues connected with the sustainable management and development of mountainous and island areas, share experiences and work towards solutions.
The three-day meeting included presentations from 10 different countries, in particular, Bangladesh, France, Germany, Greece, Hungary, India, Malta, Slovenia, The Netherlands and United Kingdom. Key note speakers were Prof. Eugenia Bezirtzoglou, Democritus University of Thrace, Prof. Ioannis Hatzopoulos, University of the Aegean, Prof. Anastassios Papastavrou, Aristotle University of Thessaloniki, Prof. Michael Scoullos, National and Kapodistrian University of Athens, Prof. Alexandros Sideridis, Agricultural University of Athens as well as Dr Michael Littledyke, Research Director, Faculty of Education, Humanities and Science, University of Gloucestershire and Dr Paul Pace, Director, Centre for Environmental Education and Research, Faculty of Education, University of Malta.
These Proceedings present the eighty nine papers that were seen as the most useful and valuable within the context of the conference. All contributions have been reviewed for publication, and not all papers submitted could be included in the final Proceedings volumes.
I hope that the expert knowledge presented in these Proceedings will not only offer a valuable source of information on the subject of sustainable management and development of mountainous and island areas but it will also be looked back on in the future as a milestone in the development of this important field of human endeavor.
Dr Evangelos I. Manolas
President of the Organizing Committee


International Conference
“Sustainable Management and Development of Mountainous and Island Areas”
29th September - 1st October 2006, Island of Naxos, Greece
THE ORGANIZING COMMITTEE
President: Manolas E., Democritus University of Thrace
Members: Papavasiliou G., Geotechnical Chamber of Greece Bessis C., Geotechnical Chamber of Greece Kokkotas V., Municipality of Naxos Karamanis G., Municipality of Naxos Posantzis I., Municipality of Naxos Tzouannis I., Municipality of Drimalia Manolas E., Municipality of Drimalia Houzouris N., Municipality of Drimalia Arabatzis G., Democritus University of Thrace Drossos V., Democritus University of Thrace Iliadis L., Democritus University of Thrace Karanikola P., Democritus University of Thrace Maris F., Democritus University of Thrace Milios E., Democritus University of Thrace Papageorgiou A., Democritus University of Thrace Tampakis S., Democritus University of Thrace Tsachalidis E., Democritus University of Thrace Tsantopoulos G., Democritus University of Thrace Tsatiris M., Democritus University of Thrace
THE SCIENTIFIC COMMITTEE
Anagnos N., Aristotle University of Thessaloniki, Greece Arabatzis G., Democritus University of Thrace, Greece Athanasakis A., University of Athens, Greece Batzios C., Aristotle University of Thessaloniki, Greece Bezirtzoglou E., Democritus University of Thrace, Greece Rojas Briales E., Universidad Politechnica de Valencia, Spain Daoutopoulos G., Aristotle University of Thessaloniki, Greece David T., Estcao Florestal Nacional, Portugal Dermisis B., Aristotle University of Thessaloniki, Greece Doukas C., Aristotle University of Thessaloniki, Greece Drossos V., Democritus University of Thrace, Greece Efthimiou P., Aristotle University of Thessaloniki, Greece Georv G., Bulgarian Academy of Sciences, Bulgaria Goulas C., Aristotle University of Thessaloniki, Greece Iliadis L., Democritus University of Thrace, Greece Kampas A., Agricultural University of Athens, Greece Karameris A., Aristotle University of Thessaloniki, Greece Karanikola P., Democritus University of Thrace, Greece

Kotsovinos N., Democritus University of Thrace, Greece Koukoura Z., Aristotle University of Thessaloniki, Greece Kousis M., University of Crete, Greece Labrianidis T., University of Macedonia, Greece Leal Filho W., TuTech, Germany Littledyke M., University of Gloucestershire, England Manolas E., Democritus University of Thrace, Greece Manos B., Aristotle University of Thessaloniki, Greece Manthou V, University of Macedonia, Greece Mavrikaki E., University of Western Macedonia, Greece Maris F., Democritus University of Thrace, Greece Matis C., Aristotle University of Thessaloniki, Greece Michailides P., University of Crete, Greece Milios E., Democritus University of Thrace, Greece Noitsakis V., Aristotle University of Thessaloniki, Greece Oliver Jose-Vicente, AIDIMA, Valencia, Spain Papageorgiou A., Democritus University of Thrace, Greece Papastavrou A., Aristotle University of Thessaloniki, Greece Pavlidis T., Aristotle University of Thessaloniki, Greece Poimenides E., University of East London, England Rafailova E., University of Forestry, Bulgaria Sakelariou-Markantonaki M., University of Thessaly, Greece Scott W., University of Bath, England Skanavis K., University of Aegean, Greece Skourtos M., University of Aegean, Greece Smiris P., Aristotle University of Thessaloniki, Greece Spartalis S., Democritus University of Thrace, Greece Tampakis S., Democritus University of Thrace, Greece Tavares M., National Forest Research Station, Oeiras, Portugal Tsachalidis E., Democritus University of Thrace, Greece Tsantopoulos G., Democritus University of Thrace, Greece Tsatiris M., Democritus University of Thrace, Greece Vlachopoulou M., University of Macedonia, Greece Zioganas C., Aristotle University of Thessaloniki, Greece

TT aa bb ll ee oo ff CC oo nn tt ee nn tt ss
Oral Presentations
Panousopoulou P., Manthou V., Vlachopoulou M.: Reverse Logistics through Recycling: A Case Study from the Brewery Sector 1Pantazis V., Kalavrouziotis I., Deligiannakis Y.: The Reuse of Wastewater and Sludge Utilization on Forest Species 11 Papadopoulos A.: A New Environmental Friendly Technology for the Production of Decay Resistant and Dimensional Stable Strandboard (OSB) 20 Papadopoulos I., Stefanis C., Alexopoulos A., Voidarou C., Kourkoutas Y., Vavias S., Bezirtzoglou E.: Microbial ecology of beetroots. 24 Papastathopoulou I.: Managing Change: The Case of Tenos Island Cyclades-Hellas 28 Papastavrou A.: The Beneficial Role of Urban Green Zones, Suburban Green Zones and Forests in Modern Society 39 Petropoulou E.: Indigenous Resource Management and Environment in a Subsistence Mountain Economy in Southern Greece 47 Pipinis E., Aslanidou M., Mavrokordopoulou O., Milios E., Smiris P. : Treatments improving seed germination of Cistus creticus L., Erica arborea L. and Erica manipuliflora Salisb. 57 Polyzos S., Christopoulou O., Minetos D. : Urban - Rural Land Use Interactions in Greece 62 Sakellariou M.: Environmental Ethics as a Determining Factor for Sustainable Development 76 Samolis A., Arabatzis G., Tsikna A., Manos B.: Tourist marketing plan in rural areas: The case of the prefecture of Pella 86 Scoullos M.: Tourism in the framework of Sustainable Development planning employing the MIO-ECSDE/ SUDECIR methodology: The case of the Island of Rhodes, Greece 96 Sideridis A.: New ICT Concepts and Projects for the Development of Rural Areas: The project Bio@gro 103 Spanos K., Spyroglou G., Baloutsos G.: Assessment of Biodiversity in Forest Ecosystems 111 Stefanis C., Alexopoulos A., Papadopoulos I., Voidarou C., Kourkoutas I., Vavias S., Bezirtzoglou E.: A Preliminary study on the microbial ecology of cultured soils. 119 Stergiadou A.: Environment impact assessment (E.I.A.) for the evaluation of forest roads in mountainous conditions (Case study: Valia Kalda) 125 Swann R.: Beyond Knowledge: Science Teaching in Early Years Education 130 Tampakis S., Tsantopoulos G., Arabatzi Z., Tsikna A.: Education and local rural development 138 Tsachalidis E., Poirazidis K.: Nesting habitat selection of the black stork (Ciconia nigra) in Dadia National Park, northeastern Greece. 147

Tsachalidis E.,Karanikola P., Poirazidis K., Zografou D. : Habitats and avifauna on the Island of Skiathos 154 Tsachalidis E., Tampakis S., santopoulos G., Zografou D.,Tsikna A., Arabatzi Z.: Teachers and Environmental Education in Greece 163 Tsatiris M., Skondras N., Liampas S. - A., Gkotsis I. : Contributing to Local Development: The Case of a Bioethanol Production Industrial Unit 172 Tsatiris M., Liampas S. - A., Giovannopoulos R. : The utilization of Zeolite of the municipality of Trigono as a soil ameliorative for plant raw material cultivation for biofuel production 177 Vasalakis A., Voudouris K.: Hydrologic Balance and Aquifer Systems on the Island of Naxos, Cycades, Greece 182
Poster Presentations
Alexopoulos A., Stefanis C., Papadopoulos I., Fotiadis S., Voidarou C., Koutroubas S., Vassiliou G., Bezirtzoglou E.: Microbial Ecosystem Diversity in an Experimental Field During Flooding 193 Baka C.: Sustainable Road Transport, Sustainable Mobility: Promoting a Cleaner and Healthier Environment 198 Drosos V., Farmakis D.: Airborne Laser Scanning and DTM Generation 206 Drosos V., Giannoulas V., Doukas A. - K.: Environmental Improvement of Forest Roads from Category C to Category B 219 Drosos V., Giannoulas V., Doukas A. - K.: General forest opening up works by the use of modern technologies: An evaluation of intensity and absorbent capacity 229 Gkaraveli A., Emmanouloudis D., Papadopoulos A. : GIS Applications in Management and Mapping of Natural Ecosystems 234 Karagiannis E., Kararizos P., Karagiannis A.: Application of Modern Automated Machines in Forest Opening-Up Works 241 Karameris A., Ragkou P., Kastani L.: Exploring the Environmental Knowledge and Attitudes of the Students in the School of Forestry and Natural Environment at the Aristotle University of Thessaloniki 247 Kontova S., Charalampopoulos I., Chronopoulou-Sereli A. : Investigation of Humidex bioclimatic index spatial pattern using geostatistical methods and GIS: The case of a green area in Nea Smyrni 257 Korakis G.: Description of vegetation types in Pylos Lagoon and Sfacteria Island, Greece 261 Kostopoulou P., Koukoura Z., Noitsakis B. : A New Insight in the Photochemical Efficiency of Cynodon dactylon (C4 species) Compared to Elymus hispidus (C3 species) under Drought Conditions 268 Manolas M., Mellissourgos G.: Koronos: Keeping Cultural Architectural Identity 274 Milios E., Pipinis E., Petrou P.: The Influence of Shade Conditions on the Young Radius (Ring Width) Growth of Juniperus excelsa Bieb. Trees in the Central Part of Nestos Valley in Northeastern 282

Greece
Papageorgiou A., Kasimiadis D., Poirazidis K., Tsachalidis E.: The Genetic Component of Biodiversity in Sustainable Forest Management 287 Pavlidis T., Marinos D., Maris F. : Weight dams for water saving in torrents: Sustainable utilization of water as the solution for water shortages at Cyclades islands 297 Poirazidis, K., Papageorgiou, A.. Kasimiadis, D.: Mapping the Animal Biodiversity in the Dadia National Park using Multi-Criteria Evaluation Tools and GIS 299 Schindler S., Vasilakis D., Poirazidis K.: Error Assessment of a Telemetry System for Eurasian Black Vultures (Aegypius monachus). 305 Sinquin A., Bailly J., Cabaret J. - P., Deschizeaux F., Despas N., Forel A., Leonard J., Manceau A., Prigent J., Schowb S., Traversay M., Vuckovic N., Borec A., Cencic A. : Cohabitation of Farmers with Brown Bear (Ursus arctos) in Slovenia 315 Theodoridis I., Pappas P., Koukoura Z. : Distribution of the genus Trifolium L. in Greek mountainous and island areas 320 Tsachalidis E., Sokos C., Birtsas P., Patsikas N.: The Australian Crow Trap and the Larsen Trap: Their capture success in Greece 325 Varras G., Kantartzis A., Kakouri P.,Koutsikou M., Papadopoulou A.: Use of Terraces in the Mediterranean Environment: a physical, sociohistorical, and economic approach. The case of Greece 330 Venieri D., Komninou G., Bezirtzoglou E., Papapetropoulou M. : Assessment and Application of Random Amplified Polymorphic DNA PCR analysis as a Fecal Source Tracking Technique 343 Venieri D., Komninou G., Bezirtzoglou E., Papapetropoulou M.: Profiles of Antibiotic Resistance in Escherichia coli Strains Isolated from Municipal Tap Water and Raw Sewage Samples in Greece. 353


OO RR AA LLPP RR EE SS EE NN TT AA TT II OO NN SS


Reverse Logistics through Recycling: A Case Study from the Brewery Sector
Panousopoulou P., Manthou V., Vlachopoulou M. Dept. of Applied Informatics, University of Macedonia, Egnatia 156, TK 54006, Thessaloniki,
Greece [email protected], [email protected], [email protected]
Abstract Logistics has been recognised as a core competitive strategy, as global and electronic markets expand the interconnection across the boundaries of enterprises. Logistics include all the activities to move product and information to, from and between members of supply chain networks. Logistics has to take into account several economic and environmental factors that are important for customers and needs to respond to an array of pressures, such as regulations, consumers’ demand and need for cost reduction. Reverse logistics, a fairly new concept, comes as a response to these pressures, and it is used as an alternative business strategy. It is a process whereby companies can become more environmentally efficient through recycling, reusing and reducing the amount of material used. In this paper the necessity and motivation for reverse logistics, are defined and the activities and processes of them are described. Furthermore, the obstacles that a company may face during the implementation of reverse logistics are examined. Finally, a case study of a Greek leading company in the brewery sector, which through recycling began to develop reverse logistics, is presented.
Keywords environment, recycling, returns management, reverse logistics, reuse.
1. Introduction
Logistics, as it is defined by the Council of Logistics Management (CLM), is the process of planning and controlling the effective flow and storage of goods, services, and related information from point of origin to point of consumption for the purpose of conforming to customer requirements. Logistics in the globalized business world is the strategic key that can enhance competitiveness over the long term. Serving the customer in the best, most efficient and effective manner has become critical, and information about issues such as order status, product availability, delivery
schedules, and invoices has become a necessary part of the total customer service experience. Timely and accurate information is now more critical than ever before to reduce resource requirements to a competitive level. A well know activity of Logistics, Reverse Logistics, is an aftermarket activity that a company can develop, that can also play a key role for improving the services to the customers, creating value at marginal costs or be the answer to environmental regulation. Reverse Logistics has become an important issue, primarily because retailers have been forced, due to increased competition, to take liberal stand as far as returns are concerned (Meyer 1999).
One of the most important dimensions in the area of reverse logistics is recycling and reuse. The reverse logistics of recycling has been discussed much in the literature (Stock 1992, Pohlen and Farris 1992, Fleischmann et al. 1997, Ritchie et al. 1999, Klausner and Hendrickson 2000, Tibben – Lembke and Rogers 2002). Reuse and Recycling began to be considered a serious subject for companies, when recycling laws were set as standards in many countries.
According to the CLM book (1993) “Reuse and Recycling, Reverse Logistics Opportunities”, recycling is a process, which includes, collection of recyclable materials from waste generators, process of recyclables materials in order to be usable again (they are called secondary), use of these secondary products for manufacturing new products and finally send these products to the market. In contrast, reuse is a process in which products are processed, in order to become raw materials again. Reuse products may also be refurbished or repaired and used again in their original form.
The German Waste and Packaging Law was enacted in April 1991 and under this law, manufacturers, distributors and retailers were responsible for recycling packaging waste (Walter, Spengler, 2005). Many other European countries also establish recycling laws, which covered curbside collection requirements, commercial recycling requirements and more
1
“Sustainable Management and Development of Mountainous and Island Areas”

general mandates for local governments to establish recycling programs. One of the most important regulations that European companies follow is the European Directive 94/62/CE, which is about packaging and package waste. By this regulation packaging manufacturers and manufacturers who use any type of packaging ought to recover a percentage of what they place on the market. By this way companies are induced to reuse or recycle and at the same time reduce the environmental impact of packaging waste, thus increase levels of environmental protection (Pilar, Adenso, Hakim, 2003).
At this point it is useful to clarify the differences between Reverse Logistics and other relevant terms such as returns management, waste management and green logistics. Returns have existed from the first time anyone manufactured products or opened a store, but what has changed in recent years is that people started to focus on the real costs involved in returns with returns management (Rogers, Tibben-Lembke, 1999). Products and packaging return for a variety of reasons, but they can be divided between those returns that are planned and desired and those that are unplanned (Subramaniam, 2004). Returns management is the process of moving goods from their final destination for the purpose of capturing value or proper disposal (Reverse Logistics Executive Council, 1999). Returns management focuses on returns authorization and the transport of goods back to the retailer or manufacturer and the issue of credit to the customer. Some times returns are arriving faster than processing or large amount of returns are kept as inventory in the warehousing for a long time. Cases when the company cannot evaluate the total cost of the return process, or when there are returns in the warehouse that are unidentified or unauthorized, are considered problematic. Reverse Logistics can be a solution for the effective handling of returns.
Reverse logistics is a more comprehensive process that focuses on the movement and management of products and resources from the customer back through the supply chain to the point of final disposition (http://www.fedex. com/us/customersupport/supplychain/faq/rm.html#topthree12).
Waste management mainly refers to the effective collection and processes of products that have no new use and are considered waste (De Brito and Dekker, 2002). The term of green logistics, or ecological logistics, describes all the necessary actions that a company could take, in
order to minimize and understand the ecological impact of logistics (Carter and Ellram, 1998). In particular, green Logistics refers to environmental aspects of all logistics activities and concentrate specifically on forward logistics (Wu and Dunn, 1995). In green logistics long – run environmental impact is taken into account until the end-of-life of the product (Gungor and Gupta, 1999).
The aim of this paper is first to describe reverse logistics, their activities and processes. Secondly, to present the benefits that a company can gain by implementing them, as well as, the obstacles that it might face during their implementation. Finally, a case study of a company which develops reverse logistics through one of the most important activities of them, recycling, is analyzed.
2. Reverse Logistics
Reverse logistics encompasses logistics activities such as network design, information flow, transportation, inventory, warehousing, material handling, and packaging all the way from products no longer required by the last user to products again usable in a market (Fleishmann 1997). Although reverse logistics act in similar fields with forward logistics there are many differences between them.
A reverse logistics flow has much less visibility and therefore is more difficult to react than in forward logistics. Companies initiate forward logistics activity as a result of planning and decision making, while they consider reverse logistics a response to actions by consumers or downstream channel members and not a part of their decision system (Tibben - Lembke, Rogers 2002).
The most prominent difference between forward and reverse logistics is this of product flow. In forward logistics the products flow from the manufacturer towards the consumer, while in reverse logistics the flow is from the end user to the manufacturer. In both flows, there might be inventory storage (Richter & Sombrutzki, 2000). In Reverse logistics flow, defective units and other problematic products are entered, while in forward logistics flow, finished products are sent to customers at the requested time.
In reverse logistics at the time of the return, information about the item and its condition may be entered into the manufacturer or retailer system and forwarder to the returns-processing center (information flow). Unfortunately, this
2
“Sustainable Management and Development of Mountainous and Island Areas”

information capture rarely occurs, or is inaccurate (Lembke – Tibben & Rogers 2002). On the contrary, the information flow in forward logistics is of great importance and considered the key for effective management. Regarding technology and information systems that are involved in reverse logistics, in most cases they are the same with these of forward logistics. There is a gap in IT technologies that cover the needs of Reverse Logistics. An example is the standard enterprise resource planning systems (ERP) that are used by the majority of companies for their forward logistics and are not effective to support the functional capabilities of reverse logistics. Finally, cash flow in reverse logistics are in terms of credits or discount. Customers that return the product because it is damaged expect to receive a refund or a new product if there is a warranty. In forward logistics the customers buy goods with cash or credit cards (Rogers, Tibben-Lembke, 2002). It is estimated that reverse logistics costs account for almost one percent of the total United States GDP (http://www.rlec.org/) with an estimate of 6 percent of all goods may be returned goods. Dell Computer Corp. have about 5 percent of its online computer purchases returned, (http://www.ebizq.net/topics/int_arch/ features/2589.html?page=2).
In some cases companies are forced to set up reverse logistics because of environmental regulations. Nowadays, ecology is very much considered both from the governments and citizens. Many governments make laws for recycling of products, making best use of parts and recycling the raw materials. Many products are subject to environmentally – driven legislation of the European – Community: due to manufacturer responsibility, they will be obliged to guarantee and finance product take-back and recycling (Schultmann, Zumkeller & Rentz, 2005).
Moreover, as several countries require companies to take back packaging as part of their environmental initiative, the activities of reverse logistics became essential for the viability of some companies. There are also other regulations that require producers to accept products at the end of their life cycle. Characteristic examples are these of car batteries, tires and white devices. Reverse logistics can play a very important role in collecting and disposing these items appropriately.
It is worth mentioning some of the application areas of reverse logistics, in order to prove that it is a business practice for many companies and not just a theory that some companies want just to present it as environmental necessity.
Examples of Industries in which, reverse logistics plays, an important role, are presented below:
Publication houses They take back and unsold volumes for reuse by 40 – 50% (Carvajal 1996, Kish 1997, Stevens and Grover 1998)
Beverage Industries They collect empty pallets and bottles in order to reuse them, after cleaning them. A characteristics example is this of Michigan beverage distributors and retailers have been mandated by law to collect empty beverage containers for recycling purposes (Goldsby & Closs, 2000)
Heave Industries Industries of iron and steel collect and reuse the waste (Downlatshahi, 2000)
Pharmateutical Industries They collect the expired formulations and drugs in order to dispose them in an environmentally friendly way. A characteristic example is this of Manchester Royal Infirmary pharmacy (Ritchie, Burnes, Whittle, Hey, 2000).
Automobile Industries They use recycled materials, which have the same functionality as new ones with no additional costs or even with lower costs and try to maximize the use of materials recovered from the end-of life products (cars). Ford Motor Company is a leading company in this area, which also makes an effort of manufacturing a car that comes close to being recyclable (Ferguson & Browne, 2001).
2.1 Activities
There are several activities involved in Reverse Logistics, which have been analyzed and examined by many authors (Koepfer, 1993; Krupp, 1993; Thierry et al., 1995; Carter & Ellram, 1998; Marcia 1999, 2000; Dowlatshahi, 2000; De Brito & Dekker, 2002; Gonzalez – Torre, Adenso – Diaz & Artiba, 2004; Kurtcan, Saglaam, Fzgorler, 2005). These activities can be broken into two big areas, depending on whether the reverse flow consists of products or packaging. Products could be in the reverse flow for several reasons such as remanufactured, refurbishment, etc, and packaging materials
3
“Sustainable Management and Development of Mountainous and Island Areas”

flows back either because they are reusable (e.g., pallets, plastic totes), or because regulations restrict their disposal. Below there is a list, based on the book of Rogers and Tibben-Lembke 1998 and Thierry et al. 1995, with all the possible activities that can insert products or packaging into the reverse flow. ProductsReturn to Supplier, Resell as new, Sell via Outlet Salvage, Recondition, Refurbish, Remanufacture Reclaim Materials Donate to charity Recycle PackagingReuse, Refurbish Reclaim Materials Recycle Salvage
Regarding products, the first preference of the retailer/supplier is generally to sell the returned product as new. If this cannot be done, the next more profitable preference is a full refund from his supplier (only in cases that there is an agreement about whether the product can be returned and under what conditions). If the return is not possible, then the product might be sold via an outlet store, or web auction, which generally reduce profits, but still is sufficiently profitable for the company. It is obvious that according to the product, before it is being resold may need to be remanufactured, refurbished or reconditioned and certainly repackaged. Another possibility is to be sold without any processing, in a “secondary market”, where products are sold or bought there because, for several reasons cannot be sold in the primary channel. In these markets there are customers or brokers that are willing to buy almost any product in any condition, in order to sell them in low-priced outlets, or perhaps overseas (Tibben – Lembke and Rogers 2002).
Furthermore, there is the possibility of dismantling the product and use some spare parts that are in good condition either for manufacturing new products or selling them to the market.
Donating to charity is another option, which depending on the country laws may generate tax advantages for the company, or develop its social interface (Rogers, Tibben-Lembke, 1999). Finally, if the product cannot be resold or refurbished it might be sold for recycling.
Regarding packaging materials, it is simply a matter of economics to take them back and reuse them for several times until they are recycled.
There are several case studies of companies that made significant savings from using environmentally friendly packaging. (Dole Fresh Vegetables, Carrefour, etc)
Generally, within specific industries, reverse logistics activities can be critical for the firm. When the value of the product or package is large, or the return is great, much more effort need to be spent on improving return processes.
2.2 Processes
The topic of reverse logistics is known to be rather complex, as there are several reasons for products being returned. Products can be sent back for damage, seasonal inventory, restocking, salvage, recalls, excess inventory, etc. After they are returned they will be processed, and the four main reverse logistics processes are presented in Fig.1.
Collection: with this process the products are brought from the customer to a point of recovery. The transport and the authorization of what is returned are defined by the return management of the company. The point of collection may be the same with the point of manufacture or a third Company that does the recovery processes for several companies.
Inspection / sorting / selection: in this phase according to the recovery options and after the products are inspected for their quality, they are being sorted and forwarded to the recovery route. Here there might be the option (depending on the product) of dismantling or split up the products into parts. After testing the condition of the spare parts, the suitable are selected ones and continue to the next phase.
Collection
DirectRecovery, Reuse
Repair, Retrieval
Remanufacture, Refurbish, Reuse
Recycle
Redistribution
Inspection / Sorting / Selection
“Figure 1: Reverse Logistic Processes”
4

Re – processing or direct recovery: In this phase, there are two options direct recovery and reprocessing. In the case of direct recovery the products that are in good condition are sold at a discount rate or at a secondary market (re – sale), after changing their packaging. In case of re-processing there might be products that need repair (warranty returns), products that would be remanufactured (products that after being repaired can be sold as new ones) and products that would be recycled.
Redistribution: in this phase, the recovery goods will be brought to the market. The distribution channels that will be used may be the already existing logistics channels. There is also the possibility of developing channels just for the products that come out from reverse logistics processes, because the products cannot distribute to the market from the existing forward logistics’ channels.
2.3 Benefits
Effective reverse logistics is believed to result in direct benefits, including improved customer satisfaction, decreased resource investment levels, and reductions in storage and distribution costs (Guintini and Andel, 1995a; Andel, 1997). Reverse logistics can significantly impact a company’s bottom line by recapturing value (Andel, 1997; Clendenin, 1997; South, 1998). In fact, if a firm does reverse logistics well, it will make money (Stock 1998). Recovery of products for remanufacturing, repair, reconfiguration, and recycling can create profitable business opportunities (Giuntini and Andel, 1995b). Companies that are able to take advantage of economies of scale may do especially well. Reverse logistics also influences customer service/satisfaction. For example, the ability to quickly and efficiently handle the return of a product for necessary repair can be critical (Blumberg, 1999).
Reducing production costs is one of the benefits that companies consider as their main motive for implementing reverse logistics. Xerox, for example saves hundreds of million of dollars by disassembling its photocopiers that no longer work and then clean, sort and repair components and recycle residual materials (Hoffman 2000).
Another trend for companies is to promote an environmentally responsible image by enacting reverse logistics programs, in order to strengthen the environmental image of their
brand. Increasing the use of recyclable materials and becoming an industry leader in environmentally friendly practices such as reverse logistics, in many cases seems to have great positive influence in the market (King, Mackinnon, 2002).
Moreover, meeting customers’ expectations are driving some companies to become increasingly involved in product recovery through reverse logistics (Thierry et al., 1995). Some companies are recovering products to meet growing customers demand for products with recycled content. In the computer industries, for example, Dell collects PCs from their commercial customers in the US, as a service associate with the sale of equipment (Fishbein, 2000).
Aftermarkets are the markets for parts and accessories to maintain or enhance a previous purchase, and they are often quite lucrative for some companies (Benjamin Klein, 1996). By implementing reverse logistics, companies can gain part from these aftermarkets. Lexmark for example offers discount to customers who agree to return their Lexmark printer cartridges to Lexmark for remanufacturing and then selling them as used ones to other markets (Hauser and Lund).
Finally, some firms are trying to follow the pressure for new legislation by improving their own performance or by implementing environmentally friendly practices in their processes. The more characteristic examples are in Germany, where companies of different sectors agreed to take back their products when they could no longer be used, without any charge (Rees, 1997).
Generally, one can say that companies get involved with Reverse Logistics because they can profit from it and provide to their customers timely and efficient service, or because they have to, and because they “feel” socially motivated to do it (Dowlatshahi, 2000).
2.4 Barriers
No matter how significant the importance and necessity for Reverse Logistics is, there are many difficulties in attempting to implement reverse logistics strategies. In the literature many authors, (Thierry & Salomon & Nunen & Wassenhove 1995, Rogers and Tibben – Lembke 1998, Landers & Cole & Walker & Kirk 2000, De Brito & Flapper & Dekker 2002, Daugherty & Myers & Richey 2002, Ravi & Shankar 2004),
5
“Sustainable Management and Development of Mountainous and Island Areas”

have analyzed the obstacles that a company has to face when it tries to develop reverse logistics processes. With the legislative measures tightening up the last decades, there are not many options left for the companies, but to go for reverse logistics practices. Reverse Logistics in many cases still is treated like a necessary evil of returns of the logistics process. The reasons that reverse logistics are treated this way are:
Near 40% of the companies believe that reverse logistics is not a priority for their firms (Rogers & Tibben Lembke, 1998). The implementation of reverse logistics may hide risk for the top management as it involves financial and operational aspects, which may change the performance of the company or may drive the company far from its goals.
Top managers pay very little attention to the reverse logistics practices that their company can develop. Their main concept is to create a brand image for the customers, that includes only virgin products. This has a major effect of not handling the returned products as profitable as they could (Shankar, 2004). There is also lack of commitment on the part of senior management. Senior management should show commitment in the form of dedicating a team of individuals and software for implementing successfully reverse logistics. Efficient leadership is also needed to provide value to reverse logistics programs. The top management should demonstrate the same commitment to the reverse logistics activities and to other organizational goals and try to integrate all members of the supply chain to this direction (Mintzberg, 1973).
There is a lack of information and technological systems (Rogers and Tibben-Lembke, 1998). An efficient information and technological system is necessary for supporting the reverse logistics during various stages of the product life cycle. Relating the product return with a past sale can support forecasting of product returns and help the inventory management. Another important issue is the efficient tracking and tracing of the returns of the product, with the minimum extra costs, which can be achieved only with the proper information system for returns.
People avoid changes when possible. Most companies started with some reverse logistics activities without having a clear reverse logistics vision, thus confusing the majority of the employees about their duties and the company’s policy (http://www.sydney.foe.org.au/ SustainableConsumption/epr_pamphlets/reusable
_pack.html). Education and training are prime requirements for achieving success in implementing reverse logistics. Companies require allocation of funds and other, since cost considerations are the prime challenge for each new activity. The present environment must be changed in order to be able to handle return products and make the necessary processes for reusing, remanufacturing, recycling, etc (http://www.wsra.net/pdf/Minutes%201-12-01.doc).
3. Empirical Study
This section, refers to a case study conducted at a leading company of the brewery sector. The case investigates the implementation of reverse logistics through recycling. The case study initially introduces the company, its structure, its background, and its environmental policy. Moreover, reverse logistics processes and activities are examined.
3.1 Case study design
The method chosen for this study was research by case study. A visit to the production area was performed and all production lines (three) were observed in order to understand the production procedure for the company’s two main products beer and water. The education manager presented the company’s environmental design and SHE (Safety, Health, Environment) policy, which gave us all the necessary information about the motivation of introducing reverse logistics through recycling in the company. Finally, the environment manager explained to us the recycling procedure after the products enter to reverse logistics processes.
3.2 Company overview
The company was founded in 1864 in central Europe and today has factories all over the world. The company recorded revenues of 10,005 million Euros during the fiscal year ended December 2004, an increase of 8.1% over 2003. The operating profit of the company during fiscal 2004 was 1,248 million Euros, an increase 2.1% over fiscal 2003.
The company is the third largest alcohol company and the second largest brewer in the world. Besides manufacturing and selling beer, the company also distributes soft drinks and other nonalcoholic beverages. The company
6
“Sustainable Management and Development of Mountainous and Island Areas”

operates in more than 170 countries across Europe, North and South America, Africa and the Middle East, and the Asia Pacific region. It is headquartered in Amsterdam, the Netherlands and employs about 61,700 people. In Greece there are four factories (Athens, Thessaloniki, Patra, Volos).
The company has shaped responsible management in environmental issues from its very beginning, due to its social standards and values. This responsibility has not diminished as the company has grown, no matter how successful it became.
The company has developed in all its factories around the world green logistics. It has included activities in its production, such as ISO 14000 certification, reducing energy usage of logistics activities and reducing usage of materials, which are activities of green logistics.
From the production of the raw materials to the disposal of the waste products, the company is conscious of its responsibility for environmental management within its logistics processes. They seek through all their activities to minimize environmental impact through efficient use of raw materials and selection of the most environment – friendly alternatives. Also the profit from the returns of their products or packaging materials is another big issue that they achieved by implementing reverse logistics processes.
The executive board of the company formulated the company’s Values & Principles in 2001, which were the same for all factories in all countries that the multinational company has action. The objectives that were set, by the executive board, will be presented in brief, showing that company’s direction is continuous improvement of its environmental safety and health performance. Some of these objectives are:
Promotion of environmental management within the supply chain Feasibility study of alternative uses for brewers grains Development of recycling processes
3.3 The Greek factory
Thessaloniki’s factory started its operations 100 years ago and is located in its industrial area. Since 1999 when ISO 14001 certification was introduced to the factory, managers were convinced that, reverse logistics and recycling, could ensure many benefits for the company in
the local market and for the image of the multinational company in the world. The plant is divided into two big areas very close to each other, one consists of the production area and the offices and the other the warehouse, the parking of the company’s truck and the special places for collection recyclable materials. The main reverse logistics activity that the company has developed is this of recycling.
The materials that the factory takes as returns and then recycle are: glass from the bottles of beer and water, aluminum cans of beer, plastic bottles of water and packaging materials (pallets and beer boxes). But due to the environmental policy of the company, the factory has developed recycle activities for other materials that are used in their office and the production such as paper (from the labels), shrink foil (packaging materials from their raw materials), barrels (metal or plastic, which consist oils or lubricants of the machines), batteries, inks and several steel waste (that come from machines, pipes etc that could no longer be used and should be destroyed).
The company started recycling in the early 90’s and today recycles all the materials that can add profit to the company. The materials that are recycled come back to the factory either by the reverse logistics processes or they are collected around the production area, offices and warehouse and sent for recycling.
One important factor for the successful implementation of reverse logistic processes and recycling is the location of the factory, which is in the industrial area of Thessaloniki. In this area most of its suppliers are located and therefore the reverse flow of the materials that are going to be recycled is less expensive.
The company invested on machines, technology and has landscaped the area around its warehouse for storing the recyclable materials. Top managers, from the beginning had as a target to create a brand image for the customers that included recyclable and environmental friendly products. Top management also show commitment for the reverse logistics processes and tried to integrate all members of its supply chain to this direction.
Furthermore, it spent time and money on training its employees, in order to make everyone understand the necessity for recycling and the extra processes that entered in the production, distribution and quality control. The two components of education and training of the employees are of prime interest for achieving
7
“Sustainable Management and Development of Mountainous and Island Areas”

success in implementing reverse logistics. The company early realized that investment reuse and recycling, only benefits and competitive advantage can offer.
3.4 Reverse Logistics processes
In this section the reverse logistics processes of the company are described. The reverse flow of the materials that the factory takes as returns from the consumers to the super markets, stores that sell drinks, restaurants and bars back to the factory. The returned products are collected to the warehouse of the factory. After the arrival of the materials to the warehouse they are inspectedand separated and each one follows its different root of recycle.
Glass BottlesThe empty glass bottles are transferred to the
factory with the same trucks that they deliver the orders to the customers. When an order is sent to a customer, it is arranged whether this truck will take empty bottles and the discount that will be given to the customer for the return of the empty bottles. After the glass bottles arrive at the factory, they are inspected and separated to these that can be reused and those that will be sent back to the supplier of glass for recycle.
The bottles, that can be reused, get in the special laundry to be washed. There their label is unglued and the clean bottles are forwarded for bottling to the suitable production line. The redistribution of the bottles is done through the already existing logistics systems. It is worth saying that the procedure that was described above is automatic and the laundry is an extension of the basic production line. Each bottle, according to the condition that is returned each time, can be reused 30 to 60 times.
The bottles that cannot be reused (usually because they are cracked or have some broken parts) are smashed into pieces and the glass is sent back to the supplier of glass bottles. Together with these quantities of returned glasses, quantities of glass from bottles that were damaged through bottling and were taken out the production line are sent back to the supplier.
Due to the fact that the company has two main glass bottles, green and brown, they are separated according to the color and sent to the supplier by this way, which leads to the production of new glass bottles with less cost. With these procedures of selecting and recycling the company has minimized 70% the cost of glass as raw material.
Labels – Paper When the bottles get in the laundry to get
washed, the labels are separated from the bottle and they end in a special place of the laundry. After they are dried, they are collected in plastic containers outside the production area and once a month they are sent to the supplier of labels for recycling. In order to improve the phase of “separating” the bottle and the label the company in 2000, decided to use more expensive but more water-soluble glue.
The paper labels together with all the other paper that is collected in special cans for recycling all around the factory (offices, warehouse, training room etc) is sold to the supplier of labels or 2 other big companies of paper recycling.
The plastic containers that are used for the collection of the used labels are used several times and when they are no longer useable (due to damages that may be caused during transportation) they are also sold to the supplier for recycling.
Aluminium cansDue to the fact that aluminium is one of the
most popular recyclable materials, the company does not take back aluminium cans from its customers. Most of them have a contract with a recycling company for selling the used aluminium cans or throwing them to the special cans for aluminium that are all around city. The cans that the company recycles are these that are collected in the special trashcans that are located around the factory and these that are rejected after quality control during production and packaging.
Packaging materialsThere are two categories of packaging
materials that the company has in its reverse logistic processes, these that are for packaging the bottles and the cans for storing them or sending them to its customer and these that raw materials are packed in.
The first category is the packaging materials that are sent back, as returns from its customers and they are pallets and plastic boxes. The packaging materials are returned to the factory together with the empty bottles. The procedure is the same with this of empty glasses and the collection of packaging materials is done to the warehouse of the factory.
The pallets that are collected to the warehouse are separated to these that can be reused, these that need to be fixed and these that are totally destroyed and will go for recycling.
8
“Sustainable Management and Development of Mountainous and Island Areas”

The plastic boxes are separated to these that can be reused after cleaning and to these that will be recycled. The plastic boxes, that will be reused, get in a special laundry that is at the beginning of the packaging line and after they are cleaned they are ready to be used as new ones and pack the bottles. All the packaging materials that will be reused are redistributed through the existing logistic channels.
In the second category there are materials such as barrels, naylon (shrink foil), plastic containers and material of distracted plastic crates. There are special areas in the warehouse for collecting these materials and when there is enough quantity, a recycling company that has contract with the factory, goes to the factory and take the recyclable materials. The profit for the company comes from selling these recyclable materials.
3.5 Other recycling activities
As one of the most important objective targets of the company around Europe is the environmental awareness, Thessaloniki’s factory managers try to follow environmental management with all possible recyclable materials.
Apart from the materials that are described in paragraph 3.4, the factory expands its recycling activities and therefore its reverse logistic processes. It recycles steel barrels, used cables, steel waste that comes from old machines, pipes and generally steel materials from the production area that can no longer be used and batteries. Waste lubricants, from the machines, is another material the company does not landfill due to environmental considerations and sell them to a company that after several processes they turn them to other kinds of useful oils.
Over the last five years as there is an increase for recycling of electronic equipment and companies provide such equipment offer discounts to their customers that send back inks, end of life printers and copiers. Therefore the company made special cans for consumable materials of laser printing and copying machines, inks etc and also collect for recycling all electronic quipment that can no longer used. The profit for the company comes from selling these recyclable materials. For these materials the reverse flow is from the factory to the supplier.
4. Conclusion
Reverse logistics helps in understanding why products are returned, detect possible quality problems, or other problems such as labeling, wrong quantities etc. Reverse logistics may offer a competitive advantage to companies that want to reduce the number of returns and increase the value of used goods.
The companies that decide to enter the business of reverse logistics need to understand that they require full-time management which is something that cannot be done occasionally or when there is free time from the other business activities. It is wrong to consider that reverse logistics is forward logistics in reverse. It is also essential for companies to understand that cost reduction is not the only benefit that reverse logistics can offer to them. This will help them to overpass all the possible barriers of obstacles that may appear during the implementation of reverse logistics.
In this paper the activities and processes of reverse logistics of returned materials and of packaging materials are analyzed and the benefits and obstacles are described. Finally a company that started developing reverse logistics by recycling is analyzed. The company through recycling manages to recapture value from most of its products and reduce its packaging and distribution costs. By developing recycling the company also promotes an environmental responsible image, which strengthen its competive position to the local market and helps the multinational company to present environmental concious global policy.
Recycling may be considered one of the first activities that many companies can insert in their processes successfully and is introducing reverse logistics and its activities to the business world.
5. References
[1] Andel Tom. Putting Returns to work. Material Handling Management September 2004; Vol. 59, no9, pp. 35 - 43.
[2] Anderson H., Brodin M. The consumer’s changing role: the case of recycling. Management of Environmental Quality 2005; Vol. 16, no.1, pp. 77-86.
[3] Autry Chad, Daugherty Patricia, Richey Glenn. The challenge of reverse logistics in catalog retailing. International Journal of Physical Distribution & Logistics
9
“Sustainable Management and Development of Mountainous and Island Areas”

Management, 2001; Vol. 31, no.1, pp. 26 – 37.
[4] De Brito M., Flapper S., Dekker R. Reverse Logistics: a review of case studies Econometric Institute Report EI 2002-21, May 2002.
[5] De Brito, M.; Dekker, R.: A framework for reverse logistics. Econometric Institute Report EI 2002-28, October 2002.
[6] Dekker et al. (Ed.). Reverse Logistics, Quantitative Models for Closed Loop Supply Chains, Springer, 2004; pp. 3-28.
[7] Dowlatshahi. Developing a Theory of Reverse Logistics. Transportation – Freight/ Materials Handling Environment. May-June 2000; pp. 143 – 155.
[8] Ferguson N., Browne Jim. Issues in end-of-life product recovery and reverse logistics. Production Planning and Control, 2001; Vol 12, no.5, pp. 534 - 547.
[9] Gibbs Geoff. Ford Seeks to offload Kwik Fit. The Guardian, January 16, 2002.
[10] Guide, V.D.R; van Wassenhove, L.N.: The reverse supply chain. Harvard Business Review 2002; Vol. 80, no.2, pp. 25-26.
[11] Gungor Askiner, Gupta Surendra. Issues in environmentally conscious manufacturing and product recovery: a survey. Computers & Industrial enginnering, 1999; Vol. 36, pp. 811 – 853.
[12] Heineken Report 2004 – 2005 Safety, Health & Environment. http://www. heinekeninternational.com/content/live/files/ downloads/InvestorRelations/Heineken%20N.V.%202004-2005%20Sustainability%20 Report.pdf [31/5/2006]
[13] King Debra, Mackinnon Alison. Who Cares? Community Perceptions in the Marketing of Corporate Citizenship. In J. Andriof, S. Waddock, B. Husted and S.S Rahman, eds., Unfolding Stakeholder Thinking (London: Greenleaf Publishing, 2002)
[14] Mason Sarah. Backward Process. IE Solutions, August 2002, pp. 42 – 46.
[15] Pilar L., Gonzalez Torre, B. Adenso –Diaz, Hakim Artiba. Environmental and reverse logistics policies in European bottling and packaging firms. Int. J. Production Economics, 2004; Vol. 88, pp. 95 – 104.
[16] Pohlen Terrance, Farris Theodore. Reverse logistics in plastics recycling.
International Journal of Physical Distribution & Logistics Management Oct 1992; Vol. 22, no7.
[17] Rogers Dale S. An examination of Reverse Logistics Practices. Journal of Business Logistics 2001.
[18] Roy Anindya. How Efficient is your Reverse Supply Chain? Supply Chain Management. Special Issue. ICFAI Press.
[19] Ravi V., Ravi Shankar. Analysis of interactions among the barriers of reverse logistics. Technological Forecastin & Social Change 2004.
[20] Rogers, D./Tibben-Lembke, R.S.: Going Backwards: Reverse Logistics Trends and Practices. Reverse Logistics Executive Council, Reno; 1999.
[21] Schwartz Beth. Reverse Logistics Strengthens supply chains. Transportation and Distribution, May 2000; Vol.41, no5, pp. 95 – 100.
[22] Spengler, T.; Püchert, H.; Penkuhn, T.; Rentz, O.: Environmental integrated production and recycling management. European Journal of Operational Research, 1997; Vol. 97, pp. 308-326.
[23] Subramaniam Usha. Reverse logistic strategies and implementation: a pedagogical survey. Journal of the Academy of Business and Economics, March 2004.
[24] Tibben – Lembke Ronald S., Dale S. Rogers. Differences between forward and reverse logistics. Supply Chain Management, 2002; Vol.7, no.5, pp. 271 – 282.
[25] Thierry, M.C.; Salomon, M.; van Nunen, J.A.E.E.; van Wassenhove, L.N.: Strategic issues in product recovery management. California Management Review, 1998; Vol. 37, no.2, pp. 114-135.
[26] Toffel W. Michael. Strategic Management of Product Recovery, California Management Review, winter 2004; Vol.46, no.2, pp. 120 – 141.
10

The Reuse of Wastewater and Sludge Utilization on Forest Species
Vasilios N. Pantazis, Ioannis K. Kalavrouziotis, Yiannis Deligiannakis Department of Environmental and Natural Resources Management, University of Ioannina, G. Seferi
2, 30100, Agrinio-Greece, e-mail: [email protected]
Abstract. oday the reuse of treated municipal wastewater in land irrigation in Greece, constitutes a practical method of disposal which is expected to contribute decisively in the immediate future towards the handling and the minimization of the environmental problems arising from the disposal of wastewater on land and aquatic systems, with the simultaneous upgrading and restoration of polluted soils and recreation of green areas. The present paper reported the results from an experiment in which wastewater and sludge from W.W.T.P. of Agrinion, Greece can be used with caution for irrigation and fertilization of forest species grown under greenhouse conditions. The most important results concern the combination of sludge and wastewater in the treatments which increases the mortality of Cupressus Arizonica Greene and the use of sludge itself, which has a very good growth. The use of sludge in the treatments also increases the mortality of Cotoneaster integerrimus Med, while the combination with wastewater has very good growth indeed.
Keywords: Reuse, wastewater, sludge, irrigation, forest species
“Introduction”
A significant number of countries have been exploring the potential of municipal wastewater reuse, and their numbers have increased significantly during the past decade. The use of municipal wastewater for irrigation and sludge utilization has become more widely practiced not only in countries with a water deficit but even in countries with more temperate climate. The method as well as the extent of their use, however, vary according to the infrastructure and the local conditionsprevalent from country to country [2], [3],[4].
In the southern Sweden, reclaimed water, sludge, and trickling filter liquids were used on a poplar plantation (Salix sp.) for the purpose of comparison with traditional methods of cultivation [7].
In the area of Eastern Montreal, Canada, an experiment was carried out on four 30X33m parcels of land planted with Acer sacharrinum L, Fraxinus pennsylvanica Marsh, Salix discolor Muhl. in 5 rows of 20 plants each. The top soil was enriched with wood chips and with constantly increasing N content sludge from W.W.T.P. The results showed that the survival rates of Acer sacharrinum L. and Fraxinuspennsylvanica were 96 and 99 % respectively. For Salix discolor the survival rate was 70% for the first year, reduced to 57 % during the second year. During the second year, the height of Acer sacharrinum L. increased by 35 % and that of Fraxinus pennsylvanica by 33 %, while the diameter of the two plants increased by 93 and 100 % respectively. The height of Salix sp. Increased by 86 %. N and P concentrations in the leaves of the plants were proportional to the concentrations in the sludge added to the soil [5].
In the area of the Upper-Saint Laurent, the South Quebec, Canada Salix viminalis L., and Salix discolor Muhl were planted in three locations, two clayish and one sandy, enriched with varying quantities of sludge from biological treatment sewage plants. The results showed that Salix viminalis L., experienced greater growth than Salix discolor Muhl. [10].
In the area of Ojinaga, Chihuahua, Mexico, the saplings of Eucalyptus camaldulensis, Populus sp, Robinia sp, were planted with fencing 2X2 m in groups of seven rows and were irrigated with municipal wastewater 1-1.36 times more than the quantity required by the controls. The saplings exhibited very good growth, while the trees later experienced good height and diameter increases. Small differences were recorded both in height and in the diameter among the trees. In general, the model used correctly predicted the values actually recorded [1].
In the area 3 Km to the south from the city of Guyla, Southern Hungary, plantation of Populus euramericana, Populus robusta and Populus sp, was established and irrigated with municipal wastewater. The
11
“Sustainable Management and Development of Mountainous and Island Areas”

results showed considerable and fast growth of the trees. Wood production was just about the same with the control. The growth of the trees irrigated with wastewater was 4-7 times bigger than the control [13].
In Irakleion, Crete, the effects of municipal wastewater on a variety of forest plant species were studied. In this study, one year-old sapling of Eucalyptus camaldulensis,Acacia cyanophylus, and Populus nigra were replanted in October, 2000. Plants of Arundodonax were also planted in February, 2001. The plants were irrigated, with treated-municipal wastewater. The Populus nigraplants showed the greatest growth in height and those of Acacia cyanophylus the greatest increase in diameter. The greatest production of biomass was that of the Acacia plants, followed by that of Arundo donax, while the smaller was that of Eucalyptus sp. and of Populus nigra [12].
In the area of Upsala, Sweden, the plants of Salix viminalis were planted in eight lysimeters of which one pair was irrigated with municipal wastewater, while the other two pairs were irrigated with water containing the same concentration of nitrogen as that of the treated wastewater. Half of the lysimeters contained clay and the other half sand. The plants in clay showed greater growth than those in sand. As a result, wood production was double in the lysimeters with clay [6].
In the area at Rabbit Island near the Nelson city, New Zealand, the treated municipal sludge was applied on the 1000 ha plantation of Pinus radiata. The plots consisted of an untreated control, sludge with 300 kg/ha N and sludge with 600 kg/ha N. The results showed that there was a significant growth in the diameter and basal area and volume and a lesser but still significant response in height growth. The volume, and branch diameter as a response to the sludge over the control treatment was highly significant. Both sludge treatments produced significantly larger branches than the control treatment. Mortality was negligible. The trees with sludge treatment had the same growth with the control in smaller period of time[9].
In the area of Pistoia in Central Italy, municipal wastewater was utilized for the cultivation of forest plants. One year old saplings of Cupressus sempervirens, Juniperus horizontalis, Myrtus communis, Arbutus unedo, Spiraea japonica, andWeigelia florida were used. The results
indicated that municipal wastewater can be reused without any restrictions in the irrigation of forest plantations [11].
The feasibility of the use of wastewater and sludge from secondary sewage treatment plants have been studied in the cultivation of forest plant species. The forest plant species used in the study were Pinus brutia of Greek origin and Pinusmaritima from Corsica. The experiment consisted of four experimental plots, as follows: Plot 1: Sludge and irrigation with reclaimed wastewater; plot 2: Irrigation with reused water without sludge; plot 3: sludge and irrigation with ordinary water; and plot 4: irrigation with ordinary water. The results showed that Pinus brutia experienced low mortality rates, but no statistically significant differences were noted among the various conditions of the experiment. The highest mortality was observed in the plot where sludge and ordinary water were used. Pinusmaritima exhibited high mortality rated which were associated with the use of sludge. The smallest increase in height was recorded with sludge and reused wastewater, while the greatest increase took place in the plots where only sludge was applied or only reused wastewater was used in the irrigation of the plants. The use of sludge or reused wastewater only resulted in greater plant height even when compared with plant height in plots where ordinary wastewater was used for irrigation [8].
The present paper reports the results of an experiment concerning utilization of wastewater and sludge in Agrinion areas in Greece, in forest species, in the Greenhouse. It is, to the extent of our knowledge, the application of wastewater and sludge for irrigation and fertilization of forest species in Greece.
“Materials and Methods”
The main objective of the research was to examine the possibility of irrigating with wastewater and fertilizing forest species. Sludge was used during the planting phase inside the plastic bags in a percentage of 20 % of the substratum (80% soil and 20 % sludge). This paper concerns a whole year of the project.
From the forestry point of view, the following aspects were monitored:
12
“Sustainable Management and Development of Mountainous and Island Areas”

- Survival and mortality rates - Growth - Impacts of the different treatments on
soil- Impacts of the different treatments on
flora - Silvicultural issues (root and crown
development - Assimilation behavior of the plant for
different chemical elements (physiology) Wastewater for irrigation and sludge
for fertilization were used from the Waste Water Treatment Plant (W.W.T.P.) of the city of Agrinio.
The plants were provided by the Forest Service of Agrinio and were planted in plastic bags on December 2003.
In order to examine the impact of wastewater and sludge on various aspects of tree growth, an experimental design was drawn with five treatments. The five treatments were as following: - Treatment 1: Control (irrigation water only) - Treatment 2: Wastewater only - Treatment 3: Sludge and Wastewater - Treatment 4: Sludge and irrigation water - Treatment 5: Diluted sludge and Wastewater
This experimental design was followed for two different species, Cupressus Arizonica Greene. and Cotoneaster Integerrimus Med., and the results are presented here.
The seedlings were grown under greenhouse conditions, in vessels with natural soil from the area and 20 % of sewage sludge. In total we used 200 plants, for the four species and the five different treatments. Each treatment contained 10 seedlings from each plant and 40 plants in total.
“Results and Discussion”
a) Mortality
After a period of time (adaptation time) the plants were assessed for survival at the beginning, at the middle and at the end of the growing season. The mortality rates found for the two forest species are presented in Tables 1 and 2.
For Cupressus arizonica Greene mortality rates were small in Control, Control+wastewater, and Sludge +Control treatments and much bigger in Sludge+wastewater and Sludge (20%) + wastewater treatments. The mortality rates seem to be associated with the presence of sludge in the treatment. The use of sludge and wastewater individually seem to have no effect on mortality, but their combination gives higher rates of mortality.
For Cotoneaster integerrimus Medmortality rates were very small in Control and Control+wastewater treatments and much bigger in Sludge+wastewater, Sludge+Control and Sludge (20%) + wastewater treatments. Also the higher mortality rates seem to be related with the existence of sludge in the treatments. In general Cupressus arizonica Greene has smaller mortality rates than Cotoneaster integerrimus Med in all the treatments. Nevertheless, more elaborate silvicultural analyses related to root development are carried out to examine this fact. However, it is not within the scope of the present paper to extent towards these issues.
Table 1. Mortality rates of Cupressus Arizonica Greene (Actual frequenses and percentages)
Treatment Period of
Assessment Control Control +
Wastewater Sludge +
Wastewater Sludge + Control
Sludge (20%) + Wastewater
June 0 (0%) 0 (0%) 4 (40%) 1 (10%) 6 (60%) October 0 (0%) 0 (0%) 4 (40%) 1 (10%) 6 (60%)
December 0 (0%) 0 (0%) 4 (40%) 1 (10%) 6 (60%) Number of plants at the
start 10 10 10 10 10
13
“Sustainable Management and Development of Mountainous and Island Areas”

Table 2. Mortality rates of Cotoneaster Integerrimus Med. ( Actual frequenses and percentages)
Treatment Period of
Assessment Control Control +
Wastewater Sludge +
Wastewater Sludge + Control
Sludge (20%) +
Wastewater June 2 (20%) 0 (0%) 4 (40%) 5 (50%) 6 (60%)
October 2 (20%) 0 (0%) 4 (40%) 6 (60%) 7 (70%) December 2 (20%) 0 (0%) 4 (40%) 6 (60%) 7 (70%) Number of plants at the
start10 10 10 10 10
b)Tree Growth (Height)
The growth of the plants was measured three times in total, at the beginning, at the middle and at the end of the growing season. The growth was assessed by measuring the height of all survived plants (complete enumeration) from a marked point close to the soil’s surface up to the top of the crown. The mean height and growth of the two forest species are presented in tables 3 and 8.
In order to examine whether the mean height of each treatment is statistically different from the mean height of every other treatment an Analysis of Variance (ANOVA) was performed. It is evident that Cupressusarizonica Greene, at the end of the growing season, Sludge and Control treatment presents statistically significant higher increase in height as compared with the Control treatment. In addition Control and wastewater, Control, Sludge and wastewatertreatments presented statistically significant higher growth of height compared to Sludge (20%) and wastewater treatment. It should be pointed out that the treatment Sludge and Control resulted to higher growth than any other treatment followed by the Sludge and wastewater, Control and wastewater, Control and Sludge (20%) and wastewater treatment.
At the end of the growing season, Sludge and wastewater treatment presented statistically significant higher total growth of Cupressus arizonica Greene, than the Control treatment. Sludge and Control treatment presented statistically significant total growth than Control, Control and wastewater, and Sludge (20%) and wastewater treatment. It is
obvious that Sludge and Control treatment presented the higher total growth followed by Sludge and wastewater, control and wastewater, sludge (20%) and wastewater and Control treatment. The results, for the height, at the start and the end of the project and for the total growth for all treatments are presented in tables 3, 4, 5 and 6.
For Cotoneaster integerrimus Med ,at the end of the growing season, Control and Wastewater treatment resulted in statistically significant higher growth of plant height than Control and Sludge(20%) and Wastewater treatment. Sludge and Wastewater treatment presented a statistically significant growth of height than Control, Sludge and Control, and Sludge(20%) and Wastewater treatment. Sludge(20%) and Wastewater treatment presented statistically significant lower means from any other treatment, and especially from Control and Sludge and Control treatment. Sludge and Wastewater treatment resulted to higher growth than any other treatment followed by Control and Wastewater, Sludge and Control, Control and Sludge (20%) and Wastewater treatment.
At the end of the growing season, Sludge and wastewater treatment presentedstatistically significant higher total growth ofCotoneaster integerrimus Med., than Control, Control and Wastewater, Sludge and Control, and Sludge (20%) and Wastewater treatment. Sludge (20%) and Wastewater treatment presented statistically significant lower means from Control and Wastewater treatment. It is obvious that Sludge and Wastewater treatment presented the higher total growth followed by Control and Wastewater, Sludge and Control, Control and Sludge(20%) and Wastewater
14
“Sustainable Management and Development of Mountainous and Island Areas”

treatment. The results for the height, at the start and the end of the project and for the total
growth for all treatments are presented in tables 7, 8, 9 and 10.
Table 3. Mean height and growth of the different treatments for Cupressus Arizonica Greene in (cm)
Treatment Height (cm) Control Control +
Wastewater Sludge +
Wastewater Sludge + Control
Sludge (20%) +
Wastewater Height June 32,6 26,6 26,83 34,88 12,00 HeightOctober
47,3 51,00 57,66 69,44 32,50
HeightDecember
52,00 52,60 61,83 72,33 34,50
GrowthPeriod 2-1
14,7 24,4 30,83 34,56 20,5
GrowthPeriod 3-2
4,7 1,6 4,17 2,89 2,00
GrowthPeriod 3-1
19,4 26,00 35,00 37,45 22,5
Table 4. Statistical differences for height at the start of the project among treatments Cupressus Arizonica Greene. ( ANOVA ) (Tukey HSD, LSD)
Treatment Treatment Control Control +
Wastewater Sludge +
Wastewater Sludge + Control
Sludge (20%) +
Wastewater Control 6,0000*** 5,76666 20,600*** Control + Wastewater
14,600***
Sludge + Wastewater
0,23333 14,833***
Sludge + Control
2,28888 8,2888*** 8,0555*** 22,888***
Sludge (20%) + Wastewater
***Denotes that difference of means is statistically significant at the 5 % level.
15
“Sustainable Management and Development of Mountainous and Island Areas”

Table 5. Statistical differences for height at the end of the project among treatments Cupressus Arizonica Greene. ( ANOVA ) (LSD)
Treatment Treatment Control Control +
Wastewater Sludge +
Wastewater Sludge
+Control
Sludge (20%) + Wastewater
Control -0,6000000 -9,8333333 17,5000*** Control + Wastewater
18,1000***
Sludge + Wastewater
9,23333333 27,3333***
Sludge + Control
20,333*** 19,7333*** 10,500000 37,8333***
Sludge (20%) + Wastewater
***Denotes that difference of means is statistically significant at the 5 % level.
Table 6. Statistical differences for total growth among treatments Cupressus Arizonica Greene. (ANOVA LSD)
Treatment Treatment Control Control +
Wastewater Sludge +
Wastewater Sludge
+Control
Sludge (20%) + Wastewater
Control Control + Wastewater
6,70000 3,500000
Sludge + Wastewater
15,700*** 9,00000 12,50000
Sludge + Control
18,144*** 11,4444*** 2,4444444 14,9444***
Sludge (20%) + Wastewater
3,20000
***Denotes that difference of means is statistically significant at the 5 % level.
16
“Sustainable Management and Development of Mountainous and Island Areas”

Table 7. Mean height and growth of the different treatments for Cotoneaster Integerrimus Med. in cm
Treatment Height (cm) Control Control +
Wastewater Sludge +
Wastewater Sludge + Control
Sludge (20%) +
Wastewater Height June 26,62 29,9 24,5 30,00 8,5 HeightOctober
43,5 66,60 73,50 48,7 12,00
HeightDecember
48,37 67,0 82,50 53,50 13,66
GrowthPeriod 2-1
16,88 36,7 49,00 18,7 3,5
GrowthPeriod 3-2
4,87 0,40 9,00 4,8 1,66
GrowthPeriod 3-1
21,75 37,1 58,00 23,50 5,16
Table 8. Statistical differences for height at the start of the project among treatments Cotoneaster Integerrimus Med. ( ANOVA )
Treatment Treatment Control Control +
Wastewater Sludge +
Wastewater Sludge + Control
Sludge (20%) +
Wastewater Control 18,1250*** Control + Wastewater
3,27500 21,4000***
Sludge + Wastewater
-2,1250 -5,4000000 -5,5000 16,0000***
Sludge + Control
3,37500 0,1000000 21,5000***
Sludge (20%) + Wastewater
***Denotes that difference of means is statistically significant at the 5 % level.
17
“Sustainable Management and Development of Mountainous and Island Areas”

Table 9. Statistical differences for height at the end of the project among treatments Cotoneaster Integerrimus Med. ( ANOVA ) (LSD)
Treatment Treatment Control Control +
Wastewater Sludge +
Wastewater Sludge + Control
Sludge (20%) +
Wastewater Control 34,70833*** Control + Wastewater
18,625*** 13,500000 53,33333***
Sludge + Wastewater
34,125*** 15,500000 29,000*** 68,83333***
Sludge + Control
5,125000 39,83333***
Sludge (20%) + Wastewater
***Denotes that difference of means is statistically significant at the 5 % level.
Table 10. Statistical differences for total growth among treatments Cotoneaster Integerrimus Med.
Treatment Treatment Control Control +
Wastewater Sludge +
Wastewater Sludge + Control
Sludge (20%) +
Wastewater Control 15,750000 Control + Wastewater
15,3500 10,350000 31,1000***
Sludge + Wastewater
36,2500*** 20,900*** 31,2500*** 52,0000***
Sludge + Control
5,00000 20,750000
Sludge (20%) + Wastewater
***Denotes that difference of means is statistically significant at the 5 % level.
“Conclusions”
The most important silvicultural aspect concerns the selection of appropriate species. There is not scientifically valid technique for species selection rather than in field trial and error procedures. The present experiment has shown that the use of sludge and wastewater increases the mortality rates of Cupressus arizonica Greene, while the use of sludge alone allows significant tree height
growth. For Cotoneaster integerrimus Med. the use of sludge increases the mortality, while the combination of sludge and wastewater causes significant increment in the tree height. Both forest species should be regarded as a good candidate when similar experiments are carried out. When biomass production is considered among forest species Cotoneaster integerrimus Med. had the higher total growth and it should be preferred. Both
18
“Sustainable Management and Development of Mountainous and Island Areas”

forest species are adapted to the Greek environment, therefore the observed differences are rather due to the individualcharacteristics of the species. Of course, it is rather early to expect that possible pollution of the soil, will be detected. For this reason, long-term monitoring of soil properties is required.
“References”
[1] Al-Jamal, M.S., Sammis, T.W., Mexal, J.G., Picchioni, G.A., and Zachritz, W.H., (2002). A growth-irrigation scheduling model for wastewater use in forest production. Agricultural Water Management Vol. 56, Issue 1, pp. 57-79. [2] Anderson, J., (2002). “The environmental benefits of water recycling and reuse”, IWAregional symposium on water recycling in Mediterranean Region, Iraklio, Greece, 26-29 September, pp. 11-20. [3] Asano, T. (Editor) (1998). “Wastewater Reclamation and Reuse”, Book volume 10, Technomic Publishing, Cancaster-Pennsylvania, USA.[4] Bazza, M., (2002). “Wastewater recycling
and reuse in the Near-east region: Experience and Issues”, IWA regional symposium on water Recycling in the Mediterranean Region, Iraklio, Greece, 26-29 September,pp. 43-59. [5] Cogliastro, A., Gerald, D., and Daigle, S., (2001). Effects of wastewater sludge and woodchip combinations on soil properties and growth of planted hardwood trees and willows on a restored site. Ecological Engineering Vol. 16, Issue 4, pp. 471-485. [6] Dimitriou, I., and Aronsson, P., (2003). Nitrogen leaching from short rotation willow coppice after intensive irrigation with wastewater. Biomass and Bioenergy, Vol. 26, Issue 5, pp. 433-441. [7] Hasselgren, K., (2000). Use of municipal waste products in energy forestry: highlights from 15 years of experience. Biomass and Bioenergy Vol. 15, pp. 71-74. [8] Kalavrouziotis, I.K., Hortis, T., and Drakatos, P.A., (2004). The reuse of wastewater and sludge for cultivation of forestry trees in dessert areas in Greece. Int. Environment and pollution Vol. 21,Issue 6, pp. 425-439. [9] Kimberley, O.M., Wang, H., Wilks, J.P., Fisher, R.C., and Magesan, N.G. (2003). Economic analysis of growth response from a pine plantation forest applied with biosolids.
Forest Ecology and Management., 189 (1-3), pp. 345-351. [10] Labrecque, M., and Teodorescu, I.T., (2001). Influence of Plantation Site and Wastewater Sludge Fertilization on the Performance and Foliar nutrient Status of two Willow Species Grown under SRIC in Southern Quebec (Canada). Forest Ecology and Management Vol. 150, Issue 3, pp. 223-239. [11] Lubello, C., Gori, R., Nicese, F.P., and Ferrini, F., (2004). Municipal-treated wastewater reuse for plant nurseries irrigation. Water Research, Vol. 38, Issue 12, pp. 2939-2947. [12] Tzanakakis, V.E., Paranychianakis, N.V., Kyritsis, S., and Angelakis, A.N., (2002). Evaluation of wastewater treatment and biomass production by a slow rate system using different plant species. IWA Regional Symposium on Water Recycling in Mediterranean Region. Iraklio, Greece, 26-29 Septemper, pp. 353-360. [13] Vermes, L., (2002). “Poplar plantations for wastewater treatment and utilization in Hungary” IWA regional symposium on water recycling in Mediterranean Region, Iraklio, Greece, 26 - 29 September, pp. 297-300.
19
“Sustainable Management and Development of Mountainous and Island Areas”

A New Environmental Friendly Technology for the Production of Decay Resistant and Dimensional Stable Strandboard (OSB)
Antonios N. Papadopoulos
Technological Educational Institute of Kavala, Branch of Drama, Department of Forestry and Management of Natural Environment, Laboratory of Wood and Wood Products, TK 66100, Drama, Greece. E-mail [email protected], [email protected]
Abstract. The purpose of this paper was to evaluate the dimensional stability and decay resistance of oriented strand boards (OSB) produced from chemically modified strands. Norway spruce (Picea abies) ring-cut strands were acetylated by reaction with acetic anhydride at 1200C for periods of 30 and 60 minutes. The results indicated a weight gain of 11.2% and 20.4% respectively. Treated and untreated strands were used to form laboratory boards, which were tested in accordance with EN standards. Boards made from these acetylated strands exhibited significantly lower thickness swelling and water absorption when compared with the control. Acetylated OSB stakes were tested in ground contact in Western Greece. The stakes were conditioned, measured and placed in soil for three years. Half of the stake was below the ground line. After three years of testing, results showed that acetylation provides excellent protection against fungal attack.
Keywords. Acetylation, chemical modification, decay resistance, dimensional stability, OSB,
1. Introduction
Oriented strand board (OSB) is a structural reconstituted panel that consists of wood strands glued with an exterior-type, waterproof resin. In the last decade, OSB has gained significant growth in the structural wood based panel market. Global OSB capacity reached about 18.4 million m3 in 1997, with production at about 15.5 million m3 [9] of which 800,000 m3 were produced in Europe (personal communication, European Federation of Associations of Particleboard Manufactures).
According to the Engineered Wood Association, North American OSB output almost equaled plywood panel production in 1998. With less than 3.0 million m3 of plywood being produced in Europe, it is expected that OSB will soon surpass plywood as the dominant panel in the market. The primary reason, in addition to the cost and availability of logs, is that plywood manufacturing is a value-added process. As such, this industry employs four times as many people compared to the manufacture of substitute wood-based panels - using the same volume of logs. This opinion is further exemplified by the closure of the largest plywood plants in Germany and France.
A major difference in the performance of plywood and OSB is the greater thickness swell of OSB when exposed to high relative humidity conditions and/or in direct contact with water [10]. This stability characteristic is a direct result of the higher pressures needed to consolidate the OSB mat. Many researchers have studied the dimensional stability (thickness swell and water absorption) of particleboards as influenced by various processing variables, the most important being density, particle configuration and degree of bonding. An excellent review can be found elsewhere [1].
The objective of this study was to look at ways of improving the dimensional stability and the decay resistance of OSB through chemical modification the lignocellulosic strands. Lignocellulosic materials are potentially very reactive due to the abundance of hydroxyl groups on the polymeric units. The presence and availability of the hydroxyl group gives lignocellulosic material their strength and versatility, but it is also the reason for the problems that arise with lignocellulosics. The hydroxyl groups are in such large numbers that hydrogen bonding within and between the
20
“Sustainable Management and Development of Mountainous and Island Areas”

polymeric species occurs throughout the material. It is hydrogen bonding that allows hydrophilic substances like water to enter the structure and interact with the polymers and alter their properties. These gives rise to other problems such as microbiological decay.
Preservation of wood by conventional methods has long been established to prevent and eradicate wood-inhabiting fungi. Conventional wood impregnation methods (water or oil type preservatives) are based primarily on the use of chemicals such as creosote, inorganic arsenical salts and chlorinated phenols. Restriction in recent years due to environmental concerns, stability and longevity of its protectant action are some of the limitations imposed in the utilization of conventional chemical treatments. The consumption of preservative treated wood in Western Europe is estimated at 6 million m3 per year, with about 30,000 tonnes of toxic preservatives used. An alternative method of enhancing the durability of wood without the use of conventional biocides is chemical modification. Chemical modification as an innovation in the bioprotection of wood is accomplished by reacting the wood with selected chemicals, which modify the predominant wood components without leaving toxic residues within the wood. Anhydrides have a high reactivity to hydroxyl groups and the blockage of the alcoholic groups by the substituent molecule has been shown to occur using relatively simple reaction systems [4,7].
The natural reactivity of lignocellulosics can be utilized to enhance their properties with the resulting material being superior in terms of performance and versatility. The basic types of chemical modification use simple monofunctional modifying agents while others use difunctional, or even polyfunctional modifying agents. One of the most practical of these is the reaction of a hydroxyl group with acetic anhydride, known as acetylation [7]. The acetic anhydride replaces the hydroxyl groups in the wood with acetyl groups (by way of covalent bonds), and leaves the wood in swollen condition because of the bulking action of the acetyl groups within the cell walls.
2. Materials and Methods
2.1. Acetylation of strands
Norway spruce-cut strands (Picea abies)were used in this study, with average strand size of 75 mm x 20 mm x 0.75 mm (length x width x thickness). The strands were dried in an oven at 1050C to approximately 2.5-3% moisture content (MC). Control boards were made from strands dried to this MC. Strands, which were to be acetylated, were subjected to an additional 12 hr drying; to achieve a bone dried condition. The oven-dried strands were acetylated by impregnation with acetic anhydride (98% anhydride, 2% acetic acid) .The strands were reacted at 1200C for periods of 30 and 60 minutes in a reaction vessel. The vessel held approximately 700 gr. of dry strands, enough to produce one board. At the end of the reaction, the excess chemical was decanted from the vessel. The strands were removed and dried overnight at 1050C, prior to board manufacture. Weight percent gains (WPG) of 11.2% (Acetylated 1) and 20.4% (Acetylated 2) were obtained after 30 and 60 minutes reaction respectively, based on the oven dry weight of stands.
2.2. Board manufacture
Control and acetylated strands were resinated with a pneumatic atomising nozzle in a rotary drum blender with a 4% (dry weight basis) resol liquid phenol formaldehyde resin. The resin, GP 2341 type, was purchased from Georgia Pacific Corp. USA, and had 53% solids content, pH=10.0 and 82mPas viscosity. Circular mats were randomly hand-formed on a circular aluminium caul. Moisture content of mats was 5% when they were placed in the press. Mats were pressed to a target thickness of 12.5 mm, at 1800C, in a 30 cm diameter electrically heated hot press, for 5 minutes. Target board density was 650 Kg/m3. Three replication of each board were made, giving a total of 9 boards. Boards were manufactured in the laboratory of wood science and technology at the School of Agricultural and Forest Sciences (University of Wales, Bangor), in 2002.
2.3. Water soak test
The thickness swelling tests after immersion in water were carried out according to EN 317. Pre-weighed-measured oven-dried specimens,
21
“Sustainable Management and Development of Mountainous and Island Areas”

each measuring 50 x 50 mm, were immersed in water for 2 and 24 and 168 hours (1 week) at 200C. After each soaking, the specimens were wiped of excess of water, measured for thickness and weighed. The thickness swelling (TS) and water absorption (WA) was determined on the basis of initial oven-dry measurements.
2.4. Stake test
Four specimens (stakes) from each board, each measuring 300 x 50 x 12.5 mm, were conditioned, measured and placed in rich,moist, limestone derived soil in Kozani area in western Greece (village of Mikrovalto), for three years (March 2002 until March of 2005). The average monthly temperature and rain precipitation were recorded for 3 years and an ombrothermic diagram showing the period of the dry season in the exposure site (Figure 1) was drawn (data were taken from the meteorological station of Servia).
Each stake was placed in such a way that half of the stake was below the ground line. Stakes were rated below the ground line and thickness of each stake measured at the ground line.
010203040506070
1 2 3 4 5 6 7 8 9 10 11 12
Month
Tem
pera
ture
(°C
)
020406080100120140
Rai
n(m
m)
Figure 1. Ombrothermic diagram: Mean temperature of air ( ), Mean annual precipitation ( ). The period that the latter is below the former denotes the dry season.
3. Results and discussion
3.1 Thickness swelling The thickness swelling data are summarised
in Table 1. From this table, it can be seen that higher levels of acetylation resulted in
improved dimensional stability. Thickness swelling after 2 hours immersion in water of the control boards was nearly 2.5 and 6.5 times more than Acetylated 1&2 boards respectively. This tendency remained the same after both 24 hours and 1-week immersion in water. The minimum TS required by the EN 300 standard for OSB/1 is 25%. Control boards did not achieve this requirement, however, it must be pointed out that no wax was used in the manufacturing of the strand boards. The addition of wax can reduce TS substantially. The TS values obtained with Acetylated 1 boards were sufficiently high to be in accordance with the EN 300 for OSB/1 but they did not conform with the EN 300 for OSB/2 (TS 20%). The TS values obtained with Acetylated 2 boards were substantially better than Acetylated 1 boards and conformed to the more stringent requirements of EN 300 for OSB/4 (TS 12%)
Our results are in conformity with those made by other workers [5,6,7,8,] regarding the acetylation of particleboards and flakeboards.
Table 1. Thickness swelling (TS) of OSB.
Board type TS (%) 2 hr 24 hr 1 week
Control 44.12 50.4 57.3 Acetylated 1 17.8 20.4 23.9 Acetylated 2 6.75 7.9 8.2
3.2 Stake test
Table 2, shows the performance of OSB stakes during the testing period. Both control and acetylated boards were generally sound (non decayed) after the first twelve months of testing. Acetylated boards were remained sound by the end of the second year, while the control boards have shown moderate attack. After three years exposure in ground stake test, the high-acetylated OSB stakes were still completely intact, whereas the low-acetylated stakes were moderate attacked. The control stakes, on the other hand, were severe attacked.
Generally the results obtained in this study, are in conformity with those made by other workers [4] regarding the performance of acetylated fibreboards in ground stake test (in Sweden).
22
“Sustainable Management and Development of Mountainous and Island Areas”

Table 2. Decay rating of control and acetylated OSB in ground stake test (a rating of 10 means no decay, 9 slight decay, 7 moderate decay, 4 severe decay and 0 means no decay).
Decay rating
Exposure time
Control Acet/ed 1
Acet/ed 2
12 months 10 10 10
24 months 7 10 10
36 months 4 7 10
4. Conclusion.
The dimensional stability of OSB was greatly improved by acetylating Norway spruce strands with acetic anhydride. Our results are in general agreement with those made by other workers regarding the acetylasion of particleboards and flakeboards. It is suggested therefore that dimensionally stable industrial acetylated boards can be produced to satisfy international standards at lower resin dosing rates (4%) than is currently employed in the industry (6-8%) thereby offsetting some of the costs of acetylation. Finally, it can be stated considering these field results together with those for acetylated solid wood [2,3], that acetylation imparts excellent protection against decay, provided that a certain degree of acetylation is reached.
5. References
[1] Kelly MW. Critical literature review of relationships between processing parameters and physical properties of particleboard. USDA For. Serv. Gen. Tech. Rep FPL-10. Forest Products Laboratory, Madison, USA, 1977 [2] Papadopoulos AN, Hill CAS. The biological effectiveness of wood modified with linear chain carboxylic acid anhydrides against Coniophora puteana. Holz als Roh-und Werkstoff 2002, 60(5): 329-332.
[3] Papadopoulos AN, MD Hale, Hill CAS. Efficacy of linear chain carboxylic acid anhydrides as wood protection chemicals. International Research Group on Wood Preservation. Cardiff, Wales, U.K. , 2002 (Document No. IRG/WP 02-30295). [4] Rowell RM, Dawson BS, Hadi YS, Nicholas DD, Nilsson T, Placket DV, Simonson R, Westin M Worldwide in-ground stake test of acetylated composite boards. International Research Group on Wood Preservation Whistler, Canada. 1997 (Document No. IRG/WP 97-40088). [5] Rowell RM Tillman A, RM Simomson. A simplified procedure for the acetylation of hardwood and softwood flakes for flakeboard production. Journal Wood Chemistry and Technology 1986, 6(3): 427-448. [6] Rowell RM, Wang RHS, J.A Hyatt. Flakeboards made from aspen and southern pine wood flakes reacted with gaseous ketene. Journal Wood Chemistry and Technology, 1986, 6(3): 449-471. [7] Rowell RM. Chemical modification of wood: Advantages and disadvantages. Proceedings American Wood Association, 1975, 71, 41-51. [8] Rowell RM, Imasura Y, Kawai S, M Norimoto. Dimensional stability, decay resistance and mechanical properties of veneer-faced low-density particleboards made from acetylated wood. Wood and Fiber Science 1989 21(1): 67-79. [9] Wu O. In plane dimensional stability of oriented strand panel. Effect of processing variables. Wood and Fiber Science 1999, 31(1): 28-43. [10] Wu O, O Suchland . Effect of moisture on the flexural properties of commercial oriented strand panels. Wood and Fiber Science 1997, decay resistance 29(1): 47-57.
23
“Sustainable Management and Development of Mountainous and Island Areas”

Microbial ecology of beetroots
Papadopoulos Ioannis, Stefanis Chrystos, Alexopoulos Athanasios, Voidarou Chrysa, Kourkoutas Yoannis, Vavias Stavros and Bezirtzoglou Eugenia
Democritus University of Thrace. Faculty of Agricultural Development, Laboratory of Food Microbiology, Biotechnology and Hygiene.
Pandazidou 193 Orestiada 68200, Greece [email protected]
Abstract. All plant surfaces carry a natural flora, which reflects mainly the environment of the cultivated soil. On the present investigation our interest is focused on the rhizoplane flora of beetroots cultivated in the area of Evros in Greece. 189 samples coming from 28 different locations of beet roots (Beta vulgaris var. rapaceum) cultivated soils were introduced to the study and cultured for recovery of aerobic and anaerobic microorganisms. Presence of C. perfringens spore densities is reported in many locations. Moreover other bacterial species were isolated; Enterobacteriaceae (75%), Staphylococcus sp. (43%), Bacillus sp (64%), Cocci Gram(-) (43%) showed important levels. Streptococcus sp (10%), Lactobacillus sp (7%), Pseudomonas (3.5%) and finally yeasts (3.5%) were also present.
It is known the high frequency of C.perfringens in most under surface bulb cultures. However, cultivated soil of beat roots have showed low populations (10%) of C. perfringens spore forms and this is explained by the particularity of this root plant. The nature of beetroot is somewhat particular compared to the other under surface bulbs. In beetroots, important endogen factors are reported; low water activity of the bulb, which permits a tolerate anaerobic growth and high sugar concentration, which inhibits massive bacterial growth. The other bacterial microflora seems to be depended mainly on the location conditions, on the nature of the organic pollution provided and on the present physicochemical status of the soil area. Soils hosting Lactobacillus sp. seems to be negative or to carry small numbers of faecal putrefactive bacteria. In order to obtain complete information for the overall soil quality, a systematic monitoring of cultivated soils must be done for preserving the product quality, as well as public health.
Keywords. Microbial ecology, Beetroots, Rhizoplane microflora.
1. Introduction
Some bacteria can grow in situations where there is a high salt or sugar content. Both sugar and salt bind up the water and thus makes the water unavailable to other bacteria, which require a certain amount of water to survive and grow
Spoilage of jams is dominated mainly by yeasts because they don’t require as much water [3]. It is then conceivable that high sugar concentration in beet roots forms of a specific microenvironment for survey of some bacterial species.
In the present study, our aim was to collect knowledge about the rhizoplane microflora harboring beetroots when cultured in field. This information will help to present the overall soil quality in field harboring beetroots cultures taking drastic measures for cultures preservation when needed, and finally contributing to the longevity of the root and preserving the product quality.
2. Material and Methods
2.1. Sample handling
Beetroots were collected from cultures occurring at the North-East part of Greece (Evros region). The root was scratched and washed by 100 ml of PBS. This water was collected together with the scratching elements of the outer surface of beetroots for further microbiological studiesSamples were mixed well by vigorous manual shaking before performing any analysis.
24
“Sustainable Management and Development of Mountainous and Island Areas”

At the laboratory, all samples were stored at 5 ± 2 C until analyses were completed. All analyses were completed within 24 h of sample collection.
2.2. Microbiological analyses
Each water sample was analyzed for recovery of aerobic and anaerobic microorganisms and especially, C.perfringens, Enterococcus sp., fecal coliforms, total coliforms and total aerobic mesophilic microflora. . The growth media used are the following: -Total coliforms (filtration method) m-ENDO Agar (Difco) incubated at 360C for 24 h. Confirmation was made by selection and culturing of 10 characteristic colonies in BGLB (Brilliant Green Lactose Broth) at 360C for 24 h. -Fecal coliforms - E.coli (filtration method) MFC Agar (Difco) incubated at 440C for 24 h. Confirmation was made by selection and culturing of 10 characteristic colonies in LTLSB (Lactose – Tryptone – Lauryl – Sulphate – Broth) at 440C for 24 h. -Fecal streptococci (filtration method) Slanetz and Bartley (Oxoid) incubated at 360C for 48 h. Confirmation was made by transport of the membrane in Esculin bile Agar at 360 C for 1 h. - C.perfringens: A quantity of 100 ml of our initial sample was passed through a membrane with a porosity of 0.45 m, which retains the microorganism C.perfringens. This last membrane filter was placed in a tube with 9 ml of medium. The composition of the L.S. broth [5] is as follows: 5 g tryptic digest of casein; 2.5 g yeast extract (Difco); 2.5 g sodium chloride; 2.5 g lactose; 0.3 g L-cysteine hydrochloride; 1 L distilled water. The pH was adjusted to 7.1 ± 0.1 and 9 ml of the medium was dispensed into tubes. Sterilization was achieved by autoclaving at 1150 C for 20 min. Before use, the medium was boiled for 20 min to reduce the oxygen content and 0.5 ml of a 1.2 % solution of anhydrous sodium metabisulphite (Na2S2O2) and 0.2 ml of a 1 % solution of ferric ammonium citrate, were added to each tube. The above solutions were prepared and sterilized by filtration (0.45 m) just prior to use. The medium was shaken and from this tube (10-1) two further dilution steps to 10-3 were made. Incubation was performed aerobically in a waterbath at 460 C for 24 h. An aliquot of each sample was heated for 20 min at 800 C for detection of germinated spore forms and for each a L.S. broth was seeded.
Standard classic procedures were performed for the identification to the species level of the aerobic microflora.
3. Results
Our results showed that Enterobacteriaceae (75%), Staphylococcus sp.(43%), Bacillus sp (64%) and Cocci Gram (-) (43%) were isolated at significant levels (Table 1) (Fig. 1). Moreover, Streptococcus sp (10%), Lactobacillus sp (7%), Pseudomonas (3.5%) and finally yeasts (3.5%) were also found at lower levels (Table 1, Fig. 1). C. perfingens was found only in spore forms (10%) in most of the studied locations. When grouping per sampling station, Bacillus (45.8%) is observed as dominated population followed by Enterobacteriaceae (33.3%), Staphylococcus (16.7%) and finallyLactobacillus (4.2%) (Table2, Fig. 2).
Table 1: Occurrence (percent) of various bacterial species in the study samples.
Microorganism (%)
Enterobacteriaceae 75
Staphylococcous sp. 43
Bacillus sp. 64
Cocci Gram(-) 43
Streptococcus sp. 10
Lactobacillus sp. 7
Pseudomonas sp. 3,5
Yeasts 3,5
C.perfringens 10
4. Discussion
Natural bacterial communities inhabiting soil are polymorphic and variable. Conventional identification of these bacteria usually requires pure cultures. It must be noted also that most bacterial species present in caves are noncultivable, although many can be shown by
25
“Sustainable Management and Development of Mountainous and Island Areas”

0
10
20
30
40
50
60
70
80
Enterobac
teriac
eae
Staphylo
cocc
ous sp.
Bacillu
s sp.
Cocci G
ram(-)
Streptoco
ccus s
p.
Lactobac
illus s
p.
Pseudomonas
sp.
Yeasts
C.perfrin
gens
Pres
ence
(%)
Figure 1: Occurrence (percent) of various bacterial species in all study samples.
microautoradiograrhy to be metabolically active [11]. Recently, a procedure that uses r-RNA sequence homology was proposed for defining and enumerating the components of a mixed natural population of bacteria [11]. This method should allow both quantitative and qualitative assessment without culture. However, there is a need for a rapid and simple technique that does not necessarily identify individual species but that does differentiate bacterial communities of special interest to public health [4].
Moreover, the soil ecosystem is heterogeneous, characterized by surfaces and materials that serve as carbon, energy sources, but also as biofilm support for microbial growth [12,13].
Table 2: Dominant microbial species per sampling location. Dominant species No of locations (%)
Bacillus sp. 11/24 45.8
Enterobacteriaceae 8/24 33.3
Staphylococcus sp. 4/24 16.7
Lactobacillus sp. 1/24 4.2
Most of the soil predominant bacteria are anaerobes [16]. The degradation activities of this mainly anaerobic microbial flora may result in a production of high organic strength which could show adverse envirommental effects [17].
It is then conceivable that process optimisation depends on an understanding of the kind of interactions between the microbial physiological groups [5].
The aim of our study was to get knowledge of this various microflora in beetroots culturing.
Bacterial species isolated include Enterobacteriaceae (75%), Staphylococcus sp.(43%), Bacillus sp (64%) Cocci Gram (-) (43%) at important levels.
Streptococcus sp (10%), Lactobacillus sp (7%), Pseudomonas (3.5%) and finally yeasts (3.5%) were also found at lower levels.
Concerning the anaerobic microflora C. perfingens is found only in spore forms (10%) in most of the studied locations. It is known the high frequency of C.perfingens in most under surface bulb cultures (Voidarou C, 2006).
However, cultivated soil of beetroots have showed lower populations of C.perfingensspore forms (10%) and this is explained by the particularity of this root plant.
Staphylococcus sp. (45,8%)
Bacillus sp. (16,7%)Lactobacillus sp.
(4,2%)
Enterobacteriaceae (33,3%)
Figure 2: Dominant species per sampling location.
The nature of beetroot is somewhat particular compared to the other under surface bulbs. In beetroots, important endogen factors are reported; low water activity of the bulb, which permits a tolerate anaerobic growth and high sugar concentration, which inhibits massive bacterial growth. The other bacterial microflora seems to be depended mainly on the location conditions, on the nature of the organic pollution provided and on the present physico chemical status of the soil area. Soil hosting Lactobacillus sp. seems to be negative or to carry small numbers of faecal putrefactive bacteria.
Systematic monitoring of the microbial flora of beetroots is imposed bacause during beets storage and processing sucrose losses due to the activity of this microflora occur [15]. One of the reasons is the formation of slimy microbial polysaccharides, which cause severe processing and quality problems to the root [1,2,6]. This effect seems to be associated with a Gram (-) Cocci, Pseudomonas and Corynebacteriummicroflora.
In our experimentation, Gram(-)Cocci were recovered (43%) at important numbers. The
26
“Sustainable Management and Development of Mountainous and Island Areas”

presence of Pseudomonas was occasionnal (3.5%) and Corynebacterium sp. was never found. Beetroots microflora can be responsible in formation of different types of harmful heteropolysaccharides [8,14]. Moreover, bacterial endotoxin production can produce fever, shock and even death. Sugar used for parenteral administration as well as sugar used for dextran productions must consequently be free of endotoxins [9].
Soil effective disinfestation are performed for control of damping-off in beetroots which consists of a common problem in fields [7,10].
It is obvious that a systematic monitoring of the beetroots microflora is necessary, in order to avoid all the above described occuring problems influencing the overall quality of the root and giving a final product of uncertain quality
5. References
[1] Atkins,PJ.,McCowage, RJ, 1984: Dextran; an overview of the Australian experience ,In: Proceedings of the Sugar Processing research conference, Sugar Processing Research Institute, New Orleans, La
[2] Barfoed ,S,Mollgaard,A,1987:dextranase lost Dextranprobleme in DDS-Zuckerfabricken,Zuckerindustrie,112:391-395
[3] Bezirtzoglou E .Food Microbiology Ed. University of Ioannina Printing Office,2003,Greece
[4] Bezirtzoglou E., Panagiou A., Savvaidis,I., Theodorou D., Tsolas O., Antoniadis, G. 1995: A new and rapid method for identification of C.perfringens in cave waters.Microecol.Ther.,23:188-194
[5] Bezirtzoglou, E., Romond ,C,1990 : Rapid identification and enumeration of C.perfringens in the human faecal flora. Microb Ecol Health Dis. 3,159-163.
[6] Clarke ,MA, Edye ,LA, Cole F, Kitchar, JL,1997: Sugarcane factory trials with dextrinase enzyme .Sugar J.59:20-22
[7] Georgakopoulos ,DG, Fiddaman, P ,Leifert, C, Malathrakis ,NE, 2002: Biological control of cucumber and sugar-beet damping-off caused by Pythium ultimum with bacterial and fungal antagonists. J. Appl. Microbiol. ,92:1078-1086
[8] Greenfield,PF,Geronimos,GL,1982:Effect of dextrans on the viscosity of sugar solutions and molasses.Int.SugarJ.,80:67-72
[9] Haska ,G,Nystrand,R,1979:determination of endotoxins in sugar with the Limulus test
[10] Kiewnick ,S,Kiewnick,B,2001:Intergrated control of rhizoctonia crown and root rot of sugar beet with fungicides and antagonistic bacteria, Plant Dis.,85(7):718-722
[11] Lee ,S, Furhman, JA,1990. DNA hybridization to compare species composition of natural bacterioplankton assemblages. Appl. Env. Microbiol,56:739-746
[12] Panagiou ,A, Savvaidis, I,Bezirtzoglou, E.1995b:Effect of chlorination upon detection of Clostridium perfringens. In:Anaerobic Pathogens, Ed.Eley AR and Benett KW, Sheffield Academic Press,UK
[13] Panagiou, A, Savvaidis, I, Theodorou ,D, Bezirtzoglou ,E.1995a: Influence of light on the presence of C.perfringens in caves. Clin.Inf.Dis.,20(2);380-1
[14] Sidebotham,RL,1974:Dextrans,Adv.Carbohydr.Chem.Biochem.30:371-444
[15] Tallgren ,AH, Airaksinen ,U, VonWeissenberg, R, Ojamo, H, Kuusisto, J, Leisola ,M .1999:Exopolyccharide-producing bacteria from sugar beets.Appl.Env.Microbiol.,65(2):862-864
[16] Voidarou ,C, Bezirtzoglou ,E, Alexopoulos ,A, Stefanis ,C, Fotou ,K, Tzora, A, Harvalos ,E, Skoufos, I and Kandrelis ,S., 2006: Clostridium perfringens frequency in a variety of soils bearing various crops. Soil Microbiol. Biochem. ,(in press).
[17] Watson-Craik IA, Stams AJ. Anaerobic digestion. Antonie Van Leeuwenhoek. 1995;67(1):1-2.
27
“Sustainable Management and Development of Mountainous and Island Areas”

Managing Change: the Case of Tenos Island Cyclades- Hellas
Ioanna Papastathopoulou 48 Erasinidou str. 11632 Athens Hellas
Abstract. The aim of this paper is to investigate the factors which are influencing and in many cases jeopardising the sustainable management of cultural landscapes.
Through the analysis of the current socio-economic situation related to the rural heritage of Tenos Island this paper is hoping to improve the understanding on the strong two-way relationship between landscape and the people.
Thus, to prove that preservation alone, or similarly the absolute lack of, is not capable of enhancing the values and the historic character of each place. A realistic approach to the aspect of change is also necessary for a balanced socioeconomic development which could lead to an ideal of sustainability.
Keywords. Abandoned landscapes, cultural landscapes, management principles, rural heritage, sustainability.
1. Introduction
Nowadays, it is widely accepted that ‘noaspect of nature is unimpacted by human agency, no artefact devoid of environmental impress’[23]. Based on this realisation, the term ‘cultural landscape’ has been adopted in order to encompass all the systems (natural, biological, social, economic) which are acting or inter-acting on a landscape formed by human culture and hosting a specific natural environment.
It should be noted that between people and the landscape there is a strong two-way relationship. Indeed, human lives do not take place in vacuum. Rather, places are very much connected with experiences, memories and that certain sense of place which most people experience in certain environments. On the other hand, human actions are greatly affecting the quality and the image of the landscape. This human power over the land does not always have positive results. On the contrary, in our times, the increasing pressures for profitable and intense use of land, the technological achievements and
the way of modern living are jeopardizing the values of the landscape, as they have evolved and layered over time. In some cases, the practices which have formed and maintained the landscape for centuries are no longer in use. The new habits and the professional orientation of the population seem to be a great threat which can alter the historic character of the landscape, or drive it to self destruction through negligence.
Tenos Island, situated in the middle of the Aegean Sea, offers a typical example of such a case. Its natural landscape formed in terraces is today a relic of an earlier type of land-use. The local economy which in the past was based on agriculture has in recent decades made a major turn towards tourism and the building industry. Former land-uses are abandoned and the landscape is being left to regenerate according to current habits and practices. The pressures for tourism development and the economic exploitation of the land are changing the image of the landscape. At the same time, negligence is threatening a large part of the hand-made landscape and within it the numerous monuments which were connected with the agricultural practice of the past.
It is evident that the situation is quite complex. Social, political and economical factors are affecting the rich heritage of Tenos Island. Local and national authorities seem to neglect the various problems. And though people have their share of rights and duties over the landscape, in reality, nobody can hold back from evolution communities which happened to live in an ‘important’, or less important landscape. Taking all these into account this paper will try to accomplish three major goals:
Understand the essence of cultural landscapes. Explore the issues related to local reality, as far as the rural heritage of Tenos Island is concerned. Propose a series of management principles which in the future could guide the formation
28
“Sustainable Management and Development of Mountainous and Island Areas”

of a complete management plan for the island.
2. Cultural Landscapes
Nowadays, cultural and natural heritage are being seen as interconnected. As an indivisible system which experiences the same problems and threats and which should be protected and enhanced within a common framework of actions and laws. However, this was not always the case. From the 19th century until recently, natural and cultural awareness seem to follow a parallel, but in any case, not a common path. In fact, the discipline-led approach, which developed based on western ideals, has turned out to be a big obstacle towards the development of a holistic approach to landscape management.
2.1 From Natural to Cultural
Until the middle of the 20th century, nature was mainly appreciated for its wildness and/or its aesthetic values. Humans were seen either as conquerors of the planet (and thus superior in the hierarchic scale of the natural world), or as ‘savages’ and thus part of the ‘uncivilised’ and ‘exotic’ nature [28].
Nevertheless, in the last fifty years, there has been a gradual changing attitude at international level. Eventually people came to be seen not only as the (ab)users of the earth’s resources, but as an inseparable element of the landscape. Moreover, scientific observations showed that in reality very few, if any, landscapes have not been affected by human practices. On the contrary, in the present image of most landscapes, one can trace a succession of cultural ‘deposits’, influenced by the social and economic framework of each period of time [5]. This way, the archaeological remains came to be considered to be as ‘natural’ features as the rocks, the plants and the animals, and thus an integral and fragile resource of the landscape, which needs to be managed in a sustainable manner, for the benefit of present and future generations [26].
Nowadays, the culture of nature has become a key-issue in landscape conservation and subsequently the holistic requirements of such a task.
2.2 From Cultural to Natural
At the same time, the appreciation of the historic character of the landscapes was approached from a different ‘scientific’ direction, as well. In fact, the development of the science of Cultural Studies, after the second half of the 19th century, brought a series of changes in the way words like ‘heritage’ and ‘monument’ are perceived. During the 1960’s public interest in the protection of heritage noticeably increased and the preservation movement began to grow. First conservation efforts were focused on individual monuments, such as important buildings, churches and great archaeological places.
Nevertheless, it soon became clear that ‘heritage’ is something more than the physical remains of the past. If we observe the history of conservation, through national and especially through international policy, we can easily follow this gradual change of interest from the material essence of heritage towards its humanistic and spiritual one; from the conservation of individual monuments, as they are described in the Venice Charter [17], towards the appreciation of the wider context of things like ‘…the place itself, its fabric, setting, use, associations, meanings, records, related places and related objects.’ [19].
Eventually, the term ‘cultural resources’ has been broadened to include the natural elements of the landscape. People accepted that as the natural landscape includes archaeological features which are affected by its management, likewise, the management of monuments and sites affect their greater surrounding. In reality, both natural and cultural heritage are dealing with the same threats and pressures from modern development, new uses and the change of the socio- economic conditions across the world [23]. The heritage of both culture and nature came to be taken seriously into consideration in conservation projects and the new term ‘cultural landscape’ was introduced in order to describe places, formed by people and hosting specific natural environments.
2.3 Cultural Landscapes- definition
The term ‘cultural landscape’ was introduced in academia in the beginning of the 20th century. However, it was not until 1992 that new guidelines from the World Heritage Committee managed to deal with the complexity of the
29
“Sustainable Management and Development of Mountainous and Island Areas”

subject [13]. The revised Convention concerning the Protection of the World Cultural and Natural Heritage was broadened to allow ‘cultural landscapes’ to be included in the World Heritage List and it clearly defined that ‘the term ... embraces a diversity of manifestations of their interaction between humankind and its natural environment’ [33].
After UNESCO a series of definitions have been adopted in academic papers and legislative documents. The U.S. National Park Services [34], for instance, defines it as: ‘a geographic area, including both cultural and natural resources and the wildlife or domestic animals therein, associated with a historic event, activity, or person or exhibiting other cultural or aesthetic values’. Similarly, the European Landscape Convention [8] perceives landscape as: ‘an area, as perceived by people, whose character is the result of the action and interaction of natural and/ or human factors’.
It is obvious that, in the majority of definitions, the term is used in order to describe places whose essential character is the result of human interaction with nature over space and time. However, as Fairclough [12] interestingly notes, the definition given by the Council of Europe in 2000 has offered an innovatory turn since it has been ‘amplified by a reminder that cultural landscape exists everywhere’. Indeed, though UNESCO’s WH list refers to a group of ‘elitist’ landscapes [29], the Council of Europe broadened the term in order to encompass every landscape, regardless of its aesthetic, cultural, etc. value. Subsequently, to recognise that ‘landscape is an important part of the quality of life for people everywhere’ [8].
This way, both the cultural and natural attributes of the landscape were recognised as equal elements of the same system. Moreover, every place was recognised as important for some part of the population which earns a legitimate right for active participation in the management process.
3. Tenos Island
A typical example of a ‘cultural landscape’ is Tenos Island, the third biggest island of the Cyclades complex.
Tenos is situated between Andros, Mykonos and Syros Island. It covers an area of 197 km2 and a coastal line of 114 km length in total. Though the archaeological remains of early periods are not many, yet it is known that Tenos
formed part of the Mycenaean civilisation. In 1204 after the conquest of Constantinople by the Francs, Cyclades fell under the Venetians. During this period Tenos started to flourish. The sense of stability that was created attracted people from across the country and Tenos became, until the end of the 19th century, one of the most heavy-populated islands in the Cyclades [20].
Figure 1. Tenos Island- today
Figure 2. Tenos Island- 16th C. by G.F. Camocio [20]
Tenos was the last Aegean Island to surrender to the Turks in 1715. This lasted until the year 1821 when the revolution came to liberate the island, as the rest of the country. After 1823 Tenos’ economy started developing around a new religious centre which was created on the site where a ‘miraculous’ icon of Mary was discovered. Numerous pilgrims started coming from across the world and the Island begun to build its reputation as a national centre of Orthodoxy.
After World War II most of the local population left for Athens or abroad in a seek of a better quality of life [20]. The depopulation of
30
“Sustainable Management and Development of Mountainous and Island Areas”

the island continued until the present when new uses like tourism and the construction industry begun to flourish.
Today, Tenos has a population of 9,701 inhabitants [4]. Most of the Tenians are living in the port and capital of the island, when the rest (mostly people of some age) are trying to hold alive the rest 52 traditional settlements. The most developed area besides the port is the coastal line lying on both sides of the port. These areas also attract the larger number of tourists, visitors and construction development.
4. The Tenian Landscape
Tenos has a distinctive mountainous relief and its soil has been formed by deterioration of the different geological formations. In addition, it is poor in organic components and shallow because of the steep slope of the mountains and the strong North winds of the island [14]. In this land the Tenians managed to cultivate barley, but also wheat, olive trees, rye, pulses, vegetables and a lot of fig trees. Also, they were producing excellent wine and their famous garlic [20].
4.1 Agricultural Terraces
The agricultural terraces are narrow pleces of land formed by the construction of a series of parallel dry stone walls. Vernikos et al. [37] argue that as with all human creations, the dry stone walls are creating symbols and meanings which are capable of transforming places into (cultural) landscapes. Indeed, the human factor is essential both for the creation and the maintenance of these constructions.
According to a recent estimation 30km2 out of the 197km2 has been formed into agricultural terraces which is about 45.8% of the total agricultural land [10]. The first written evidence on the Tenian terraces goes back to 1456 [1]. However, it is speculated that this tradition has its origins deeper in the past. It should be noted that the construction and maintenance of the terraces requires highly demanding works. Hence, the decision for their construction comes either after demanding pressures for food, or, after an increased need for soil conservation [35]. Based on this thought, one could argue that the changes in the density of local population, which occurred mainly during the Venetian and Ottoman conquest, could be responsible for the character and the image of the Tenian landscape.
In contradiction with other places, Tenos
Figure 3-4-5. Pigeon houses- footpaths-terraces- traditional settlements: Inseparable elements of the Tenian landscape
31
“Sustainable Management and Development of Mountainous and Island Areas”

managed to keep alive the habits of traditional agriculture and subsequently to maintain the character of its landscape. This occurred partly because agriculture was a ‘family business’ [20]. The agricultural fields were divided into small ownerships used by each family primarily to feed its own members. However, another important reason would be the difficulty of transportation. Indeed, until the first half of the 20th century traffic was distributed by an extensive network of narrow footpaths. Although these paths offered convenient shortcuts between villages, yet they were never an efficient way of transporting goods.
5. Present situation
The important historic past of Tenos is until today being reflected in the natural and cultural environment of the island. In this wider context all elements of the landscape seem to be in harmonisation with each other. Things like the agricultural terraces, the numerous footpaths which gave access to private ownerships and the structures which were connected with the agricultural practice are creating an interacting network of non renewable cultural elements. As it will come clear later, in our times more than ever before, this system seeks for a holistic treatment in order to maintain its character. Indeed, in the last few decades the new habits and new uses of the landscape are changing the established socio-economic conditions on the island. In addition, they are endangering the image and the qualities of its landscape including all the natural and cultural elements within it.
5.1 Agriculture
As already mentioned, after World War II, began the decline of Tenos Island. Many people left for Athens or abroad in order to ensure not only a better financial future but also access to modern infrastructures and education. At the same time, the people who stayed back orientated themselves towards more profitable occupations and agricultural practice begun to give its place to trade and the tourism industry [36].
This change in the professional orientation of the population is responsible for a series of environmental threats which are altering the quality of the Tenian landscape. Indeed, nowadays, both the terraces and the architectural structures connected with agricultural practice,
like the famous pigeon houses [ ]and the windmills, have lost their purpose. People eventually started to neglect their maintenance and the hard environmental conditions of the island, such as the strong winds, snowfalls and rains begun to cause their destruction. In fact soil erosion is today one major issue on the island since whole slope sides (and with them the monuments built upon them) have begun to slip towards the sea.
At the same time, as already mentioned above, an intense construction activity of modern summer houses, has developed both in the coastal area and in the mainland of the island. Because of the difficult mountainous relief and the formation of the ground into agricultural terraces the works required for building and giving access to the new houses are huge and usually are extending in almost half of the existing field. This way the image of the place is rapidly changing and major destruction is being caused to the hand-made Tenian landscape.
Apart from the terraces, the abandonment of agricultural practice is causing other destructions, as well. In fact, both the flora and the fauna of the place are being affected. As Bielsa et al. [6] argue: ‘the abandonment of agricultural land generally results in an increase of vegetation biomass. This process leads to homogenization of the landscape. In addition, abandonment promotes fragmentation of agricultural land’.
It should be noted that many areas across Europe are experiencing the same problems. According to MacDonald et al. [24] ‘agricultural abandonment reflects a post war trend in western Europe of rural depopulation to which isolated and poorer areas are most vulnerable’.The reasons which are causing this phenomenon of abandonment of agricultural practice are many. Yet, Vernikos [36] believes that the small ownerships, the limited natural resources, the aging of the population, but also the decreased competitiveness of agricultural products caused by the large production and transportation costs, are the main reasons which are negatively affecting the development of the primary sector in many of the Hellenic Islands, including Tenos and most of the other Islands which form part of the Cyclades complex.
Abandoned landscapes are urgently requiring solutions. They are extremely vulnerable to the rapid intrusion of new uses since the phenomenon of depopulation is accompanied by a major drop in land value.
32
“Sustainable Management and Development of Mountainous and Island Areas”

5.2 Tourism
Tourism has turned out to be probably the biggest industry in the world [15]. In the post-war period, there begun to emerge an increasing urban-based interest in the countryside. This was the result of a change in the way people were living. The increased income combined with lesser working hours made it possible for people to plan their leisure time, with the wide use of the car and other means of public transport promoting the development of a variety of outdoor- activities [30]. Domestic and international tourism began to grow. Soon it was realised that one of the most important benefits from these recreational activities is the cultural exchange which provides an understanding not only of the past, but also of the contemporary habits and culture of the local population [18].
This process can generate a big chain of development practices. According to ICOMOS [18]: ‘Tourism can capture the economic characteristics of the heritage and harness these for conservation by generating funding, educating the community and influencing policy’. But at the same time, it can have a serious impact on the coherence of local communities.
In Tenos one could observe two kinds of tourism: the seasonal tourism and a particular type of religious tourism developed around the church of the Annunciation. The former flourishes from May until October and its infrastructures developed mainly across the coastline on both sides of the capital. The latter involves one or two day visits, mainly to the port of the island, submission to the holy icon and of course, use of the facilities of the capital.
Around the 1970’s and 1980’s many locals moved from their villages to the capital to get involved in the tourist industry and many old houses in the mountainous settlements were left empty. Undeniably, the development of the area around the capital prevented the economic development of the rest of the island. However, it could be argued that at the same time it prevented the alteration of the traditional character of the villages and of the countryside in general. Many people from abroad end especially from the U.K., France and Germany bought properties in the hinterland, taking advantage of the low cost housing prices. With the arrival of the temporary residents, a new social structure was established. The new population which has bought properties in the island is offering their
Figure 6. Phenomena of soil erosion near Moudados settlement
Figure 7. Modern construction works are altering rapidly the image of the Tenian landscape
Figure 8. Current legislation is not capable of protecting the monuments which were connected with the agricultural practice of the past
33
“Sustainable Management and Development of Mountainous and Island Areas”

skills and financial assistance to conserve some of the traditional structures of the island. However, at the same time they are causing serious alterations to the social structure of some villages. Indeed, nowadays, there are whole villages which are characterised as German or French.
In the last decade, a very profitable industry begun to take epidemic dimensions: the construction of private summer houses. This time the target group was of Hellenic origins, mainly Athenians who wanted to obtain a secondary residence in the countryside. With the development of modern transportation Tenos could be reached in as little as 2 hours. Thus, it provided a unique place for relaxation from the noise and faster rhythms of the capital. In addition, its hinterland, almost untouched by tourism, offered to the ‘city people’ a sense of authenticity. Of course, the arrival of this new social group was unable to regenerate the countryside and prevent the trend of depopulation. Indeed, as the foreign summer visitors, many Athenians are residents on the island for approximately only two months per year. Thus, the phenomenon of depopulation is observed during most months of the year.
Undeniably, tourism is a very powerful economic resource. Under the right circumstances it can be ‘an essential part of many national and regional economies and can be an important factor in development,...’ [18]. However, it is a fact that tourism can easily have a serious impact on cultural landscapes by altering the distinct character of the place, or by corrupting the authenticity of local populations. In many cases, it creates conflicts which must be properly solved within carefully considered planning and management frameworks.
6. Managing change
It is clear that the Tenian landscape is a typical example of a historic place. At the same time, it falls into the definition of a ‘landscape’, as this is presented in the European Landscape Convention (see §2.3). It should be noted that as of December 2001, Hellas is among the signatories of the Convention [9]. According to this: ‘Each Party undertakes: a) to recognise landscapes in law, as an essential component of people’s surroundings, an expression of the diversity of their shared cultural and natural heritage and a foundation of their identity; b) to
establish and implement landscape policies aimed at landscape protection, management and planning ...’ [8].
Yet so far, no gesture whatsoever implies that the Hellenic State will proceed from the act of signature into real action. In fact, my research has shown that the authorities do not have a management plan which would enhance the historical character of Tenos Island. On the contrary, they are overlooking the complex problems and solutions are being caught up in a game of power between the different Services and the incapability to adopt an integrated approach. As a result, day by day, a number of competing interests, different needs and wills are jeopardising the values of this fragile anthropogenic landscape.
Figure 9. Destructive additions to a pigeon house (designated monument: FEK 674/B 1984)
It is clear that agriculture is no longer in practice and people are searching to find other profitable occupations. As usual, economic survival comes first and the existing heritage seeks for profitable economic exploitation through the introduction of new uses. Local population has no financial interest in maintaining their non renewable heritage, nor they are informed of its value for their long term
34
“Sustainable Management and Development of Mountainous and Island Areas”

prosperity. Undeniably, ignorance and insufficient control is causing major destructions to the non- renewable heritage of the island. Indeed, my research has shown a great lack of education and a general ignorance over the origins and the uniqueness of the landscape. It could be argued that such an omission is causing an apathetic behaviour from the side of the local population and challenges the bond between humans and their place. As a result the locals are selling out their land, instead of searching for creative new enterprises which will promote local culture and enhance the wider environment. And though the role of the State is limited, more or less, to that of the police, in most cases, it is proven incapable to prevent destruction.
7. Guiding Management principles
As already mentioned the Hellenic State does not have a management plan which would enhance the historical character of Tenos Island. However, it is clear that there is a great need for it to do so. The new social groups are changing rapidly the balance of the Tenian society and new habits are threatening the environmental integrity of the place.
Nowadays, researchers have developed a number of conceptual and analytical frameworks on sustainable landscape management. According to MacFarlane [25]: ‘... one overarching vision might be the development of landscapes that are ecologically viable, ..., visually appealing, culturally meaningful and physically accessible’.
Of course, this is not a rule. In reality, every proposal is (or should be) influenced by a series of factual elements. These are providing not only the necessary contact with the locality of the place, but also, are giving an essence of legitimacy to the whole process. Hence, serious consideration should be given to the following:
Local environmental and socio-economic conditions ‘Good practice’ in National and International LevelInternational Charters and Recommendations
Based on these facts, a central long-term vision could be developed. In order to increase effectiveness this final aim should be:
Realistic, and thus reflect the current needs and particularities of the area.
Flexible, and thus encompass the changes which inevitably follow the general evolution of things.
Multi-collective, and thus involve as many relevant disciplines as possible in order to cover the complex nature of the landscape.
Inclusive, and thus respect the democratic right of every person to have a say on their environment.
This central aim cannot be reached in a day. In fact, a series of short and medium-term goals should be adopted in order to prepare the way and drive change into the desirable direction. These should include well coordinated and planned actions in three major fields: in research, planning and in education.
7.1 Research
Undeniably, an in depth understanding of a cultural place is essential [21]. The unravelling in time depth of the complex interrelations which have formed its historic character can provide people with essential information on the social structures and the bonds created through a long process of changes and the constant effort for survival. Indeed, without understanding, the task of assigning priorities seems like a blind mission.
In the case of Tenos Island, as in all the cases involving cultural landscapes, research should be multidisciplinary. It could include disciplines like archaeology, architecture, biology, ethnology, history, sociology, tourism studies, ecology, geology, environmental studies, etc.. Probably, the most effective way of managing this big team would be through a local research institution. This could be based on the island but it should be open to cooperation with similar institutions, on a European and international basis, in order to exchange knowledge and information. Research should be supported with European, national or local grants for research projects, scholarships for students making research on relevant topics, organisation of international conferences and publications in two languages, at least, in order to ease the exchange of information.
7.2 Planning
It could be argued that ‘a landscape heritage is ... a practised heritage’ [31]. This makes effective planning to be a key issue in the landscape management process. More
35
“Sustainable Management and Development of Mountainous and Island Areas”

specifically, planning should seek for the most preferable balance between socio-economic prosperity, natural enhancement and heritage protection. It should be based on sensible decisions and on the in depth understanding of the place. However, this should not be a one-off process. On the contrary, changes and new practices should be considered, studied and monitored constantly, in order to achieve best results. In this difficult exercise creativity and the foreseen seem to be necessary tools.
The planning process for Tenos Island should include the cooperation of a series of Ministries like the Ministry for the Environment, physical Planning and Public works, as well as the ones for Tourism, Culture, Rural development and food, Development, Aegean, Economics, Internal Affairs, etc. It should be represented on the island in order to eliminate the phenomena of the present bureaucratic processes and be open to dialogue and the prospect of change. In fact, its decisions should be made after consultation of the research team and representatives of the public. The local population should be asked to develop initiatives which would enhance the wider environment, built partnerships and to be an active player in this game of managed evolution. All these actions should be supported by Governmental measures which encourage education and the active participation, and last but not least, increase motivation.
7.3 Education
It is of common belief that every single person has both a share in the landscape and a right to care for it [27]. Thus, management plans are influencing people’s lives and their wider environment. In fact, public participation is an essential factor in sustainable development [7] and public awareness is seemingly a necessity.
In the case of Tenos Island the knowledge should be encouraged by a series of measures. Educational programmes in local schools, courses for youngsters and adults on skills and local customs could improve awareness and the participation of the public. The facilitation of one or two interpretation centres across the island would develop a move in this direction. Of course, nowadays, museums are not well visited by the Hellenic population [3]. Hence, new creative ways should be explored in order to attract attention and make the visiting experience appealing both to the local population and the visitors of the area.
7.4 Application
Ucko [32] argues that legislation ‘… mirrors the political and social conditions of each country in striking but complex ways…’. In Hellas, although there was an early awareness of heritage protection [16]; [22], political events like the Hellenic Civil War and the dictatorship regime held back the evolution of conservation thought. During recent years the legislative system of the country has evolved in order to follow the general climate of the times, as this is formed through the various European and international charters and recommendations. However, political thought has not reached the stage of accepting and supporting things like public participation, local initiatives and the necessary multidisciplinary approach. Yet, all these goals are achievable. Or better, as this paper argues, it is definitely something worth fighting for. Courageous political vision and effective planning could enhance the general quality of life. And in addition, the local population could find again its optimism to face in a creative way the demanding future which lies ahead.
8. Conclusion
Theoretically, international legislation and recommendation papers could guide national laws in order to protect and enhance the quality of the landscape. However, when it comes to practice international ‘good practice’ is not always capable of preventing destruction and enhancing the historic character of the landscape. On the contrary, as the case of Tenos Island has demonstrated the Hellenic laws are unable to protect the historic character of the Tenian landscape. Rather, they seem to create a dangerous fragmentation in the long-established relationship between the landscape and the local population, endangering the quality of every day life.
More specifically, the existing un-flexible governing system, based on western ideals, is proven incapable of embracing the necessary integrated approach that the complex nature of the landscape demands. Moreover, the labyrinth of bureaucracy and most importantly the lack of political will are proven to be fatal obstacles towards the ideal of sustainability.
Undeniably, the present reality on Tenos Island looks like a dead–end situation, as far as the protection of the landscape is concerned.
36
“Sustainable Management and Development of Mountainous and Island Areas”

However, things can always be improved. Lowenthal [23] believes, that ‘we can return neither to a state of nature nor to any supposed ‘balance’; Environmental interference always requires further interference, and stewardship means not leaving nature alone but meddling more carefully’. One could argue that the same stands for the wider physical and socioeconomic environment of Tenos Island. In fact, research could improve the understanding of the complex interrelations between the cultural and the natural elements of the landscape. At the same time, education could increase the awareness of the public on issues related with the past andpossibly prevent destruction. Last but not least, careful planning could enhance the quality of the landscape and thus achieve long term prosperity for both the present and future generations.
9. References
[1] ACT. Archives of Catholic episcopacy of Tenos 2-5 May 1456; file 18.
[2] Alexopoulos K. ,[Tenos, the short journey]. Athens: Erinni; 1993
[3] Anon. [Hellenic Museums; 2005.
Article sited in: http://www.in.gr/news/article.asp?IngEntityID=44565, Published the 22/08/2005.
[4] Anon. & [Geographic and Historical elements]; nd. Municipality of Tenos Official webpage: http://www.tinos.gr/genika.html. [26-03-2005].
[5] Atkins P, Simmons I and Roberts B. People, Land & Time- An Historical Introduction to the Relations between Landscape, Culture and Environment. London: Arnold; 1998.
[6] Bielsa I, Pons X and Bunce B. Agricultural Abandonment in the North Eastern Iberian Peninsula: The Use of Basic Landscape Metrics to Support Planning. Journal of Environmental Planning and Management 2005; 48(1): 85-102.
[7] Bitsani E. [Cultural
Management and Marginal Development]. Athens: Dionikos; 2004.
[8] Council of Europe. European Landscape Convention. European Treaty Series; 176. Strasbourg: Council of Europe; 2000 http://conventions.coe.int/Treaty/en/Treatie
s/Word/176.doc [01-07-2005]. [9] Déjeant-Pons M. The European Landscape
Convention, Florence. In Fairclough G, Rippon S, editors. Europe’s Cultural Landscape: archaeologists and the management of change. Brussels: Europae Archaeologiae Consilium; 2002. p. 13-24.
[10] Doukellis P, Mendoni L. ‘-
[a historic approach of the agricultural terraces of Tenos]’ Official webpage of LIFE project; nd http://www.spin.gr/static/sitetrnsfr/life/agrotinos/life-TINOS/Doukelis2/doukelis-text.html [ 26-03-2005].
[11] Fairclough G. Europe’s landscape: archaeology, sustainability and agriculture. In Fairclough G, Rippon S, editors. Europe’s Cultural Landscape: archaeologists and the management of change. Brussels: Europae Archaeologiae Consilium; 2002. p.1-12.
[12] Fairclough G. Archaeologists and the European Landscape Convention. In Fairclough G, Rippon S, editors. Europe’s Cultural Landscape: archaeologists and the management of change. Brussels: Europae Archaeologiae Consilium; 2002. p.25-37.
[13] Fowler P J. World Heritage Cultural Landscapes: 1992-2002. World Heritage Papers, 2003; 6. Paris: UNESCO World Heritage Centre.
[14] Georgantopoulos E. -
[Tenian- ancient and modern geography and history of Tenos Island]; 1889. Republished bySofianos D. Athens: Brotherhood of the Tenians in Athens; 2005.
[15] GESAMP- joint Group of Experts on the Scientific Aspects of Marine Pollution. A sea of troubles. Rep. Stud. GESAMP, No. 70; 2001. Sited in Oceans Atlas Organisation official webpage: www.oceansatlas.org/unatlas/uses/uneptextsph/tourismph/214gs70022.html [07-08- 2005]
[16] Hellenic Society, editor.
[Protection of Monuments and Traditional Settlements]. Athens; 1975.
[17] ICOMOS. International Charter for the Conservation and Restoration of Monuments and Sites (The Venice Charter); 1964.
37
“Sustainable Management and Development of Mountainous and Island Areas”

[18] ICOMOS. International Cultural Tourism Charter- Managing tourism in places of heritage significance (8th Draft). Mexico:ICOMOS International Scientific Committee on Cultural Tourism; 1999.
[19] ICOMOS-Australia. Charter for the Conservation of Places of Cultural Significance (The Burra Charter); 1999: paragraph 2.1.
[20] Karali M. [Homesteads in
Exomeria, Tinos]. Athens: ETBA; 2002. [21] Kerr J. The Conservation Plan: a guide to
the preparation of conservation plans for places of European cultural significance.Sydney: The National Trust of NSW; 1996.
[22] Kokkou A. [The
care for the Protection of Antiquities in Hellas and the First Museums]. Athens: Hermes; 1977.
[23] Lowenthal D. Natural and Cultural heritage. International Journal of Heritage Studies 2005. 11( 1): p. 81-92.
[24] MacDonald et al. Agricultural abandonment in mountain areas of Europe: Environmental consequences and policy response. Journal of Environmental Management 2000; 59: p. 47–69.
[25] MacFarlane R. Managing whole landscapes in the post-productive rural environment. In Benson J, Roe M H, editors. Landscape and sustainability. London, New York: Spon Press; 2000. p.129-56.
[26] Macinnes L, Wickham-Jones C R, editors. Time-depth in the countryside: archaeology and the environment. In All Natural Things- Archaeology and the Green Debate. Oxford: Oxbow books; 1992. p. 1-13.
[27] Olivier A. Preface. In Fairclough G, Rippon S, editors. Europe’s Cultural Landscape: archaeologists and the management of change. Brussels: Europae Archaeologiae Consilium; 2002. p. iii-iv.
[28] Phillips A. The Nature of Cultural Landscapes: a nature conservation perspective. In ICOMOS- UK, The Cultural Landscape- Planning for a Sustainable Partnership between people and place. London: ICOMOS- UK; 2001. p. 46-63.
[29] Priore R. The background to the European Landscape Convention. In ICOMOS- UK, The Cultural Landscape- Planning for a Sustainable Partnership between people and place. London: ICOMOS- UK; 2001. p. 31-37.
[30] Santos J M L. The Economic Valuation of Landscape Change- theory and policies for land use and conservation. Cheltenham, Northampton: Edward Elgar; 1998.
[31] Setten G. Farming the Heritage: On the Production and Construction of a personal and Practised Landscape Heritage. International Journal of Heritage Studies 2005. 11[1]: p. 67-79.
[32] Ucko P J. Forward. In Cleere H, editor. Archaeological Heritage Management in the Modern World. London, Boston: Uniwin Hyman; 2000.
[33] UNESCO Operation Guidelines for the Protection of the World Cultural and Natural Heritage (WHC/2/revised: February 1996). Paris: UNESCO; 1996.
[34] US National Park Service. Cultural Resource Management Guideline, NPS-28. Washington, DC: U.S. Department of the Interior, National Park Service; 1998.
Sited in: http://www.cr.nps.gov/history/online_books/nps28.htm [01-08-2005].
[35] van Andel T H, Runnels C and Pope K. Five Thousand Years of Land Use and Abuse in the Southern Argolid, Greece. In Kardulias N, Shutes M, editors. Aegean Strategies- Studies of Culture and Environment on the European Fringe. Lanham, Boulder, New York, Oxford: Rowman & Littlefield; 1997. p. 33-60.
[36] Vernikos N. The primary sector; nd. Ministry of Agricultural production Official webpage: http://www.ypai.gr/go.asp?uid=1716&mn=13&cmu=91&thID=0.html [09-06-2005].
[37] Vernikos N et al. [proposal for the
classification of dry stone wall construction. In Proceedings of the International Meeting:
[the structural stone in monuments]. Athens, Mytilene: ICOMOS- . . . .; 2002. p. 265-76.
38
“Sustainable Management and Development of Mountainous and Island Areas”

The Beneficial Role of Urban Green Zones, Suburban Green Zones and Forests in Modern Society
Anastassios C. Papastavrou
Professor of Forest Policy, Lab of Forest Policy, School of Forestry and Natural Environment, Aristotle University of Thessaloniki, P.Box 247, 54124,
Thessaloniki, Greece E-mail:[email protected]
Abstract. The increase of population and urbanism has created a suffocating surrounding environment in urban areas. Additionally, increase in the people’s income, the upgrading of the quality of life, the increased movement of urban populations within the country, the pollution in the cities and industrial areas have generated extended needs for urban populations for recreation in green areas. Green zones in our country can be distinguished in urban green zones, suburban green zones and forests in mountainous areas. Forest uses can be of natural, social and economic content. Therefore, the urban, suburban green zones and forests have the potential to meet the needs of modern society in goods and services.
Keywords. Forest policy, forest value, recreation, green zones, quality of life.
1. Introduction
The increase of the population and the continuous movement of agricultural populations to urban and industrial centres (urbanism) have shaped a suffocating situation in city areas. Additionally, the parallel increase in the income, the upgrading of the quality of life, the increased movement of urban populations within the country, the pollution in the cities and in industrial areas have changed the needs of urban populations [8],[16].
Thus, there is a new need for modern people to spend leisure time in a clean environment, away from noise, pollution and the thick density of a city [6],[13]. Natural areas for outdoor recreation can be found along the coastal areas, in rivers and lakes, in organized areas for camping, in the forest environment and in natural parks. In national parks the
visitor can see natural monuments, landscapes of rare scenery, impressive geomorphologic formations, and representative species of rare flora and fauna of our country [6],[8],[9],[11],[13].
The forest wealth of our country is comprises of renewable and non-renewable forest resources. The proper development and exploitation of these resources can cover a variety of public needs, which justifies the social role of forests [16], [17].
The benefits in goods and services that result from the exploitation of green areas by modern society are complicit and multifarious. The type and the quality of the provided goods and services from green areas define their use and usefulness. Therefore, the uses are those which will imply the satisfaction of our needs, effective or not.
2.Classification of green areas
According to “article 4” of the Law 998/1979, “about the protection of forests and forest areas generally” (F.E.K 289/29.12.1979, issue A’) forests and forest areas in Greek territory are distinguished by their usefulness and the functions they serve in society, their distance from human installations and the activities that take place within them [18],[20]
Under these circumstances it is apparent that city populations that are usually psychologically and emotionally charged from the difficult daily quality of life in the cities seek peace of mind, calmness and quiet that can only be found in recreation areas [6]. This kind of areas can be identified in green zone circles [8] as follows:
a) green zones generated from city parks, gardens, road trees, internal and external home areas form the urban zone, available for daily uses such as terraces, roof gardens and
39
“Sustainable Management and Development of Mountainous and Island Areas”

balconies, b) green zones in a short distance from communities, between 10-30 km, form the suburb zone which is available for leisure time recreation, daily and during weekends, and c) green zones in a distance over 50 km form a distant green zone from urban centers, available for long vacation.
Green areas and forest zones, mainly those situated in coastal areas and along highways, are of great importance as they are in exaggerated demand and consequently highly priced. These areas thus have an important forest policy value due to their social and cultural functions [8,16,17]
As urban and suburban green zones are generally considered all areas of a substantial surface with green vegetation and groups of trees in addition to forest areas located within or in a short distance from urban centers. These green areas cover a very small proportion of civil territories in our country. In Athens green zones per citizen are close to 2,0 m 2 and similar percentages are registered in Thessaloniki and other big cities, such as Patras, Larissa, Volos, etc [16,17].
As forest green zones are considered: a) forests and forest areas located in a zone of 1000m width from the sea/coastal line, that is coastal forests, b) forests and forest areas 500m from lake borders that is perilacustrianforests and c) forest and forest areas 200m from river banks that is riverside forests.
Additionally, roadside forests are the forests and forest areas located along highways in a zone of 1000m width, and along regional roads in a zone of 200m width. The desire of the population to have second and / or summer houses in beautiful green landscapes, that can be easily accessed from highways or regional roads has increased the market price and consequently the demand for such areas. During the last 20 years, these areas have been in high demand for the creation of tourism resorts, houses, agrotourism and similar use installations.
The reasons for that increased demand for roadside and coastal forest areas can be attributed to the progressive cultural and economic development of our country in combination with the expansion of internal and external tourism in all seasons of the year.
The importance and value of these areas for the public is mainly due to their forest cover, i.e., pine forests either of pinus brutia or pinus halepensis (halepo pine) which have been
recognized as landscapes of great and unique beauty.
The extended tourist season has also generated an important demand and increase of the value of forest areas situated close to natural or artificial lakes.
In Greece, the total area of these forest zones comes up to 250.000 ha. This area comprises of public forests and forest areas that cover 180.000 ha and non-public forests and forest areas that cover 70.000 ha.
3. The beneficial role of green zones
The social role of urban, suburb and forest green zones are of a great importance for the public. Following, it is described in detail the beneficial role for the society of the above three categories of green zones that are identified in our country.
3.1. Benefits from urban green zones
The social importance of green areas within urban centers is widely acknowledged as they contribute to the improvement of the quality of life in the cities. Among the benefits urban green zones :
1. contribute to the confrontation of the problem of sound pollution,
2. contribute to the confrontation of the problem of the air pollution,
3. clear the city atmosphere, 4. decrease wind velocity, 5. combat high temperatures, 6. produce oxygen and keep CO 2 ,7. constitute the ideal reserve for wildlife,
small animals and birds, 8. constitute recreation areas for the public 9. help to confront smog problems.
It should be pointed out that 0.4 hectares of forest can produce the oxygen needed for the respiration of 2 persons.
However, the green areas that could serve the above functions are limited, and they cannot satisfy modern peoples’ needs. The main reason for that situation is the false and non-adequate planning strategy in big cities which is mainly geared towards the covering of peoples’ housing needs.
Experts claim that green urban zones should correspond to 15,5 m 2 per citizen as presented in Table 1.
40
“Sustainable Management and Development of Mountainous and Island Areas”

Children playground green
areas
1,0 m 2 for every citizen
Public parks and city gardens
4,5 m 2 for every citizen
Health parks, small city forests,
walking areas
10,0 m 2 for every citizen
Total green area 15,5 m 2 for every citizen
Table 1. Green zone norms for urban areas
However, the beneficial role of green zones in urban areas depends on:
a) the size of these areas b) their distance from the center of the city c) extreme temperatures d) humidity situation e) forest species that are selected and used
The urban green zones that also include private terraces, balconies, back yards, roof gardens, road vegetation and small parks in the streets are characterized by variety of uses and consequently by the variety of the flora species that are used. However, their mixture of species is not adequate with regard to serving the needs of the city [8],[13].
Additionally, all the trees that are found within an urban center would play an important and useful role in the structured environment because they: a. add a character of nature in the city landscape b. support the landscape with colors, flowers and beautiful schemes, forms and textures c. beautify a harsh scenery, like big buildings d. soften the hard lines of the buildings, metal and glass surfaces, and e. are used as an architectural tool, aiming to define areas for specific use or to unify the landscape and create levels.
Moreover, the existence of trees has a positive impact in a person’s mood and spirit in a way that is not clearly counted, yet widely acknowledged. A healthy grove, small forest, park or garden that is situated in a working environment constitutes a major element for the health of that environment.
In conclusion, it is also evident how urban green zones can effectively contribute to: lessening air pollution, confronting the green house effect, the storage of rainfall waters that
prevent soil erosion, economic stability, the creation of wild life biodiversity into the cities.
3.1.1. Suggestions for the improvement of urban green zones
The improvement of urban green zones can be supported through the following guidelines
1. Creation of parks into the cities. It is also significant to enrich the uses of these urban parks including more activities, such as public swimming pools in proper locations. Creation of new parks or renewal of older parks should incorporate the proper vegetation species concerning trees, shrubs, ornamental bushes, etc. with efficient cover percentage. Parking lanes should be organized and drilling should provide water for the visitors.
2. Regional roads or ring-city roads that usually suffer from heavy traffic need to be protected with road tree lines, aiming to minimize air and sound pollution or both.
3. When urban planning produces new road openings and new pavement areas it is important to include tree lines and green points with the necessary flora species, e.g. aromatic species. Such an effort improves the aesthetics of the area and confronts pollution efficiently.
4. Optical protection is necessary in ugly areas within the city. These areas can be construction material, open warehouses, industrial lands, old houses, cemeteries, etc.
5. Private multi-storey apartment houses should be aesthetically improved through the planting of various flora species in public areas, back and front yards, roofs, pavements, along parking spaces, etc.
6. Big public buildings should also consider also their aesthetic improvement. A first step can be roof gardens for the public.
7. Parking spaces, cemeteries, zoos, railway stations, bus stations, gymnasiums, etc should be enriched with trees and vegetation for more green spots.
41
“Sustainable Management and Development of Mountainous and Island Areas”

8. Protection of the suburban environment and sustainable urban development according to EE Regulations
Tree-lines along the city roads need special care and should be protected measures and suggestions [13] that include:
a) replacement of poplars in road vegetation with more appropriate species,
b) light constructions for tree protection,
c) use of more trees along the roads,
d) enrichment of the variety of the species used,
e) increase of deciduous trees species that have the ability to allow the sun to pass through them in wintertime and also offer to the public the required shadow and coolness in summertime,
f) use of tree species with big and thick leaves that act as a barrier towards pollutants and function as biological filters, and
g) final selection of the tree species taking into consideration the design guidelines on landscape architecture and aesthetic values (e.g. required size, colour, texture and scheme).
3.2. Benefits from suburb green zones
Suburban green zones are those that start from the city borders and encircle them in continuous or fluctuating zones.
These green zones that surround communities should not be mistaken to those urban green zones that are located within the limits of the suburb civil communities, such as parks, yards, gardens, etc. The latter constitute urban green zones and make suburban communities more appealing to modern society.
The main parameters for the lessening of the natural suburban forests in our country are the arbitrary purchase of forest areas, forest clearings, land reclamations, the expansion of
the cities that take place without any particular urban planning. Forest fires that usually take place during the summer make things worse.
The majorities of these forests has been created artificially with extended land forestations or have been developed and upgraded through the efforts of local Forest Service Offices. Within that framework, many Greek communities – municipalities, communities and even villages – acquired in the middle of the 20th century smaller or greater pine or cypress’s forests.
The beneficial role of suburban green zones and especially forest and forest areas is focused on service delivery to the nearby cities. These services include:
a) the improvement of the watershed, b) the absorption and adjustment of
rainfalls, snow, etc. c) the protection of soil, d) the prevention of floods, e) the arrangement of running surface
waters, f) the creation of adequate ecosystems for
flora and fauna, etc g) the development of recreation sites, etc
Recreation is the most obvious service of suburban forests to the citizen and its value is based on certain characteristics that finally define the citizen’s wishes and requirements as well as future trends and selection models. There are basic parameters concerning the forest function of recreation, such as:
a) the frequency of the citizen’s visits in the neighboring forests,
b) the existence, rational organization and structure of recreation areas,
c) the available time for recreation in relation to the distance of these green areas,
d) the availability or not of private or mass transportation means,
e) heavy traffic in the recreation area in combination to easy transportation without problems,
f) the differentiation of the citizens towards the provided available recreation activities, and
g) the awareness of the public regarding protection of the environment.
Since it is difficult to measure and quantify information regarding suburban recreation, estimating the value of recreation is
42
“Sustainable Management and Development of Mountainous and Island Areas”

complicated matter. All estimations are indirect based on quantitative parameters that affect the qualitative parameters [3].
3.2.1. Suggestions for the improvement of suburban green zones
The improvement of the suburban green zones can be supported through the following guidelines:
1. Protection of the local environment, prohibition of throwing garbage in the suburban forest areas, creation of special infrastructure for the visitors, water, pic-nic areas, benches, etc
2. Vehicles access only predefined areas within the forest, aiming not to disturb the visitors
3. Mixture of deciduous and evergreen forest species for both aesthetic and ecological purposes such as stability of the ecosystem, increase of biodiversity, etc
4. Total prohibition of apiculture in suburban forests and parks since they can cause problems to the visitors
5. Protection and special care for local torrents within suburban green zones, with the upgradation of their vegetation in mixed type aiming to both flood protection and local ecosystem enhancement
6. Exploitation of existing water resources. They can even generated by the creation of dams that form small lakes for aesthetic purposes and for the increase of biodiversity
7. Registration and classification of suburban green zones aiming to prohibit their participation in urban development planning
8. Establishment of projects and studies concerning evaluation, management and assessment of the social role of suburban green zones.
9. Monitoring of forests according to EE Regulations for the protection of the environment
and their sustainable development
10. Use of new technology tools and applications aiming to effectively collect and analyze the available forest data and enhance decision-making
3.3. Benefits from forest green zones
Forest green zones usually include the following well known functions that also constitute important forest uses for society:
a) Water use, b) Hunting and fishing use c) Graze use d) Wood production use e) Biological reserves of forests f) Recreation-tourism use g) Natural monuments h) Mining areas i) Garbage disposition areas j) Climate stabilization k) Public health improvement l) Aesthetic use
The above-mentioned uses of the forests are widely recognized by society and their multiple purpose roles have been identified [12]. The public is increasingly becoming aware about the preservation and sustainable development of forests, aiming to offer goods and services to the society.
3.3.1. Suggestions for the improvement of forest green zones
The improvement of forest green zones can be effectively supported through the following guidelines:
1. Observance of EE legislation 2. Protection, registration, mapping
of all the available forest and forest areas in parallel to their soil classification
3. Increase, expansion and development of protective, watershed and aesthetic forest with the adequate funds from the government
4. Upgrading of the deciduous forests and systematic exploitation of forest plantations
43
“Sustainable Management and Development of Mountainous and Island Areas”

5. Creation of new protective and watershed forests in properly selected locations
6. Protection and preservation of virgin forests, nature monuments
7. Sustainable development of natural parks, biotopes and wetlands
8. Protection constructions to minimize the flood risk from torrents
9. road opening for protection purposes
10. Promotion of hunting, fishing and aquaculture in mountainous running waters
11. Renovation and coding of forest legislation aiming to resolve the ownership conflicts, forest and graze conflict of uses, development projects within forest areas, etc.
12. Innovation of forest co-operatives
13. Proper organization of forest industries
14. Rational distribution of forest service personnel according to special regional needs
15. Establishment of regional forest funds for research enhancement
16. final resolution of ownership registration for forest and forest areas within the country.
17. Renovation and periodical planning of forest policy guidelines according to the needs of society and the needs of the environment [5,19].
18. Use of new technologies for the protection of forests. Forest Informatics can be a useful tool for the organization and planning within all aspects of forestry, especially for decision-making purposes [14,15].
3. Conclusions-Discussion
The development and the exploitation of the forests in our country are still key issues and during the last fifteen years the governmental
forest service tries to establish a development process towards that direction.
The forecast is that in the direct future there will be an intense interest by the government for investments aiming to reclaim or create aesthetic forests to provide goods and services to the society. That will enable the exhausted city people who seek recreation and pleasure to discover a beautiful and healthy natural environment, away from the noisy, unhealthy and oppressive environment of their daily lives.
The provision of these goods and services depends on the existence and the structure of the forest. Additionally, our country has a rich variety of plants and animals, beautiful landscapes, etc a fact already recognized by the international scientific community. Although our country is small there is great biodiversity created by its great mountains, forests, the variety of forest species, the biotopes, the wetlands, the islands, the coasts in continental and island Greece. Hence, concerning biodiversity, Greece is considered of great importance in the European Union in particular and Europe, in general.
Biodiversity is defined as the presence of species and the percentage of their participation in the ecosystem. The protection of the natural environment demands the preservation and the strengthening of biodiversity on forest ecosystems, found in 4 different levels, such as a) variety of species (animals, plants, microorganisms), b) variety of ecosystems, c) variety of natural reserves in an area and d) variety of landscape (wider combinations and links within and between the ecosystems).
That biodiversity in our country is of great social, economic and cultural value. It a basic feature of the natural environment in our country that is of unique and rare beauty. Thus there is a need for the effective protection, management, expansion and development of forests and the natural environment [20]. For that purpose, it is imperative to properly plan and adequately design forest protection in parallel with generous state funding.
In Greece, where the majority of forests and forest areas are public, the Forest Service is a non-profit governmental division aiming at the protection and preservation of forests and forest areas. The Forest Service has to preserve the forest character of the above forest areas
44

through proper organization and planning [1],[2],[4],[19].
National forest policy regarding local development strategies aims at the well being of the population of the area in economic, cultural and social terms [16]. Infrastructure projects for the regional development of forest areas have to be planned and distributed with the proper social criteria in order to contribute to the social improvement and financial development of the population [21]
Forest science, due to its multidisciplinary nature, requires the adoption of powerful technological tools to aid management decisions. Computer software systems are in the focus of modern decision-making, including data/information storage and management, data availability and alternatives’ formulation and selection [1]. Thus, new technologies can be a useful tool in dealing with the problems which need to be solved [5],[10],[ 15]
Furthermore, Greece, as a member-country of the E.U, has to follow the common regulations and directives enacted by the EU for the protection of the environment [2],[7],[18].
On the basis of the above, there is a huge need for a more effective planning and organization, concerning forests and forest areas along with the application of the proper forest policy aiming at the protection and development of urban and suburban green zones and multiple purpose forestry [4],[14],[15].
Therefore, the urban and suburban green zones and forests will be able to meet the needs of the society in goods and services.
REFERENCES [1] Andreopoulou, Z.S., Vassiliadou, S.E., Papastavrou, A.C. Human Resources Data Base Management Using Microsoft Visual C++™ for Greek Forest Administration. Proceedings of the 2nd International Conference HAICTA- Hellenic Association of ICT in Agriculture, Food and Environment Conference; 2004. March 17-19; Thessaloniki: 2004, pp.209-218 [2] Andreopoulou, Z.S., L.S. Iliadis, A.C. Papastavrou. “Development of spatial DB as an administration tool for the exploitation of the potential in FDO in protected areas in Thrace Region”. In the Proceedings of the International Conference “Protected Areas-
Natural Monuments and Local Development”; 2002 July 20-22; Lesvos. University of Aegean-Department of Geography. [3] Christopoulou, O.G., A.C. Papastavrou. Evaluation des Comportement des Visiteurs des Station de Spor D’Hiver pour une Gestion plus Effectrive (Cas de Pelion). MEDIT 1997; 1, Mars 1997. Centre International de Hautes Etudes Agronomiques Mediterraneennes, Bologna.[4] Dimitriadis, . Administration - Project Management. New Technologies Editions. Athens; (1996). [5] Iliadis, S.L., A.C. Papastavrou, Lefakis P.D.. A Computer-System that Classifies the Perfectures of Greece in Forest Fire Risk Zones Using Fuzzy Sets. Forest Policy and Economics 2002;4(1):43-54. [6] Karameris, A.K. The role of green in the improvement of the quality of urban environment. Scientific annals of the Department of Forestry and natural environment.1989;.Volume L.B. Thessaloniki. [7] Kostopoulos, T.I. European Union and Local Administration. Volume A. Papazisi Editions. Athens;1996. [8] Papastavrou, A.C.. The social role of forestry. Scientific annals of the Department of Forestry and natural environment; 1988. Volume L.A. Thessaloniki. [9] Papastavrou, A.C. The suburb forest-park of Thessaloniki before and after the forest fire of July 1997. Proceedings of workshop, Macedonia Studies Society. Thessaloniki; 1999. [10] Papastavrou, A.C. Introduction in Forest Informatics. Pegasus 2000 editions. Thessaloniki.;2001. [11] Papastavrou, A.C Social Role and Perspectives in the Development of urban and suburb green zones. Macedonia Studies Society. Thessaloniki; 2003a. [12] Papastavrou, A.C. Principles and guidelines of Forest Policy for the Development of Forests. Proceedings of the 11th Panhellenic Conference of Forestry Society: «Forest Policy, Coppice forests, Protection Natural Environment» 2003b September 29-October 3, Ancient Olympia, Greece, 2003 [13]Papastavrou, A.C., Goupos, C.V. Forestry Extensions. Publications Dpt. In AUTH. Thessaloniki; 1996. [14] Papastavrou, A.C., Lefakis P.D., Andreopoulou Z.S., Iliadis L.S.. Forest
45
“Sustainable Management and Development of Mountainous and Island Areas”

Informatics-Volume II. Department of Publishing of A.U.TH. Thessaloniki; 1999. [15] Papastavrou, A.C., Lefakis P.D., Iliadis L.S., Andreopoulou Z.S., Forest Informatics-Volume I. Department of Publishing of A.U.TH. Thessaloniki; 1999. [16] Papastavrou, A.C., Makris, K.I. Forest policy. Volume A. Publishing Department of AUTH. Thessaloniki; 1985 [17] Papastavrou, A.C., Makris, K.I. Forest policy (especially in Greece). Volume B. Publishing Department of AUTH. Thessaloniki; 1986 [18] Papastavrou, A.C., .S. Andreopoulou,
. . Goupos, P.D. Lefakis. Legislative Framework for the Development of Informatics within Forest Administration. Scientific Annals of Department of Forestry and Natural Environment; 1998. Volume .Aristotle University of Thessaloniki. Thessaloniki. [19] Papastavrou, A.C., .S. Andreopoulou. The Contribution of Informatics in Forest Service. Proceedings of the 9th
9 Panhellenic Conference of Forestry Society; 2000. October 17-20 Kozani, Greece; 2000. [20] Tampakis S., A.C. Papastavrou, C. Goupos, Karanikola, P. Assessment of Protection and Management of Greek Forests. New Medit ; 2003, 3. CIHEAM. Bari. Italia [21]Theoharopoulos, D.G., A.C. Papastavrou and N.E. Anagnos. Mountainous areas development through the exploitation of natural resources. Case study: The Fokida prefecture, Greece. Proceedings of the International Conference: “Forest Research: A Challenge for an intergrated European Approach – Sosioeconomic aspect of forestry; 2001 August, Vol. II - Forest Research Institute – Thessaloniki, 2001.
46

Indigenous Resource Management and Environment in a Subsistence Mountain Economy in Southern Greece
Eugenia A. Petropoulou
School of Social Sciences, Department of Sociology, University of Crete, Gallos Campus, 74100 Rethimno, Crete, Greece
Email address: [email protected]
Abstract. Considerable attention has focused on the potential of indigenous agricultural knowledge for sustainable development. Drawing upon fieldwork on the natural resource management practices of diversified farming systems in a mountainous community in Southern Greece, this paper will examine the potential of the traditional system for a sustainable food security strategy. It also explores the stock of indigenous knowledge and information about land degradation assessment and management held by small-scale farming communities. Problems of land degradation are reviewed, such as loss of soil fertility, application of inadequate amounts of organic fertilisers, lack of mulching, etc. It is argued that sustainability depends on more than ecological factors and in particular, requires sensitivity to socio-economic parameters such as labour demands and food security policies.
Keywords. Southern Greece, indigenous resource management, land degradation, mountain economy, sustainable development.
1. Introduction
In most southern European countries a respective amount of food and cash crops are still produced by small-scale mountainous farmers using traditional farming methods. Significant yield increases have been achieved in these farming areas due to modern farming techniques. But this marriage between traditional and modern farming methods has its drawbacks stemming from inappropriate EU and state policies, low population densities, market forces and biophysical-agroclimatic factors. Inevitably this has brought into sharper focus issues of food security and self-sufficiency in those nations still dependent on mountainous small-scale traditional farming systems [1].
Specifically, the mountainous areas of Greece, comprising nearly three-quarters (65%) of the national territory [2], have attracted the attention of many academic, EU, state, policymakers and planners over the past 20 years, primarily to evaluate environmental conditions and population loss stemming from rapid agricultural transformation and modernisation policies [3]. Most studies explored the extent and causes of population loss and sustainable management of mountainous resources [4]. Little attention has been paid to the status and management of agricultural lands, which account for a substantial proportion of the total land area. Numerous studies have been undertaken on agricultural land over the past two decades, but most of them have been confined to the analysis of crop production and cropping patterns [5]. The few in-depth studies on land management focused on farmers’ local livelihood strategies [6, 7]. No studies have examined the environmental implications of the on-going land use and management practices in the pursuit of formulating a sustainable mountain development and food security strategy. Its relevance is explained by three major factors.
1. Being mostly steep slopes, agricultural lands are vulnerable to accelerating soil erosion, causing land productivity to fall [8].
2. Agricultural lands in the mountains in Greece are characterized by low population density due to socio-economic and political factors. Hence, land abandonment as a result of outmigration and off-farm employment in the Greek mountains leads to less productive and susceptible to environmental degradation lands [9].
3. Although agriculture is considered as the economic mainstay of the majority of households in Greek mountains, primarily it operates to meet subsistence needs. Recent EU structural policies directed to the so-called Less Favourable
47
“Sustainable Management and Development of Mountainous and Island Areas”

Areas (LFAs) - namely, mountainous, semi-mountainous and disadvantaged areas of the member-states – aimed mainly at raising farm productivity and thus farm incomes, and/or non-farming employment opportunities [10].
In a mountainous environment lands are susceptible to accelerating soil erosion and thus, land degradation [11]. Therefore, understanding the stock of indigenous knowledge possessed by farmers for land resource evaluation and the management of their peculiar environments may be crucial in the development of renewable resource management strategies that will provide a long-term base for sustainable agricultural production [12]. Accordingly, this paper examines the role of land use and land management practices in soil conservation with reference to a small mountainous community in southern Greece. The specific focus is on landholding structures, crop diversification, cropping intensity, agroforestry, crop management practices and indigenous resource-conserving practices. Moreover, the study aims to describe traditional methods of recognizing and managing the various stages of land degradation. It employs techniques of qualitative investigation to determine what knowledge is possessed by mountainous small-scale Greek farmers. Besides contributing to studies on the mountains, this study will contribute towards the formulation of an environmentally and economically sound land management and food security strategy consistent with indigenous values.
2. Research design
Information on local land use and management practices was collected through a questionnaire survey of 26 households from a total of 98, in a resource-poor mountainous community of southern Greece, Alagonia.
The lack of lists identifying individual households prevented the adoption of simple random sampling to determine which households were to be surveyed. Agroecological transects or the random walk method were adopted into different parts of the village[13]. The survey was contacted from the fourth week of May until the fourth week of July, 1995. The survey included information on landhoding structures, cropping systems, agroforestry, land management and environmental-conserving practices. Field observations were also carried out and informal
interviews held with farmers to evaluate the resource management systems. In addition, each farmer, with the researcher, were directly involved in various fields and site inspections to evaluate the evidence of various stages of land degradation known to the farmers.
The utilization of inexpensive and rapid qualitative field techniques facilitated the appreciation of the indigenous traditional knowledge and information which is necessary to the formulation of the “bottom-up” renewable resource management policies.
Finally, supplementary information was collected by unstructured interviews and personal discussions with key informants (e.g. secretary and president of the village) and extension workers on the transformation of farming systems and on land degradation matters. All information was analysed using SPSS.
3. Description of the study area
Alagonia is located at the foothills of mountain Taygetos within the province of Kalamata, prefecture of Messinia, southern Greece, department of Peloponesos. The mountain of Taygetos, catches the rains blown on from the Messinian gulf all winter and is very wet from around the end of November to the beginning of May. Alagonia retains much of this rainfall which bubbles out of hundreds of natural springs during the dry part of the year. It extends some 22,100 stremmata (10 stremmata = 1 ha), about the point 37˚ 07 North; 22˚16 East and its agricultural lands both arable and pastureland account for nearly 58% of the total land area (Agricultural-Livestock Census, 1991). At its highest point the land of the village rises to over 850m. a.m.s.l., falling around 700m. Mean annual temperatures range from 14˚C to 16˚C.
According to Nakos [2], the soils of the study area are usually shallow (depth ranging from 5 to 30cm) with slopes ranging from 18-25% in ridges and from 14-21% for terraced cultivated sites within the village. The vegetation of the terraced site - now greatly reduced in extent and composition - ranges from coniferous trees, scrubs, plane trees, orchards, cherry-trees, chestnut-trees, fruit trees, olive-trees, pasturelands and agriculture. Soils here range from deep dolomitic limestones to loamy/skeletal texture of the main arable area.
These lands are suitable for both arable and non-arable agriculture. The regular hoeing and
48

ploughing involved in arable agriculture results in frequent disturbance of the soil structure. Non-arable agriculture, however, does not cause such frequent disturbance in soil structure, as lands are not regularly tilled. Despite requiring regular hoeing and ploughing, arable agriculture does not aggravate high rates of soil erosion, since lands are nearly leveled.
Agricultural lands on ridges and slopes of the greater Alagonia area between 1300 and 1750m range from limestones to loamy/skeletal texture on the sides of the steeply sloping mountain peaks. As a consequence of their soil characteristics and because these steep slopes are vulnerable to accelerating soil erosion, they are most suitable for agricultural systems which do not require regular hoeing and ploughing, i.e. forestry, livestock raising. The vegetation of the terraced area, now greatly reduced in extent and composition, ranges from fir forests, scrubs, pine trees, plane trees, perennial springs, fruit trees, olive-trees, pasturelands and agriculture.
The annual average precipitation is between 986 to 1,150mm. Most rainfall is concentrated between the months of March and October and frosts may be expected from December to March. Steep slope gradients combined with a relatively heavy rainfall have made these lands vulnerable to accelerating soil erosion. It is thus important to examine the on-going agricultural and land management systems with regard to their role in soil conservation and management.
3.1. Landholding structures
Agricultural lands in the study area constitute 16.7% of cultivated area and fall into two main categories, rain-fed lands (10.8%) and irrigated lands (5.9%). Pasturelands constitute 41.2% while forests constitute 42.1% of the total land use area (Fieldwork data, 1995).
The limited amount of land suitable for agriculture, combined with a rising rural population prior to 1950s (about 1,000 inhabitants) increased the demand for land and gave rise to a mountainous agricultural economy characterized by small landholdings. Migration patterns and depopulation rates in the early sixties and seventies (drop of population to 541 inhabitants) accelerated land abandonment since the already small landholdings were not easily sold or rented out [3].
Anthropologists on the other hand argued that landholdings in Greece are becoming smaller and economically marginal as a result of the division of property between heirs [14]. In reality there is little conclusive evidence to demonstrate such a trend. The task of providing such evidence is made more difficult by the fact that historical data on changes in farm structures are scarce in Greece, particularly at the local level where they are either under-estimated or over-estimated depending on whether farmers want to minimize land taxes or obtain subsidies [15].
Thus, historically as well as present, mountain farmers have been working on small landholdings, which are getting steadily smaller in size due to an ageing agricultural workforce, increasing outmigration rates and EU hill farmers’ compensatory allowance schemes(under these agricultural modernization schemes farmers over 55 years of age have to rent or sell part or all of their land to younger farmers in order to get an early retirement pension) [16].
The study area is not an exception. According to fieldwork data (1995) Alagonia was divided into large (>71 stremmata), medium (51-70 stremmata), medium/small (21-50 stremmata) and small (<20 stremmata) landholdings where one ha equals with 10 stremmata. None of farmers’ landholdings exceeded 7.5 ha or 75 stremmata. Notably more than three-quarters of the households surveyed had landholdings smaller than 50 stremmata or 5 ha accounting for 73.1% of the total landholdings, leading thus to agricultural intensification.
3.2. Crop diversification and mixed cropping
As noted earlier, the land use potential differs throughout the study area owing to variations in soil type, elevation and slope gradient. Despite this, there was no significant variation in cropping pattern. Owing to the small size of landholdings and scarce non-farming employment opportunities, virtually all farm households had utilized their lands for potato (84.6% of total cropped area), vegetables (73.1% of total cropped area) and cereal crop (61.5% of total cropped area) production to safeguard their food supply. Agroforestry products such as cherry-trees, chestnut-trees, walnut-trees, apple-trees and olive trees accounted for 34.8%, 19.2%, 3.8%, 11.5% and 30.8% respectively of the total cropped land.
49
“Sustainable Management and Development of Mountainous and Island Areas”

Confronted with the problems of increasing food security demand and marginal landholdings, farmers of the study area have adopted a practice of mixed cropping or growing two-three field crops simultaneously in one plot, as a strategy of securing more produce by tapping limited resources, both human and environmental. The maize-bean-squash complex was the predominant type of mixed crop combination in almost all landholdings according to informal interviews and fieldwork walks.
Crop diversification and mixed cropping are both environmental and economically sound practices. When two or more crops are grown in sequence in the same field, each crop uses the fertility of the soil in its own particular way. Different plants grow to different depths and require different nutrients [17]. When many plants are associated in the same field, more waste and organic matter are available. The economic benefits of mixed cropping could be three to four times higher than that of monocropping on a per hectare basis [18].
To make therefore, the best use of limited land resources, farmers plant maize, beans, and pulses on bunds and terrace risers. Owing to the ever-increasing demand for food, farmers cannot cultivate single legume crops in farm plots. Although there is the possibility of cultivating these crops in fields following the harvesting of potatoes, farmers have not taken any initiative towards it, owing to a- the tradition of releasing livestock into the fields, and b- farmers’ lately economic interest on profitable garden crops.
3.3. Cropping intensity
Having assessed the intercropping pattern of the study area, it is sensible to examine the intensity of land utilization.
The Alagonian potato production system is relatively old, first introduced in the area at the beginning of the 20th century and fully developed after the 1930s in the study area [19]. Overall, potatoes were more intensively cultivated than any other arable crop. The traditional indigenous rotation system of potatoes used to enhance soil fertility. Potatoes for example were planted near mountain ridges, from 1,250 to 1,300m, for the first year, during March or April and were harvested between September-October. In November the plots were cultivated with barley or oats and sown in late June early July. Then the same plot was left either fallow or cultivated with legumes to enhance soil fertility, such as
lupines, for a year before beginning again the rotation cycle with potatoes (State agronomist, 28.07.95). This can be described as a three year rotation system.
The post 1970 period, a period of rapid scale enlargement and intensification for rural Greece in general [20] had a direct impact on farming practices with specific reference to the potato production system of the study area. In this context the potato rotation system on the ridges had slightly changed. Crop rotations of two years were then the norm meaning that potato plots were not left fallow or cultivated with lupines but instead land was chemically fumigated in order to receive the new cycle of potato crop.
Three to four times per year, the potato plots were disinfected from rotten potatoes. The intensification of potato planting reached a mean of one ton per every two stemmata (10 stremmata = 1ha) compared to that of one ton in every five stremmata (State agronomist, 20.07.95). The frequency of potato growing and the decrease of fallow years influenced the number of pests and diseases in different potato plantings.
After the country’s accession to the EU accompanied by trade liberalization and the suppression of state monopolies, the Agricultural Ministry of Greece could not function any longer as the main regulator and distributor of potato-tuber production. Non-governmental or private institutions took over the distribution of potato-tubers by importing cheep seeds from abroad instead of producing them locally. This was due to the high cost of labour, lack of mechanization and land fragmentation in the mountainous areas of Greece. Farmers of the study area were placed in a position of marginality expressed with outmigration patterns, off-farm employment and land abandonment. The remaining population (410 inhabitants up to the late 1990s) in order to secure their food supply restricted the cultivation of potatoes within the village area (between 700-850m of altitude) and near household farm plots. The reason for cultivating plots relatively close to farmhouses was that the remaining farmers were old enough (63% over 55 years of age) and they lacked means of transportation.
Now most plots had been utilized for three crops per year when moisture and nutrient supplies were considered adequate. Potatoes were cultivated in March and harvested towards the end of September. Maize was sown in November and harvested in July. Beans were intercropped with maize, normally for four
50
“Sustainable Management and Development of Mountainous and Island Areas”

weeks before the harvest of the latter crop. Alternatively some plots after the harvest of potatoes were sown with wheat or oats. Following the potato harvest from the last week of September until the first week of November, most farm plots were left fallow. In the case of maize most plots were left fallow from the end of July till early November. Thus, the lands of close proximity to the farmers’ households were being gradually utilized for both winter and summer crops to cope with the problem of food supply (Semi-structured interviews, 1995).
3.4. Agroforestry
Planting trees in association with field crops is a long established tradition in the mountains [21]. Accordingly, farmers in the study area had grown assorted varieties of fruit fodder/fuelwood trees. The most common varieties of local fruits cherry, apple, pear, plum, fig, black cherry, and blackberry were the typical variety of fruits found in less than 800m altitude, close to farmhouses. Despite suitable soil, temperature and moisture in the ridges, all the farm households in Alagonia were engaged in fruit cultivation within the village area.
Regarding the fodder/fuellwood trees, chestnut, walnut and olive were the predominant species grown in farmlands. Confronted with the problem of shrinking forest resources, lack of transportation facilities, these trees have been highly useful in fulfilling fodder/fuelwood and economic requirements of farmers. They were found to be nearby the village’s settlement than in the ridges, owing to relatively distant location and strict municipal control of forest [22].
Moreover, farmers of Alagonia had grown fruit and fodder trees mixed with maize and wheat crops primarily on terraced plots close to farmhouses. Specifically, fruits were found confined mainly to homeplots as these were well fenced to prevent cattle and human trespassing. As their landholdings were highly fragmented (an average farm household held seven plots), it was futile for farmers to plant fruit trees on scattered farm plots which could not be either fenced or watched regularly to prevent the theft of fruits.
The increasing number of trees estimated in Alagonia does not mean that local farmers plant trees in response to a generalized rational of conservation, still less to theories about the influence of trees on rainfall, but for reasons that are specific to the species in question. Trees are
investments of capital and labour and have implications for the management of mountainous small scale-farming [23]. Trees, therefore, like cherries and chestnuts are of vital importance to the indigenous population. Oral interviews with farmers suggested that one of the main reasons, cherry and chestnut-trees are planted today, is due to the lack of young labour to convert and maintain the hilly land into terraces. This is attributed to changes in labour availability as already mentioned, combined with changes that occurred in the production system of potatoes, which had therefore shifted the calculus of land use. A point was reached where there was a corresponding shift in land use towards intensive tree crop cultivation.
The decision to plant trees also reflects a gender division of responsibility and rights of access to the farm. Men plant trees for their commercial value (e.g. olive-trees and lately chestnut-trees); fuel (e.g. olive-trees and walnuts) and for ornamental, or shade purposes (e.g. chestnut and walnut-trees) [22, 23]. Women favour fruit-trees of their need for household food supplies or amenity purposes.
Furthermore, fruit and nut-trees require little start-up capital or special education, according to [23]. They compete minimally with the stable crops of Alagonia, potato and olive-tree (i.e. harvesting time of tree crops differ), representing an attainable form of intensification securing food for the remaining of the population and providing them with an extra income (informal interviews, June-July, 1995).
4. Resource-conserving practices of land management
This section will deal with resource-conserving practices used in the productive system of the study area, and also to the local knowledge which supports their use. Farmers typically posses a great deal of indigenous knowledge of their productive environments. Such knowledge relates to soil conservation elements such as contour tillage, fertilization, fallowing, surface mulching etc. The information presented below relies heavily on informal interviews and participant observation [24].
4.1. Soil conservation
Conservation can consist of appropriate agricultural practices (i.e. indigenous tillage) or the construction and maintenance of terraces, etc.
51
“Sustainable Management and Development of Mountainous and Island Areas”

to limit soil loss. Traditional operations such as contour tillage, terracing, mixed cropping, fallowing, fertilization, surface mulching will be reviewed in this section [24].
Contour tillage. All farm plots in Alagonia are terraced while soil tillage is based upon local technical knowledge. Of the farmers interviewed 75%, cultivated on the contour. Of these, 96% stated that they did so in order to minimize run-off and hence erosion. In no cases were ridges used at right angles to the prevailing wind in order to control wind erosion, thus suggesting that farmers believe water erosion to present a greater problem. In all cases cultivation involved ploughing (i.e. ridging) and subsequently planting and cultivation on the contour rows.
In several cases farmers applied different methods within the same field, cultivating on the contour where the slope was gentle (within the village), and on the grade where the slope was steep (in the ridges). There were observed examples of cultivation on the contour where the slope was evidently too steep and thus storms and heavy rains had caused extensive overstopping and breaking of the contour rows and subsequently gullying and soil wash.
Terracing. Most farm plots in Alagonia have been terraced for more than 20 years. Reportedly, most plots were terraced many centuries ago. This is consistent with statements of the majority of respondents in Alagonia, that they didn’t know how these terraces were constructed. Household labour is scarce meaning that a very small proportion of households have been involved in terrace construction or preservation. In order to preserve the already existent terraces 25% of farmers plant crops, grass or even small trees along contours or the back of a terrace. As the water flows across the surface it meets with rows of plants growing perpendicular to the flow, and slows the water down by preventing soil erosion and improving infiltration. This is a low input alternative to the construction of physical structures that generally require large labour inputs, lacking in Alagonia.
Mixed cropping. Mixed cropping is widely practiced in the study area with 74% of farmers intercropping between two and three crops. The great majority of cases were a mix of maize, lima bean (Phaseolus spp) and squash (curcubita pepo).
Mixed cropping has the potential to reduce erosion by having a crop on the land for a longer period of the year. However, in this study area the crops cultivated have widely similar growing
seasons and thus the potential for this benefit is reduced (see section 3.2). Nevertheless the inclusion of legumes in the system may improve its nitrogen available for cereal crops or maize.
The stated objectives of the farmers interviewed about mixed cropping did not include an awareness of its potential for improved soil conservation. In the majority of cases intercropping was undertaken as a strategy to hedge against risk.
Fallowing. Fallowing was used by a great extent in the study area. Less than 10% of farmers stated no practice of fallowing and if so it was only for a limited period. Fallowing ranged from 5-8 years. “Bareness” of land for such a long period could lead to soil erosion and as farmers stated outmigration was the major constraint for abandoning field plots.
Fertilisation. All farmers applied manure/compost to their field crops, yet the question arises if the supply was adequate from their subjective perspective. Despite this there is a decreasing ability to support cattle compared to the period before 1980 due to high levels of out migration and consequent changes in labour availability.
Instead inorganic fertilizers were used by all respondents of the village. When they were asked “if they used animal manure at all”, 24 cases out of the 26 answered positively. When analysed 92.3% use animal manure along with inorganic fertilizers. Olive crops and homegarden vegetables received animal manure (69.3%) and only 3 cases less than 10% reported the application of organic fertilizers on potatoes along with organic fertilizers. The amount of manure applied was not specified. This is consistent with the assumption that nowadays mountainous farmers largely depend on chemical fertilizers.
Composting on the other hand conserves existing nutrients. Although it was not included in the form of a question in the survey questionnaire it was observed as a practice in few Alagonian farm plots. A handful of farmers mix household wastes, crop residues or twigs of trees before applying. This practice takes place in summer, few weeks before sowing in order to prevent quick digestion of organic matter as a result of high temperatures [24]. Composting demands high labour availability both in the building of heaps and in the spreading on fields. For this reason when practiced is limited to homegardens.
52
“Sustainable Management and Development of Mountainous and Island Areas”

Surface mulching. Mulching could be a very effective practice for conserving soil nutrients or providing a protective cover at a time when crop cover is not present. For example, the vegetation cut down to make way for cropping could be used as mulch which not only adds nutrients and organic matter to the soil but also protects it from soil erosion. Thus, surface mulching or leaving crop stalks in the field is an important biological measure to protect soils from being directly exposed to agents of erosion and to improve soil structure and restore fertility [24]. Most of the respondents in Alagonia, regardless of their socio-economic status, reported that they didn’t leave crop residues in their fields.
Wider use of this practice may well be restricted due to the relatively small amounts of residue available and the competing uses which exist. For example, the use of residues as animal fodder was witnessed in many farm plots. Furthermore, the density of mulch viewed in many fields was below the level required to be most effective as a protective cover.
5. Environmental degradation
Despite being comprised of high ridges (up to 1300m) and lower in altitude lands (700-800), with different types of biophysical conditions (see also section 3), there was not significant variation in land use and management practices in the study area.
This section will help to identify the critical land characteristics used by local farmers to assess the level of land degradation and thus the need for management. The utilization of the local stock of knowledge can be viewed as an alternative approach to the control of land degradation. It can be argued that such an alternative can form one of the bases for agricultural development in the mountainous areas of Greece [12].
Thus, the research findings show that Alagonia sees land degradation as composed of two distinct stages, each with recognizable signs on the landscape, namely: incipient and advanced stages of land degradation.
5.1. The incipient stage of land degradation
Farmers in Alagonia seem to recognize early signs of land degradation by examining a number of indirect factors which affect the quality and physical appearance of their crops and fallow
lands. This is not surprising because it is well known that in most traditional societies people have developed a remarkable stock of knowledge about their environment by using a range of indicators to make valid statements and prediction about the conditions of the physical world, e.g. weather and food forecasts. In this regard, Table 1 shows that most farmers recognize the following as the early signs of land degradation, namely: a- loss of soil fertility; b- extinction of plant varieties; c- increasing appearance of pests on farms; d- appearance of weeds on the farms and e- increased frequency of crop diseases.
Table 1: Early signs of land degradation Alagonia
Early signs of degradation Cases %Loss of soil fertility 18 69.2 Extinction of plant varieties 3 11.5 Appearance of pests on farms 23 88.6 Appearance of weeds on farms 14 53.8 Increased frequency of crop diseases 13 50.0 Source: Fieldwork data, 1995; Total number of farmers interviewed accounted for 26 cases
From the five indicators of land degradation identified by farmers, “increased frequency of crop diseases, appearance of weeds and pests” are those which directly destroy crop foliage and harvestable products or overrun farm lands, thus providing the farmer with glaring evidence of degradation. The one and final sign that of “loss of soil fertility” is that which provided the farmer with some indirect evidence of the declining nutrient status of the soil which in turn affected crop yield, thus marks the onset of land degradation.
It may be seen, therefore, that the early process of land degradation is well articulated in the minds of the farmers in Alagonia. Usually, after several years of observation, through close association with land during farming periods and activities, farmers acquire diverse information and knowledge on environmental characteristics. For example, the appearance of certain weeds on farmlands is also indicative of micro-climatological changes taking place within the mountainous environment of Alagonia. Typically, the floor of the forest is almost devoid of grasses and is characterised by a thick layer of organic matter. According to a group discussion, the paucity of plants in the herb layer in the forest was due largely to the grazing of flocks and to the burning and cropping farming
53
“Sustainable Management and Development of Mountainous and Island Areas”

practices. With the gradual afforestation measures taken by the Forestry Department and the local migration waves accompanied by a decreasing rate in the number of grazing flocks, the rapid growth of weeds belonging to the filicales family took place. It can be assumed that farmers were right in selecting the presence of weeds, which were alien to the forestry area, as a major indicator of degradation.
5.2. Advanced stage of land degradation
In contrast to early stages of land degradation, where farmers had to employ indirect indicators, advanced degradation was associated with more visible and direct signs, particularly those relating to soil appearance and vegetation cover, as well as crop yields.
Only two signs of advanced land degradation were reported by the majority of farmers. All of the cases interviewed (100%) commended on sandy or coarse top-soil texture, which is normally associated with areas of severe sheet erosion, as the most striking evidence of a degraded landscape. Highly erosive landscapes were found in ridges due to over-cropped potato farmlands in the 1970s and the abandonment of those lands in the 1980s. Decrease in crop yield is the last and equally important sign of advanced degradation in Alagonia. 88.5% of farmers who identified this sign saw it as obvious evidence of declining soil fertility and consequently land degradation. Farmers of the study were conscious about the infertility of degraded soils.
6. A checklist validation of farmers’ assessment
In order to assess with greater clarity and objectivity the elements which guided farmers’ assessment of degradation in the area, a checklist was complied of potential major degradation indicators. The list was derived from various sources which included:
a- reconnaissance survey of farmers’ viewpoint; b- interview with experts, extension workers etc., c- existing literature on land degradation [25].
From such sources, five major groups of indicators were identified (Table 2), with each group containing three to five indicators.
The checklist of indicators was presented to farmers to validate the importance attached to each during their individual assessments of land degradation.
Over 96% of farmers used land tenurial changes in their evaluation and accorded each of the tenurial indicators high to very high ratings (Table 2). This is not unexpected since changes of tenure systems from ownership to rented land are often sited as the first sign of the onset of degradation [26].
Table 2. Checklist validation of land degradation Rating of indicators by farmers
Indicators Severity* % using it A. SOIL 1. sandy soil 4 100.0 2. surface crust 1 14.8 3. soil texture change 4 87.0
B. EROSION 1. sheet erosion 3 10.0 2. gully erosion 1 0.0 3. badland 1 0.0
C. VEGETATION 1. forested 5 85.2 2. vegetation density 5 71.3 3. dominance of pests 4 87.0 4. drop in crop yield 4 88.5
D. FARMING PRACTICES 1. monoculture 1 0.0 2. reduced fallow periods 1 0.0 3. change in cropping system 4 50.0 4. overgrazing 1 0.0 5. use of manure 2 55.5
E. LAND TENURE 1. individual ownership 4 96.3 2. rented land 4 96.3 3. land fragmentation 5 100.0 4. conflict over land 5 100.0 * Meaning of severity rating scores (modal score): 1. absent or insignificant; 2. low; 3. moderate; 4. high; 5. very high. Source: Fieldwork, 1995.
Although indicators of land tenurial changes feature predominantly in the checklist assessment by the people, they were not associated, per se, with the early and advanced
54
“Sustainable Management and Development of Mountainous and Island Areas”

signs of degradation. It is possible that the farmers gave greater weight to physical characteristics and changes to their physical environment until in a direct interview situation they were forced to confront the part played by human related factors.
In addition to land tenurial changes there was one more important category of indicator – vegetation. In general, it may be observed that the checklist validation technique of land degradation indicators confirms in broad terms the extent to which small-scale traditional farmers in Alagonia have an accurate knowledge of their immediate environment and the various changes taking place in their physical world.
7. Conclusion
This paper has attempted to contribute to the evaluation of mountainous small-scale indigenous farming systems and management. It also attempted to explore the stock of indigenous knowledge and information about land degradation assessment and management in southern Greece. The information presented outlined farmers’ landholding structures, indigenous agronomic knowledge regulating cultivation such as crop diversification, mixed cropping, cropping intensification and agroforestry to cope with issues of food shortage arising from their marginal lands. All farmers’ plots were terraced although not preserved regularly due to labour shortages. Nevertheless out migration patterns, and an on growing elderly population led to increasing hoeing and ploughing rates of lands located in close proximity to household farms. Furthermore, the application of inadequate amounts of organic fertilizers, lack of mulching and fallowing of lands for too long a period without any vegetation cover can lead to the assumption that the terraced lands were undergoing unsustainable rates of degradation. Farmers’ assessment of degradation in the study area was examined while a checklist was compiled of the potential major degradation indicators. In particular, the visible attributes of soils and physical landscapes, as well as noticeable changes in the composition and appearance of flora and fauna, were drawn upon to describe the character and process of land degradation in the area.
At another level, one of the findings of the land degradation assessment was that farmers placed over-riding emphasis on the physical characteristics of their environment in judging
the various stages of degradation. The contributory roles of people and cultural land practices were largely ignored until they were prompted through the checklist validation procedure. The major implication is that farming mountainous communities need to be educated on the human aspects of degradation and in fact the interrelatedness of cultural activities and the physical world.
Furthermore, while this discussion has drawn attention to the potential for food security and self-sufficiency in the so called LFAs still dependent on small-scale ecological production systems, sustainability depends on more than ecological concerns [10]. It also depends on government pricing policies, market forces (see sections 3.2 and 3.3) and on the maintenance of young labour force if indigenous systems of land conservation are to be improved.
Finally, mountainous farmers recognize the essential role of government in ameliorating land degradation problems in the study area, despite the fact that their views were hardly ever incorporated into past policies. The continued faith in government derives from the weak socio-economic strength and financial resources of community members in tackling basic land degradation problems facing them. Future policies, therefore, must reciprocate by integrating community views on land management as discussed in this paper and finance land conservation efforts at the community level. Meanwhile, much empirical work remains to be done on mountainous small-scale indigenous farming systems.
References
1 Altieri, M.A, Anderson, C.A. An Ecological Basis for the Development of Alternative Agricultural Systems for Small Farmers in the Third World. American Journal of Alternative Agriculture 1986; 1: 30-38.
2 Baxevanis, J. Economy and Population Movements in the Peloponesos of Greece. Athens: National Centre of Social Research.
3 Beebe, J. Basic Concepts and Techniques of Rapid Appraisal. Human Organisation 1995; 54(1): 42-51.
4 Black, R. Crisis and Change in Rural Europe. Aldershot: Ashgate Publishing Ltd; 1992.
5 Blaikie, P.M. The Explanation of Land Degradation. In: Ives, J.D., Pitt, D.C, editors. Deforestation: Social Dynamics in Watersheds
55
“Sustainable Management and Development of Mountainous and Island Areas”

and Mountain Ecosystems. London: Routledge; 1988; 132-158.
6 Boserup, E. The Conditions of Agricultural Growth and the Economics of Agrarian Change under Population Pressure 1965; Chicago: Aldine.
7 Carter, A.S, Gimour, D.A. Increase in Tree Cover on Private Farm Land in Nepal. Mountain Research and Development 1989; 9(4): 381-391.
8 Conacher, A, Sala, M, editors. Land Degradation in Mediterranean Environements: Nature and Extent, Causes and Solutions. Chichester: John Wiley & Sons, Ltd; 1995.
9 Conway, G.R. Agroecosystem Analysis. Agroecosystem Analysis 1985; 20: 31-55.
10 Conway, G.R, Barbier, E.B. After the Green Revolution: Sustainable Agriculture for Development. London: Earthscan Publications Ltd; 1990.
11 Damianakos, S, Kassimis, B, Maropoulou, M, Zacopoulou, E. Trois villages d’ Epire (1958/61-1988): elements d’analyse sociodemographique. The Greek Review of Social Research 1990; no special (74A): 1229-1259.
12 Dewees, P. The Woodfuel Crisis Reconsidered: Observations on the Dynamics of Abundance and Scarcity. World Development 1989; 17(8): 1159-1172.
13 Gidarakou, I, Kazakopoulos, L, Papadopoulos, D.A. Succession of the Family Farm. A Typological Approach. Searching for the Future of Greek Agriculture. 6th Panhellenic Conference of Rural Economy; 2000 Nov 24-25; Thessaloniki, Greece; Athens: Stamoulis; 2002: 179-192 (in Greek).
14 Gliessman, S.R. Agroecology: Researching the Ecological Basis for Sustainable Agriculture 1990; London: Springer-Verlag.
15 Herzfeld, M. Social Tension and Inheritance by Lot in Three Greek Villages. Anthropological Quarterly 1980; 53: 91-100.
16 Louloudis, L, Vlachos, G, Christopoulos, S. Local Systems of Survival in Greek Mountainous and Less Favourable Areas. In Spilanis, I, Iosifidis, Th, Kizos, A, editors. Development Strategies in Less Favourable Areas. Athens: Gutenberg; 2004, 235-266 (in Greek).
17 Louloudis, L, Martinos, N, Panagiotou, A. Patterns of Agrarian Change in East-Central Greece. Sociologia Ruralis 1989; 29(1): 49-66.
18 Masourides, A.N. Alagoniaka. Athens: Syllogos Artemision Athinon-Peireos; 1994 (in Greek).
19 Millington, A.C. Land Use Transformation and Environmental Impacts of EC Agricultural Policy and Rural Depopulation: Messinia, Greece. In: Jones, G, Robinson, G, editors. Land Use Change and the Environment in the European Community. Biogeography Research Group and Rural Geography Study Group of the Institute of British Geographers 1991; 107-121.
20 Mouzelis, N. Peasant Agriculture, Productivity and the Laws of Capitalist Development: A Reply to Vergopoulos. The Journal of Peasant Studies 1979; 6(3): 99-117.
21 Nakos, G. The Land Resource Survey of Greece. Journal of Environmental Management 1983; 17: 153-169.
22 Petropoulou, E. Diverse Livelihood Systems as a Means of Survival and Rural Development in Southern Greece. In: Koutsouris, A, Zorini, L.O., editors. European Farming and Rural Systems Research and Extension into the Next Millennium: Environmental, Agricultural and Socio-Economic Issues. Athens: Papazisis Publishing S.A; 2004; 481-496.
23 Sakiotis, I. Frauds and Subsidies: The New Face of Socialism?. New Ecology 1994; 122: 23 (in Greek).
24 Spilanis, I, Iosifidis, Th, Kizos, A, editors. Development Strategies in Less Favourable Areas. Athens: Gutenberg; 2004 (in Greek).
25 Warren, M.D, SLikkerveer, J.L, Brokensha, D. The Cultural Dimension of Development: Indigenous Knowledge Systems. London: Intermediate Technology Publicatios; 1995.
26 Woods, L.E. Land Degradation in Australia 1984; Canberra: Australian Government Publishing Services.
56

Treatments improving seed germination of Cistus creticus L., Erica arboreaL. and Erica manipuliflora Salisb
Elias Pipinis1, Maria Aslanidou1, Olga Mavrokordopoulou1, Elias Milios2 Pavlos Smiris1
1 Laboratory of Silviculture, School of Forestry and Natural Environment,Aristotle University, Thessaloniki 54124, Greece, e-mail: [email protected] of Forestry, Environmental Management & Natural Resources
Democritus University of Thrace, Orestiada, Greece, e-mail: [email protected]
Abstract. Erica arborea, Erica manipuliflora and Cistus creticus species are commercially valuable for their uses because (they have small requirements in water and nutrients) but they also have a scientific value since few surveys have been conducted concerning dormancy breaking and seed germination. The objective of the present work is to study the application of various treatments in order to improve seeds germination. After the treatment, the seeds of both species were subjected to germination test under controlled conditions (20oC/16h dark period and 25oC/8h light period). The best results were recorded in Erica arborea and Erica manipuliflora seeds after one month of prechilling. The seeds that were treated for 10 min in 180oC did not germinate at all. The maximum percentage of germination for Cistus creticus seeds (79.5%), was observed when the seeds were soaked for 24 hours in hot water at 60oC and then transferred in growth chambers.
Keywords: Cistus creticus, Erica arborea,Erica manipuliflora, hot water soaking, prechilling, seed germination.
1. Introduction
In the Mediterranean basin, different plant communities have demonstrated their resistance to fire and vegetation regeneration has been traditionally described as an autosuccessional process where, after a fire, the vegetation generally recovers without any great changes in the species composition. Thus, Mediterranean- type ecosystems are generally recognized as highly resilient to fire as consequence of the ability of plant species to recover from fire by means of resprouting from fire-resistant structures or from fire-protected seeds [11]. Most of these species regenerate by vegetative resprout but some,
like the Cistus species, are considered obligate seeders, with seeds whose germination is stimulated by heat so they spread as a result of fires [19].
Erica arborea is a typical component of maquis communities. In the mountains it occurs also as brushwood in sparse, sunny oak woods, especially of Quercus frainetto [3]. They grow up in elevations of 400-500m, but in Thasos and Evoia islands have been found at 800m. The highest stations have been found at 1200m on Mt.Pilion in Thessalia.
Erica manipuliflora is an evergreen shrub, frequent in littoral and subinland Greece, generally not higher than 600-700m. The highest stations have been found at 1100m on Mt Taygetos and at 2000 m in Crete island. It is a component of phrygana communities but it grows also in Pinus halepensis or P. brutiaforests. In the mountains it can be found in Pinus nigra woods [3]. Erica arborea andErica manipuliflora are members of the Ericaceae family.
Cistus creticus is a small shrub about 80-100 cm tall. It is common throughout the country, mostly in the maritime zone up to about 500-600 m, however it reaches 1100m on Mt Olympos and 1200m in Crete island. Cistus creticus is an important constituent of phrygana communities but grows also at the edge of maquis and in open pine forests [2,3]. Cistus species are used as general remedies in folk medicine for treatment of various skin diseases and as anti-inflammatory agents [15]. It is a member of Cistaceae family.
The study of seed germination of Erica arborea, Erica manipuliflora and Cistuscreticus has a great commercial and practical interest for nursery owners, because it provides easy proliferation techniques of these species with seeds and they are species which can be cultivated as ornamental bushes with small
57
“Sustainable Management and Development of Mountainous and Island Areas”

requirements in water and nutrients. As well, they have a scientific value, since few surveys have been conducted concerning seed germination. The aim of this work was to study the germination in the seeds of Erica arborea, Erica manipuliflora and Cistus creticus.
2. Materials and methods
Fruits of Erica arborea were collected in early June, of Erica manipuliflora in November from Kavala, east Macedonia of Greece. Afterwards the collection, the fruits (capsule) were left to dry naturally inside a well-ventilated room. Then the fruits were repeatedly grated by hand in order to break them and sieved until a high percentage of purity was accomplished.
Fruits (capsule) of Cistus creticus were collected in July from the same area. The fruits were dried naturally first and then were grated in order to break them. Sieving and flotation were used, in order to clean the seeds (flotation removed trash and no healthy seeds). The clean seeds were spread in filter paper and left to dry. After drying, the seeds were stored in glass containers in the refrigerator (2-4oC) until the beginning of the experiment.
2.1 Seed treatments for Erica arborea and for Erica manipuliflora
Concerning the seeds of Erica species, dueto seed size, random samples of 0,15gr were taken. Randomly, the samples were divided in two groups. The samples of the first group were subjected to the following treatments: samples were dry heated in an oven for 10 min at a) 80o, b) 130o and c) 180oC, also other samples were immersed in running water for 48h and samples were used as e) control (samples with no treatment). Afterwards, each sample was placed in plastic petri dish on filter paper moistened with distilled water and transferred to a growth chamber for the germination test. The samples of the other group were subjected to the same treatments. Then the samples were subjected in cold stratification for 1 month. Afterwards, they were transferred to a growth chamber for the germination test. For each treatment we used 4 replicates (samples) of 0.15gr.
2.2 Seed treatment for Cistus creticus
The experiment was carried out with the following treatments. Seeds were immersed for 24h in warm water in a) 40oC, b) 60oC and c) 80oC, also other seeds were immersed in boiling water for d) 10, e) 20 and f) 30 min (100oC) and seeds were used as g) as control (seeds with no treatment). Afterwards, the seeds were placed in plastic petri dishes 9cm in diameter on filter paper, moistened with distilled water. The petri dishes were transferred to a growth chamber for the germination test. For each treatment we used 4 replicates of 50 seeds.
3. Germination test
The petri dishes of all species were placed in a growth chamber. The temperature in the growth chamber was set at 20 C for 16 h dark period and 25oC for 8 h light period [23] or they were stratified at 3–4 C for 1 month and afterwards they were transferred to a growth chamber until they germinated [7]. Seed germination was defined as the appearance of a radicle, at least 2 mm long, according to [10]. Germinated seeds were counted every 4 days for 5 weeks. Each germinated seed was removed in order to avoid counting confusion. The seeds were periodically watered with distilled water to keep them moistened.
4. Statistical analysis
For all species the experimental design used was a completely randomized design with 4 replicates. For Erica species statistical analysis was made with the number of germinated seeds. The effects of different treatments on seed germination were tested using the Dunnett T3 test, since there was heterogeneity of variances in our data [20]. The effect of treatment 180oC for 15 min on germination was not analyzed because no seed germinated. In Cistus creticus the germination percentages were analyzed by one – way ANOVA. In order to increase normality, the germination percentage data was transformed to arc-sine square root values [16]. Also, the homogeneity of variances was verified using the Levene test. In the multiple comparisons the Duncan’s test was used [12]. All statistical
58
“Sustainable Management and Development of Mountainous and Island Areas”

analysis was carried out using SPSS 12.0 (SPSS, Inc., USA).
5. Results
After one month of cold stratification, the seeds of Erica arborea that had been remained untreated, gave the highest percentage of germination (from the 0,15 gr sample that was used 486 seeds germinated), when the germination percentage in the seeds that had been dry heated in an oven for 10 min at 130 Cwas very low (29 seeds in 0.15gr seed sample) (Table 1).
Table 1. Seed germination in Erica arboreaTreatments Mean Std.
Deviation Control - 1 month of
stratification 486a 23.76
48h H2O - 1 month of stratification 270b 21.26
Control 117c 17.19 10min 80oC-1 month of strat/fication 116c 16.27
48h H2O 77c 11.52 10min 80oC 68c 9.20
10min 130oC 35d 4.08 10min 130oC-1 month of strat/fcation 29d 4.24
Germination data (means, S.D.) for Erica arborea seeds. Means with the same letter are not significantly different at p<0.05. The comparisons were made using the Dunnett T3 test.
Table 2. Seed germination in Erica manipuliflora
Treatments Mean Std. Deviation
Control - 1 month of stratification 181a 16.43
Control 142 ab 17.83 48h H2O - 1 month of
stratification 123b 13.14
48h H2O 73c 10.95 10min 80oC-1 month of strat/fication 62c 7.39
10min 80oC 24d 4.16 10min 130oC 7e 1.83
10min 130oC-1 month of strat/fcation 4e 1.15
Germination data (means, S.D.) for Erica arborea seeds. Means with the same letter are not significantly different at p<0.05. The
comparisons were made using the Dunnett T3 test.
Table 3. Germination rates in seeds of Cistus creticus
Treatments Mean Std.Deviation
24h 60oC 79.5a 4.43 24h 80oC 55b 4.76
10min 100oC 48.5c 4.12 30min 100oC 43cd 4.16 20min 100oC 40d 4.32
Control 6.5e 1.91 24h 40oC 5e 1.15
Germination data (means, S.D.) for Erica arborea seeds. Means with the same letter are not significantly different at p<0.05. The comparisons were made using the Duncan test.
Likewise, Erica manipuliflora seeds gave the highest germination percentage when they had been remained untreated after one month of cold stratification (from the 0,15gr sample that was used 181 seeds germinated). The germination percentage in the seeds that had been dry heated in an oven for 10 min at 130 Cwas very low (4 seeds germinated after 1 month of cold stratification) (Table 2).
For Erica arborea and Erica manipuliflorawe observe that the seeds that were treated with 180ºC for 10 minutes did not germinate at all, consequently this treatment was not included in the statistical analysis. For the seeds of Erica arborea that were not prechilled, the highest germination percentage was in the untreated seeds (117 seeds germinated) when the treatments with (10min in 80o and in 130oC) gave 68 and 35 seeds germinated respectively. From the sample that was immersed in running water for 48 h after one month of stratification, 270 seeds germinated, while 77 seeds germinated from the sample that were not prechilled after the immersion (Table 1).
Concerning the seeds of Erica manipuliflora, after one month of cold stratification the statistical analysis showed that significant differences exist between the seeds that were used as control and the other treatments (181 seeds germinated form the sample that was used as control and 123, 62 and 4 seeds from the treated samples) (Table 2). On the other hand there were differences between treatments where the seeds remained for 10 minutes in 80 C and 130 C and between
59

the seeds that were used as control and seeds that immersed in running water for 48h without prechilling. The germination percentages were 24, 7, 142 and 73 germinated seeds respectively (Table 2).
From the results in Table 3, we observe that the seeds of Cistus creticus, which were treated with hot water at 60 C for 24 h gave the highest germination percentage equal to 79.5%. High germination percentages, equal to 48.5% and 43%, were also observed for the seeds, which were treated with hot water at 100 C for 10 and 30 minutes respectively, while the germination percentage for the seeds that were treated with water at 100 C for 20 minutes was 40%. The lower germination percentage (5%) gave the seeds that were treated for 24 hours with hot water at 40 C. Also, the seeds that were used as control gave small germination percentage equal to 6.5%. From the statistical analysis (Table 3) we observe that treatment in which the seeds immersed for 24h in hot water at 40ºC differs statistically from the rest.
6. Discussion – conclusions
Germination process is characterized by the absorption of humidity, enzymatic activity, increased respiration, storage of carbohydrates and the division and elongation of cells, which result in a visible radicle growth [23]. It is influenced by the environmental conditions (humidity, oxygen, temperature and light), but also by the interaction of hormones [5]. Temperature is one of the most important environmental factors that influence germination. High temperatures cause low germination and high mortality in seeds [1]. The same conclusion was also reported from [21]. They proved with their research that high temperatures decrease the total quantity of germinating seeds. From the above results it is obvious that the highest germination percentage that was recorded in the seeds of Erica arborea and Erica manipuliflora were in the seeds that were subjected for germination test without any treatment after 1 month of prechilling. The seeds, which were treated for 10 min in 180oC did not germinate at all. According to [6], the maximum germination rate (90%) in Acer pseudoplatanus seeds was observed under 5 C.
Concerning the seeds of Cistus creticus the highest germination percentage (equal to
79.5%) was observed after the seeds were immersed in hot water at 60 C for 24 hours. The increased temperature of the water promoted germination and gave important germination rates in all treatments. The smaller germination rates were observed when the water’s temperature, in which the seeds were immersed, was 40 C as well as in the seeds that were used as control. Low germination rates were also observed in seeds of Pistacia lentiscus and Prunus avium after their eve in low temperature [17]. Cistus creticus is thermophilic species consequently its germination is not encouraged in low temperatures [4]. This way of dormancy breaking (hot water soaking) has found application in many forest species such as: Crataegus, Carpinus, Eleagnus. Laucaena leucouphala and Acacia leucophloea species presented the higher rates of germination (80-90%) after the eve of their seeds in temperature 80-90 C [8].
7. References
[1] Alonso S, Peretti A. Germination and seedling growth in Briza subaristata at different light, temperature and substrate conditions. Seed Science and Technology 1995; 23:793-800.
[2] Athanasiadis N. Forest Botany. Trees and shrubs in Greece. Thessaloniki. Greece. Giaxoudis- Giapoulis Press; 1985.
[3] Boratynski A, Browicz K, Zielinski J. Chorology of trees and shrubs in Greece. Polish Academy of Sciences. Institute of Dendrology; 1992.
[4] Dafis S. Forest Ecology. Thessaloniki. Greece. Giaxoudi-Giapouli Press, 1986.
[5] Davies PJ. Plant hormones and their role in plant growth and development. Kluwer academic publishers; 1990.
[6] Derkx M, Joustra M. Determination of optimal moisture content and duration of medium less cold pretreatment for dormancy release in the three species of Acer. Proceedings Fifth International Workshop on seeds, Reading. U.K, 1998; p. 15-23.
[7] Dungey NO, Brown G, Pinfield NJ. The involvement of cytokinins in the removal of testa- induced dormancy in Acer seeds. Pflanzenphysiology 1980; 233-237.
[8] Gordon A. Rowe D. Seed manual for ornamental trees and shrubs. Forestry
60
“Sustainable Management and Development of Mountainous and Island Areas”

Commission Bulletin 59, London. Handbook of seed technology for genebanks. No2. Vol. II. Compendium of specific germination information and test recommendations; 1982.
[9] International Seed Testing Association.International Rules for Seed Testing Rules. Seed Science & Technology 27, Supplement; 1999.
[10] Lewak S. Regulatory pathways in removal of apple seed dormancy. Acta Horticulturea 1981; 120:149-159.
[11] Martin DL, Raventos J, Gonzalez-Idalgo CJ. Post- fire vegetation succession in Mediterranean gorse shrublands. Acta Oecologica 2006; (in press).
[12] Matis K, Forest Biometry I. Statistics. Thessaloniki (in Greek); 1991.
[13] Naveh T. Effects of fire in the Mediterranean regions. In: Kozlowski, TT, Ahlgren, C E (eds). Fire and Ecosystems. Academic Press, New York: 1974; pp.401-439.
[14] Pinfield N, Dungey N. Seed dormancy in Acer. An assessment of the role of the structures covering the embryo. Review J. Plant Physiology 1985; 120:65-81.
[15] Pomponio R, Gotti R, Santagati A, Cavrini V. Analysis of catechins in extracts of Cistus species by micro-emulsion electrokinetic chromatography. Journal of Chromatography 2003; 990:1-2:15-223.
[16] Snedecor GW, Cochran WE. Statistical methods 7th Ed. The Iowa State University. Iowa USA Press; 1988.
[17] Suszka B. Physiological aspects of seed conservation. Annales of Science Forestry 1989; 46:72-84.
[18] Swank SE, Oechel WC. The effects of herbivory, competition and resource limitation on chaparral herbs. Ecology 1991; 72:104-115.
[19] Tarega R, Luis E, Valbuena L. Eleven years of recovery dynamic after experimental burning and cutting in two Cistus communities Acta Oecologica 2001; 22 :277-283.
[20] Toothaker L.E. Multiple comparison procedure. Sage University, Paper series on Quantitative Application in the social Sciences Newbury Park, CA, Sage Publications; 1993:07-089,
[21] Valbuena L, Tarrega R, Luis E. Influence of heat on seed germination of Cistus laurifolius and Cistus ladanifer.
International Journal of Wildland Fire 1992; 2:15-20.
[22] Vila M, Terradas J. Neighbour effects on Erica multiflora (Ericaceae) reproductive performance after clipping. Acta Oecologica 1998; 19 (2):139-145.
[23] Young JA, Young CG. Seeds of woody plants in North America. Revised and Enlarged edition. Portland, Oregon USA; 1992
61
“Sustainable Management and Development of Mountainous and Island Areas”

Urban - Rural Land Use Interactions in Greece
Serafeim Polyzos Lecturer, University of Thessaly, Department of Planning and Regional Development, Pedion
Areos, Volos, Greece, 38334, tel.:+30-24210-74446. E-mail: [email protected]
Olga Christopoulou Assistant Professor, University of Thessaly, Department of Planning and Regional
Development, Pedion Areos, Volos, Greece, 38334, tel.:+30-24210-74417. E-mail: [email protected]
Dionissios Minetos PhD Candidate, University of Thessaly, Department of Planning and Regional Development,
Pedion Areos, Volos, Greece, 38334, tel.:+30-24210-74276. E-mail: [email protected]
Abstract. Development theory and practice have focused on either "urban" or "rural" land uses, placing often, relatively little consideration on the interrelations between them. By contrast, several empirical studies have shown that there are urban - rural land use linkages performing an important role in stimulating land use change processes.
Land use changes in Greece have been the outcome of combining forces with mostly economic and institutional origin. Interactions between the major land uses have diachronically resulted to spatial patterns of great economic and environmental interest. This paper aims at describing urban, agricultural and forest land use changes during the last decades in Greece as well as analyzing the major regional and economic development implications. Particular attention is given to the analysis of possible driving forces with economic origin.
Keywords. Land use change, land use theories, urban sprawl, correlation analysis.
1. Introduction
Land use changes in Greece are mainly driven by economic and institutional factors. During the last 40 years, worldwide growing demand for urban space has resulted in unplanned residential development and illegal dwelling construction to the expense of agricultural and forest land uses (Weber et al. 2005). In a similar vein, particular areas have experienced considerable demand for agricultural land resulting in declining forest
resources (Angelsen 1999; Sluiter 2005). In other instances, rural land devaluation due to low agricultural product prices and to demographic shrinkage has led whole areas to abandonment and to subsequent forest expansion (Angelsen and Kaimowitz 1999).
Rapid land use changes at the rural/urban fringe and beyond have attracted considerable attention among scientists of relevant fields, policy makers, national governments and international organisations (Alavalapati et al. 2005; Baulies and Szejwach 1998; Lambin et al. 2001). Growing land use transition rates, concerning mainly alterations from agriculture and forest land uses to urban land uses, have stimulated a series of pressuring adverse phenomena ranging from profound microclimate changes (urban heat island phenomenon), biotic diversity threats (genetic, species and ecosystem diversity diminution), soil erosion and forest and open land “squeeze” to increased vulnerability to human settlements, local water and food shortage, as well as to cultural degradation issues (Alphan 2003; Moeller 2004; Xiao et al. 2006; Yuan et al. 2005). A critical step in improving the way we approach land use changing patterns requires uncovering underlying causes and proving etiological hypotheses which are essential in order to formulate effective policy solutions (Verburg et al. 2004).
Society’s knowledge concerning the use of natural environment has been greatly enhanced in contemporary times as intense research is curried out concerning almost any environmental aspect (Lambin et al. 2001). In addition, technological advances, especially
62
“Sustainable Management and Development of Mountainous and Island Areas”

those associated with remote sensing sensors and platforms, have accelerated the pace and furthered the way the environment is studied (Lillesand and Kiefer 1979; Lu et al. 2004). However, despite voluminous research efforts it seems that land use change phenomena still advance at constantly increasing rates, new complex combinations of land patterns arise and the underlying causes that create contemporary land patterns comprise of different structural elements than in the past. This is justified at least by the fact that the economic and socio-cultural environments are in a fluxion, and meaningful understanding of chancing land use patterns requires a mixture of theoretical and methodological approaches (Walker 2004a).
This study primarily aims at a) revealing the major land use change trajectories in Greece for a period of twenty years and b) at conducting an empirical investigation into the possible interactions that exist between different land use type transition patterns using as scale of analysis the prefectural administrative level. The above aims are pursued through the estimation of the kind and magnitude of correlations between changes of different land use types for the period 1971-1991 as well as through the selective diagrammatical representation of correlation patterns in a pair-wise manner using some characteristic land use alterations derived from correlation analysis. The study resumes by drawing some conclusions regarding the results. This is made in the light of well known theoretical schemata relevant to the field of land use change as well as using logical reasoning and relevant past experience in the field.
2. Theoretical approaches to land use change: land allocation mechanisms
The global economy is based upon supply and consumption practices of goods and services (including information exchange) that in one way or another most of them derive from natural environment (Fujita and Krugman 1995). Understanding the economic system and its mechanisms of growth is a prerequisite for modelling and forecasting future trends of land use/cover change (Briassoulis 2000). Economic systems are dynamic entities and their anatomy and functioning may revile characteristics of enormously complex nature (Arthur 2005). Historically, land development
rhythms have been relatively slow allowing nature to adjust. However, nowadays the increasing pressures on finite land resources sometimes lead to over-exploitation of natural resources and land degradation (IHDP/START 2002; United Nations 2006).
The morphology and evolution of land use patterns have been extensively studied and theorised by scientists of different disciplines (Irwin and Geoghegan 2001; Lambin et al. 2001; Verburg et al. 2004; Walker and Solecki 2004; Walker 2004a). Thus, a plethora of theories have been developed so far in order to provide possible explanations of land allocation processes. In the section that follows a selective representation of such theoretical schemata is given in the light of the land allocation mechanism that each theory puts forward. This is done in order to connect the proximate causes of land use change in Greece uncovered by the correlation analysis with broader issues regarding economic functioning as well as social behaviour.
2.1. Economic theories
Agricultural land allocation theory: The seminal work by von Thünen (1826) about agricultural land allocation of different crops around a city market is believed to have influenced most of the subsequent thinking concerning location economics. Von Thünen’s question about land allocation mechanisms concentrated on the relationships between markets, production, and distance and led to the formation of “agricultural land allocation theory”. The basic mechanism of land use patterns formation is the farmers’ intention to maximise their profits (Nerlove and Sadka 1991). In doing so, every farmer bits for certain pieces of land according to their ability to pay a certain (economic) rent which is subject to the distance from the market, the nature of the crop and other competing crops. In this way, specific and distinctive topological patterns (of ring morphology) of economic activities arise through market mechanisms (Cromley 1982; Fujita and Krugman 1995). Von Thünen approach was later further develop by Hoover, Dunn, Lösch, and Isard.
Theory of the Location of Industry: In 1909, Alfred Weber put forth the first developed general theory of industrial location and stressed the critical importance of certain locational factors. According to his theory three main factors influence the choice of
63
“Sustainable Management and Development of Mountainous and Island Areas”

where to locate an industry: transportation cost (cost of bringing material to the industry and delivering products to the market), labour cost and economies of scale (due to industrial agglomeration). In cases where transportation cost is the most important factor, a location triangle is used to solve the problem of locating an industry in relation to the source of material and the market. The foundations of the theory lay in economic theory and are concerned with minimising the costs that an industry is faced with (Gregory 1981). Certain changes in locational factors may lead to the rearrangement of land use patterns.
Urban land use theory: In 1960, coherent urban location patterns led William Alonso to the formation of “urban land use theory”. In some respects, this theory is a modification of von Thünen’s theory in order to apply to urban land uses (i.e. residential, commercial and industrial). In his intra-area land use distribution approach, the leading mechanism behind arising urban spatial patterns around a city’s Central Business District is households’ attempts - subject to a certain budget - to maintain a given satisfaction level (Leven 1999). Thus, spatial distribution of land uses depend on household’s financial budget and preferences, land parcel distance from the city centre and the location of employment areas. In this way land use allocation is close related with individuals’ utility maximization. Certain change to people’s preferences or financial budget may lead to land use changes.
Cumulative causation theory: Cumulative causation theory by Myrdal in 1957 focuses on the initial unequal spread of human as well as natural resources between different geographical areas and holds the idea that this unequal distribution leads to a permanent situation where the wealthier regions absorb capital from the agricultural regions (Seiter 2003). Although there is diffusion of positive effects to agricultural areas coming from the further development of wealthier regions, this is of a lower magnitude and the patterns of unequal development between areas persist. However, both absorption of capital and difisusion of positive effects can be viewed as land use change mechanisms.
Growth pole theory: Growth pole theory was put forward by Perroux (1955) and improved by Boudeville (1966). It refers to the grouping of industries around a central core of other industries creating agglomerations and inducing further development of economic
activity throughout its zone of influence (Courtney and Errington 2003; Thomas 1975). These processes have certain implications upon land patterns as well as on the growth of “pole area” and the surrounding areas. The land use change mechanism is of economic nature and explains mostly firm location patterns.
Central place theory: Central place theory, created by Walter Christaller and published in 1933, suggests that there are laws determining the number, size and distribution of cities. It deals with relationships between market centres and consumers within regions and proposed a hierarchical arrangement of settlements in hexagons (Beguin 1992). Land allocation is mainly determined by competing economic forces. Thus, land patterns in one region may be determined by other regions’ economic forces.
Unequal exchange theory: Unequal exchange theories were initially suggested in order to describe the dependence relationship that exists between developed and less developed countries in the form of commodities exchange. It uses the concept of the reproduction of labour power to support that because of differences in the cost of labour between countries, trade and demand for commodities are virtually determined by the developed countries. Because commodities production requires land inputs (as a factor of production), the developed countries determine land uses in the less developed world by significantly influencing the kind and volume of traded commodities. Lipietz suggested the “theory of unequal regional exchange” that applies the above reasoning to explaining dependency relationships between geographical areas within a country.
2.2. Social Theories
Concentric zone theory: This theory was proposed by Burgess in 1925 and was one of the earliest models developed to explain the spatial organization of urban areas. According to this theoretical schema, competition for land and other natural resources lead to the spatial differentiation of urban space into zones. Allocation of zones is archived in an economic-based manner where users that can afford to pay high rents occupy certain zones. This theoretical approach has been influenced by Darwinian evolution theory and proposes that a great deal of fundamental forces that
64
“Sustainable Management and Development of Mountainous and Island Areas”

operate in nature (competition, dominance, invention and succession) can also be found operating in human societies (Briassoulis 2000). However, the culture modifies the forces of nature. Human preferences, competition and other market forces are the primary forces of land use change.
Multiple nuclei theory: The multiple nuclei theory proposed by McKenzie in 1933 supports that cities have lots of different centres. The land use patterns and rents are influenced by these centres. New nuclei are developed as a result of arising needs for new facilities or as a response to diseconomies within older clusters of activities (Gottdiener 1994). These nuclei develop due to different types of activities in a city.
Radial sector theory: The radial sector theory was proposed by Hoyt in 1939. While accepting the existence of a central business district, the theory suggested that various groups make location decision moving away from the city centre along highways, and other transportation features. Improved access to an area raises land values (Briassoulis 2000). The higher income group moves rapidly than the lower income group. Hence, the distribution of capital between social classes is of outmost importance. Capital availability can influence developmental processes and thus land use patterns.
Core-Periphery theory: This theoretical perspective explains economic activities distribution on the basis of the hierarchies of political and economic power that exists in society (Briassoulis 2000). In 1966, Friedmann in order to account for the gradual evolution of regional economies, proposed the 4-stage theory of economic growth where he defines the distinct paths through which the development of spatial economy moves.
Theory of reproduction: Another theory that stresses the importance of social classes in capitalist economies is the “theory of reproduction”. According to this approach, rooted in some respects to Marxist concepts, economic patterns arise as a result of the constant struggle between the different classes in capitalist economies (especially between the labour class and the capitalist class) (Gottdiener 1994). Hence, socioeconomic relations and interactions determine spatial patterns.
Theory of mass consumption: The theory of mass consumption was employed by Sack in the ‘90 in order to explain contemporary
people – natural environment relationships. It deals with the patterns and ethics of social behaviour towards natural environment and states that present patterns of consumption adopted by humans have resulted in generating a chasm between people and the environment (Rappa 2002). Rapidly increasing patterns of consumption raise the rates that natural resources are used and thus, profound land use modifications appear.
Ecological revolutions theory: Having some similarities with the theory of reproduction, ecological revolutions theory proposed by Merchant, deals with social classes, the relations of production and the possession of means of production in the light of human – nature contact. Ecological revolutions happen when significant social transformations occur (Gottdiener 1994). The social transformations induce changes in the human – nature relationship which, in turn, changes the way natural resources are perceived, manipulated and utilised.
Urban land nexus theory: Social classes’ struggle and capital possession is also central to this theory proposed by Scott in the ’80. They are the major processes through which economic growth arises and land developmental patterns formulate (Gottdiener 1994).
Dependency theory: This theoretical approach deals with the unequal relationships between countries. These unequal relationships usually tend to have permanent characteristics. The dependency relation is mainly forced by developed countries to the less developed ones through the “imposition” of certain technological patterns in the production process as well as through the introduction of exogenously controlled patterns of development (Briassoulis 2000). All these led to an exploitation process where developed geographical regions manipulate less developed areas. In this way land use patterns emerge due to exogenous factors.
Theory of the spatial divisions of labour:In the debate on urban and regional inequality Massey proposed the “theory of the spatial divisions of labour”. The theory focuses on restructuring effects of labour markets and on the spatial divisions of labour, stressing the re-organization of production (Briassoulis 2000). Development accumulates in certain regions as new successional investments are applied. This theory of uneven development should pay greater attention to the historical constitution
65
“Sustainable Management and Development of Mountainous and Island Areas”

of agents within their institutional contexts (Sunley 1991).
The frontier thesis: This theoretical schema was proposed by Turner in 1894. The purpose was to describe the spread of human development in the continent of North America (Briassoulis 2000). According to this theory land occupation by humans take place in successive waves subject to the state that each time the socioeconomic forces of society are.
2.3. Allocation mechanisms synthesis and evaluation
The theories that are briefly described in this study, have in one way or another attempted to explain the land use allocation phenomena through a set of statements grounded on economic and/or social concepts. In addition, they occasionally employ environmental factors (raw material sources etc) a complementary explanatory mode. Despite the obvious fact that certain theories are fitted better to certain scales of analysis (i.e. local, regional, country level or multi-country and global levels) or that some theories are able to account for certain land use changes (e.g. either urban, agricultural or forest land modifications), the land allocation mechanisms that have been proposed are of great importance in choosing explanatory variable in empirical modeling applications. In statistical analysis of land use changes the depended variables used (usually demographic, economic or socio-cultural factors) need to be chosen on firm theoretical grounds and not in a solely empirical fashion. In this respect, it is extremely important that prior to applying an in-depth analysis into the underlying factors of land use change, someone acquires a reasonable sense about the proximate causes of land use change in a particular study area. A way of achieving this is via the examination of land use change trajectories as well as via the correlation analysis between different land use types. Knowing correlation patterns between different land uses as well as their theoretical relevance, the process of selecting explanatory variables becomes more coherent and meaningful.
In the sections that follow, the central aim, among others, a correlation investigation between patterns of land use changes in Greece is pursuit.
3. Investigating interactions between land use changes in Greece
3.1. Study Area
Greece covers a total area f 131.957,4 km2. The mainland part of the country marks the end of the Balkan Peninsula whereas the insular part (about 3.000 both habited and inhabited islands situated in the Aegean Sea as well as the Ionian Sea) borders with Asia and Africa continents. Coastline stretches for approximately 15,021 kilometers. According
to the National Statistics Services of Greece (NSSG 2001) the country’s population is approximately 10.9 million people with 72.8% staying in urban areas and the remaining 27.2% being rural population. In mountainous areas live 9.2% of the population, whereas in semi-mountainous and urban areas the figures are 21,8% and 69.0% respectively. Finally, agriculture and pastoral uses cover 49.5% of country’s surface, forests, shrub and bare land cover 47.2%, inland water 1.3% and urban and other artificial surfaces cover 2.0% (NSSG 2001).
Geomorphologically speaking, most of the mainland territory consists of mountains. Just a few major agricultural plains exist the largest of which is placed in central Greece in the administrative boundaries of the Thessaly region. The country consists of 13 administrative regions, which are further subdivided into 51 prefectures (Fig.1). The 51
Figure 1. Greece: The country is subdivided into 51 prefectures
66
“Sustainable Management and Development of Mountainous and Island Areas”

prefectures are also subdivided into 1,035 municipalities and communities.
Figure 2 illustrates major land uses unfoldment in a country level for the years 1971, 1981 1991, as they were extracted using the data provided by three Agriculture and Livestock Censuses carried out by the National Statistical Service of Greece (NSSG 1975, 1985, 1995). On the whole, agricultural, pastoral and forest land uses occupy most of the countries territory. Both a large number of theoretical schemata - some of which were presented in the previous sections – and a lot of empirical studies suggest that there exist a two-way influential relation between on the one hand land use changes and on the other hand employment patterns and production levels of different economic sectors.
Figure 2. The basic land uses in Greece for the years 1971, 1981 and 1991
Bearing in mind the fact that the largest percentage of land uses refer to the primary sector of production, table 1 displays the progress of the rate of (a) the Gross National Product in Agriculture to the total Gross National Product (GNP) and (b) the Gross National Product in the Mine Sector to the total GNP (NSSG 2001). From the data present in table 1, it can be seen that the Agricultural sector looses importance gradually. This means that the contribution of agricultural production to the total national production of all sectors decreases. As regards the Mine sector contribution to the GNP it seems to experience an increase in the mid ‘80s but this is a brittle and parenthetical drift as in the late ‘80s as well as in the ‘90s this economic branch looses importance. However, it is worth mentioning that the Mine sector’s contribution to the GNP is relatively small accounting for
as much as 1.5 to 2.0%. The trends regarding the contribution of these two sectors to the GNP may have influenced the intension and magnitude of land uses in Greek prefectures.
Table 1. Trends in the rate of GNP in agriculture and mine sectors
Year GNP in Agriculture as part of the Total
GNP
GNP in Mine as part of the Total
GNP1971 18,75 1,51 1972 18,51 1,49 1973 20,39 1,41 1974 19,78 1,33 1975 20,03 1,43 1976 18,69 1,46 1977 16,76 1,50 1978 17,42 1,40 1979 15,91 1,54 1980 17,72 1,53 1981 16,8 1,53 1982 18,37 1,94 1983 16,93 2,09 1984 17,59 2,29 1985 17,26 2,17 1986 16,17 1,62 1987 15,79 1,81 1988 16,4 1,64 1989 16,32 1,51 1990 14,51 1,53 1991 16,43 1,47 1992 14,79 1,3 1993 13,81 1,2 1994 14,94 1,17
3.2. Land use classification system
The two general groups of theoretical approaches presented earlier suggest that a variety of economic and social forces might work competitively or additionally towards the configuration of land use patterns across the regions or the prefectures of the country. Having in mind that the total land surface available to different land uses is finite, it became apparent that an increase of the land surface allocated to a particular land use category will induce a decrease of equal amount to the land surface occupied by another (or more) use(s). Thus, diachronically there
Agr
icul
tura
l Lan
dU
se %
Priv
ate
Past
ure
Land
Use
%
Inla
nd W
ater
Land
Use
%
Oth
er L
and
Use
%
Year 1971
Year 199105
10
15
20
25
30
35 Year 1971
Year 1981
Year 1991
67
“Sustainable Management and Development of Mountainous and Island Areas”

might have been observed land use transition patterns on a regional or on a perfectural scale that are the outcome of a plethora of interacting factors, influencing the magnitude of final land use change on a spatially distinctive manner.
The major land use changes in Greece as well as the interactions between land use change trajectories on a prefectural scale will be presented shortly. Before doing so, it is given a brief description of the land use classification system used by the Greek NSSG and been adopted for the purpose of this study. The paper then continues with a correlation analysis regarding different land use change types. Data are of a decennial temporal resolution; cover the period from 1971 to 1991; and derive from three NSSG’s Agriculture and Livestock Censuses. Data from the census conducted in 2001 were not available, thus this period is not covered by the present study.
The major land use categories adopted by the present study are described below. Table 2. Land use classes adopted by the study
Land Use Type Description Agriculture Arable land,
fallow land, grassland,
Municipal Pasture Communal or municipal areas used for grazing
including meadows Private Pasture Private, monasterial
and state pastures, used for grazing
including meadows Forest Areas partly or wholly
covered by ligneous plants, state and privately-owned
Inland Water Lakes permanent marshes, river, near seashore areas covered by water,
areas covered by water for the greatest part of the year
Urban Houses and other buildings transportation network, urban free space, sports fields, military bases,
archaeological sites Other Rocky pieces of land, bare land,
waste land, quarries and mines
(a) Agriculture Into the agricultural category of land use
there are included the following subcategories: Arable land: land under annual crop, vine yards, areas cultivated with all kinds of trees. Fallow land: Land, which though usually cultivated, has rested for 1 to 5 years. Grassland: Any patch of land covered by grass, not cared for, but growing naturally and harvested to be used for grazing
animals. This class does not include areas mainly used for grazing animals even if grass is eventually harvested from them.
Changes in agricultural land use can be divided into two broad categories: (a) to agricultural land use conversion referring to the complete replacement of agricultural use from a different type of land use (e.g. change to urban land use through development mechanisms or to forest use through abandonment processes, plantation establishment etc) and (b) to agricultural land use modification referring to partial alterations to human manipulations of land (e.g. expansion or intensification of agricultural use without the land loosing its initial character as in the cases of adopting a new technology in the manipulation of agricultural land, introduction of increased inputs of fertilizers, pesticides etc). (b) Pasture
The pastoral land use general category is subdivided into two categories according to the type of ownership attached to the land:
Communal or municipal pastures: Areas nearly exclusively used for grazing purposes, for a certain period or for the whole year round, including meadows, provided that the later are mainly used for grazing purposes. These pastures are owned by Municipalities or Communes. Private and jointly owned pastures: These pastures differ from the former in that they are private property, monasterial land or they belong to the State.
(c) Forest The forest category of land uses includes
areas partly or wholly covered by ligneous plants, irrespective of age and size. They include both state and privately-owned forests. (d) Inland Water
This category includes lakes, permanent marshes, rivers, and areas covered by water for the greatest part of the year. This category also includes near seashore areas covered by water such as bog or other seashore water accumulations of a permanent or temporal character. Areas lying near some rivers or lakes, dried up and temporarily cultivated (usually in summer or autumn months) are considered as arable land. (e) Urban
Urban category refers to areas occupied by houses and other buildings (schools, churches and monasteries, industries etc), transportation
68
“Sustainable Management and Development of Mountainous and Island Areas”

network, urban free space, sports fields, military bases, archaeological sites, etc. (f) Other Land Uses
This category includes any other land not reported under the previous groups (i.g. rocky pieces of land, bare land, waste land, quarries and mines, etc).
4. Results and discussion
A correlation analysis between spatial changes in major land use categories (see table 2) is performed. Land use changes are calculated on the prefectural lever thus, making 51 figures for each land use category per decade. Two correlation coefficients tables are constructed for the decades 1971-81 and 1981-91. The existence of a negative correlation between two land use categories leads to the conclusion of a negative interaction between these categories whereas a positive correlation leads to the conclusion of a positive interaction.
The statistical analysis is performed through SPSS 13.0 software, and the final results are presented in tables 3 and 4. In order to establish better monitoring of the analysis process as well as to improve the interpretation potential there are plotted two groups of scatter-grams presented in Figures 3 and 4. Individual scatter-grams delineate the distribution of values among major land use categories in a pair-wise manner.
An initial observation that could be made is that there is a negative correlation between agricultural and urban land use changes throughout the study period, although not being statistically important. The above negatively correlated variables denote that the prefectures which presented urban growth, also experienced a parallel reduction in their agricultural land cover. Hence, within these areas there exists a negative interaction between agricultural and rural land uses.
Results concerning the interaction between agricultural and pastoral land uses seem to be contradictory. During the first period (1971-1981) the results suggest a positive although statistically insignificant relationship between agricultural and municipal pasture land uses and a negative, statistically significant relationship between agricultural and private pasture land uses. During the second period (1981-1991) the correlation trends for the above variables are contrary to those of the
first period. Hence, it is difficult to safely conclude on the direction of interaction between these variables. In case of a positive relationship it may be concluded that exists a complementary interaction between the sectors of agriculture and livestock farming in that expansion of one sector leads to expansion of the other and vice-versa.
Agricultural and forest land uses present a negative although statistically insignificant relationship. This result seems reasonable since usually an increase in the agricultural land cover happens at the expense of forest land cover and, on the other hand, an increase in forest land cover most of the times takes place on abandoned agricultural land.
Some results that appear to be questionable are the correlation patterns (a) between agricultural an inland water land uses and (b) forest and inland water land uses. In the first case, the correlation appears positive though statistically insignificant during the first period and negative and statistically significant in the second period. In the second case concerning forest and inland water land uses, the correlation appears negative though statistically insignificant during the first period and positive and statistically significant during the second period. “Inland water” (lakes, rivers etc) increase can be achieved by permanent alterations to forest and agricultural or pastoral land uses (e.g. human-induced flooding of a forest area in order to create a new water body). At the same time, an increase in inland water availability could possibly lead to cultivated land expansion and thus to an increase in agricultural land uses.
An interesting conclusion can be drawn out of correlation coefficients assigned to forest land use modifications compared to (a) urban land use changes and (b) the changes in the category of “other land” uses. In the first case the correlation is positive and statistically insignificant for the 1st time period and positive and statistically significant for the 2nd
period. In the second case the correlation is negative and statistically insignificant for 1st
time period and positive and statistically significant for the 2nd period. Bearing in mind that increasing urbanization at the prefectural level usually results in forest land reduction, it was expected that the results would have been negative in the first case.
69
“Sustainable Management and Development of Mountainous and Island Areas”

Table 3. Correlation coefficients between variables representing major land use changes for the period 1971-1981.
Agricultural Land Use Change
1971-1981
MunicipalPasture Land Use Change 1971-1981
Private Pasture Land Use Change
1971-1981
Forest Land Use
Change1971-1981
Inland Water Land Use Change
1971-1981
Urban Land Use
Change 1971-1981
Other Land Use
Change1971-1981
Agricultural Land Use Change 1971-1981
1.000
Municipal Pasture Land Use Change 1971-1981
0.097 (0.499) 1.000
Private Pasture Land Use Change 1971-1981
-0.521** (0.000)
-0.201 (0.157) 1.000
Forest Land Use Change1971-1981
-0.122(0.394)
-0.106 (0.460)
0.117 (0.412) 1.000
Inland Water Land Use Change 1971-1981
0.047(0.744)
0.658** (.0000)
-0.348* (0.012
-0.077 (0.593) 1.000
Urban Land Use Change1971-1981
-0.119(0.405)
-0.104 (0.466)
0.131 (0.360)
0.157 (0.273)
0.050 (0.728) 1.000
Other Land Use Change1971-1981
0.027(.0850)
0.347* (0.013)
0.033 (0.820)
-0.177 (0.214)
0.010 (0.946)
-0.175(0.220) 1.000
Notes: t – statistics in parentheses, **correlation is significant at the 0.01 level (2-tailed), *correlation is significant at the 0.05 level (2-tailed).
Table 4. Correlation coefficients between variables representing major land use changes for the period 1981-1991.
Agricultural Land Use Change
1981-1991
MunicipalPasture Land Use Change 1981-1991
Private Pasture Land Use Change
1981-1991
Forest Land Use Change
1981-1991
Inland Water Land Use Change
1981-1991
Urban Land Use Change
1981-1991
Other Land Use Change
1981-1991 Agricultural Land Use Change 1981-1991
1.000
Municipal Pasture Land Use Change 1981-1991
-0.192(0.177) 1.000
Private Pasture Land Use Change 1981-1991
0.177(0.213)
-0.085 (0.554) 1,000
Forest Land Use Change1981-1991
-0.024(0.869)
-0.045 (0.752)
0.955** (0.000) 1.000
Inland Water Land Use Change 1981-1991
-0.246(0.082)
0.227 (0.109)
0.814** (0.000)
0.893** (0.000) 1.000
Urban Land Use Change1981-1991
-0.107(0.454)
0.233 (0.099)
0.839** (0.000)
0.885** (0.000)
0.904** (0.000) 1.000
Other Land Use Change1981-1991
0.177(0.215)
-0.241 (0.088)
0.627** (0.000)
0.637** (0.000)
0.478** (0.000)
0.429**(0.002) 1.000
Notes: t – statistics in parentheses, **correlation is significant at the 0.01 level (2-tailed), *correlation is significant at the 0.05 level (2-tailed).
70
“Sustainable Management and Development of Mountainous and Island Areas”

2,000,00-2,00-4,00-6,00-8,00-10,00
AGRICULTURE 71-81
0,20
0,10
0,00
-0,10
-0,20
-0,30
-0,40
-0,50
URBA
N 71
-81
R Sq Linear = 0,014
2,000,00-2,00-4,00-6,00-8,00-10,00
MYNICIPAL PASTURE 71-81
0,20
0,10
0,00
-0,10
-0,20
-0,30
-0,40
-0,50
URBA
N 71
-81
R Sq Linear = 0,011
2,001,000,00-1,00-2,00
PRIVATE PASTURE 71-81
0,20
0,10
0,00
-0,10
-0,20
-0,30
-0,40
-0,50
URBA
N 71
-81
R Sq Linear = 0,017
1,000,500,00-0,50-1,00-1,50
FOREST 71-81
0,20
0,10
0,00
-0,10
-0,20
-0,30
-0,40
-0,50
URBA
N 71
-81
R Sq Linear = 0,025
1,000,500,00-0,50-1,00
WATER 71-81
0,20
0,10
0,00
-0,10
-0,20
-0,30
-0,40
-0,50
URBA
N 71
-81
R Sq Linear = 0,002
0,800,600,400,200,00-0,20-0,40
OTHER 71-81
0,20
0,10
0,00
-0,10
-0,20
-0,30
-0,40
-0,50
URBA
N 71
-81
R Sq Linear = 0,031
2,001,000,00-1,00-2,00
PRIVATE PASTURE 71-81
1,00
0,50
0,00
-0,50
-1,00
-1,50
FORE
ST 71
-81
R Sq Linear = 0,014
2,000,00-2,00-4,00-6,00-8,00-10,00
MYNICIPAL PASTURE 71-81
1,00
0,50
0,00
-0,50
-1,00
-1,50
FORE
ST 71
-81
R Sq Linear = 0,011
2,000,00-2,00-4,00-6,00-8,00-10,00
AGRICULTURE 71-81
1,00
0,50
0,00
-0,50
-1,00
-1,50
FORE
ST 7
1-81
R Sq Linear = 0,015
0,800,600,400,200,00-0,20
OTHER 81-91
12,00
10,00
8,00
6,00
4,00
2,00
0,00
-2,00
FORE
ST 81
-91
R Sq Linear = 0,406
Figure 3. Relationships between land use change patterns in the 51 Greek Prefectures (1971-1981)
71
“Sustainable Management and Development of Mountainous and Island Areas”

6,005,004,003,002,001,000,00-1,00
AGRICULTURE 81-91
1,50
1,00
0,50
0,00
-0,50
URBA
N 81
-91
R Sq Linear = 0,012
1,000,500,00-0,50-1,00
MUNICIPAL PASTURE 81-91
1,50
1,00
0,50
0,00
-0,50
URBA
N 81-9
1
R Sq Linear = 0,054
12,5010,007,505,002,500,00-2,50
PRIVATE PASTURE 81-91
1,50
1,00
0,50
0,00
-0,50
URBA
N 81
-91
R Sq Linear = 0,704
12,0010,008,006,004,002,000,00-2,00
FOREST 81-91
1,50
1,00
0,50
0,00
-0,50
URBA
N 81
-91
R Sq Linear = 0,782
0,600,400,200,00-0,20
WATER 81-91
1,50
1,00
0,50
0,00
-0,50
URBA
N 81
-91
R Sq Linear = 0,817
0,800,600,400,200,00-0,20
OTHER 81-91
1,50
1,00
0,50
0,00
-0,50
URBA
N 81
-91
R Sq Linear = 0,184
12,5010,007,505,002,500,00-2,50
PRIVATE PASTURE 81-91
12,00
10,00
8,00
6,00
4,00
2,00
0,00
-2,00
FORE
ST 81
-91
R Sq Linear = 0,911
1,000,500,00-0,50-1,00
MUNICIPAL PASTURE 81-91
12,00
10,00
8,00
6,00
4,00
2,00
0,00
-2,00
FORE
ST 8
1-91
R Sq Linear = 0,002
6,005,004,003,002,001,000,00-1,00
AGRICULTURE 81-91
12,00
10,00
8,00
6,00
4,00
2,00
0,00
-2,00
FORE
ST 81
-91
R Sq Linear = 5,615E-4
0,800,600,400,200,00-0,20-0,40
OTHER 71-81
1,00
0,50
0,00
-0,50
-1,00
-1,50
FORE
ST 7
1-81
R Sq Linear = 0,031
Figure 4. Relationships between land use change patterns in the 51 Greek Prefectures (1981-1991)
72
“Sustainable Management and Development of Mountainous and Island Areas”

Urban sprawl into forest area is a well documented phenomenon in the international literature (Geist and Lambin 2001; Schneider et al. 2005; Walker 2004a; Walker and Solecki 2004b; Weber et al. 2005; Yuan et al. 2005). However, the results suggest the opposite, in that urbanization in the prefectural level, on the whole, “encourages” forest protection and indeed enhancement. Safe conclusion can not been put forward as potential changes in other land categories (e.g. bare land forestation, agricultural and pastoral land forestation) might have contributed to forest land increase.
As regards to the second case (“forest land” category and “other land” category interaction), due to the fact that the “other land uses” category includes rocky areas, bare land, quarries, mines etc, a negative correlation between “forest” land use and “other land” uses was expected. Usually, the above pair of uses has a competitive relationship as forest growth and maintenance is not encouraged by mine or bare-land expansion. The results, however, do not clearly suggest the existence of such a relation.
Finally, the paper examined the relationships of urban land uses with the remaining land use categories. During the 1st
time period, as it is suggested by the results, urban land use category generally exhibits statistically insignificant relationships with the majority of the examined land use types, being in some cases a positive relation and in some other cases a negative one. However, during the 2nd time period all relationships assigned to this land use category are positive ones as well as statistically significant. Generally speaking, it can be said that there does not exist sufficient empirical justification to firmly evaluate the interaction between, on the one hand, the urban land uses and on the other hand the rest land use categories. This is because, the municipal or private pasture land uses, the inland water land uses and the “other land uses” are not usually influenced to a significant degree by urban sprawl and the resultant needs for urban space (Mertens et al. 2004).
5. Conclusion
A general conclusion that can be elicited by the empirical analysis contacted above is that someone does observe interactions between the various land uses in the Greek prefectures
which in some cases are statistically significant and in some others are not. There are also cases where the direction of interaction (being either positive or negative) contradicts with the initial expectations.
Another useful conclusion coming from the results analysis is that the interactions between the various land use categories do not remain stable in their direction (positive or negative) and importance (high of low) for the two time periods that have been investigated. This “instability” may arise partly due to changes in economic forces that shape spatial patterns in the prefectures of the country or due to statistical data inaccuracies (e.g. quality of data especially those of 1971 census).
Finally, as it was mentioned before, there are interactions between urban and rural land uses (mainly between agricultural and forest land uses). However, these relationships do not appear to be statistically significant. Perhaps of greater importance is the positive correlation between urban and forest land uses. This relationship implies that urbanisation if not strengthening forest maintenance at least does not account for forest land loss which could be a consequence of numerous wildfires or other factors. Still, of particular interest appears to be the negative relationship between agricultural and forest land uses, something that shows the competitive character of these land uses.
In sum, the correlation analysis can provide useful insights concerning the proximate causes of land use patterns formation, and ultimately useful information as to the possible underlying causes of land use change. Improved prognosis about the future synthesis of land use patterns and effective regional policy design presuppose thorough understanding of past and current land use change trends.
6. References
[1]. Alavalapati, Janaki, Cartera, Douglas, and Newman, David (2005), 'Wildland–urban interface: Challenges and opportunities', Forest Policy and Economics, 7, 705-08.
[2]. Alphan, H (2003), 'Landuse change and urbanization of Adana, Turkey', Land Degradation and Development, 14, 575–86.
73
“Sustainable Management and Development of Mountainous and Island Areas”

[3]. Angelsen, Arild (1999), 'Agricultural expansion and deforestation: modelling the impact of population, market forces and property rights', Journal of Development Economics, 58, 185–218.
[4]. Angelsen, Arild and Kaimowitz, D. (1999), 'Rethinking the Causes of Deforestation: Lessons from Economic Models', The World Bank Research Observer, 14 (1), 73–98.
[5]. Arthur, W. Brian (2005), 'Out-of-Equilibrium Economics and Agent-Based Modelling. ''Paper prepared for Handbook of Computational Economics, Vol. 2: Agent-Based Computational Economics, K. Judd and L. Tesfatsion, eds, ELSEVIER/North-Holland, forth-coming 2005.''', (Los Alamos, USA: Santa Fe Institute).
[6]. Baulies, Xavier and Szejwach, Gerard (1998), LUCC Data Requirements Workshop: Survey of needs, gaps and priorities on data for land-use/land-cover change research; in LUCC Report Series; no 3, ed. International Project Office, 7 vols. (Land-Use and Land-Cover Change (LUCC) Project, International Human Dimensions Programme on Global Environmental Change (IHDP) and International Geosphere-Biosphere Programme (IGBP), 3; Barcelona,: Institut Cartogràfic de Catalunya,) 1-143.
[7]. Beguin, H. (1992), 'Christaller's central place postulates', The Annals of Regional Science, 26 (3), 209-29.
[8]. Briassoulis, H. 'Analysis of land use change: Theoretical and modelling approaches in: The web book of regional science, http://www.rri.wvu.edu/Web Book/Briassoulis/contents.htm', access-ed 10-02-2006.
[9]. Courtney, Paul and Errington, Andrew (2003), 'Small towns as ‘sub-poles’ in European Rural Development: Policy, theory and methodology', 77th Annual Conference of Agricultural Economics Society, (University of Plymouth: Agricultural Economics Society).
[10]. Cromley, Robert G. (1982), 'The Von Thünen Model and Environmental Uncertainty', Annals of the Association of American Geographers, 72 (3), 404-10.
[11]. Fujita, M. and Krugman, P. (1995), 'When is the economy monocentric?: Von Thünen and Chamberlin unified', Regional Science & Urban Economics,25 (4), 505-28.
[12]. Geist, Helmut and Lambin, Eric (2001), What drives tropical deforestation? A meta-analysis of proximate and underlying causes of deforestation based on subnational case study evidence; inLUCC Report Series; no 4, ed. International Project Office (Land-Use and Land-Cover Change (LUCC) Project, International Human Dimensions Programme on Global Environmental Change (IHDP) and International Geosphere-Biosphere Programme (IGBP)) 116.
[13]. Gottdiener, Mark (1994), The Social Production of Urban Space (Texas University of Texas Press) 340.
[14]. Gregory, D (1981), 'Alfred Weber and Location Theory', in D R Stoddart (ed.), Geography, Ideology and Social Concern (Oxford: Blackwell).
[15]. IHDP/START ( 2002), 'Urbanisation and the Transition to Sustainability', in Valerie Schulz (ed.), IHDP/START International Human Dimensions Programme on Global Environmental Change: Workshop, June 2-15(Proceedings No. 6; Bonn, Germany: IHDP).
[16]. Irwin, E. G. and Geoghegan, J. (2001), 'Theory, data, methods: Developing spatially explicit economic models of land use change', Agriculture, Ecosystems and Environment, 1764, 1-18.
[17]. Lambin, E. F., et al. (2001), 'The causes of land-use and land-cover change: Moving beyond the myths', Global Environmental Change, 11 (4), 261-69.
[18]. Leven, Charlie (1999), 'Obituary: William Alonso 1933-1999', Urban Studies, 36 (8), 1427-30.
[19]. Lillesand, T. M. and Kiefer, R. W. (1979), Remote sensing and image interpretation.
[20]. Lu, D., et al. (2004), 'Change detection techniques', International Journal of Remote Sensing, 25 (12), 2365-407.
[21]. Mertens, B., et al. (2004), 'Modelling deforestation at distinct geographic scales and time periods in Santa Cruz,
74
“Sustainable Management and Development of Mountainous and Island Areas”

Bolivia', International Regional Science Review, 27 (3), 271-96.
[22]. Moeller, M. S. (2004), 'Monitoring long term transition processes of a metropolitan area with remote sensing', International Geoscience and Remote Sensing Symposium (IGARSS) (5), 3398-401.
[23]. Nerlove, Marc and Sadka, Efraim (1991), 'Von Thfinen's Model of the Dual Economy', Journal of Economics,54 (2), 97-123.
[24]. NSSG (1975), Distribution of the country's area by basic categories of land use: Pre-census data of the Agriculture and Livestock Census of the year 1971, ed. National Statistical Service of Greece (Agriculture and Livestock Census; Athens).
[25]. NSSG (1985), Distribution of the country's area by basic categories of land use: Pre-census data of the Agriculture and Livestock Census of the year 1981, ed. National Statistical Service of Greece (Agriculture and Livestock Census; Athens: Hellenic Republic).
[26]. NSSG (1995), Distribution of the country's area by basic categories of land use: Pre-census data of the Agriculture and Livestock Census of the year 1991, ed. National Statistical Service of Greece (Agriculture and Livestock Census; Athens: Hellenic Republic).
[27]. NSSG (2001), Statistical Yearbook of Greece, ed. National Statistical Service of Greece (Athens: Hellenic Republic).
[28]. Rappa, Antonio (2002), Modernity & Consumption (Singapore: World Scientific) 200.
[29]. Schneider, A., Seto, K. C., and Webster, D. R. (2005), 'Urban growth in Chengdu, western China: Application of remote sensing to assess planning and policy outcomes', Environment and Planning B: Planning and Design, 32 (3), 323-45.
[30]. Seiter, Stephan (2003), 'Endogenous growth - one phenomenon: two interpretations', in Harald Hagemann and Stephan Seiter (eds.), Growth Theory and Growth Policy (London: Routledge), 27-39.
[31]. Sluiter, R. (2005), 'Mediterranean land cover change: Modelling and monitoring natural vegetation using GIS and remote sensing', Nederlandse Geografische Studies, (333), 17-144.
[32]. Sunley, Peter (1991), 'Game theories? Spatial divisions of labour and rational choice Marxism', Antipode, 23 (2), 229-39.
[33]. Thomas, Morgan D. (1975), 'Growth pole theory, technological change, and regional economic growth', Papers in Regional Science, 34 (1), 3-25.
[34]. United Nations (2006), 'Four Global Objectives on Forests Agreed Upon', in UN Forum on Forests (ed.).
[35]. Verburg, P. H., et al. (2004), 'Land use change modelling: Current practice and research priorities', GeoJournal, 61 (4), 309-24.
[36]. Walker, R. (2004a), 'Theorizing land-cover and land-use change: The case of tropical deforestation', International Regional Science Review, 27 (3), 247-70.
[37]. Walker, R. and Solecki, W. (2004), 'Theorizing land-cover and land-use change: The case of the Florida Everglades and its degradation', Annals of the Association of American Geographers, 94 (2), 311-28.
[38]. Walker, R. and Solecki, W. (2004b), 'Theorizing land-cover and land-use change: The case of the Florida Everglades and its degradation', Annals of the Association of American Geographers, 94 (2), 311-28.
[39]. Weber, C., Petropoulou, C., and Hirsch, J. (2005), 'Urban development in the Athens metropolitan area using remote sensing data with supervised analysis and GIS', International Journal of Remote Sensing, 26 (4), 785-96.
[40]. Xiao, J., et al. (2006), 'Evaluating urban expansion and land use change in Shijiazhuang, China, by using GIS and remote sensing', Landscape and Urban Planning, 75 (1-2), 69-80.
[41]. Yuan, F., et al. (2005), 'Land cover classification and change analysis of the Twin Cities (Minnesota) metropolitan area by multi-temporal Landsat remote sensing', Remote Sensing of Environment, 98 (2-3), 317-28.
75
“Sustainable Management and Development of Mountainous and Island Areas”

Environmental Ethics as a Determining Factor for Sustainable Development
Maria Sakellariou, Lecturer, Pedagogical Department of Pre-school Education, University of Ioannina, Ioannina, Greece Email: [email protected]
Abstract. At the dawn of the 21st century, it is essential to redefine education concerning principles, aims and practices aiming to the sustainable development. Pedagogic intervention can restructure the relationship between humans and the environment insofar as it aims towards the change of the behavior itself. Environmental Education can contribute decisively in changing attitudes and behaviors and establishing environmental ethics. It is here argued that the main presumption behind the above goals is to redefine the educational level of pedagogic intervention, in order to maximize its effectiveness and continuation. As it is being established, the most appropriate level for such an intervention is that of pre-school age.
Key words: Environmental Education, pre-school Education, Environmental Ethics, Sustainable Development.
1. Introduction
At the dawn of the 21st century, the subject of redefining education at the level of its principles, aims and practices is considered to be under enquiry, based on the vision for a continuing and ongoing future for human societies. Pedagogic intervention will enable us to restructure the relationship between humans and the environment because it is the one which aims towards the change of the behavior itself and not on imposing a specific behavior according to legal demands and regulations [7].
Based on this position, it is obvious that education needs to be redefined radically, so the young citizens of this world are able to perceive, to realize and to value their share of responsibility as far as their actions, their activities, their viewpoints and behaviors are concerned. They altogether provide the basis for the potential devastating practices against the environment and humanity. Environmental Education can establish this new moral and
dynamically exhibit the model of ongoing development which is also the main goal for the 21st century [45]. It is to say a mater of pedagogy and education.
In the present paper it is argued that the main presumption behind the above goals is to redefine the educational level of pedagogical intervention with the criteria being to maximize its effectiveness and its maintenance. As it has been established from the international literature, the most suitable level for such an intervention to take place is that of pre-school age. In that age the factors for learning are more favorable for this kind of intervention since the mark that it leaves is more intense, as it has been proven from pedagogical theory and practice.
2. Developing Environmental Ethics
Although the idea behind linking education with the environment already dates back to the 18th and the 19th century from Goethe, Rousseau, Frobel, Montessori [29], it was only until after the 1960’s that Environmental Education began to formulate as an autonomous environmental and educational preposition. The main goal, as it is further clear from the conferences on this topic (Beograd in 1975, Tiflid in 1977) is to create a citizen who is aware of the problem. However, that knowledge about the environment and its problems would be acquired through the promotion of the abilities required for its realization and its effective management, through the process of fostering positive attitudes and behaviors, but also through the actions taken for solving such environmental problems [15]. All of the above create the concern for environmental ethics (EE), not as yet another theme of pedagogical procedure, but as an essential need for the survival of our planet and for our modern culture.
The semantic definition of the term EE derives from the theoretical and research approaches in the field of international
76
“Sustainable Management and Development of Mountainous and Island Areas”

literature and finds scientific support in the Theory of Attitudes, from the discipline of Social Psychology.
The term “awareness” has three main resultants that determine its existence. More specifically, consciousness is made up from cognitive, emotional and practical elements [44]. Exactly the same correspondence can be found in the term environmental awareness and therefore in the term Environmental Ethics [27], [21].
To be more specific, EE is shaped from three dimensions: the cognitive dimension, the emotional and the practical dimension. These in turn are analyzed as: knowledge about the environment, emotional involvement with the environment and action about the environment.
The knowledge about the environment involves:
Personal involvement Responsibility Readiness for action
The action (behavior) regarding the environment involves:
Verbal behavior Personal behavior Positive behavior towards the information about the environment We should note however that these
dimensions were shaped and are still being enriched through the large research experience that has been acquired at a global level already from the 1960’s [27], [3],[5], [11].
2.1.Models of Environmental Ethics
Despite their effectiveness, the most important models of EE, as it is mentioned in the international literature, lead to the acceptance of the basic dimensions of Environmental Education. They address the topic of the “environmentally ethical citizen”, one who will not only be aware of the environmental problems and of their consequences, but one who will consciously utilize his activities for the sake of obtaining environmental balance [20].
In 1987, the UNESCO signed a model for action in which “the subjects and the society became sensitive towards the environment by acquiring the knowledge, the values, the abilities, the experience, but also the determination to act—personally and
globally—in order to solve the present and future environmental problems” [47].
The first investigations concerning the attitudes about the environment seem to appear in the United States in the beginning of the 1970’s. Having established the theoretical framework of their research on the attitudes theory, Maloney and Ward [27] were led to a restructuring of the EE protocol which is comprised of the following factors:
Emotional involvement (affect) Expressed intention for action (verbal commitment) Actual behavior (actual commitment) Ecological knowledge (knowledge) Similar approaches and conclusions were
derived from other important pieces of research [11], Hungerford and Volk [21] made reference to the term “environmental sensitivity”, which as it is proven from the bulk of research, is especially important in relation to behavior, but also the practical involvement which aims at finding solutions to environmental problems to be the main pre-supposition for deriving the term Environmental Ethics.
Sia, Hungerford and Torrera [40] also derived at the same conclusion considering the variables that have to do with the knowledge and the usage of the environmental strategies for action, as well as the environmental sensitivity. As a consequence, they immediately proposed their inclusion in the school curriculum and in the educational practice.
Following the same line of thinking in terms of the goal Simmons [41] proposed an even more simplified model. It quotes that the knowledge (about environmental topics), the ability for solving problems and the psychological factors (attitudes, development, self-esteem) all contribute towards the shaping of the idea of EE.
Orban maintains the view that EE consists of a number of cognitive elements, whose interpretation should be looked upon from a cognitive as well as a social level [8].
Rost’s model [32] argues that “….the subject-who-acts or the subject-who-does- not-act is a logical and a potentially programmed behavior”.
We therefore observe that the common characteristic between the models that we briefly examined is that they incorporate in their approach the basic resultants of
77
“Sustainable Management and Development of Mountainous and Island Areas”

Environmental Ethics: namely, the knowledge, the attitude and the behavior. They further have some common points of reference as far as the development of the environmentally responsible citizen is concerned, through the following:
Knowledge of environmental topics Values relating to the environment Internal and External focus of control Environmental sensitivity Knowledge of the environmental strategies for action and the ability for their utilization Active involvement for finding solutions to the environmental problems It is obvious that none of the
environmental models fail to accept the linear relationship: knowledge leads to attitude, attitude leads to behavior, but they rather view the environmentally aware citizen as the subject “who acts” and who is going through an ongoing battle as he interacts with the psychological, the social and the cultural factors.
2.2 Environmental Ethics and Intervening factors
An important element in interpreting the concept of EE is its contribution to the personal factors that lead to change, like for example, individuals’ emotional involvement, their evaluation of their whereabouts, their feeling of having personal responsibility for the environment. Yet, the effect of several non-personal factors is also important, like for example, family socialization, the school, the media, the social class, the previous experiences, the philosophical views about life, the motives (financial or other types), the knowledge about the strategies for action [8].
Another interesting approach is also that which investigates the effect of the general political attitudes and viewpoints, and also the demographic characteristics such as age, race, gender, socio-economic status and background, environmental sensitivity, and behavior [12], [46].
At another level, the scientists are trying through a socio-psychological point of view to interpret the notion of EE. There are several approaches around this viewpoint which investigate the effect of public commitment and common interest, as well as the meaning
of personal threat in the way environmental behavior is being outwardly exhibited.
Finally, another equally important approach is that of investigating the elements of personality that force the subject to become involved in environmental matters. The subjective differences in the development of EE, from a humanistic viewpoint, lie in the social initiative and in the freedom of thought which can be thought of as reflecting certain general attitudes which shape EE [3].
The argumentation regarding the elements that comprise the development of the environmentally responsible personality has been the subject of many investigators. For example, Arbuthnot [1] has shown that the environmentally aware people are those who are involved in various activities that are similar in nature and those who, although they are not any different from the uninvolved ones as far as gender and the level of education is concerned, they usually have a younger age and more chances for belonging to a higher social class.
Furthermore, Lounsbury and Tornatzky’s research [26] has recorded some discrepancies between peoples’ verbal commitment for action and their actual/behavioral expression of their commitment.
Approaching the multi-faceted nature of peoples’ attitudes through Maloney’s changing factors (Knowledge, Affect, Verbal Commitment and Actual Commitment) we observe that personal differences do play a determining role in the attitude that someone has towards the environment. Therefore, those factors that are not in the control of the educational system ought to be taken under consideration, as the intervening factors towards the adoption and the establishment of the attitude and of the relationship with the environment. Yet, at the same time, Environmental Education emerges as an essential factor, which at the level of personal differences plays a determining role in shaping our EE.
In the framework of Smith-Sebasto and Forther’s research [42] and specifically in the framework of the tool that they have developed (the IACI-Environmental Action Internal Control Index) it is proposed that the teachers of Environmental Education should be interested in: a. the subjects’ viewpoints about the environment, b. the information that the
78
“Sustainable Management and Development of Mountainous and Island Areas”

subjects have received about the present situation, c. the ways through which they consider that they will achieve the change, and d. the ways through which the subjects develop positive attitudes [42].
Under the framework of the above facts, we can conclude that EE accepts the interaction of several changing factors, such as the elements of personality, the social and psychological factors, but also the socio-economic, political and cultural prerequisites. This conclusion is expected since EE does not seize to be a form of social awareness, which is especially required for modern environmental reality.
3. Environmental Ethics as a dynamic factor for a “Sustainable Future”
The term Environmental Ethics in the field of Environmental Education is the resultant of environmental concern and environmental awareness. The need for acquiring EE has developed from the moment that there was a discrepancy between man’s needs and nature’s needs. This argumentation has led to the creation of the environmental dilemmas [39]. This obvious discrepancy is also the subject matter of EE, which through the development of a framework of principles, with obligations and values, could guide our relationship with the environment [39].
After reading the international literature, we are led into the conclusion that the main philosophical approaches for EE are the following:
1. The utilitarian position which places the value of the nature up to the point of satisfying basic human needs [17], [43].
2. The pathocentric position, which extends the moral factor to all creatures that are thinking and feeling because of their capacity to suffer [432].
3. Schweitzer’s philosophy for the reverence of life, which extends the EE to all living creatures (that is to say the total of the flora and fauna).
4. The holistic approach, whereby the laws of EE entail the whole of nature, including both the living and non-living creatures: humans, animals, the vegetation, the stones, mountains and rivers.
A more realistic approach is the position concerning the “biotic community’, which supports the inter-dependence between man and nature, with actions that protect the balance of the biotic community [43]. The well-known position developed by Leopold in 1949 clearly states that: “There is one thing certain, that it tends to protect the integrity, the stability and the beauty of the biotic community” [24].
The role of Environmental Education in developing attitudes, behaviors and consciousness within an evaluation system which presupposes the EE comes out as extremely significant. It is stated that Environmental Education has set itself the goal of bringing about a long-term change in peoples’ consciousness about the nature and the way that people treat it [27], while it is necessary to reach to the feelings of people, which in turn determine ethical values [43]. Environmental Education, through an essential approach, both of the socio-political changing factors that guide man’s behavior, as well as the emotional and ethical routes that determine his decisions is a determining factor in the development of EE.
So, the shift towards modern environmental concern has further set the stage for the development of the concept of ongoing development. The target point of this concern was the critique towards the basic ideology of development and the essential need for changes in the fields of development, of economy, of politics and of society. Within this framework the modes of ongoing development emerge dynamically, and have to do with the development that takes place on the basis of the continuation of the balance between the physical systems of the planet, covering the needs of the present as well as of the future and ensuring ecological sustainable development and social justice [14].
Environmental Education has already incorporated in its conceptual framework the concepts of ‘sustainable’ and of ‘ Sustainable Development’ from the Map of the Beograd in 1978, the main points of which include the framework of developing a concept of the sustainable [48]. In 1977, during the summit in Tiflida, the concern for Environmental Education was established, while in 1987 in the Moscow conference the “sustainable” was officially coined as a term and was included in the conceptual framework of the
79
“Sustainable Management and Development of Mountainous and Island Areas”

Environmental Education [47]. From the summit in Rio in 1992 and onwards, the concept of sustainable development emerges totally and dynamically as the main target set for the 21st century. This was the reason why the role of education on sustainable development is considered extremely important for the sustainable when it cannot be better expressed and described most appropriately in any other way but only with the term environmental education [45], since it is connected with the values, the beliefs, the attitudes which determine the development of a new EE.
Therefore, the role of EE with the philosophy that we developed in the previous chapters constitutes a determining and dynamic factor, since it shapes attitudes and develops those abilities that allow men to better envisage the world around them, its functions and their place it in European Commission in 1995. It also gives him the chance to envisage the future that he wishes to have and attempts to create [14].
4. Pre-school Training and Education for the Sustainable Development
An important presupposition for the success of the goals of Environmental Education is to define the educational level of pedagogic intervention. As it is being established from the international literature [6], [22], the most suitable level of such an intervention is this of the pre-school age whereby the learning factors are the most appropriate ones. Tilbury [45] emphasizes that these first years of learning “… could be proven to be critical for the Environmental Training of the child …”, since it is considered to be a fundamental period for shaping attitudes and behaviors towards environmental matters. If children do not form an EE during their first years of life, there is a danger that they do not develop these attitudes and behaviors later on in life [45], [51].
As a consequence, the pre-school age is the most appropriate time period for pedagogical intervention, for shaping the attitudes and behaviors of the environmentally oriented people, through the projection and the organization of values, so the children become absorbed in the biophysical, the social, the cultural and the political environment. This age is offered for the development of
sensitization towards the human being and towards the willingness to contribute to the quality of life
During this period of life, the basis is being set for the development of the individual’s personality, which for Psychopedagogics consists of the sum of the characteristics, the inclinations, the interests and abilities, the social and emotional tendencies, the philosophical intentions towards values. Besides, according to the field of Ecological Psychology, mankind and the environment constitutes a unified, multi-complex, inter-dependent and interconnected system, in which the two-way interactions determine how man becomes an integral part of the physical and the socio-political system in which he acts and develops. The Brofenbrenner ecological model of human development, in 1977, depends exactly on this progressive, mutual adjustment, in between the developing human organism and the changes occurring in the immediate environment in which he lives, while the meaning of the environment as well as man’s uniqueness are being emphasized [36].
4.1. Interventions for altering the ecologically negative behavior
4.1.1. Constitutional (out-school) interventions
The concern for the state of the environment has led the government to adopt environmental policies, based on the principle of ongoing development. The need for preventive politics for protection of the environment is recognized necessary by everyone. The big concern of the European Commission is clearly stated at the 5th
Programme of Politics and Actions for the Environment and for Sustainable Development (1992), in which the strategy of preventive action is being outlined. At the core of this policy, one can find the ideas of collaboration and common responsibility.
Yet, constitutional interventions do not change the behavior radically, that is they do not establish a constant conscious shift, but they aim towards the development of a kind of an addiction to the citizens for treating the environment in a friendly manner. In order to establish an even more stable shift of the behavior, we need an intervention that will
80
“Sustainable Management and Development of Mountainous and Island Areas”

result in the conscious change of the behavior and one, which will be characterized by stability and continuation. This alludes to a different kind of intervention that is distinguished by its stability in terms of time and by its sustainable character, as long as these occur at the right age. It is about the didactic-pedagogical interventions that are taking place at school and which can provide the sustainable elements so as to ensure the continuation of the result that is to take place.
4.1.2. School (Didacticl-pedagogic) Intervention
The solution to the problem seems to lie in the change of the behavior through the didactic-pedagogic intervention at the school environment. The school is considered to be a place of the child’s socialization, a place of social action and of intervention [33]. For this reason, it should constitute the main place of environmental sensitivity, and in collaboration with the social surroundings, it should create a new conscience, a new EE. Yet, how can the school manage to lead the child to such a behavior and under what circumstances will the educational intervention bring about positive results? The model of classification of the educational goals seems to be important for the development of EE, since it involves the subject matter of sensitization, the subject matter of skills, of attitudes and of participation [13]. That is, it’s about the basic dimensions of EE (cognitive- emotional- practical) as they have been recorded in the international literature and were developed in a previous section of this paper (2.1).
The cognitive subject matter involves knowledge, understanding, recognition, solution of the problems and so on.. In parallel, the emotional field is expressed with a positive attitude towards the environment and the field of skills is determined through a series of psycho-kinesthetic activities of an ecological nature [2]. The dynamic of the pedagogical intervention at the school is shaped by:
1. Its medium, which is purely educational
2. Its content, as it is predetermined by the goal set by the educational system
The didactic approach that is suggested by the aims of Environmental Education at a realistic intake and realization of the objective reality, with the sensitization of the children
through their experiences of life, so as to be able to get to know, to love, and ultimately to develop a behavior which is friendly and protective towards the environment. The goals will create the prerequisites for conscious users of the environment and will pave ways that will lead to solutions of our ecological problems (Reformistich-realpolttich tendierenden Fraktichen).
Saveland [37] notes that, in order for the positive attitude and behavior towards the environment to be created, the child should try to discover it, get to know it and love it. These expectations can become a reality if they are based on learning through research and discovery and if they are based on the child’s internal need to actively participate, to be creative and have self-realization, along with his joy and his fulfillment that comes along with these activities [35], [49]. Whatever the educational good that is been fostered though experiencing the situations through the Environmental Education, this is being transferred on to the children, who internalize it as they experience it along with their development.
The children experience the environment with research and with discovery, with game and role play, by utilizing all the potential that they have and by developing their cognitive and emotional content, by developing the sensitivity and by altering their attitudes and behaviors that come along with the environmental values. As a final point, it leads to a new EE, which in turn functions as a dynamic factor for sustainable development, for a ‘sustainable future’.
The need for action, the need for discovery, the need for communication should be fostered in the ‘sustainable school’ and represent the main functions of the pedagogic interventions. Besides, the field of Genetic Pedagogy [50] accepts the fact that human thought it structured to function just like the mind of a scientist (speculation – hypothesis – verification) and that this functional need, that is this “scientific” contact with the environment should be sought from the pre-school [7].
Therefore, through the pedagogic negotiations, the children will be able to acquire knowledge about the environment, which will allow them to shape their positive attitude towards it. The maintenance of this kind of attitude will be achieved through the
81
“Sustainable Management and Development of Mountainous and Island Areas”

educational interventions which will entail the active teaching of values [30]. Especially in the field of Early Childhood Education, because children at this age have only a limited capacity to perceive complex ecological problems, the behaviors that they exhibit come along with the diachronic values and the goals of the EE only through experiencing reality [34]. Through the activities that they participate in (group play), in the framework of mimicry, children will be indirectly led to acquire a positive attitude towards the environment, satisfying their basic needs for action, research discovery, as they respond to the essential needs of their biological existence.
The love for the environment is a form of behavior which is included in the category of emotional goals. The attempt to satisfy these goals will be made if we are based on the knowledge about the environment. The cognitive perspective by the preschool child will become a reality in the framework of the child’s participation in the team, which will be the field of action and of creation, but also the reason for self-acting, for self-expression, for responsibility, for joint responsibility, for trust and for expression of sensitization. All of the above will constitute the EE, through which children will come to understand, and for that matter support, the world that surrounds them [30].
A similar climate is created from different child-centered didactic models, like this of the Experiental - Communicative Teaching [7]. The routes for all of these procedures lie in the Pragmatics and the Critical Theory, which place emphasis in the practical consequences of the teaching practice and on man’s emancipation accordingly. It is about two theories that target to cultivate a personality, which will be characterized by freedom and responsibility [23].
Yet, it is obvious that the decoder as well as the drastic medium of such a refreshing air brought about by Environmental Education in pedagogic intervention is the teacher himself who is called upon to connect the needs, the interests and the speculations of the children, with the objective reality. Specifically, it is the pre-school teacher, who needs to be characterized by broad knowledge of many topics and by sensitivity, so as to meet the challenges of the multi-faceted demands of his role. The teacher also aims to satisfy the
child’s psychological and spiritual needs, using individualized approaches but also holistic systemic methods and methodological tools so as to be able, through the daily experience to provide the child with the opportunities for thought, contemplation and action [34].
The pre-school teacher is the one who is going to help out in connecting the school with the society, since the first is systemically linked with the second and goes through the alterations that the society goes through. The core of this society is the family, which is centered mainly round the parents. The society ought to collaborate with them, with the ultimate purpose the coordination of the interventions, alleviating in this way any conflicting situations and dilemmas that are created between the child, the parent and the child itself, which are created from the conflicting interventions that sometimes take place [10], [30]. The joint effort of the educator and the child’s parents ought to coincide and lead into the creation of conscious, responsible and suspicious citizens who view the protection of the environment as a way of life.
Naturally, the teacher ought to disambiguate scientifically his actions from the pedagogic, from the psychological, the sociological, the environmental and the rest of the sciences. It is the teacher’s duty to prepare children of pre-school age for dealing with environmental matters. That is through the daily interaction with culture, and by transmitting the cognitive, the legal, and the law-enforcing and ethical elements, the principles and the rules that govern the environment, pointing out the various aspects and expressions and emphasizing the multi-complex and multiplex role in the maintenance of life. This means that all of these will be achieved if children develop a sense of the environment, through a holistic consideration of the subject. At the same time, the teacher ought to challenge and stir up the child’s mind to contemplate over the modern environmental problems, so as to be able to become sensitive towards man’s fragile relationships with the environment, forcing them to adopt a friendly attitude towards it. An environmentally friendly negotiation is evidently considered reliable if it manages to transmit all of the values that relate to specific behaviors (like those of responsibility, readiness for piece, hope and frugality) at the same time. The
82
“Sustainable Management and Development of Mountainous and Island Areas”

juxtaposition with the values ought to be constant, to develop procedurally and, whenever possible, to occur through examples of negotiations and therefore to be different for each individual.
Based on what has been already discussed, the children ought to develop EE early on from the pre-school age, which in turn will ensure a “sustainable future”. Education and training on Sustainable Development ought to be critical, geared towards values. It ought to be holistic, inter-disciplinary, systemic, political and pedagogically innovative, directed towards action and life-time achievement [25], [45]. It is therefore obvious that it is very important to redefine the school and even more so to redefine pre-school education to favor sustainable development. There need to be changes in the ways educational systems and institutions work, in order to set new goals for them and to try out new structures and roles for the school, the educators and the children [9], [14]. The school ought to be governed by the principles and to follow those practices that are based on, count on and promote the idea of Sustainable Development.
With this line of thinking Pre-school Education ought to promote the development of a sustainable future, so long as it has managed to set the “framework” of freedom and emancipation, so the new generation to define autonomously the present and care for the future instead of adopting the choices and demands of previous generations, always based on the diachronic values like this of social justice, social trust, peace, democracy, but also modern values, such as maintenance of the ecological balance and sustainable development.
5. References
[1] Arbutnot, J. The roles of attitudinal and personality variables in the prediction of environmental behavior and knowledge, Environment and Behavior 1977; 9 (2), 217-232. [2] Bloom, B.S. Taxonomy of didactic aims, Code, Thessaloniki; 1986. [3] Borden R. J., Schettino, A.P. Determinants of environmental responsible behavior. Facts or feelings. The Journal of Environmental Education 1979; 18 (2), 35-39.
[4] Bowers, C. The Cultural Dimensions of Ecological Literacy, Journal of Environmental Education 1996; 27. [5] Bowman, L.S. Public opinion and the environmental. Environment and Behavior 1977; 9, 385-411. [6] Callaway, R.W. Modes of biological adaptation – Their role in international development Monographs, I (1), The Galton Institute; 1970. [7] Chrysafidis, K. -
,Gutenberg; Athens; 1995. [8] Crivas, S. Environmental Education and environmental attitude: A synthetic approach through bibliography research. Pedagogic review 1998; 27, 41-67. [9] Cuban, L. A. fundamental puzzle of school, phi Deltakappan, 1988; 70(5), 341-344. [10] Cube, F., Storch, V. Umweltpädagogik – Ansätze, Analysen, Ansblicke, Schindele, Heidelberg; 1988. [11] Dispoto, R. Interrelationships among measures of environmental activity, emotionality, and knowledge. Educational and Psychological Measurement 1997; 37, 451 – 459. [12] Dunlap, R.E. The impact of political orientation on environmental attitudes and actions, Environment and Behavior 1975; 27, 428-454. [13] Engleson et al., 1991, A Guide to Curriculum planning in Environmental Education. Wisconsin: Department of Public Instruction; 1991. [14] Flogaiti, E., Daskolia, M. Environmental Education: Designing a sustainable future: In Aggelidis, P., Mavroeidis, G., Educational innovations for the school of the future, iss.2; 2004, Typothito-G. Dardanos; Athens. [15] Flogaitis, E., The contribution of Environmental Education in Sustainability. In: M. SCOULOS (Editor.) Environment and society: Education and public awareness for sustainability, Athens;1998: 189-193. [16] Frankena, W.K. Ethics and the environment in K.E. Goodpaster, K.M. Sayre (Eds). Ethics and the problems of the 21st
century; 1979, 3-20, Notre Dame, In: University of Notre Dame Press. [17] Georgopoulos, A. Environmental ethics, Gutenberg; Athens; 2002. [18] Grob, A. Meinung, Verhalten, UmWelt, Bern, Peter Lung Verlag; 1991. [19] Hampel, B., et al. The Impact of Parental Work and Education on Environmental
83
“Sustainable Management and Development of Mountainous and Island Areas”

Knowledge, Concern and Behavior among Adolescents, Environmental Education Research 1996; 2 (3), 287-300. [20] Hungerford, H., Peyton, R.B., Wilke, R. J., Goals for curriculum development in environmental education. Jurnal of Environmental Education 1980; 20 (3), 3-9. [21] Hungerford, H., Volk, T. Changing learner behavior through environmental education. The Journal of Environmental Education 1990; 21 (3), 8 – 21. [22] Kellemer – Pringle, M. The needs of Children, London: Idalgo; 1986. [23] Kyburz – Graber, R. Die lehrerzentrierte Unterrichtsstruktur des Gymnasiums als Hindernis fuer projektorientierten Unwettunterricht, Schindele, Heidelberg; 1988. [24]Leopold, A. A Save Count Yalmanak. New York, Oxford University Press; 1949.[25] Liarakou, G., Flogaitis, E. Why education for sustainability now? In: K. Webster, (Ed.), Education for sustainability – A teacher development project, London: FSC; 1999. [26] Lounsbury, J.W., Tornatzky, L.G. A scale for assessing attitudes towards environmnetal quality, Journal of Social Psychology 1977; 101, 299-305. [276] Maloney, M.P., Ward, M.P. Ecology: Let’s hear from the people; An Objective scale for the measurement of ecological attitudes and knowledge. American Psychologist 1975; 28, 583 – 586.[28] Mavroeidis, G., Petrou, A.The Higher Education in the 21st century, Intercollege press, Nicosia; 2003. [29] Palmer, J. Environmental education in the 21st century: Theory, practice, progress and promise. London: Routledge; 1998.[30] Pantazis, S., Sakellariou, M. A proposal for environmental education for pre-school, In the Proceedings of the conference for Pre-School Education Department in Crete with title: Phycho-pedagogic in pre-school age, October; 2001 [31] Papadimitriou, E. For a new philosophy of the nature, Gutenberg, Athens; 1994. [32] Rost, J. Das Verhaltnis von Wissen und Handeln ans Kognitiontheoretischer Sicht, In: Haussler, P. (Hrsg): Physikunterrich ung, Menschenbildung IPN, Kiel; 1992. [33] Sakellariou, M. Didactic and methodological Aspects for the socio-pedagogic work in the pre-school, Journal window in education of children, 2002a; 16.
[34] Sakellariou, M. Intoduction in the didactic of the social and pedagogic work in pre-school, Atrapos, Athens; 2002. [35] Sakellariou, M. The social education in pre-school, in Pantazis, S. and Sakellariou, M. (eds). “Preschool Pedagogic, Problems-solutions”, Atrapos, Athens; 2004. [36] Salkind, N. Theories for human development. Patakis eds., Athens; 1985. [37] Saveland, R. Purpose and Procedures in Environmental Education, I.U.C.N., Wiley and sons I-II; 1976. [38] Schahn, J., Holtzer, E. Studies of Individual Environmental concern, in: Environment and Behavior, 22; 1990. [39] Seligman, C. Environmental Ethics, Journal of Social Issues 1989; 45, 169-184. [40] Sia, A., Hungerford, H., Tomera, A, Selected predictors of responsible environmental behavior analysis: The journal of Environmental Education 1986; 17 (2), 31-40. [41] Simmons, D.A. Are we meeting the goal of responsible environmental behavior? The journal of Environmental Education 1991; 24 (2), 16-21. [42] Smith – Sebasto, N.J., The Environmental Action, Internal Control Index, The Journal of Environmental Education 1994; 25 (4), 23-29. [43] Szagun, G., Mesenholl, E. Environmental Ethics: An empirical study of Wert German Adolescents. The journal of Environmental Education 1993; 25 (1) 37-44. [44] Taylor, C. In P.F. Second (Ed.), Explaining Human Behavior. Consciousness, human action and social structure, Sage Publications, Inc. ; 1982. [45] Tilbury, D. Environmental education for sustainability: Defining the new focus of environmental education in the 1990s. Environmental Education Research 1995; 1 (2), 195 – 212. [46] Tognacci, L.N., Weigel, R.H., Wideen, M.F., Vernon, D.T. Environmental quality: How universal is public concern? Environment and Behavior 1972; 4, 73-86. [47] UNESCO, International strategy for action in environmental education and training for the 1990s. United Nations Educational, Scientific and Culture Organization, Paris,France; 1987, 1988. Wagenschein, M. Verstehen lernen, Beltz, Weinheim; 1973.[48] UNESCO, La charte de Belgrade, Connexion, 1976 ; 1, 1-3.
84
“Sustainable Management and Development of Mountainous and Island Areas”

[49] Vouyoukas, A. Essays on educational concern, Felekis eds; 1986. [50] Wagenschein, M. Verstehen lernen, Beltz, Weinheim; 1973. [51] Wilson, R.A. Environmental Education programs for personal children, The Journal of Environmental Education 1996; 27, 28-33.
85
“Sustainable Management and Development of Mountainous and Island Areas”

Tourist marketing plan in rural areas: The case of the prefecture of Pella
Aimilios Samolis1, Garyfallos Arabatzis2, Asteria Tsikna3 and Basil Manos4
1. Economist, MBA, e-mail: [email protected] 2. Department of Forestry and Management of the Environment and Natural Resources, Democritus University of Thrace, Orestiada, e-mail: [email protected] 3. Chemist, M.Sc, e-mail:[email protected] 4. School of Agriculture, Department of Rural Economy, Aristotle University of Thessaloniki, Thessaloniki, e-mail: [email protected]
Abstract. The survival and the development of a tourist destination requires a detailed knowledge of market’s rules as well as the application of contemporary methods of tourist marketing and especially the use of effective tools such as tourist marketing’s strategic plans.
This research attempts to constitute a strategic plan of tourist marketing for the prefecture of Pella. The main characteristic of this plan is the formation of a context in which the prefecture of Pella will be developed and recognised as a destination based on the following forms of tourism: mountain tourism (skiing, climbing), health tourism (water springs), and educational tourism (archaeological, cultural). Additionally, the creation of a strong image of the prefecture is also a basic characteristic of this plan.
Keywords: Planning, Tourist Marketing, Prefecture of Pella.
1. Introduction
Marketing planning, according to [10], is a logical sequence of activities, which lead to the definition of marketing’s objectives and the mapping out of plans for their achievement. The planning of tourist marketing is a process during which, the combination of the goals of a tourist organism and the existing opportunities of the surrounding marketing through the best use of material and human resources is achieved [5].
According to [11], a tourist-marketing plan consists of the formation of a group of objectives and a plan of activities that are essential for the achievement of these objectives. On the other hand, according to [2], tourist-marketing plans consist of a logical sequence of activities, which have as their main goal the achievement of marketing’s objectives. Their effectiveness is based on whether and to what extend people that participate attach great importance to the changes
of the external environment as well as to the factors that influence plans’ objectives.
The main reasons that impose the mapping out of a strategic plan of tourist marketing are: the constantly more hostile and more complicated environment in which tourist organisms operate, the rapid improvements of technological changes, and the necessity to maximise the efficiency in line with the necessity to minimise the cost, which is achieved via “the best possible combination” of all the factors and activities of the organism [2], [8], [10].
The mapping out of plans of tourist marketing results from a logical process, which consist of certain steps that are characterised by a sequence. These steps can be grouped in stages. These stages, according to [10], are: Mission, Business objectives, Marketing Control, SWOT Analysis (Strengths-Weaknesses-Opportunities-Threats), Assumptions, Objectives and Strategies of marketing, Estimation of the expecting results, Finding alternative plans and mixs, Budget, Calculation and repeating of control. As well, according to [2], the stages are: Mission report and outline of corporate objectives, Competition analysis, Customer analysis, Tourist product and SWOT analysis, Marketing objectives and alternative marketing strategies, Evaluation and selection of strategy, Tactical mix and strategy materialization.
2. Development of strategic plan of tourist marketing for the prefecture of Pella
The strategic plan of tourist marketing was constituted for the prefecture of Pella, in whose economy, the primary factor plays recently a vital but declining role. However, the prefecture has important advantages, like the rich and diverse natural environment and significant cultural resources whose development can comprise an important factor of tourist development. The mapping out of tourist
86
“Sustainable Management and Development of Mountainous and Island Areas”

marketing’s strategic plan for the prefecture of Pella is the outcome of a specific process, which comprises of logical steps that are analysed below.
3. Mission report and outline of corporate objectives
Our role is: to offer to the residents of the prefecture the possibility to be engaged in tourism, in order to stay in their native place.
Our mission is: to give to the visitors unforgettable moments and unique experiences, so as to visit and stay gradually more often to our area.
Distinctive ability: the capability of our agricultural area for diverse agricultural production can be combined harmonically with tourism and culture for a sustainable tourist development.
Indications for the future: cooperation between the organizations and businesses based on the local agreement of sustainability for the production of high quality tourist product through a variety of alternative forms of tourism. This can be related to agricultural production, in order to succeed in the recognition of the area as an autonomous tourist destination as well as in the construction of a powerful “image” for the prefecture of Pella as a destination of alternative tourism.
4. Strategic analysis
4.1. Tourist market analysis
4.1.1. Strategic analysis of competitiveness
The main competitors of the prefecture of Pella are assumed to be, primarily the prefecture of Imathia, secondly the prefecture of Florina followed by the prefecture of Grevena, the prefecture of Thessaloniki, the prefecture of Pieria, the prefecture of Kastoria, the prefecture of Serres, and the prefecture of Halkidiki. Direct competitors of the prefecture of Pella can be those that additively have the following four characteristics: a) offer similar tourist products to the ones offered by the prefecture of Pella, b) their tourist development is based mainly on those products c) they are easily accessible from Thessaloniki like the prefecture of Pella and this is why most visitors come from this prefecture, and d) they belong to the same geographical
periphery of Central Macedonia or they border on the prefecture of Pella. From the above prefectures, those that have all four characteristics are the prefecture of Imathia, the prefecture of Florina, and the prefecture of Serres. [14].
4.1.2. Strategic analysis of consumers of the prefecture of Pella
. Analysis of existing consumers of the prefecture of Pella
Tourists in the prefecture of Pella are mainly Greeks with a percentage of 92% and foreigners 8%. The most important attractions of the prefecture of Pella are the Loutraki Spring Waters in the municipality of Aridaia, Kaimaktsalan Skiing Centre located on the mountain of Bora, Edessa Waterfalls, the city of Edessa and the Archaelogical Site of the prefecture of Pella.
The type of the consumer tourist that visits Loutraki Spring Waters is changing according to the duration and the time of visit. The main consumer groups in Loutraki Spring Waters are: a) Groups of pupils, students, and elderly throughout the year, but mostly during May and summer, which use for transportation tourist coaches, b) Adults and families mainly during spring and summer, which use for transportation private vehicles and they come from Thessaloniki, the prefecture of Kozani, the prefecture of Pieria, the prefecture of Imathia, and Athens, and c) Individuals during weekends, national holidays and bank holidays, which use for transportation private vehicles.
Visitors of Kaimaktsalan Skiing Centre are divided into three categories depending on the reason for their visit: a) Athletes that belong to societies, practice winter sports and are involved professionally in skiing, b) Members of skiing clubs and autonomous skiers that dabble in skiing activities or have them as a hobby, (ski, snow board, snowmobiles), and c) Simple visitors that come often autonomously and rarely by tourist coaches for a few hours of leisure. Visitors come predominantly from Thessaloniki and nearby areas of Central and Western Macedonia [1], [14].
The first stop for visitors of Edessa is the Waterfalls Park and according to statistics, taken from the Tourist Information Office between 1997 and 2003, the average synthesis in percentages of visitors consists of (76%) Greeks and (24%) foreigners mainly from Europe
87
“Sustainable Management and Development of Mountainous and Island Areas”

(19%), Cyprus (3%), United States of America (1%), and from other countries (1%). Greek visitors of the Park are predominantly families, couples, pupils and retired, which visit the area as organised groups or as individuals. They primarily come from Thessaloniki, secondly from Athens and thirdly from Central and Western Macedonia.
Visitors of the Archaeological Museum of Pella are mainly pupils coming from Macedonia and they visit the Museum during school excursions during springtime [14].
b. Analysis of future consumers of the prefecture of Pella
Future consumers of tourist products of the prefecture of Pella should be defined in relation to the trends and the demands of tourism’s future markets. According to the results of a European survey, tourism in Europe is thought to double in the next 20 years. This increase will be combined with the differentiation of tourist product and is going to affect its demand and its distribution. In addition, according to a report of the World Tourism Organisation (WTO), the demand in the next 20 years will be predominantly focused on the “alternative” forms of tourism and the demand for diverse tourist products is going to increase.
The factors that are going to influence the demand at a world-wide level but mainly at a European level according to the estimations of the European Committee for tourism in Europe, are: the ageing of population in Europe, since in 2020 the number of people with an age above 65 is going to be increased by 17 million compared to the number in 2002, the increase in travelling of people between the ages of 50 and 65, because they are going to be single and financially independent, the improvement of travel experience, the increase in requirements, the making of travelling easier after the completion of the European Union, the opening of the borders, the common current, the release of airlines, and the trend towards shorter and frequent trips that are going to include more activities.
The choice of destination is going to be based on factors such as climate, natural environment, history, and cultural heritage.
The above trends of demand together with the factors that affect it and the criterions for the
choice of a destination, strengthen the prediction that qualitative and alternative forms of tourism will be developed and will reveal the profile of future consumers of differentiated products of the prefecture of Pella [9],[15].
c. SWOT Analysis
The analysis SWOT makes possible the detailed and methodical examination of the strong points as well as the definition of the opportunities and threats which are related with a tourist destination. The analysis SWOT for the prefecture of Pella which follows (with a short presentation in tables 1,2,3 and figures 1, 2) points at the creation of the real image of the prefecture as a tourist destination which will be a stable base for the definition of objectives and strategies.
5. Strategic choice and direction
5.1. Tourist marketing’s objectives for the prefecture of Pella
The basic development objective for the prefecture of Pella is the creation of a context for the development and the recognition of Pella as a destination with alternative forms of tourism as main forms of development. An additional objective, is the creation of a strong “image” of the prefecture through the elevation of its advantages, which can be accomplished by developing the opportunities and coping with external environment’s threats. The general objective of strategic marketing is the development of new tourist products suitable for upcoming markets (differentiation), according to Ansoff’s strategic directions model, but simultaneously aiming at the improvement of the present product through the expansion of the present market. The special marketing objectives are: the increase in hotel beds, the increase in the average residence of the foreigner tourists in the prefecture, the increase in the average annual bookings of the hotels, the preservation of the visitor market of the prefecture of Thessaloniki and of the rest of the areas of Central and Western Macedonia, and the expansion in the markets of eastern Macedonia and the Balkans.
88
“Sustainable Management and Development of Mountainous and Island Areas”

Table 1: Analysis of the internal environment of the prefecture
EVALUATION IMPORTANCE /
STRENGTHS AND
WEAKNESSESVery
strong
point
Strong
point
Weak
point
Very
weak
point
Very
important
Important Unimportant
Natural resources
1. Alexander the Great
2. Accessibility
3. Edessa’s waterfalls
4. Snowing duration in Bora
5. Traditional Settlement
6. Mountain paths 4 & 6
7. Human resources (ageing)
8. Facilities sufficiency
9. Absence of connection with main
road networks (EGNATIA)
10. Seasonal tourism
11. Visit duration
12. Hospitality of residents
13. Low prices
14. Capacity of quarters
15. Local tradition
16. Network marking
17. Development of archaeological
sites
18. Local cuisine
Source: Samolis, 2005
89
“Sustainable Management and Development of Mountainous and Island Areas”

Table 2: Analysis of the external environment of the prefecture (opportunities)
/ Opportunities for the prefecture Opportunity code
Succession potentiality
Value(1 to 9)
Attraction
Value(1 to 9)
1 Increase in preference for qualitative and secure tourist products
A 6 6
2 Trend for short-distance journeys in domestic destinations
B 9 9
3 Increase in demand for “active” tourism C 8 4
4 Safe destination D 4 4
5 Good communication connection Giannitsa-Skidra-Aridaia via the new road
E 4 3
6 Accession in “Natura,” network for areas. Mountains Boras, Tzena & Paiko, the pass of Apsalos-Moglenitsa and the lakes Agra & Begoritida
F 8 8
7 Development of geographical position in order to attract tourists from neighbouring countries with the perspective of direct connection
G 1 7
8 Accession of border areas of the prefecture of Pella in INTERREG European programme and financing of tourist investments
H 9 7
9 Easy accessibility to counties of Macedonia that are in a development stage
I 8 4
10 Accession of tourist product in the limits of tourist development of Macedonia J 3 8
11 Potentiality of development of several forms of alternative tourism, connection of natural & cultural resources with the agricultural production
K 4 7
12 Increase in interest for Central and Western Europe for holidays in the open-air in simple quarters of “ecotourism”
L 6 4
13 Constant increase in elderly until 2020 in the 10 most significant European countries M 9 1
Source: Samolis, 2005
Figure 1. Matrix of opportunities
Potentiality of success
High 9 5 1 Low 9
Attraction 5
Low 1 5
A, B, F & H D & E
C, I, L & M G, I & K
90
“Sustainable Management and Development of Mountainous and Island Areas”

Table 3: Analysis of the external environment of the prefecture (threats)
/ Threats for the prefecture Threat code
Occurrence potentiality
Value(1 to 9)
Risk
Value(1 to 9)
1. Common sources of threats in the modern world (armed brawl, terrorist attacks, earthquakes, floods, slidings etc) A 4 8
2. The strong euro increases the risk to be characterised as an expensive destination
B 8 4
3. The expensive capital (Athens) increases the risk to be characterised as an expensive country C 8 4
4. The unwise use of fertilisers-pesticides decreases water’s quality D 7 7
5. The mining activities without a future plan threat the natural environment E 4 8
6. The uncontrolled grazing-woodcutting and illegal hunting are putting to risk the stability of the sensitive ecosystems of the area
F 4 9
7. Increase in competitor destinations that offer similar tourist product
G 8 8
8. Offering of low quality services and lack of professionalism H 6 9 9. The decline of European economies, including our country,
causes the decrease in income and the increase in unemployment
I 6 4
10. Difficulty to develop activities during periods of low demand
J 8 8
11. Bureaucracy in the operation of public organization K 6 4 12. Requirement of consumers for better quality of tourist
product with the same or lower price L 4 4
13. Weakness of local societies to handle local problems (passive handlers)
M 8 4
Source: Samolis, 2005
Figure 2. Matrix of threats
Potentiality of occurrence
9 5 1 High High 9
Attraction 5
Low 1 5
D, G, H & J A, E & F
B, C, I, K & M L
91
“Sustainable Management and Development of Mountainous and Island Areas”

5.2. Tourist marketing’s strategies for the prefecture of Pella
5.2.1. High marketing strategies
In the case of the prefecture of Pella, is assumed to be effective to choose the strategy of focusing on small parts of the market, since with its limited financial sources it is not possible to aim at big markets. Additionally, the prefecture because of its powerful agricultural area, which is unique, and its rich stores of natural-environmental and cultural resources it has the capability to develop qualitative products with a local identity. At the same time, the strategy of focusing and the strategy of differentiating assist to the recognition of the area within the borders of sustainable development.
5.2.2. Special marketing techniques
Special marketing techniques that are selected for the prefecture of Pella in relation to the product are, the improvement of the quality and the characteristics of the available products and services, the fixing of the product’s name, and the enrichment and expansion of the product’s diversity. In relation to the price, are the alteration of pricing, the continuation of the competitive prices, and the offering of “premium-priced” products. In relation to the promotion are, the changing in selling tactics, a thorough advertisement campaign, a thorough programme of public relations, and a communicative mix focused on the groups-objectives. In relation to the distribution are, the development of new distribution channels and a thorough programme of distribution and promotion with the use of new technologies.
5.3. Segmentation of the tourist market of the prefecture of Pella
According to the profile of the existing and future consumers of the tourist product of the prefecture of Pella, the most suitable and distinctive parts of the market (strategy of focusing) were chosen, which meet the existing and differentiated tourist product needs of the prefecture (strategy of differentiating) and are: a) retired-elderly, 55 years of age and more, coming from the
domestic market (mainly for spring water tourism in Loutraki), b) public and private servants, 20-39 years of age, middle financial class, high educational level, attracted by mountain sports like skiing and climbing, organising their trip themselves using a private passenger car, going to close destinations with an average distance of 100 km from the main attraction site, which is Bora’s mountain with Kaimaktsalan skiing centre c) superior administrative and managerial executives of the public and private organization and people having scientific, artistic and allied occupations, 25-54 years of age, coming from the domestic market, going on short trips that are organised by themselves using a private passenger car, usually during weekends and bank holidays, attracted by nature and clean air for activity and calmness, mainly for climbing, spring water and skiing tourism d) people of 40-64 years of age, coming from the wider area of Balkans and Europe in general, middle and upper financial class, high educational level, attracted by the history and culture of a place, combining their visit with leisure and spirit cultivation (archaeological, historical and urban tourism), mainly visiting Ancient Pella, Edessa and Aiges, e) public schools, every kind of junior high school and high school, using school buses, during the school year but mainly during spring and autumn, driven by the context of educational tourism (historical, archaeological and cultural) and environmental education, attracted by the historic importance of the area, its archaeological and cultural riches (Alexander the Great-Ancient Pella-Aiges) and its environmental centres (information centre of Agra’s wetland and centre of environmental education of Loudia’s wetland in the municipality of Giannitsa) [14].
5.4. Establishment of the prefecture of Pella as a tourist destination
The establishment of the prefecture of Pella as a tourist destination should be based on its particular advantages against its competitor destinations that are unique, lasting and they cannot be copied. The advantage for the national market-target is the natural waterfalls of Edessa, as for the international market is the place where Alexander the Great was born.
92

Those characteristics can make the prefecture of Pella distinctive in the consumer’s mind among other destinations and together with its rich natural-environmental, historical and cultural resources can create a variety of tourist products that can satisfy consumers’ interests and requirements, in the context of developing alternative forms of tourism, since these forms gain more and more interest in tourist demand. Additionally, because of the power of the agricultural area, the prefecture has the capability of connecting the local production with the available tourist products, in order to keep the prices down without losing the quality. The prefecture with the use of appropriate advertisement messages can achieve an efficient picturing in the consumer’s mind that “The prefecture of Pella: The place where Alexander the Great was born”, “The prefecture of Pella: The magic of the waterfalls”.
6. The constitution of budget of tourist marketing’s plan for the prefecture of Pella and materialization organization
STEPFOR+ network (Network of Cooperating Tourist Businesses, Cultural organizations of the prefecture of Pella) is the most suitable organization for materializing the strategic plan, because it is an autonomous and independent organization, which promotes the prefecture as a tourist destination and has as members organizations and businesses of the tourist network of the prefecture. At the present time, because of the limited experience, the constitution of the budget is going to take place according to the method that is based on the review, is simple, economical, popular and easy as a technique. So, the previous budgets of the Committee of Tourist Promotion between 2001 and 2005 are going to be taken into account and in line with the readjustments and additions, according to the present facts, the whole budget for the years between 2006-2010 is going to be determined. This is going to take place in line with the suggested activities, which are going to be relevant to the components of the marketing’s mix and are going to be part of a strategic plan of five years for the prefecture of Pella, making the whole budget more functional, more thorough and finally more effective. In addition, there must also exist a prediction in case of sudden incidents and
crisis for an immediate readjustment of the budget and the suggested activities, in order to overcome those difficulties effectively. It is also thought to be substantial, the surveillance of the budgets of the promotion’s tourist programmes of the competitor destinations to avoid for the prefecture of Pella having an inferior budget [10], [12], [16].
The materialization factor of the tourist marketing’s plan for the prefecture of Pella does not affect directly the components of the marketing’s mix (excluding the mix of promotion) and its role for the rest of the elements is simply consultative, instructional and co-ordinational. Obviously, the decisions for the product, the price and the distribution are taken mainly from the tourist businesses, which should realise that it is them who form the identity and recognition of the area. As a result, the budget of tourist marketing’s plan for the prefecture of Pella is identical with the requisite expenses of the mix’s distribution of the whole prefecture’s tourist product.
7. Tactical mix and strategy materialization
7.1. Suggestions relatively to the product
The main product of the area is the thematic vacations, which are related to alternative forms of tourism and require the formation of “thematic packages”. The suggestions of the materialization organization in relation to the product must focus on the development of natural and cultural resources for the development of alternative forms of tourism (water spring, skiing, climbing, archaeological etc). Furthermore, they must focus on the improvement and development of infrastructures and services, according to sustainable tourist development, with respect to the environment and to the area’s future.
7.2. Suggestions relatively to the price
Referring to the price of the whole tourist product, because the prefecture of Pella is at its starting stage of tourist development and at this stage it attempts to succeed in recognising the product, it should remain at a competitive level (low prices). The strategy of competing prices is strengthening by the trend of developing mountain destinations with a similar tourist product (alternative forms of tourism), which
93
“Sustainable Management and Development of Mountainous and Island Areas”
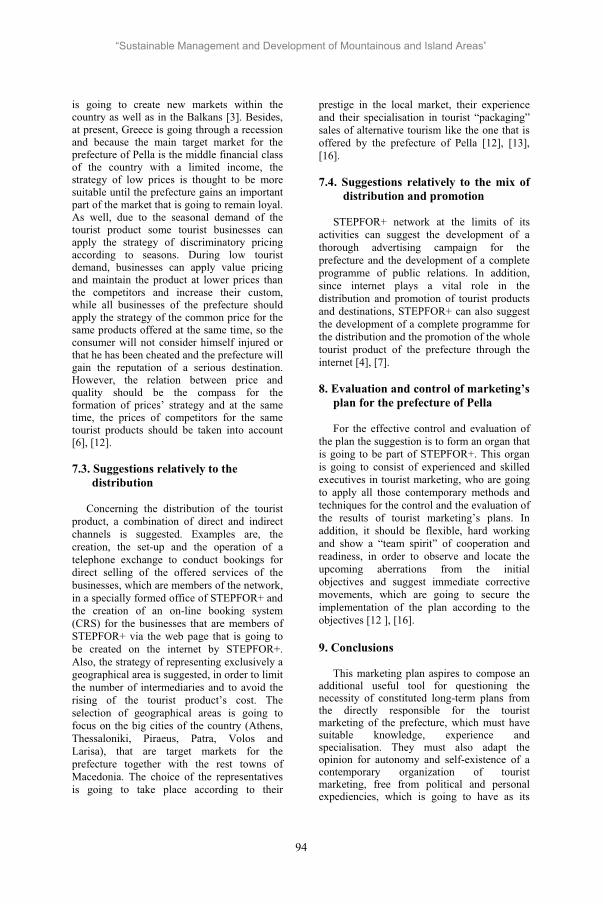
is going to create new markets within the country as well as in the Balkans [3]. Besides, at present, Greece is going through a recession and because the main target market for the prefecture of Pella is the middle financial class of the country with a limited income, the strategy of low prices is thought to be more suitable until the prefecture gains an important part of the market that is going to remain loyal. As well, due to the seasonal demand of the tourist product some tourist businesses can apply the strategy of discriminatory pricing according to seasons. During low tourist demand, businesses can apply value pricing and maintain the product at lower prices than the competitors and increase their custom, while all businesses of the prefecture should apply the strategy of the common price for the same products offered at the same time, so the consumer will not consider himself injured or that he has been cheated and the prefecture will gain the reputation of a serious destination. However, the relation between price and quality should be the compass for the formation of prices’ strategy and at the same time, the prices of competitors for the same tourist products should be taken into account [6], [12].
7.3. Suggestions relatively to the distribution
Concerning the distribution of the tourist product, a combination of direct and indirect channels is suggested. Examples are, the creation, the set-up and the operation of a telephone exchange to conduct bookings for direct selling of the offered services of the businesses, which are members of the network, in a specially formed office of STEPFOR+ and the creation of an on-line booking system (CRS) for the businesses that are members of STEPFOR+ via the web page that is going to be created on the internet by STEPFOR+. Also, the strategy of representing exclusively a geographical area is suggested, in order to limit the number of intermediaries and to avoid the rising of the tourist product’s cost. The selection of geographical areas is going to focus on the big cities of the country (Athens, Thessaloniki, Piraeus, Patra, Volos and Larisa), that are target markets for the prefecture together with the rest towns of Macedonia. The choice of the representatives is going to take place according to their
prestige in the local market, their experience and their specialisation in tourist “packaging” sales of alternative tourism like the one that is offered by the prefecture of Pella [12], [13], [16].
7.4. Suggestions relatively to the mix of distribution and promotion
STEPFOR+ network at the limits of its activities can suggest the development of a thorough advertising campaign for the prefecture and the development of a complete programme of public relations. In addition, since internet plays a vital role in the distribution and promotion of tourist products and destinations, STEPFOR+ can also suggest the development of a complete programme for the distribution and the promotion of the whole tourist product of the prefecture through the internet [4], [7].
8. Evaluation and control of marketing’s plan for the prefecture of Pella
For the effective control and evaluation of the plan the suggestion is to form an organ that is going to be part of STEPFOR+. This organ is going to consist of experienced and skilled executives in tourist marketing, who are going to apply all those contemporary methods and techniques for the control and the evaluation of the results of tourist marketing’s plans. In addition, it should be flexible, hard working and show a “team spirit” of cooperation and readiness, in order to observe and locate the upcoming aberrations from the initial objectives and suggest immediate corrective movements, which are going to secure the implementation of the plan according to the objectives [12 ], [16].
9. Conclusions
This marketing plan aspires to compose an additional useful tool for questioning the necessity of constituted long-term plans from the directly responsible for the tourist marketing of the prefecture, which must have suitable knowledge, experience and specialisation. They must also adapt the opinion for autonomy and self-existence of a contemporary organization of tourist marketing, free from political and personal expediencies, which is going to have as its
94
“Sustainable Management and Development of Mountainous and Island Areas”

only goal the promotion of the natural, cultural and human resources of the prefecture of Pella. This organization, which for the moment seems to be the STEPFOR+ network, with the appropriate strategic plan of tourist marketing is going to contribute to the development of the attractive elements of the prefecture, while is going to promote the appropriate administration and distinction of cultural elements, the appropriate construction and materialization of a policy aiming at the qualitative and aesthetic upgrading of tourist infrastructures and the enrichment and development of new products of high quality. This is going to play a vital role in the sustainable and rational development of the prefecture of Pella.
10. References
[1] Arabatzis G., Kamenidou E. and Mihailidis A. 2002. Attitudes, opinions and characteristics of the visitors of Bora’s Skiing Centre. Proceedings of 15th
Panhellenic Conference in Statistics. Vol , pp. 109 –117. Ioannina.
[2] Christou, . 2000. Principles and Philosophy of National and Peripheral Plans of Marketing. Hellenic Open University, Patra.
[3] Gartner, W. Tourist Development: Principles, Procedures and Policies. Ellin, Athens.
[4] Groutas, G. and Nikolaidis, H. 2000. Tourist Marketing of Sectors, Organisations and Businesses. Hellenic Open University, Patra.
[5] Holloway, J. C and Robinson, C. 1995. Marketing for Tourism. Longman, Harlow.
[6] Igoumenakis, N. 1999. Tourist Marketing. Interbooks, Athens.
[7] Kazazis, . 2000. Effective Marketing for Profitable Sales. Stamoulis, Athens.
[8] Kehagias, . 2001. Planning of Marketing’s Programmes. Hellenic Open University, Patra.
[9] Mihailidis, G. 2002. Study of Tourist Development of Peripheries of Central Macedonia and Western Macedonia. Thessaloniki.
[10] McDonald , M. 1999. Marketing Plans: How to Prepare them how to Use them. Butterworth – Heinemann, Oxford.
[11] Middleton V.T.C and Clarke J.2001. Marketing in Travel and Tourism. Butterworth- Heinemann, Oxford.
[12] Protopapadakis, . 2003. Tourist Marketing. Stamoulis, Athens.
[13] Sakellaridis, . 1999. Computing in Tourism. Hellenic Open University, Patra.
[14] Samolis, . 2005. The Constitution of a Strategic Plan of Tourist Marketing for the Prefecture of Pella. M.Sc. Hellenic Open University, Patra..
[15] Tsartas, ., Manologlou, . and Markou . 2001. Qualitative Characteristics and
Demand Trends of Domestic Tourism. NCSR, Athens.
[16] Vitouladiti, O. 2000. Tourist Marketing of Sectors, Organisations and Businesses: Manual of Study of the Book Marketing in Travel and Tourism. Hellenic Open University, Patra.
95
“Sustainable Management and Development of Mountainous and Island Areas”

Tourism in the framework of Sustainable Development planning employing the MIO-ECSDE/ SUDECIR methodology:
The case of the Island of Rhodes, Greece
Michael ScoullosProfessor, University of Athens, Chairman of MIO-ECSDE
Abstract
The paper describes the participatory approach developed in the framework of the project called SUDECIR for the formulation of sustainable development plans in a typical Mediterranean coastal region, the development of which is dominated by tourism the island of Rhodes, Greece, by MIO-ECSDE (Mediterranean Information Office for Environment, Culture and Sustainable Development). Two are the innovations of the used methodology reported here: (1) The acceptance that the holistic approach needed for sustainable development plans does not inhibit ‘prioritization’ and focusing on the ‘driving’ sector where more emphasis and work is needed. The selection of main stream tourism in Rhodes as a vehicle for change towards sustainability was essential. (2) The incorporation of dialogue in the process, from the very beginning, where the aspirations of the involved stakeholders were taken seriously into account. Even the objectives and criteria of sustainable development were discussed and amended by them. The process is suitable to be implemented in similar cases, through ‘voluntary’ or ‘negotiated’ agreements, especially in areas where tourism is the dominant economic sector.
Key-words
Sustainable development plans, tourism, carrying capacity, stakeholders participation
Introduction
Sustainable Development (SD) which emerged as the major message of the UNCED and the Rio
(1992) process, and was further elaborated and concretised in Johannesburg in 2002, calls for the formulation of realistic and operational plans which could interpret the globally accepted principles into tangible reality in regions and cities where people live and work. The primary objective of the SUDECIR research project (Sustainable Development in European Cities and Regions), which was supported by DG Research of the EU, was to develop a (bottom-up) analytical concept and an associated set of practical guidelines which, when applied to a well defined region containing one or more population centres, will produce a clear and concrete path for that region towards sustainability. A set of the key results of the SUDECIR project have been published [1,2] In the present paper we provide an outline of the analytical tool SUDECIR offers in order to initiate and follow up a dialogue with key stakeholders in formulating SD plans. The SUDECIR approach is based on a systematic effort to facilitate an understanding of regional SD objectives, followed by the introduction, discussion and acceptance of sustainability criteria and indicators; the assessment of the present status of the region with regard to sustainability, the identification of the key or driving economic sectors in the region; the elaboration through participatory process of a regional sustainable development plan, which is a living, non static plan, open to gradual adaptations and improvements. In the framework of SUDECIR, MIO-ECSDE focused on the Mediterranean region and the important sector of tourism. The methodology developed and applied is based (1) on the identification of tourism as the critical ‘driving’ economic sector of the Rhodes Island taken as a region,
96
“Sustainable Management and Development of Mountainous and Island Areas”

(2) the identification of the limits to the volume of activities of this sector based on the determination of the ‘Carrying Capacity’ of the region that is being analysed, by using an amended CAMP methodology introduced originally by the PAP/RAC of the UNEP/MAP in the integrated planning study for the island of Rhodes [3,4]; and (3) on maximizing the value added by public participation. With regard to the latter, via the process of formulating and reaching consensus on a SD Plan, the emphasis of MIO-ECSDE’s methodology is the incorporation, and cultivation from the very beginning, of the common ‘vision’ for the future and comparison of such a vision to the subjective assessment of the current situation. Through that process the identification and agreement on the root causes, and the adoption of the objectives and criteria of ‘Sustainable Development’ is obtained, keeping in mind that the process is long and that a ‘step by step’ improvement is more likely than an ‘ideal total and rapid transformation’. The present paper elaborates exclusively on the ‘procedural’ aspects of the participatory
component of the SUDECIR project as it was developed and applied in the case of Rhodes. The methodological process for drafting sustainability plans is presented in a schematic way in the SUDECIR Process Diagram (fig. 1). Its various steps contain: - a regional Status Audit - an advanced regional analysis where the critical sector(s) are identified and analysed and - the drafting of sustainability plans in various steps. It is stressed that the identification of the key economic sectors is not made in order to elaborate a sectoral approach but to identify the most suitable and strong ‘vehicle’ for the needed changes also in all (or at least most) other sectors which could contribute to sustainable development. The involvement of the Public in the entire process from the early stages and their participation in the decision-making process concerns the modes of public participation and partnership, the nature of the groups involved (‘stakeholders’) and the interpretation of the ‘arrows’ connecting the various parts of the proposed flow diagram. The arrows represent in
Figure 1. The SUDECIR process programme
97
“Sustainable Management and Development of Mountainous and Island Areas”

an abstract, dynamic way inputs including: exchange of information, dialogue, comments and criticism or agreement of the involved stakeholders. The relationship developed with the stakeholders and the evolution of the process itself are very critical for the success of the whole exercise. In the following paragraphs an attempt is made to explain the available experiences gained from the application of the approach in the island of Rhodes. It should be understood, however, that the approaches described and suggested are most likely transferable to other similar cases only after considerable amendments and adaptation to the local conditions taking into account the politico-economic and cultural framework of the particular area and time available for the process as well as the existing traditions, previous experiences, the prevailing of national or local level participatory culture and the overall institutional background. First reference is made to the concept of partnership and the various stakeholders and then to the arrows which have been ‘clustered’ into three groups: - Group 1 (1a to 1d) concerning the ‘transfer’ of sustainability criteria into the system; - Group 2 (2a to 2d) concerning the ‘incorporation’ of social assessments and perceptions into the system; - Group 3 (3a to 3d) concerning the evolution of the sustainability plan itself.
The concept of partnership
Partnership and public participation are, by definition, complex notions. One should clarify what partnership means and which are the expressions of the Public and the view of the stakeholders. It is widely accepted [5,6] that partnership is a bundle of compromise arrangements of mutually binding nature which balance and fulfil better than other relevant alternatives the interest of all parties and on which agreement was reached through a dialogue. The participation in the dialogue of the largest possible number of parties concerned is –at least in theory- considered to increase the options of stability and sustainability of these agreements.
Although dialogue is usually a lengthy procedure and does not necessarily lead to a partnership agreement, it is usually the backbone of a continuum which may ultimately lead to the ‘institutionalisation’ of procedures and/or other agreements. Such ‘institutionalised’ agreements could include also the so called ‘voluntary’ or ‘negotiated’ agreements, types of labelling, classification, etc. They are usually reflected in the methods of operation of organisations or fora and may be applied also with parties who had not originally participated in the dialogue which resulted in the agreements. The population of a given region or locality, is often a passive recipient of information and may contribute to decision making on sustainability plans only through referenda or mass popular actions (e.g. demonstrations etc.) but cannot be easily considered as a party to such a dialogue. To effectively participate in the formulation of sustainability plans the population must be given well designed and truly democratic opportunities such as public hearings, open consultations, etc., which are frequently organised by the local or regional authorities. In many cases the public begins to formulate positions, expresses interest and selects priorities stimulated by persons or NGOs who take the initiative. The views of the population are expressed in various ways in many cases through elected traditional and/or innovative fora and formal representatives; in other cases by spontaneous leaders or personalities widely acceptable by the population, influential NGOs etc.
The Parties Involved
Authorities & Formal Elected Fora:Obviously, Sustainability plans for a region are not negotiated and adopted without the involvement of the ‘state’ authorities and the local authorities. The State, in the case of Rhodes, included: - Central Government, - Regional or Prefectural administration, - District Authorities, Local Authorities included the City of Rhodes as well as other municipalities. In many countries there are in place local, district, town, prefectural and other popular councils elected and managing, to a certain
98
“Sustainable Management and Development of Mountainous and Island Areas”

extent, local affairs. In some cases these councils are properly empowered to approve, reject or even amend projects and actions submitted by the Central Government or the Regional Executive Authorities. In many Mediterranean countries such bodies –even when they exist- are not adequately empowered. In many cases the aforementioned elected bodies are directly or indirectly linked either with the State (e.g. Central Government, Regional of Prefectural administration with representation through regional elections) or with city or town (local) authorities or district representations (see below). In Rhodes, apart from the City Municipal Council, of particular importance is the Prefectural Council which covers the entire island while the Regional Council of the South Aegean was at the time of the project in its first years of operation with very limited responsibilities.
NGOs:NGOs may play several important roles. Such roles could range from mobilisation of the wider public, raising public awareness and consciousness in favour of or against a policy or project at national or local level, up to proposing solutions or amendments, and mediating between a public group and the Government, or offering direct support to the authorities by organising jointly campaigns on issues of mutual interest (e.g. water). At the European and Mediterranean level, NGO Federations and networks have played a major lobbying, educational and political role, participating actively in the formulation of policies, and diffusing the messages and policies to a large number of national and local NGO members [6,7]. In the case of Rhodes MIO-ECSDE played a participatory important role activity of facilitator and coordinator of the entire dialogue with all stakeholders. A series of local NGOs were also involved. However, in many cases their role is very limited in the implementation and enforcement of policies or commitments undertaken by Governments.
The private sector:The private sector includes:
- The chambers of commerce and/or industry, recently showing particular interest in issues of development (see the relevant Chamber and Union of Hoteliers in Rhodes). - The private investment sector (e.g. Banks), important for project financing. - ‘Producers’, such as farmers, fishermen, etc., represented in the case of Rhodes through their local unions or cooperatives. - The private consultative sector which in some cases (not so much in Rhodes) has shown ability to bring together other parties in order to obtain consensus for the success of the project to which its work is related.
Syndicates:Syndicates such as Labour Unions, Trade Unions etc. also have an important saying in formulating sustainability plans. They were involved also in Rhodes.
Financing Organisations:Projects which are not self-financed by beneficiaries are only implemented if they are of acceptable environmental and economic prospects. Therefore, these organisations play an increasingly important role in the relevant public dialogue. They were not so significant and were not involved in Rhodes.
Universities and Research Institutes:These institutions have frequently ability to influence other parties due to their usually good reputation and high respect that the public and the authorities show to their expertise and their politically ‘neutral’ work. Both universities of Athens and the Aegean were involved.
Intergovernmental and other International Institutions:Several such institutions and agencies, particularly of the UN and the EU families, could play effective roles in participating in and initiating or stimulating dialogues and partnerships or providing finance and technical assistance to projects which involve the public. In the case of Rhodes UNEP/MAP and its PAP/RAC were involved and the European Commission was also indirectly involved.
99
“Sustainable Management and Development of Mountainous and Island Areas”

Political Parties:In many European countries political parties play, in a non-systematic way, a role in stimulating public debate on environment and development issues. In the Mediterranean countries the role of Parties in this topic varies widely from case to case. In some countries the role of the party in power virtually reflects the views of the Government. In Rhodes, all political Parties were informed, invited and to a certain extent participated or responded.
Churches and Religious Groups:Traditionally they participated rarely in public dialogues on issues related to environment and sustainable development, although many of them are becoming increasingly active, mostly on moral and ethical issues.
In conclusion, representatives of all the aforementioned groups were invited and participated in the Rhodes Island dialogues for the drafting of the relevant sustainability plans, in addition to all relevant departments of public administration.
Arrows’ explanation in the flow diagram of the SUDECIR methodological approach (Fig. 1)
Group 1: The transfer of sustainability criteria into the systemThis process is important in many ways. In fact it attempts to bring into the sustainability plan a number of ‘objective’, sound and, if possible, widely accepted criteria and indicators against which the existing and suggested modes of development could be tested. In this respect the criteria are usually, at least initially, proposed or selected by experts. Ideally, they should be proposed by scientists acting not in isolation from other stakeholders, but also without compromising their scientific analyses and hard data or norms deriving from the analyses of the prevailing theories and good international practice. These arrows represent a flow of information and expertise and they should be formulated in an easily understandable way using all modes recommended by environmental awareness-raising methodologies.
So, the arrows of family 1 represent primarily transfer of criteria scientifically selected, communicated from the beginning to the various stakeholders, receiving comments and feedback from them and, if necessary, redesigning and adapting them accordingly. The latter is reflected by a two-way reaction expressed with the small 2b arrow representing the feedback to the 1b, which is the main ‘communication’ process. Arrow 1a represents the use of criteria in order to assess the existing situation including identification and analysis of the driving key economic sector(s). Arrow 1c represents the use of the same criteria and eventually derivative indicators for the selection of the appropriate recommendations and strategies to be included in the draft sustainability plan while arrow 1d represents the need to use the sustainability criteria as a necessary ‘check-list’ against which the commonly agreed policies and strategies included in the sustainability plan will be tested.
Group 2 arrows: The incorporation of the social assessment(s) into the systemThe group 2 arrows are extremely important and represent a very ‘innovative’ approach, applied -to the best of our knowledge- for the first time in the case of Rhodes. The basic idea was to bring into the system the more ‘subjective’ understanding and perceptions of the public about what is sustainable or unsustainable, easily acceptable, barely acceptable or totally unacceptable by them. This input is crucial for the content of the sustainability plan but also for the design of the drafting process itself (arrows 3). It is also an important educational tool of participatory learning and a great help to start the negotiation and the public dialogue. Active involvement facilitates consensus building and hopefully agreement and commitment. Arrow 2a represents the assessment of the existing situation. What is considered more or less sustainable or unsustainable, the historical evolution of the situation and the reasons and interpretations - which may be in some cases valid and in other not, superficial or deeply rooted in the minds of the people - for whatever evolution, negative or positive.
100
“Sustainable Management and Development of Mountainous and Island Areas”

Arrow 2b is the reaction of the public to the sustainability criteria suggested, while arrow 2c represents mainly the expectations, aspirations and ambitions of the various stakeholders. These expectations are of two types (a) their "vision" for the region or city at a "steady state" of sustainability, (b) their expectations from the process itself and the margins of what they will consider as a successful and useful exercise, or what they may consider as failia. Arrow 2d represents the active participation of the various groups in the formulation and finalisation of the commonly agreed elements of the plan. All the input of the public and stakeholders have been collected in the case of Rhodes through a series of questionnaires, filled in by members of the research group during interviews with targeted groups of stakeholders. Few questionnaires were completed by the stakeholders themselves.
Group 3 arrows: The evolution of the Sustainability Plan itself The 3rd group of arrows represents actually the evolution of the sustainability plan. Figure 2 gives more details about an eventual sequence of steps in drafting sustainability plans and the approximate content of these drafts.
It is stressed that the first steps of the draft contained very few recommendations, just enough to trigger the interest of the stakeholders but making clear that everything is "open" for discussion and rearrangement. Emphasis is given to the analysis of the existing situation and the assessment, and mainly to the building of confidence and a proper explanation (and if possible acceptance) of the process itself. In steps 3b and 3c, the recommendation part was strengthened and from the moment the stakeholders have agreed on the process and the method of decision making (consensus), the distribution of tasks and commitments among partners follows in a natural and smooth way, with increased possibilities of implementation of the sustainability plan proposed both through ‘voluntary’ agreements and through the introduction of new or updated legislation/ regulation. However the benefits of the process should not be overestimated. For the commitments to last and be translated into concrete actions, a mechanism should be in place to remind, facilitate the flow of information and secure fulfilment of obligations and renewal of commitments. This mechanism (either in the form of a ‘follow-up Committee’, or ‘Secretariat’, or ‘Coordination unit’) requires a minimum of funds and some sort of
Figure 2: the steps of the formulation of a Sustainable Development Plan, including the participatory aspects
101
“Sustainable Management and Development of Mountainous and Island Areas”

‘legitimisation’ (or ‘institutionalisation’) in order to survive personnel changes in administration and critical stakeholders. This was and still is the weak point in the agreed Sustainability Plan of Rhodes. Despite the fact that the Union of hoteliers itself has accepted to declare Rhodes a touristically saturated island and the local and regional authorities have all praised the plan there was, unfortunately, no support mechanism ready to finance a secretariat for coordination of the implementation of the plan.
References
[1] Scoullos M. et al., “Planning Sustainable Regional Development. Principles Tools and Practices. The case study of Rhodes Island – Greece” MIO-ECSDE SUDECIR project, 1999. [2] Vonkeman G.H. (ed), "Sustainable Development of European Cities and Regions (SUDECIR)" (Environment & Policy Volume 26), 2000. [3] PAP/RAC, 1996, «Integrated Planning Study for the Island of Rhodes», in the framework of the MAP Coastal Area Management Programme, UNEP/MAP, METAP. [4] Coccossis H. & Mexa A.., (eds), “The Challenge of Tourism Carrying Capacity Assessment: Theory and practice”, Ashgate Publishing, 2004, Aldershot, England [5] Scoullos M.J., 1997, ‘Public Participation’, in the «Transboundary Diagnosticstic Analysis for land based Sources of Pollution», UNEP (OCA)/MED IG.11/Inf.7, UNEP/MAP, 10th Ordinary Meeting, 18-21/11/1997, Tunis [6] Scoullos M., Roniotes A., Malotidi V., «Public Participation, Environmental Information & Awareness in the Mediterranean», M -ECSDE, Athens, 2002 [7] Scoullos M. J., 1996, «General Political Conditions, form of cooperation and process for development initiatives applied. A closer look to the Mediterranean», Nursery No5, 34-36, Bauhaus Dessau: Special Edition on Sustainable Regional Development.
102
“Sustainable Management and Development of Mountainous and Island Areas”

New ICT Concepts and Projects for the Development of Rural Areas: The project Bio@gro
A.B. Sideridis Informatics Laboratory
Agricultural University of Athens 75, Iera Odos str., Athens 118 55, GR
Abstract. Today, Information and Communication Technologies (ICT) offer various options and could contribute significantly to the development and sustainable management of mountainous and island areas. In general, rural areas have finally attracted the attention of policy makers and major projects have been initiated both at national and international level. These, mostly European projects, offer alternatives and support to traditional farming, forest management, fisheries and management of the environment as a whole.
An alternative to traditional farming that could be fully exploited for the development of island and mountainous areas is Organic Agriculture (OA). That is why, in this paper ICT innovations are examined and a particular example of a significant European project named BIO@GRO is presented. This project aims in implementing an eServices system that provides access to multilingual, specialized, updated and certified OA online information, access to electronic commerce and mobile services and user-friendly access to farmers.
Keywords. e-Services, Island, Mountainous, Rural Areas, Organic Agriculture, Sustainable Development, Web Portals.
1. Introduction
It has taken long for people to understand the important role that Information and Communication Technologies (ICT) play for the development of economically and scientifically vital areas of Agriculture, Forestry and the Environment as a whole. This is particularly true for rural areas where the digital divide and the scarce of expertise on ICT is more evident than other areas of relative activities. Nevertheless, for the last few years new concepts and applications of ICT, in parallel with uncertainty
for the future existence of human communities in rural areas, have led to a new momentum and effort to fill up the gap. Thus, innovative ICT systems are used to encourage local people to fully exploit hidden potential of their region no matter how poor this area in resources it may look like to be. The development of rural areas is of utmost importance for the European Union (EU). Although priority is given to the countries of South Europe, where the problem of rural development is more immense, there are countries of the central and north Europe, like Scotland and France, where a number of projects for rural development are well ahead. In countries of South Europe like Greece, Cyprus, Italy, Spain and Portugal major European programmes are either at implementation stage or at early design phase due to be announced in the near future. Such full programmes of e-government, e-commerce, telemedicine, distance learning and education services are already progressing well aiming to fill up the gap created by years of neglecting of rural areas.
The basic principle in designing programme umbrellas (horizontal actions) for rural development is the provision and availability of services and equal opportunities to the European citizens no matter to the place they live. People living in rural areas should enjoy the same quality of services provided to people living in cities and major city centers. This principle is predominant and major European project proposals have been approved on the grounds that their contribution to high quality of services to citizens of rural areas is safeguarded.
During the last ten years appropriate ICT infrastructural projects, throughout Europe, have been implemented securing thus successful development of well designed web applications and integrated services. Research ICT institutions, small and major soft and hardware
103
“Sustainable Management and Development of Mountainous and Island Areas”

companies have established partnerships and have undertaken the difficult task to develop and operate reliable public and private services. Thus, in the name of rural development, ICT is becoming a creative art and as technology is encouraging new concepts and technological innovations to be applied for the benefit of people living and working in remote areas. Philosophically this means that ICT, after long periods of industrial problem orientation, is now turning to more human and environmental orientation. After all, having reached a perfect stage of automation and nature podigetissis, it is the time to turn back and see all those left behind in rural areas, the lucky ones I should honesty say!
In this paper an attempt is made to exhibit new concepts of ICT and the way they should be applied for rural development and sustainable management of neglected areas of Southern Europe like the mountainous and island ones. A realistic example of an ICT service equally provided to farmers and citizens of both rural and non rural areas is also presented.
2. ICT innovations and their impact to rural development
Since the last decade of the 20th century it was evident that people living in rural areas should be better informed through ICT means of communication rather than the traditional ones. In Greece since the late 80’s a huge ICT programme was designed aiming to automate in stages various services to citizens. These automated services have developed since then to full e-government services. A major initiative on ICT, taken in the ’90s, is referred to Information Society projects. These projects mostly supported by the European Union (EU) were enhanced with environmental, social and economic issues. Rural development and the quality of services offered to citizens were and still are basic dimensions and priority areas. Since island and mountainous areas are the basic morphological characteristics of Greece, rural ICT projects have been designed and partially implemented under the Information Society strategic plans of the country. New concepts, technologies and innovations of ICT offer now realistic solutions to rural community day to day problems. A few examples follow and indicate the need for further research and wider application:
E-Government services covering full governmental operations (Public Administration, support in farming activities, common agricultural policies directives, agricultural subsidy systems, etc).e-Commerce applications to Forestry, traditional farming, agrotourism. Decision Support Systems for both open and greenhouse cultivars. Expert System applications to Pest Management, Plant and Vegetable Production [10], Animal Husbandry, disease diagnosis. RFID applications for managing purposes of animal production (this is a quite important application area to mountainous and island areas). Geographical Information System development and wide application to Forestry Management, rural development [5,7,8] etc. Multimedia, Portals, One Shop Stop centers [4,14,15] informing citizens of rural areas and providing support to various operations (farming, forestry economics, agro tourism). Web and mobile computing applications for meteorological alert messages in forest management and farming [7], [8].
It is true that rural areas of south Europe have not enjoyed the benefits of ICT technologies and the number of applications, as those described above, is still minor. It is believed that digital divide creates a gap which is exceptionally wide in rural areas. Nevertheless, technology and its adoption is an art of imitation, necessity and persuasion. Citizens of island and mountainous areas cannot and should not be blamed for not being fully aware of ICT capabilities. On the other hand governments and supporting organizations (such as extension services) are reluctant to proceed. They are afraid that money will be spent and ICT systems will not be exploited by interested groups in rural areas.
The problem of digital divide in rural areas attracted the attention of research communities and government/non government organizations. Specific management methodologies have been employed to deal with it. Taking into account educational level of the farming community, level of ICT acceptance, idiosyncrasies of local
104
“Sustainable Management and Development of Mountainous and Island Areas”

farmers, and geographical characteristics of the areas concerned, major horizontal actions were announced. Steps towards implementation of specific applications in priority areas, as the rural ones, based on the technologies above, have been properly estimated and focused on by both national governments and the EU.
An example of an e-services system, which is characteristic of well spent money for rural areas and particularly the islander and mountainous, is described below.
3. ICT support to Organic Agriculture
Organic Agriculture (OA) is “a holistic production management system which promotes and enhances agro-ecosystem health, including biodiversity, biological cycles, and soil biological activity” [1]. Such an important agricultural activity has attracted Internet websites, web portals and other information resources concerning OA. It is true that island and mountainous areas present characteristic cases for knowledge dissemination and education opportunities through Internet. Farmers, traders, agriculturists, consumers and even children, can now have full access to relevant information resources. The problem is that farmers of island and mountainous areas need specialised, upgraded, accurate and reliable information. This information should be offered to them as a service tool capable to direct, advice and encourage going ahead with new alternatives in agriculture or any other activity of their region. On the other hand provision of information regarding OA through the Web can lead to economically and environmentally successful activities contributing a lot to sustainable growth.
Bioagro e-services system is as an online tool for accessing informational and educational content. It provides a single point of access to information regarding OA to all the actors involved in the OA value chain.
A recently published survey [11] about OA simple web sites, portals and systems has produced several valuable results. More specifically, the majority of OA information resources are simple web sites or web portals, freely available to the public. Most of them use English as the main content language, and have global coverage. The technology used is mainly HTML. About half of them offer search services. The thematic area of most of these resources focuses on OA crops and animals. Popular target groups seem to be consumers
and farmers. In the specific example of Bioagro the roles and needs of all actors (Organic farmers, Traders, Processing companies, Consumers/citizens, governmental organizations and agencies, certigfication and inspection organisations, research institutions and universities, agronomists and EU agricultural agencies) have been fully analysed [6].
4. Bi@gro specifications and e-services
The Bio@gro platform is being designed based on a thorough analysis of the requirements of potential users. As a result, it will be a platform which will meet the needs of its various users ranging from organic farmers, processors and traders to consumers, researchers and generally all actors related to OA and its products [17].
Figure 1. User Groups of the Bio@gro portal
In this context, it differs from other portals about OA, targeted mainly at meeting the needs of only one or two of the aforementioned user categories. The added value (and main advantage) of Bio@gro is its inherent ability to offer the basis on which to learn, implement, buy, sell, and cooperate. The Bio@gro portal will be useful for its flexibility, dynamic profile, unique services, technology, reliability and its consistently up-to-date information system. Bio@gro’s content will be available in four different languages: English, Greek, German and Romanian. This will support and increase the internationality of the portal, thus enabling potential non English speaking users to have access to the information offered. The result will be a growing circle of users and a widespread
105
“Sustainable Management and Development of Mountainous and Island Areas”

usage of its services. Many different subjects will be presented in various ways adapted to the national or the local mentality of each user. Information and knowledge on OA offered to four European languages is an attraction for all categories of users. Researchers will find data and papers easier, consumers will be informed about prices, offers and market situation, farmers will find inputs, legislations and links for cooperation. After being tested through the provision of the content in all four languages, the platform will be in the position to easily support future expansion to other languages for the existing content.
Bio@gro e-services system aims to provide a single point of access to accurate and multilingual OA information, e-business, e-learning and mobile services to all key actors involved in the OA value chain. The system is based on the use of Web portal technologies and includes the following services [1]:
Access to information and e-business services via a single point of access. Multilingual access to information and services. Access via different communication channels (Internet, mobile devices). Provision of specialized, updated and certified OA information. User-friendly access to information and services.
It is of utmost importance to provide the above services paying specific attention to security and privacy in communication and transactions.
Bio@gro’s e-services are distinguished into various categories. They include a variety of online services and content resources such as Information, e-Business and e-Learning. Examples of information services and content resources include [9]:
News about OA, announcements, events (such as eco-festivals, conferences), etc. Digital Library with OA reports, studies, papers, legislations, etc. Directories of OA-related links, such as European and national OA initiatives, related agencies, such as certification bodies, monitoring organizations etc., and useful links to other related web sites. OA events calendar service.
E-business services and content resources include:
Legislation, law and administrative documents related to OA (European and National) and related services, such as taxation etc. Market Reports, market information and trends, OA product price reports and status, etc. Online shops and markets with OA products directory (allowing OA farmers with e-shops and e-markets to promote their e-commerce services, as well as consumers to find online markets with OA products). This service consists of:
Advertisement services, where interested parties can promote their enterprise and/or product, by placing a logo or e-mail service. Presentation of the own offer products and services in a common pool of all European OA enterprises (e.g. by a link from the European list to the own homepage). Information for contact making to suppliers, i.e. support of the purchase preparation for necessary products and services.
Potential customers’ support services, such as OA producers and markets recommendation services (provides support for sale for products and services which are to be sold). Bio@gro “registered members” catalogue (registered OA producers, processors, traders, farmers, researchers etc.)
E-learning content resources include: Online courses on what OA is, its advantages, ways to apply OA to specific crops, OA animal feeding etc. (produced by Bio@gro). Best practice guides on what OA is, its advantages, ways to apply OA to specific crops, OA animal feeding, best cultivation and animal production practices with respect to each country’s special needs etc. (produced by Bio@gro). Catalogue of other online educational resources related to OA (recommended by Bio@gro) Frequently Asked Questions (FAQs) about OA, such as pros and cons, means and methods etc.
Other categories of services and online content resources can also be included, such as e-government catalogues that list information about OA Governmental and Non-Governmental Agencies, links to online taxation services useful for OA farmers and traders, etc. Additionally, the eServices System aims to provide its users with a series of mobile services, including SMS-based
106
“Sustainable Management and Development of Mountainous and Island Areas”

alerting services (such as alerts for OA news, weather forecasts and crop protection alerts) as well as mobile-based access to parts of its content [16].
Figure 2. Bio@gro e-Services Platform
5. e-Services System Architecture
The main architectural modules of the e-Services System are the following (Figure 2) [17]: Catalogue Information Module: This module provides the users with searching capabilities through the deployment of multiple and hierarchical levels of information supported by an advanced criteria-searching mechanism. Batch loading mechanisms are available for information update, on-line loading of data (SOAP interfaces, Web Interface for catalogue management, back end integration with other external systems), a filtering mechanism and support for GCI Global classification standards. Search Mechanism Module: This module acts complementary to the catalogue information module, and provides searching abilities with a variety of criteria (information category, date of publication, type of information, legal publisher, type of content etc). To support this searching functionality, the module provides free text enabled searching (with stemming and stop words for all the languages that will be used), further search ability in the results, ability to group results by a variety of criteria, and a dynamic query constructor so that the results of the queries can be provided to powerful cluster servers. Bio@gro’s architecture also includes:
The Web Presence Sub-module features rapid and accurate content management in almost any format and dynamic development of Web pages, creation and modification of information
using common desktop tools and finally, multimedia content upload. The Content Administration Sub-module features user–administrator management of Web sites and definition of access and permission rights, content categories management and grouping rules, management of Web site templates based on graphical user interface rules and restrictions and multimedia content management. Business Opportunity Module. This module can support actors of the OA value chain to search for potential partners for business purposes (e.g. trade, consulting, transport, logistics), exploit new market opportunities and start new business activities in general. This module consists of four sub-modules: The Business Opportunity Catalog Sub-module. This sub-module permits registration of users etc). The Business Opportunity Publishing/ Submission Sub-module. This sub-module permits registered users to submit their business collaboration requests/offers. The Business Opportunity Searching Sub-module. Through the use of this sub-module, users will be able to source/search for business opportunities either by a step-by-step guide (wizard) or by a search mechanism. The Business Opportunity Matching and Notification Sub-module. This sub-module provides automatic user notification, whenever new business opportunities are submitted at the system. Mobile Services Module. This module provides direct and up-to-date information mainly to OA farmers through the use of SMS messages, created and distributed through a specific platform enabling the dispatch of “groupSMS” to specific users with personalised content. Advertising Service Module. This module is used to support advertising services. It provides the ability to manage and present advertising banners on specific Web pages of the eServices System. Online Certification Form Module. This module provides the OA actors with the capability to download and submit documents regarding certification issues provided by certification bodies. Administrator Module. This module deals with the administration of all services provided by the above modules as well as with some
107
“Sustainable Management and Development of Mountainous and Island Areas”

complementary tasks (batch loading of information, multi-linguality etc).
6. Bio@gro’s Content Categories
The need for up-to-date information about the OA sector, including events from all around the world and legislative, agricultural, scientific and economic developments, has driven to the categorisation of content for the Bio@gro portal.
8) Mobile Services
3) Legislation, Standardization and Certification
1) What is bio@gro
6) E-Business Resources
5) Educational Resources
7) E-Government Resources
4) Information Resources
2) What is OA
Content Categories of bio@gro Web
portal
Figure 3. List of Content Categories of Bio@gro Web portal
Bio@gro provides information derived from governmental (e.g. Ministries of Agriculture, AGROCERT) and non-governmental organizations (e.g. IFOAM, certification bodies) of four participating countries (Greece, Germany, Cyprus and Romania), the daily press, scientific journals, on-line scientific associations (e.g. European Association for animal production - EAAP), educational institutions, processors, traders and consumers’ associations, various OA related websites, as well as de novo content produced by Bio@gro itself [16].
7. Discussion
For the last fifteen years has become evident that ICT play an important role for the development of economically and scientifically vital areas of Agriculture, Forestry and related activities. It has been realized though that digital
divide and the scarce of expertise on ICT, in islander, mountainous and rural areas in general, are still the main obstacles to the full adoption of ICT innovations for the economic development of those areas.
Nevertheless the solution to the above problem can be found on ICT itself. There are alternatives and important projects are implementing them. As an example the Bio@gro e-services system has been described.
The Bio@gro e-services system aims in contributing to the faster growth and integrated development of the island and mountainous areas by offering decentralized services, possibilities for e-commerce, and increased support and encouragement to all OA actors. It can be used as a prototype of using ICT concepts to economically develop rural, islander and mountainous areas.
Currently, the Bio@gro eServices System is under the final implementation stage, where the content collected is being transferred in the final platform. During this phase, a setup of trials for the functionality and efficiency of the portal are being designed from the Bio@gro consortium, in order to begin the trial phase of the platform. The Bio@gro is available at http://www.bioagro.gr(see Figure 4).
Figure 4. Bio@gro Homepage
From the beginning of the development of the platform, several dissemination actions have proved that the interest in visiting and using such a web portal is constantly increasing. Starting from the simple users such as customers, to users who seek specialized information, such as organic farmers or traders, the interested in using this innovative platform assures that this is a viable ICT application.
108
“Sustainable Management and Development of Mountainous and Island Areas”

8. Acknowledgements.
The work presented in this article has been partially funded by the European Commission, and more specifically the project No EDC-11293 “Bio@gro”. The author of the article would like to thank all project partners for their assistance in the context of the project, which was essential for the preparation of this article.
9. References
[1] Adamides G, Berndt I, Bilalis D, Costopoulou C, Eppler U, Friedel R, Hadjigeorgiou I, Giannaki S, Giannopolitis C, Koukouli M, Lang U, Lionis J, Manouselis N, Nistor E, Paranici B, Passam H, Patrikakis CZ, Piorr HP, Radu A, Roman GV, Sideridis AB, Stalides G, Toader M and Xylouri E. Deliverable D1.1 “Business Model and Market Analysis”. In: USAMVB-FA, editor. Deliverables for Bio@gro eContent project No 11293, Athens: Agricultural University of Athens; 2005.
[2] Adamides G, Berndt I, Costopoulou C, Dardamani E, Eppler U, Frangiadaki E, Friedel R, Giannaki S, Giannopolitis CN, Hadjigeorgiou I, Koukouli M, Lang U, Lehmann G, Lionis J, Manouselis N, Minotou C, Passam H, Patrikakis CZ, Piorr HP, Savvides S, Scherer N, Sideridis AB, Tsakalis N, Tourlomousis P and Xylouri E. Deliverable D1.2 “User requirements Analysis”. In: AUA, editor. Deliverables for Bio@gro eContent project No 11293, Athens: Agricultural University of Athens; 2005.
[3] Adamides G, Berndt I, Biberian N, Dritsas K, Georgiades M, Georgiadou E, Giannakopoulou M, Giannopolitis CN, Sideridis AB, Patrikakis CZ, Konstantas A, Koukouli M, Minotou C, Roman GV, Savvides S, Sava T, Stalides G, Toader M, Tsakalis N, Piorr HP, Berndt I, Lang U, Eppler U, Friedel D and Friedel R. Deliverable D 5.4 “Exploitation Strategy”. In: ARI, editor. Deliverables for Bio@gro eContent project No 11293, Athens: Agricultural University of Athens; 2006.
[4] Costopoulou C, Karetsos S, Ntaliani M, Gidarakou I, Sideridis A. A Greek Organic Agriculture Portal. Proceedings of 2nd
Conference of Hellenic Association of ICT
in Agriculture, Food and Environment on: Information Systems & Innovative Technologies in Agriculture, Food and Environment, Vol.2, 2004 March 18-20; Thessaloniki, Greece; 2004. p.136-142.
[5] Filis J, Sabrakos M, Bader M, Sideridis AB, Yialouris CP. GEDAS: An Integrated Geographical Expert Expert Database System. ESWA Journal 2003; 24(1): 25-34.
[6] Friedel R, Sideridis AB, Patrikakis CZ, Adamides G, Berndt I, Coward S, Epure LI, Fragkiadaki E, Giannaki S, Giannopolitis CN, Ion V, Kakabouki I, Kantzinos E, Klümpner E, Konstantas A, Koukouli M, Lang U, Minotou C, Nistor E, Petropoulos S, Radu-Popovici A, Roman GV, Sava T, Savvides S, Scherer N, Thanopoulos C, Thomopoulos P, Toader M, Tourlomousis P and Tsakalis N. Deliverable D5.3 “Bio@gro market survey and positioning”. In: AOEC-AUA, editors. Deliverables for Bio@gro eContent project No 11293, Athens: Agricultural University of Athens; 2005.
[7] Kaloudis S, Anastopoulos D, Yialouris CP, Lorentzos N, Sideridis AB. Insect Identification Expert System for Forest Protection.Expert Systems with Applications, V.28; 2005; 28:. 445-52.
[8] Kaloudis, S., Tocatlidou, A., Lorentzos, N.A., Sideridis, A.B., Karteris, M. (2005). Assessing Wildfire Destruction Danger: A Decision Support System Incorporating Uncertainty. Ecological Modelling, 181 (1): 25-38.
[9] Lang U, Eppler U, Sideridis AB, Patrikakis CZ, Adamides G, Berndt I, Biberian N, Coward S, Epure LI, Fragkiadaki E, Friedel R, Georgiadou E, Giannakopoulou M, Giannopolitis CN, Ion V, Kakabouki I, Konstantas A, Koukouli M, Ladikou D, Manouselis N, Minotou C, Nistor E, Petropoulos S, Piorr HP, Poulopoulou I, Radu-Popovici A, Roman GV, Sava T, Savvides S, Stalidis G, Thanopoulos C, Thomopoulos P, Toader M, Tsakalis N and Xylouri E. Deliverable D3.2 “Content Collection Methodology”. In: UASE, editor. Deliverables for Bio@gro eContent project No 11293, Athens: Agricultural University of Athens; 2005.
[10] Maliappis M, Sideridis AB. AFramework of Knowledge Versioning Management Expert Systems 2004; 21(3): 149-56.
[11] Patrikakis CZ, Konstantas A, Koukouli M, Manouselis N, Sideridis AB. Analysing
109
“Sustainable Management and Development of Mountainous and Island Areas”

Competition for a Web Portal. A. Tatnall (Ed.), In: Tatnall A, editor. The Encyclopedia of Portal Technology and Applications; Hershey, PA: Idea Group Publishing; (to appear) 2007.
[12] Roman GV, Toader M, Radu-Popovici A, Nistor E, Epure LI, Ion V, Truta AM, Popescu EM, Sideridis AB, Patrikakis CZ, Dritsas K, Konstantas A, Koukouli M, Manouselis N and Minotou C. Deliverable D4.1 “Trial Specifications”. In: DIO, editor. Deliverables for Bio@gro eContent project No 11293, Athens: Agricultural University of Athens; 2006.
[13] Roman GV, Toader M, Radu-Popovici A, Nistor E, Epure LI, Ion V, Truta AM, Popescu EM, Sideridis AB, Patrikakis CZ, Konstantas A and Manouselis N. Deliverable D 4.2a “Overall Bio@gro eServices System Assessment &Evaluation report”. In: USAMVB-FA, editor. Deliverables for Bio@gro eContent project No 11293, Athens: Agricultural University of Athens; 2006.
[14] Sideridis AB, Costopoulou CI, Patrikakis CZ, Manouselis N, Stalides G. An eServices System to Support Information Exchange among the Agricultural Community. Proceedings of EFITA/WCCA Joint Congress; 2005 July 25-28; Vila Real, Portugal; 2005.
[15] Sideridis AB, Patrikakis CZ, Manouselis N. Information Architecture Requirements for Agricultural Web Portals. Proceedings of the International Congress on Information Technologies in Agriculture, Food and Environment ITAFE05; 2005 October 12-14; Adana, Turkey; 2005.
[16] Sideridis AB, Patrikakis CZ, Thanopoulos C, Konstantas A, Adamides G, Basa G, Berndt I, Bilalis D, Coward S, Eppler U, Epure LI, Fragkiadaki E, Friedel R, Giannaki S, Giannopolitis CN, Hadjigeorgiou I, Kakabouki I, Lang U, Manouselis N, Minotou C, Nistor E, Passam HC, Petropoulos S, Piorr HP, Popescu EM, Radu-Popovici A, Roman GV, Savvides S, Toader M, Thomopoulos P, Tourlomousis P, Truta AM, Vemmos S and Xylouri E. Deliverable D3.1 “Definition of Content categories”. In: AUA, editor. Deliverables for Bio@gro eContent project No 11293, Athens: Agricultural University of Athens; 2005.
[17] Stalidis G, Ladikou D, Patrikakis CZ, Manouselis N, Sideridis AB, Costopoulou C, Giannopolitis CN, Adamides G, Baka N, Berndt I, Eppler U, Friedel R, Friedel D, Lehmann G, Viorel I, Kiriazopoulou A, Lang U, Lionis J, Nistor E, Mircea E, Piorr HP, Xylouri E, Savvides S, Toader M, Scherer N, Perdiki J, Stokou D, Dimitriadi V, Pantzis Y and Touskas G. Deliverable D2.1 “Bio@gro Services Functional Components, Data, Interface Specification And Design”. In: POULIADIS-AUA, editors. Deliverables for Bio@gro eContent project No 11293, Athens: Agricultural University of Athens; 2005.
[18] Stalidis G, Ladikou D, Pantzis Y, Stokou D, Dimitriadi V, Touskas G, Perdiki J, Sideridis AB, Patrikakis CZ, Manouselis N, Koukouli M and Konstantas A. Deliverable D2.2 “Initial Demo”. In: POULIADIS-AUA, editors. Deliverables for Bio@gro eContent project No 11293, Athens: Agricultural University of Athens; 2005.
[19] Stalidis G, Ladikou D, Stokou D, Dimitriadi V, Touskas G, Perdiki J, Patrikakis CZ, Sideridis AB and Konstantas A. Deliverable D2.3 “Implementation of the prototype Bio@gro eServices System”. In: POULIADIS, editor. Deliverables for Bio@gro eContent project No 11293, Athens: Agricultural University of Athens; 2006.
110
“Sustainable Management and Development of Mountainous and Island Areas”

Assessment of Biodiversity in Forest Ecosystems
K.A. Spanos1, G. Spyroglou1, G. Baloutsos2
1 N.AG.RE.F. – Forest Research Institute, 57006 – Vassilika, Thessaloniki, Greece 2 N.AG.RE.F. – Institute of Mediterranean Forest Ecosystems and Forest Products Technology,
11528 –Athens, Greece [email protected]
Abstract. A forest ecosystem comprises of three main components, a) structure (e.g. physical characteristics), b) composition (e.g. number of species), and c) function (e.g. evapo-transpiration) upon which forest biodiversity is based and determined. Forest ecosystems can be characterised by key factors (parameters) which are important for the evaluation of biodiversity.
These factors can be grouped or classified according to major ecosystem components and furthermore according to spatial scale (national, regional, landscape and stand level). Indicators are the tools that can be used to assess the size/or level and quality of forest biodiversity.
Different indicator schemes (methodologies) have been developed recently but all should be adapted to the specific objectives of biodiversity assessment and to the forest types concerned. In this work a general description and analysis of key factors, important for forest biodiversity, and the development of an indicator methodology for assessment of forest biodiversity are presented.
Keywords. Biodiversity, forest ecosystem, as-sessment, key factor, indicators..
1. Introduction
Biodiversity is defined as “the variability among living organisms from all sources includ-ing inter alia, terrestrial, marine and other aquatic ecosystems, and the ecological complexes of which they are part; this includes diversity within species, between species and of ecosystems” [5].. This definition implies that lists of species will suffice to describe biodiversity but the quality of biodiversity is not revealed in a list.
Ecological factors (e.g. climatic or edaphic), genetic diversity and competition among species, and other biotic and abiotic factors are important on biodiversity. Three main components of bio-diversity have been widely recognised [9] [23] [24] [25] [20]: composition, structure and func-tion. These three components have been used as a basis to identify key factors and develop indi-
cators for forest biodiversity. Definition and de-scription of components of biodiversity and eco-logical integrity with reference to forest ecosys-tems [8] [20]:
Composition - refers to the identity and vari-ety of elements in a collection, and includes spe-cies lists and measures of species diversity and genetic diversity (including genomic diversity).Ecosystems are composed of organisms, species, groups of closely interacting species, genetic di-versity within species, legacies of organisms (e.g. dead wood, soil organic matter) and various inorganic components (e.g. minerals and gases).
Structure - is the physical organisation or pattern of a system, from habitat complexity as measured within communities, to the pattern or patches and other elements at the landscape level. Ecosystem structure arises from the pat-terns in which components of composition occur. Two aspects of system structure have been dis-tinguished [20]: a) architectural, and b) social. Architecture refers to the physical aspects of structure, and is mostly applied to spatial patterns in the plant community (e.g. the number of can-opy layers, patchiness in the species distribution, age classes). Social structure refers to patterns in the way that individuals, species, or groups of species relate to one another and to the system as a whole (e.g. predation, symbiotic relationships, and mutualisms).
Function – involves ecological and evolution-ary processes, including gene flow, disturbances, and nutrient cycling. There are two aspects of function: a) the influence on processes (e.g. pho-tosynthesis, nutrient cycling, population growth), and b) the influence on system structure (e.g. balance among different populations). In addition to the internal functions, there are external func-tions, which are influences of the whole commu-nity on its surroundings (e.g. regulation of water and nutrient fluxes, soil stabilisation, absorption and reflection of solar energy).
Compositional and structural factors deter-mine and constitute the biodiversity quality of an area [23], and are essential for the productivity
111
“Sustainable Management and Development of Mountainous and Island Areas”

and ecosystem sustainability. Functional factors (i.e. the functions performed by different species, wood degradation, soil microbiology) are con-tributing to ecological integrity (i.e. the ability of an ecosystem to function and maintain itself) [12] [15]..
2. Processes generating and maintaining biodiversity
All species are important for forest productiv-ity, and contribute to ecosystem functioning. These include such diverse organisms as various fungi and small mammals and invertebrates [7]. Effective conservation of forest biodiversity helps to maintain ecological processes (e.g. de-composition, nutrient and hydrological cycles, succession, natural regeneration), and provides high ecosystem stability. In order to maintain biodiversity quality, it is necessary to preserve or stimulate the patterns and processes giving rise to heterogeneity (range of spatial scales) [13].
The main processes generating and maintain-ing biodiversity are listed and described as fol-lows [4] [20]:
- Natural disturbance regimes Disturbance is a key process affecting natural
forest ecosystems. Disturbance agents may be endogenous and exogenous, caused by biotic or abiotic agents/factors, and may cover a broad range of temporal and spatial scales. Disturbance is the driving force for forest dynamics and re-generation, through structural changes, initiation of secondary succession and creation of habitat diversity. Disturbances of medium severity and random and periodic disturbances are known to maintain high species richness and productivity and limit competitive exclusion [18]. The links between site type and disturbance forces are critical because they shape the composition and structure of the forests and of many other impor-tant processes. The maintenance and restoration of the full range of natural habitats and distur-bance regimes, tree and keystone species and successional stages, stand size diversity, and cer-tain processes found/occur in natural ecosystems are therefore very important to biodiversity [17] [1].
- Dispersal/Migration The dispersal and migration of species deter-
mine the future ecosystem composition and pat-tern. Human activities may cause changes in the landscape pattern (e.g. fragmentation) and can influence migration and dispersal and hence alter the pattern of gene flow. The effects of fragmen-
tation vary widely from species to species and from habitat to habitat.
- Reproduction The reproduction process determines the fu-
ture ecosystem composition. Differences in re-productive biology (gender effects, pollination and fertilisation systems) and impacts on the process of reproduction (increased selfing and poor seed production as a result of habitat frag-mentation) can result in rapid, direct and dra-matic changes on biodiversity [10, 20, 21].. In cases with of species with short generation peri-ods, non-overlapping generations, or highly spe-cific mutualisms, changes can be devastating (e.g. habitat loss, even-aged forests susceptible to insect/fungal attacks).
- Regeneration/Succession Gap-phase dynamics promote successional
diversity and determine the natural patterns of ecosystem dynamics. Natural regeneration by seed is a fundamental aspect of sustainability. After disturbances (e.g. felling, wind-throwing) seral communities develop in different stages (e.g. replacement of parts of mature forest stands by communities dominated by pioneer or early successional species). Silvicultural management regimes that alter ecosystem parameters beyond a critical limit can cause permanent changes to the ecosystem, leading to an arrested climax [4]. Therefore, the preservation of biodiversity in forest ecosystems requires all successional stages to be maintained [9].
- Trophic dynamics Refers to processes in which species from dif-
ferent trophic levels interact, including predation and herbivory. Each trophic level is dependent on other levels, and therefore impacts on trophic dynamics can seriously affect ecosystem func-tioning.
- Ecosystem processes A full operational set of ecosystem processes
is essential for ecosystem functioning and stabil-ity. Such processes include photosynthesis, nu-trient and hydrological cycles, dynamic aspects of food webs, succession, evolution, migration, and disturbances across landscapes. Removal of disturbance or other processes reduce the ability of an ecosystem to function efficiently.
- Local extinction Local extinction refers to the disappearance of
a population or metapopulation [20, 21].. It is a process (rather than an event) and today is mainly caused by rapid human-induced envi-ronmental changes [2] [3]. It results in elimina-tion of species population that potentially con-
112
“Sustainable Management and Development of Mountainous and Island Areas”

tribute to ecosystem functioning. Populations with very low or critical sizes become vulnerable to extinction because of both demographic and genetic factors, leading to inbreeding depression and loss of genetic diversity [10, 21]. The popu-lation size necessary to maintain viable popula-tions varies widely, depending upon species and environment. Preserving a sufficient number of individuals of a given species requires an ade-quate habitat size to be maintained, including all ecosystem components on which the species de-pends (directly or indirectly) [24]. Loss of key-stone species has cascade effects (i.e. leads to the loss of other species or the disruption of proc-esses) [20, 21, 6].
3. Key factors of forest biodiversity
Important parameters of biodiversity may be defined as key factors that influence (directly or indirectly) the biological diversity within forest ecosystems. The main key factors can be catego-
rised according to the different ecosystem com-ponents (as described previously):
a) structural (physical characteristics), b) compositional (the biological compo-
nent), and c) functional (biotic/abiotic disturbance fac-
tors and management). Furthermore, geographical scale (or policy/
management level) at which key factors ex-ist/applied are crucial for biodiversity assess-ment. Three levels of geographical scale have been considered:
1. National/regional - is the scale at which national overview of forest policy and manage-ment is applied)..
2. Landscape scale - is the scale at which different forest habitats and stand development stages interconnected)..
3. Stand scale (forest management unit, de-fined by the applied silvicultural regime)..
Table 1 shows an example of major key fac-tors used at different geographical scale for as-sessment of biodiversity in forest ecosystems
Table 1. An example list of key factors of forest biodiversity (at all levels) SCALE LEVEL Key parameters
Structural Composi-tional
Functional
1. National/ regional
- Forest area cover - Legal status/ Forest law - Forest ownership - Forest types and silvicultural re-
gime - National Parks and other protected
forest areas (%, ha) - Area of old grown/mature forests - Area of conversion of coppice
forests to high forests
- Indigenous species
- Exotic spe-cies
- Non-local species
NATURAL DISTURBANCE
- Fire - Storms (wind, rain,
snow) - Biological distur-
bance
HUMAN ACTIVITIES
- Forest management -Agriculture/farming - Other land use - Pollution
2. Landscape - Habitats/ecotypes - Forest corridors - Fragmentation - Land use history
- Species with specific requirements (landscape level)
- Exotic spe-cies
- Non local species
NATURAL DISTURBANCE
- Fire - Storms (wind, rain,
snow) - Biological distur-
bance
HUMAN ACTIVITIES
- Forest management -Agriculture/farming - Other land use - Pollution
3. Stand - Tree species - Stand area
- Species with specific
NATURAL DISTURBANCE
113
“Sustainable Management and Development of Mountainous and Island Areas”

- Stand spatial structure - Habitat types - Stand vertical structure - Forest history -Amount of dead wood - Organic litter
requirements (stand level)
- Forest soil conditions
- Fire - Storms (wind, rain,
snow) - Biological distur-
bance
HUMAN ACTIVITIES
- Forest management -Agriculture/farming - Other land use - Pollution
4. Development of indicators for biodiver-sity assessment
A review of the concept of biodiversity indi-cators and methodology development is pre-sented in this section. An indicator may be a spe-cies, a structural component or a process of a biological system, the occurrence of which in-sures the maintenance of the most important as-pects of biodiversity [15].. Indicators can provide useful information on the status of and trends in biodiversity. When measured, they can demon-strate ecological trends and assess the state or quality of an ecosystem. Indicators can be quan-titative or qualitative.
A good indicator should be [4, 23, 7]: - Relevant to ecologically significant phe-
nomena.. - Able to differentiate between natural cycles
and/or trends and those induced by human pres-sure..
- Capable of providing a continuous assess-ment over a wide range of stress.
- Sufficiently sensitive to provide an early warning of changes.
- Distributed over abroad geographical area (widely applicable).
-Easy and cost effective to measure, collect, assay and calculate.
The Convention on Biological Diversity De-cision IV/1 and Recommendation III/5 (Hand-book of the Convention on Biological Diversity) set the overall target in setting indicators that they should address matters such as [5, 7]:
- the way indicators relate to management questions;
- the ability to show trends; - the ability to distinguish between natural
and human-induced change; - the ability to provide reliable results (i.e.
through the establishment of standard method-ologies);
- the degree to which indicators can straight-forward interpretation;
- the question of baselines for measurement, in the light of the fact that application of a pre-industrial baseline may often prove problematic.
Indicators can therefore be individual species or groups of species or taxonomic groups [5, 20, 6].
Biodiversity indicators can be chosen and de-veloped in two ways:
A) In the first way, indicators can be based on parameters (e.g. bird species richness, tree spe-cies richness) of a particular component of bio-diversity. The indicator to be chosen depends upon many factors but there is always a correla-tion between the indicator and the component of biodiversity. Indicators usually measure species diversity [11] [22]. These indicators are most commonly developed by counting the number of plant or animal species which exist in a particular area (species richness), or additionally, by their relative abundance and evenness as a part of a diversity index (species diversity).
B) The second way of developing of biodi-versity indicators is based on the assumption that, in the forest context, biodiversity depend-ents upon structure of stands and landscapes, the species and the management and disturbance re-gimes. As a consequence, biodiversity indicators may be developed from the analysis of key fac-tors affecting biodiversity. Thus an indicator based on key factors of biodiversity may be: a) structural (total wood volume), b) compositional (species etc.), and c) functional (management or disturbance):
Structural indicators: it is known that a more complex ecosystem will support a greater variety of species. Forest trees and stand structure have major impacts on other components of the forest ecosystem (e.g. birds, mosses, lichens, and in-sects). Stand structure, the dynamics and devel-
114
“Sustainable Management and Development of Mountainous and Island Areas”

opment of forest stands, can play a key role in the development of biodiversity indicators in forest ecosystems (undisturbed and managed). Structural changes for example may increase ecosystem’s susceptibility to various distur-bances and encourage the loss of native species through the establishment of invasive (non-native) species. Canopy structure controls the quantity, quality, spatial and temporal distribu-tion of light, precipitation and air movement. All these factors combined, determine air humidity, temperature and soil moisture [19], which ulti-mately influence the microclimatic suitability of particular flora and fauna.
Compositional indicators: compositional in-dicators are usually empirical indicators.. How-ever, a functional relation may exist as most spe-cies depend (at least to some extend) upon the
presence of other species. For example, tree di-versity is a key factor affecting the diversity of many other taxa, and therefore, can be used as an indicator of biodiversity [16].
Functional indicators: for evaluation and as-sessment of different scales of biodiversity in a forest ecosystem, an integrated approach is re-quired that includes, apart from species abun-dance, also their functions, size, spatial distribu-tion and other information. Indicators of function or process (e.g. decomposition, evapo-transpiration) are particularly valuable when as-sessing biodiversity in full sense.
In the following Tables examples of structural (Table 2), compositional (Table 3), and func-tional indicators (Table 4) are presented [14, 15, 16, 20].
Table 2. An example of structural key factors and indicators of forest biodiversity (stand scale).. Key factor Indicator
Tree species Volume/biomass (total m3, % per species) Basal area (m2, % per species)
Stand size ha Stand shape
- Edge to area ratio Ecotone - Type - Surrounding habitat
Forest history Stand continuity: - Indicator species - Historical maps - Area of old growth/ancient forest - Area of recent forest - Area of plantations
Habitat types Area (%) of different habitats: - Classification schemes - National forest types
Stand structure Horizontal structure: - Gap occurrence - Tree clustering Vertical structure:
Dead wood Presence, nature and spatial distribution of standing and lying dead wood: - Type, species, decay class and amount
Litter Humus: - Type/quality of humus, amount/depth (cm) Flammable litter: - Amount/depth (cm)
115
“Sustainable Management and Development of Mountainous and Island Areas”
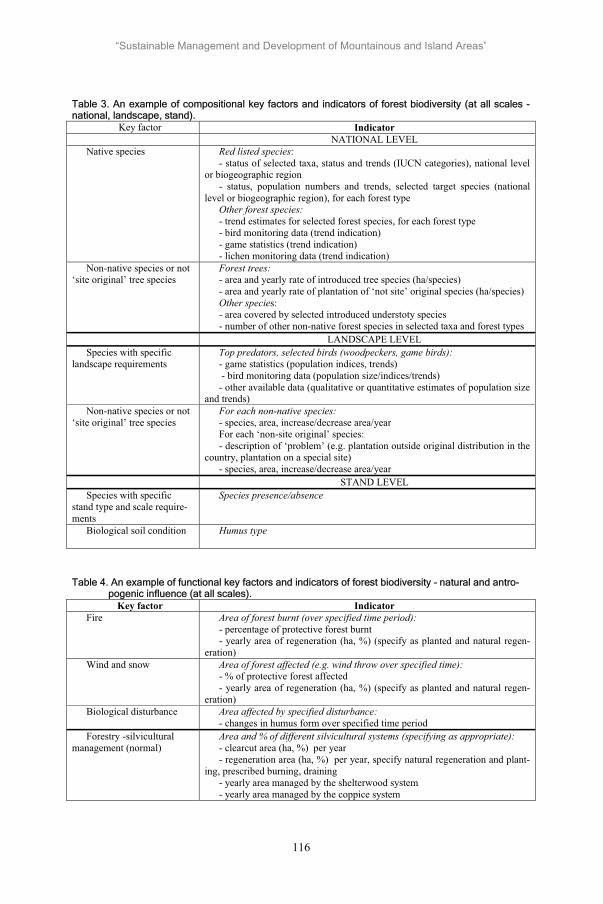
Table 3. An example of compositional key factors and indicators of forest biodiversity (at all scales - national, landscape, stand).
Key factor Indicator NATIONAL LEVEL Native species Red listed species:
- status of selected taxa, status and trends (IUCN categories), national level or biogeographic region
- status, population numbers and trends, selected target species (national level or biogeographic region), for each forest type
Other forest species: - trend estimates for selected forest species, for each forest type - bird monitoring data (trend indication) - game statistics (trend indication) - lichen monitoring data (trend indication)
Non-native species or not ‘site original’ tree species
Forest trees: - area and yearly rate of introduced tree species (ha/species) - area and yearly rate of plantation of ‘not site’ original species (ha/species) Other species: - area covered by selected introduced understoty species - number of other non-native forest species in selected taxa and forest types
LANDSCAPE LEVEL Species with specific
landscape requirements Top predators, selected birds (woodpeckers, game birds): - game statistics (population indices, trends) - bird monitoring data (population size/indices/trends) - other available data (qualitative or quantitative estimates of population size
and trends) Non-native species or not
‘site original’ tree species For each non-native species: - species, area, increase/decrease area/year For each ‘non-site original’ species: - description of ‘problem’ (e.g. plantation outside original distribution in the
country, plantation on a special site) - species, area, increase/decrease area/year
STAND LEVEL Species with specific
stand type and scale require-ments
Species presence/absence
Biological soil condition Humus type
Table 4. An example of functional key factors and indicators of forest biodiversity – natural and antro-pogenic influence (at all scales).
Key factor Indicator Fire Area of forest burnt (over specified time period):
- percentage of protective forest burnt - yearly area of regeneration (ha, %) (specify as planted and natural regen-
eration) Wind and snow Area of forest affected (e.g. wind throw over specified time):
- % of protective forest affected - yearly area of regeneration (ha, %) (specify as planted and natural regen-
eration) Biological disturbance Area affected by specified disturbance:
- changes in humus form over specified time period Forestry -silvicultural
management (normal) Area and % of different silvicultural systems (specifying as appropriate): - clearcut area (ha, %) per year - regeneration area (ha, %) per year, specify natural regeneration and plant-
ing, prescribed burning, draining - yearly area managed by the shelterwood system - yearly area managed by the coppice system
116
“Sustainable Management and Development of Mountainous and Island Areas”

Forestry silvicultural management (normal)
Area and % of different silvicultural systems: - protection forest (specify type, climate, wind/erosion, water protection,
control flooding) - nature conservation forestry and/or forest prolonged rotation period - urban/recreation forestry
Agriculture and grazing Forest areas under different agricultural systems (ha): - agroforestry (specify e.g. cork oak, olive, walnut) - other land with significant agricultural/grazing use combined with
trees/forests (specify, ha, number and mean density per100 ha of grazing ani-mals
- Areas with significant remaining impacts from former agriculture/farming
Other land use Specify (e.g. hunting area, park - land) Social influences: - visitor pressure (numbers) - establishments - amount of garbage in forests (volume, type)
Pollution Forest areas (ha) with impact of different types of pollution (in relation to critical loads or levels)
Water: - sodium dominance index
5. Conclusions
Biodiversity key factors and indicators are crucial for studying and monitoring of forest biodiversity [20, 7]:
- A priority list of key factors should be se-lected based on international experience, and able to be applied to different forest types.
- In a long term perspective, a standardized system of indicators to be implemented in a na-tional assessment of biological diversity is needed.
- A further development of indicator schemes and methodology are needed. This can be achieved along two lines [20]:
a) expand the National Forest Inventories to incorporate indicators of forest biodiversity,
b) introduce satellite - based techniques for the monitoring of forest biodiversity. Satellite mapping/inventory has the advantage of generat-ing data that can be analyzed using GIS.
Finally priority research areas are presented for the further development of indicators for op-erational use [20, 7]:
1) Validation of indicators of forest biodiver-sity. This requires research on their predictive value in relation to the components of biodiver-sity.
2) Establish reference values and critical thresholds for forest biodiversity. This represents a further step once indicators have been selected.
3) Development of parameters and indicators for assessing genetic diversity of forest trees.
Research and data generating in this field are certainly needed.
4) Development of indicators for national monitoring of forest biodiversity. The national forest inventories should be expanded and incor-porate the biodiversity concept (including meas-urements).
5) Strengthening the landscape concept for forest biodiversity. There is a strong need to de-velop planning procedures for landscape level for the management of biodiversity [1].
REFERENCES
[1] Angelstam, P. Landscape analysis as a tool for the scientific management of biodiver-sity. Boreal ecosystems and landscapes – structures, functions and conservation bio-diversity. Ecological Bulletin, 1997; 46: 140-170.
[2] Angelstam, P. Towards a logic for assess-ing biodiversity in boreal forest. In: Bach-mann, P., Köhl, M. and Päivinen, R. (eds). Assessment and biodiversity for improved forest planning. European Forest Institute (EFI), 1998a Proc. No 18, pp. 301-313
[3] Angelstam, P. Maintaining and restoring biodiversity in European boreal forests by developing natural disturbance regimes. J. Veg. Sci. 1998b; 9: 593-602.
[4] Boyle, T. J. B. et al. Criteria and indica-tors for assessing the sustainability of for-
117
“Sustainable Management and Development of Mountainous and Island Areas”

est management: a practical approach to assessment of biodiversity. CIFOR; 1998, Indonesia
[5] Convention on biological diversity (CBD), 1992 (http://www.biodiv.org/) [10/7/2006]
[6] Dimopoulos, P., Bergmier, E., Theodoro-poulos, K., Fischer, P. and M. Tsiafouli. Monitoring guide for habitat types and plant species in Natura 2000 sites of Greece with Management Institutions. Univ. of Ioannina and Hellenic Ministry for the Environment, Physical planning & Public Works. Agrinio. Greece. 172p. 2005..
[7] Feest, A. Establishing baseline indices for the quality of biodiversity of restored habi-tats using a standardised sampling process. Restoration Ecology 2006; 14(1): 112-122.
[8] Franklin, J. F., K. Cromack, W. Denison, A. McKee, C. Maser, J. Sedell, F. Swan-son, and G. Juday. Ecological characteris-tics of old-growth Douglas-fir forests. General Technical Report PNW-118. U.S. Forest Service, Pacific Northwest Forest and Range Experiment Station, Portland, Oreg. 1981.
[9] Franklin, J. F. Structural and functional diversity in temperate forests. In: Wilson, E. O. editor, Biodiversity. National Acad-emy Press, Washington, D.C., 1988; pp. 166-175.
[10] FRAXIGEN. Ash species in Europe: bio-logical characteristics and practical guide-lines for sustainable use. Oxford Forestry Institute, Univ. of Oxford, UK. 2005; pp.128.
[11] Gaston, K. J. editor. Biodiversity. A biol-ogy of numbers and difference. Blackwell synergy 1996.
[12] Gaston, K. J. Biodiversity. In: Sutherland, W. J. editor. Conservation science and ac-tion; 1998 Blackwell synergy pp. 1-19.
[13] Halpern, C. B. and Spies, T.A. Plant spe-cies diversity in natural and managed for-ests of the Pacific Northwest. Ecol. Appl. 1995; 5: 913-934
[14] Hansson, L. editor. Boreal ecosystems and landscapes: structures, processes and con-servation of biodiversity. Ecological Bulle-tins No. 46, 203 pp. 1997
[15] Hansson, L. Indicators of biodiversity: an overview. BEAR 1998; Technical Report, no. 1.
[16] Hansson, L. Biodiversity indicators in ter-restrial environments. In: Larson T-B., and Esteban J. A. editors. Cost effective indica-tors to assess biological diversity in the framework of the convention on biological diversity (CBD). Swedish Environmental protection Agency , Stockholm, Sweden and Ministry of Environment, Government of Catalonia, Barcelona, Spain. 2000; p. 27.
[17] Hunter, M. L. Jr. Wildlife, forests and for-estry. Principles of managing forests for their biological diversity. 1990; Prentice Hall.
[18] Huston, M. A general hypothesis to species diversity. Am. Nat. 1979; 113: 81-101.
[19] Jennings, S. B. Brown, N. D. and Sheil, D. Assessing forest canopies and undertorey illumination: canopy closure, canopy cover and other measures. Forestry, 1999; 72: 59-73.
[20] Larsson Tor-Bjorn. Biodiversity evaluation tools for European forests. Ecological Bul-letins. 2001; 50: 000-000
[21] Lowe, A., Harris, S., Ashton, P. Ecological Genetics - Design, Analysis, and Applica-tion. Blackwell Science Ltd, UK, USA, Australia; 326 p.. 2004
[22] McGeoch, M. A. and Chown, S. L. Scaling up the value of indicators. Trends Ecol. Evol. 1998; 13: 46-47.
[23] Noss, R.. F. Indicators for monitoring bio-diversity: a hierarchical approach. Conser-vation Biology 1990; 4: 355-364..
[24] Perry, D. A. Forest ecosystems. The John Hopkins University Press. 1994.
[25] Spies, T. Forest and structure, composi-tion, and function. In: Kohn, A. and Frank-lin, J. F. editors. Creating a forestry for the 21st century. The science of ecosystem management; 1997; p. 11-30.
118
“Sustainable Management and Development of Mountainous and Island Areas”

A Preliminary study on the microbial ecology of cultured soils.
Stefanis Christos, Alexopoulos Athanasios, Papadopoulos Ioannis, Voidarou Chrysa, Kourkoutas Ioannis, Vavias Stavros and Bezirtzoglou Eugenia.
Faculty of Agricultural Development, Department of Food Science and Technology, Laboratory of Microbiology, Biotechnology and Hygiene,
Democritus University of Thrace, Pandazidou 193, 68200, Greece [email protected]
Abstract. For the extended knowledge of the soil ecosystem is required information on the distribution and function of bacteria associated with this ecosystem. Thus, 63 samples from cultivated soils were collected, coming from the Evros Region in Greece. Our samples consist of cultivated soils dedicated to the production of the following types of cultures; maize, beetroots and cereals. Membrane filtration equipment was used. All samples were alternatively passed through two membrane filters, the first (20 m pore size) was used for retention of the soil impurities and the second (porosity 0,45 m) for C. perfringens. The growth medium used was lactase - sulfite (L.S. broth). Other bacterial species were isolated and identified by using classical bacteriological media. When grouping per location, increased populations of Bacillus sp. followed by Enterobacteriaceae were observed in most of the locations. Moreover, in some locations the following microbial species were recovered; Staphylococcus sp., Streptococcus sp., Clostridium perfringens, Bifidobacterium, Corynebacterium, other anaerobic bacteria and yeasts. When grouping per culture type, high densities of Bacillus sp. were associated with beetroots cultures. An important population of yeasts was associated with cereals cultures and finally, a more varied microflora dominated by Bacillus sp. and Enterobacteriaceae was observed in all maize cultures. Our preliminary findings seemed to be important not only from the point of microbial ecology but also in indicating that an association must be real between the occurrence of some bacterial species, the type of culture and the maturation stage of the culture. So, more research is necessary and it will be interesting to associate the occurrence
of these bacteria with the nature of the organic pollution and other physicochemical parameters. It is then conceivable, that an efficient program based on a detailed and permanent screening must be established in all cultivated areas in order to ameliorate the product quality, but also focusing on the consumer safety and preservation of public health.
Keywords. Microbial ecology, Cultured soil, C. perfringens.
1. Introduction
Waters are regularly monitored for presence of microbial indicators coming by contamination with human fecal wastes [1,2,3,8,14,17]. However, such systematic monitoring is not performed in soil ecosystems [6,15]. Monitoring of soils must be performed to index the potential of contamination to the plant cultures, as well as their extension to be pathogenic for humans working on close proximity with the cultured lands or consuming contaminated vegetables [5]. The ecological factors and the region involved to a capital role in the development of the soil microflora and its pathogenic potential. In the present investigation, we determined the numbers of the preponderant aerobic and anaerobic bacteria in soil samples. The knowledge would, in the long run, help to identify the various microorganisms involved in the soil fertility and as well as, of their pathogenic potential. In an effort to better understand how human influence alters the soil ecosystem, together with other endogenous factors involved, our interest focused on a systematic study of different cultured soils.
119
“Sustainable Management and Development of Mountainous and Island Areas”

2. Materials and Methods
2.1. The study area
The present study collects samples of cultivated soils, coming from the North-East area of Greece, including the Geographical Department of Evros (Fig. 1) Our samples consist of cultivated soil dedicated to the production of the following products (Table 1): Beta vulgaris var. rapaceum (beet-root), cereals, maize, vineyard, as well as legumes (beans, egg-plant )cultures.
Figure 1: Map of Greece, showing the sampling area in Evros region.
2.2. Sample handling
All samples from cultivated soil were collected aseptically, in a plastic bag. Triplicate samples of 500g were collected by the aid of a sterilized spoon instrument at a depth of 10 to 30 cm below the soil surface, in a way that the sample soil includes also the cultivated bulb. The soil pH is reported between 4.5- 6.5. Subsequently, 50 g of thoroughly mixed soil specimen was brought aseptically in a flask. In this same flask, the surface of the cultivated product was scraped from soil and washed out by 450 ml of PBS. Samples were mixed well by vigorous manual shaking before performing any analysis (Fig. 3). Samples for physicochemical analysis were placed in 500 ml bottles.
At the laboratory, all samples were stored at 5 ± 20 C until analyses were completed. All analyses were completed within 24 h of sample collection.
Table 1 : Sampling locations according to the culture type.
Code Location Culture
1 University Legumes (beans)
2 Pirgos Cereals
3 Sterna Cereals
4 Lepti Beetroot
5 Thourio Beetroot
6 Chimonio Beetroot
7 Kleiso Beetroot, Cereals, Maize
8 ETHIAGE Legumes (beans, egg-plant)
Maize, Vineyard
2.3. Microbiological analyses
Membrane filtration equipment was used. All samples were alternatively passed through two membrane filters, the first (20 m pore size) was used for retention of the soil impurities and the second (porosity 0,45 m) for C.perfringens. The growth medium used was lactose – sulfite (L.S. broth) [4]. Membranes were placed into the first tube of a ten-fold dilution series and further diluted to 104, and then incubated aerobically in a water bath at 460 C for 24 h (Fig. 2). A portion of each sample was heated for 15 min at 800 C and seeded into lactose – sulfite broth to detect spores. Interpretation of results is simple and is based on the clouding of the medium from lactose fermentation, presence of iron sulfur
Soil specimen
in PBS
Filtration (filter 20 m)
Filter 0.45 m
Incubation (46oC/24h)
1ml 1ml 1ml
(L.S. broth)10-1 10-2 10-3 10-4 Incubation
(46oC/24h)
Heating (80oC/10min)
(L.S. broth)10-1 10-2 10-3 10-4
1ml 1ml 1ml
Filter 0.45 m
Soil specimen
in PBS
Filtration (filter 20 m)
Filter 0.45 m
Incubation (46oC/24h)
1ml 1ml 1ml
(L.S. broth)10-1 10-2 10-3 10-4 Incubation
(46oC/24h)
Heating (80oC/10min)
(L.S. broth)10-1 10-2 10-3 10-4
1ml 1ml 1ml
Filter 0.45 m
Figure 2: Experimental protocol for the detection of Clostridium perfringens in soil.
120

(black precipitate) and presence of a gas visible in the inverted Durham tube within 24h at 460
C.All liquid media were boiled for 20 min before use to reduce the oxygen content.
3. Results
Bacteria dominated the soil microflora are Bacillus sp(49.5 %) and Enterobacteriaceae(36%),followed by Clostridium perfringens in both vegetative (15.8%) and spore forms(23.8%). Moreover, Enterococcus(4.4%) , Staphylococcus (3.9%),Bifidobacterium(3.2%), Lactobacillus(1.6%), Corynebacterium (1.6%) and yeasts (3.2%) were present (Table 2, Fig. 1). When collecting by culture type (Table 3),Bacillus and Enterobacteriaceae were dominating in beetroots originated soils followed by Staphylococcus and Lactobacillus.In maize soils ,Bacillus and Enterobacteriaceae were dominating followed by Staphylococcus.The major population in cereal was Bacillus, followed by yeasts, Bifidobacterium andClostridium . Legumes showed Bacillus andEnterobacteriaceae populations and finally, invineyard originating soils, Bacillus, Enterobacteriaceae, Staphylococcus andClostridium were found.
4. Discussion
Bacteria may be capable of growth in soil and soil related ecosystems. However, their
Table 2: Occurrence (percent) of bacteria in soil.
Species (%)
Bacillus sp. 49.2
Enterobacteriaceae 36.0
Enterococcus sp. 4.4
Staphylococcus sp. 3.9
C. perfringens (spores) 23.8
C. perfringens (vegetative) 15.8
Bifidobacterium sp. 3.2
Lactobacillus sp. 1.6
Conynebacterium sp. 1.6
Yeasts 3.2
survival seems to be strongly influenced by many conditions. Presence of predators is capital by comparing populations of bacteria in the presence of predators with those in the absence of predators, lower numbers were observed for fecal coliforms than for fecal Streptococci [19]. This may have been due to the greater production coliforms [20].
0
10
20
30
40
50
60
Bacillu
s sp.
Enterobac
teriac
eae
C. perf
ringen
s (spore
s)
C. perf
ringen
s (ve
getativ
e)
Enteroco
ccus s
p.
Staphylo
cocc
us sp.
Bifidobac
terium sp
.
Yeasts
Lactobac
illus sp
.
Conyneb
acter
ium sp.
Pre
sens
e (%
)
Figure 3 : Occurrence (%) of bacteria in soil.
A biomass size spectrum (BBS) depicts the abundance and distribution of organisms by size class in an ecosystem. Changes in the scope of the manualized BBS can be indicative in changes in the biological and microbial community structure, productivity, plant fertility, predator-pray relationships, effects of environmental variability, nutrient leading and habitat change. BBS of stressed ecosystems often have steep negative slopes. Although, eutrophic ecosystems as well, with excess nutrient loading blooms of microscopic phytoplankton can greatly increase the abundance and biomass in bacteria, leading to stress full conditions such as hypoxia and mortality of other bacteria as living biological species [10,13,16,17].
Table 4: Major bacterial flora according to the culture type.
Culture type Dominant species
Beetroots Bacillus sp.
Enterobacteriaceae
Staphylococcus sp.
121
“Sustainable Management and Development of Mountainous and Island Areas”
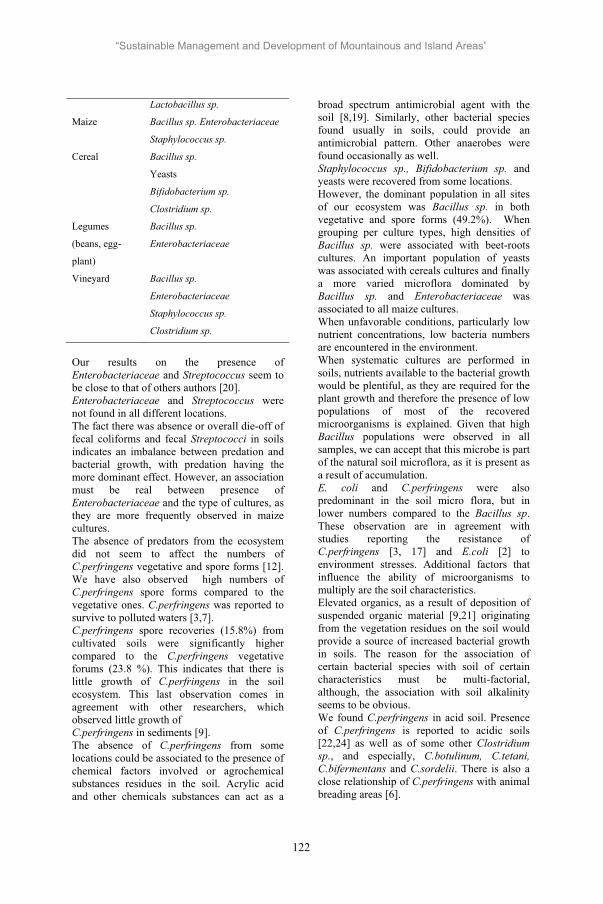
Lactobacillus sp.
Maize Bacillus sp. Enterobacteriaceae
Staphylococcus sp.
Cereal Bacillus sp.
Yeasts
Bifidobacterium sp.
Clostridium sp.
Legumes
(beans, egg-
plant)
Bacillus sp.
Enterobacteriaceae
Vineyard Bacillus sp.
Enterobacteriaceae
Staphylococcus sp.
Clostridium sp.
Our results on the presence of Enterobacteriaceae and Streptococcus seem to be close to that of others authors [20]. Enterobacteriaceae and Streptococcus were not found in all different locations. The fact there was absence or overall die-off of fecal coliforms and fecal Streptococci in soils indicates an imbalance between predation and bacterial growth, with predation having the more dominant effect. However, an association must be real between presence of Enterobacteriaceae and the type of cultures, as they are more frequently observed in maize cultures. The absence of predators from the ecosystem did not seem to affect the numbers of C.perfringens vegetative and spore forms [12]. We have also observed high numbers of C.perfringens spore forms compared to the vegetative ones. C.perfringens was reported to survive to polluted waters [3,7]. C.perfringens spore recoveries (15.8%) from cultivated soils were significantly higher compared to the C.perfringens vegetative forums (23.8 %). This indicates that there is little growth of C.perfringens in the soil ecosystem. This last observation comes in agreement with other researchers, which observed little growth of C.perfringens in sediments [9]. The absence of C.perfringens from some locations could be associated to the presence of chemical factors involved or agrochemical substances residues in the soil. Acrylic acid and other chemicals substances can act as a
broad spectrum antimicrobial agent with the soil [8,19]. Similarly, other bacterial species found usually in soils, could provide an antimicrobial pattern. Other anaerobes were found occasionally as well. Staphylococcus sp., Bifidobacterium sp. and yeasts were recovered from some locations. However, the dominant population in all sites of our ecosystem was Bacillus sp. in both vegetative and spore forms (49.2%). When grouping per culture types, high densities of Bacillus sp. were associated with beet-roots cultures. An important population of yeasts was associated with cereals cultures and finally a more varied microflora dominated by Bacillus sp. and Enterobacteriaceae was associated to all maize cultures. When unfavorable conditions, particularly low nutrient concentrations, low bacteria numbers are encountered in the environment. When systematic cultures are performed in soils, nutrients available to the bacterial growth would be plentiful, as they are required for the plant growth and therefore the presence of low populations of most of the recovered microorganisms is explained. Given that high Bacillus populations were observed in all samples, we can accept that this microbe is part of the natural soil microflora, as it is present as a result of accumulation. E. coli and C.perfringens were also predominant in the soil micro flora, but in lower numbers compared to the Bacillus sp.These observation are in agreement with studies reporting the resistance of C.perfringens [3, 17] and E.coli [2] to environment stresses. Additional factors that influence the ability of microorganisms to multiply are the soil characteristics. Elevated organics, as a result of deposition of suspended organic material [9,21] originating from the vegetation residues on the soil would provide a source of increased bacterial growth in soils. The reason for the association of certain bacterial species with soil of certain characteristics must be multi-factorial, although, the association with soil alkalinity seems to be obvious. We found C.perfringens in acid soil. Presence of C.perfringens is reported to acidic soils [22,24] as well as of some other Clostridium sp., and especially, C.botulinum, C.tetani, C.bifermentans and C.sordelii. There is also a close relationship of C.perfringens with animal breading areas [6].
122
“Sustainable Management and Development of Mountainous and Island Areas”

The region of Evros is not reported as a basic animal breading area of our country and so, the low detectable numbers of C.perfringens explained this fact. Our preliminary findings seemed to be important not only from the point by the microbial ecology but in indicating that an association must be real between the occurrence of some bacterial species, the type of the cultures and the maturation stage of the culture. This study highlight the main factors involved in the influence of the soil ecosystem. It must be also noted that pathogenic bacteria are capable of extended persistence or multiplication in environmental ecosystems and so a systematic monitoring of soil is imposed. Monitoring tools based on a systematic screening evaluated by statistical precision [13] is an important feature to determine changes that should occur to the microbial ecology of the soil ecosystem. In this way, cultivated areas will be supervised systematically and this will lead to an amelioration of the product quality together with a safety for the consumer and preservation of public health.
5. References
[1] Bezirtzoglou ,E., Dimitriou ,D., Panagiou ,A,1996.Occurrence of C.perfringens in river water by using a new procedure. Anaerobe. 2,169-173.
[2] Bezirtzoglou ,E., Dimitriou, D., Panagiou ,A., Kagalou, I., Demoliates ,Y,1994. Distribution of C.perfringens in different aquatic environments in Greece. Microbiol Res. 149,129-134.
[3] Bezirtzoglou, E., Panagiou ,A., Savvaidis ,I., Maipa ,V,1997. Distribution of C.perfringens in polluted lake environments. Anaerobe,3,169-172.
[4] Bezirtzoglou, E., Romond ,C,1990 : Rapid identification and enumeration of C.perfringens in the human faecal flora. MEHD. 3,159-163.
[5] Bezirtzoglou, E.,2005. General Microbiology ,Chapter 7, Ed. Parisianos (Greece), ISBN: 960-394-343-6,2005,pp122
[6] Desmarais ,TR., Solo – Gabriele, HM., Palmer, CJ.,2002. Influence of soil on fecal indicator organisms in a tidally influenced subtropical environment. Appl Environ Microbiol. 68(3),1165 – 1172.
[7] Despain Smith, L., Gardner ,MV. ;2002. The occurrence of vegetative cells of C.perfringens in soil. J Bakteriol (Note).588,407-408.
[8] Edwards ,DD., McFeters ,GA., VenKatesan ,MI.,1998.Distribution of C.perfringens and fecal sterols in a benthic coastal marine environment influence by the sewage outfall from McMurdo Station, Antarctica. Appl Environ Microbiol. 64(7),2596-2600.
[9] Emerson ,DJ., Cabelli ,VJ,1982.Extraction of C.perfringensspores from bottom sediment samples. Appl Environ Microbiol. 44(5),1144-1149.
[10] Imlay, JA,2002.How oxygen damages microbes : oxygen tolerance and obligate anaerobiosis. Adv Microbiol Physiol. 46,111-153.
[11] Iyer ,P., Bruns ,MA., Zhang ,H., VanGinkal ,S., Logan ,BE,2004. H2 – producing bacterial communities from a heat – treated soil inoculum. Appl Microbiol Biotechmc. 66,166-173.
[12] Jean ,D., Briolat ,V., Reysset ,G,2004.Oxidative stress response in C.perfringens. Microbiology.150,1649-1651.
[13] Koutroumanidis ,T,Iliadis, L,Sylaios, G,2005.Time-series modeling of fishery landings using ARIMA models and Fuzzy Expected Intervals software.Environ Model Software.
[14] Maipa, V., Alamanos, Y., Bezirtzoglou ,E,2001. Seasonal fluctuation of bacterial indicators in coastal waters. MEHD.13,143-146.
[15] Matches ,JR., Liston ,J., Curran ,D,1974.C.perfringens in the Environment. Appl Microbiol. 28(4),655-660.
[16] Mullie ,C., Romond ,MB., Yazourh ,A., Libersa, C., Bezirtzoglou ,E., Romond ,C,2002.Influence of stress on faecal carriage of C.perfringens MEHD 14,118-121
[17] Savvaidis, I., Kegos ,Th., Papagiannis ,C., Voidarou ,C., Tsiotsias ,A., Maipa
123
“Sustainable Management and Development of Mountainous and Island Areas”

,V., Kalfakakou, V., Evangelou ,A., Bezirtzoglou ,E,2001.Bacterial indicators and metal irons in high mountain lake waters. MEHD.13,147-152.
[18] Setlow, P,1994. Mechanisms which contribute to the long-term survival of spores of Bacillus species. J Appl. Bacteriol. 76,495-605.
[19] Sieburth, JM,1961.Antibiotic properties of acrylic acid, a factor in the gastrointestinal antibiosis of polar marine animals. J Bacteriol.82,72-79.
[20] Simon ,MTP,1985.Sepsis, Septicaemia, Sewage and the Sea. In: Proceedings of the Joint Meeting of the Hong Kong Society for Microbiology and the Guangdong Society of Microbiology. 1985;2470-2480.
[21] Smith, LDS,1975. Common mesophilic anaerobes including C.botulinum and C.tetani, in 21 soil specimens. Appl Microbiol. 29(5),590-594.
[22] Yamagishi, T., Ishida, S., Nishida, S,1964. Isolation of toxigenic strains of C.perfringens from soil. J Bacteriol. 88(3),646-652.
124

Environmental impact assessment (E.I.A.) for the evaluation of forest roads in mountainous conditions (Case study: Valia Kalda)
A. G. StergiadouAristotle University of Thessaloniki
School of Forestry and Natural Environment Institute of Mechanical Science and Topography
Uni. Box: 521 24, Zip Code:541 24, Thessaloniki, Greece e-mail1: [email protected]
Abstract. This research develops a method to evaluate the impacts of forest road construction on the natural environment. The method will be used to improve the layout of forest roads on an early planning stage. The method, which will be applied, should be practical, effective and easy to use before the road construction. Criteria to assess environmental impacts were identified and rated by interviewing forest scientists in Greece by using questionnaires. These criteria will be analyzed by using methods of analytical photogrammetry and GIS. A threshold will be defined for the level of compatible impacts. Road segments exceeding this threshold will be identified for re-design purposes to minimize negative impacts on the environment.
Keywords. Environmental Impact Assessment (E.I.A.), Environmental Assessment Criteria, forest road construction, mountainous condition, evaluation methods using E.I.A., Valia Kalda – Northern Pindos.
1. Introduction
The term Environmental Impact Assessment (E.I.A.) means an assessment of impact on the environment caused by anthropogenic interference. This paper deals with the impacts on the natural environment by road construction. In Greece this terminology used for the first time in the Law Nr.743/77 and same years later in the Law Nr. 1650/86, articles 3 to 6, which were referred to as the environmental protection in order to be compatible to the Greek legislation with the European directions that was given to Greece.
Despite the legislation about E.I.A. all constructions were rarely undertake by them, because constructors could not estimate the use of them (Stergiadou et all, 2003, Stergiadou et all, 2004). The Egnatia road constructors were the
first who used E.I.A. in their constructions, knowing the great importance of using them for opening up roads, according to the law claimed in the practical form. For a successful forest opening up project it is necessary to take into consideration the net cost of road construction as well as the cost arising from the Environment (Doukas, 1994, Becker, 1995, Doukas et all 1998). The total cost is the sum of partial cost (Warner 1973).
To assure that all viewpoints are brought to the table, we should not rely on risk assessment for decision-making. Instead, we could employ a decision-making technique that was described in the National Environmental Policy Act (NEPA) of 1969, a federal law. NEPA requires that, before certain decisions can be made, all reasonable alternatives must be examined. If this approach is taken, then the public can get involved in describing and discussing all reasonable alternatives. In such a process, all viewpoints can be aired. Cultural values, historical perspectives, and local concerns can all be brought into the decision, along with issues of technology, costs, and benefits. People can look at all the alternatives and can decide which one they prefer. The process of thinking about alternatives is healthy for a community -- it helps people visualize the future that they want for themselves and their children. Risk assessment suppresses such discussions (Montague 2006).
. The key issues are: a) Construction work in the field often results in environmental damage, and, to be more specific, to get access to a forested area it is necessary to take into consideration the road net cost as well as the cost arising from the landscape and the natural environment. b) Human presence demands exploitation of the natural environment. Yet it causes interference some times with a negative effect.
125
“Sustainable Management and Development of Mountainous and Island Areas”

Figure1. Forest road C1 in “Valia Kyrna” after the 2002’s fire
The area of “Valia Kyrna” (figure 1) in the forest complex of Smolica – in Northern Greece (figure 2) - is held as the research area. This area is wooded with “Pinus Nigra” known as “Robola” and it composed of a unique biotope because many rare species are living there (brown bears, wolves, lynx, etc.). The road network is old, but every year the office of forestry improves the network and works on opening up of the forest, in order to cut the timber from the forest.
Figure2. Orientation map of the research area
2. Methodology
The methodology that was followed was practical, effective and easy to use before or after a road has been constructed (OECD, 1994). For this reason: 1. Practical criteria have been held in order to
evaluate the intensity of the impact and absorption. The grading of these criteria depends on the following principle: We accept a situation as ideal (=100%) for the forest protection from construction. This ideal situation will be described by criteria.
2. The rating of these criteria came as a result from a survey of forest scientists by using questionnaires. The following parameters have been considered: a) the duration of the negative effect, b) the influenced area, c) the sensitivity of the general public to the effect as well as the social impact and political desire. (The evaluation of the later parameters will be difficult and therefore the description of an E.I.A. in a profile form will be a necessary addition) (Eskioglou, 1994, Koutsopoulos et all 1984, Mousiopoulos, 1999).
3. Analytical photogrammetric method and GIS will be used to evaluate the road location on the landscape level and with respect to the environment.
4. E.I.A. of existing roads, in the research area will reveal different forms of absorption of negative impacts along the roads (Heinimann, 1992, Sedlak, 1993, Weiss, 1986). This information will be used to assess the impacts of the planned forest roads. The equation that gives the compatibility
with the natural environment is: C(%) = MA(%) X ME (%),
Where C(%): Compatibility, MA(%): Mean Absorption, ME(%): Mean Intensity.
The proposed research is of practical interest for forest sustainable management. The identification and the rating of criteria for assessing environmental impacts of road construction combined with revealing possible mitigating effects through impact absorption will allow for comprehensive evaluations of every forest road according standards set by new EU directions. The E.I.A. is of special interest when comparing different technically dual road alignments at the planning stage. Besides assessing them against the objectives of the access planning additional criteria will be available to include impacts on the forest ecosystems. The latter will affect the road alignment in horizontal and vertical perspective and result in a solution, which is technically and environmentally acceptable. The criteria of assessing environmental impacts of forest roads will be analysed by using methods of conditions and protection of forest ecosystems. Based on the framework of the E.I.A. we must find a compatible solution in order to improve the road on the level both on the serpentine and the road draining system. The combination of Analytical
126
“Sustainable Management and Development of Mountainous and Island Areas”

photogrammetry and GIS can be used as a decision – support tool together with the:
E.I.A. parameters, Cost,Existing legislation Environmental policy.
3. Results
Based on questionnaires which have been given to the office of Forestry of Vallia Kalnta’s area we composed a table (table 1) where all the criteria of absorption and intensity with their weights and the evaluation of forest roads have been presented F.R.C1 and F.R.C2. The equation that gives the compatibility of forest road with the natural environment is:
C(%) = MA(%) X ME (%),
Where: C(%): Compatibility, MA(%): Mean Absorption, ME(%): Mean Intensity
CRITERIA OF INTENSITY F.R.C1 F.R.C2
1. Terrain allocation
Weights
Grade %
Sum Grade %
Sum
1.1 Curve radius
2,1 100 210 40 84
1.2 Gradient
2,01 80 161 60 120,1
1.3 Gross section
2,25 90 202 60 135
2. Road width
2,04 70 143 70 142,8
3. Road gradient
2,52 100 252 80 201,6
4.Serpentine 2,13 100 213 50 106,5 5. Position of road
5.1 Distance of water flow
1,83 100 183 100 183
5.2 Distance of forest boundary
1,65 100 165 100 165
5.3 Area with construction problems
2,40 80 192 90 216
6. Picture of landscape6.1From
terrain 1,83 100 183 80 146,4
6.2 Vegetation 1,8 100 180 100 180 6.3View effect 1,7 100 170 100 170 6.4Compatible
constructions
1,6 100 160 - -
6.5 View of 1,65 100 165 - -
water flow 7.Visual absorption capability
1,77 90 160 80 136
8. Forest road construction (only for existing road)8.1 Earth works machinery
2,16 70 151 70 151,2
8.2 Material
2,08 100 208 100 208
8.3 Seeding andmulching of side slope
1,38 90 124 90 124,8
8.4 Road drainage system
2,31 70 162 20 46,2
SUM 37,21
3384 2516,6
Avarege clause
90,9% 67,6%
TABLE 1. Evaluation on forest roads at Valia Kalda
The gradation of absorption criteria based on: the kind of Terrain Conditions and the distance between the constructing forest road and other interesting locations.
CRITERIA OF ABSORPTION F.R.C1 F.R.C21. Terrain
conditionsWeight
s Grade%
Sum
Grade %
Sum
1.1 Forest 3 100 300 90 270 1.2 Mixed forest 3 65 195 70 210 1.3 High forest 3 100 300 80 240 1.4 Selection forest
3 50 150 50 150
1.5 Mean height 3 75 225 40 120 1.6 Side quality 3 50 150 50 150 1.7 Productivity 3 - - 15 45 1.8 Slope 2 25 50 25 50 1.9 Exposition 2 85 170 70 140 1.10 Relief 2 100 200 80 160 2. Distance from
2.1 Tourist places
1 100 100 70 70
2.2 Highway 1 100 100 90 90 2.3 Railway - - - - - 2.4Archaeological Sites
1 - - 80 80
2.5 Town 1 100 100 100 100 2.6 Village 1 90 90 60 60 2.7 Path way 1 100 100 - -
SUM 29 2230 1935
Avarege clause 76,9%
66,7%
127
“Sustainable Management and Development of Mountainous and Island Areas”

The values of Weights are: 1 for minimum weight (not important), 2 for medium weight (important) and 3 for maximum weight (very important). It is also well known that the absorption can be measured by: the type of Forestall plants (pinus, acer, etc), the topography of the location and the social interest.
4. Conclusions and suggestions
Based on the above mentioned results we came to the following conclusions:
The table 1 shows that the first forest road (F.R.C1) has a better absorption (76, 9%) than the second forest road (F.R.C2) (66, 7%). The reason is that at (F.R.C2):
The terrain conditions were graded as: not so forested, with medium height plants, a small productivity and max exposition.The distance from Tourist places, Archaeological sites, villages and pathways has been in an average 60% – 90%, which is good but not so good enough as (F.R.C1).
The first forest road (F.R.C1) shows compatibility almost 91% (=90, 9%), so it is over than the 50% which is necessary in order to accept the existing road as a compatible road with the natural environment.
The second forest road (F.R.C2) shows compatibility nearly 68% (=67, 6%), so it is also over than the 50% which is necessary in order to accept the existing road as a compatible road with the natural environment.
In cases where the road shows no compatibility (less than 50%) then this road is not accepted and it is suggested that the technical specifications of the staking grade line should be improved.
According to the research results it is suggested:
1. A list of criteria (table 1) and their weights to evaluate the intensity of the impact from road construction and the absorption ability will be very useful and practical for the assessment by the Environmental Impact Assessment. Such a profile form based on European Union directions, will be useful to every office of forestry.
2. It could be very useful to have alternative road construction solutions for comparison based on the new planning technique according to the aims
of opening up the forest, terrain conditions and the protection of forest ecosystem, before the forest road is constructed.
3. The staking grade line of one road in a Digital Terrain Model will be easiest to use for the comparison of more than one road alternative, in order that the best solution be taken.
4. Road segments exceeding this threshold will be identified for re-design purposes to minimize negative impacts on the environment.
5. It is of maximum importance in sensitive ecological systems such as Mediterranean forest areas, to have a realistic concept by designing the opening up of forests.
6. To use a real – time expert system environment designed for on-line dynamic decision support, mission critical command and control and communicate with offices of forestry, universities, etc.
The existence of a profile form based on European Union directions for Environment Impact Assessment; can be used also as a decision – making tool, for re- design purposes of existing roads. The existing legislation and the local environmental policy which held in Greece can give new directions to the offices of forestry in the section of construction works.
5. References
[1] Becker, G., Walderschließung auf dem Prüfstand, AFZ, BLV Verlagsgesellschaft mbh München, 1995; 9(2): 19 – 20. BLV Verlagsgesellschaft mbh München; 9: 19 – 20.
[2] Doukas, K., Erschließungsmodelle und Umweltschutz, Tagungsbericht über das 28 Internationales Symposium FORMEC in Langnah, I. E. Schweiz; 1994. p. 318 -326.
[3] Doukas, K., Akca, A., Umweltverträglichkeitsprüfung bei der Walderschließung in Griechenland, Algemeinen Forst und Jagdzeitung, J. D. Sauerlaenders Verlag, Frankfurt am Main 1999; 17(3):27-28.
[4] Eskioglou, P., Environmental Studies. Environmental Impacts from the design, construction and use of road works, Scientific Seniority of Department of
128
“Sustainable Management and Development of Mountainous and Island Areas”

Forestry and Natural Environment, Thessaloniki, 1994; 27: 497 – 516.
[5] Heinimann R.H., Umweltverträglichkeit forstlicher Erschließungen-das scheizerische Prufverfahren, Scientific Seniority of Department of Forestry and Natural Environment, Ehrenband von Prof. G. Stergiadis, Thessaloniki, 1992; LD(2):589 -600.
[6] Koutsopoulos, K., Kophitsas, I., A Procedure for the Estimation of the Environmental Impacts of a Road, Technical Chronic, Athens, Greece, 1984; 4(1-2):14 – 17.
[7] Montague P., Making good decisions, http://www.gdrc.org/uem/eia/ [30/06/2006].
[8] Mousiopoulos, N., Specification for studies in Environmental Impact (Analytical terms, structures and directions), Thessaloniki, Greece: Second Edition, ZHTH Press; 1999.
[9] Organization for Economic Co-operation and Development (OECD) – Environment Directorial, Environmental Impact Assessment for Roads, 1994; A - B, Road Transport Research. http://www.oecd.org[30/6/2006].
[10]Sedlak O., Walderschließung und Naturschutz, Forstzeitung, Wien, 1993; 7(2): 8-11.
[11] Stergiadou A., Stergiadis Ch. Giannoulas V., Doucas K., The contribution of different GPS type’s in sustainable development (Case: mountain Chortiatis – Kissos)”, Proceedings of 8th International Conference on Environmental Science and Technology, Limnos 8 -10 September; 2003, p.774 -781.
[12] Stergiadou A., Drosos V., Giannoulas V., Estimation of environmental effects from forest roads at Metsovo, Proceedings under publishing of 4th National Conference for Metsovo, Metsovo 27 -30 September; NTUA, Athens; 2004.
[13] Warner, M.L. Environmental Impact Analysis: An Examination of three Methodologies, Wisconsin, USA: Ph. D. Dissertation at Madison University; 1973.
[14] Weiss H., Waldstrassenbau und Landschaftschutz, Bündner Wald, Chur, Schweiz, 1986; 36(12): 13 – 15.
129
“Sustainable Management and Development of Mountainous and Island Areas”

Beyond Knowledge: Science Teaching in Early Years Education
Ros Swann
School of Education,University of Gloucestershire, Francis Close Hall Campus Swindon Road, Cheltenham, Gloucestershire.
Abstract. The purpose of this paper is to explore the role of science in the education of young children and respond to the question of whether or not it is appropriate to include science in an early years (Foundation Stage 3-5 years) curriculum.
The paper begins with a discussion of the ‘Scientific Child’ and draws on child development theory, which underpins the rationale for including science in the early years curriculum.
Concepts such as ‘dispositions’, ‘schema’ and ‘agency’ are discussed in the context of developmentally appropriate practice and the role of play in young children’s learning. Recent research on the role of ‘sustained shared thinking’ in young children’s development and self-awareness is explored, as is the impact of recent research on the brain development of babies and children.
The paper concludes with a discussion on the importance of setting an appropriate context for including science activities with young children.
Key words. Science Education. Foundation Stage. National Curriculum (UK). Developmentally Appropriate Practice. Curriculum. Dispositions. Schema.
Context.
Unlike most, if not all, countries in Europe, children in the United Kingdom begin their formal education at five years of age. While in countries such as Sweden, Norway and Denmark children are still accessing a play based curriculum in pre-school centres and kindergartens at this age, in the United Kingdom it is expected that children will begin to undertake a formal curriculum, based on a framework of discreet subjects, which has its roots in the secondary curriculum, originally developed in the Middle Ages.
Since the introduction of the National Curriculum [10], the debate has continued as to the appropriateness of such a curriculum
for primary aged children, and in particular, children as young as five.
The National Curriculum has undergone a number of changes since its first inception, however, currently the notion of teaching subjects through a cross curricular or thematic strategy is being promoted as an effective strategy. This is, of course, not new. Teachers in the United Kingdom were successfully using this kind of teaching strategy in the early 1970s and 1980s.
The obsession the English have with covering content, rather than taking a lead from the children’s interests, is however, still apparent in much of the pedagogy of the primary school.
For those practitioners working with our very youngest children in nurseries, pre-schools, family centres, children’s centres and reception classes, however, there is more freedom to follow a cross-curricular approach within a play based curriculum. It is hoped by many that the curriculum for the younger children, the Foundation Stage [5], is one that will eventually impact on practice further up the school and it is this approach to teaching and learning, particularly within science, that I wish to consider.
I am not about to advocate that young children between the ages of three to five years should be taught a formal science curriculum, what I am suggesting is that the natural curiosity of children at this age is such that they can explore scientific concepts at their own level through a play based curriculum. I am also speculating that this could have a positive impact on their interest in scientific issues as they mature. Neither am I suggesting that such young children should be engaged in learning about content. Engaging in scientific thinking at this age is about having the opportunity to develop process skills and a respect for their environment. I have shared the emergence of a moth from a pupa with five year olds and will never forget their wonder and excitement at this event; the sudden discovery, again at five years old, of the surface tension of water,
130
“Sustainable Management and Development of Mountainous and Island Areas”

quite by chance, as I was watering some plants in my classroom, or the first time they looked down a powerful microscope and saw that pond water was full of tiny creatures. Their fascination with what they could see was something that has stayed with me for many years.
Although I did not start out as a science teacher, I have always been engaged by science, and have wanted the children I taught to share that engagement with me. I was lucky enough to have a scientist for a father who trusted us to experiment with all sorts of interesting chemicals and material, which probably, now, in our current health and safety culture would result in a visit from Social Services! It was through these experiences though, and my visits to the Science Museum in London, where I was fascinated by the massive steam engines that I grew to within a science culture and subsequently developed an interest in environmental science. What I learned as a child is that science underpins our entire existence that it is not something divorced or separate from daily life. I believe that to have an understanding of the real nature of science is to understand and respect the beauty and complexity of the world.
The Scientific Child
We are born with the ability to discover the secrets of the universe and of our own minds, and with the drive to explore and experiment until we do. Science isn’t just a specialised province of a chilly elite; instead, it’s continuous with the kind of learning every one of us does when we’re very small. [6, p.3]
Gopnik, Meltzoff and Kuhl suggest that the fundamental process of learning in young children is scientific and indeed add ‘It’s not that children are little scientists but thatscientists are big children’ [6, p.3]. They argue that the very essence of being human is to be a scientist; that the curiosity and problem solving skills that humans are born with are fundamental to the way in which we all learn and that this process begins at birth.
The scientist peering into the crib, looking for answers to some of the deepest questions about how and why the world and language work, sees the scientist peering out of the crib, who it turns out, is doing much the same thing. No wonder they both smile. [6, p.3] What can happen in the United Kingdom though, is that by the time children reach nine
or ten years of age many of them seem to have lost their sense of curiosity and are resistant to science. This is not only a tragedy in terms of their own learning but it is also disastrous in terms of their having an interest in and understanding of their environment. Children in the United Kingdom have had fewer and fewer opportunities to explore their outside environments and are growing up with some fundamental misconceptions about the way the world works and no sense of connection to the planet. As a global society we cannot afford this. I believe it is essential that we give children more opportunities to explore life through a ‘scientific lens’ at an earlier age. Indeed in the United Kingdom, there is currently a growing interest in the importance of outside play. [4, 13]. These studies indicate that outdoor experiences in a natural environment can have very positive effects on children, encouraging creativity, curiosity and resilience. Again, this is not new, but it is, at least, now recognised that the obsession with academic subject content over process during the last two decades has been potentially destructive.
Including science in an Early years Curriculum
What then, should be the nature of science in an early years curriculum?
The Foundation Stage Guidance document splits up young children’s learning into several areas of experience [5]:
Physical Development Mathematical Development Communication, Language and Literacy Creative development Personal, Social, Health and Emotional Development Knowledge and Understanding of the World
In United Kingdom, and particularly English, Foundation Stage settings, science usually appears as part of the Knowledge and Understanding of the World element to the planned learning. I believe, however, that to subsume science under Knowledge and Understanding of the world, for this age group, is a mistake since it implies a content based approach. My suggestion is that science, at this age, can be effectively included in a play based curriculum, in recognition that the processes involved in learning about science are more significant
131
“Sustainable Management and Development of Mountainous and Island Areas”

than the content. It should appear under Personal, Social, Health and Emotional Development (PSHE) rather than Knowledge and Understanding. Since, with young children, science is about their interaction with and learning from their environment, learning about themselves and other people, learning about staying healthy, science is much more about Personal, Social, Health and Emotional Development than it is about facts. Science can aid the development of skills and dispositions and give children a sense of agency. It can also foster children’s sense of curiosity, challenge stereotypes, develop their sense of responsibility and respect for others and it is not simply about a preparation for accessing a formal science curriculum later on.
Skills, Problem Solving and Agency
We often underestimate young children’s abilities to think things through for themselves, and indeed, in the United Kingdom, I believe we do not offer them enough opportunities to do this. The culture of accountability in the United Kingdom has led, I would suggest, to the expectation that we can live in a risk free society, so that for fear of litigation, children are more constrained and have fewer and fewer opportunities to develop a sense of independence, responsibility and agency.
I believe that the inclusion of science in an Early Years curriculum can offer children these missed opportunities and re-establish a healthy balance between safety and independence in a host of different ways, from exploring local woodland to caring for a class garden and working out how to protect seedlings from snails without hurting the snails. (The best suggestion I have for this to date, is that we should have imported a great big hairy spider to scare away the snails.) If children are given the opportunity to develop a sense of empathy with the natural world at an early age, this will become normal, part of their way of looking at the world. It will also encourage a sense of responsibility for themselves and others and in addition, by developing a stronger sense of agency, children are more confident and have higher self esteem.
Dispositions and Challenging Stereotypes
Dispositions are established very early and are the ‘habits of mind’ [9] or attitudes to learning (sometimes referred to as ‘orientations to learning’) that children develop as a result of whatever learning experiences they have had. The key thing to remember about dispositions is that something can be taught so appallingly badly that children, as a result, become disenchanted with or resistant to the subject and lose interest. ‘Knowledge can be acquired without having the disposition to use it’ [8, p.2]. For example, from my own experience, I have known both children and adults who have been taught reading so dismally that they no longer have the disposition to read. This would seem somewhat counter productive as an outcome of a child’s, or indeed anyone’s, learning experiences.
A disposition, then, is:
a tendency to exhibit frequently, consciously, and voluntary a pattern of behaviour that is directed toward a broad goal…. Children can be said to have the disposition to be curious if they typically and frequently respond to their environment by exploring, examining, and asking questions about it. Similarly, the disposition to complain or while would be robust if exhibited frequently, and weak if rarely exhibited. [9, p.3]
It is possible that some dispositions are innate but as Katz points out:
children develop pre-dispositions which are malleable and affected by experience. Adults should encourage children to develop competence and confidence in their own ability to learn. [9, p.3]
And, as Anning and Edwards [1, p.63] add, ‘dispositions are rooted in our sense of our likely effectiveness’. Waller suggests:
Research on learning dispositions suggests that fostering positive dispositions leads to children becoming more purposeful, successful and less likely to become disaffected. [20, p.96]
It is my contention that, as children develop self confidence and a greater sense of agency through science activities and early explorations, so are developed the dispositions of:
132
“Sustainable Management and Development of Mountainous and Island Areas”

Resilience and persistence Mastery orientation Self-management and organisation Curiosity, exploratory drive and risk taking Creativeness. Concentration Assertiveness (For a more comprehensive discussion of dispositions see Laevers [11])
It would seem to me self evident that since we are today, educating our youngest children for a future that we cannot, ourselves, predict, the above dispositions are ones that we would wish to foster in school.
Indeed, current research in the United Kingdom [22] suggests that children’s independent, self regulated learning is the most significant precursor for developing metacognition. The pedagogy for the development of self-regulation includes encouraging children to develop the ability to tackle new tasks confidently, to be able to find resources without adult help, to develop own ways of carrying out tasks and to engage in independent co-operative activities with peers.
This research has established that young children:
given the opportunity, are capable of taking far more responsibility for their own learning than was previously thought. Even at this young age, they are beginning to be aware of their own learning, to be able to organise their approach to learning activities and to see themselves positively as learners. [22]
Dispositions are not simply fostered by children’s own explorations in the Piagetian sense [13] but can be encouraged and developed by their interactions with those around them. We know that children learn through interaction with their peers and with the adults around them. [19, 12] and there is current research taking place in the United Kingdom on the significance of ‘Sustained Shared Thinking’ [17, 23]. This research is based on the understanding that children need real engagement in conversation and sharing ideas rather than the somewhat token responses and opportunities to engage that they can experience in their schools [21].
Encouraging young children to engage in scientific thinking and explore their environment in an active enquiring manner
also provides opportunities for challenging stereotypes. As children learn about themselves they can also learn about others, their place in the world and the place of others. They can begin to understand that the world is interconnected on a profound level. Not because they have been taught this, but because they have had the opportunity to experience it. (Though I sometimes wonder, after many years of working with young children, if they do not have a deeper understanding of this than many adults.) Children are able to learn too, that to be scientist is not synonymous with being male and wearing a white coat and that science is lived and experienced.
Developmentally Appropriate Practice, Play and Schemas
Developmentally Appropriate Practice, to which is often added the term ‘contextually’, refers to the kind of practice and curriculum that takes into account the developmental needs of the children. The curriculum and day to day planning is driven by the children rather than the adults, and the agenda is focussed on their developmental needs at any one time, rather than a learning objective based on some developmental norm, which may or may not be appropriate for their cultural context. (By ‘cultural context’ I refer to culture on both the macro and the micro level.)
The concept of a developmentally appropriate curriculum is based on the understanding that:
teaching is most effective when it provides opportunities for learning in ways that motivate and challenge children … Apart from becoming successful, lifelong learners, and acquiring attitudes, knowledge and skills which will serve them well in future endeavours, this approach is most likely to produce adaptable, imaginative, creative and highly motivated people. [7, p.51]
Throughout this discussion I have referred to the inclusion of science in a ‘play based curriculum’. This, I suspect, would be unproblematic in any other European country other than England. While, we in theory, subscribe to such an approach within the Foundation Stage, at three and four years old, our five year old children are still expected to
133
“Sustainable Management and Development of Mountainous and Island Areas”

access the National Curriculum with its content laden philosophy.
Even though, however, reference to a play based curriculum in the Foundation Stage Guidance document would appear to be straightforward, interpretations as to what actually constitutes ‘play’ are many and rarely congruent. However:
It is recognised that play is important for both children and adults. Play is re- creative and gives individuals the opportunity to step outside the world of work and relax, or focus their attention on something different. For young children however, play is far more than recreation, it is the foundation for all learning. [16, p.102]
Early research on children’s play, interpreting data based on laboratory studies, did not provide much evidence as to the cognitive gains children made through play, though it was conceded that social development was fostered. Later, more naturalistic studies, based on observations of children’s play however, gave more insights into the cognitive, social and emotional development that is evident in the play of young children. [12]
Tamis-Lemonda, Katz and Bornstein [18, p.213] have identified the role of play in five domains of development:
1. Psychological – the regulation of arousal, expressing emotions, resolution of conflicts.
2. Mastery – developing attention span and task directed behaviour.
3. Cognitive – the acquisition of information and skills, creative and divergent thinking, representational abilities.
4. Social – giving and receiving, taking account of others’ thoughts and intentions in decision-making.
5. Culture – the means of transmitting social roles and cultural values.
The extent to which play should or should not be structured is a debate that continues to exercise the minds of early years practitioners in the United Kingdom. There are those who advocate a more tightly structured approach to play, with clear learning objectives and expected outcomes, (much in the nature of the Stepping Stones in the Foundation Stage
Guidance) and a carefully planned environment. Others believe that too much structure inhibits children’s play and undermines their creativity. Some would indeed argue that once play becomes structured it ceases to be real play.
From the children’s point of view, I suspect they would agree. While visiting a Swedish pre-school recently, my attention was caught by a sign containing the children’s rules for the teachers which had been created by the four and five year olds in the class. The first rule was ‘Don’t interfere with our play’. The second and third rules read: ‘Be kind to the little children’, and ‘We want to know when we are getting something wrong, but please tell us in a normal voice’.
The concept of schemas is one that has informed the planning of many practitioners in the early years. These are recognised as patterns of behaviour or thought, sometimes reflected in their art work and mark making, that indicate common themes or threads that are preoccupying a child’s thinking at any one time.
Educators can provide a more appropriate curriculum which matches the developmental levels and interests of children by using their knowledge of schemas … to develop a greater awareness of patterns of learning and understand more about children’s predominant interests. [12, p.45]
Schemas include trajectory, rotation, connection, transporting, and enveloping patterns of behaviour and can be observed in children’s play. The notion of employing our understanding of schemas to develop children’s play and support their interests, I would suggest, is a pre-cursor to the constructivist approach to teaching and one that could be usefully adapted to include scientific thinking. Their play does not come from nowhere. In their play, they are developing their own ideas and making sense of their worlds. They are also reflecting what they know through their play and the following example demonstrates how science thinking can be incorporated and indeed reflected, in young children’s play.
Fire Station play [3, p.24]:
Role Play area set up as a fire station for children aged between five and six years old.
134
“Sustainable Management and Development of Mountainous and Island Areas”

The children had visited a fire station and learnt about the firemen’s ‘watches’ or rotating patterns of shifts.
The resources provided for the children included:
Wellington boots, wet play clothes, walkie-talkies, two telephones, white boards, musical instruments, uniforms and helmets, fire engine, keyboard, tables and chairs, plastic bottles, a selection of tools, torches, tubing an hoses, ladder. Flashing blue light, wall charts showing the rosters for the ‘watches’, coils of rope, notepads, tape recorded messages, large bricks, large notice board covered in children’s paintings of fire engines, signs and symbols, (for example keep clear, emergency exit, fire station, no entry, fire and rescue services).
Extracts from the observation:
Number 98 – there’s a fire down town.
What do we have to do today? (Using walkie-talkie to ask chief)
See if the road is busy.
(Playing the triangle and bells to alert to the fire. Writing on the whiteboards.
Number two fire. House number two.
Yes but what street? …
This is officer Bradley. Fire. Fire.
(Ssssssss) putting the fire out
Fire’s gone. I’ve saved the house ….
(Back in the control centre the chief is reporting:)
OK a robber has blown up the house.
We definitely need to go.
Go go go. We have to put our fire coats on cos we’re the ones going in.
And a safety hat. (Selects one with a visor).
Boss am I late?
We need you on a job.
I need a safety thing (harness)
So I don’t fall over.
(fire bell ringing again)
Dog stuck up a tree.
Job’s not for me – I go at night times. I’m blue watch.
You need your oxygen so you can breathe.
What is instantly clear from the above extract is that not only are the children developing transferable skills such as writing and ordering, they are drawing on the real–world knowledge that they have gained from popular TV programmes such as London’s Burning and their visit to the fire station. Combining this with their play knowledge, they show ‘new configurations and transformations in a co-constructed social context’ [23, p.25]. As well as the importance of the social interaction and co-operation between these two children, a moment’s reflection will suggest all the possible science links one could develop with the children from this kind of role play.
More recent neuroscience research has given us a clearer understanding of the significance of play on the developing brain and the impact of emotions on cognitive development. We are becoming more aware now of the importance of the affective dimension to teaching and learning.
From birth to age 5, children rapidly develop foundational capabilities on which subsequent development builds. In addition to their remarkable linguistic and cognitive gains, they exhibit dramatic progress in their emotional, social, regulatory and moral capacities. [15, p.7]
… Shortly after birth, children begin to learn about the world through their remarkable capacities to create their own knowledge from early experience. This inborn thrust is facilitated by the extent to which their environments provide opportunities and supports for growth. [12, p.27]
135
“Sustainable Management and Development of Mountainous and Island Areas”

Malaguzzi (1920-24), the first head of the municipal early childhood centres in the now, well known city of Reggio Emilia in Northern Italy advocated a ‘pedagogy of relationships’ and regarded children as:
autonomously capable of making meaning from experience ... and that ‘children’s self–learning and co-learning are supported by interactive experiences constructed with the help of adults. [20, p.139]
Conclusion
My argument is then, that far from treating the inclusion of science in an early years curriculum as a content driven body of knowledge, it can be used as a cross-curricular vehicle for fostering the development of positive dispositions. By including science in the curriculum through a play based approach and encouraging children to engage in their own problem solving and finding solutions, we develop their confidence. Recognising that they are, and must be active participants in their own learning reflects ‘the intrinsic human drive to explore…one’s environment’ [15, p.27].
Setting an appropriate context for science activities and encouraging scientific thinking involves posing real problems with children and engaging them in open ended enquiry rather than using the closed ‘I already have the answer in my head and you have to guess it’ kind of question. The research on sustained shared thinking makes it clear that children need to be involved in conversations in which they have a real voice. As I suggested at the beginning of this discussion, we often underestimate the reasoning capabilities of young children.
Through using science as a lens through which children can view and make sense of their world, I believe we can encourage the development of a sense of empathy and responsibility for the environment. Most importantly though, if we wish our children to develop empathic and respectful relationships with each other and our shared environment, we must begin by treating them with respect.
Learning is complex, but children are actively engaged in problem solving of their own making from birth. They are trying to make sense of, and participate in,
their social world and it is important not to underestimate children’s ability to understand.’ [20, p.104]
References.
[1] Anning A, Edwards A. Promoting Children’s Learning from Birth to Five. Buckingham, Open University Press; 1999.
[2] Carr M. Assessment in Early Childhood Settings. London, Paul Chapman; 2001.
[3] Dowling M. Supporting Young Children’s Sustained Shared Thinking. London, BAECE; 2005.
[4] Føjrtoft I, The Natural Environment as a Playground for Children. Early Childhood Education Journal 2001 29(2): 111-117.
[5] Foundation Stage Curriculum Guidance. DfES; 2000.
[6] Gopnik A, Meltzoff A, Kuhl P. How Babies Think. London, Weidenfield & Nicholson; 2000.
[7] Hurst V, Joseph J. Supporting Early Learning. Buckingham, Open University Press; 1998.
[8] Katz LG. What should young children be doing? American Educator 1988 (Summer): 29-48.
[9] Katz LG. Dispositions as a learning Goal. (www.eric.ed.gov) accessed 29.06.06.
[10] Laevers F. editor, The Leuven Involvement Scale for Young Children, Experiential Education Series, No. 1. Leuven: Belgium Centre for Experiential Education; 1994.
[11] National Curriculum. London, DfEE; 1988
[12] Nutbrown C. Threads of Thinking.London, Paul Chapman; 1999.
[13] Piaget J, Inhelder B. The Psychology of the Child. New York, Basic Books; 1969.
[14] Rickinson M, Dillon J, Teamey K, Young Choi M, Morris M Benefield PA, Review of Research on Outdoor Learning: Summary of Interim Findings. Reading: NFER; 2003
[15] Shonkoff J, Phillips D, From Neurons to Neighborhoods. New York: National Academy Publishers; 2000
[16] Swann,, R, in Waller, T, editor. An Introduction to Early Childhood, London, Sage; 2005.
[17] Sammons P, Sylva K, Melhuish EC, Siraj Blatchford I, Taggart B. EPPE Project, London, DfES; 2004
[18] Tamis-Lemonda, Katz, Bornstein, in Macleod, Brudenell A, editors, Advanced
136
“Sustainable Management and Development of Mountainous and Island Areas”

Early Years Care and Education, Oxford, Heinemann; 2004.
[19] Vygotsky LS. Thought and Language. New York, MIT Press; 1986
[20] Waller T, editor, An Introduction to Early Childhood. London, Sage; 2005
[21] Wells G. The Meaning Makers. London, Hodder & Staughton; 1987.
[22] Whitebread CINDLE Project, Cambridge; 2006
[23] Wood E. in Anning, Cullen, Fleer, editors. Early Childhood Education. London, Sage; 2004.
137
“Sustainable Management and Development of Mountainous and Island Areas”

Education and local rural development
Stilianos Tampakis Department of Forestry and Management of the Environment and Natural Resources,
Democritus University of Thrace, 193 Pantazidou Street, 68200 Orestiada, Greece.
E-mail: [email protected]
Georgios Tsantopoulos Department of Forestry and Management of the Environment and Natural Resources,
Democritus University of Thrace, 193 Pantazidou Street, 68200 Orestiada, Greece.
E-mail: [email protected]
afeiro Arabatzi Philologist, National Kapodistrian University of Athens
E-mail: [email protected]
Asteria Tsikna Chemist, MSc Environmental Quality, University of Bournemouth UK
E-mail: [email protected]
Abstract: In recent decades, agricultural productive activities show a constant decline both in Greece and abroad and nowadays constitute only one aspect of rural development. New productive activities and services have been developing in the countryside (production of non-food products, recreation, protection of the landscape and the environment in general). At the same time, the successive reforms of the CAP during the ‘90s have paved the way for a considerable expansion of agricultural land to be withdrawn from food production in order to be used for the production of wood. This paper studies the views of the citizens of the prefecture of Preveza concerning the region’s current and future development, in conjunction with their educational level. It also examines the existence of any relation between the local population’s socio-demographic characteristics and the investments being made in forest plantations. The research was conducted through the use of a questionnaire and by personal interview. The data analysis was performed by using the non-parametric Kruskal-Wallis and Mann-Whitney tests and the 2 test of independence. The interviewees are of the opinion that the present development of their region is based on industry and trade, but consider that forestry and cottage industry can play a leading role in its future growth. The study has also shown that investments in forest
plantations are dependent on gender, profession, income, education and age.
Keywords: Forest plantations, Non parametric tests, Rural development, Sociological research
1. Introduction
The accession of Greece into the European Economic Community (EEC) in 1981 and the implementation of the Common Agricultural Policy (CAP) resulted in an inflow of significant financial resources, an improvement of the producers’ level of income, a further intensification of production and an emphasized agricultural orientation of rural areas [2],[9].
Recently, the successive reforms of the CAP, the changing global environment imposed by the agreements of the World Trade Organization (WTO), the enlargement of the European Union (EU), the various food scandals, and the attempts to secure better prices for consumers have created a new state of affairs for agriculture and rural areas in general [13], [15].
European Union policies promote the countryside as an area dedicated to the preservation, protection and enhancement of the natural environment, cultural values and quality of life [2], [6], [18].
138
“Sustainable Management and Development of Mountainous and Island Areas”

Within the framework of the continuous CAP reforms, agri-environmental measures have been instituted, along with measures for early retirement, afforestation, and regulations for organic farming and livestock. The above-mentioned steps contribute to the transformation, differentiation and shift in the existing system of production and simultaneously highlight the multi-functional role of agriculture and of the countryside as a whole [3], [5].
The multi-functional role of rural areas extends beyond the role of agriculture to include other activities, such as the production of non-food products, recreation, the preservation, management and enhancement of the landscape, the protection, management and development of forests, and the protection of the environment.
The present research into the views of citizens concerning the multi-functional role of forests in rural Greece was a result of acknowledging their increasing significance in recent decades in relation to environmental, social and economic developments and changes. More specifically, the multifunctional role of forests (environmental, social, financial, developmental, cultural) is beginning to become more pronounced, along with the potentially multiple benefits they can offer to the local productive and social system and towards maintaining an environmental balance [11], [21], [22].
The objective of this study is to examine how the citizens of the prefecture of Preveza envisage the development of their region and to identify any relations between their socio-demographic characteristics and the investments being made in forest plantations.
2. Study area
According to information from the census of 2001, the prefecture’s population numbers 59,356 persons, which signifies an increase of 799 people compared to the previous census in 1991 [17]. The prefecture of Preveza covers a total area of 103,600 ha, 51.1% of which is covered by forests and forested land, 28.3% by agricultural land, and 14.1% by lowland pastures [16].
In 1990, the primary sector represented 25% of the GDP, the secondary sector accounted for 24% and the tertiary sector for 51.5%. In 2001, the percentage of the GDP from the primary sector gradually reduced to 12.9%, and there was a similar trend in the GDP share from the
secondary sector (18.4%). On the contrary, during the same period, the tertiary sector showed a significant increase, which resulted in the GDP share from this sector rising to 68.7% [1].
The prefecture offers substantial comparative advantages, such as its climate and natural resources (fertile agricultural land, meadows, lagoons), which means that the primary sector, but mainly tourism, can prosper at a very rapid rate and increase the local population’s level of income.
3. Research methodology
The questionnaire used in the present research mainly includes closed-type questions. The research was conducted using a structured questionnaire and the method selected was face-to-face interviews.
The “population” under study is the total number of households in the prefecture of Preveza. Simple random sampling presupposes the existence of a full list (sampling frame) of the population without omissions or repetitions [7]. The sampling framework used involved lists of consumers of household electricity. These lists were considered the most appropriate choice, since almost 100% of households in the region under study use electricity.
Using households is a classic example of using groups of people as a sampling unit, instead of individual persons. This is a preferred solution in certain cases, since it is a more convenient and less costly method [14]. The selection process for the respondents (from a household chosen at random) was organized in such a way that the same family member would not always be selected, i.e. the head of the family, his wife, etc. [7].
In order to estimate the population proportion that share a specific characteristic, we can proceed with the following admissions. If i in the unit sample has this characteristic we then write pi = 1; if it does not, we then write pi = 0.In this case, the estimated population proportion which is also the unbiased estimation of the actual population proportion ph is provided by the formula:
pp
n
ii
n
1
139
“Sustainable Management and Development of Mountainous and Island Areas”

The estimation of the variance of the population proportion s2
p and the standard error of the population proportion sp, without the correction of the finite population is small because of the sampling fraction:
sp p
np2
11
sp p
np
1
1The confidence interval for this proportion
can be taken from tables or special abacus, and can also be calculated with the help of the t-STUDENT value
p p t sp
where t = the value of the STUDENT distribution for probability (1- ) = 95% and n-1 degrees of freedom.
The sample size was calculated based on the simple random sampling formulae [10], [14]. Although simple random sampling without replacement was used, the correction of a finite population can be ignored because the size of the sample n is small compared to the size of the population .
Since the variables refer to proportions, the determination of the total sample size is provided by the formula:
nt p p
e
2
21( )
where p = the estimation of proportion t = the value of the STUDENT
distribution for probability (1- ) = 95% and n-1 degrees of freedom. Since the size of the conducted pre-sampling is large (over 50), the value t is taken from the probability tables of the normal distribution for the desired probability. In practice, for 95% probability the value is 1.96 [14].
e = the maximum admitted difference between the sampling mean and the unknown mean of the population. We accept that it is 0.05, i.e. 5%.
In order to calculate the size of the sample, we were obliged to conduct pre-sampling on a sample size of 50 persons. Thus, the population proportion (p) was calculated for each variable.
The use of a questionnaire is not restricted to estimating only one population variable, but more, which is why we need to estimate the sample size for each one of these variables. If the
estimated sample sizes are similar, and the size of all is within the financial means of the sampling, then the sample size selected is the maximum. In this way, the variable with the greatest variance is estimated with the desired precision, while the rest are estimated with a greater accuracy than was initially defined [14].
The variables “the region’s current development can be based on agriculture” and “the region’s future development can be based on livestock” presented the largest sample size, with a proportion of p=0.5, therefore 1-p= 0.5, which means that the sample size is:
nt p p
e
2
2
2
21 196 05 1 05
0 0538416
( ) , , ( , ),
,
We therefore accepted a sample size of 385 persons, which means that the other variables are calculated with greater accuracy with the specific sample size.
The households in the sample were then precisely identified (full name and address) using random numbers that we chose from random number tables. Face-to-face interviews were conducted in the selected households, with a member of the family that was selected at random. When the household occupants were not found or refused to answer, two more attempts were made to obtain their opinion. When this was not possible, we used the same procedure in order to select new sampling units. The data collection took place in 2002 and the statistical package SPSS was used to implement the Kruskal - Wallis and Mann – Whitney statistical tests.
4. Results
4.1. Development of the region
Apart from the basic production coefficients (natural resources, labour and capital), the basic determinants that affect the developmental process of a country or region are technology, the qualitative composition of its human resources, the skills of its public administration, entrepreneurship, market size, infrastructure, and the institutional framework [20].
The implementation of any large scale developmental programme becomes problematic, if not impossible, if a country does not possess a suitably trained and specialized labour force, capable of adapting to the new conditions of labour. Specialized educational institutes
140
“Sustainable Management and Development of Mountainous and Island Areas”

(Universities, Technical Colleges) prepare young people to take on this challenge. Education fulfils two basic objectives: a) it improves a person’s intellectual skills and his / her capacity to comprehend the world and make the best possible decision on every occasion and b) it conveys knowledge and skills to the younger generations, so that they can act effectively. Specifically, tertiary education provides the scientific and technological personnel that is used to staff not only all levels of education, but also all the sectors and mechanisms of society and economy. In addition, more than any other social institution, it determines the long-term prospects of economic progress, by exercising a timely influence on the developmental potential of a country or region [19], [20].
In the prefecture of Preveza, the existence of any relation was examined between the topics included in the sectors upon which the region’s development is based and the inhabitants’ educational level, with the use of the Kruskal – Wallis statistical test. Following the application of the statistical test, statistically significant differences emerge between the various levels of education and industry (x2= 7,999, BE=2, Asymp.sig=0,018) and trade (x2= 10,882, BE=2, Asymp.sig=0,004) (Table 1).
The Mann – Whitney statistical test was used to examine the relations between the various categories of variables for which the Kruskal – Wallis statistical test showed statistically significant differences.
Table 1. Results of the Kruskal – Wallis statistical test, between the current development of the region and the levels of education
Economic sectors Primary Secondary Tertiary Chi - Square Significance
Agriculture 110,19 99,46 101,86 1,519 0,467 Livestock 107,68 101,97 99,19 ,689 0,708 Forestry 111,03 97,93 104,42 2,199 0,333
Cottage industry 107,52 100,90 101,99 ,553 0,758 Industry 87,99 111,62 102,40 7,999 0,018
Commerce 83,67 107,84 117,36 10,882 0,004 Tourism 90,72 107,56 108,55 4,042 0,132
Table 2. Results of the Mann – Whitney statistical test
Economic sectors
Educational levels
MeanRank Mann-Whitney U Significance
Commerce Primary 47,30 Tertiary 55,99
822,00 0,001
Commerce Primary 69,50
Secondary 88,19 2320,00 0,009
Industry Primary 69,64
Secondary 88,12 2328,00 0,006
Table 3. Results of the Kruskal – Wallis statistical test, between the region’s future development and the levels of education
Economic sectors Primary Secondary Tertiary Chi -
Square Significance
Agriculture 104,88 104,21 97,53 0,597 0,742 Livestock 110,20 101,08 97,93 1,544 0,462 Forestry 100,37 97,12 120,78 5,474 0,065 Cottage industry 97,37 98,04 122,58 6,430 0,040
141

Industry 108,34 103,88 93,67 1,865 0,394 Commerce 99,92 105,48 101,16 0,459 0,795
Tourism 98,84 105,54 102,47 0,672 0,715
Table 4. Results of the Mann – Whitney statistical test
Economic sectors Educational levels Mean Rank Mann-Whitney U Significance
Cottage industry Primary 45,77 Tertiary 58,06
943,50 ,031
Forestry Primary 46,64
Tertiary 56,88 994,00 0,006
Table 5. Relation between gender and investments in forest plantations
Forest plantations Total No Yes
Male 50,8% 57,9%
49,2%70,3%
100,0% 63,4%
Gen
der
Female 64,0% 42,1%
36,0%29,7%
100,0% 36,6%
Total 55,6% 100,0%
44,4%100,0%
100,0% 100,0%
Pearson Chi-Square=6,57, =1, Sig=,046
The Mann – Whitney statistical test was applied between the levels of education (“primary”, “secondary” and “tertiary”) and the variable: the development of the region is based on industry and trade. Thus, statistically significant differences exist between the educational levels “primary” and “tertiary” and the variable “the development of the region is based on trade” (U= 822,000, Asymp.sig=0,001) (Table 2). Specifically, mostly tertiary education graduates believe that their region’s development is based on trade rather than primary education graduates. In addition, statistically significant differences arise between the educational levels “primary” and “secondary” and the variables, the development of the region is based on industry (U= 2.328,000, Asymp.sig=0,006) and trade (U= 2.320,000, Asymp.sig=0,009) (Table 2). In addition, secondary education graduates believe that the development of their region is based on the above-mentioned sectors rather than primary education graduates.
The interviewees with the highest educational level believe that the tertiary sector and primarily trade has contributed to the region’s development. Similarly, the interviewees with a medium educational level
believe that both industry and trade have contributed to local development.
During the whole post-war period, the primary sector has been following a downward trend regarding its share of total employment. On the other hand, the tertiary sector has more than doubled its percentage, while the secondary sector is now showing a decline, after following a steady uphill course in recent years. The above-mentioned facts show that there is a major outflow of labour forces mainly from the primary to the tertiary sector, a fact which indicates that economic development is now more dependent on trade and services rather than on the industrial sector. Furthermore, the declining course of Greek agriculture and the downgrading of the farming profession have resulted in directing particularly the young people in rural areas towards professions in the tertiary sector [12], [20].
The Kruskal – Wallis statistical test was used to study the existence of any relation between the topics included in the sectors upon which the region’s future development is based and the inhabitants’ educational level. Statistically significant differences were observed between the various levels of education in relation to cottage industry (x2= 6,430, BE=2,
142
“Sustainable Management and Development of Mountainous and Island Areas”

Asymp.sig=0,04) and forestry (x2= 5,474, BE=2, Asymp.sig=0,065) ) (Table 3).
The Mann – Whitney statistical test was then used to examine the relations between the various categories of variables for which the Kruskal – Wallis statistical test showed statistically significant differences. The Mann – Whitney statistical test was applied between the levels of education (“primary”, “secondary” and “tertiary”) and the variables: the future development of the region will be based on cottage industry and the future development of the region will be based on forestry. Thus, statistically significant differences exist between the educational levels “primary” and “tertiary” and the variable, the future development of the region will be based on cottage industry (U= 943,500, Asymp.sig=0,031) ) (Table 4). In particular, more tertiary education graduates believe that their region’s growth will be based on cottage industry rather than primary education graduates. It appears that the cottage industry sector, with its small family businesses, will contribute to the future development of the region, according to the views of the tertiary education graduates. This sector, mainly cottage industry linked with agricultural products, has progressed considerably in recent years, mostly due to the numerous problems that producers face in selling their products; as a result, some of them have resorted to establishing small manufacturing businesses for their own products.
Furthermore, statistically significant differences exist between the educational levels “primary” and “tertiary” and the variable, the future development of the region will be based on forestry (U= 994,000, Asymp.sig=0,006) ) (Table 4). Specifically, more tertiary education graduates believe that their region’s growth will be based on forestry rather than primary education graduates. These people are of the opinion that forests will play a vital role not only in boosting rural economic development but mainly in providing indirect benefits (recreation, aesthetic pleasure, preservation of the water balance, environmental protection).
4.2 The characteristics of those who invest in forest plantations
Many European countries, particularly after WWII, have carried out major afforestation programmes in order to cover their needs in wood and its products. In the European Union in
particular, the reforms of the Common Agricultural Policy in 1992 and 1999 created the preconditions and a favourable financial climate for the establishment of forest plantations on agricultural land, primarily by professional farmers [3][4].
Taking into account the leading role that forestry is expected to play in the future development of the prefecture of Preveza, a study was made into the relation between individual characteristics (gender, profession, income, education and age) and investments in forest plantations.
A systematic correlation was found to exist between “gender” and investments in forest plantations. Men are most often those who invest in forest plantations rather than women (X2
Pearson=6,57 with 1 degree of freedom, significance level <0,046) (Table, 5). Most owners of agricultural land and the majority of those who manage agricultural establishments are men, which means that they are the ones who will ultimately take the final decision about the crops they will establish.
There is also a systematic correlation between “profession” and investments in forest plantations. It was found that farmers mostly tend to invest in forest plantations (X2
Pearson=16,87 with 16 degrees of freedom, significant level <0,05) (Table, 6). The farmers are the ones who are directly related and dependent on agricultural land, which means it is easier for them to decide about alternative possibilities for its exploitation.
143
“Sustainable Management and Development of Mountainous and Island Areas”

Table 6. Relation between profession and investments in forest plantations Forest plantations Total No Yes
Farmer 39,4% 22,8%
60,6% 44,0%
100,0% 32,2%
Does housework 58,8% 17,5%
41,2% 15,4%
100,0% 16,6%
Private Employee 73,1% 16,7%
26,9% 7,7%
100,0% 12,7%
Civil Servant 84,2% 14,0%
15,8% 3,3%
100,0% 9,3%
Self-Empl (trade, plumb etc) 54,8% 20,2%
45,2% 20,9%
100,0% 20,5%
Self-Empl (Doctor, law etc) 53,3% 7,0%
46,7% 7,7%
100,0% 7,3%
Prof
essi
on
Artisan/entrepreneur 66,7% 1,8%
33,3% 1,1%
100,0% 1,5%
Total 55,6% 100,0%
44,4% 100,0%
100,0% 100,0%
Pearson Chi-Square=16,87, =6, Sig=,010
A systematic correlation also exists between “income” and investments in forest plantations. People with a lower income tend to invest in forest plantations. In addition, as the level of income rises, the number of those who invest in forest plantations drops (X2
Pearson=8,92 with 3 degrees of freedom, significance level <0,05) (Table, 7). It is usually farmers who have the lowest income, therefore it is logical that they would be more likely to establish forest plantations.
A systematic correlation also exists between the “educational level” and investments in forest plantations. It was observed that primary education graduates invest more frequently in forest plantations. The percentage of secondary education graduates is slightly lower, while the percentage of tertiary education graduates is
very small (X2 Pearson=19,47 with 2 degrees of freedom, significance level <0,001) (Table, 8). Most of the primary education graduates are farmers, therefore it is easier for them to invest in forest plantations compared to graduates of other levels.
A systematic correlation also exists between “age” and investments in forest plantations. It was found that young people mostly invest in forest plantations. Furthermore, as the age increases, the frequency of those who invest in forest plantations decreases (X2 Pearson=19,47 with 2 degrees of freedom, significance level
<0,05) (Table, 9). Young people usually prefer to invest in forest plantations, because it involves a long-term investment, since these plantations have a long rotation period.
Table 7. Relation between income and investments in forest plantations Forest plantations Total No Yes
<2.300.000 47,6% 35,1%
52,4% 48,4%
100,0% 41,0%
Inco
me
2.300.000-4.200.000 54,2% 28,1%
45,8% 29,7%
100,0% 28,8%
144
“Sustainable Management and Development of Mountainous and Island Areas”

4.200.000-6.500.000 60,5% 22,8%
39,5% 18,7%
100,0% 21,0%
>6.500.000 84,2% 14,0%
15,8% 3,3%
100,0% 9,3%
Total 55,6% 100,0%
44,4% 100,0%
100,0% 100,0%
Pearson Chi-Square=8,92, =3, Sig=0,03
Table 8. Relation between education and investments in forest plantations Forest plantations Total No Yes
Primary 32,8% 16,7%
67,2% 42,9%
100,0% 28,3%
Secondary 60,6% 55,3%
39,4% 45,1%
100,0% 50,7%
Educ
atio
n
Tertiary 74,4% 28,1%
25,6% 12,1% 100,0%
21,0%
Total 55,6% 100,0%
44,4% 100,0%
100,0% 100,0%
Pearson Chi-Square=19,47, =2, Sig=0,000
Table 9. Relation between age and investments in forest plantations
Forest plantations Total No Yes
18 - 33 64,0%56,1%
36,0%39,6%
100,0% 48,8%
34 - 49 53,1%29,8%
46,9%33,0%
100,0% 31,2%A
ge
> 49 39,0%14,0%
61,0%27,5%
100,0% 20,0%
Total 55,6%100,0%
44,4% 100,0%
100,0% 100,0%
Pearson Chi-Square=7,58, =2, Sig=0,023
5. Conclusions
A country’s development does not only depend on the natural capital that the country invests in its economy, but also on the knowledge and skills of its labour force. As a rule, a higher level of education provides people with the necessary tools to arrive at the best possible decisions.Depending on their educational level, the interviewees in the prefecture of Preveza present different views concerning the current development of their region. The higher the educational level of those questioned, the higher they place the tertiary sector, and particularly trade, on their list of determining factors.
There is also a differentiation of views concerning the future growth of the region, which is related to the level of education. The cottage industry sector, which is a sector that is inextricably linked to primary production, and the forestry sector with its multifunctional role, are at the top of the list of activities that will affect the region’s future development according to the views of the tertiary education graduates who were interviewed.
This viewpoint seems to have been further enhanced by the investments in forest plantations which have been made in recent years, primarily by men, young farmers by profession, of a low educational and income level.
145
“Sustainable Management and Development of Mountainous and Island Areas”

6. References
[1] All Media. The Economic and Social Physiognomy of the 52 Prefectures and 13 Regions. thens; 2004.
[2] Anthopoulou Th. Geographical Differentiations, Territorial and Social Restructuring of Rural Areas. In: From Rural Space to the Countryside. Athens: Gutenberg Publications; 2001.p. 103-147.
[3] Arabatzis G. European Union, Common Agricultural Policy (CAP) and the Afforestation of Agricultural Land in Greece. New Medit, Mediterranean Journal of Economics, Agriculture and Environment 2005; 4: 48-54.
[4] Arabatzis G. The Personal and Social Characteristics of Investors - black Locust Cultivators and the Factors that Affect the Size of Black Locust (Robinia pseudoacacia L) Plantations According to Regulation EEC/2080/92. Geotechnical Scientific Issues; 14(2): 5-14.
[5] Damianos D, Dimara E, Skouras D. Alternative Production Activities in less Developed Rural Regions, Journal of Social Research, 1997; 92: 151-81.
[6] European Commission. urope 2000+ Collaboration for Urban Planning in Europe.
russels;1995. [7] Filias V, Pappas , Antonopoulou ,
Zarnari , Manganara , Meimaris ., Nikolakopoulos I, Papachristou ,Perantzaki , Sampson , Psychogios, .Introduction to the Methodology and Techniques of Social Research. Athens Gutenberg Social Library; 1996.
[8] Forest Service of Preveza. Final Review of Projects and Activities. Preveza 2003.
[9] Gousios D. Territorial Approach of the Organization and Development of the Countryside. Spatial Systems in Small Towns. In: From Rural Space to the Countryside. Athens: Gutenberg Publications; 2001. p. 149-179.
[10] Kalamatianou . Social Statistics, One-dimensional Analysis Models. Athens: To Oikonomiko Publications; 1997.
[11] Kassioumis K, Papageorgiou K, Christodoulou A, Blioumis V, Stamou N, Karameris A. Rural Development by Afforestation in Predominantly Agricultural Areas: Issues and Challenges from two
Areas in Greece. Forest Policy and Economics 2004; 6: 483-496.
[12] Maravegias . Greek Agriculture towards 2010. Athens: Papazisis Publications; 1999.
[13] Mardas D. From the EEC to the EU. Thessaloniki: Zygos Publications; 2005.
[14] Matis . Forest Sampling. Assets Exploitation and Management Society. Xanthi: Democritus University of Thrace; 2001.
[15] Mattas . Policy of the European Union and other International Organizations. Thessaloniki: Aristotle University Press; 2000.
[16] NSSG. Distribution of the Land according to Basic Categories of Use. thens; 1995.
[17] NSSG. Results of Population Census. thens; 2003.
[18] Papadopoulos . Rural Restructuring and Agriculture: Towards a Political Economy of Rural Space”. In: Critical Approaches towards Development and Rural Environmental Protection, L. Louloudis and N. Beopoulos (editors), Athens: Stochastis Publications; 1999 p.30-58.
[19] Pesmazoglou S. Education and Development in Greece 1948-1985. Athens: Themelio Publications; 1987.
[20] Saiti . ducation and Economic Development. Athens: Typothyto Publications, Georgios Dardanos; 2000.
[21] Slee B, Snowdon P. Rural Development Forestry in the United Kingdom. Forestry 1999; 72: 273-84.
[22] Slee B, Wiersum KF. New Opportunities for Forest-Related Rural Development. Forest Policy and Economics 2001: 3:1-4.
146
“Sustainable Management and Development of Mountainous and Island Areas”

Nesting habitat selection of the black stork (Ciconia nigra)in Dadia National Park, northeastern Greece.
Efstathios P.Tsachalidis Department of Forestry and Management of the Environment and Natural Resources,
Democritus University of Thrace, Pantazidou 193, GR-68200 Orestiada, Greece. [email protected]
Konstantinos Poirazidis Department of Forestry and Management of the Environment and Natural Resources,
Democritus University of Thrace, Pantazidou 193, GR-68200 Orestiada, Greece. [email protected]
Abstract. Dadia National Park, in northeastern Greece is known for its considerable species diversity of breeding avifauna. The selection of nesting microhabitat of the black stork Ciconia nigra was studied in order to promote its long-term conservation. Data collected on 23 nest-site variables, describing the landscape and vegetation structure of the habitat. The black stork nested at lower altitudes, near cultivations and near human settlements. This species nested in loose mature forests with big trees with greater height of canopy, greater nest-tree DBH. As conservation-management guidelines we recommend the preservation of small groups of old forest with sparse canopy and the creation of small wetlands at the lowlands.
Keywords. Ciconidae, conservation, forest management, habitat selection.
1. Introduction
Forest management has a major impact on wildlife populations by influencing habitat structure, resource availability and populations of interacting species [14], [32]. Deforestation or intensive forest exploitation - though less obvious in temperate zones –threaten specialist species depending on trees or forests to breed [43]. As a group of high political concern, birds are subject to conservation plans for those species facing an unfavourable conservation status at an European scale [42] and special attention should be paid by nations to design Special Protected Areas (SPAs) for those species listed in Appendix 1 of the Directive of the Council of the European Community on the
Conservation of Wild Birds (Directive 79/409/CE).
Management decisions should seriously consider the habitats of forest-nesting birds being sensitive in forest management [8], [22], [23]. Appropriate knowledge reduces conflicts between forest management and conservation of birds [24], leading to suitable decisions towards the protection of the biological diversity and fundamental processes of the forest systems [31].
As almost all large bird species, storks are declining world-wide: 15 of 19 species are considered as regionally threatened [7]. The exact causes for the regression differ by species, but they comprise habitat loss, excessive use of pesticides and direct exploitation by man [42]. In many cases, too little is known on species-specific ecological requirements to help with defining efficient conservation measures. The black stork is a large and rare bird, which breeds mainly in the undisturbed forests of temperate Eurasia [7]. This species has historically gone extinct or suffered sharp declines in large areas, and forest destruction and degradation are considered its major threats [30]. In addition, habitat changes, especially the loss of wetlands and the use of pesticides in wintering grounds in Africa contribute to the population decline [11]. In Greece, black stork has been declined in most of its distribution and is listed in the Red Data Book as endangered species. Existing data suggest that this species was scarce or uncommon even during the 19th century [12]. Today black storks nest in Thrace, Macedonia, Ipeiros and as far south as northern Thessaly, as well as on the island of Lesvos. The total breeding population estimated at 30-40 pairs [42] but it is probably at least 50-80 pairs. In Dadia
147
“Sustainable Management and Development of Mountainous and Island Areas”

National Park (hereafter Dadia NP) the stronghold area of this species in Greece, the black stork showed a small positive increase during 2001-2005, starting with 25 pairs in 2001 and reaching 30 pairs in 2005.
Dadia NP is known for its rich biodiversity [1], [10], [13], [16]. Particularly high number of breeding raptor species (18-20, of which 12 are tree-nesting); some in large populations occur in the area [10], [27], [28]. Over the last decades, rotational timber exploitation applied in a large part of Dadia NP has resulted in alterations of forest diversity, stand structure and size class composition, affecting temporally and spatially many of the nesting sites of the raptors and other protected species like black stork [1], [27].
In this paper, we analyze nest site preferences for the black stork population in Dadia NP. The breeding sites of the species have been quantitatively described in north-eastern Europe [9], [18], [39], [40] but none relative study has been carried out in the southern of the European distribution of the species as well as in Greece.
2. Study area and methods
The study area, the Dadia NP, is situated in the Evros Prefecture, north-eastern Greece (40°59 to 41°15 N, 26°19 to 26°36 E). In 1980, it has been declared a reserve and in 2003 a National Park. It constitutes of a forest complex extending 432.86 km2, including two zones of strict protection (core areas) covering a total of 72.93 km2 (Fig. 1). The study area is characterized by valleys of extensive oak and pine forests, and includes a variety of other habitats such as cultivations, pastures, torrents and stony hills. Elevation ranges from 20 m to 640 m and the climate is sub-Mediterranean.
Figure 1. Map of the study area
All occupied territories and as many active nests as possible were located by systematic surveys (1999 to 2001). In cases when nest sites were not found, other observations such as food or nest material transportation, landing to suitable forest area or repeated display flights, were considered to locate the centre of a territory [4], [37]. Nest-site characteristics were only measured at the active nest sites found in 2001 to avoid pseudo-replication by including more than one nest sites from the same pair in the analysis [36].
Nest-site characteristics were described by measuring a total of 26 nest-site variables that were separated in two groups describing the topographical (horizontal) and vegetation (vertical) structure of the nesting habitat (Table 1).Topographical variables were geomorphologic and distances of nest sites from sources of disturbance and environmental characteristics (see also [2], [20]. Vegetation variables included characteristics of nest-tree and stand structure in a circular area of 0.1 ha (radius 17.85 m) centered at each nest [35]. Mean canopy cover and height of the canopy were estimated visually by averaging the measurements of four canopy cover estimates (facing to north, east, south and west) around nest-sites. All topographical variables were measured from the Geographic Information System (GIS) through a special designation made for the study area in 2001 [29]. Geomorphologic variables of altitude, slope and aspect were created using the Spatial Analyst extension from the ArcGIS software (ESRI) and calculated at the nest site (0.1 ha). Aspect was transformed into north/south and east/west components using cosine and sine, respectively. Measurement of habitat variables in the field was made at the end of the breeding season after the nestlings had fledged to avoid disturbance.
Random sampling was conducted throughout the study area. The positions of samples were determined by the GIS and identified in the field using a Global Position System (GPS). The sampling was carried out of most of the forest areas (also in a younger forested area where trees had a mean DBH > 15 cm) without a pre-selection of representative or typical raptor nesting habitats [41]. Because the spatial variability in forest structure and in other environmental variables the number of random samples was calculated according to the stabilization of the variance on the measurement variables. For most of them this was succeeded
0 2 4 6 8 101 Km ±
Greece
Turkey
Bulgaria
AlbaniaTurkeyF.Y.R.O.M
Border of Greece
Dadia NP borderCore areas
148
“Sustainable Management and Development of Mountainous and Island Areas”

with a number of 70 samples (accuracy ± 20% and significance level p = 0.05).
Statistical analysis: The regularity in nest spacing was tested with the G-statistic calculated as the ratio between the geometric mean and the arithmetic mean of the squared nearest neighbour distances between the nests. This index ranges from 0 to 1, where values close to 1 (> 0.65) indicate uniform distribution of nests [5]. When an active nest was not found, the centre of the active territory was used instead.
To identify the habitat characteristics selected by the stork, comparisons were made between the variables measured at the nest-sites and the respective at the random samples. Each data set was tested for normality as a total with the Kolmogorov-Smyrnov test. All variables of distances and tree-numbers in all diameter classes were transformed into square roots. The variable “canopy cover”, being a percentage, was arcsine-transformed. The variables “number of trees in diameter class 36-48 cm” and “number of trees in diameter class 48-80 cm” normalized when combined in one category.
Data were analysed in two steps. At first a bivariate correlation test (r > 0.6) was performed to check for strong correlations between variables. For each pair of highly correlated variables, the variable retained for analysis was the one with the greatest among-group variance or ease of ecological interpretation [19]. At the second step, univariate one-way ANOVA models were performed to check for significant difference in each of the remaining variables.
3. Results
During the two-year study, 23 territories of black stork recognized with a nearest neighboring distance 1.820 ± 1.307 m (mean ± sd) and range 347 – 4.945 m. The density of the population was 5.1 territories / 100 km2. Based on the values of the G-test, an irregular (clumped) nest distribution was observed for the black stork (G = 0.39).
The black stork nested at lower altitudes, compared with these available in the random samples and used all those available slopes (Table 1). Regarding the exposure the species nested more at the south – southwest orientations although this was not significant (Fig. 2).
Figure 2. Distribution of the black stork nest sites and random plots according to the slope exposure.
The black stork showed a preference in nesting near cultivations and also near villages and other settlements but the analysis didn’t reveal a significant difference from random samples regarding nest distances from forest openings and main streams (Table 1).
Table 1. Mean and SD (range) estimates of topographical variables for the black stork and random locations. Univariate differences between stork and random locations were tested by means of ANOVA: * p < 0.05; ** p < 0.01; *** p < 0.001
The black stork generally used big trees for nesting. The mean DBH of the nesting tree was found 56 cm and it was highly significant bigger than that in random samples indicating the importance of this parameter in its nest-site selection. The selection of the biggest tree for nesting in the area of 0.1 ha was also highly significant (Table 2). The nest-tree heights
Black stork(n=16)
Random locations(n=70)
Topographical variables
Elevation (m)102.9 ± 70***
(40 - 288)215.37 ± 82.45
(50 - 476)
Slope (degrees)13.2 ± 5.8
(6 - 24)15.19 ± 6.69
(1 - 41)Disturbance variables
Distance from villages (m)†3373.3 ± 2417.1*(784.9 - 9210.3)
4992.1 ± 3103.1(498.8 - 12396.9)
Distance from other settlements (m)†2409.3 ± 1341.4**(742.8 - 5757.3)
4873.2 ± 3447(261.6 - 13261.9)
Distance from paved roads (m)†1155.5 ± 1018.5(130.2 - 3317.1)
1704.6 ± 1116.8(16.8 - 4198.4)
Distance from unpaved roads (m)†191.8 ± 87.4(65.8 - 363.6)
169.02 ± 152.2(8.3 - 747.2)
Distance from cultivations (m)†736.7 ± 1304.2***
(22.3 - 4362.1)1646.6 ± 1719.2
(11 - 6423.3)Ecological variables
Distance from forest openings (m)†274.6 ± 299.8(35.2 - 1209.1)
451 ± 419.6(10.5 - 1716.2)
Distance from main steams (m)†1075.1 ± 724.6(44.6 - 2151.2)
982.2 ± 687.6(10.9 - 3417.2)
† Anova test performed on the variable transformed
Black stork
-5.00%
5.00%
15.00%
25.00%
35.00%
N
SE
S
SW
W
NW
Í
-5.00%
5.00%
15.00%
25.00%
35.00%
Total areaRandom pointsN
SE
S
SW
W
NW
149
“Sustainable Management and Development of Mountainous and Island Areas”

ranged 5-27 m but most pairs nests on trees 14-16 m high and the selection of tall nest-trees was significant in the black stork. The mean height of tree canopy was at black stork nests as 9.4 m and the height of tree canopy was also a characteristic that was selected by the species (Table 2).
Table 2. Mean and SD (range) estimates of vegetation variables for the black stork and random locations. Univariate differences between stork and random locations were tested by means of ANOVA: * p < 0.05; ** p < 0.01; *** p < 0.001
The black stork nested in forest areas with a significantly lower total number of trees than this found in the random samples. The number of trees with small diameters (8-20 cm) around nests was significantly lower than in random samples. The number of trees with medium diameters (22-34 cm) around nests was also significantly lower in black stork than in random samples (Table 2). In contrast, regarding the number of trees with the greatest diameters (36-80 cm), that is the presence of mature forest around nests, were significantly higher in black stork nests. The preference of the species for nesting in sparse forests but where more mature
trees occurred resulted in a mean DBH of trees around nests being significantly higher than in random samples (Table 2). The canopy cover was insignificantly different in the nesting area compared with the random samples suggesting that this characteristic did not affect its nest-site selection.
4. Discussion
4.1. Spatial distribution of nests
The birds establish a minimum area around nest site that is defended against intruders of the same species and other species in general [21], [37]. Forced by intra- and interspecific competition many species space their nests regularly usually reflecting a regular distribution of food resources [21], [37]. When the available nest-sites are limited or the distribution of the suitable habitats is uneven these birds nest in shorter or longer distances than these they would select according to their needs and there are irregularities in the spacing of nesting places [21], [37]. High habitat preferences may lead to clumped bird dispersions [37] and this may has mostly defined nest spacing in the black stork (G= 0.39) in our area. Black stork used mainly arable fields and wetlands for foraging in Dadia forest that are limited in the study area [1], [2] and as consequently the establishment of the nesting sites are close to these habitats. In a distance of 3 km in the middle of the study area 12 black stork pairs of an 16 km2 area (as determined by minimum convex polygon by the nest location) breeding successfully benefited from the proximity of suitable foraging habitat. This species seem to have reduced the intraspecific competition for best exploiting their preferred habitats.
4.2. Nest site selection
Geomorphological habitat characteristics seem to be the most important for a variety of animal species, especially in areas with varying terrain [25]. Preference of nesting of the black stork in low altitudes was rather related to the vicinity of their foraging areas (cultivations, open water areas with streams) being absent in higher altitudes [1], [29] and may not necessarily reflect an adaptation of nesting near human settlements expected to have developed at low altitudes. Slope is one of the most important
Black stork(n=16)
Random locations(n=70)
Nest-tree characteristics
Diameter Breast Height (DBH) (cm) 55.7 ± 10.3***
(40 - 74)26.9 ± 9.6(16 - 58)
Max DBH on random plots a42.9 ± 10.5
(22 - 67)
Nest-tree height (m)16.1 ± 5.2**(5.5 - 25.3)
13.4 ± 3.9(5 - 27.1)
Height of tree canopy (m)8.2 ± 2.9***(5.3 - 17.8)
5.1 ± 2.3(1.7 - 12.1)
Nest height from the ground (m) b8.4 ± 2.2
(4.2 - 12.8)
Stand structure characteristics (0.1 ha)
Total number of trees (> 8 cm) †39.4 ± 22.1***
(9 - 80)76.2 ± 44.6(13 - 230)
Number of trees in diameter class 8-20 cm †26.9 ± 19.2**
(0 - 60)58.1 ± 43.8
(1 - 220)
Number of trees in diameter class 22-34 cm †5.7 ± 3.5**
(1 - 13)13.7 ± 10.9
(1 - 66)
Number of trees in diameter class 36-80 cm †6.7 ± 2.7*
(2 - 12)4.4 ± 4.4(0 - 22)
Mean DBH in plot (cm)26.9 ± 8.9***
(16.8 - 48)20.9 ± 34.4(14.7 - 34.4)
Canopy cover ‡74.3 ± 19.6(45 - 100)
57.9 ± 21.6(15 - 100)
a Measured only in the random locationsb Measured only in the species† Anova test performed on the variable ? transformed‡ Anova test performed on the variable arcsin
150
“Sustainable Management and Development of Mountainous and Island Areas”

factors affecting nest site selection for many bird species [34], [38]. Despite the potential advantages for the black stork of nest accessibility and visibility around a nest site situated in areas with steep slopes, this characteristic was not selected by this species. This was possibly due to the limited availability of steep areas, once these with slope > 20° occur mainly at the central and southwest parts of the area constituting less than 14% of the area [29].
We attribute the lack of statistical relationships between the distance of nesting sites from forest openings and the respective measurement in the random samples to a great availability of forest openings due to an extensive heterogeneity of vegetation types and ground cover forms, especially in the lowlands [29]. Forest openings and streams are important as habitats favouring high densities of reptiles, amphibians [13] and small fishes are being prey types of prime significance for the black stork in the Dadia National Park. The lack of significant relationships between random samples and each, the distance of nests from forest openings and central streams, respectively in the black stork it is possible to be the effect of studied scale. The storks can move in considerable distances to collect prey especially in the late stages of nestlings’ growth when water surfaces reduce due to evaporation [15]. The black stork has been characterized as a forest-interior bird, preferred to nest in a certain distance from edge [18] although in other places it breeds very close to forest edges [33]. This may be due to a trade-off between distance to foraging sites and predation risk or disturbance at edges [18].
Nesting of the black stork near human settlements may be related to the occurrence of water for longer periods in the lowlands used for the cultivations. Many species can afford near nests human disturbance of low intensity and duration but avoid areas of intensive human activities [2], [3], [26]. In Dadia NP most of the black storks did not seem to avoid nesting relatively close to human structures that is near potential disturbance sources. In contrary to other breeding areas in Europe where the stork preferred large undisturbed forest [18] being vulnerable to forestry-related disturbance [32], in our study area it attracted from anthropogenic edges offered more foraging opportunities. It seems that the quality of the foraging areas play an important role for the maintenance of a good population in one area [17].
The black stork nested on trees with the greatest DBH reflecting its need for mature trees to support the big nests it construct [6]. Of the characteristics of the vegetation variables, the occurrence of mature forest around nests was the most important factor for the black stork. The presence of mature forest probably gives the possibility of the storks to construct nests on different mature trees in subsequent years and this has been noted few times to black stork. Several studies have similar results showing that most black storks are on the largest trees of the stand [9], [32], [39]. The canopy height above ground reflecting the openness of the interior of forest areas where they nest was important to this species. This species preferred to establish the nest sites in loose forest with high height canopy. Nesting in mature loose forests and at a great nest height from the ground facilitates nest access, a good visibility around nest site for protection against predators and the height of the canopy as well as the canopy closure may reflect a balance between nest accessibility and concealment [32].
Habitat selection proceeds in a stepwise fashion where the various criteria of selection are hierarchically ordered [24]. According to our results, the black storks in Dadia National Park were initially segregated by distance to foraging areas. In their breeding territories the birds were selective to the microhabitat, choosing forest structures and nest-tree characteristics that probably maximize breeding success.
4.3. Management proposals
In order to protect this remarkable species, special management measures are needed to retain the nesting habitat along the years.
1) In the forest management area of the National Park small groups of mature forest with loose density and sparse intermediate canopy must be preserved. The most favourable management for the black storks in the area is the logging of small tree groups which at areas creates small groups of similar aged forest classes.
2) Based on the mean DBH, the forests become suitable for nesting of storks after the age of 50-60 years. Thus, at any stage of the forest management, tree groups of at least this age, in various positions and distant of at least 300-500 m must be preserved in the management stands.
151
“Sustainable Management and Development of Mountainous and Island Areas”

3) Isolated trees above 80 years old must be preserved in all stands especially when occurring in closed forest because they bear the most important characteristics that are selected by the storks.
4) The dispersion of the suitable nesting habitats in order to become available for more new pairs.
5) The creation of small wetlands in the forested area will benefit black stork.
5. Acknowledgements The research of Kostas Poirazidis was
supported by the research project “EPEAEKII - PYTHAGORAS II: 1329-1”, co-funded by the European Social Fund & National Resources. We are very grateful to WWF-Greece for the continuous support and to T. Skartsi, K. Pistolas, P. Babakas and D. Kostovska for help in the fieldwork.
6. References
[1] Adamakopoulos T, Gatzoyannis S, Poirazidis K. Study on the assessment, the enhancement of the legal infrastructure and the management of the protected area in the forest of Dadia. Specific Environmental Study, WWF-Greece, Athens;1995.
[2] Andrew J.M, Mosher J.A. Bald eagle nest site selection and nesting habitat in Maryland. Journal of Wildlife Management 1982; 46: 383-390.
[3] Anthony R.G, Isaaks F.B. Characteristics of Bald Eagle nests in Oregon. Journal of Wildlife Management 1989; 53: 148-159.
[4] [10] Austin G.E. The distribution and breeding performance of the buzzard Buteo buteo in relation to habitat: an application using remote sensing and geographical information systems [dissertation]. University of Glasgow; 1992.
[5] Brown D. A test of randomness of nest spacing. Wildfowl 1975; 26: 102-103.
[6] Cramp S, Simmons K.E.L, editors. The Birds of the Western Palearctic, Oxford University Press; 1980.
[7] Del Hoyo J, Elliot A, Sargatal J, editors. Handbook of the Birds of the World, Vol 1. Lynx Editions, Barcelona, Spain; 1992.
[8] Donazar J.A, Blanco G, Hiraldo F, Soto-Largo E, Oria J.. Effects of forestry and other land-use practices on the
conservation of Cinereous Vultures. Ecological Applications 2002;12(5): 1445-1456.
[9] Drobelis E. On the biology and protection of the black stork in Lithuania. Acta Ornithologica Lithuanica 1993; 7-8: 94-99.
[10] Hallmann B. Guidelines for the conservation of birds of prey in Evros. IUCN/ WWF; 1979.
[11] Hancock J, Kushlan J.A, Kahl M.P. Storks, Ibises and Spoonbills of the world. Academic Press, London; 1992.
[12] Handrinos G, Akriotis T. The birds of Greece. Christopher Helm, London; 1997.
[13] Helmer W, Scholte P. Herpetological research in Evros, Greece: Proposal for a biogenetic reserve. Research Institute for Nature Management, Arnhem and Department of Animal Ecology, Catholic University, Nijmegen; 1985.
[14] Hunter M. Maintaining Biodiversity in Forest Ecosystems. Cambridge University Press, Cambridge, UK; 1999.
[15] Jiquet F, Villarubias S. Satellite tracking of breeding black storks Ciconia nigra: new incomes for spatial conservation issues. Biological Conservation 2004; 120: 153-160.
[16] Kati V, Devillers P, Dufrene M, Legakis A, Vokou D, Lebrun Ph. Testing the value of six taxonomic groups as biodiversity indicators at local scale. Conservation Biology 2004; 18: 1–9.
[17] Lõhmus A, Sellis U. Foraging habitats of the black storks in Estonia. Hirundo 2001; 14: 109-112.
[18] Lõhmus A, Sellis U, Rosenvald R. Have recent changes in forest structure reduced the Estonian black stork Ciconia nigrapopulation? Biodiversity and Conservation 2004; 1-12.
[19] McGarigal K, Cushman S, Stafford S. Multivariate statistics for wildlife and ecology research. Springel-Verlag, New York; 2000.
[20] Moorman C.E, Chapman B.R. Nest-site selection of red-shouldered and red-tailed hawks in a managed forest. Wilson Bulletin 1996; 108(2): 357-368.
[21] Newton I. Population ecology of raptors. Poyser, Berkhamsted; 1979.
[22] Niemi G.J, Hanowski J.M, Raptor responses to forest management: a holarctic perspective. Journal of Raptor Research 1997; 31(2): 93-94.
152
“Sustainable Management and Development of Mountainous and Island Areas”

[23] Olendorff R.S, Bibles D.D, Dean J.R., Haugh J.R, Kochert M.N. Raptor habitat management under the U.S. Bureau of Land Management Multiple-use Mandate. Raptor Research Reports 1989; 8:1-80
[24] Penteriani V, Faivre B, Frochot B. An approach to identify factors and levels of nesting habitat selection: a cross-scale analysis of goshawk preferences. Ornis Fennica 2001; 78: 159-167.
[25] Pereira J.M.C, Itami R.M. GIS-Based Habitat Modelling Using Logistic Multiple Regression: A study of the Mt. Graham Red Squirrel. Photogrammetric Engineering & Remote Sensing 1991; 57 (11): 1475-1486.
[26] Petretti F. Notes on the behaviour and ecology of the Short-toed Eagle in Italy. Gerfaut 1998; 78: 261-286.
[27] Poirazidis K, Skartsi T, Pistolas K, Babakas P. Nesting habitat of raptors in Dadia reserve, NE Greece. In: Muntaner M, Mayol J, editors. Biologia y Conservacion de las Rapaces Mediterranneas 1994; Monografias, No 4, SEO, Madrid; 1996 p. 325-333.
[28] Poirazidis K. Dadia-Lefkimi-Soufli Forest Reserve, Diurnal raptor assemblages, Status report of raptor species populations. WWF Greece, E.U: 2003.
[29] Poirazidis K. Breeding habitat selection from co-existing raptor species in the National Park of Dadia-Leukimi-Soufli [dissertation]. Aristotle University of Thessaloniki; 2003 [In Greek].
[30] Profus P. Black stork, Ciconia nigra. In: Tucker M, Heath F, editors. Birds in Europe: Their Conservation Status. Birdlife Int., Cambridge; 1994 p. 98-99.
[31] Reynolds R.T. Management of western coniferous forest habitat for nesting Accipiter hawks. USDA For. Ser. Gen. Tech. Rep. RM-102, Ft. Collins, CO, U.S.A; 1983.
[32] Rosenvald R, Lõhmus A. Nesting of the black stork (Ciconia nigra) and white-tailed eagle (Haliaeetus albicilla) in relation to forest management. Forest Ecology and Management 2003; 185: 217-223.
[33] Sackl P. Aktuelle Situation, Reproduktion und Habitatansprüche des Schwarzstorchs. Schriftenreihe für Umwelt und Naturschutz im Kreis Minden-Lübecke 1993; 2: 54-63.
[34] Santana C.E, Laboy E.N, Mosher J.A, Temple S.A. Red-tailed Hawk nest sites in Puerto Rico. Wilson Bulletin 1986; 98: 561-570.
[35] Selas V. Nest-site selection by four sympatric forest raptors in southern Norway. Journal of Raptor Research 1997; 31 (1): 16-25.
[36] Sergio F, Boto A, Scandolara C, Bogliani G. Density, nest sites, diet, and productivity of common buzzards (Buteo buteo) in the Italian Pre-Alps. Journal of Raptor Research 2002; 36: 24-32.
[37] Solonen T. Spacing of birds of prey in southern Finland. Ornis Fennica 1993; 70: 129-143.
[38] Speicer R, Bosakowski T. Nest site preferences of red-tailed hawks in the highlands of southeastern New York and northern New Jersey. J. Field Ornithology 1988; 59(4): 361-368.
[39] Skuja S, Budrys R.R. Nesting sites of black stork, lesser spotted eagle and common buzzard and their nest exchange in the forests of north, noth-east and central Lithuania. Baltic Forestry 1999; 5: 67-74.
[40] Strazds M, Lipsbergs J, Petrins A. Black stork in Latvia-numbers, distribution and ecology. Baltic Birds 1990; 5(2): 174-179.
[41] Titus K, Mosher J.A. Nest-site habitat selected by woodland hawks in the central Appalachians. Auk 1981; 98: 270-281.
[42] Tucker M, Heath F, editors. Birds in Europe: Their Conservation Status. Birdlife Int., Cambridge; 1994.
[43] Tucker G.M, Evans M.I, editors. Habitats for birds in Europe. A conservation strategy for the wider Environment. BirdLife Int., BirdLife Conservation Series no.6, Cambridge; 1997.
153
“Sustainable Management and Development of Mountainous and Island Areas”

Habitats and avifauna on the Island of Skiathos
Efstathios.P.Tsachalidis Department of Forestry and Management of the Environment and Natural Resources,
Democritus University of Thrace, Pantazidou 193, GR-68200 Orestiada, Greece. [email protected]
Paraskevi Karanikola Department of Forestry and Management of the Environment and Natural Resources,
Democritus University of Thrace, Pantazidou 193, GR-68200 Orestiada, Greece. [email protected]
Konstantinos Poirazidis Department of Forestry and Management of the Environment and Natural Resources,
Democritus University of Thrace, Pantazidou 193, GR-68200 Orestiada, Greece. [email protected]
Despoina Zografou Faculty of Education, Department of Primary school, Aristotle University of Thessaloniki,
GR-54006,Thessaloniki, Greece.
Abstract. The island of Skiathos despite its small size presents a great variety of biotopes such as: coniferous forests with chaparral undergrowth, coast wetland, streams, stubbles, streams’ mouths, sandy and rocky beaches, firewoods, arboribulture and rocky islands. In these biotopes more than 113 bird species that belong to 17 classes and 39 families have been observed. Passeriformes class is the largest one; 16 families and 63 bird species belong in this class, with most common ones the blackbirds, linnets, greenfinches, and goldfinches. Next follows the class of Charadriiformes, which includes 5 families and 12 bird species, with main species: sandpipers, seagulls and terns. Species that breed in Skiathos come up to 62 ones. Special interest presents the ferruginous duck (Aythya nyroca), which forms threatened species worldwide together with european shag (Phalacrocorax aristotelis) that belong to the vulnerable class. Furthermore for 10 threatened breeding species in the island specialconservation measures must be taken.
Keywords. Avifauna, habitats, Skiathos.
1. Introduction
All ecosystems and human societies depend on a healthy and productive natural environment that contains diverse plant and animal species [10].Birds contribute most significantly to the diversity of terrestrial vertebrates and have a special role in conservation. The ecological value of the birds is very important for the ecosystem stability. Birds have been recognized as useful biological indicators for long-term monitoring programs to detect and assess changing environmental conditions [2], [7]. There are strong ecological and economic reasons for sustaining healthy bird populations. Due to their large number of species and population, they cover a wide trophy spectrum and they contribute to reducing insect densities, small-mammal populations to dissemination of seeds, nutrient and energy cycling; on the other hand with the double relation of predator - prey they play a significant role in the maintenance of the ecosystem’s ecological equilibrium. There are various ways of assigning conservation values to bird species. Valuing species by endemism, habitat specialization, taxonomic uniqueness and degree of endangerment has been more popular among those attributes generally accepted. As with any other group of organisms, the limited availability of suitable habitats is one of the main the problem in conserving birds and special
154

management should consider species of conservation concern as well as non-threatened species.
Skiathos is the westernmost island of Northern Sporades island complex, central Greece. It is situated closer to the mainland, near to mountain of Pilio. There are many wetlands (lagoons) in the island and many migratory birds, like swans, ducks and other endangered species, use them as refuge and breeding areas. The most significant wetland is that of Koukounaries area located in the southern part of Skiathos. In this area a mixed forest of 14.5 ha with Pinushalepensis, P. pinea and an understorey of sclerophyllous shrubs extends up to the coastline, there is a lake (Strofilia) with a surface of 9.5 ha to its north, and a marine zone which covers half of the site's area.
The Koukounaries site has been declared a Controlled Housing Zone, is considered a wetland core and characterised as an "area of total protection of nature". No building activities or interventions are allowed apart from the already existing golf terrain, the conduct of some scientific research studies and the potential construction of small tourist units which will be in limited numbers, in accordance to the environment and outside the forest boundaries. In addition, Skiathos island is protected by the Barcelona Convention.
There have been great tourist pressures in the island as well as various other human interventions resulting in the substantial decrease of the populations of aquatic migratory birds as well as in the gradual destruction of the flora. The last years and under the pressure of the environmental problems of the intense tourist and residential development of the island, it has been recognized that the island and especially certain of its areas should be declared as Special Protection Areas (SPAs). SPAs are strictly protected sites classified in accordance with Article 4 of the EC Directive on the conservation of wild birds (79/409/EEC), also known as the Birds Directive, which came into force in April 1979. They are classified for rare and vulnerable birds, listed in Annex I to the Birds Directive, and for regularly occurring migratory species. Additionally according to the directive 92/43 referring to “the preservation of natural habitats and wild flora and fauna” [3] has been included in the communal network NATURA 2000.
Until now, has not been conducted any systematic research on the island’s ecological values. There are few data for the situation of the
island’s avifauna [1], [8], [9], [12]. These circumstantial information and occasional outdoor observations that took place in the island was the framework for the drawing up of the present study. Aim of the present study was the ecological evaluation of the island regarding to the existing habitats and avifauna according to the criteria of nesting, rarity and habitats’ seasonal use.
2. Study area
The study area, Skiathos island, is situated in the Magnisia Prefecture, central Greece (Fig. 1). Its area size is 47.8 km2 and its largest part is covered by forests and semi-forest areas with Pinus halepensis, Pinus pinea and Quercus ilex,interchanging with rural cultivations, mainly olive plantations. The predominate climate is temperate mediterranean with an annual rainfall of about 600 mm. The whole island is being protected as an aesthetic forest since 1977.
Figure 1. Map of the study area
3. Results
3.1. Habitats’ description
In Skiathos despite its small size (47.8 km2) all habitats’ types existing in the Aegean islands, with the exception of pseudoalpine areas above the forest limits, are presented.
Main habitat types are the following: a) Sandy beaches with sandbanks which are constantly covered by sea water of minor depth are very common in Skiathos, but due to the provoked annoyance by the visitors during the reproductive period they do not form a special habitat for bird species (tourist period coincides with birds’ reproductive period) b) Vestigial moving sand - dunes and sand - dunes with hard-leaf bushes vegetation as well as sand - dunes with Pinus pinea.c) Coast wetlands with Mediterranean seasonal ponds and surrounding vegetation. Amongst these three lagoons of the island Strofilia, Agios
GreeceTurkey
BulgariaF.Y.R.O.M.
Alba
nia
155
“Sustainable Management and Development of Mountainous and Island Areas”

Georgios and Vromolimnos, that present great degradation due to the human impact and not systematically used anymore by wader birds, are included. Furthermore, there are two more lagoons of considerable size in the small island of Tsougrias, at a small distance westwards of Skiathos, where the vegetation remains undisturbed and no intervention in its hydrologic function has taken place. These wetlands are excellent habitats for the foraging and reproduction of waterfowl and waders. d) Streams, reedbeds and streams’ mouths in the sea are very significant because they host many bird species. These small wetlands usually have plane-trees and reedbeds. They can be either rocky with poor vegetation such as rushes and moss like the stream in the area of the Castle, or they end up in sandy beaches by creating channels with reeds at the lower points and plane-trees at the higher one of its banks like the stream of Megalos Aselinos and Platania. It should be noted that certain streams in the island have steady flow but the majority of these biotopes have been trespassed and altered. e) Coniferous forests composed by Pinus pineaand P. halepensis. We meet clumps of P. pineain the homonymous location (Koukounaries = P.pinea) that ends up in Mandraki and Xerxes Harbor. Furthermore there are bushes in almost any sandy beach with sclerophyllous undergrowth and mainly Quercus ilex. Pinushalepensis forests cover the largest part of the mountain volume of Skiathos and can be classified in three zones according to the vegetation’s structure as a result of the forest fires. Areas recently burnt, where P. halepensisis regenerated, areas that were burnt in the past and are partly wooded with interspersed big trees and thick young tree plantations and finally areas that remain undisturbed where the natural structure is preserved with rich sclerophyllous shrubs. f) Brushwoods cover a small area in the east part of the island in the areas of Xanemos and Stigeros in its west part, as well as a small area in the hill of Karabotsakisma. g) Arboribultures and small parts of broadleaved forests and maquis cover a large part of the northeast end of the island. They are characterized by a vegetation variety interchanging between small in size olive plantations and parts of broadleaved trees of big age; they form ideal habitats for seed-eater birds. h) Rocky beaches and rocky islands. Rocky beaches start at the bay of Kehria (north part of
the island) and stretch to the cape of Kephala (northeast part of the island); they are characterized by the intense and rough geomorphologic relief. Rocky islands are situated close to the island and there are plenty mainly in the north and east part of the island. They are mainly used by seabirds for reproduction. i) Inhabited areas and human substructures are concentrated in the south part of the island and are restricted in a zone near the sea.
3.2. Avifauna
The present study improves the data of previous ones [1], [8], [12].
Certainly there are deficiencies in the data to be located mainly: i) in the breeding of some species in the island ii) species recording mainly those who present low detectability and nocturnal behavior, iii) species’ population, iv) recording of systematic use of habitats by birds and migratory behavior of many species (seasonal movements).
The valuation of birds’ value in Skiathos took place mainly according to quality and not quantitative (population) criteria. The absence of quantitative criteria does not affect the complete comprehension and valuation of ecosystem values in the island. As already mentioned birds’ value in the island of Skiathos is attempted according to the available qualitative data, referring to: breeding, rarity, seasonal appearance and national and international conservation status for birds.
The results in Table 1 created mainly from the review of the current bibliography and relevant studies [5], [1], [8], [12], together with few observations in the field. According to these results it is recognized that in Skiathos have been observed 113 bird species, which form 27.7% of the total number of avifauna species to be encountered in our country [6].
This number of bird species (113) of Skiathos belongs to 17 classes; include 39 families (Table 2). The largest one is the class of Passeriformes, which includes 16 families and 63 species which are more than half that were recorded in the island. Most species belong to the Sylviidae family with 15 species. Next follow the classes of Charadriiformes with 5 families and 12 species and Accipitriformes with 1 family and 6 species. The remaining classes include one family with 1 to 6 species.
156
“Sustainable Management and Development of Mountainous and Island Areas”

From Tables 1 and 4 the conservation status of birds and their habitats in the island of Skiathos is established. In Skiathos 60 species (i.e. 53.1%) are nesting. The number of these species can also be higher per 7 species but for the documentation of this assumption more and systematic observations are requisite.
The special value of birds in Skiathos is also established by the number of breeding species in the island and belongs to a special conservation status. According to these criteria the species that nesting in the island and belong to the threatened ones come up to 9 (Table 4). Special interests present the species: Aythya nyroca which reproduces occasionally and belongs to the threatened species worldwide together with Phalacrocorax aristotelis that belong to the vulnerable class. More specific Phalacrocoraxaristotelis is encountered in considerable population in rocky beaches at the northern part of the island and according to the red book is included in the class that is in danger of extinction. Furthermore, other species that also nesting in the island and belong to the vulnerable class (V) are: Circus aeruginosus; Hieraaetus pennatus; Burhinus oedicnemus and Larus melanocephalus. The species Falco eleonoraeand Falco peregrinus belong to the category of scarcely known. It is estimated that in the future these species will belong to the class of species that are in direct danger of extinction, unless proper measures for their protection are taken.
From the bird species we encounter in Skiathos, 16 of them (14.2%) are considered to be threatened species (Tables 1 and 4). Ten (10) of these species (8.9%) belong to the high risk class, one species (0.9%) is considered as rare and five species (4.4%) is considered as scarcely known. In Table 1 rarity information for every bird species is given. Larus audouinii belongs to the threatened species worldwide.
In wintertime 60 species (53.1% of the total), whereas in summertime 85 (75.2%) are presented. 40 species (35.7%) are migratory, whereas 42 (37.5%) species remain in the island round the year (permanently); 39 (34.8%) species remain in the island during summertime and 15 (13.4%) during wintertime (Table 3). In these same tables we observe that 40 bird species (35.7%) pass through (stop) the island for rest and food. In relation to the conservation status 75 species (66.4%) are protected by the Greek Legislation, 32 species (28.3%) by the
Communal Directive 409/79, whereas 86 species (76.1%) by the Bern Convention (Table 5). The conservation status for each bird species is shown in detail in Table 1.
With reference to the birds of prey we find out, that out of 36 species that exist in Greece 13 of them are observed in Skiathos. These birds belong to the three classes of Accipitriformes and Falconiformes (diurnal birds of prey) and Strigiformes (nocturnal birds of prey). Each class includes one family, Accipitridae with 6 species, Falconidae with 5 species and Strigidae with 2 species respectively (Table 2). It is characteristic that 13 of the above species are fully protected both nationally and internationally by various Conventions (Table 1 and 5). The presence of such a significance number of birds of prey in Skiathos, reveals the ecosystems’ robustness from the ecological viewpoint, because all of them are to be found at the top of the ecological pyramid and belong to the highest level of the trophic pyramid (carnivorous); therefore their presence in an ecosystem is ensured under favorable food and nest conditions. The variety that features the birds of prey forms a live biological indicator of the biotopes’ quality and proves their robustness.
The great significance of Skiathos for the birds of prey is established through the fact that out of 13 species that use wetlands and surrounding hilly and mountainous areas of the island as their habitats, eight of them are breeding (five species belong to various risk class) and the remaining five either wintering or are autumn or spring visitors (passing) (Table 1 and 2).
157
“Sustainable Management and Development of Mountainous and Island Areas”

Table 1. Birds of Island Skiathos ( = Directive 409 / 79/ E.E, n= Convention of Bern, e=Presidential Decree 86/1969 (Greek legislation))
nes Category of
Scientific name ting Greek Inter danger Refere
Winter Summer Migration nat. (Red book) nces
1 2 3 4 5 6 7 8 9 10
1 Podiceps cristatus 1,5
2 Calonectris diomedea v ,n 1,2
3 Puffinus puffinus v ,n 2
4 Hydrobates pelagicus v o R 2
5 Phalacrocorax aristotelis v v * V 1,2
6 Pelecanus onocrotalus v e ,n E1 2
7 Ardeola ralloides * e ,n 1,4,5
8 Egretta garzetta * e ,n 1,2,4,5
9 Ardea cinerea * e 1,2
10 Cygnus cygnus e ,n K
11 Aythya nyroca * (V) 1,5
12 Neophron percnopterus * e ,n V 2
13 Circus aeruginosus * e ,n V 1,4
14 Accipiter nisus e n 1,2,4,5
15 Buteo buteo * e n 1,2,4
16 Pernis apivorus e ,n 2
17 Hieraaetus pennatus * e ,n V 1,4
18 Falco tinnunculus * e n 1,2,4,5
19 Falco vespertinus e n 1,4
20 Falco subbuteo e n 2
21 Falco eleonorae * e ,n K 1,2
22 Falco peregrinus * e ,n K 2
23 Phasianus colchicus * V 1
24 Alectoris chukar * 1,3
25 Coturnix coturnix * K
26 Porzana porzana ,n 2
27 Burhinus oedicnemus * ,n V 1,2,4,5
28 Charadrius dubius * n 1,4
29 Philomachus pugnax 1,4
30 Scolopax rusticola
31 Tringa nebularia 1,4,5
32 Tringa ochropus n 1,4
33 Tringa glareola ,n 1,4,5
34 Actitis hypoleucos n 1,4,5
35 Larus melanocephalus * e ,n V 1
36 Larus audouinii ,n (E2) 2
37 Larus cacchinans * 1,2,5
38 Sterna hirundo * e ,n 1
39 Columba livia * 1,2
40 Streptopelia decaocto * e 1
41 Streptopelia turtur * 1,2,3
42 Otus scops * e n 1,2,3,4
43 Athene noctua * e n 1,2,3,4
44 Caprimulgus europaeus ? e ,n 1,2
45 Apus apus * n 1,2,3
46 Apus pallidus ? n 1
47 Apus melba n 1,2
48 Alcedo atthis * e .n 1
49 Merops apiaster * e n 2
50 Upupa epops * e n 2
51 Melanocorypha calandra * e ,n 2
52 Galerida cristata * 2
53 Ptyonoprogne rupestris * e n 2
54 Hirundo rustica * e n 1,2,3
55 Hirundo daurica * e n 1,2,3
56 Delichon urbica * e n 1,2,3
Seasonal Legislation
occurrence
158
“Sustainable Management and Development of Mountainous and Island Areas”

Table 1. continuity nes Category of
Scientific name ting Greek Inter danger Refere
Winter Summer Migration nat. (Red book) nces
1 2 3 4 5 6 7 8 9 10
57 Anthus campestris * e ,n 1,2,3
58 Anthus pratensis e n 2
59 Anthus spinoletta e n 2
60 Motacilla flava * e n 1,2,3,5
61 Motacilla cinerea e n 1,2,3
62 Motacilla alba * e n 2
63 Troglodytes troglodytes e n 2
64 Prunella modularis e n 1
65 Cercotrichas galactotes * e ,n 2
66 Erithacus rubecula e n 2
67 Luscinia megarynchos * e n 1,2,3
68 Phoenicurus phoenicurus n 2
69 Saxicola rubetra e n 1,3
70 Oenanthe hispanica * e 1,2,3
71 Oenanthe oenanthe e n 1,2,3
72 Monticola solitarius * n 1,2
73 Turdus merula 1,2,3
74 Cettia cetti ? e n 1,5
75 Hippolais pallida * e n 1,2,3
76 Hippolais olivetorun * e ,n 2
77 Hippolais icterina n 2
78 Sylvia cantillans ? e n 1,2,3
79 Sylvia melanocephala * e n 1,2,3
80 Sylvia communis e n 1,2,3
81 Sylvia atricapilla e n 1,2,3
82 Sylvia borin n 2
83 Sylvia ruppelli ,n 2
84 Sylvia curruca n 1
85 Phylloscopus collybita e n 2
86 Phylloscopus bonelli n 2
87 Regulus regulus e n 2
88 Regulus ignicapillus e n 2
89 Muscicapa striata e n 1,2,3
90 Parus caeruleus * e n 1,3
91 Parus ater * e n 2
92 Parus major * e n 1,2,3
93 Sitta neumayer * e n 2
94 Oriolus oriolus e n 2
95 Lanius collurio * e ,n 1,2,3
96 Lanius senator ? e n 1,2,3
97 Garrulus glandarius ? e 2
98 Corvus monedula * e 1,3
99 Corvus corone * e 1,2,3
100 Corvus corax * e 1,2,3
101 Pyrrhocorax pyrrhocorax e ,n K 2
102 Passer domesticus * e 1,2,3
103 Passer hispaniolensis * 2
104 Fringilla coelebs * e 1,2,3
105 Carduellis chloris * e n 1,2,3
106 Carduelis carduelis * e n 1,2,3
107 Carduelis cannabina * e n 1,3
108 Acanthis cannabina * 2
109 Emberiza cirlus e n 1,2,3
110 Emberiza citrinella v 2
111 Emberiza caesia ? e ,n 2
112 Emberiza melanocephala e n 1,2,3
113 Emberiza calandra * e 2
Seasonal Legislation
occurrence
References (1 : YPEXODE, H. .S. & m , 1997; 2 : Skagianis et al. 2002; 3 : Androukaki & Adamantopoylou, 1992; 4 : Magioris, 1992; 5 :Matsakis, 1992).
159
“Sustainable Management and Development of Mountainous and Island Areas”

Table 2. Systematic classification of Skiathos Birds a/a Order Family Species a/a Order Family Species
1 Podicipediformes Podicipedidae Podiceps cristatus Anthus campestrisProcellariidae Calonectris diomedea Anthus pratensis
2 Procellariiformes Puffinus puffinus Motacillidae Anthus spinolettaHydrobatidae Hydrobates pelagicus Motacilla flava
3 Pelecaniformes Phalacrocoracidae Phalacrocorax aristotelis Motacilla cinereaPelecanidae Pelecanus onocrotalus Motacilla alba
Ardeola ralloides Troglodytidae Troglodytes troglodytes4 Ciconiiformes Ardeidae Egretta garzetta Prunellidae Prunella modularis
Ardea cinerea Cercotrichas galactotes5 Anseriformes Anatidae Cygnus cygnus 16 Passeriformes Erithacus rubecula
Aythya nyroca Luscinia megarynchosNeophron percnopterus Phoenicurus phoenicurusCircus aeruginosus Turdidae Saxicola rubetra
6 Accipitriformes Accipitridae Accipiter nisus Oenanthe hispanicaButeo buteo Oenanthe oenanthePernis apivorus Monticola solitariusHieraaetus pennatus Turdus merulaFalco tinnunculus Cettia cettiFalco vespertinus Sylvidae Hippolais pallida
7 Falconiformes Falconidae Falco subbuteo Hippolais olivetorunFalco eleonorae Hippolais icterinaFalco peregrinus Sylvia cantillansPhasianus colchicus Sylvia melanocephala
8 Galliformes Phasianidae Alectoris chukar Sylvia communisCoturnix coturnix Sylvia atricapilla
9 Gruiformes Palidae Porzana porzana Sylvidae Sylvia borinBurhinidae Burhinus oedicnemus Sylvia ruppelliCharadriidae Charadrius dubius Sylvia curruca
Philomachus pugnax Phylloscopus collybitaScolopax rusticola Phylloscopus bonelliTringa nebularia Regulus regulus
10 Charadiiformes Scolopacidae Tringa ochropus Regulus ignicapillusTringa glareola Muscicapidae Muscicapa striataActitis hypoleucos Parus caeruleusLarus melanocephalus Paridae Parus ater
Laridae Larus audouinii Parus majorLarus cacchinans Sittidae Sitta neumayer
Sternidae Sterna hirundo Oriolidae Oriolus oriolus
Columba livia Lanidae Lanius collurio
11 Columbiformes Columbidae Streptopelia decaocto Lanius senator
Streptopelia turtur Garrulus glandarius
12 Strigiformes Strigidae Otus scops Corvus monedula
Athene noctua 17 Passeriformes Corvidae Corvus corone
13 Capimulgiformes Caprimulgidae Caprimulgus europaeus Corvus corax
Apus apus Pyrrhocorax pyrrhocorax
14 Apodiformes Apodidae Apus pallidus Passeridae Passer domesticus
Apus melba Passer hispaniolensis
Alcedinidae Alcedo atthis Fringilla coelebs
15 Coraciiformes Meropoidae Merops apiaster Carduellis chloris
Upopidae Upupa epops Fringilidae Carduelis carduelis
Alaudidae Melanocorypha calandra Carduelis cannabina
Galerida cristata Acanthis cannabina
Ptyonoprogne rupestris Emberiza cirlus
16 Passeriformes Hirundinidae Hirundo rustica Emberiza citrinella
Hirundo daurica Emberizidae Emberiza caesia
Delichon urbica Emberiza melanocephala
Emberiza calandra
Table 3. Seasonal occurence of Skiathos birds reproduced
W S W+S only W only S M species1 2 3 4 5 6 7 8
Number of species 60 85 42 15 39 40 62(7)(%) 53,1 75,2 37,2 13,2 34,5 35,4 54,9 (6,2)
Seasonal occurence of Skiathos birds.Index
W=winter, S=summer, M=migratory
160
“Sustainable Management and Development of Mountainous and Island Areas”

Table 4. Threatened and reproduced species of Skiathos birds
Index
E V K Total E V R K Total1 2 3 4 5 6 7 8 9 10
Number of species 1 8 2 11 2 8 1 5 16(%) 0,9 7,1 1,8 9,8 1,8 7,1 0,9 4,4 14,2
E = endangered, V=vulnerable, K=insufficiently known, R=rare
reproduced speciesCategory of danger
threatened species
Table 5. Protective Legislation
e o n e+o+n only e only o only n only o+n e+n1 2 3 4 5 6 7 8 9 10
Number of species 75 32 86 20 10 4 13 8 45(%) 66,4 28,3 76,1 17,7 8,8 3,5 11,5 7,1 39,8
Index
e=Presidential decree 86/1969, o= Directive 409/79/EEC, n= Convention of Bern FEK 32/A/14-3-83
Category of legislation
4. Conclusions – Suggestions
According to this study it has been recognized that the island of Skiathos is very significant for the avifauna. Therefore various precaution measures should be taken in order for the island’s biotopes not only to be preserved and protected but in many cases to be improved with various work projects that should be suggested after relevant studies.
During the summer period (tourist peak period) special attention should be paid for the protection of the island’s wetlands (Strofilia, Ag. Georgios, Vromolimnos and Tsougria); these are significant areas for the foraging and reproduction of waterfowls and waders. Pinus halepensis, P. pinea and sclerophyllous shrubs should be protected; their downgrading by uncontrolled activities should be stopped. Further research should be carried out and precaution measures should be taken for bird species that live and breeding in the island, belonging to the high risk classes.
In order to reduce the disturbance created by the motion of motorized vehicles and boats, these activities should be restricted to special zones and outside of areas with special ecological interest and mainly in areas where threatened bird species are breeding.
Finally, the island’s competent authorities should organize their activities in order to protect the ecological value of the island and through them mainly during the summertime both residents and visitors of the island should be informed of the wetlands’ and biotopes’ value.
5. References
[1] Androukaki E, Adamantopoulou S. A species-area relationship in the avifauna of northern Sporades (Aegean – Greece). Biologia Gallo – Hellenica 1992; 19 (2): 37-44.
[2] Canterbury G.E, Martin T.E, Petit D. R, Petit L.J, Bradford D.F. Bird Communities and Habitat as Ecological Indicators of Forest Condition in Regional Monitoring. Conservation Biology 2000; 14(2): 544-558.
[3] Directive of the Commission of European Communities 79 / 409/ EEC «The conservation of wild birds» (EEL 103/1/25-4-1979).
[4] Directive of the Commission of European Communities 92/43/EEC, NATURA 2000, «Conservation of natural habitats and wildlife», ( L 206/7/22-7-1992).
[5] Handrinos G, Akriotis T. The Birds of Greece. Christopher Helm. London; 1997.
[6] Karandinos M. The Red data book of threatened vertebrates of Greece. Hellenic Zoological Society and Hellenic Ornithological Society Athens; 1992.
[7] Koskimies, P. Birds as a tool in environmental monitoring. Annales Zoologici Fennici 1989; 26(3): 153-166.
[8] Magioris S. N. Evaluation and significance of wetlands to the migratory waterbirds on the idlands of the Central and Western Aegean. Biologia Gallo – Hellenica 1992; 19 (2) : 119-134.
161
“Sustainable Management and Development of Mountainous and Island Areas”

[9] Matsakis J. Inventaire de la faune de Grece, Etat des biotopes et des populations d especes menaces. Biologia Gallo – Hellenica 1992 ;19(2) 103-118.
[10] Pimental D, Wilson C, McCullum C, Huang R, Dwen P, Flack J, Tran Q, Saltman T, Cliff B. Economic and Environmental Benefits of Biodiversity. BioScience 1997; 47(11): 747-757.
[11] Presidential Decree 86/1969. Forest code. [12] Skagianis, P. Integrating Project of
Development in the Municipality of Skiathos. University of Thessaly. Technical School. Department of Engineering Planning and Regional Development. March 2002.
[13] YPEXODE. «Habitats of Island Skiathos».–Society of study the Mediterranean Monk seal ( machus monachus). Hellenic Ornithological Society. Athens; 1997.
162
“Sustainable Management and Development of Mountainous and Island Areas”

Teachers and Environmental Education in Greece
Efstathios Tsachalidis Department of Forestry and Management of the Environment and Natural Resources, Democritus
University of Thrace, 193 Pantazidou Street, 68200 Orestiada, Greece.
E-mail: [email protected]
Stilianos Tampakis Department of Forestry and Management of the Environment and Natural Resources, Democritus
University of Thrace, 193 Pantazidou Street, 68200 Orestiada, Greece.
E-mail: [email protected]
Georgios santopoulos Department of Forestry and Management of the Environment and Natural Resources, Democritus
University of Thrace, 193 Pantazidou Street, 68200 Orestiada, Greece.
E-mail: [email protected]
Despina Zografou Aristotle University of Thessaloniki, School of Primary Education
Asteria Tsikna Chemist, MSc Environmental Quality, University of Bournemouth UK
E-mail: [email protected]
afeiro ArabatziPhilologist, National Kapodistrian University of Athens
E-mail: [email protected]
Abstract: One of the most important issues concerning society today is the accumulation of environmental problems and the lack of a policy that would resolve or minimize them. The downgrading of the environment cannot only be confronted through knowledge and measurements. What is required is the members of society to change their mentality, attitude, and behaviour, in order to redefine the relation between man and his environment. Such a redefinition of roles can only be feasible through the adoption of a new environmental ethos. The courses on Environmental Education taught in the first two levels of the educational system and the use of suitable programmes related to the environment are called upon to assist in the creation of such an ethos.
Based on the above, the main objective of this paper is to assess the status of the teaching staff employed in the first two educational levels. For this reason, the research focused on specific information concerning teachers’ individual
characteristics, their knowledge and attitudes towards the environment, and the correlation between these factors, in order to determine which teachers are better suited to respond to the demands of Environmental Education.
The data collection took place from April to May 2001, through the completion of tailor-made questionnaires by the teachers during personal interviews. The evaluation of the teaching staff’s status was considered necessary, because their knowledge, attitude, and environmental awareness are believed to be of primary importance for the promotion of environmentally-related principles and values that will contribute to the creation of a new environmental ethos. The above-mentioned teachers, due to their daily contact with pupils of the most impressionable age, can play a key role in the formulation of environmentally-aware citizens, whose behaviour can be conducive in reducing the volume of problems linked to the environment.
163
“Sustainable Management and Development of Mountainous and Island Areas”

Keywords: Environmental attitudes, Environmental education, Environmental knowledge
1. Introduction
Society as a whole demands an improved quality of life, financial gain that is always driven by the quest for a large and easy profit, and economic development with no limits. On the other hand, the state, due to the absence of an appropriate policy, is unable to address the multiple and varied environmental problems that arise from the demands and activities of people. The problems therefore are constantly becoming more acute. Certain efforts are made on behalf of the state and some agencies to tackle and potentially minimize the danger, while also taking into account the modern views on sustainable development, which aspires to maintain our quality of life at least at current standards and also prevent any further destruction of the environment. These two objectives can only be achieved if a suitable policy is drawn up that will aim at creating future citizens characterized by an environmental conscience and awareness. Environmental Education will have a major part to play in the formulation of this new environmental ethos.
From an educational perspective, no attempts were made to incorporate Environmental Education within the educational system prior to the '60s and '70s. The association between education and the environment in Greek schools took place through the subject of “Patridognosia” (roughly translated as ‘knowledge of the homeland’), that was formally established for the first time by Law in 1913. This subject was taught for over 70 years and studied “the child’s immediate geophysical and social environment, history, customs, religious-national-economic life, and folk culture”. In fact, the content of this lesson was descriptive and static, promoting sterile encyclopedic teaching without offering children the opportunity to organize their experience into patterns of thinking.
Since 1998, Environmental Education is taught on a voluntary basis in Primary Schools and is regarded an autonomous activity that is not included in the school timetable. Those primary school teachers who have worked on E.E. in the initial stages of its development in our country have been primarily characterized by a sensitive outlook and concern towards
environmental issues (Papadimitriou 1995). At present, some of the most significant efforts within this framework include references of environmental matters in other subjects, the voluntary involvement of teachers and pupils mainly on project-type work and field studies, and the appointment of E.E. specialists by law [5].
During the last decade, E.E. has been called upon to contribute towards what is known as “sustainable development”. Education is believed to play a key role in finding ways to persuade young people to become aware and take action in support of the common goal of sustainability, by having a positive influence on the resolution of numerous related problems faced by our planet, such as poverty, lack of food and environmental degradation. This new challenge for environmental education presupposes new incentives and a new orientation.
In Greece, the number of teachers and pupils who take part in Environmental education programmes is very small [5], [21]. Several researchers have attempted to define the characteristics of environmental education within the framework of the school curriculum, primarily abroad as well as in Greece, mostly on a local level. Rakintzis [18] examined the knowledge and attitudes of teachers in Secondary education, working at Lower Secondary schools (Gymnasia) in the Prefecture of Imathia. Douvli [4] studied the knowledge, attitudes and views of students in a Lyceum in Thessaloniki.
Aivazidis [1] worked on the attitudes of students at the A.U.Th. in connection to E.E. Kalaitzidis [11] looked at School Geography and E.E. in schools. Goupos [6], carried out research with questionnaires distributed to teachers of all levels, in order to assess and analyze the difficulties they face when implementing E.E. programmes, in an attempt to determine the relation between these difficulties and the teachers’ socio-demographic attributes. Tsachalidis et al [21], [22], [23], [24] used questionnaires to study the individual characteristics, knowledge and mentality of teachers in Primary and Secondary education in Eastern Macedonia. In addition, the above-mentioned researchers [24] examined the obstacles and E.E. related applications in Primary Education in Eastern Macedonia.
The most important studies regarding E.E. abroad were conducted by: Zverev [27] in the former U.S.S.R., Williams and McCrorie [25] in
164
“Sustainable Management and Development of Mountainous and Island Areas”

Ireland, Hausbeck et al. [8] in the USA, and Szagun and Mesenholl [20] in Western Germany. Alvarez et al. [2] in Spain, also performed a study with questionnaires related to the level of knowledge and attitude of pupils vis-à-vis environmental issues, following the application of various environmental methods, in order to compare their effectiveness. ines et al. [9], and Leeming et al [13], [14] explored the knowledge, attitudes and behaviour of students towards the environment. Finally, we should underline that a large number of foreign scientists focus on the need for further research regarding the efficiency of teacher training on E.E. [10], [19] stating that it should not be limited to a mere formality but must achieve its real purpose, which is the formulation of well-informed citizens who want to be actively involved in environmental protection.
For this reason, a study of the level of knowledge and the attitudes of the teaching staff in Primary and Secondary education, regarding major environmental issues, is considered essential. Such knowledge is a pre-requisite to taking the necessary action and measures to improve the situation, so that E.E. is taught in Greece by the most qualified people who will enable it to effectively respond to its new role.
2. Methodology
The completion of the questionnaires took place in 2001 within the Region of Eastern Macedonia, namely the Prefectures of Serres, Drama and Kavala, and they were addressed to teachers in Primary and Secondary Education. Personal interview was the method used for their completion. The sampling method used was simple random sampling. Pre-sampling was carried out for each Prefecture in isolation, in order to determine the sample size, followed by the formulae of simple random sampling [12], [16]. In total, 1647 questionnaires were collected in total.
Each questionnaire included twelve knowledge questions and eleven questions on environmental attitudes (environmental awareness). Eight of the twelve knowledge questions were in multiple-choice form, and only included one correct answer, as well as the option “I do not know”. The remaining four questions had YES-NO answers and “I do not know”.
During the assessment of the teachers’ knowledge, every correct answer was graded
with one (1) point and every incorrect answer and “I do not know” with zero (0) points. The total number of correct answers provided the knowledge assessment for each interviewee.
The questions on environmental attitude (environmental awareness) included five graded answers and were assessed on a single scale of 1 to 5, with 1 denoting a negative and 5 a positive attitude. The sum of the grades for all questions provided the attitude assessment for each interviewed teacher.
Descriptive statistics were used to produce the results on the individual characteristics, and the knowledge and attitude questions concerning the environment. Furthermore, the Kruskal–Wallis statistical test was used to examine the relations between knowledge and attitude and the individual characteristics that were measured on the ordinal scale. Whenever statistically significant differences arose during the Kruskal–Wallis statistical test, the Mann–Whitney statistical test was applied to examine the relations between knowledge and attitude and the individual characteristics that were measured on the nominal scale.
The Kruskal – Wallis statistical test is used in the analysis of variance with one factor, but with three or more groups of an equal or unequal number. The cases are classified and the sum of the ordinal values for each group is calculated. These calculations are then used to arrive at the value of the criterion which approaches the x2
distribution. The mean rank signifies the sum of the orders divided by the number of cases.
The Mann-Whitney statistical test corresponds to the parametric t-test groups. The applied methodology is simple. The observations are sorted in ascending order from the smallest to the biggest, so that a unified sample is created. We then make a correspondence between each observation and its ordinal number, i.e. its position in the order we created.
Finally, we add up the ordinal numbers from the observations that correspond to each sample and check whether the two sums differ significantly [7], [15].
3. RESULTS
3.1. The teachers’ individual characteristics
As we can see in Table 1, there is no differentiation related to ‘gender’. Regarding
165
“Sustainable Management and Development of Mountainous and Island Areas”

‘age’, the largest percentage (44.8%) is aged 30-40, followed by the group of 40-50 year olds with 42.1%. Regarding the ‘number of years since graduation’, the highest percentage (28.6%) belongs to the group “15-20 years”. As for the ‘number of years in employment’, 40.6% have been employed for 5-15 years. Nine out of ten (88.2%) are permanent staff. Finally, about eight in ten (82.5%) come from a village or small town.
3.2 The teachers’ environmental knowledge
Based on the teachers’ answers, their knowledge is classified into three categories. In the first, which is considered most satisfactory, the percentage of answers is close to or exceeds 80%, and concerns matters related to acid rain, renewable natural resources, the ozone phenomenon, and geothermia as a source of energy. In the second, which is considered satisfactory, the percentage ranges between 64% and 74%, and concerns matters related to observing flamingos in the wetlands of Greece, the role of decomposers, biodiversity, eutrophication, and heterotrophic organisms. Finally, in the third, which is considered non-satisfactory, the percentage of answers ranges between 17% and 32.3%, and concerns matters related to animals in immediate danger of extinction, sustainable development, and the proliferation of the Dama dama deer (table 2).
3.3 Exploring the relation between the teachers’ individual characteristics and their environmental knowledge
The Kruskal–Wallis statistical test was used to explore the relation between the teachers’ individual characteristics, measured on the ordinal scale, and their environmental knowledge. The individual characteristic variables measured on the ordinal scale were ‘age’, ‘number of years since graduation’, ‘number of years in employment’ and ‘place of origin’. After the application of the statistical test (table 3), statistically significant differences were found to exist concerning the teachers’
knowledge and the above-mentioned four variables.
The Mann–Whitney statistical test was used in order to examine the relations between environmental knowledge and the categories of individual characteristics, whenever statistically significant differences were observed. The same test was also used for the remaining individual characteristics, ‘gender’ and ‘employment status’ that were measured on the nominal scale.
Based on the Mann–Whitney statistical test, statistically significant differences were found to exist between the ‘gender’ categories and the teachers’ knowledge. In particular, men have a better level of knowledge than women. Furthermore, statistically significant differences were identified between environmental knowledge and the age groups under 30 and over 50 years of age. More specifically, older teachers have a better level of knowledge compared to younger ones.
The variables ‘number of years since graduation’ and ‘number of years in employment’ also present a similar picture to age. Therefore, those teachers who graduated over 25 years ago are more knowledgeable than those who graduated less than 10 years ago. Furthermore, those teachers who have been employed for more than 15 years have a better level of knowledge than those who have been employed for less than 5 years. Permanent teachers have a better level of knowledge than substitutes and, finally, those teachers who come from the city have better knowledge than those who originate from small towns (table 4)
3.4 The teachers’ environmental attitudes
From the data in table 5, it is apparent that over eight in ten teachers (88.1%) believe that garments in good condition should be used and not withdrawn because they are no longer fashionable. Also, 77.2% of teachers do not agree with the establishment of industrial units that pollute the environment but provide work and a high income. Hunting is not considered a sporting activity by 69.8%. A further 69.2% of teachers believe that the use of nuclear energy is not essential although it does provide additional and cheaper energy.
166
“Sustainable Management and Development of Mountainous and Island Areas”

Table 1. Descriptive statistical data of the teachers’ individual characteristics.
Variable Category Percentage (%) Male 50.1% Gender Female 49.9% <30 3.7
30-40 44.8 40-50 42.1 Age groups
>50 9.4 <10 11.1
10-15 25.3 15-20 28.6 20-25 19.0
No of yrs since graduation
>25 16.0 <5 23.0
5-15 40.6 No of yrs in employment >15 36.4
Permanent staff 88.2% Employment status Substitute staff 11.8% Village 37.1%
Small town 44.4% Place of origin City 18.5%
Table 2. Percentage of successful answers related to the environment
Knowledge questions Percentage (%)
What is acid rain? 86.8 Which of the following is a renewable natural resource? 86.5 Where is the ozone phenomenon observed? 81.1 Is geothermia a source of energy? 79.0
Are Flamingos found in wetlands in Greece? 73.7 What is the role of decomposers in the ecosystem? 71.0 What is biodiversity? 69.6 What kind of phenomenon is Eutrophication? 64.9 Which organisms are considered heterotrophic? 63.9
Which of the following animals are in immediate danger of extinction?
32.3
What is sustainable development? 22.3 Where does the Dama-dama deer live? 17.0
Table 3. Results of the Kruskal–Wallis statistical test, on the level of the teachers’ environmental knowledge
Chi - Square Significance Age groups 10,173 0,017 No of yrs since graduation 17,293 0,002 No of yrs in employment 7,163 0,028 Place of origin 14,294 0,001
The establishment of zoos is something that 60% of the teachers agree with and consider a
suitable tool for raising public awareness on environmental protection issues. Finally, the
167
“Sustainable Management and Development of Mountainous and Island Areas”

majority of teachers (54.4%) do not view modern technology as a threat for the environment.
Table 6 indicates that a large percentage of teachers, (46.9%) and (31.8%) respectively, state that “harmful animals” should not be persecuted, and that the modernization of agriculture does not help to preserve the wild fauna. Finally, the majority separate recyclable materials from their household garbage and consider environmental pollution when buying products, at (25.9%) and (29.9%) respectively.
3.5 Exploring the relation between the teachers’ individual characteristics and their environmental attitude
The Kruskal–Wallis statistical test was used to explore the relation between the teachers’ individual characteristics, measured on the ordinal scale, and their environmental attitude. The individual characteristics measured on the ordinal scale were ‘age’, ‘number of years since graduation’, ‘number of years in employment’ and ‘place of origin’.
After the application of the statistical test, statistically significant differences were found to exist concerning the teachers’ environmental attitude and the four individual characteristic variables (table 7).
The Mann–Whitney statistical test was used in order to examine the relations between the teachers’ attitudes and the categories of
individual characteristics, whenever statistically significant differences arose. The same test was also used for the remaining individual characteristics, ‘gender’ and ‘employment status’ that were measured on the nominal scale.
Following the application of the Mann–Whitney statistical test, statistically significant differences were found to exist between the ‘gender’ categories and the teachers’ environmental attitude. In particular, women display greater environmental awareness than men. Furthermore, statistically significant differences were identified between environmental attitudes and the age groups over 30 and 40-50 years of age. More specifically, older teachers show a heightened level of environmental awareness compared to younger ones.
The variables ‘no of yrs since graduation’ and ‘no of yrs in employment’ also present a similar picture to age. Therefore, those teachers who graduated 20-25 years ago are more environmentally-aware than those who graduated less than 10 years ago. Furthermore, those teachers who have been employed for more than 15 years have a higher level of environmental awareness than those who have been employed for less than 5 years. Permanent teachers are more environmentally aware than substitutes and, finally, those teachers who come from villages are more aware of the environment than those who originate from cities.
Table 4. Results of the Mann–Whitney statistical test on environmental knowledge
Variable Category Mean Rank Mann-Whitney U Significance
Male 880,53Gender Female 767,27 292439,50 0,000
<30 88,60 Age groups >50 115,69 3513,50 0,004
<10 202,77 No of yrs since
graduation >25 237,79 20252,00 0,004
<5 459,54 No of yrs in employment >15 508,37 102077,00 0,008
Permanent 833,31Employment status Substitute 725,05 121744,00 0,002
Small town 470,76 Place of origin City 538,33 96751,50 0,001
168

Table 5. Percentages showing the teachers’ environmental attitudes
Attitude questions (environmental awareness) Fully agree
Agree Disagree Fully disagree
Do not know
Does modern technology constitute a problem for the environment?
9.2 32.2 43.0 11.4 4.3
Is hunting a sporting activity? 3.7 21.7 48.1 21.7 4.7 Is nuclear energy essential because it provides additional and cheaper energy? 4.3 18.9 52.2 17.0 7.6
Do you agree with the establishment of industrial units that pollute the environment but provide work and a high income?
2.1 14.8 54.9 22.3 5.9
Do you believe that zoos should exist in order to raise awareness amongst the public? 17.1 42.9 26.9 9.3 3.8
Do you agree with the withdrawal of garments that are in good condition because they are no longer fashionable?
2.4 13.2 60.0 22.1 2.3
Table 6. Percentages showing the teachers’ environmental attitudes Attitude questions
(environmental awareness) Always Usually Sometimes Rarely Never
Should “harmful animals” like: fish-eating birds, wolves, foxes, etc. be persecuted?
1,6 3,6 21,1 26,9 46,9
Do you separate recyclable materials from your household garbage? 23,1 25,9 23,1 13,3 14,6
Do you consider environmental pollution, when you are buying products? 18,6 29,9 28,9 16,2 6,4
Do you believe that the modernization of agriculture helps to preserve the wild fauna? 4,6 14,3 23,2 26,0 31,8
Table 7. Results of the Kruskal–Wallis statistical test, on the level of the teachers’ environmental attitudes
Chi - Square Significance Age groups 15,413 0,001 No of yrs since graduation 15,714 0,003 No of yrs in employment 12,166 0,002 Place of origin 9,550 0,008
4. Conclusions
The main characteristics of teachers working in Primary and Secondary education in Eastern Macedonia are the following: the largest percentage come from villages or small towns, are permanent staff, aged over 30 and have been in employment for over five years. Regarding gender, they are more or less equally balanced.
Their environmental knowledge is judged sufficient only on certain issues. Thus, there is a lack of knowledge on current issues linked to sustainable development and biodiversity.
In total, a better knowledge of the environment characterizes men rather than
women [8], [26], those who come from the city rather than a small town, and older people who graduated and started work many years ago rather than younger teachers, who only recently graduated and have just been appointed. Finally, permanent teachers have a better knowledge surrounding the environment compared to their substitute colleagues [3].
The environmental attitudes of teachers concerning most environmental topics are clear. Thus, they are opposed to the use of nuclear energy and the establishment of industries that pollute the environment, while they actively recycle and think of the ecological impact caused by the products they purchase.
169
“Sustainable Management and Development of Mountainous and Island Areas”

Table 7. Results of the Mann–Whitney statistical test on environmental attitudes
Variable Category Mean Rank Mann-Whitney U Significance
Male 778,88 Gender Female 869,29 301850,00 0,000
<30 288,93 Age groups 40-50 385,83 15733,50 0,001
<10 226,16 No of yrs since
graduation 20-25 260,70 24507,50 0,009
<5 456,98 No of yrs in employment >15 509,99 101107,50 0,004
Permanent 833,03 Employment status Substitute 727,13 122149,00 0,003
Village 707,15 Place of origin City 642,66 202148,00 0,002
The characteristics of those teachers who present a heightened environmental awareness are similar to the characteristics of those teachers whose level of knowledge is also higher [17]. Their place of origin is the only exception regarding to environmental awareness, as the teachers who come from villages are more aware than those coming from cities; furthermore, women teachers are more environmentally-aware than men.
Those who teach Environmental Education in Primary and Secondary education should therefore be older and more experienced teachers.
In conclusion, we could say that training is required in order to improve the teachers’ environmental knowledge, particularly of those teachers who would like to get involved in E.E., and who are quite young and have only recently completed their studies. On the other hand, the syllabus of various University Departments linked to education should also be updated in order to include mandatory courses with an ecological content.
5. References
[1] Aivazidis K. Exploring the Knowledge and Attitudes – Views of Students at the A.U.Th. Graduate paper. School of Biology. Thessaloniki: A.U.Th.; 1998.
[2] Alvarez P, Emilia I, Perales F, Garcia J. Analysis of A Quasi-Experimental Design Based on Environmental Problem Solving for the Initial Training of Future Teachers of Environmental Education. Journal of
Environmental Education, 2002; 33(2):19-21.
[3] Barba RH, Rubba, PA. A Comparison of Preservice and Inservice Earth and Space Science Teachers' General Mental Abilities, Content Knowledge, and Problem-Solving Skills. Journal of Research in Science Teaching 1992: 29(3); 520-535.
[4] Douvli P. Recording the Knowledge, Views and Attitudes of Pupils in the 1st Grade of Lykeio on Environmental Issues. Post-graduate paper. School of Biology. Thessaloniki: Aristotle University of Thessaloniki; 1997.
[5] Georgopoulos . The Problematics of Environmental Education, in Ecology and Sciences of the Environment. Athens: Stochastis publications; 1988.
[6] Goupos T. An Assessment of the Difficulties Faced by Teachers in Pre-school, Primary and Secondary Education, who are Active or Would Like to Become Active in Environmental Education Programmes in School. For Environmental Education 2001: 21; 13-20.
[7] Halkos G. Statistics. Theory, Applications and Use of Statistical Programmes on the Computer. Athens: Typothito Publications – Giorgos Dardanos; 2000.
[8] Hausbeck K, Milbrath L, Enright S. Environmental Knowledge, Awareness and Concern Among 11th Grade Students: New York State. Journal of Environmental Education 1992: 24(1); 27-34.
[9] Hines J, Hungerford M, Tomera N. Analysis and Synthesis of Research on Responsible
170

Environmental Behaviour, A Meta-Analysis. Journal of Environmental Education 1986: 18(2); 1-8.
[10] Iozzi L. What Research Says to the Educator: Part one. Environmental Education and the Affective Domain. Journal of Environmental Education 1989: 20(3); 3-9.
[11] Kalaitzidis D. School Geography and Environmental Education. PhD Thesis.
lexandroupoli: D.U.Th.; 1999. [12] Kiochos P. Statistics. Athens: Interbooks
Publications; 1993. [13] Leeming F, Dwyer W, Porter B, Cobern M,
Oliver D. Effects of Participation in Class Activities on Children’s Environmental Attitudes and Knowledge. Journal of Environmental Education 1997: 28(2); 33-42.
[14] Leeming F, Dwyer W, Porter B, Cobern M. Outcome Research in Environmental Education, a Critical Review. Journal of Environmental Education 1993: 24(4); 8-21.
[15] Makrakis V. Data Analysis in Scientific Research with the Use of SPSS. Athens: Gutenberg publications; 2005.
[16] Matis . Forest Sampling. Publications Service. Thessaloniki: A.U.Th.; 1988.
[17] Pettus A, Frary M, Teates, TG. The Attitudes of Science and Social Studies’ Teachers toward Environmental Issues. Journal of Research in Science Teaching 1978: 15(5); 367–372.
[18] Rakintzi . A study of the Knowledge, Attitudes and Views of Teachers in Secondary Education Regarding the Environment. Post-graduate paper. School of Biology, Thessaloniki: Aristotle University of Thessaloniki; 1997.
[19] Rakow S. A Review of Teacher Inservice in Environmental Education 1970-1980. Journal of Environmental Education 1985; 16(4); 7-10.
[20] Szagun G, esenholl E. Environmental Ethic: An Empirical Study of West German Adolescents. The Journal of Environmental Education 1993: 25(1); 37-44.
[21] Tsachalidis , Galatsidas S, Christopoulou O, Tsantopoulos G. Research on the Provided Environmental Education at the Secondary Schools of Eastern Macedonia. Minutes of the 4th International Conference “Technology of the Environment”, -
TCG. ELECO’ 03; 2003 30 Jan - 2 Feb; thens; 2003.
[22] Tsachalidis , Galatsidas S, Tsantopoulos G. Personal Characteristics of the Teachers at Primary Schools of three Prefectures in Eastern Macedonia and their Relation to the Environmental knowledge and attitudes of the Teachers. Proceedings of VIo
Panhellenic Geographic Conference of the Hellenic Geographic Information Society; 2002 ct 3 – 6; Thessaloniki; 2002.
[23] Tsachalidis , Tsantopoulos G, Galatsidas S, Amoiridou Th. Primary Environmental Education in Eastern Macedonia. Applications – problems. Minutes of the 2nd
Panhellenic Conference of the Society of Sciences and Education; 4-6 ov 2005; Drama; 2005a.
[24] Tsachalidis , Tsantopoulos G, Galatsidas S,. Amoiridou Th. A Study of the Environmental Knowledge and Attitudes of the Teaching Staff in Primary Education in the Drama Prefecture. Minutes of the 2nd
Panhellenic Conference of the Society of Sciences and Education; 4-6 ov 2005; Drama; 2005.
[25] Williams M, McGrorie R. The Analysis of Ecological Attitudes in Town and Country. Journal of environmental management, 1990: 31; 157-162.
[26] Zimmermann LK. Knowledge, Affect, and the Environment: 15 Years of Research (1979-1993). The Journal of Environmental Education 1996:27 (3); 41-44.
[27] Zverev D. Youth and Natural Environment: a Survey in the USSR. Prospects 1984: 15(2); 261-268.
171

Contributing to Local Development: The Case of a Bioethanol Production Industrial Unit
Michael N. Tsatiris, [email protected] A. Skondras, [email protected]
Sarantis – Aggelos G. Liampas, [email protected] I. Gkotsis, [email protected]
Department of Forestry and Management of the Environment and Natural Resources. Democritus University of Thrace, Greece.
Abstract. In this work, the application of sweet sorghum (Sorghum bicolor) cultivation for bioethanol production in conformity to the European Parliament instruction 2003/30/EC/08.05.03 for the substitution of conventional fuels with alternatives is studied.The views of the inhabitants of the municipality of Trigono related to the cultivation of sweet sorghum as a plant raw material for bioethanol production in the municipality of Trigono as well as for the contribution by the establishment of an industrial productive unit of this specific biofuel to the local development are investigated. Data were collected by heads of selected households of the municipality of Trigono through personal interviews and by using a questionnaire.
Keywords: sweet sorghum, bioethanol production, biofuel, bioenergy, local development, municipality of Trigono.
Introduction
The European Parliament, by creating the instruction 2003/30/EC/08.05.03 relative to the promotion of biofuels or other renewable fuels for transport usage, summoned all the European Union members to substitute conventional fuels at least 20% until 2020. Also, all the members of the Union are obliged to use biofuels at the minimum percentage of 5.75%, which, in Greek standards is corresponded to a production of 390000 tones of bioethanol.[7]
The country which is already considered to be successful in replacing the conventional fuels with biofuels, is Brazil whose efforts in bioethanol production, which was supposed to replace the oil are
considered to be absolutely successful. An 80% of the new automobiles in the country has the ability to use a gasoline and ethanol mixture, while a percentage of more than 20% of the whole number of the means of transport uses bioethanol exclusively [6 ].
Bioethanol in Brazil is produced by using sugar cane as a plant raw material, in the U.S.A. by using corn and in France by using wheat and sugar beet. In Greece there is no bioethanol production currently as a biofuel for automobiles[6].
For the production of bioethanol the agricultural plants which can be used are the sugar beet, the sugar cane, the corn, the wheat and sweet sorghum. The last one gave unexceptionable results in the experimental cultivations which took place in North Greece and in Kopaida region. Its output in sugar is remarkable and is characterized by a high photosynthetic ability contributor. In the Table 1, the output in biomass and bioethanol per acre of the above mentioned plants is shown [7].
Table 1: Output in biomass and bioethanol per acre of some agricultural plants.
Energy Cultivations
Biomass Tones/Acre
Bioethanol Litres/Acre
Sweet sorghum 28 - 32 2680 Corn 4 1600 Sugar beet 26 2320 Wheat 1.6 560
Source: [7]
One of the most remarkable ideas for biofuel production in Greece, is the idea of the establishment of an industrial unit of bioethanol production in the municipality of Trigono in Evros prefecture which is going to use sweet sorghum as a plant raw material.
172
“Sustainable Management and Development of Mountainous and Island Areas”

The municipality of Trigono is located in Evros prefecture. According to the census of 2001, the population of the municipality consists of 6656 habitants and its size is 91913.58 acres. It is the northernmost municipality of Greece as it is located above the Ardas River between Greece, Turkey and Bulgaria. The economy of the municipality is mainly based on agriculture. The usual cultivations are corn, cotton and wheat as well as other cultivations in lesser extent. The problems in agriculture did not let the area unaffected. The population of the municipality has decreased through the last years.
We believe that the establishment of a bioethanol production industrial unit which will use sweet sorghum as a plant raw material will comprise respiration for the greater region of Evros prefecture because apart from the biofuel production, the cultivation of sweet sorghum which will probably be well bounded, will provide economic motives to the planters of the area, support the agricultural economy and sustain the population in the countryside.
In this work, the views of the inhabitants of the municipality of Trigono related to the cultivation of sweet sorghum as a plant raw material for bioethanol production in the municipality of Trigono as well as for the contribution by the establishment of an industrial productive unit for this specific biofuel are investigated.
Methodology
The municipality of Trigono consists of 2684 households [5]. The formula of simple random sampling without repetition was applied to estimate the sample size (n) with given accuracy and minimum cost, for the “population” of the municipality of Trigono [2], [4]:
N * t2 * s2
n = N * d2 + t2 * s 2
Where n: size of sample d: absolute error S: standard deviation
2684 = N: the number of households of the municipality of Trigono or the size of the “population” 2.021 = t: the value of STUDENT distribution for probability (1-a)% = 95% and n-1 (41-1 = 40) degrees of freedom.
The unknown parameters d and s were estimated with the help of a pilot sampling [1], where a presample of 41 households-observations was randomly taken by the municipality of Trigono. Particularly, the quantitative variable “mean annual production of agricultural products per household” which presents the largest standard deviation regarding the mean (a borderline case) was selected and then the standard deviation of this variable was used in the above formula as a standard deviation (S). The characteristic values of the variable were: x (mean)=35.42 tons of agricultural products
per household and year and s=7.61 tons of agricultural products per household and year. The absolute error (d) or the estimation’s accuracy was taken as being equal to 2% of the population mean, namely d=0.02 * 35.42 or d=0.708. So, the sample’s size (n) was estimated as follows:
2684·(2.021)2·(7.61)2
n=
2684·(0.708)2+(2.021)2·(7.61)2
n=402 households
The 402 households of the sample were then precisely located (full name and address) by using random numbers on the consumers’ list of domestic electric current. Data were collected by the realization of personal interviews and filling in a questionnaire from the selected households of the municipality of Trigono. The heads of selected households were informed by letters about the purpose of this research and the time of the interview for each household was prefixed. Data were obtained by 100% of the selected households. The analysis of the data was carried out by using the statistical package for social sciences, SPSS version 12 for Windows as well as by the Excel programme for Windows.
Results – Discussion
The analysis of the data which were collected from a sample size of 402 households from the municipality of Trigono, showed the planters’ great dissatisfaction which comes from the bounties of their products (Fig.1), the
173
“Sustainable Management and Development of Mountainous and Island Areas”

country’s agrarian policy as well as their discomposure to the fact that young people do not work in agriculture and seek other ways to survive which has as a consequence the gradual depopulation of the countryside.
Are you satisfied from the bounties you reciev e?
0
50
100
150
200
250
300
350
400
450
YES NO
Answer
Figure 1: The disappointment of the planters for the bounties of their products.
The majority of those who were asked (74%) believes that the young people abandon agriculture mainly due to the lack of economic amplifications and facilitations as well as the lack of vision which will give them motivation to turn to this specific section. This can be tangible from the fact that the 74% of those who were asked is minded in turning its tillage into sweet sorghum (Fig.2) having the conviction that profit will come out of this change.
Will you change your tillage into Sweet sorghum?
YES
74%
NO
26%
Figure 2: The willingness of the planters for the cultivation of Sweet sorghum.
In the question relative to the income from the cultivation of sweet sorghum, comparably to any other agricultural plant 81% believes that it will rise while 2% believes that it will be decreased
and the rest 17% believes that it will remain immutable (Fig.3). The divergence of the percentage between those who believe that their income will rise from the change of their tillage (81%) and those who are really minded to change it (74%), exists due to several factors such as the difficulty of convincing the demands of the new tillage.
What do you believ e it will happen to your income?
It will rise
81%
It wii remain the
same
17%
It wiil be reduced
2%
Figure 3: Expectancy of the planters of how their income will be affected by the cultivation of
Sweet sorghum.
Despite the fact that the above mentioned data are encouraging for the establishment of a bioethanol production industrial unit in the municipality of Trigono, a prominent percentage of those who were asked, encounters this issue with great wariness. In the question relative to the public’s opinion about the possibility for this industrial unit to be constructed, the negative answer prevails with a percentage of 59.3% over the positive answer which touches the percentage of 25.6%. The rest 15.1% chose not to answer this question (Fig.4). This great negative percentage can be partly justified because of the dissatisfaction and disbelief that has been caused to the agrarian population because of the way in which the state takes care of the agrarian issues especially in borderlands.
174
“Sustainable Management and Development of Mountainous and Island Areas”

Do you believe that the bioethanol production industrial unit w ill be constructed?
0
50
100
150
200
250
It w ill not be constructed It w ill be constructed
Figure 4: The planters’ opinion about the construction of the unit.
At the percentage of 68% those who were asked, had been informed for the establishment of a bioethanol production industrial unit by the local authorities and at the percentage of 30.5% by fellow-villagers. The rest percentage had been informed in different ways (Fig.5). The municipality of Trigono, provides young and new planters agrarian seminars which are relative to the cultivation of sweet sorghum. All the above mentioned information shows the mobilization of the local authorities in order to inform those who are interested in cultivating sweet sorghum for the operation of this specific industrial unit.
W here did you get you informatio n from?
0
50
100
150
200
250
300
Grange Local Authorities Press Radio Television
Figure 5: Ways of information about the establishment of the bioethanol production
industrial unit.
In the question relative to the contribution of this unit to local development (Fig.6), 80.7% of those who were asked, believe that this unit will comprise an important attraction pole for incoming planters considering the fact of the reduced taxes which will be paid by those who will take part in the bioethanol production program, the relatively higher bounties and the capability of the unit to employ a large part of
the area’s population. Besides, it is common conviction that the unit will constitute an attraction pole for the youth who left the area because of the lack of occupation. This is based on the fact that the unit will be able to absorb almost the total amount of the plant production of a cultivating area that reaches 49382.72 acres [3].
Do you believ e that the unit will contribute to the dev elopment of the area?
YES81%
NO
5%
IT Will Remain the
Same
14%
Figure 6: Conviction of the planters about the contribution of the unit to the development of
the area.
Specifically, regarding the question “what biofuels do the planters know” – including wood, agricultural by-products, bioethanol and biodiesel – wood prevailed (100%) over the others because it constitutes the simplest and most familiar renewable energy source. The agricultural by-products are known at a percentage of 35%, while only 20% of those who were asked were aware of what bioethanol is and 6% of them knew about biodiesel. (Fig.7)
Which renewable fuel do you know?
0
50
100
150
200
250
300
350
400
450
Wood Agricaltural By-products
Bioethanol Biodiesel
Figure 7: The biofuels the planters are aware of.
Conclusion
The establishment of a bioethanol production industrial unit using sweet sorghum as a plant raw material in the municipality of Trigono will upgrade the greater region of
175
“Sustainable Management and Development of Mountainous and Island Areas”

Evros prefecture. This industrial unit will contribute to the local development as it can provide jobs for a great part of the rural population for the cultivation of sweet sorghum as well as the absorption of the plant production of a great cultivating area. The bounties and the tax exemptions that will come from the cultivation of sweet sorghum will give to the planters of the region the opportunity for greater financial profits which implies prosperity for the region as well as energy profit for Greece coming from the production of bioethanol and the reduction of fossil fuels importation.
References
[1] Dalianis, K. 1972. Designing and Analysis of Experiments. Athens.
[2] Freese, F. 1962. Elementary Forest Sampling. USDA Forest Service.Agric. Hand. No 232 [3] Goutkidis, P. 2006. Mayor in the
Municipality of Trigono. Personal Communication.Dikea.
[4] Matis, K. 1988. Forest sampling.Aristotelian University, Thessaliniki.
[5] N.S.S.G. 2005. Results of a census about population and households (2001) Prefecture of Evros. National Statistical Service of Greece. Athens.
[6] Newspaper “The Investor’s World”. 2006. Ethanol production in the world. 27-28 May 2006. Athens, pp.30-31
[7] Vakakis. 2006. Energy Cultivations and Agrarian Income. Athens.
176
“Sustainable Management and Development of Mountainous and Island Areas”

The utilization of Zeolite of the municipality of Trigono as a soil ameliorative for plant raw material cultivation for biofuel production
Michael N. Tsatiris, [email protected] – Aggelos G. Liampas, [email protected]
Rigas A. Giovannopoulos, [email protected]
Department of Forestry and Management of the Environment and Natural Resources. Democritus University of Thrace, Greece
Abstract. Zeolite (Clinoptilolite) is a friendly to environment mineral. The views of the inhabitants of the municipality of Trigono concerning the utilization of zeolite as a natural soil ameliorative for the cultivation of sweet Sorghum (sorghum_bicolor) which will be used as a plant raw material for the production of bioethanol in Municipality of Trigono (Evros, Greece) are investigated. The excavation of Zeolite aims at the exploitation of its physicochemical properties as well as mineral and chemical constitution, since zeolite acts as an ion exchanger and catalytic converter. Data were collected by the heads of selected households of the municipality of Trigono through personal interviews and by using a questionnaire.
Keywords: zeolite, Clinoptilolite, soil ameliorative, sweet sorghum’s cultivation, bio ethanol’s production, municipality of Trigono.
Introduction .
Zeolites (Greek, zein, "to boil"; lithos, "a stone") are minerals that have a porous structure. The term was originally coined in the 18th century by a Swedish mineralogist named Axel Fredrick Cronstedt who observed, upon rapidly heating a natural mineral that the stones began to dance about as the water evaporated. Using the Greek words which mean "stone that boils," he called this material zeolite. More than 150 zeolite types have been synthesized and 48 naturally occurring zeolites are known. They are basically hydrated alumino-silicate minerals with an "open" structure that can accommodate a wide variety of positive ions, such as Na+, K+, Ca2+, Mg2+
and others. These positive ions are rather loosely held and can readily be exchanged for others in a contact solution.
The important part of the Natural Zeolite is the crystalline hydrated alumino-silicate of alkaline metals and metals of alkaline earths (Ca, K, Na, Mg) called Clinoptilolite which is found in Petrota and Pentalofos of the municipality of Trigono (Evros, Greece) (Fig.1). This zeolite deposit is of a great economic interest, considering that it is the richest among the zeolite formations in North-eastern Greece (4.7 x 10⁶ tons). [1]
PetrotaClinoptilolite Mordenite
PentalofosClinoptilolite
MetaxadesClinoptilolite Heulandite Mordenite
Dadia - LefkimiClinoptilolite Heulandite Mordenite
LefkadaClinoptilolite
KefaloniaClinoptilolite
ZakynthosClinoptilolite
SamosClinoptilolite Mordenite Analcime Erionite Chabazite Phillipsite
KimolosClinoptilolite MordeniteMilos
Clinoptilolite Mordenite
Thira(Santorini)Clinoptilolite Mordenite
PolyegosMordenite
KomotiniAnalcime ClinoptiloliteMordenite
FerresHeulandite Mordenite
Figure1. Existence’s areas of clinoptilolite deposits in Greece [7]
Clinoptilolite is a 100% natural nutrient and water management system that promotes [7]: a) Lower fertilizer cost and water conservation, b)Improved plant "yields", growth in poor, sandy and porous soils, c)Balanced pH (7.0) and aerated soil, d)Proven soil buffering and encapsulation of: d1)Noxious gases preventing root decay, d2)Toxic chemicals, hydro carbons heavy metals and salts. Clinoptilolite improves the efficiency of used fertilizers and thus
177
“Sustainable Management and Development of Mountainous and Island Areas”

promotes better plant growth and consequently enhances the yield. Clinoptilolite added to fertilizers helps to retain nutrients and, therefore, the long term soil quality is improved, enhancing its absorption ability. It concerns the most important plant nutrients such as nitrogen (N) and potassium (K), and also calcium, magnesium and micro-elements [6]. Clinoptilolite is used successfully in the cultivation of a wide variety of crops including cereals, vegetables, grapes, other fruits and sorghum. [10]. A variety of biomass sources can be used for producing bio-ethanol, among these is sweet sorghum, which is an annual crop with high photosynthetic rate among crop plants, high biomass yields potential and high percentage of easily fermentable sugars [2], [4]. Clinoptilolite which is found in Petrota and Pentalofos of the municipality of Trigono could be utilized as a soil ameliorative for cultivation of sweet sorghum which is going to be used as a raw material for bio ethanol production in the above mentioned area.
The views of the inhabitants of the municipality of Trigono concerning the utilization of Clinoptilolite as a natural soil ameliorative for the cultivation of sweet sorghum which will be used as a plant raw material for the production of bio ethanol in the municipality of Trigono are investigated.
Methodology
The municipality of Trigono consists of 2684 households [9]. The formula of simple random sampling without repetition was applied to estimate the sample size (n) with given accuracy and minimum cost, for the “population” of the municipality of Trigono [5], [8]:
N * t2 * s2
n = N * d2 + t2 * s 2
Where n: size of sample d: absolute error S: standard deviation
2684 = N: the number of households of the municipality of Trigono or the size of the “population”
2.021 = t: the value of STUDENT distribution for probability (1-a)% = 95% and n-1 (41-1 = 40) degrees of freedom.
The unknown parameters d and s were estimated with the help of a pilot sampling [3], where a presample of 41 households-observations was randomly taken by the municipality of Trigono. Particularly, the quantitative variable “mean annual production of agricultural products per household” which presents the largest standard deviation regarding the mean (a borderline case) was selected and then the standard deviation of this variable was used in the above formula as a standard deviation (S). The characteristic values of the variable were: x (mean)=35.42 tons of agricultural products
per household and year and s=7.61 tons of agricultural products per household and year. The absolute error (d) or the estimation’s accuracy was taken as being equal to 2% of the population mean, namely d=0.02 * 35.42 or d=0.708. So, the sample’s size (n) was estimated as follows:
2684 * (2.021)2 * (7.61)2
n = 2684 * (0.708)2 + (2.021)2 * (7.61)2
n=402 households
The 402 households of the sample were then precisely located (full name and address) by using random numbers on the consumers’ list of domestic electric current. Data were collected by the realization of personal interviews and filling in a questionnaire from the selected households of the municipality of Trigono. The heads of selected households were informed by letters about the purpose of this research and the time of the interview for each household was prefixed. Data were obtained by 100% of the selected households. The analysis of the data was carried out by using the statistical package for social sciences, SPSS version 12 for Windows as well as by the Excel programme for Windows.
178
“Sustainable Management and Development of Mountainous and Island Areas”

Results – Discussion
The majority of the residents of the municipality of Trigono (68%) are well aware of the fact that there are zeolite deposits in Trigono (Fig.2). This is proof that the residents of that area are interested and well-informed about the natural resources which are present in their area and can be used in many industrial sectors.
" Do you know about the zeolite deposits in your area? "
68%
32% YesNo
Figure2. Acquisition of knowledge of subjects of the existence of Zeolite deposits in the area of Trigono, Evros
The average age of the people who were questioned were between the age of 50 to 64 years old (54%). This percentage can go as high as 63% for the total of people over 50 (Fig.3). This is due to the fact that the municipality of Trigono is located in an area where the main occupation of the inhabitants is agriculture, and young people prefer to move to cities and find employment there than work in the fields as farmers. This situation is caused because of the fact that there are no financial advantages or benefits, and also because of the lack of vision or any form of motivation from the state to help them stay and work in the agricultural sector.
Age of Subjects:
18-3313%
34-4924%
50-6554%
65+9%
18-33
34-49
50-65
65+
Figure3. Age of Subjects
72% of the inhabitants of the municipality of Trigono are aware of the excavation program in the area of Petrota, due to the fact that it is a
small community and the locals can get informed relatively easily about what is taking place in their county (Fig.4).
" Do you know about the excavation program in the area of Petrota-Evros? "
28%
72%
Yes
No
Figure4. Subject notification of the excavation program in the area of Petrota-Evros.
Despite the fact that there are positive elements for the construction of a bio-ethanol plant in the municipality of Trigono, only a relatively small percentage of the subjects (43%) did know that sweet sorghum is a major raw material for the production of bio-ethanol (Fig.5). In order to inform the people interested, the mobilization of the responsible bureau or agency is required, so that they participate in the bio-ethanol production program through the cultivation of the sweet sorghum. One such effort would be considered enough to attract younger people into farming and as a direct result bring them back to the countryside. Some 37,500-50,000 acres of land have to be cultivated in order to have a satisfactory production of bio-ethanol. It is clear that such a vast area of land needed (for Greek standards) would offer occupation to a significant number of young farmers.
“Are you aware of the fact that bio-ethanol can be produced from sweet
sorghum?”
57%
43% Yes
No
Figure5. Subject notification for the production of bio-ethanol by the cultivation of sweet sorghum
It is worth noticing that the majority of the subjects were familiar with the beneficial
179
“Sustainable Management and Development of Mountainous and Island Areas”

properties of using clinoptilolite as a soil ameliorative (one of its uses) and approximately 78% of them are ready to use clinoptilolite in their crops and specifically in the cultivation of sweet sorghum, if there is encouragement of its production by the state (Fig.6). All of them expect a higher yield in their crops as a direct result of the use of the particular ameliorative.
“Do you have any intention of using natural zeolite as a natural soil ameliorative in your crops?”
Yes78%
No22%
Figure6. Intention of subjects regarding usage of clinoptilolite as a soil ameliorative in crops
There were six different answers regarding the above question about the means of information for the beneficial properties of clinoptilolite as a soil ameliorative. Most people were notified by the Agricultural Cooperative (38%), many by the Local Prefecture (31%) and quite a few from their fellow-villagers (25%). It is important to mention that only a small percentage of the population (a total of 6%) were notified through the Mass Media (Radio-Television-Press) (Fig.7).
2 17 7
122 99155
050
100150200
TelevisionRadio Press
Local Prefecture
Fellow-villagers
Agricultural Coope...
“How were you informed about clinoptilolite?”
Figure7. Means of information about the beneficial uses of clinoptilolite as a soil ameliorative.
Regarding the question on the uses of zeolite, most subjects were familiar with two of its major applications: First, as an animal feedstuff (32%) and second as a soil ameliorative for crops (26%). Zeolite application as greenhouse “bedding”, as a means for cleaning sewage, as an ameliorative
for acidic soils and in the detergent industry are little known (13%-10%-8%-8% respectively). The uses of clinoptilolite for the enrichment of oxygen as well as the purification of natural gas are almost unknown (2%-1% respectively) (Fig.8).
" Are you familiar with any of the following uses of Zeolite? "
greenhouse “bedding”
13%
cleaning sewage10%
ameliorative for acidic
soils 8%
enrichment of oxygen
2%
purification of natural gas
1% detergent industry
8%
animal feedstuff
32%
soil ameliorative
for crops 26%
Figure8. Knowledge of subjects about the uses of zeolite.
Conclusion
The subjects have been informed about the beneficial uses of clinoptilolite as a soil ameliorative (mainly from the Agricultural Cooperative or the Local Prefecture) and are willing to use it in their crops expecting a greater yield on their production. The general belief of the residents was that they needed support from the state. The excavation of clinoptilolite and its use as a soil ameliorative generally and specifically in order to improve the yield of the cultivation of the sweet sorghum, which will be used as a raw material for the production of bio-ethanol (in the new bio-ethanol plant that will be built in the area), will bring prosperity to the local community and a boost to the local economy.
References
[1]Barbieri, M, Castorina, F, Masi, U, Garbarino, C, Nicoletti, M, Kassoli-Fournaraki, A, Filippidis, A and S. Mignardi. 2001. Geochemical and isotopic evidence for the origin of rhyolites from Petrota (Northern Thrace, Greece) and geodynamic significance, Che./ Erde (61):13-29
[2]Berenson,F.2004. Sweet sorghum as a raw material for ethanol production. Proceedings of a workshop “Biomass for Energy”. CNRE Bulletin No.18, 14-15 Sept. 2004, Hamburg.
180
“Sustainable Management and Development of Mountainous and Island Areas”

[3]Dalianis, K. 1972. Designing and Analysis of Experiments. Athens
[4]Dendy, D.A.V. 1995. Sorghum and Millets: Chemistry and Technology. London.
[5]Freese, F. 1962. Elementary forest sampling. USDA Forest Service. Agric. Hand.No.232
[6]Hall, A., Stamatakis, M.G. & J.N. Walsh. 2000. The Pentalofos zeoletic tuff formation: A giant ion-exchange column, Annales Geologiques des Pays Helleniques, 38, Fasc, C.,
[7]Kirov, G.N., Filippidis, A., Tsirambidis, A., Tzvetanov, R.G. & A. Kassoli-Fournaraki.1990. Zeolite-bearing rocks in Petrota area, Greece. Geol. Rhod. (2): 500-511.
[8] Matis, K. 1988. Forest sampling. Aristotelian University, Thessaloniki
[9] N.S.S.G. 2005. Results of a census about population and households (2001). Prefecture of Evros. National Statistical Service of Greece. Athens
[10] Wilson, G, Pond, W and F. Mumphton. 1984. Zeo-Agriculture, Use of Natural Zeolites in Agriculture and Aquaculture. International Committee on Natural Zeolites. Brockport, New York.
181
“Sustainable Management and Development of Mountainous and Island Areas”

Hydrologic Balance and Aquifer Systems on the Island of Naxos, Cyclades, Greece
A. Vasalakis1, K. Voudouris1
1Lab. of Engineering Geology & Hydrogeology, Dept. of Geology, Aristotle University of Thessaloniki, 54124 Thessaloniki, Greece.
E-mail: [email protected]
Abstract. The island of Naxos, the largest island in Cyclades Archipalago, is poor in surface water and dependent on groundwater resources for its puplic water supply. The island is characterized by increased demands of water, during the last decades, due to tourist development and intense irrigation. This paper deals with the water balance and the occurrence of groundwater resources on the island of Naxos. Firstly, the geological features are explored. Afterwards, the parameters of hydrological cycle, including rainfall, evapotranspiration, infiltration and surface runoff are examined. The water balance parameters have been computed using the Thornthwaite and Mather method with the use of GIS. Monthly rainfall data from four rain gauge were used, covering a period 1987-2003. The main aquifers of the island are developed in the marbles or in formations comprising layers of schists and marbles.
Keywords: Aquifers, Cyclades, Hydrologic balance, Naxos.
1. INTRODUCTION
The island of Naxos is located in the Cyclades Archipelago (Aegean sea), covering an area of 431.5 km2. Approximately 18,188 people inhabit the island; the summertime population increases, due to tourism influx.
Geologically, the island of Naxos can be divided in (a) a metamorphic complex occupying the major part of the island (alternating marbles and schists), (b) a granodiorite and (c) minor undifferentiated rocks, mainly unmetamorphosed sediments and ophiolite suite rocks. Younger rocks are the Neogene and the Quaternary deposits [12]. The metamorphic complex is essentially composed of a sequence of alternating marbles and pelitic rocks.
Marbles dominate in SE Naxos and pelitic rocks are most abundant in central Naxos. Minor rock-types of the complex include amphibolites, quartzites, meta-conglomerates, metamorphosed
ultrabasic bodies and meta-bauxites. The permeable rocks cover about 50% of the total area of the island (Fig. 1).
Water demands have increased during the last decades and are mainly covered by groundwater abstracted from the aquifers via numerous wells and boreholes. Problems such as salinization, quality deterioration, decline of groundwater level and increasing pollution risks have been appearing, relating to the intensive exploitation in combination with the lack of rational water resources management [2, 4].
The water needs for irrigation purposes were estimated to be 13x106 m3/yr, whereas the water needs for domestic use are 2.5x10⁶ m3/yr [6].
Evaluating the components of hydrologic balance may contribute to overcome the disequilibrium in the water balance of the island. The main purpose of this study is to estimate the hydrologic balance of the island of Naxos. The morphological characteristics of the island are determined with the use of GIS based on the digital elevation model (DEM).
2. HYDROLOGY
2.1 Climate
The island of Naxos is characterised by a mean annual relative humidity of 70.4% (meteorological station of Chora Naxos). The most humid months are January and December followed by November and February. The driest months are June and secondly July. However, during the year, the value of humidity exceeds 67.5%. he lowest values of relative humidity precede the high temperature season and depend on the state of the winds (etesian winds). Due to the fact that the island of Naxos is located in rather open sea, powerful winds are frequent to occur affecting the climate.
The island has Mediterranean type climate with wet winters and hot, dry summers. Thehydrological year is considered to last from October to the end of September of the next year.
182
“Sustainable Management and Development of Mountainous and Island Areas”

According to the climatic classification of Koppen [3] the climate of the island belongs to the type Csa, indicating mild climate with dry summer and the mean temperature of the hotter month higher than 22°C. According to the climatic classification of Thornthwaite [9] the climatic type of Naxos climate is: DdB'3a' where: D: declares semi-dry climate d: absence or small surplus of water B'3: semi-hot type of climate a': very small rate of thermal activity during the summer.
2.2 Hydrologic balance
The knowledge of the hydrologic balance contributes to the optimisation of the water resources management of a region. The hydrology of the groundwater is dependent on the hydrology of the surface water. Thus, for the estimation of the groundwater water potential, the estimation of the hydrological balance is essential. The hydrologic balance is given by the equation: P R E I dw dq (1) where: P: rainfall, R: the surface flow, E: evapotranspiration, I: infiltration, dw: the variation of the quantity of groundwater reserves and dq: the result of human intervention
Considering the factors dw and dq asnegligible, the equation (1) becomes:
P R E I (2) The equation (2) refers to the surface water
balance of the region and not to the total water balance, due to the fact that for the determination of the total water balance, the determination of the quantitative variation of the groundwater reserves of the region (dw), as well as the magnitude of the anthropogenic interventions in the same region (dq) are required.
2.3 Data collection and analysis
The meteorological data used, were taken from four (4) meteorological stations of the island, located at Chora Naxos, Chalkeion, Kynidaros and Apeiranthos. The altitude of the stations is 5 m, 283 m, 427 m and 607 m a.s.l., respectively (Fig. 1).
Homogeneity of annual rainfall was checked by using the double mass curve analysis. This method compares the sum of the annual values of rainfall of one station, for a specific period of time, with the mean cumulative rainfall of a group of neighbouring stations, for the same
period [5, 13]. In our case the data coming from the four (4) rain gauge stations are sufficiently homogenous. The water balance parameters have been computed on the basis of procedures described by Thornthwaite and Mather [10, 15].
Figure 1. Geological map of island of Naxos showing the location of the meteorological stations.
2.4 Rainfall
The rainfall data used cover a time interval of 16 hydrologic years (1987-2003). This period is considered satisfactory and during that period all the stations were operating. The annual rainfall values from the four rain gauge stations of the island for the period 1987-2003, are shown in Table 1.
The correlation matrix of annual rainfall data is given in Table 2. A strong relationship is detected between the annual rainfall of four stations (r=0.64-0.91).
The mean annual rainfall of Chora station is 352.3 mm with a maximum of 651.9 mm recorded in 2002-03 and a minimum 140 mm recorded in 1989-90. The mean annual rainfall values of the remaining stations are: 698.2 mm (Chalkeion), 706.8 mm (Kynidaros) and 716.3 mm (Apeiranthos).
Applying the 5-years moving average similar wet and dry periods were identified at four stations. First rainfall occur in middle October or later in the lowlands.
An increasing number of droughts, as well as heavy rainstorms that caused flooding, have occurred during the last decades [15].
183
“Sustainable Management and Development of Mountainous and Island Areas”

Table 1. Annual values of rainfall (mm).ANNUAL RAINFALL (mm)
Chora Naxos Chalkeion Kynidaros Apeiranthos
Elevation (m) Year
5 m 283 m 427 m 607 m 87-88 341.3 654.1 657.1 742.5
88-89 317.2 544.0 533.7 553.7
89-90 140.0 243.5 315.2 335.6
90-91 351.3 793.1 786.2 913.0
91-92 280.9 547.4 560.2 498.8
92-93 311.4 626.9 602.5 634.1
93-94 383.1 619.6 547.7 576.6
94-95 403.3 902.4 952.2 879.0
95-96 381.1 854.6 795.5 1054.8
96-97 399.8 583.6 838.4 616.7
97-98 360.6 6595 683.2 546.3
98-99 485.1 784.5 900.3 591.2
99-00 169.2 349.4 347.8 355.7
00-01 233.9 465.5 432.8 491.2
01-02 427.1 1009.6 1002.5 1159,0
02-03 651.9 1534.2 1354.0 1512.8
mean 352.3 698.2 706.8 716.3
Table 2. Correlation matrix of the mean annual rainfall, measured at each station of Naxos island.
CHORA NAXOS KYNIDAROS APEIRANTHOS CHALKEIO
CHORA NAXOS 1
KYNIDAROS 0.89 1APEIRANTHOS 0.64 0.79 1
CHALKEIO 0.85 0.91 0.90 1
2.4.1 Relation between rainfall-altitude
The annual rainfall depth (P) is influenced by the elevation (H) of the region [11]. Simple linear regression between mean annual rainfall (the dependent variable) with altitude of each station (the independent variables) was applied in order to study the spatial distribution of rainfall. The obtained equation from the linear regression for the period 1987-2003 is (Fig. 2): P= 0.61 H + 416.6 (R2 = 0.76) (3)
It is obvious that the annual rainfall is correlated strongly with the altitude. According to the above equation an increase of annual rainfall of about 0.61 mm per 1 m of ground elevation. The mean altitude of Naxos island is 245.7 m. Thus, the mean annual rainfall depth in Naxos island for period 1987-2003 was estimated to be 566.5 mm.
2.4.2 Estimation of the rainfall water volume
In order to estimate the mean elevation of the island we realised a quantitative analysis of Naxos by digitalising the contours of 50 m of the topographic map and so creating a digitalized map of the region (Fig. 3). Table 3, shows the distribution of the surface of Naxos in relation to the elevation. The mean annual volume of rainfall of an area enclosed by two contour lines, can be estimated by multiplying the mean annual depth of rainfall at the mean altitude of the contours which enclose the area, by the surface of the area. So, the total mean annual volume of rainfall of Naxos, can be calculated by summing the volumes of rainfall that correspond to each area between successive contours (Table 4.)
Table 3. Distribution of the surface.
Contours (a) – (b)
Mean Elevation h'
(m)
Surface Ebetween (a) - (b) in km2
(%)
Cumulative E
(%)
0-50 25 68.81 15.9 15.9 50-100 75 46.04 10.7 26.6
100-150 125 41.82 9.7 36.3 150-200 175 41.19 9.5 45.8 200-250 225 35.81 8.3 54.1 250-300 275 33.14 7.7 61.8 300-350 325 29.47 6.8 68.7 350-400 375 27.28 6.3 75.0 400-450 425 24.9 5.8 80.7 450-500 475 20.49 4.7 85.5 500-550 525 15.77 3.7 89.1 550-600 575 13.01 3.0 92.2 600-650 625 10.32 2.4 94.6 650-700 675 8.58 2.0 96.5 700-750 725 6.21 1.4 98.0 750-800 775 4.17 1.0 98.9 800-850 825 2.16 0.5 99.4 850-900 875 1.29 0.3 99.7 900-950 925 0.91 0.2 100.0 950-1000 975 0.18 0.0 100.0
Total 431.55 100.0 100.0
y = 0,61 x + 416,6
R2 = 0,76
0
100
200
300
400
500
600
700
800
900
0 100 200 300 400 500 600 700
elevation (m)
annu
al ra
infa
ll (m
m)
Figure 2. Annual rainfall (mm) vs elevation (m).
184
“Sustainable Management and Development of Mountainous and Island Areas”

Table 4. Distribution of surface E, rainfall depth P and volume of rainfall water V at different elevations.
As shown in Table 4 the total mean annual volume of rainfall water that receives the island of Naxos is 249.75x10⁶ m3.
2.4.3 Distribution of rainfall during the year
The annual rainfall values concerning the rain gauge stations of the study area are presented in Table 1 and their graphic presentation is shown in Fig. 4. The previous diagram shows a wide fluctuation of the annual values of rainfall. The higher rainfall values are observed at the station of Apeiranthos.
The lower rainfall values were observed at the station of Cora Naxos. due to the low elevation. The hydrologic years which presented the higher values of rainfall are 2002-2003 and 2001-2002. The lower values of rainfall correspond to the hydrologic years 1989-1990 and 1999-2000.
The following Table 5 presents the mean monthly values of the four meteorological stations. According to Table 5. December has the highest monthly percentage of rainfall (23.1%), while November, January, February and March have equally important percentages.
Figure 3. Topographic map.
Figure 4. Fluctuation of the annual rainfall depth for the period 1987–2003.
Table 5. Mean monthly values of rainfall (mm) for the period 1987 – 2003.
h(m)
E(km2) P (mm) V
(106m3)V
(%) Cumulative
V (%) 25 68.81 431.91 29.72 11.90 11.90 75 46.04 462.44 21.29 8.52 20.42
125 41.82 492.96 20.62 8.25 28.68 175 41.19 523.49 21.56 8.63 37.31 225 35.81 554.01 19.84 7.94 45.26 275 33.14 584.54 19.37 7.76 53.01 325 29.47 615.06 18.13 7.26 60.27 375 27.28 645.59 17.61 7.05 67.32 425 24.9 676.11 16.84 6.74 74.06 475 20.49 706.64 14.48 5.80 79.86 525 15.77 737.16 11.63 4.65 84.52 575 13.01 767.69 9.99 4.00 88.51 625 10.32 798.21 8.24 3.30 91.81 675 8.58 828.74 7.11 2.85 94.66 725 6.21 859.26 5.34 2.14 96.80 775 4.17 889.79 3.71 1.49 98.28 825 2.16 920.31 1.99 0.80 99.08 875 1.29 950.84 1.23 0.49 99.57 925 0.91 981.36 0.89 0.36 99.93 975 0.18 1011.89 0.18 0.07 100.00
SUM 431.55 249.75 100.0
CHORA
NAXOS KYNIDAROS APEIRANTHOS CHALKEION
MONTHS RAINFALL (mm)
27.88 47.70 57.14 51.75
68.09 91.54 95.56 92.48
D 70.72 171.99 167.88 160.55
J 51.56 107.61 123.26 107.18
F 50.26 110.64 121.48 114.47
48.04 103.91 76.56 110.79
17.33 40.67 46.59 36.96
9.31 15.99 14.04 13.45
J 0.94 5.67 1.30 0.94
J 0.07 0.00 0.00 0.00
0.33 0.78 1.68 0.89
S 7.81 10.33 10.84 8.78
AVERAGE 352.3 706.8 716.3 698.2
185
“Sustainable Management and Development of Mountainous and Island Areas”

The driest months are June, July, August and September. Finally, a unevenness, referring to the seasonal distribution of rainfall was observed.
The main volume of rainfall water falls during winter (54%), while during summer the rainfall is insignificant (1%). Autumn and spring present roughly the same percentage of rainfall (23% and 22%, respectively).
Table 6. Mean monthly and seasonal (%) distribution of rainfall.
Monthly distribution of rainfall (%)
Month (%) Month (%)
OCTOBER 7.5 APRIL 5.7
NOVEMBER 14.1 MAY 2.1
DECEMBER 23.0 JUNE 0.4
JANUARY 15.7 JULY 0.0
FEBRUARY 16.1 AUGUST 0.2
MARCH 13.7 SEPTEMBER 1.5
Seasonal distribution of rainfall (%)
Season Mean (%)
AUTUMN 23.0
WINTER 54.9
SPRING 21.6
SUMMER 0.5
2.5 Evapotranspiration
2.5.1 Air temperature
For the calculation of the air temperature, the data of the meteorological stations stations of Chora Naxos and Chalkeion that concerned the common time interval between 1989 and 2001 were analysed. The monthly distribution of temperature during one hydrologic year in Naxos, (1989-2001) varies from 12.08 oC(January) to 25.3-25.2 oC (July - August) at Chora Naxos station and from 11.2 oC (January) to 26.4 oC (July) at Chalkeion station.
During 1989-2001 the fluctuation of the mean annual temperature at Chora Naxos station varies from 17.5 oC (hydrologic year 1991-1992) to 19.1oC (hydrologic year 2000-2001). The mean annual temperature at Chalkeion station is relatively higher, ranging from 16.6 oC(hydrologic year 1990-1991) to 19.8 oC(hydrologic year 1999-2000).
The aridity index (Id), which is mathematically expressed by the equation Id=P/(T+10), where, P is the mean annual rainfall in mm and T is the mean annual temperature in ºC, indicates a value of 12.38 at Chora Naxos station and 24.71 at Chalkeion station. This difference should be attributed to the difference of the rainfall depth of these two stations. It is pointed out that the two stations show almost equal values of mean annual temperature, while the depth of annual rainfall at the station of Chalkeion is approximately two times higher than the one at Chora station.
2.5.2 Real evapotranspiration
In order to calculate the real (actual) evapotraspiration, the Thornthwaite-Mather method [10], was used. This method is widely used for the calculation of both the monthly and the annual potential and real evapotranspiration. For the application of this method is necessary to determine the maximum water storage in the soil depending on the soil features; the grain size of the aquifer, the density and the type of vegetation, the depth of the water level and the inclination of the ground [15].
According to Soulios [7] in case of application of this method at the karst systems of Greece, the water storage in the soil (water-holding capacity) varies from 0-10 mm as far as it concerns completely naked karsts, to 50-60 mm concerning medium-high covered karst.
In our case the maximum water storage in the soil was determined as 70 mm for the station of Chora Naxos due to the alluvial deposits, that predominately cover the areas found at lower elevations and as 40 mm for the station of Chalkeion characterising higher elevations that are dominated by karstified marbles and green schists scarcely covered by flora. In order to calculate the real evapotranspiration (Er) using the potential evapotranspiration (Ep) the Thornhwaite balance was applied [10, 15].
For the application of the Thornthwaite- Mather method, the monthly values of rainfall and temperature were used. In our case the temperature data come from 2 meteorological stations which have a common period of measurements 1989-2001 whereas the rainfall data come from 4 stations, which have a common period of measurements 1987-2003. As far as it concerns the variation of the mean annual temperature of a region during a period of ~10 years, this variation is = ± 0.5 , where is
186
“Sustainable Management and Development of Mountainous and Island Areas”

the average and is the standard deviation. This fact allows data taken in different time periods to be used, with important statistical accuracy [13].
Applying therefore the method of Thornthwaite-Mather at Chora Naxos station and at Chalkeion station, was calculated that the mean coefficient of the real evapotranspiration are 77.5% and 42.4%, respectively.
From the graph (Fig. 5) it is found that water deficit is recorded during the period April-September, while water surplus and natural recharge is recorded during the period December-March when the water storage in the soil has its maximum capacity. During the period April-June the process of consumption of water storage in the soil takes place, while the period October-December is the replenishment period of water storage in the soil.
Figure 5. Hydrologic balance (Chora station). P: rainfall, EP: potential evapotranspiration, Er: real evapotranspiration (1) natural recharge= infiltration + water runoff, (2) water deficit, (3) evaporation of soil humidity, (4) replenishment of water storage.
As it appears in Table 4, 53% of the total volume of rainfall water falls at areas with elevation lower than 300 m (approximately the elevation of Chalkeion station).
For elevation lower than 300 m the value 77.5% was applied as coefficient of real evapotranspiration, value estimated for Chora Naxos station, while for areas with higher elevations was applied the value 42.2%, estimated for Chalkeion station.
The average coefficient of the real evapotranspiration is 61% of the rainfall water that falls in the island of Naxos (Table 7).
The remaining amount is allocated to runoff and infiltration.
Flow in the torrents of the island persist throughout the wet period. There are no available data for the discharge of the torrents of the island.
Table 7. Volume of water at different elevations.
h(m)
E(km2)
VP(106 m3)
VE(%)
VE(106 m3)
VP – VE(106 m3)
25 68.81 29.72 77.50 23.03 6.69
75 46.04 21.29 77.50 16.50 4.79
125 41.82 20.62 77.50 15.98 4.64
175 41.19 21.56 77.50 16.71 4.85
225 35.81 19.84 77.50 15.38 4.46
275 33.14 19.37 77.50 15.01 4.36
325 29.47 18.13 42.40 7.69 10.44
375 27.28 17.61 42.40 7.47 10.14
425 24.9 16.84 42.40 7.14 9.70
475 20.49 14.48 42.40 6.14 8.34 525 15.77 11.63 42.40 4.93 6.70 575 13.01 9.99 42.40 4.23 5.75 625 10.32 8.24 42.40 3.49 4.74 675 8.58 7.11 42.40 3.01 4.10 725 6.21 5.34 42.40 2.26 3.07 775 4.17 3.71 42.40 1.57 2.14 825 2.16 1.99 42.40 0.84 1.15 875 1.29 1.23 42.40 0.52 0.71 925 0.91 0.89 42.40 0.38 0.51 975 0.18 0.18 42.40 0.08 0.10
Sum 431.55 249.75 100.00 152.37 97.38 Average 61%
2.6 Infiltration
The variation between the real evapo- transpiration water volume and the rainfall water volume, constitutes the surplus of water and represents the amount of water that corresponds to the processes of runoff and infiltration.
The infiltration coefficient (i) expresses the percentage of the rainfall water that infiltrates in the ground. Previously it was estimated using the Thornthwaite-Mather method that, the mean real evapotranspiration coefficient of the island of Naxos is 61% of the annual rainfall depth. The remaining percentage refers to the processes of infiltration and runoff. Except from the rainfall depth the infiltration coefficient is also influenced by other factors. One of the most important factors is the soil type. Soulios [7] proposes some values regarding to the active infiltration presented by various rock types (Table 10).
From the Tables 8 and 9 it is concluded that a water volume about of 64x106 m3 infiltrate into
187
“Sustainable Management and Development of Mountainous and Island Areas”

the ground. Thus, the coefficient of infiltration is 25.6%. Table 8. Distribution of the geological formations in relation to the elevation.
Altitude (m)
0-200
200-400
400-600
600-800
800-1000
Sum / Formation
Alluvial 29.84 2.00 0.00 0.00 0.00 31.84 Ploutonic
rocks 33.37 3.00 0.00 0.00 0.00 36.37
Marbles 63.25 76.25 45.30 13.70 3.00 201.50
Schists – gneiss 68.32 25.00 16.67 9.00 1.00 119.99
Migma- tites 0.00 15.45 9.70 6.08 0.54 31.77
Amfi-bolites 3.09 4.00 2.50 0.50 0.00 10.09
Sum / Surface
Surface (106 m3)
197.9 125.7 74.2 29.3 4.5 431.5
Table 9. Distribution of the rainfall water volume in each geological fomations.
Altitude (m)
0-200
200-400
400-600
600-800
800-1000
Sum / Formation
Alluvial 14.05 1.19 0.00 0.00 0.00 15.24 Ploutonic
rocks 15.71 1.79 0.00 0.00 0.00 17.50
Marbles 29.79 45.47 32.33 11.41 2.83 121.83
Schists – gneiss 32.18 14.91 11.90 7.50 0.94 67.42
Migma-tites 0.00 9.21 6.92 5.07 0.51 21.71
Amfi-bolites 1.45 2.38 1.78 0.42 0.00 6.04
Sum / Surface
Water volume (106 m3)
93.2 74.9 52.9 24.4 4.3 249.8
2.7 Hydrologic balance
From the aforementioned estimates one can give the following approximate hydrologic balance for the island of Naxos (Table 11).
The annual surface water (R) was estimated to be 33.4x10⁶ m3. Construction of small dams and reservoirs, which will intercept and collect the surface runoff in order to save water is proposed [14].
Table 10. Estimatinon of the volume of infiltration per formation VI.
VP (106 m3) Infiltration index VI (106 m3)
Alluvial 15.24 17% 2.59 Ploutonic
rocks 17.50 1% 1.75
Marbles 121.83 45% 54.82 Schists –
gneiss 67.42 5% 3.37
Migmatites 21.71 5% 1.09
Amfibolites 6.04 6% 0.36 Sum /
Surface 249.75 25.6% 64.0
Table 11. Hydrological balance. P Er I R
Percentage (%) 100.00 61.01 25.62 13.37 Water
Volume (x106 m3) 249.75 152.37 63.99 33.39
Water depth (mm) 566.65 345.71 145.18 75.76
3. AQUIFER SYSTEMS
The main aquifer in Naxos island is developed in marbles, which are characterized by intense karstification and fracturing. A volume of water of 54.8x10⁶ m3/yr infiltrates in marbles aquifer and then a part of this volume is discharged through springs; submarine brackish water or inland freshwater springs. The transmissivity of karstified marbles calculated from pumping tests ranges between 10-4 and 10-2
m2/s [1]. In fault zones of impermeable rocks (schists,
gneiss, granite) aquifers are developed with low productivity; 1-2 L/s at boreholes and less than 5 L/s at springs [1].
In alluvial deposits, mainly in western part of the island, phreatic aquifer is developed with low permeability, due to the presence of fine particles. This aquifer shows signs of depletion and quality deterioration, due to the over-exploitation by numerous boreholes and wells. This reveals that the quantity of extraction of groundwater from the wells is more than the annual natural recharge of the aquifer.
Based on the hydrochemistry two main groups of groundwater samples can be identified [12]: Ca (Mg)-HCO3 (freshwater in marbles) and Na-Cl (water affected by seawater intrusion in coastal zones).
4. CONCLUSIONS
The island of Naxos is characterized by increased demands of water, during the last decades, due to tourist development and intense irrigation.
The medium altitude of Naxos island is 245.7 m and the total area that covers is 431.5 km2 (marbles 46.7%, schists 27.8%, unmetamorphosed sediments 7.4%, granodiorite 8.4%, migmatite 9.7%).
The rainfall (P) is strongly correlated with the altitude (H) by the relation P=0.61H+416.6
188
“Sustainable Management and Development of Mountainous and Island Areas”

(R2=0.76). Thus, the calculated mean annual rainfall depth of the island of Naxos is 566.5 mm, corresponding to 249.75x10⁶ m3/yr.
The rainfall occurs mainly from late October to May (85% of annual rainfall) and the peak season is from December to November. June and July are the months of the lowest rainfall of the island.
The coefficient of the real evapo-transpiration, which is estimated with the Thornthwaite-Mather method, ranges from 62% in the coastal areas to 46% in the mountainous areas of the annual rainfall. The volume of real evapotranspiration is estimated to be around 152.4x10⁶ m3/yr or 61% of the annual rainfall.
Using the same method, the natural recharge (infiltration) and runoff was estimated to be 64x106 m3/yr and 33.4x10⁶ m3/yr, respectively. Out of this amount, a volume of water of 54.8x10⁶ m3/yr infiltrates in the marbles.
The mean water balance shows a water surplus for the period January-April, while in May-June the process of consumption of soil humidity takes place. Water deficit is observed from June to October, while the period October-December is the replenishment period.
The main aquifers in the island of Naxos are developed in marbles (47% of the total area of island). The marble aquifer is characterized by intense karstification and fracturing. Aquifers of lower importance are also present in the Quaternary deposits of the island. The alluvial aquifer is over-exploited.
An integrated management strategy should be applied, based on the conjunctive use of groundwater, surface water, the discharge of freshwater springs in order to provide adequate water and to improve the sustainability of the groundwater resources of the island of Naxos.
Future investigations of the hydrological balance in the island of Naxos would benefit by improvement in hydrological data monitoring, the application of isotopic analysis and computer modelling to simulate the water cycle.
Bibliography
[1] Dazy, J., Drogue, C., Charmanidis, Ph., Darlet, Ch. The influence of marine inflows on the chemical composition of groundwater in small islands: the example of the Cyclades (Greece). Environmental Geology 31 (3/4) June 1997; 133-141.
[2] European Environment Agency (EEA). Water resources problems in Southern
Europe. Topic report, 15, inland waters (by Estrela, T., Marcuello, C., Iglesias, A.), 1996.
[3] Koppen, W., Geiger, R. «Handbuch der Klimatologie», Berlin; 1936
[4] Lambrakis, N., Marinos, P. The salinisation of coastal aquifers in Greece; a general review. Proc. of the Coastal Aquifers Intrusion Technology: Mediterranean countries, IGME, Spain, Serie: Hydrogeologia y Aguas Subterraneas, No 8, VII, 251-263, 2003.
[5] Linsley, P.K., Kohler, M.A., Paulhus, J.L.M. «Hydrology for engineers». Mc Graw-Mill Co, p. 492, 1988.
[6] Ministry of Development. Plan of water resources management in Greece. Technical report (Unpublished, in Greek), 2003.
[7] Soulios, G. General Hydrogeology, Vol. A .University press, Thessaloniki, 1986.
[8] Sreedevi, P.D. Climatic water balance and droughts of Pageru river basin, Cuddapah district, Andhra Pradesh, India. Env. Geology (2002): 42:681-689.
[9] Thornthwaite, C. «An approach toward a rational classification of climate», Geogr. Rev., Vol. 38, pp. 55 – 94; 1951.
[10] Thornthwaite, C. Mather, J. «The water Balance», Climatology, vol. VIII, No 1, New Jersey, pp. 1 -37; 1955.
[11] Tsakiris, G. «Water resources: Technical Hydrology, Ed. Symmetria, Athens, p. 675, 1995.
[12] Vasalakis, A., Voudouris, K., Fytikas, Dimopoulos, G. Groundwater quality in Naxos island, Cyclades, Greece. E-Proceedings 9th International Conference on Environmental Science & Technology, Rodos, 2005, B 981-986.
[13] Voudouris, K. Hydrogeological conditions in NW part of Achaia. Dept. of Geology, University of Patras (in Greek), 1995.
[14] Voudouris, K. The impacts of agricultural and tourism development on ground water sustainability: two examples from South Greece. Geographies, 2005, No 10, 130-146 (in Greek).
[15] Voudouris, K. Groundwater balance and safe yield of the coastal aquifer system in NEastern Korinthia, Greece. Applied Geography (in press), 2006.
189
“Sustainable Management and Development of Mountainous and Island Areas”


PP OO SS TT EE RRPP RR EE SS EE NN TT AA TT II OO NN SS


Microbial Ecosystem Diversity in an Experinmental Field During Flooding.
Alexopoulos Athanasios, Stefanis Christos, Papadopoulos Ioannis, Fotiadis Sideris, Voidarou Chrysa, Koutroubas Spiros, Vassiliou Georgios and Bezirtzoglou E
Democritus University of Thrace, Faculty of Agricultural Development, Pandazidou 193 Orestiada, 68200, Greece.
Abstract. The microbial ecosystem diversity in fields shows a strong influence from geomorphic process. Inundation affects soils by altering soil structure, depleting O2, accumulating CO2,inducing anaerobic conditions, reducing iron and manganese and denitrificating soil. Flooding also induce decay of the plant roots. The overflowing of Evros river, which consists of a physical barrier between Greece and Turkey, resulting from collection of waters drainage, of melted snow or heavy continuous rainfall in the area of Evros focused our interest.
In order to have an estimate of the microbial ecology of soils after flooding in Evros river, water sampling of abandoned floodplain were done in an experimental plant field. Water sampling was effectuated in eight locations at the field harbouring cultures of winter cereals; durum wheat, bread wheat and barley.
All water samples were cultured for recovery of aerobic and anaerobic microorganisms. The following bacterial species were isolated in all locations at low levels (<103
CFU/ml), Enterobacteriaceae (103 CFU/ml), E.coli (101 CFU/ml), total coliforms (102
CFU/ml), Staphylococcus (102 CFU/ml). Presence of the anaerobic C. perfringens is reported in one location at 102 CFU/ml.
The high frequency of C. perfringens is reported in most underground plant cultures, because of its anaerobic character. But our investigation showed low C. perfringens densities. As our cultured soil is covered by a shallow water body permanently during the inundation period, an adaptation to flooding occurs. These adaptations to the flooding stresses are interesting because plants exposed to flooding develop mechanisms, involve physiological adaptations and diversify their microbial flora. Low levels of fecal bacteria were presented and this could be explained by the fact that out study was carried out in an experimental field, protected from animal or human fecal
contamination. Moreover, the microbial flora was consistently diversified from the stress and diluted in the water impacted by flooding. A prospective microbiological monitoring for preserving the sanitary quality of agricultural soils must be done systematically not only for preserving the soil ecosystem but also for protection of public health.
Keywords. Flooding, Water quality, C. perfringens, Inundation.
1. Introduction.
In a month period during February 2006, Thrace experienced a series of severe weather events resulting in widespread and extensive flooding of the Evros river. Severe flooding of large land areas was occurred, with frequent floodwater contamination of both surface water [11] and groundwater. Flooding affects soil by altering soil structure, depleting O2, accumulating CO2, including anaerobic decomposition of organic matter, and reducing iron and manganese [1,12,20,22]. Soil inundation is finally resulting in decreasing the capacity of a soil to succeed an efficacy plant growth, as flooding also induce decay of plants roots. The overflowing of the Ardas-Evros ecosystems was focused our interest for evaluating the microbial ecology of the soil after flooding.
2. Materials and Methods
2.1.The study area
The present study collects samples of abandoned flood waters from an experimental field located in the North East part of Greece (Thrace) (Fig. 1). Waters are occurring from the overflowing of the Ardas-Evros river following continuously rainfalls and snow melted.
193
“Sustainable Management and Development of Mountainous and Island Areas”
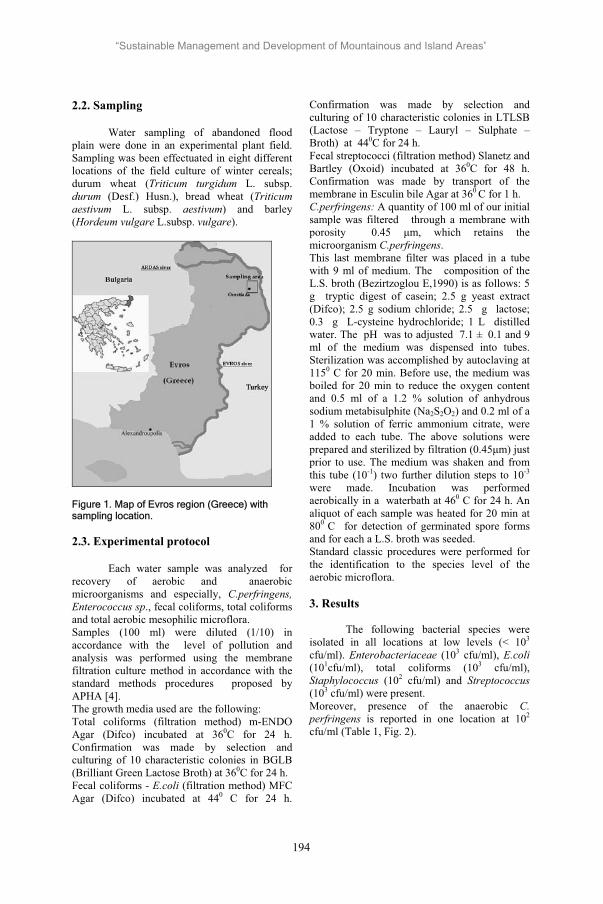
2.2. Sampling
Water sampling of abandoned flood plain were done in an experimental plant field. Sampling was been effectuated in eight different locations of the field culture of winter cereals; durum wheat (Triticum turgidum L. subsp. durum (Desf.) Husn.), bread wheat (Triticumaestivum L. subsp. aestivum) and barley (Hordeum vulgare L.subsp. vulgare).
Figure 1. Map of Evros region (Greece) with sampling location.
2.3. Experimental protocol
Each water sample was analyzed for recovery of aerobic and anaerobic microorganisms and especially, C.perfringens, Enterococcus sp., fecal coliforms, total coliforms and total aerobic mesophilic microflora. Samples (100 ml) were diluted (1/10) in accordance with the level of pollution and analysis was performed using the membrane filtration culture method in accordance with the standard methods procedures proposed by APHA [4]. The growth media used are the following: Total coliforms (filtration method) m-ENDO Agar (Difco) incubated at 360C for 24 h. Confirmation was made by selection and culturing of 10 characteristic colonies in BGLB (Brilliant Green Lactose Broth) at 360C for 24 h. Fecal coliforms - E.coli (filtration method) MFC Agar (Difco) incubated at 440 C for 24 h.
Confirmation was made by selection and culturing of 10 characteristic colonies in LTLSB (Lactose – Tryptone – Lauryl – Sulphate – Broth) at 440C for 24 h. Fecal streptococci (filtration method) Slanetz and Bartley (Oxoid) incubated at 360C for 48 h. Confirmation was made by transport of the membrane in Esculin bile Agar at 360 C for 1 h. C.perfringens: A quantity of 100 ml of our initial sample was filtered through a membrane with porosity 0.45 m, which retains the microorganism C.perfringens.This last membrane filter was placed in a tube with 9 ml of medium. The composition of the L.S. broth (Bezirtzoglou E,1990) is as follows: 5 g tryptic digest of casein; 2.5 g yeast extract (Difco); 2.5 g sodium chloride; 2.5 g lactose; 0.3 g L-cysteine hydrochloride; 1 L distilled water. The pH was to adjusted 7.1 ± 0.1 and 9 ml of the medium was dispensed into tubes. Sterilization was accomplished by autoclaving at 1150 C for 20 min. Before use, the medium was boiled for 20 min to reduce the oxygen content and 0.5 ml of a 1.2 % solution of anhydrous sodium metabisulphite (Na2S2O2) and 0.2 ml of a 1 % solution of ferric ammonium citrate, were added to each tube. The above solutions were prepared and sterilized by filtration (0.45 m) just prior to use. The medium was shaken and from this tube (10-1) two further dilution steps to 10-3
were made. Incubation was performed aerobically in a waterbath at 460 C for 24 h. An aliquot of each sample was heated for 20 min at 800 C for detection of germinated spore forms and for each a L.S. broth was seeded. Standard classic procedures were performed for the identification to the species level of the aerobic microflora.
3. Results
The following bacterial species were isolated in all locations at low levels (< 103
cfu/ml). Enterobacteriaceae (103 cfu/ml), E.coli(101cfu/ml), total coliforms (103 cfu/ml), Staphylococcus (102 cfu/ml) and Streptococcus(103 cfu/ml) were present. Moreover, presence of the anaerobic C.perfringens is reported in one location at 102
cfu/ml (Table 1, Fig. 2).
194
“Sustainable Management and Development of Mountainous and Island Areas”

4. Discussion
The nature and distribution of ecosystems at all levels, showed a strong influence from geomorphic processes [25].
Table 1: Descriptive statistics of microbiological results.Parameter (cfu/ml)
(N) Presence (%)
Mean Min Max
Total mesophilic microflora
20 100 830 700 980
Total coliform 20 100 100 90 210 Fecal coliform (E. coli)
16 100 9 7 12
Enterococcus sp. 16 100 1000 800 1400 Staphylococcus sp.
16 100 100 60 240
C. perfringens 16 6.2 100 100 100
Soil inundation due to heavy continuous rainfall, melted snow, water drainage and overflowing of the river Ardas-Evros had brackish ecotypes in an experimental field introduced in our study, dominated by cultures of winter cereals. Measurements of microbial populations have been used to asses the effects of the inundation on the soil ecosystem. Microbes play an important role in the carbon, nitrogen and sulfur cycles [8]. Thus, they are of capital significance of the stability of the biosphere. They are also found on the surfaces of plants (leaves, flowers, fruits, roots), as well as in a wide range of other habitats. Moreover, it must be noted that each soil support its own diverse flora of bacteria, fungi, protozoa, and algae. Pores of various sizes in soil structure [22] are available for exploitation and colonization by the microbial flora. The organic matter occurring as added plant, animal or insect, is gradually transformed to a nutrient rich soil, ideal for microorganisms maintenance. However, major changes can occur in these small pores or created microenvironments following flooding. Heavy continuous rain may cause accentuated changes in the soil environment by inducing a predominant anaerobic environment. Wet soils are becoming less permeable and so less O2 is available in their body. Flooded soil collects together an aqueous phase, a solid phase an gaseous phase, fauna and the microbial flora. Our aim was to investigate the dominant bacterial flora of the aqueous phase in flooded cultured soils.
Quantitative estimate of the bacteria population is reported to < 103 cfu/ml. The qualitative estimating of the above bacterial flora showed Enterobacteriaceae (103 cfu/ml), E.coli (101
cfu/ml) total coliforms (102 cfu/ml), Staphylococcus (102 cfu/ml) and Streptococcus(103 cfu/ml) . Almost all of these microorganisms are aerobic-anaerobic facultative species and so, they can be found as well in aerobic and anaerobic conditions. A decrease in the redox potential due to the depletion in O2 is reported [21,26]. In order to estimate the anaerobic profile of our ecosystem, we looked at the occurrence of C.perfringenswhich is a strictly anaerobic bacterium. C.perfringens was found in one location at 102
cfu/ml. The high frequency of C.perfringens in most undersurface cultures is reported [9,16,24,31], because of its anaerobic character. As stated, low densities of C.perfringens were observed in the present study. As our cultured soil is covered by a shallow water body permanently during the inundation period up to 2 months, we must accept an adaptation to flooding. This adaptation to the flooding stresses is interesting because plants exposed to flooding develop mechanisms, involve physiological adaptations and diversify their microbial flora.[2,3,5,6]. The soil is a rich reservoir of microorganisms in vegetative and spore forms. Moreover, the soil bacteria produces resistant structures as endospores of Clostridium which can resist to desiccation and a wide range of temperature fluctuations [7]. Anaerobic conditions causing by flooding help in removal of nitrogen causing denitrification of the soil.
830
100
9
1000
100 100
0
200
400
600
800
1000
1200
Total mesophilicmicroflora
Total coliform Fecal coliform(E.coli)
Enterococcus sp. Staphylococcussp.
C. perfringens
cfu/
ml (
Mea
n Va
lue)
Figure 2: Mean values (cfu/ml) of the various bacterial species recovered from the study samples.
195
“Sustainable Management and Development of Mountainous and Island Areas”
Nitrogen is considered to be the most limiting nutrient in plant growth and production. So, nitrogen losses occurring from the extensive sojourn of floodwaters after diffusion from the soil-water interface make soil of an unfavorable environment for culture. Moreover, C.perfringens is specifically used to detect fecal pollution of a remote origin and this is possible because of the presence of resistant spore forms [9]. The metabolic dormancy [27] and the resistance properties of bacterial spores are both crucial to the ecological role of spores as survival structures [7]. In order to complete this role, it is also essential that spores are able to monitor their external environment so as to trigger germination in suitable environmental conditions. Low numbers of fecal bacteria were found, together with the anaerobic C.perfringens. As reported, C.perfringens is likely to occur in particularly large numbers in soil contaminated by fecal matter [9,13,14,19]. Additionally, there is a close relationship between the amount of pollution and presence of C.perfringens[9,18,23,30]. The low level of fecal bacteria could be explained by the fact that our study was carried out in an experimental field, protected from animal or human fecal contamination. Additionally, the microbial flora was consistently diversified from the stress and diluted in the water impacted by flooding. Moreover, one possible explanation of the observed absence of C. perfringens in many of the studied locations might be related to previous research works which demonstrate that acrylic acid and other chemical substances can act as a broad –spectrum antimicrobial agent within the soil. [15,28]. Similarly, other bacterial species found usually in soils, could provide an antibacterial pattern. The soil pH is reported usually from 4.5 to 6.5 in all type of soils. Presence of C. perfringens is associated with acidic soil. Other authors have reported presence of other clostridial species as C.botulinum, C.tetani., C. bifermentants, and C. sordelii in acid soils [29]. The reason for the association of certain clostridial species with acid soil are not known, but this may be more than the simple effect of the level of hydrogen ion concentration [29]. Nevertheless, this simple parameter of pH, which permits the estimate of the soil acidity, could be important to the consideration of the microbial soil quality at least associated to the anaerobes.
High organic matter content seems to strengthen this correlation [16,29]. In our floodwater samples, the pH is reported close to the neutrality and so the absence of C. perfringens in most of the samples could be associated to this effect as well. The neutral pH in our water samples is maintained by the dilution in high water masses coming from the inundated river. Our data raise the ecological significance of a systematic microbiological monitoring for determining the sanitary quality of agricultural soils when they become contaminated by other systems, such as human or animal operations or extremely wetting or flooding of the area.
5. References.
[1] Allen JA.,Pezeshki SR., Chambers JL. Interaction of flooding and salinity stress on bald cypress (Taxodium distichum). Tree Physiol., 1996, 16:307-313.
[2] Angeles G. The periderm of flooded and non-flooded Ludwigea octovalvis (Onagraceae). JAWA Bull. 1992, 13:195-200.
[3] Angelov MV., Sung SS., Doong RL., Harns WR., Kormanik P.P., Black C.C. Jr. Long and short-term flooding effects on survival and sink-source relationships of swamp- adapted tree species. Tree Physiol., 1996, 16:477-484.
[4] APHA., Standard methods for the Examination of Water and Wastewater, 18th ed. Washington DC., 1992.
[5] Armstrong WR., Brandle R., Jackson MB., Mechanisms of flood tolerance in plants. Acta Bot Neerl. 1994, 43:307-358.
[6] Baker J.B. Tolerance of planted hardwoods to spring flooding. S.J. Appl. For. 1977, 1:23-25.
[7] Bezirtzoglou ,E., Dimitriou, D., Panagiou ,A., Kagalou, I., Demoliates ,Y.,1994. Distribution of C.perfringens in different aquatic environments in Greece. Microbiol Res. 149,129-134.
[8] Bezirtzoglou, E., 2005. General Microbiology ,Chapter 7, Ed. Parisianos (Greece), ISBN: 960-394-343-6,2005, pp122
[9] Bezirtzoglou, E., Panagiou , A., Savvaidis ,I., Maipa ,V.,1997. Distribution of C.perfringens in polluted lake environments. Anaerobe 3,169-172.
196
“Sustainable Management and Development of Mountainous and Island Areas”

[10] Bezirtzoglou, E., Romond ,C,1990 : Rapid identification and enumeration of C.perfringens in the human faecal flora. MEHD. 3,159-163.
[11] Casteel MJ., Sobsey MD., Mueller JP. Fecal contamination of agricultural soils before and after hurricane associated flooding in North Carolina. J. Environ. Scien. Health Part A, 2006, 41:173-184.
[12] Davies FS., Flora JA., Gas exchange and flooding stress of high bush and rabbiteye blueberries. J. Am. Soc. Hortic. Sci., 1986. 111:565-571.
[13] Desmarais TR., Solo-Gabrielle HM., Palmer CJ., Influence of soil on fecal indicator organisms in a tidally influenced subtropical environment Appl. Environ. Microbial. 2002, 68(3), 1165-1172.
[14] Despain S., L., Gardner ,M.V., 2002. The occurrence of vegetative cells of C.perfringens in soil. J Bakteriol (Note) 588,407-408.
[15] Edwards ,D.D., McFeters ,G.A., VenKatesan ,M.I.,1998. Distribution of C.perfringens and fecal sterols in a benthic coastal marine environment influence by the sewage outfall from McMurdo Station, Antarctica. Appl Environ Microbiol. 64(7), 2596-2600.
[16] Emerson RJ., Cabelli VJ. Extraction of C. perfringens spores from bottom sediment samples. Appl. Environ. Microbiol. 1982, 44(5):1144-1149.
[17] Fujioka RS. Monitoring coastal marine waters of spore-forming bacteria of faecal and soil origin to determine point from non-point source pollution. Water Sci Tech. 2001, 44(7), 181-188.
[18] Fuyioka RS., Shigumura LK. C. perfringens a reliable indicator of stream water quality. J. Water. Pollut. Control Fed., 1985, 986-992.
[19] Geldreich E.E., Huff C.B., Bardner RH., Kabler PW., Chark HF. The faecal coli aerogenes flora of soils from various geographical areas. J. Appl. Bacteriol. 1962, 25:87-93.
[20] Iyer ,P., Bruns ,M.A., Zhang ,H., VanGinkal ,S., Logan ,B.E., 2004. H2 – producing bacterial communities from a heat – treated soil inoculum. Appl Microbiol Biotechmc. 66,166-173.
[21] Jean ,D., Briolat ,V., Reysset ,G., 2004. Oxidative stress response in C.perfringens. Microbiology.150,1649-1651.
[22] Kozloski T.T., Responces of woody plants to flooding and salinily. Tree physiology monograph No 1., Heron Publishing, Victoria, Canada, 1997, 1-29.
[23] Maipa, V., Alamanos, Y., Bezirtzoglou ,E., 2001. Seasonal fluctuation of bacterial indicators in coastal waters. MEHD.13,143-146.
[24] Matches ,J.R., Liston ,J., Curran ,D., 1974. C.perfringens in the Environment. Appl Microbiol. 28(4),655-660.
[25] Prescot LM, Harley JP., Klein DA. The terestrial environment In: Microbiology Part 10, Chapter 42. 3rd ed., 1996, 859-880
[26] Rivoal J., Hanson AD., Evidence of a large and substained glycoly tic flux to lactate in anoxic roots of some members of the halophytic genus Limonium. Plant Physiol, 1993, 101:553-560.
[27] Setlow, P,1994. Mechanisms which contribute to the long-term survival of spores of Bacillus species. J Appl. Bacteriol. 76,495-605.
[28] Sieburth, J.M.,1961. Antibiotic properties of acrylic acid, a factor in the gastrointestinal antibiosis of polar marine animals. J Bacteriol.82,72-79.
[29] Smith, L.,D.,S.,1975. Common mesophilic anaerobes including C.botulinum and C.tetani, in 21 soil specimens. Appl Microbiol. 29(5),590-594.
[30] Somerson DL., Eberl SG., Dicksa RA. C. perfringens as a point source indicator in non-polluted streams. Water Res., 1989, 23(2), 119-197.
[31] Yamagishi, T., Ishida, S., Nishida, S., 1964. Isolation of toxigenic strains of C.perfringens from soil. J Bacteriol. 88(3),646-652.
197
“Sustainable Management and Development of Mountainous and Island Areas”

Sustainable Road Transport, Sustainable Mobility: Promoting a Cleaner and Healthier Environment
Baka Chrisoula 48 Ragavi, 11474, Athens
E- mail: [email protected]
Abstract. Today, European cities are facing an important challenge, that of developing sustainable mobility, indispensable for the health of cities, their economic viability and the well being of their citizens.
Mobility is a fundamental necessity of 21st century life and brings access to jobs, markets, education, health care and other primary services and leisure. However, current mobility trends are unsustainable, which means that the growing worldwide demand for transportation cannot be met simply by expanding today’s means of transportation.
The transportation of people must be affordable, available and sustainable in its impact on the environment and society. Quality environments that encourage walking, cycling and the use of public transport help social and cultural interaction. This creates vibrant healthy communities and encourages social responsibility through increased human contact.
Ultimately, Sustainable mobility is a long term aim to sustain quality of life for all.
Keywords: Environment, Health, Road Safety, Sustainable Transport, Sustainable Mobility
1. Introduction
European cities of all sizes and types are confronted with the same challenge: the promotion of a more rational and balanced form of development. This goal is often translated into a single word, which is becoming more and more popular: Sustainability. In theory, contributing to sustainability means promoting a cleaner and healthier environment as well as a social well- being.
Odd Gullberg, Chief Operating Officer of the World Business Council for Sustainable Development (WBCSD), speaking on the
subject of Sustainability at the Bibendum Forum and Rally Kyoto, Japan (June 8, 2005), said: “ The way we transport people and goods is not sustainable”.
Today, the way cities are being managed puts at risk their long term existence, particularly if urgent solutions are not found to resolve critical problems, such as social exclusion, lack of security, traffic congestion, deterioration of air quality, noise and traffic accidents. Particularly, in our country, there is no systematic way to address all these issues at once. Integrated approaches are definitely needed to mitigate the negative impacts of any actions or policies decided at local level. So far, the policies on transport and land use which have been implemented, at local level, have not helped to improve the situation in cities. In many cases, they have even failed to maintain the existing level of Sustainability. Therefore, local administrations have a great need for new management and planning tools to define the right set of measures and policies conducive to sustainable mobility.
Generally speaking, if we assume that in 25 years from now, the world population will have exceeded eight (8) billion, and that half of them will live in large cities, the question is, what does that really mean with regard to mobility?
The main purpose of this paper is to raise queries about sustainable mobility and to set out an inevitable discussion on how to achieve an acceptable balance between the positive and negative effects of increasing transportation, taking into account the needs of people for mobility and the economic imperative of moving goods efficiently and effectively.
198

2. Transport affects the environment
One of the greatest challenge facing political decision-makers and society in general in the 21st century is to reconcile transport with environmental constraints. All transport activities give rise to internal and external costs. Internal costs are those met directly by users such as purchase, fares, taxes, fuel, energy and maintenance. External costs are more difficult to measure. They represent costs paid by others and are required in order for the transportation mode to function and include road infrastructure, parking lots and traffic management. They also include indirect costs to the community as a whole such as congestion, air pollution, noise, accidents, the destruction and the visual scarring of communities, as well as the demolition of historic buildings and sites and uneconomic urban sprawl. External costs differ in relevance according to local characteristics. Quantifying and prioritising them is sometimes difficult and debatable. However assessing the cost of congestion, accidents and the use of space are widely accepted. Public transport, due to its collective nature, excellent safety record and efficient use of space, wins on every count.
2.1 External costs of Transport
The main external costs (negative effects) arising in the transport sector are the following:
Accidents: when transport systems are used, accidents occur, generating a whole range of costs (loss of life, medical care and disabilities sustained by victims etc.).For the purpose of this paper, an accident can be defined as a short, sudden, and unexpected event or occurrence that results in an unwanted and undesirable outcome.
More than 50% of all car trips made in Europe are for a distance of less than 5 km and 30% are for under 3 km, making the risk of having an accident especially high. Many of these trips could be replaced by other, more sustainable modes. In fact, the most dangerous cities are the ones where most trips are made by car. On average it is 5-10 times safer to travel by public transport (based on per passenger x km transported). In Europe it is
some 20-25 times safer to travel by rail than road, making public transport and rail significantly safer than the private car.
Safe travel is a major concern to consumers of all ages and social classes. There is a generally accepted misperception that travel by car is still relatively safe, particularly in developed countries, yet traffic accidents are a major cause of death in all countries. It is an indisputable fact that the majority of all transport accidents are caused by car traffic and according to a WHO report (published in 1999 and based on 1998 data) there are 1.17 million deaths and more than 10 million injured due to traffic accidents world-wide.
Source: UITP/ISTP Millennium Cities DatabaseAir pollution: emission of particulate matter, carbon monoxide (CO), lead volatile organic compounds (VOC), nitrogen oxides and sulphur dioxide (SO2), damaging health, the environment and buildings. Urban air pollution is a major cause of the serious deterioration in the quality of life, and it has detrimental effects on health, with the elderly and young children being the most vulnerable members of the population.
According to WHO, every year more people die from diseases provoked by traffic-related air pollution than are killed in car accidents.
In developed countries, air quality has improved substantially thanks to better technologies (catalytic converters, low emission engines, particulate filters) and cleaner fuel. However the saturation of the roads with traffic, combined with unfavourable atmospheric conditions, threaten these improvements Climate change: greenhouse gases (mainly carbon dioxide-CO2) have an enduring impact on the earth’s climate, resulting in increased desertification, raised sea levels, serious harm to agriculture and other destructive environmental and health-related side effects. Noise: transport generates noise, which adversely affects humans in a variety of ways, causing disturbances, stress and more serious health problems. Noise can interfere with sleep patterns and mental activities such as memory and the ability to deal with complex analytical problems. Children chronically exposed to loud noise show impaired acquisition of reading skills, attention and problem-solving ability.
199

Noise related to transport has been shown to negatively affect children's performance at school. Source: Charter on Transport, Environment and Health, WHO
Congestion: more vehicles are being added to already dense traffic flows, particularly car traffic flows, paralysing the system and leading to substantial wastage for all users. Congestion makes the entire transport system inefficient. Furthermore congestion is growing in all urban areas and has a measurable impact on an economy. This problem is not confined to peak times or specific areas but is now widespread in both developed and developing cities, and threatens economic growth and viability.
Energy Consumption: Transport is the largest consumer of energy and still relies heavily on non-renewable fossil fuels. According to a study by the International Energy Agency, IEA, the transportation sector will overtake industry as the largest energy user by 2020, and energy used for transportation is projected to increase at an annual rate of 2.1 percent, the biggest growth of all end-use sectors. By this date the world will be consuming two thirds more energy than today and most of this growth in demand will come from the developing world.
Source: Transport Energy Data Book: Edition 21, ORNL, 2001
Greenhouse Effect: The negative impacts of air pollution on human and environmental health are now at the forefront of the political, social and environmental debate. The health of the planet, as well as the health of individuals, is at risk. The effect of Greenhouse Gases (GHG - CO2, methane and water vapour) on our climate is indisputable.
Climate change is a global problem and requires every sector to play a role. Total emissions are predicted to reach 70% above today's level by 2030 and the lion’s share of this will come from developing countries. It is estimated that emissions from China alone will be up by 3.6 billion tonnes by then. The Greenhouse Effect is the phenomenon attributed directly or indirectly to human activity that has altered the composition of the atmosphere, producing a change in the world’s climate.
Private automobiles account for around half of all CO2 emissions and are the major source of CO2 in urban areas.
Over the past fifty years, the number of cars in the world has increased from 50 million to around 450 million.
The predicted explosive growth in private car ownership in developing countries will bring alarming consequences despite significant progress in engine technology. In Europe this figure grows by approximately 3 million new cars per year.
Source: Federation Internationale de l’Automobile 1999.
3. The current road transport system in Athens, as an example
Firstly, in Athens mobility flows are very much car-dependent. Children are driven to school and back, for safety reasons but also because many schools are not within walking distance for their pupils. Private school students often have to travel across the city in order to reach their suburban schools; out-of-school tuition (very common in Greece) as well as sport activities also necessitate private transportation. Moreover, on the active population side, employees often have to travel to work by car, due to the inadequacy of the public means of transport, the large proportion of self-employed people and the existence of a multitude of small shops also require a lot of travelling. Finally, the bureaucratic and highly centralised structure of the administration compels a lot of people to visit the public services in person for their business, rather than using the post, the phone or other forms of new technologies. As a result, the circulation of motor vehicles in the city of Athens is often extremely difficult and unpleasant, becoming more problematic over time.
According to the analysis of Attiko Metro S.A. 1996, only about 36.8% of all passenger movements is carried out by public means of transport, while the remaining 63.2% is made by private means of transport. About 42.4% of all daily movements are journeys to work and another 13.3% is for private purposes. Private cars account for 38.4% of all vehicle movements, whereas the public means of transport (buses) account for 30.8% and taxis for 10.3% (see table 1). This situation is
200
“Sustainable Management and Development of Mountainous and Island Areas”

significantly different from the one observed a number of years in the past, when the public means of transport was the main means of transportation for the majority of people in the grater Athens area (in 1962 almost 80% of all passengers used busses, while in 1972 the percentage had fallen to 61.8%). Today, less than a third continue to use busses, while only 11.1% are frequent users possessing a monthly pass that offers access to the public means of transport in the city (except for the railway and the subway). Even so, some two (2) million passengers travel by public means of transport every day.
Table 1. Mean of transportation and Purpose of transportation 1962-1996.
Year Mean of
transportation 1962 1972 1996
1. Private car drivers (and motorcycles)
10.2 24.1 38.4
2. Passengers of public means of transport
79.6 61.8 30.8
3. Taxi passengers
3.6 5.7 10.3
4. Other passengers
6.5 8.4 20.5
Total 100 100 100 Purpose of
journey
From home: Work 36.3 42.2 42.4 Shops 6.1 5.3 7.5 Education 1.4 5.0 13.6 Recreation 19.6 14.7 3.6 Other 21.8 24.3 32.9 Not from
home: 14.8 8.5
Total 100 100 100 Source. Smith Wibur and Associates 1963 and
1972. Attico Metro S.A. 1996.
Environmental pollution Motor vehicles, besides congestion, are also
one of the main sources of air pollution. The presence of air pollution in Athens is a permanent phenomenon since the 1970s. It increases during the summer months and on sunny days, when the wind is very weak, and it decreases (sometimes even wiped away) when there is wind from a northern direction.
Air pollution and health Transport has major implications on health.
Poor air quality affects all people, particularly vulnerable groups such as those with asthma and respiratory problems. The specification of the type and level of environmental damage and more specifically of air pollution, on the health status and the welfare of the individuals is a complex task, where no scientific consensus has been convincingly established.
As mentioned above Groups mostly affected by air pollution include the elderly, children and those with cardiovascular disease. It is interesting to note that whenever there is an aggravation of smog, tenths of people have to be taken to hospital. In addition, noise pollution seems to affect mostly residents living on or near busy roads, densely populated areas, and the city centre which is crowded almost at all times.
Despite recent improvements in the quality of air, Athens is still one of the most heavily polluted European cities.
Road traffic accidents Many available statistics, in general, give a
fairly precise picture of the quantity of car-related deaths and on the causes of road accidents. Logically , one can say that those who pay the heaviest death toll are young males, elderly and children. Young motorists, without experience, are often involved in car crashes. School- age children, especially those in working class areas with denser traffic and less supervision from their parents, are also at risk, even just outside their schools. Young gypsies and refugee children working or wandering on the streets, are also more likely to be involved in a car accident. Finally, elderly people are a very vulnerable group and they constitute the majority of pedestrian fatalities.
201
“Sustainable Management and Development of Mountainous and Island Areas”

4. Sustainable Transport, Sustainable Mobility
The Concept of Sustainable Transport For something to be Sustainable it has to be
able to maintain its normal qualities, over a very long period of time: essentially “forever”. However, there is no universally accepted definition of Sustainability, Sustainable Development or Sustainable Transport. Some definitions are listed below.
Sustainable Development “meets the needs of the present without compromising the ability of future generations to meet their own needs.”Brundtland Commission (1987)
According to Agenda 21, it is necessary to meet the basic needs of all citizens of the earth, while, at the same time, protecting and maintaining our natural resources and ecosystems.
A sustainable transportation system is “one in which fuel consumption, vehicle emissions, safety, congestion, and social and economic access are of such levels that they can be sustained into the indefinite future without causing great or irreparable harm to future generations of people throughout the world.” Transport Canada (1999)
According to the Mobility 2030 report, SustainableMobility is the ability to "meet society’s needs to move freely, gain access, communicate, trade and establish relationships" in such a way that "essential human or ecological factors will not be sacrificed today or in the future." Put moresimply, it means satisfying mobility requirements, while respecting people and the environment.
A strict interpretation of sustainable transport means that we should concentrate on measures aimed at avoiding long-term damage. From a practical point of view, however, there are good reasons to adopt a definition which also includes major short-term disturbances to nature as well as negative effects on human health.
Economic theory says that we should try to achieve any goal at the least possible cost.
From this point of view it is clearly wrong to enforce the same physical restrictions on the use of fossil fuels in all sectors of society or to demand a flat rate reduction in all sectors of any given pollutant. This implies that we should refrain from mandatory restrictions on the use of different modes of transport.
It has been said that, a sustainable transportation system has the following characteristics regarding:
(a) the natural environment:
limit emissions and waste (that pollute air, soil and water) within the urban area’s ability to absorb/recycle/cleanse;
provide power to vehicles from renewable or inexhaustible energy sources. This implies solar power over the long run; and
recycle natural resources used in vehicles and infrastructure (such as steel, plastic, etc.).
(b) Society: provide equity of access for
people and their goods, in this generation and in all future generations;
enhance human health; help support the highest quality of
life compatible with available wealth; facilitate urban development at
the human scale; limit noise intrusion below levels
accepted by communities; and be safe for people and their
property. (c) Economy:
Be financially affordable in each generation;
Be designed and operated to maximize economic efficiency and minimize economic costs; and
Help support a strong, vibrant and diverse economy.
4.1 Transportation Impacts on Sustainability
Transportation facilities and activities have significant sustainability impacts, including those listed in the following table. As a result, strategies that increase transportation system
202
“Sustainable Management and Development of Mountainous and Island Areas”

efficiency and reduce negative impacts from transportation are among the most effective ways to make progress towards sustainability objectives.
Table 2 Transportation Impacts on Sustainability
This table lists impacts that transportation activities tend to have on sustainability objectives.
Because transportation activities have so many impacts related to sustainability, it is important to identify strategies that help achieve multiple objectives, and avoid those that solve one transportation problem but exacerbate others. For example, a policy or program that reduces traffic congestion, but increases air pollution emissions or crashes cannot be considered a sustainable solution. Similarly, a strategy that reduces energy consumption and air pollution emission, but increases traffic congestion, crashes and consumer costs is not necessarily a sustainable strategy. The most sustainable strategies are those that simultaneously help reduce traffic congestion, pollution, crashes and consumer costs, increase mobility options for non-drivers, and encourage more efficient land use patterns, or at least avoid contradicting these objectives.
Conventional planning tends to assume that transport progress is linear, consisting of newer, faster modes that displace older, slower modes as illustrated below. This series model
assumes that the older modes are unimportant, and so, for example, there is no harm if increasing automobile traffic causes congestion delay to public transit or creates a barrier to pedestrian travel. From this perspective it would be backward to give public transit or walking priority over automobile travel.
Walk Bicycle Train Bus Automobile Improved Automobiles
Sustainable transport reflects a parallel model, which assumes that each mode can be useful, and strives to create balanced transport systems that use each mode for what it does best. Transport progress therefore involves improving all useful modes, not just the newest mode. For example, in many cities the most beneficial transportation strategies may involve improving walking and cycling, support for public transit use, and restricting automobile traffic in congested urban areas. It does not assume that faster, motorized modes should have priority over slower modes, or that increased travel speed is necessarily more important than qualitative factors such as comfort, safety and equity.
4.2 The Concept of Sustainable Mobility
A world where Sustainable Transportation fits in Sustainability has three components: society, the environment, and the economy that are all inter linked.
Society is the organisation of complex human interactions and today we depend quite strongly on them. Thus the Sustainability of societies is a necessary condition for meeting human needs. Societal factors are a major component of any legacy to future generations and are therefore important for Sustainability. They also determine the present quality of life, of which accessibility is a significant factor.
The Environment refers to respect for human surroundings and other life forms and limiting their activity to the least irreversible damage to the environment.
The Economy describes the resources available and how these resources are organised to meet human needs and goals. Economic factors have a strong influence on the environment and society in general.
Transportation of people must be affordable, available and sustainable in its
EconomicTraffic congestion Mobility barriers Crash damages Transportation facility costs Consumer transportation costs Depletion of non-renewable resources SocialInequity of impacts Mobility disadvantaged Human health impacts Community cohesion Community livability AestheticsEnvironmentalAir pollution Climate change Habitat loss Water pollution Hydrologic impacts Noise pollution
203
“Sustainable Management and Development of Mountainous and Island Areas”

impact on the environment and society. It also helps to achieve Sustainability in other aspects of human endeavour.
5. Conclusions – Recommendations
Sustainable Development and Sustainable Mobility are no longer isolated topics for theoretical or ideological discussions, but are crucial issues, which have an impact on everyone’s daily quality of life. As can be seen, over the last decade, traffic congestion, air pollution from transportation and greenhouse gas emissions have spiralled out of control, but it is too late to worry about whether cars are good or bad. The challenge is to develop transport alternatives that take into account all modes, integrating the advantages of cars, while mitigating the disadvantages.
Sustainable transportation planning requires a paradigm shift: a fundamental Change in the way people think about and solve problems. It requires more comprehensive analysis of impacts, consideration of indirect and cumulative impacts, consideration of demand management solutions, and public involvement in transportation decision-making.An interesting example of a large-scale awareness raising initiative on the adverse impacts of current urban mobility trends on the quality of life and the environment is the European Mobility Week. Each year from 16 to 22 September European citizens have the opportunity to enjoy a full week of events dedicated to Sustainable Mobility. A wide range of initiatives tackling different aspects of urban mobility are carried out by local authorities on each day of the week and in partnership with local organisations and associations.
The time for action is nowCreating a better future requires acting now,
for a more equitable present. Governments and businesses in all sectors need to be committed to programmes that will improve the current trends and patterns. Without a fundamental shift in our present habits of consumption and production, economic progress will be stifled and environmental degradation will continue, affecting all citizens. There will be greater social exclusion for the poor and less able, diminishing the advantages of a diverse urban culture.
Real sustainability is only possible if : - Every level of society participates in the
process and starts to make changes in their own mobility expectations and patterns. In other words, all the various players, including consumers, need to change practises and put policies into place that will lead to a sustainable future for all.
- Operators and the industry adopt the best possible practices in their own activities in promoting cleaner technologies and Develop policies in respect to Sustainable Mobility for the optimal use of economic resources centred on: intelligent land use planning, the restriction of private car use and the promotion of public transport.Real sustainability is only possible if we:
- Promote the most efficient transport modes in order to diminish health costs to the community due to accidents and lack of physical exercise
- Encourage future desirable mobility habits in young people.
- Create better environments for walking and cycling to complement public transport and reduce short distance travel by private vehicles in urban areas.
- Increase awareness via the media and other public campaigns that rail and bus transport is considerably safer than travel by private car.
- Scrap old polluting vehicles and replace them with efficient newer ones.
- Integrate all modes of transport to create safer transport environments and attain maximum interoperability.
- Promote dissuasive policies to restrict car use in inner cities and optimise the use of all available space, especially urban space used for parking.
- Encourage mobility solutions that are acceptable to society and that respect the environment, employment and health. These could include general access to a means of transport and the promotion of more environmentally friendly means of transport such as intermodality;
Benefits of Sustainable Road Transport
improved traffic flows reduced congestion better road safety good road conditions
204
“Sustainable Management and Development of Mountainous and Island Areas”

deterred unacceptable road user behaviour
travel time saving reduced vehicle emissions and
enhanced air quality vehicle operation cost saving improved economic and social
development
Sustainable Mobility is not the goal in itself. The goal is sustaining quality of life through the equitable appropriation of space and resources and the corresponding access to social and economic life for all.
6. References
[1] Becker, U.; Rau, A., New objectives for transportation planning; in: Handbook for transportation planning in municipalities, Heidelberg, 2004
[2] Brundtland Commission (World Commission on Environment and Development), Our Common Future,Oxford University Press, 1987
[3] European Commission, Towards More Integrated Implementation Of Environmental Legislation In Urban Areas, Working Group on Integrated Implementation of Environmental Legislation (WG/IIEL), European Commission (DG Environment), March 2002
[4] Gudmundsson H, “Making Concepts Matter: Sustainable Mobility And Indicator Systems In Transport Policy” International Social Science Journal,Vol. 55, No. 2, Issue 176, June 2003
[5] Hall, R., Understanding and Applying the Concept of Sustainable Development to Transportation Planning and Decision-Making in the U.S., PhD Dissertation, Massachusetts Institute of Technology, 2006.
[6] Halsnæs, et al., Transport and the Global Environment: Accounting for GHG Reductions in Policy Analysis,UNEP Collaborating Centre on Energy and Environment (UCCEE), 2001.
[7] Hollnagel, E., Barriers and Accident Prevention, , Great Britain, Ashgate 2004
[8] Rau, A.: Sustainable Mobility: How must be the transportation system of the future? Potsdam, Straßenverkehr; 2001.
[9] UNESCO-SCOPE (2006), Indicators of Sustainability: Reliable Tools For Decision Making, UNESCO-SCOPE, Policy Brief No 1
205
“Sustainable Management and Development of Mountainous and Island Areas”

Airborne Laser Scanning and DTM Generation
Vasileios C. Drosos Ass. Professor, Department of Forestry and Management of Environment and Natural
Resources, Democritus University of Thrace, 193 Ath. Pantazidou Street, 68200 N. Orestiada, tel.: 25520 41122, fax: 25520 41192, e-mail: [email protected]
Dimitrios E. Farmakis Electronic Engineer, 19 Sofokleous Street, 56625 Thessaloniki, tel.: 2310 636288,
e-mail: [email protected]
Abstract. Airborne laser scanning has become a widely used technique for the derivation of topographic data. The term Lidar (light detection and ranging) is used, too. The high degree of automation in both, capturing the data and processing the data, contributed to its fast spread. The scanner is mounted on an aircraft or helicopter, which usually flies over the terrain in a strip-wise manner. Airborne laserscanning (or “lidar”) has widely replaced stereo-photogrammetric approaches in the task of digital terrain model generation. Currently, the main application for laser scanner data is the production of digital terrain models (DTM). The major reasons for this fact are the efficiency of the technique, the high precision and reliability potential and the capability of partly penetrating vegetation and thus delivering elevation data also in forest areas. The high reliability is accounted for by the character of an active measurement technique, which does not suffer from matching errors like automatic stereo-photogrammetric approaches. In addition to these “classical” applications, airborne laserscanning has proven to be a valuable data source for automatic 3D GIS information extraction tasks such as 3D building model generation or corridor mapping. Many theoretical considerations and practical tests have shown the high accuracy potential of airborne laserscanning. In the following, the accuracy potential of airborne laserscanning will be reviewed, consequently treating not only height, but also planimetric accuracy of data points and derived objects. The analysis of laserscanner system components as well as practical tests indicates, that the height precision of airborne laserscanner data is usually significantly better than the planimetric precision. While the height precision of a single ground point is often in the order of 10-15 cm,
an almost linear dependence of planimetric precision on flying height above ground can be stated, with a typical precision in the order of 0.5-1.0 meter at a flying height of 1000 meter above ground. Both height and planimetry precision are affected by significant systematic effects, which are often larger than the stochastic errors.
Keywords. Airborne Laser Scanning, Stereo Photogrammetry, DTM, Accuracy.
1. Introduction
Laser scanning, including both the airborne and terrestrial laser scanning, is one of the most interesting and potential 3D data acquisition and monitoring techniques, which can support future studies of real estate and environmental economics. Vast data sets, even covering whole countries, challenge existing manners of proceeding. Existing laser data can be used for multidisciplinary tasks.
Airborne laser scanning (ALS) is a method based on laser (lidar) range measurements from an aircraft and the precise orientation of these measurements between a sensor (the position of which is known by the use of a differential-GPS technique) and a reflecting object, the position of which (x, y, z) is to be defined (Fig. 1).
Terrestrial laser scanning (TLS) is a similar method utilizing a laser on a mounted platform and recording the object from the horizontal perspective. Modern ALS enables up to 100 000 range measurements per second from an altitude of about 1 km. With a scan angle of 10o, a pulse density of 4 pulses per square meter can be obtained at typical flight speeds. On an average day, about 200 km2 of land can be surveyed. Because of shorter measuring distances than with
206

ALS and stabile platform TLS systems provide dense and accurate 3D point clouds.
Figure 1.The principle of the airborne laser scanning.
Today terrestrial laser scanning is used for digital factory, virtual reality, architecture, civil engineering, archeology and cultural heritage, surgery, plant design and automation systems (robotics). Airborne laser scanning is used for DTM, 3D city modeling, power line monitoring, change detection of coastal zone, forest inventory, to name a few examples. Countrywide collection of airborne laser scanning, mainly due to DTM (Digital Terrain Model) derivation, is becoming increasingly common.
Airborne laser scanning is widely used for the derivation of terrain information in wooded or open areas but also for the production of building models in cities. For this, the generation of a digital terrain model (DTM) is also required. Currently, the main application for laser scanner data is the production of digital terrain models (DTM), whereas the fully automatic derivation of building models is not as operational yet [52]; [41]; [8]. The automatic derivation of tree height and extraction of other forest stand parameters is investigated [27], as well as the automatic derivation of break lines in the laser data [9]; [53]. The DTM is necessary for all the applications described in this paragraph.
1.2. What is the Digital Terrain Model?
Height information from the terrain surface in regular grid form gives a digital terrain model. The quality of a DTM is directly dependent on the grid interval and the data source from which it is generated. Depending on the required application information about breaklines and embankments will be incorporated. The DTM is visualised through, for example, 3D-wire mesh models with coloured height columns. Contour lines, cross sections, slope models or volume calculation can also be derived from a DTM.
The DTM plays a major role in the production of geo-referenced aerial photos i.e. digital orthophotos.
A sufficient amount of height information is necessary in order to calculate a DTM. Such information is gathered from the photogrammetric restitution of spot heights and breaklines in aerial photos or from laser scanner mapping. There are some programs that don’t only generate the DTM, but also provide a variety of processes for analysis and visualisation.
Using spot heights on the digital surface model (DSM) are automatically determined from a dense bundle of points. For this process direct geo-referencing of the imagery or automatic aerial triangulation are necessary pre-requisites. Manual measurement is confined to verification of the automatic correlation and elimination of spot heights from buildings or vegetation, in order to derive the DTM.
1.3. What is the LIDAR Technology?
The development of airborne laser scanning (ALS) goes back to the 1970s with early NASA systems. Although cumbersome, expensive, and limited to specific applications (such as simply measuring the accurate height of an aircraft over the earth’s surface), these early systems demonstrated the value of the technology. Emitting a laser pulse and precisely measuring the return time to the source can estimate the “range” calculated using the value for the speed of light (similar to a total station surveying instrument).
The advent of GPS measuring systems in the late-80s provided the necessary positioning accuracy required for high performance LIDAR. It wasn’t long until rapid pulsing laser scanners were developed linked to the GPS system. The systems became complete with ultra-accurate
207
“Sustainable Management and Development of Mountainous and Island Areas”

clocks (for timing the return) and Inertial Measurement Units (IMU) for capturing the orientation parameters (tip, tilt, and roll angles) of the scanner.
LIDAR systems emit rapid pulses of laser light to precisely measure distances from a sensor mounted in a port opening on the bottom of an aircraft's fuselage to targets on the ground. The use of lasers to measure distance, called laser range finding, has been around for a long time. Hughes Aircraft Company Laboratories developed the first optical laser in 1960. Shortly thereafter, laser range finding was demonstrated by timing the round-trip travel of a laser pulse between the laser transmitter, a target and the laser receiver [20]. Advances in timing technology have allowed laser pulses to be measured in fractions of a nanosecond. Time is converted to distance using the velocity of light (3 x 10⁸ m/s).
Current LIDAR systems use lasers with timing systems that are able to measure distances with an accuracy of less than 5 centimeters. The pulse rate of LIDAR systems range from 2,000 to 33,000 pulses per second depending on the manufacturer's design and intended application. Even at these high pulse rates, the light has enough time to travel from the sensor to the ground and back before the next pulse is sent. A scanning mirror is used to direct the laser pulses back and forth across a wide swath underneath the path of the airplane. The swath width is dependent on the altitude of the aircraft and the scan angle. The reflected laser light from the ground follows the reverse optical path and is directed into a small telescope and then to the laser receiver. The aircraft typically fly at an altitude of 700 meters, which allows elevation recording across a swath about 300 meters wide depending on the type of instrument used. A series of overlapping, parallel swaths are conducted so the entire study area is mapped.
The laser distance measurements would be useless by themselves if there was not some way of georeferenceing the measurements into x, y, z data-points. The precise location of the laser sensor head and attitude of the aircraft must be accurately known in order to individually georeference each laser “hit”. LIDAR is actually the convergence of three technologies: Laser Range finding, GPS and INS (Inertial Navigations Systems). Determining the precise location of a moving aircraft would not be possible without a constellation of GPS satellites. Major strides have been made in recent years in
integrated GPS and INS technologies in LIDAR systems, and this has made it cost effective for survey companies to purchase and operate these instruments.
With Differential GPS, it is now possible to obtain the position of a GPS receiver onboard an aircraft to within a few centimeters. The GPS antenna is usually mounted directly above the laser head, and the distance between the two is accurately measured. GPS data are typically recorded at a rate of 0.5Hz or 1Hz [47]. In addition to the onboard GPS receiver, there are one or more GPS ground reference stations. The ground stations identify and correct errors in the aircraft's position. These are operated by ground crews at known locations, such as USGS benchmarks or monuments, near or within the area of study. “The GPS ground data is logged and post-processed together with the airborne GPS data providing a differential GPS solution for the aircraft position” [14].
The precise beam orientation at the time the laser pulse is sent is critical to correctly locate the reflection in 3-D space. The angle of the laser scan mirror is easily measured at the time of each pulse. But, at the same time the aircraft is tilting, pitching, accelerating or bumping along during the flight. A very small change in attitude of the platform would result in a large change in horizontal distance where the beam strikes the ground. The INS records the roll, pitch and yaw of the aircraft at all times. While this would seem like a highly complex measurement, today's inertial systems are able to determine this to within 0.01 of a degree [16]. Later during the post-processing phase, this information is used to compute the exact angle and orientation of the beam relative to the coordinate system being used. The INS units’ incorporate highly accurate accelerometers and horizontal and vertical gyroscopes, which are electro-magnetically held in suspension. “These components are relatively expensive today, but better and cheaper systems are being developed” [50].
Airborne LIDAR can quickly generate a large number of terrain data-points. “Commercial systems are available with typical data capture rates equivalent to 100 km2/hr” [14]. The density of the data-points can be adjusted several ways, by changing the flying height, airspeed, scan angle or scan frequency. The pulse rate is usually fixed. The scan angle and frequency may or may not be adjustable for a particular instrument. Also, the flight-line side lap could be widened to increase the data point density. For example, a
208
“Sustainable Management and Development of Mountainous and Island Areas”

client of a survey company may specify that five-foot point spacing is required for a certain project. Depending on the manufacturer of the LIDAR instrument being used, the survey company would determine the appropriate flying height, the airspeed, the scan angle/frequency and the number of flight lines needed to cover the desired area.
LIDAR is usually flown at low altitudes, generally between 700 and 1500 meters. When higher altitudes are used, two things happen. First, the accuracy is reduced because at greater distances the angular error of the IMS increases the circle of error on the ground, and second, the footprint increases. “When a pulse hits the ground, the beam's footprint varies between 0.5 and 2 feet, depending on flying height” [47]. Because of distension of the beam, the chances are good that the beam will hit more than one object on the way down and be reflected several times. In forested areas there may be several “returns” for each pulse. The first return may be from leaves at the top of the canopy, a second return may be from a branch midway down and the last return may be the actual ground elevation. “LIDAR systems have been developed to record as many as five returns from a single pulse” [50]. The last return would be used in developing digital terrain models. In even the densest forests at least some of the light usually reaches the ground. But if it doesn't, by hitting the trunk of a tree for example, the data-point could be identified as an anomaly during post-processing and be thrown out. The difference between the first return and the last return has been used to measure the heights of forest canopies. In the case where the beam hits a building, the shape of the building would usually be readily apparent in the 3-D model when five-foot point spacing is used. Software has been developed to create “bare-earth” models that filter out vegetation, called “vegetation removal” software. Considering that flood plains are usually well forested and have a lot of vegetation, this feature of LIDAR makes it particularly well suited for floodplain mapping. Surveys done during the fall or winter months may provide more hits on the ground. Infrared/near infrared frequencies are used for terrain surveys because good reflections are obtained. Eye-safety is a concern using infrared and the manufactures must design the laser not to be too powerful.
Following the survey flight, the data is downloaded and post-processing of the raw data
is done using software supplied by the manufacturer of the LIDAR. Usually there is sequence of steps that leads to the generation of the end product. This may include auto-processing, calibration parameter checks, and identification of systematic errors, manual processing and data cleaning/anomaly classification. “Typical post-processing times are two to three hours for every hour of recorded flight data with additional processing time required for more sophisticated analysis such as target classification or vegetation removal” [15]. Lastly the x, y, z data-points are transformed into the local reference coordinate system. The end product is normally a comma-delimited ASCII file in x, y, z format. Contouring and hydraulic analysis is done with a GIS program such as Arc/Info or ArcView with Spatial Analyst extension. 3-D rendering could be done with ArcView 3-D Analyst. The GIS must be able to handle large data sets since the number of data-points could easily be in the millions. A LIDAR survey of approx 250 km2 in the Florida Panhandle during October 1996 yielded approximately 27 million data-points with a point density greater than 100,000/km2 [15].
1.4. Comparison between stereo-photogrammetry and lidar
In recent years, numerous studies have demonstrated the capacity of small footprint scanning lidar for mapping forest canopy structural attributes such as height and volume [19]; [43]; [44]; [13]; [30]. The accuracy of estimates of various attributes of individual tree, plot, and stand are in most cases higher than those achieved by other means of remote sensing. Lidar-based estimates are in some cases as accurate as field measurements themselves [43]. This level of accuracy can be achieved because lidars have the capability of measuring the elevation of both the canopy surface and the underlying terrain. In comparison, photogrammetric measurements of closed canopies only give information on canopy surface altitude. Despite its advantages, lidar-based forest mapping may remain an experimental tool for a number of years due to its high acquisition costs. Low flying heights and narrow viewing angles translate into a high number of flight lines compared to that of aerial photo surveys [5]. The cost of recurrent lidar surveys over large areas for forest monitoring purposes will likely remain prohibitive.
209
“Sustainable Management and Development of Mountainous and Island Areas”

Moreover, research on forest dynamics currently cannot benefit from scanning lidars as multi-date datasets are still extremely rare, and long-term retrospective studies are today not possible.
Both the high costs of lidar and the limitations of photogrammetry may be alleviated by combining these two types of remote sensing techniques to produce composite canopy height models (CHMs). Because it is theoretically possible to co-register a lidar bare earth digital terrain model (DTM) and a photogrammetric stereo-model, it should be possible to subtract lidar terrain elevations from photogrammetric canopy elevations to produce canopy heights. There are several advantages to this composting technique. Assuming ground elevation is stable over time, bare earth lidar DTMs availability would allow forest monitoring to be performed using recurrent aerial photo surveys or stereo acquisition of high resolution satellite images (e.g. Ikonos and QuickBird). Retrospective studies that would consist in mapping forest attributes from archived stereo photos combined to recent lidar DTMs would become possible.
Aerial laser survey is important constituent part of the newest methods and technologies of geoinformatics and digital photogrammetry and is widely adopted at solving many tasks of ecological monitoring and forest mapping and inventory. Laser forest terrain mapping and survey can be done independently and in complex with space and aerial digital video- and photography combined with ground sampling as well.
Commercial softcopy photogrammetry programs were essentially developed for terrain mapping, and may lack the ability to reliably match stereo images of the forest due to tree leaning, complex canopy geometry, and occlusion patterns that vary between the left and right photos. Results from previous studies disagree on the level of accuracy that can be achieved through stereo matching. Some studies report that height estimate errors may be large [18]; [42], while others report accurate results [39].
In North America laser mapping methods using satellite and aircraft platforms was developed and widely practiced at geodesy, cartography and forest inventory and survey [3]; [23]; [11]; [21]; [46]; [7]; [29]; [1]; [36]; [37]; [38]; [13]; [34]; [40]; [48]; [54]; [2]; [28]; [55]; [35]; [49].
2. Methodology 2.1 Creation of DTM from Laser Data
Systematic shifts in height data between different flights were corrected using ground control heights of flat surfaces and buildings. After coordinate transformations, geodic correction, strip adjustment and systematic shift correction laser point clouds were classified by TerraScan software (see www.terrasolid.fi) to separate the ground points from other points (low and high vegetation).
The ground points were triangulated using TIN densification method developed by Axelsson, where surface was allowed to fluctuate within certain values, controlled by minimum description length, constrained spline functions, and active contour models for elevation differences [4]. Ground points were connected in a TIN. A sparse TIN was derived from neighbourhood minima, and then progressively densified to the laser point cloud. In each iteration, points are added to the TIN, if they are within defined thresholds. The method has been implemented to Terrascan software.
2.2 Evaluation of the Laser DTM
The accuracy of the laser DTM was evaluated by comparing the DTM values with the corresponding reference points obtained by field measurements. Systematic elevation error was calculated as mean height differences between laser DTMs and field measurements, whereas the random error was obtained from standard deviation (s) of the difference.
The effect of tree cover was calculated as follows: terrain points were considered to be either in an open area or under a tree.
2.3. Requirements to height and planimetric accuracy
Airborne laserscanning was introduced as a commercially available measurement technique in the early/mid nineties. In the beginning, the precision of laser scanner point data was solely specified as a height precision. Data providers often specified 10-20 cm, which was considered sufficient by most users. A better height precision, although desirable for some applications, seems unrealistic for most natural surfaces for the following two reasons:
210
“Sustainable Management and Development of Mountainous and Island Areas”

- Early systems offered data rates of 2-10 kHz, leading to datasets with a point spacing of typically 3-4 meter. At this point spacing, the terrain representation error caused by sub-sampling will be larger than the actual measurement error for most terrain types.
- The laser ground spot diameter is typically in the order of 25 cm at a flying height of 1000 meter.
In regions with significant terrain surface roughness, there will be height amplitude of several centimetres within the spot.
Figures on the planimetric precision of laser scanner data points generated by early systems were known, but usually neglected, although in most systems the planimetric precision of laser scanner data is significantly worse the height precision. This reduction of the precision measure of laser scanner ground points (with three-dimensional coordinates) to only height precision was justified by two reasons:
- As the technique was mainly applied for the generation of digital terrain models over areas with limited terrain slope, planimetric errors of several decimetres were not very relevant in datasets with a point spacing of a few meters.
- Many users of laser scanner data prefer to work on digital terrain models in a regular grid (height image), obtained from irregularly distributed raw data points by interpolation and filtering. In this case, the character of raster data gives reason for the specification of only a height precision.
Although these figures cannot be generalized, they define a requirement to the accuracy of laser scanner data, with planimetric accuracy being of the same relevance as height accuracy.
2.4. Factors that affect the accuracy of LIDAR
The accuracy of elevation measurements is of utmost importance in floodplain management studies, but as is most often the case, this accuracy comes at a cost. The USGS supplies 7.5-minute DEM (Digital Elevation Models) free of charge to download off the Internet via SDTS format. These data sets are widely available for areas throughout the US and correspond to the USGS quad sheets. The DEMs have a cell resolution of only 30 meters and a “vertical accuracy equal to or better than 15 meters” (from USGS DEM metadata). While this accuracy may be suitable for broader watershed basin studies or regional hydrologic modeling, it would not be
suitable for detailed flood hazard mapping. Ground surveys using total stations and differential GPS may obtain very accurate x, y, and z information, however it would be very expensive to obtain enough data-points for broad floodplain mapping projects. LIDAR provides an inexpensive alternative while maintaining a high level of accuracy. “Claimed vertical accuracies of commercially available LIDAR systems typically are on the order of 15 centimeters” [47].
Survey company marketing personnel may tend to make extravagant claims about the accuracy they can attain with LIDAR, because this is one of the main selling points. They may claim a 5-centimeter “relative accuracy”, but this is accuracy between data-points and not absolute vertical accuracy. If care is taken in the installation and calibration of the equipment and the ground stations are accurately located within the study area and carefully monitored, this can go a long way in increasing the overall accuracy of the LIDAR survey. When choosing a contractor for a particular project, it would be wise to consider the contractor's experience with quality control and not just the specifications of the instrument.
As mentioned above, the flying height will affect the accuracy of the LIDAR survey. At increasing heights, the angular errors inherent in the INS increase the circle of error in the horizontal plane on the ground. “INS pitch and roll uncertainties are generally considered the limiting factor in ATM (NASA’s Airborne Terrain Mapper) survey accuracy and are thus a primary source of concern” [25]. The laser range finding would be the most accurate of the three subsystems, with an accuracy of better than 5 centimeters over a wide range in distances. The accuracy of the GPS component would fall somewhere in between the other two. It is the combined accuracy of the three subsystems working together that determine the accuracy of the LIDAR instrument. Other factors that can affect the accuracy of LIDAR surveys are: high winds, wet snow, rain, fog, high humidity, and low cloud cover.
Several academic studies have been made to determine the overall accuracy that can be achieved with LIDAR instruments. One study on ice-level elevations in Greenland determined that: “Results from flight data indicate that ice-surface elevations can be reliably measured to an accuracy of ~20 cm (and possibly to ~10 cm) over baselines of more than seven hundred
211
“Sustainable Management and Development of Mountainous and Island Areas”

kilometers” [24]. This study used NASA’s AOL (Airborne Oceanographic Lidar), which uses a scan mirror with adjustable off-nadir settings of 5, 10, or 15 degrees. Another study in Long Valley, California, determined that their LIDAR measurements of the elevation of Lake Crowley where within 1-4 cm of the absolute height. “Comparison of laser heights of Lake Crowley to tidal gauge heights yields only a 1-4 cm difference in absolute height” [45].
2.5. Error sources that affect the accuracy of LIDAR
The major error sources influencing the accuracy of airborne laser scanner point data are the lasers canner instrument itself, the position and orientation determination system, the alignment between these two subsystems and possibly human errors in data handling and transformation.
- The precision of laser scanner slant distance measurement is primarily determined by the precision of time-of-flight measurement (most instruments) or signal phase measurement. In addition, distance measurement may be influenced significantly by the type of local ground coverage and the terrain slope [26]. With most systems operating at narrow opening angles, errors in distance measurement propagate mainly into the height coordinate. The error budget of the scanning mirror device is described by the angular resolution and may also be influenced by mechanical problems such as vibrations or oscillations caused e.g. by interference with the aircraft engine. These errors will mainly propagate into the across-track planimetric coordinate.
- The position of the aircraft and the sensor is determined by differential GPS techniques. Depending on the GPS satellite configuration, the error of the GPS height coordinate will usually be larger than the error of the planimetric coordinates. An INS system integrated with the GPS system is used to interpolate and possibly smoothen the 3D trajectory and to determine the platform orientation parameters. Random errors or uncompensated drifts of the INS system will primarily lead to errors in the roll pitch and yaw angles, which mainly influence the planimetric coordinates.
- Alignment errors between laser scanner instrument, aircraft body and GPS/INS system components as well as synchronization errors
will cause systematic offset and tilt effects in data strips.
Every data provider applies calibration schemes to determine these alignment errors and to correct for them. Nevertheless, remaining errors not revealed by the calibration process will cause systematic shifts or rotations of the data strips.
- Errors in the transformation to local coordinate systems may be caused by errors in reference points or by human error.
While errors in slant distance measurement are primarily of stochastic nature, errors introduced by the position and orientation determination sub-system cause systematic deformations of laserscanner data strips. These systematic effects may be of local nature, but may also cause constant shifts (e.g. as a consequence of GPS cycle slips), tilts or torsions of whole strips [12].
Generally, position determination errors cause ground point coordinate offsets, which are independent on flying height, while the effects of orientation parameter errors will increase linearly with flying height. Their effect will also differ between strip centre and strip edges. The slant distance measurement precision will show a weak distance-dependence, while angular errors of the scanning mirror will propagate linearly into ground coordinates. As a consequence, the horizontal ground point coordinate precision will show an almost linear dependence on flying height, while the vertical ground point coordinate precision will be much less flying height dependent.
3. Results and discussion
In the following, the results of a few practical tests are shown and discussed. Even though these tests are based on a limited number of datasets and do not represent all laserscanner systems but they show some interesting phenomena.
Practical statements on laserscanner point coordinate precision can either be based on ground control points introduced as check points or on discrepancies between data in the overlap area of neighbouring or crossing strips. Like in conventional photogrammetry, the measurement of a large number of check points (e.g. by GPS or stereo-photogrammetry) is connected with a large effort, while a rather dense pattern of tie point discrepancies in strip overlap regions can be obtained semi automatically or automatically from the actual data.
212
“Sustainable Management and Development of Mountainous and Island Areas”

3.1. Height accuracy
The Netherlands was the first country to generate a nation-wide digital terrain model by airborne laserscanning. In the preparation phase of this project, a large number of practical tests were performed to verify the height accuracy of the data by ground control. As the individual laserscanner data point cannot be recognized in the terrain, flat regions such as parking lots or soccer fields (with their height determined by GPS) were used as ground control. A height precision in the order of 15 cm is reported, by Huising and Gomes Pereira [17].
Crombaghs uses ground control and semi-automatically measured height discrepancies in a relatively sparse distribution along the overlapping region between neighbouring data strips as input for a laserscanner strip adjustment scheme [12]. Their results show strip height discrepancies of up to 15 cm, with an RMS of 7 cm; it has to be noted that these figures are derived from planar patches containing some 100 points, thus largely eliminating stochastic errors.
Burman also uses height discrepancies in strip overlap regions as input to a strip adjustment scheme, assuming a linear strip error model with three shifts and three rotations per strip [10]. Vertical strip errors of up to 9 cm are reported.
Maas shows height differences in the overlap regions neighbouring strips in a rather dense pattern, with the distance between patches being smaller than the distance between successive dGPS aircraft position measurements [33]. Height discrepancies are measured automatically by a least squares matching approach including robust estimation techniques. The results show height discrepancies of 10-20 cm in the overlap regions. Although there is a recognizable trend in some cases, rather strong local deviations from linearity along flight direction can be seen. This can probably be explained by the dominating effect of limited dGPS height precision. As a consequence, a linear strip deformation model, which is assumed by several authors, seems at least questionable.
These strip discrepancies are usually based on planar patches of a pre-defined size, containing multiple laserscanner points. Several publications address the local precision of a single laserscanner height measurement, unaffected by pose determination errors.
Maas obtains a single point height standard deviation of 3-4 cm as standard deviation of unit weight in least squares matching applied to plane
laserscanner data patches [33]. These figures were obtained in data of flat terrain. Reveal a significant dependence of height precision on terrain slope, which is possibly caused by orientation errors and the poorly defined reflection of laser pulses with a finite spot size on tilted non-planar surfaces [26]. The discrepancy between these figures on single shot precision and precision measures derived from ground control or redundant data indicates that, at least over flat terrain, the systematic errors in height data are larger than the stochastic errors. As a consequence, accuracy measures for objects obtained from multiple data points, which are simply derived by error propagation schemes based on the assumption of Gauss distribution (e.g. [12]), will usually be much too optimistic.
3.2. Planimetric accuracy
Like with height accuracy, measurements for the verification of planimetric accuracy can be provided by ground control or by discrepancies in redundant data. Generally, terrain surface changes are required to enable ground control check. As an alternative, laser pulse intensity information (generating a reflectance image) may be used in regions of poor height contrast [32].
A principal limitation in the selection and measurement of ground control for planimetric accuracy verification is posed by the under sampling characteristics of airborne laserscanner data, with the point spacing usually being significantly larger than the laser ground spot diameter. Roof corners of buildings will often give suitable ground control. Some data providers try to hit the antenna of their dGPS base station by a laser pulse in order to provide planimetric reference - a technique that will only work at rather high sampling rates.
Kilian and Behan use least squares matching, applied to laserscanner height data interpolated to a regular grid, to determine planimetric offsets between neighbouring data strips [22]; [6].
While the advantage of this technique is the possibility of adapting existing software implementations, it can be shown that interpolation effects in regions with height discontinuities (e.g. tilted planes interpolated into the occlusion regions behind buildings) will cause large systematic errors in the strip-offset determination [31].
As an option to solve for this deficiency, shows an implementation of least squares
213
“Sustainable Management and Development of Mountainous and Island Areas”

matching to laserscanner point data in a TIN structure for the determination of three-dimensional geometric discrepancies between neighbouring strips [31]. The technique yields a measurement precision in the order of 1/10 - 1/20 of the average point spacing in regions with suitable height contrast.
Applied to a dataset with overlapping and crossing strips at a flying altitude of 500 m, planimetric shifts of up to 65 cm were detected [51]. Report an RMS precision of 49/41/12 cm in X/Y/Z for the same dataset. As an extension of the technique, [32] describes the use of reflectance data (laser pulse intensity image, also in a TIN structure) replacing surface height texture in the determination of planimetric strip offsets in flat regions with sufficient surface reflectance texture.
Burman reports across-track coordinate discrepancies of up to 70 cm from a dataset acquired from a flying height of 700 meter above ground, derived from height difference measurements only [10].
Generally, defining ground control or tie points which are suitable for the determination of planimetric strip discrepancies turns out to be more difficult than defining height control [31]. Shows that significant surface gradients in orthogonal directions are required to solve for both vector components, and that height jumps have to be handled with great care. In many regions, the only suitable objects are buildings with roof faces in orthogonal directions (e.g. L- or T-shaped buildings). To overcome this deficit, suggests to use linear and planar features obtained from a segmentation of the data. While each individual feature provides only partial strip discrepancy information, sufficient input for a laserscanner data strip adjustment procedure can be generated by local accumulation of partial strip discrepancy information.
4. Conclusions - Proposals
Airborne laserscanning systems have faced a fast increase of their data rates in the past few years.
Parallel with growing data rates, the technique is now applied to a wide range of new application fields. While in early DTM generation applications with point spacing of several meters the primary focus was on height accuracy, planimetric accuracy of laserscanner data may be of equal importance in applications
aiming at 3D GIS information extraction from dense laserscanner data.
Unlike in conventional stereo-photogrammetry, the height precision of surface points generated by airborne laserscanning is usually significantly better than the planimetric precision. As the planimetric precision potential is mainly influenced by the scanning mirror mechanism and the orientation determination system, there will be an almost linear dependence of planimetric precision on flying height above ground. In contrast, as the dominant factors influencing height precision are platform position determination by differential GPS (and possibly ground definition within the laser spot), height precision will be much less flying height dependent.
The precision figures for the height coordinate of airborne laserscanner data reported in the literature are mostly in the order of 10-15 cm. Less studies have been published on the planimetric accuracy of laserscanner data. Precision figures reported in the literature are in the order of 50 cm for flying heights of 500 - 700 meter. These accuracy figures are in accordance with the specifications provided by system manufacturers. Laserscanner data strip adjustment procedures may reduce systematic errors, but their effect is generally limited when using global strip deformation models and neglecting local systematic effects.
Only digital methods are used on all stages of collection, archiving and processing data, both on the aircraft and during ground based processing. As a result data processing starts in the landing point immediately after flight day.
Laser scanning also shows the advantage of higher degree productivity for large-scale topography survey of forested areas at about 100-150 km, and on fixed-route flight survey about 500-600 km per day. Besides, for number of cases the laser scanning appears the only possible source of information on forested lands:
- True relief measurements (ground surface model) without significant loss of accuracy is possible with laser scanning for open forest areas and even under tree canopies.
- The work areas without visual texture is possible to survey like forest openings, sands, fully snowed areas etc.
- Survey of location and shape of objects of a complex structure mostly man-made, for example forest plantations, power line towers and lines, buildings and facilities, etc.
214
“Sustainable Management and Development of Mountainous and Island Areas”

The state-of-the-art aerial survey methods provide almost complete exclusion of ground geodetic works from technology cycle, as the data obtained principally at WGS-84 no need for plan/elevation on-ground support. The only exclusion is positioning and operating base GPS stations.
Aerial laser survey equipment may be installed within one day to any light aircraft or helicopter with permanent cargo/survey hatch. This makes possible to use aircrafts of local aviation companies and enterprises at any region, eliminating high expenses of long distance driving of aircraft to a survey site.
Low-density data (1 pulse/11.6 m2) from high altitude (2400 m) and large scanning angle (resulting in a 1.8 km swath width) are reasons for lower accuracy.
LIDAR is particularly well suited for floodplain mapping. The unique ability of LIDAR to penetrate vegetation allowing the terrain surface to be mapped directly from the air is a distinct advantage over field surveying or photogrammetry in mapping floodplains, which are heavily vegetated, which is normally the case. Current commercial LIDAR systems offer vertical accuracy of 15 centimetres (six inches) and horizontal spacing of data-points as high as 4.3 pts/m2. The high accuracy and high data-point density that can be achieved with LIDAR improves the accuracy of flood hazard mapping and hydraulic studies and ultimately provides for better flood preparedness.
5. References
[1] Ackermann F. Airborne laser scanning – present status and future expectations. Journal of Photogrammetry & Remote Sensing 1999; 54(2-3): 64-67.
[2] Andersen HE, Reutebuch SE, Schreuder GF. Automated individual tree measurement through morphological analysis of a LIDAR-based canopy surface model. In: Precision Forestry. Proceedings of the First International Precision Forestry Coop. Symposium; 2001 June 17-20; Seattle, Washington, University of Washington; 2001. p. 11-22.
[3] Aldred AH and Bonnor GM. Application of airborne lasers to forest surveys. Petawawa National Forestry Institute; Chalk River; Ontario; Canada Inf. Report PI-X-51; Technical Inf. and Dist. Centre 1985; p. 62.
[4] Axelsson P. DEM Generation from Laser Scanner Data Using Adaptive TIN Models. International Society for Photogrammetry and Remote Sensing. Proceedings of the International Archives of Photogrammetry and Remote Sensing; 2000 July 16-23; Amsterdam, International Society for Photogrammetry and Remote Sensing; 2000. Vol. XXXIII (B4): 110-117.
[5] Baltsavias EP. A comparison of between photogrammetry and laser scanning. ISPRS Journal of Photogrammetry and Remote Sensing 1999; Vol. 54: 83-94.
[6] Behan A. On the Matching Accuracy of Rasterized Scanning Laser Altimeter Data. IAPRS 2000; Vol. 33, Part B2: 75-82.
[7] Blair JB and Coyle DB. Vegetation and topography mapping with an airborne laser altimeter using a high efficiency laser and scan able field-of-view telescope. Ann Arbor. Proceedings of the Second International Airborne Remote Sensing Conference And Exhibition; 1996; Michigan, USA, Environ. Res. Inst. of Michigan; 1996. Vol. II. p. 403-407.
[8] Brenner C. Towards fully automatic generation of city models. International Society for Photogrammetry and Remote Sensing. Proceedings of the International Archives of Photogrammetry and Remote Sensing; 2000 July 16-23; Amsterdam, International Society for Photogrammetry and Remote Sensing; 2000. Vol. XXXIII (B3): 110-117.
[9] Brügelmann R. Automatic breakline detection from airborne laser range data. International Society for Photogrammetry and Remote Sensing. Proceedings of the International Archives of Photogrammetry and Remote Sensing; 2000 July 16-23; Amsterdamm, Netherlands, International Society for Photogrammetry and Remote Sensing; 2000. Vol. XXXIII (B3): 109-115.
[10] Burman H. Laser Strip Adjustment for Data Calibration and Verification. IAPRS 2002; Vol. 34, Part 3A: 67-72.
[11] Chappelle EW, Williams DL, Nelson RF and Mc Murtrey JE. Lasers may help in remote assessment of vegetation. Laser Focus World 1989; 6: 123-126.
[12] Crombaghs MJE, Brügelmann R, de Min EJ. On the adjustment of overlapping strips of laseraltimeter height data. IAPRS International Archives of Photogrammetry and Remote Sensing, 16-23 July 2000,
215
“Sustainable Management and Development of Mountainous and Island Areas”

Amsterdam (International Society for Photogrammetry and Remote Sensing), XXXIII(B3/1), pp. 230-237.
[13] Dubayah RO and Drake JB. Lidar remote sensing for forestry. Journal of Forestry 2000; 98: 44-46.
[14] Flood M, and Gutelius B. Commercial Implication of Topographic Terrain Mapping Using Scanning Airborne Laser Radar. Photogrammetric Engineering and Remote Sensing 1997; 63: 327.
[15] Flood M, Gutelius B. and Orr M. Airborne: Terrain Mapping. Earth Observation Magazine 1997; Feb: 87.
[16] Fowler RA. LIDAR for Flood Mapping. Earth Observation Magazine 2000; July: 67-75.
[17] Huising J, Gomes Pereira L. Errors and accuracy estimates of laser data acquired by various laser scanning systems for topographic applications. ISPRS Journal of Photogrammetry and Remote Sensing 1998; Vol. 53, No. 5: 245-261.
[18] Gong P, Biging GS. and Standiford R. The potential of digital surface model for hardwood rangeland monitoring. Journal of Range Management 2000; 53: 622-626.
[19] Hyyppä J, Kelle O, Lehikoinen M. and Inkinen M. A segmentation-based method to retrieve stem volume estimates from 3-D tree height models produced by laser scanners. IEEE Transactions Geosciences and Remote Sensing 2001; 39(5): 969-975.
[20] Jensen JR. Remote Sensing of the Environment. An Earth Resource Perspective. Prentice Hall; 2000.
[21] Kalshoven JE and Dabney PhW. Airborne laser polarimetry measurements during the forest ecosystems dynamics experiment. In: Proceedings of the IGARS’90 Symposium; 1990 May 20-24; College Park, MD, USA, University of Maryland; 1990. V. 1, p. 897-899.
[22] Kilian J. Calibration methods for airborne laser systems. IAPRS 1994; Vol. 30, Part 1: 42-46.
[23] Krabill WB and Martin CF. Aircraft positioning using global positioning system carrier phase data. Navigation J. Inst. Navigation 1987; 34(1): 1-21.
[24] Krabill WB, Thomas RH, Martin CF, Swift RN and Frederick EB. Accuracy of Airborne Laser Altimetry over the Greenland Ice-sheet. International Journal of Remote Sensing 1995; 16(7): 1211-1222.
[25] Krabill W, Abdalati W, Frederick E, Manizade S, Martin C, Sonntag J, Swift R, Thomas R, Wright W. and Yungel J. Greenland ice sheet: high-elevation balance and peripheral thinning. Science 2000; 289(5478): 428-430.
[26] Kraus K, Pfeifer N. Determination of terrain models in wooded areas with airborne laser scanner data. Journal of Photogrammetry and Remote Sensing (ISPRS) 1998; Vol. 53: 193-203.
[27] Kraus K. and Rieger W. Processing of laser scanning data for wooded areas. In Fritsch and Spiller, editors. Photogrammetric Week ’99, Stuttgart, Germany: Wichmann Verlag; 1999.
[28] Kraus K and Pfeifer N. Advanced DTM generation from lidar data. International Society for Photogrammetry and Remote Sensing. Proceedings of the International Archives of the Photogrammetry, Remote Sensing and Spatial Information Sciences; 2001 Jul. 22-24; Annapolis, USA, Maryland; 2001. Vol. XXXIV-3/W4, p. 23-30.
[29] Lefsky MA, Cohen WB, Harding DJ. Lidar remote sensing of aboveground biomass in three biomes. International Society for Photogrammetry and Remote Sensing. Proceedings of the International Archives of the Photogrammetry, Remote Sensing and Spatial Information Sciences; 2001 Jul. 22-24; Annapolis, USA, Maryland; 2001. Vol. XXXIV-3/W4, p. 150-160.
[30] Lim K, Treitz P, Wulder M, St-Onge B and Flood M. LiDAR remote sensing of forest structure. Progress in Physical Geography; 2003, 27(1).
[31] Maas H-G. Least-Squares Matching with Airborne Laserscanning Data in a TIN Structure. IAPRS 2000: Vol. 33, Part 3A, pp. 548-555.
[32] Maas H-G. On the Use of Pulse Reflectance Data for Laserscanner Strip Adjustment. International Society for Photogrammetry and Remote Sensing. Proceedings of the International Archives of the Photogrammetry, Remote Sensing and Spatial Information Sciences; 2001 Jul. 22-24; Annapolis, USA, Maryland; 2001. Vol. XXXIV-3/W4, p. 31-38. Also Accepted for ISPRS Workshop on Land Surface Mapping and Reconstruction using Laser Altimetry.
[33] Maas H-G. Methods for measuring height and planimetry discrepancies in airborne
216
“Sustainable Management and Development of Mountainous and Island Areas”

laserscanner data. Photogrammetric Engineering and Remote Sensing 2002; Vol. 68, No. 9: 933-940.
[34] Magnussen S. and Boudewyn P. Derivations of stand heights from airborne laser scanner data with canopy-based quintile estimators. Canada Canadian Journal of Forest Research 2000; 28: 1016-1031.
[35] McCombs JW, Roberts SD and Evans DL. Influence of fusing lidar and multi spectral imagery on remotely sensed estimates of stand density and mean tree height in a managed loblolly pine plantation. Forest Science 2003; 49(3): 457-466.
[36] Means JE, Acker SA, Harding DJ. Use of large-foot-print scanning airborne lidar to estimate forest stand characteristics in the western Cascades of Oregon. USA Remote Sensing of Environment 1999; 67(3): 298-308.
[37] Means JE, Acker SA, Fitt BJ. Predicting forest stand characteristics with airborne scanning lidar. Photogrammetric Engineering & Remote Sensing 2000; 66(11): 1367-1371.
[38] Means JE, Hopkins PF, Jensen JR. Industry and academia explore remote sensing applications. Journal of Forestry 2001; 99(6): 4-6.
[39] Miller DR, Quine CP and Hadley W. An investigation of the potential of digital photogrammetry to provide measurements of forest characteristics and a biotic damage. Forest Ecology and Management 2000; 13(5): 279-288.
[40] Montes N, Gauquelin T, Badri W. A non-destructive method for estimating aboveground forest biomass in threatened woodlands. Forest Ecology & Management 2000; 130(1-3): 37-46.
[41] Morgan M, Tempfli K. Automatic building extraction from airborne laser scanning data. International Society for Photogrammetry and Remote Sensing. Proceedings of the International Archives of Photogrammetry and Remote Sensing (IAPRS); 2000 July 16-23; Amsterdam, International Society for Photogrammetry and Remote Sensing; 2000. Vol. XXXIII (B3): 110-117.
[42] Næsset E. Determination of mean tree height of forest stands by digital photogrammetry, Scandinavian Journal of Forest Research 2002a; 17: 446-459.
[43] Næsset E. Predicting forest characteristics with airborne scanning laser using a
practical two-stage procedure and field data, Remote Sensing of Environment 2002b; 80: 88-99.
[44] Næsset E and Økland T. Estimating tree height and tree crown properties using airborne scanning laser in a boreal nature reserve. Remote Sensing of Environment 2002; 79: 105-115.
[45] Ridgeway JR, Minster JB, Williams N, Bufton JL and Krabill WB. Airborne Laser Altimeter Survey of Long Valley, California. USA Geophysical Journal Intl. 1997; 131(2): 267-280.
[46] Ritchie JC, Evans DL, Jacobs D. Airborne laser measurements of forest and range canopies. In: Application of advanced information technology: effective management of natural resources. Proceedings of the Conference; 1993 June 18-19; Spokane, USA, Washington; 1993. p. 428-435.
[47] Sapeta K. Have You Seen the Light-LIDAR Technology is Creating Believers. GEOWorld 2000; October: 32.
[48] Sun G, Ranson KJ. Modelling lidar returns from forest canopies. IEEE Transactions on Geosciences & Remote Sensing 2000; 38(6): 2617-2626.
[49] Todd K, Csillag F and Atkinson P. Three-dimensional mapping of light transmittance and foliage distribution using LIDAR. Canadian J. of Remote Sensing 2003; 29(5): 544-555.
[50] Turner AK. LIDAR Provides Better DEM Data. GEOWorld 2000; November: 30.
[51] Vosselman G, Maas H-G. Adjustment and filtering of raw laser altimetry data. Proceedings of the OEEPE Workshop on Airborne Laserscanning and Interferometric SAR for Detailed Digital Elevation Models; 2001 March 1-3; Stockholm, Sweden, Royal Institute of Technology, Department of Geodesy and Photogrammetry, 2001; p. 5-9.
[52] Wang Z, Schenk T. Building extraction and reconstruction from lidar data. In International Society for Photogrammetry and Remote Sensing. Proceedings of the International Archives of Photogrammetry and Remote Sensing (IAPRS); 2000 July 16-23; Amsterdam, International Society for Photogrammetry and Remote Sensing; 2000. Vol. XXXIII (B4): 110-117.
[53] Wild D, Krzystek P. Automated break line detection using an edge preserving filter. International Society for Photogrammetry
217
“Sustainable Management and Development of Mountainous and Island Areas”

and Remote Sensing. Proceedings of the In International Archives of Photogrammetry and Remote Sensing (IAPRS); 1996 July 16-23; Vienna, International Society for Photogrammetry and Remote Sensing; 1996. Vol. XXXI (B3): 110-117.
[54] Wulder M, St-Onge B, Treitz P. Three-dimensional analysis of forest structure and terrain using LIDAR technology. Proceedings from Ideas to Innovation-Geomatics for a New Millennium; GEOIDE; 2000 May 25-26; Calgary, Canada, AB; 2000. p. 15-25.
[55] Ziegler M, Wimmer A, Schardt M. Hochauflösende Gelände- und Oberflächenmodelle aus Laserscannerdaten – ein Anwendungsbeispiel aus der Forstinventur. Österreich. VGI: Z. Vermesse. Geoinf. 2001; 89(1): 18-25.
218
“Sustainable Management and Development of Mountainous and Island Areas”

Environmental Improvement of Forest Roads from Category C to Category B
Vasileios C. Drosos Ass. Professor, Department of Forestry and Management of Environment and Natural Resources,
Democritus University of Thrace, Ath. Pantazidou 193 Street, 68200 N. Orestiada, tel.: 25520 41122, fax: 25520 41192, e-mail: [email protected]
Vasileios J. Giannoulas Lecturer, School of Foresty and Natural Environment, Aristotle University of Thessaloniki, Campus
54124 Thessaloniki, TC 226, tel.: 2310 998977, 992744, fax: 2310 998979, e-mail: [email protected]
Aristotelis - Kosmas G. Doukas Professor, School of Foresty and Natural Environment, Aristotle University of Thessaloniki, Campus
54124 Thessaloniki, TC 226, tel.: 2310 998971, 992748, fax: 2310 998979, e-mail: [email protected]
Abstract. Until not so long ago, the opening up of forests was carried out with the machinery of the time, based on purely technical and financial criteria. Nowadays, apart from the financial and technical aspects, special emphasis is given to the compatibility of construction work with the natural environment based on measurable criteria and on the Environmental Impact Assessment (E.I.A.) with accuracy and objectivity without general aphorisms. “Compatibility with the environment” means defining, describing and assessing the effect of a work on the environment. Especially in wooded areas, works may cause loss of vital green spaces and increased risk of floods in the broader area, thus leading to continuous deterioration of the quality of life overall. Thus, it is clear that for each forest technical work, it is absolutely necessary to assess its compatibility with the environment. The largest part of the country’s forests are crossed by category C forest roads, most of which, due to the needs of modern society and the multiple goals of forestry, must be improved in order to be more accessible to humans and vehicles. The aim of this paper is to investigate the effect of forest road improvement from category C to category B on natural environment. In this context, the paper sets the criteria and the parameters affecting a forest road and determines the weight of the intensity and absorbency criteria of the ecosystem. The forest road in the area Avanta – Palaia Nipsa was measured by means of on site research and Geographical Information Systems,
and it has been assessed based on the criteria of intensity and absorbency, before and after the improvement works. The improved road that has been examined is compatible with the environment. Finally, measures for improving roads and rehabilitating the environment in damaged areas are also proposed.
Keywords. Improvement, forest opening up, road construction, Environmental Impact Assessment.
1. Introduction
A forest is exploitable only through a good road network. Until not so long ago, the opening up of forests was carried out with the machinery of the time, based on purely technical and financial criteria. Recently and following a worldwide lobbying on the degradation of the environment, countries were forced to impose laws for the protection of the environment. According to these laws, any construction work must be preceded by an environmental impact assessment to demonstrate impact during the construction as well during the use of the work. The environmental effects to be examined are categorized as follows [18]:
- Temporary or persisting. Temporary effects appear during the
construction, e.g. noise from the construction machinery, dust, while the persisting ones have continuous and stable influence, such as the
219
“Sustainable Management and Development of Mountainous and Island Areas”

change of the natural environment, noise, air pollution etc.
- Accidental or anticipated. The first ones include effects such as fire,
environmental pollution due to accidents, while the second ones include the occupation of agricultural land leading to migration or shifting to other economic activities along with transfer of the population to urban centres.
- Reversible or irreversible. Reversible are the effects that can be
eliminated through adequate measures or at least they can be maintained at very low levels. Irreversible are the ones that do not allow the environment to come back to its initial state. This second category may also be considered as persisting.
- Fast developing or slowly developing The first ones occur during the construction
or right after the completion of the work. The second ones may occur either during construction works or after their completion, but their effects appear much later e.g. effect on the flora and fauna.
The steps taken during the Environmental Impact Assessment are the following:
- Analysis of the environmental impact of the opening up works.
- Analysis of the criteria affecting the layout and the construction of an individual forest road.
- Analysis of the absorbency criteria for the effects of the road construction.
- Evaluation of the criteria by means of field measurement data, photogrammetric and photo-interpretative assessments and GIS.
- Grading of the same criteria with objective grading – each coefficient affecting the impact is graded as excellent (100) when it has zero effect.
- Evaluation of a series of alternative solutions to end up to the one with the highest grading, which is called compatibility coefficient of the work with the environment.
- Drawing of conclusions and proposals for the use of modern means during the evaluation of environmental impact.
Compatibility with the environment means to determine, describe and evaluate the effects of a work on the environment. After the intensive forest road construction from 1960 to date, the concept that each new road construction should be carried out on an environmentally friendly basis and only when it is absolutely necessary, started to be applied [3]. Especially in the field of problematic forest areas where there is loss of vital green spaces leading to increased flood risk
in the broader region and degradation of the quality of life overall. Thus, it is clear that for every forest technical work, it is necessary to control its compatibility with the environment.
The roads that have been constructed to date by the forest service not only haven’t damaged natural environment but they improved the area without creating serious problems to the ecosystem.
Category C forest roads nowadays cross the largest part of the country’s forests. In recent years, due to the complex role of forest roads (effective fire protection, intensive protection and systematic management of the forest wealth, serving mountainous communities etc), it is absolutely necessary to ensure accessibility all around the year.
Forest road network, as the main connection work must be studied scrupulously before its construction or its potential improvement, because it is a work of human intervention in natural ecosystems and results in great changes in the form and operation of nature which can be maximized or minimized depending on the construction method.
The completion of the environmental impact assessment entails the identification and assessment of the existing alternative solutions. Amongst them, the solution of “no action” must be also examined when necessary and in no way, should it be excluded because then it deprives the approach from the necessary objectivity and balance. The zero (0) solution, referred to forest without roads, is technically and economically impossible [6].
By improving a forest road from a lower to a higher category, we improve its technical characteristics achieving: a) 8% road gradient maximum, b) 6m road width, c) 30m curve radius minimum, d) construction of concrete pipes and ditches for the drainage of rain waters, e) 2% road inclination for straight parts and 6% for curves, with widening depending on the curve radius, f) straight parts between opposite-direction curves, at least 10m and shaping of the slopes of ditches and embankments in order to avoid accessibility problems around the year and to achieve the following:
1. Easy transfer of the residents of neighbouring areas, especially of the apiarists and lumberjacks.
2. Free transfer of forest products, such as wood.
3. Rational management and protection of the forest against the risks threatening it.
220
“Sustainable Management and Development of Mountainous and Island Areas”

4. Easier access for excursionists. The aim of the present paper is to investigate
the environmental impact of the improvement of an already existing category C forest road, in order to achieve the requirements of a category B forest road 10+353,37 km long.
The existing road mainly serves the need for fire protection for the broader area of the forest complex as well as the rational management of the adjacent forest and reforestations of a total area of 4,000 ha, the movement of the forest workers for the performance of works as well as the facilitation of the area’s stockbreeders.
2. Research area
In the area, there is no approved land plan while the specific work is located inside the borders of the area called “Southern FOREST complex of Evros”, enlisted under the code OP 1110009 in the National List of Regions of the European Network Nature 2000, based on the updated data of the year 2003 for Greece. The area has been characterized as a Special Preservation Zone (3PA) for the bird fauna, conforming to Directive 79/409/EC.
The Southern forest complex is at the southeastern ends of the mountain range of Rodopi. It is located at 41o 06´ and 40o 51´ latitude and 25o 38´ and 26o 12´ longitude.
Specifically, the borderline of the complex is the following:
North: the line passing from the hills of Skopia – Mytoula – Kefali – Kazakou Magoula –Simaia – Lagokoryfi – Karvouniaris – Frourio
West: borders of the prefectures of Evros and Rhodopi
South: the seashore and the national road from Nea Chili to Monastiraki
East: the national road from Alexandroupolis to the Greek borders.
The total area of the complex is 81929,6 Ha. The maximum height above sea level is 950m
while the prevailing height is 400-500m and the mean ground slopes are 40-50%.
Based on the ecosystems developed on the broader area under research and their vegetation characteristics, it is noted that the land uses in the Southern Forest Complex belonging to the jurisdiction of the Forest Service of Alexandroupoli, to its largest extend concern forest areas in general, followed by rangelands and by cultivated lands. Forest areas are of various types.
3. Methodology
The method, which would be applied, should be practical, effective and easy to use before the road construction. For this reason the following steps have been taken:
- As far as absorbency is concerned: Setting of the criteria and the absorbency
percentages of the ecosystem (A) based on the opinions of experts (special scientists) and the related literature ([19]; [9]; [15]; [14]; [11]; [17]). Grading of the absorbency capacity of the ecosystem as for the effect of the forest road, based on data collected from the management plan of the research area.
The grading of these criteria depends on the following principle:
We accepted a situation as ideal (=100%) for the forest protection by road construction. The percentage of deviation from this ideal situation will be subtracted from 100%. The result will be the grading of the criteria.
The absorbency criteria are divided into 3 categories:
1st forestry criteria, 2nd topographic criteria and 3rd social criteria.
The weights of the criteria are: three (3) for the forestry criteria, two (2) for the topographic criteria and one (1) for the social criteria.
The forestry criteria are the following: 1. The kind of coverage. The percentage of
the road that crosses: the forest is graded with excellent 100; a wooded area, depending on the density, with 25-50; and a woodless area with 15.
2. The forestry species. The percentage of the road that crosses: a mixed forest is graded with excellent 100; a conifer forest with 70; and a broadleaf forest with 50-80 depending on the season when measurements are performed, that is if trees have leaves or not.
3. The management form. The percentage of the road that crosses: a seedling (high) forest is graded with excellent 100. The percentage of the road crossing a coppice forest is graded with 50 and the percentage of the road crossing a middle forest is graded with 75 to 100 depending on the seedling-coppice forest rate.
4. Age (forestry form). The percentage of the road crossing a group-selective forest is graded with excellent 100, a selection forest with 75 and an even-aged forest with 50.
5. The height of the trees. The percentage of the road that passes among large trees >20m is graded with excellent 100, medium size trees 10-
221
“Sustainable Management and Development of Mountainous and Island Areas”

20m with 75 and small trees <10m with 25-50 depending on their height.
6. The site quality. Good (first and second site quality), medium (third and forth site quality) and poor (fifth and sixth site quality). The percentage of the road crossing: good land quality is graded with excellent 100, medium with 50 and poor with 25.
7. The productivity of the forest: Category I (productivity over 3m3/year/ha). Category II (productivity 1-3m3/year/ha). Category III (productivity less than
1m3/year/ha). The percentage of the road crossing forest of
category I productivity is graded with excellent 100, forest of category II productivity with 50 and forest of category III productivity with 25.
The topographic criteria are the following: 1. The cross slope of the ground. The
percentage of the road passing from small slopes <8% is graded with excellent 100, from medium slopes 8%-20% with 50 and high slopes >20% with 25 to 5, depending on the slope.
2. The exposition. The percentage of the road passing from an altitude less than 1000m with northern exposition is graded with excellent 100, southern with 50 and eastern-western with 75.
The percentage of the road passing from an altitude over 1000m, with eastern or western exposition is graded with excellent 100, and northern or southern with 70.
3. The relief. The percentage of the road passing through a mild relief is graded with excellent 100, a multifarious relief with 15 and a varied relief with 50.
Social criteria depend on the number of humans affected by the road. Distance plays a major role in impact e.g.
1. Distance from a tourism resort (Since tourism is seasonal and is culminated during the peak season, each kilometre of the distance from the resort increases grading e.g. distance 0-1 km is graded with 0, 1-2km with 10, 2-3km with 30 etc.).
2. Distance from the national and country road network (the same as with the resort).
3. Distance from a railway (it has no direct impact but if one sees the road from the train, he/she might want to visit the forest by car. However, it has impact due to noise).
4. Distance from an archaeological site (the same as with the resort).
5. Distance from an adjacent big city (the same as with the resort).
6. Distance from an adjacent village (the same as with the resort).
7. Distance from a European path every time the road crosses the path, its grading is reduced (e.g. if it crosses the path once it is graded with 80, if twice with 60, 3 times with 40 etc.).
8. Distance from a natural or artificial lake or river (the same as with the resort).
In these cases, the road is graded with 25% when there are many recipients, with 50% when there are few recipients and with 100% when there are no recipients.
- As far as intensity is concerned: The intensity criteria have been set based on
literature and the questionnaire. The questionnaire was drafted with the help of experts and literature and includes the impact intensity criteria. It was asked from the employees of forestry technical offices in Greece to evaluate the criteria and express their views and observations. ([4]; [7]; [12]; [8]; [10]; [21]; [13] [2]; [1]). This gradation depends on many parameters such as [9]:
- The effect period. - The influence area. - People’s sensitivity. - Social and political desire. The intensity criteria were divided in laying
out criteria and construction criteria. The laying out criteria are the following:
1. The curve radius (the more it exceeds 25 meters the lowest the grading).
2. The laying out of the gradient (the highest the height discrepancy between the ground and the gradient over 0.5m, the lowest the grading).
3. The cross section (the largest the distance of the centre line and the section point of the road with the ground over 0.5m, the lower the grading depending on the discrepancy in meters).
4. The road gradient (the percentage of the road where the road gradient is not 3-12%, reduces the grading on a scale of 100).
5. The width of the road (the percentage of the road where the road width is different than 3.5m with widening every 250m, reduces the grading on a scale of 100).
6. The distance of serpentines (the less the distance between serpentines from 500m, the less the grading).
7. The distance of the forest road from a stream, from the forest borders and from dangerous sites.
The percentage of the forest road that is located on a valley less than 10m from a stream bank reduces the grading on a scale of 100.
222
“Sustainable Management and Development of Mountainous and Island Areas”

The percentage of the forest road that is located less than 10m outside the forest borders or less than 20m inside the forest borders, for aesthetic reasons, reduces the grading on a scale of 100.
The percentage of the road passing by a clay ground, large opening streams, unstable grounds, reduces the grading on a scale of 100.
8. The view of the forest road to morphological formations, vegetation, space projection, compatible constructions, water areas and the adaptation of the forest road in the environment.
The percentage of the road where there are no morphological formations (no need to prevail), reduces the grading on a scale of 100.
The percentage of the road, where the visual field is not consisted of vegetation forms providing even a limited variety; uniform cultivation in the form of geographical shapes reduces the grading on a scale of 100.
The percentage of the road, where the visual field include no water flows and streams, even with limited visual interest and clarity (provided that they exist), is graded with a lower percentage on a scale of 100.
The percentage of the road, where the visual view does not focus on the forest and the assiduous forestry interventions, is graded with a lower percentage on a scale of 100.
The percentage of the road, which is not visually concealed when observed from the opposite slope from a spot of the same altitude, is graded with a lower percentage on a scale of 100.
The construction criteria are the following: construction machinery, construction materials, the seeding and mulching of side slopes, technical works, drainage, supply [1].
The percentage of the road, where a hydraulic excavator has not been used on earthy grounds with ground slope over 60%, is graded with a lower percentage on a scale of 100.
The percentage of the road, where a hydraulic excavator has not been used on rocky grounds for fragment management, is graded with a lower percentage on a scale of 100.
The percentage of the road that has not been stabilized on a road gradient > 10%, is graded with a lower percentage on a scale of 100.
The percentage of the road where the material of road surfacing is not taken from the site or does not consist of environmental-friendly recycled materials is graded with a lower percentage on a scale of 100.
Depending on the construction materials, if the road is gravel-paved, it is graded with a lower percentage on a scale of 100. If it is asphalted or if it bears other construction materials, it is graded with 50.
The percentage of the road’s side slopes, where on the embankments with slope near the corner of the natural side slope and ground slope of about 60 – 70%, natural or technical seeding and mulching has not been carried out, is graded with a lower percentage on a scale of 100.
The percentage of road culverts that is not: a. Slab-roofed culverts in openings 3-4 meters wide b. Drain boxes on soil of poor bearing, 3-4 meter wide. C. Concrete pipes with embankment twice as large as the pipe’s diameter, depending on the type and corner of bearing d. Stabilized stream beds with concrete (passages), is graded with a lower percentage on a scale of 100.
The percentage of the road retaining walls exceeding 3 meters in height, is grade with a lower percentage on a scale of 100.
The percentage of exceeding the bridge’s opening over 8 m., is graded with a lower percentage on a scale of 100.
The lack of drain dips (rills) across the surface at road gradient > 10% and length > 100 m., is graded with a lower percentage on a scale of 100.
The percentage of the main forest road where ditches on the road surface and the necessary sloping for its drainage lack, is graded with a lower percentage on a scale of 100.
The evaluation of all these parameters of absorbency and intensity will be difficult and therefore the description of an E.I.A. in a profile form will be a necessary addition.
The results of the intensity and absorbency criteria provided the compatibility coefficient of every road [5].
To grade the criteria, aerial photographs and digital orthophotos of the area were used as well as the management plan, the forestry map of the complex and the geological map. The on site measurements involved the use of compass, clinometers, and measure tape [20].
The goal of the construction, as mentioned before, is to transform the already existing category C forest road into a category B road and improve it by minor widening, construction of drainage ditches rain waters and construction of similar technical works (concrete pipes).
223
“Sustainable Management and Development of Mountainous and Island Areas”

4. Results
The study of the forest road and the grading of the ecosystem’s absorbency and intensity resulted in table 1.
The grading is carried out as follows: 1. To calculate the mean intensity value, we
multiply the grade of each criterion by its weight and in the end, we divide the sum of the products by the total sum of weight. This value is the mean intensity value on a scale of 100 (%). The same applies for absorbency. These figures, CIand CA, provided that weight rates are not subjective, indicate the approximate protection degree of the natural environment from the construction of the forest road.
2. To calculate the forest road’s compatibility coefficient we multiply the mean absorbency value by the mean impact intensity value.
- For category C road: C = (I x CI) x (A x CA) = 64.12% x 66.34% = 42.53%
- For category B road: C = (I x CI) x (A x CA) = 64.12% x 91.39% = 58.60%
It seems that the forest road in question, which was improved from category C to category B, has mean absorbency value of 64.12% and mean intensity value of 91.39%. The forest road’s compatibility coefficient with the natural environment is 58.60% or 0.586.
Based on the results, we notice that the road under study is classified as acceptable, since its compatibility coefficient is 58.60%.
In the parts of the road where: S>50% and A>50%, the construction is
accepted under no special conditions. S<50% and A>50% or S>50% and A<50%,
the construction is accepted under conditions. S<50% and A<50%, the construction is
accepted provided that works to restore natural environment will be carried out.
In the case of the forest road under study, we accept that its improvement was rational.
To satisfy the above-mentioned criteria, it was necessary to improve the road accessibility by carrying out the works briefly described below:
- Earthworks to improve the sub grade of the existing forest road, with excavations and limited widening on specific sites.
- Works involving the opening and shaping of drainage ditch for rain waters (typical triangular 0.24-0.32 m² cross section).
- Construction of technical works; thirty six (36) concrete pipes, D=0,80 m. four (4) concrete pipes, D=1.00 m., one (1) concrete pipe D=0,60 m., with respective walls uphill and downhill, a retaining wall to support the side slopes 11.30 m long and 3.80 m. high, and one (1) drainage, in order to safeguard accessibility against spring waters.
5. Conclusions - Proposals
The improving of the forest road from category C to category B and the control of its compatibility with the environment led to the following conclusions:
Taking into account the value of the compatibility coefficient, as well as the increased need to improve the existing road and meet the needs of its users, the road’s new layout is considered as acceptable, from an economic and technical point of view as well as in terms of environmental impacts.
The construction of the work will be truly beneficial, given that, so far, we are obliged to carry out maintenance works to the existing category C forest road, quite often, twice or three times a year, since the first rain, even if it is hardly heavy, turns the existing road sub grade inaccessible, because of the vertical but also parallel crevices, which do not allow the passage of vehicles (Fig. 1).
The cost of maintaining the road is particularly high, while at the same time there is increased cost for the vehicles of the Forest Service due to delays (fuels, damages due to bad road sub grade). The same also applies for forest workers, cattle breeder, beekeepers, farmers and the other residents of the area due to the bad condition of the roads.
The environmental effects may be divided in two categories: those that will occur during the execution of the works and those that will occur after the completion and operation of the work.
The said work is a low-scale work, including low intensity interventions in the natural environment (reversible) and limited and provisional consequences (temporary) on the biotic and abiotic environment, only during its execution. Gas wastes are expected to be produced by the internal combustion motors of the machines during the works for the construction of the infrastructure (general excavations, embankment construction, land levelling and shaping of the road forest’s surface and material transfer for the construction).
224
“Sustainable Management and Development of Mountainous and Island Areas”

Table 1. Evaluation of forest roads C and B C B
Criteria Weights Grade % Sum Grade
% Sum
a. Criteria of absorption (A)1. Terrain conditions 1.1. Forest 3 50 150 50 150 1.2. Broadleaved forest 3 60 180 60 180 1.3. High forest 3 75 225 75 225 1.4. Selection forest 3 75 225 70 225 1.5. Mean height 3 75 225 75 225 1.6. Site quality 3 50 150 50 150 1.7. Productivity 3 50 150 50 150 1.8. Slope 2 50 100 50 100 1.9. Exposition 2 80 160 80 160 1.10. Relief 2 75 150 75 150 2. Distance from 2.1 Tourist places 1 90 90 90 90 2.2. Highway 1 80 80 80 80 2.3. Railway 1 75 75 75 75 2.4. Archaeological sites 1 100 100 100 100 2.5. Town 1 100 100 100 100 2.6. Village 1 10 10 10 10 2.7. European path 1 10 10 10 10 2.8. Lake or river 1
b. Criteria of intensity (I)Laying out
1. Earthwork allocation 1.1. Curve radius 2,10 75 157 100 210 1.2. Gradient 2,01 65 131 92 185 1.3. Gross section 2,25 40 90 70 157 2. Road width 2,04 50 102 87 177 3. Road gradient 2,52 100 252 100 252 4. Serpentine 2,13 60 128 100 213 5. Position of road 5.1. Distance of water flows 1,83 100 183 100 183 5.2. Distance of forest boundary 1,65 100 165 100 165 5.3. Area with construction problems 2,40 50 120 50 120 6. Picture of landscape 6.1. Form of terrain 1,83 50 91 50 183 6.2. Vegetation 1,80 100 180 100 180 6.3. View effect 1,70 50 85 50 170 6.4. Compatible constructions 1,60 75 120 75 160 6.5. View of water flows 1,65 7. Visual absorption capability 1,77 70 124 90 159
Construction 8. Construction of forest road (only for existing road) 8.1. Machinery of earth works 2,16 70 151 80 173 8.2. Material 2,08 75 156 100 208 8.3. Seeding and mulching of side slope 1,38 40 55 90 124 8.4. Road drainage system 2,31 30 69 100 231
It does not exist in this road.
225
“Sustainable Management and Development of Mountainous and Island Areas”

Figure 1. The impact of the water to the non-existence road drainage system.
These wastes consist of chemical compounds such as carbon monoxide (CO), hydrocarbons (H/C) and nitrogen oxides (Nox). However, due to the work’s size, they are considered unimportant and cannot disturb the composition of the area’s atmosphere. During the execution phase, a local increase in the noise level caused by the activity of the various machines is expected to occur. The noises are considered negligible, not only because of the work’s location, where the forest serves as a natural filter, but also because of its small size. Finally, during the work’s execution, the relief of the road surface is also expected to be affected, since new works to partially improve the road surface
will be executed, given that the existing forest road is already largely developed and its improvement will not delay.
This improvement is not expected to cause important alteration on the ground relief and the features of the area.
The changes to occur on the topographic relief due to the construction (ditch construction, widening, technical works construction) will be relatively limited due to the small extent of the works, as we have mentioned before, since it concerns the widening of the already existing forest road, mainly for shaping the side slopes and constructing a drainage ditch. The technical works construction is only limited to concrete pipes of a diameter of 0,80 m. and only four culverts of a diameter of 1,00 m., while a small drainage and a retaining wall for the stabilization of the side slopes are also provided.
The important point is that the construction of this work makes the access to the fire fighting vehicles and all other vehicles easier, which will directly contribute to the effective protection of vegetation, within an extremely flammable forest environment, as well as to the control of any illicit woodcutting activities. The work location does not affect cultivated areas or grasslands.
The excavations and the road widening, as well as the foundation of the technical works will not be extended and thus, they will not cause significant vegetation loss. Any vegetation loss that may occur will be naturally restored shortly, since this forest road passes through the forest and the existing vegetation does not face important regeneration problems. The vegetation loss can cause limited visual disturbance, since the nature of the foundation works is of small scale. The area is covered by extended vegetation and any intervention of such form will not cause alteration of the landscape.
The aesthetics reduction due to the vegetation loss is temporary and reversible thanks to the flora species of the area, which will recover shortly, even as soon as the first sprouting period after the works completion.
During the construction phase, no important impact on the animal species living within the work’s area is expected. It is estimated that the construction machinery will cause nuisance, which will lead to small, temporary displacements of animals towards
226
“Sustainable Management and Development of Mountainous and Island Areas”

neighbouring areas. These effects, however, will occur only during the work’s construction. The nuisance that will be caused by the use of explosives, will be of small duration and magnitude, since the explosives that will be probably used will be of low power and of limited scale, where a hammer machine will be used, mainly for opening up the drainage ditch. Only in case of absolute necessity explosives will be used for the rock excavation of solid rocks. If the use of explosives is necessary, even of small power, it will not take place during the reproduction period, i.e. from July to October so as not to cause negative impact on the biological cycle of the wild fauna.
Moreover, on the passage points and along the forest road axis there are no indications of nest making or wildlife hibernation sites (birds or mammals). The sites estimated to fulfil the nesting conditions for some predators are far enough, on the rocky slopes, in the area of Avantas and Loutra. Consequently, there is no question of particular nuisance for the fauna and especially bird fauna.
The impact on the population and the employment in the research area settlements are indirect and positive, as the residents will have financial benefits, since the traffic conditions, the transfer of the forest-workers in the forest and the facilitation of the stockbreeders living in the area will be improved. The increase in traffic from and to the construction points, especially of the technical works, due to the staff transfer vehicles, the construction machines and especially the traffic of the trucks transferring the materials will cause a small increase on the noise levels, as well as an increase on the air pollution. The settlements, however, will not be affected, as the work sites are located away from the inhabited areas. Specifically, there will be an increase in the dust due to machinery traffic, during the excavations for the improvement - widening of the road and the technical works’ construction.
The impact of all these is estimated as negligible and will last only during the construction period.
Another important criterion for the positioning of the work was that it should be located in a place where there would be no need for a totally new opening up, which would involve greater intervention in the forest and the environment and would damage the overall area. For this reason, the already
existing category C forest road remained with small changes. This road will be improved to ensure the best possible access to the fire fighting vehicles, given that an important network of forest and tractor roads end up to this same road, which serve the management and protection of a large forest and reforestation area. Both its starting point and its end are connected with the corresponding country road network of Avanta-Aisymi and the category B road of Nipsa-Palaia Nipsa.
The materials collected from the works for the existing ditch cleaning will be layered properly during the final shaping of the road sub grade.
For the construction of the technical works (concrete pipes, retaining wall e.t.c.), the necessary materials will be supplied by the aggregates mines closest to the work’s area.
The improvement work on the forest road “Avanta-Palaia Nipsa” is directly related with the fire protection of the greater area and the continuous traffic of fire fighting vehicles. After the work’ s completion, it is expected that exhaust emissions, noise pollution and odours produced by the engines of the vehicles moving on the forest road will be reduced thanks to the normal speed on the improved sub grade, time saving and fuel saving.
After the work’ s completion, small-scale negative impact is expected on environmental elements:
(a) due to the change of the road’s technical features (widening, inclinations, arches of curvature, e.t.c.), but not an important one,
(b) the destruction of the forest vegetation on both sides of the road will be the minimum possible,
(c) streams’ embankment and the shifting of the water flow within the catchment area, will not be significantly affected. On the contrary, it will have positive consequences for the normal flow of the rain waters,
(d) the alteration on the area’s ground relief, will not affect the landscape and
(e) alteration on land uses and exploitation of the area’s forest resources, is not expected.
The conclusion drawn is that with the improvement works of the category B forest road “Avanta-Palaia Nipsa”, no significant and irreversible disorder on the natural environment is anticipated. Nevertheless, if it does occur to any extent (possibly during the work’s execution), it will be temporary and
227
“Sustainable Management and Development of Mountainous and Island Areas”

negligible, so that the ecosystem maintains its balance.
Furthermore, this work safeguards forest protection as well as better forest management, which can be done in the appropriate season without particular difficulties and on the lower cost.
6. References
[1] Becker G. Walderschließung auf dem Prüfstand. DEUTSCHLAND AFZ 1995; V 9: 482-483.
[2] Doukas K. Walderschließung in Griechenland. DEUTSCHLAND AFZ 1993; Heft 19: 1056-1057.
[3] Doukas A-K. Forest Constructions and Natural Environment. Thessaloniki: Giaxoudis Publishing; 2004.
[4] Doukas K and Akca A. Umweltverträglichkeitsprüfung bei der Walderschließung in Griechenland. DEUTSCHLAND Allgemeinen Forst und Jagdzeitung, 1999; 170(Heft 3): 47-53.
[5] Giannoulas V, Doukas K, Drosos V, Soutsas C. The Environment Impact Assessment (E.I.A..) by the forest opening up in the forest complex of Down Olympus. In: Bulgarian Academy of Sciences. Proceedings of the third Balkan scientific conference on Study, Conservation and Utilization of Forest Resources; 2001 October 2-6; Sofia, Bulgaria. Sofia: Forest Research Institute; 2001. Volume I, p. 58-66. ISBN: 954-90896-5-7.
[6] Heinimann H. Umweltverträglichkeit forstlicher Erschließungen. Konzept für die Abwicklung, die Analyse und die Bewertung. Schweiz. Z. Forstwegs 1994; 145: 139-157.
[7] Kotoulas D. Management and control of torrent streams. Part I. Thessaloniki: Aristotle University of Thessaloniki Press; 1985.
[8] Kotoulas D. Management and control of torrent streams. Part II. Thessaloniki: Aristotle University of Thessaloniki Press; 1987.
[9] Koutsopoulos K and Kophitsas I. A Procedure for the Estimation of the Environmental Impacts of a Road. GREECE Techn. Chron.-A. 1984; Vol. 4, (1-2): 43-52.
[10] Mader HJ. Ökologische Aspekte des Waldwegebaues. ÖSTERREICH Forstzeitung 1990; 46/47: 1184-1187.
[11] Ntafis S. Forest Ecology. Thessaloniki: Aristotle University of Thessaloniki Press; 1986.
[12] Ntafis S. Applied Silviculture. Thessaloniki: Aristotle University of Thessaloniki Press; 1986.
[13] Sedlak, O. 1993. Walderschließung und Naturschutz. ÖSTERREICH Wien, Österreichische Forstzeitung 1993; 104 (7): 23-25.
[14] Smyris P. The structure of Paranesti’s virgin forest. Scientific List of Department of Forestry and Natural Environment, Volume KH, Thessaloniki: Aristotle University of Thessaloniki 1985; (20): 593-670.
[15] Stergiadis ChG, Kotoulas D, Papastaurou A. Forest and mountainous regions- protection, development and exploitation. Scientific List of Department of Forestry and Natural Environment, Volume K KST-KZ. Thessaloniki: Aristotle University of Thessaloniki 1984; (1): 17-50.
[16] Stergiadis CG, Doukas K., Karagiannis E, Kararizos P. Die Holzrücken in kleinen Distanyen mit der Trommel Multi –KBF, die auf der Kettensäge angepasst wird. Wiss. Jahrbuch der Fakultät für Forstwirtschaft und Natürliche Umwelt, Bd. KST-KZ. Thessaloniki: Aristotle Universität Thessaloniki 1991; p.124-135.
[17] Trzesniowski A. Wozu Walderschließung in Österreich? ÖSTERREICH Wien, Österreichische Forstzeitung 1993; 104 (7): 5-7.
[18] Tsoxos G. Environmental Road Construction. Thessaloniki: Aristotle University of Thessaloniki Press; 1997.
[19] Warner ML. Environmental Impact Analysis: An Examination of three Methologies. Ph. D. Dissertassion. Wisconsin: University of Madison; 1973.
[20] Watts S, Halliwell L. Essential Environmental Science – Methods & Techniques. London: Routledge; 1996.
[21] Zundel R. Rechtliche Aspekte des Waldwegebaus. DEUTSCHLAND München AFZ 1990; Nr. 45 (46-47): 1182-1184.
228
“Sustainable Management and Development of Mountainous and Island Areas”

General forest opening up works by the use of modern technologies: An evaluation of intensity and absorbent capacity
Vasileios C. Drosos Ass. Professor, Department of Forestry and Management of Environment and Natural Resources,
Democritus University of Thrace, Ath. Pantazidou 193 Street, 68200 N. Orestiada, tel.: 25520 41122, fax: 25520 41192, e-mail: [email protected]
Vasileios J. Giannoulas Lecturer, School of Foresty and Natural Environment, Aristotle University of Thessaloniki, Campus
54124 Thessaloniki, TC 226, tel.: 2310 998977, 992744, fax: 2310 998979, e-mail: [email protected]
Aristotelis - Kosmas G. Doukas Professor, School of Foresty and Natural Environment, Aristotle University of Thessaloniki, Campus
54124 Thessaloniki, TC 226, tel.: 2310 998971, 992748, fax: 2310 998979, e-mail: [email protected]
Abstract. The combination between the technology of the digital photogrammetry and the GIS technology was used in order to evaluate the compatibility between the general forest opening up works and the natural environment. In order to evaluate the compatibility, practical criteria of the intensity of the human influence as well as criteria of the environment absorbency to the opening up works were used. The digital maps and the spatial analysis allowed the efficient and reliable evaluation of these criteria. The results proves that the usage of this method provides the ability to evaluate the compatibility of the existing opening up works with the natural environment and the possibility to choose the most compatible for the environment solution.
Keywords. Forest opening up, natural environment, digital photogrammetry, GIS.
1. Introduction
The development of mountainous areas is the main objective of the forest policy implemented today in our country. However, development entails human intervention in the natural environment, leading to its alteration and often its degradation.
One of the most important human interventions in a forest ecosystem is the construction of a network of transport facilities (forest roads, trail, skidding roads etc), which contributes to the transportation of forest
products, tourism development and forest protection ([10]; [1]).
However, apart from the said positive effects, opening up works burdens the environment and damages the landscape. Some times the said damages may be restored but in most cases this is impossible. These effects cannot be evaluated based on economic features in the framework of the known decision-making methods such as cost-benefit analysis and other mathematical methods.
The term “compatibility with the environment” means to define, describe and assess the effects of a construction work on the environment and to take measures for its protection. Thus, the primary concern of a forest engineer should be the compatibility of such opening up works with the environment. For this reason, the assessment criteria for forest technical works are used in order to examine and evaluate the impact of works on the natural environment, as well as to choose the best (compatible) environmental solution among various alternatives before the construction of roads ([2]; [6]).
Rapid development in the field of P/C and GIS software now enables the examination and analysis of the said criteria in an objective and cost-effective manner [4].
The aim of this paper is to investigate the compatibility of construction works with the environment based on the measurable criteria of intensity and absorbency and to take advantage of modern environment-friendly technologies.
229
“Sustainable Management and Development of Mountainous and Island Areas”

2. Materials and Methods
The tools used to achieve the research goals set in this paper were the following:
Digital orthomap of the research area resulting from a photogrammetric processing of two aerial photos in a digital photogrammetric station and the further processing of the orthophoto in GIS software. Then, followed the digitalization of the land uses, the forest road network and finally the safe measurements concerning the accurate estimate of the area for each land use and the length of the existing forest road network [5].
Data from the last management plan for the forest such as harvesting, management form, existing forestry species etc. Criteria were set to determine the intensity of human intervention in the natural environment, due to the current opening up works and forest exploitation works ([3]; [9]; [7]; [11]). At the same time, weight coefficients were set to express the intensity of each criterion based on the opinion of expert scientists. Specifically, the intensity criteria used are the following: 1. Road density [8]. 1.1. Skidding with draught or load animals. Coefficient weight: 3. 1.2. Skidding with mechanical means or combination from animals and mechanical means. Coefficient weight: 3. 2. The use of tractors in skidding. Coefficient weight: 2 3. Percentage of opening up. Coefficient weight: 3. 4. Skidding direction. Coefficient weight: 1. 5. Traffic frequency and vehicle type. 5.1. Exceeding of traffic frequency. Coefficient weight: 2. 5.2. Overloading of transport vehicles. Coefficient weight: 2. 6. Forest roads’ categories. Coefficient weight: 2.7. Position of roads: 7.1. Distance of water flows. Coefficient weight: 3.7.2. Distance of forest boundaries. Coefficient weight: 3. 7.3. Problematic (unstable) soils. Coefficient weight: 3.
The next parameter studied was the capacity of the forest ecosystem to absorb the impact of the works. By absorbency, we mean the extent to which the effect will be absorbed by the ecosystem with time, as well as the number of
the recipients of the effect [6]. The absorbency criteria evaluated and the respective weight coefficients are the following [12]: Criteria Weight Terrain conditions 1. Kind of coverage 3 2. Forestry species 3 3. Management form 3 4. Age 3 5. Tree height 3 6. Productivity 3 7. Slope of ground 2 8. Exposition 2 9. Relief 2 10. Distance from:10.1. Tourist recreation area 1 10.2. National road network 1 10.3. Railway 1 10.4. Archaeological site 1 10.5. Adjacent big city 1 10.6. Adjacent village 1 10.7. European path 1 10.8. Natural or artificial lake or river 1
The final grading of intensity (I) for each criterion is provided by the product of each criterion value multiplied by its weight coefficient to find the barycentric mean. Similarly, the absorbency (A) of the forest ecosystem is calculated by each criterion value multiplied by the respective weight coefficient to find the barycentric mean.
These figures are indices concerning the compatibility degree of the opening up works with the natural environment.
3. Results
The following table 1 presents the percentages of intensity and absorbency criteria for the research area of Pisoderi in prefecture of Florina.
- As far as intensity is concerned: Criteria 1, 3 and 4 can be estimated digitally,
(Fig 1 and 2), criteria 2, 5 and 6 are set based on the management plan or on site, while criterion 7 is assessed either with special software, displaying on the P/C screen what is observed from a different DTM point or on site.
- As far as absorbency is concerned: Criteria 1, 2, 7, 8 and 9 can be estimated
digitally, (Fig 3 and 4), criteria 3, 4, 5 and 6 are set based on the management plan or on site, while criterion 10 is assessed with special software, displaying on the P/C screen what is observed from a different DTM point.
230
“Sustainable Management and Development of Mountainous and Island Areas”

Table 1. Criteria of intensity and absorbency.
INTENSITY Criteria Grad % Weights Sum
1 Road density 1.1. Skidding with draught or load animals 96 3 288 1.2. Skidding with mechanical means or
combination from animals and mechanical means
- It does not exist in the area.
2 Percentage of tractors use in opening up 100 2 200 3 Percentage of opening up 69 3 207 4 Skidding direction 100 1 100 5 Traffic frequency and motor vehicle types 5.1 Exceeding percentage of traffic frequency 100 2 200 5.2 Exceeding percentage due overloading 80 2 160 6 Forest roads’ categories - No machine skidding is accomplished 7 Position of roads 7.1 Distance of water flows 100 3 300 7.2 Distance of forest boundaries 100 3 300 7.3 Problematic (unstable) soils 100 3 300
Total 22 2055 Average value CI=C(I* I)/C I 2055/22=93,40%
ABSORBENCY Terrain conditions
1 Kind of coverage 86,00 3 258 2 Forestry specie 75,00 3 225 3 Management form 85,00 3 255 4 Age 100,00 3 300 5 Tree height 75,00 3 225 6 Productivity 100,00 3 300 7 Slope of ground 31,20 2 62,4 8 Exposition 85,00 2 170 9 Relief 15,00 2 30 10 Distance from 10.1 Tourist recreation area 30 1 30 10.2 National road network 50 1 50 10.3 Railway - It does not exist in the area. 10.4 Archaeological site - It does not exist in the area. 10.5 Adjacent big city - It does not exist in the area. 10.6 Adjacent village 70 1 70 10.7 European path 70 1 70 10.8 Natural or artificial lake or river - - -
Total 28 2045,4 Average value C =C( * )/C 2045,4 / 28 = 73,05%
4. Conclusions - Proposals
The said values are based on objective and measurable figures, the indices of environmental impact whose study ensures the reliability of the method used. Its application is necessary not only for the evaluation of the current opening up works in a forest, but also
before the construction of new ones in order to examine their impact on the environment and to promote the best solution.
This method used to calculate the values of the intensity and absorbency criteria is now easily applied with the use of P/C and GIS technology. The use of this method presupposes the use of the adequate database.
231
“Sustainable Management and Development of Mountainous and Island Areas”

Figure 1. Percentage of opening up.
Figure 2. Skidding direction.
The processing of a large volume of data is performed very quickly compared to traditional methods, and it is free of systemic errors since the user is no longer intervening to calculations. There is also the potential of producing multiple digital maps and diagrams of different form for different road networks, which help reach the best decisions possible.
The implementation of the said method is also examined for forests of different
management form such as degraded, non-productive, protected forests etc.
Figure 3. Exposition map.
Figure 4. Slope map.
232
“Sustainable Management and Development of Mountainous and Island Areas”

5. References
[1] Becker G. Walderschließung auf dem Prüfstand. DEUTSCHLAND AFZ 1995; V 9: 482-483.
[2] Buerger R, Heider O, Kohler V, Steinlin H.. Leitfaden zur Beurteilung von Straßenbauvorhaben unter Gesichtspunkten des Natur- und Landschaftsschutzes. Schriftenreiche des Instituts für Landespflege. Albert-Ludwigs- Universität Freiburg; 1987.
[3] Buwal Hg. Umweltverträglichkeitsprüfung (UVP) bei Meliorationen. Wegleitung und Empfehlungen. Mitteilungen zur Umweltverträglichkeitsprüfung (UVP), Nr.3. Bundesamt für Umwelt, Walt und Landschaft. Bern; 1990.
[4] Doukas K und Akca A.. Untersuchungen über die Anwendung von modernen photogrammetrischen Methoden bei der Forstwegetrassierung und der Waldkatastervermessung. DEUTSCHLAND Hamburg Forstarchiv, 1990; (61): 71-80.
[5] Doukas K. Die Verwendung moderner Informationstechnologie bei der Planung von Waderschliessung und Holzbringung in Griechenland. DEUTSCHLAND AFZ 1995; Heft 12: 664-667.
[6] Doukas A-K. 2004. Forest Constructions and Natural Environment. Thessaloniki: Giaxoudis Publishing; 2004.
[7] Heinimann H. Umweltverträglichkeit forstlicher Erschließungen. Konzept für die Abwicklung, die Analyse und die Bewertung. Schweiz. Z. Forstwegs 1994; 145: 139-157.
[8] Kroth W. Entscheidungsgrundlagen bei Walderschliessunginvestionen. DEUTSCHLAND Fw. Cbl. 1973; Jg. 87, (Heft 4): 237-248.
[9] Mader H-J. Ökologische Aspekte des Waldwegebaues. ÖSTERREICH AFZ 1990; 46/47: 1184-1187.
[10] Sedlak O. 1993. Walderschließung und Naturschutz. ÖSTERREICH Forstzeitung 1993; 104 (7): 23-25.
[11] Trzesniowski A. Wozu Walderschließung in Österreich? ÖSTERREICH Wien. Österreichische Forstzeitung 1993; 104 (7): 5-7.
[12] Zundel, R., 1990. Rechtliche Aspekte des Waldwegebaus. Rechtliche Aspekte des Waldwegebaus. DEUTSCHLAND München AFZ 1990; Nr. 45 (46-47): 1182-1184.
233
“Sustainable Management and Development of Mountainous and Island Areas”

GIS Applications in Management and Mapping of Natural Ecosystems
1 Anthi Gkaraveli, 2 Dimitrios Emmanouloudis and 2 Antonios Papadopoulos
1 Forest Authority of Magnesia Prefecture, Xenofontos 1, 38333, Volos, Greece. Tel. +30(2)4210 39109
2 Technological Educational Institute of Kavala, Branch of Drama, Department of Forestry and Management of Natural Environment, Laboratory of Wood and Wood Products, TK 66100, Drama,
Greece. E-mail [email protected], [email protected]
Abstract. There is much interest, currently, in the expansion and restoration of semi-natural woodland for both nature conservation and sustainable development. The work described here was part of a wider study creating an environmental database for the Snowdonia National Park, in Wales (UK), and developing modelling systems to assist in locating new native woodland. Geographical Information Systems (GIS) were used to manage the spatial referenced datasets and integrate data in a computer-based platform to inform management decisions through simulation modelling. Presented are two GIS-based modelling projects, including: (1) identification of priority areas for forest restoration; and (2) predictive mapping of semi-natural woodland sites.
Keywords. GIS, modeling, mapping, environment, UK.
1. Introduction
In countries such as the United Kingdom with a long history of human settlement and clearance of forests for agriculture, forest habitats survive only as remnants. By 1895 less than 5% of Wales was forested, mostly with native deciduous tree species. By 1997 the area of forest had increased to 14% as a result of extensive plantings of exotic conifers, there being no significant change in the area of broadleaves [5]. Ancient woodlands, the supposed remnants of the original forest cover, comprised 5770 fragmented woods of which the majority were 20 ha or smaller, covering only 2.7% of Wales [13]. Today, the Forestry
Strategy for Wales [4] acknowledges the need for de-fragmentation by expanding the forest area and re-connecting individual woods and forests in forest habitat networks.
The need to restore and enhance rare and threatened habitats has been recognised within the European Union under the EU Habitats and Species Directive [2]. The United Kingdom has responded through the UK Biodiversity Action Plan (BAP) [10], which lists 59 actions to be taken. These include protecting ancient semi-natural woodlands and encouraging a steady expansion of woodland and forest cover. Local BAPs have also been produced to aid implementation of specific elements of the national BAP; that for the Snowdonia National Park [12] identifies the need to expand the area of upland oak and ash woodlands, and encourages the restoration of these habitats where possible.
This study, which was carried out at the University of Wales Bangor (UK) in 2002, in order to help guide native woodland expansion plans in Snowdonia, aimed to achieve the following: (1) to consider GIS modelling as a means of identifying priority areas for native woodland restoration, and (2) to predict and map the distribution of semi-natural woodland resource in the National Park.
2. Materials and Methods
2.1. Study area
The Snowdonia National Park in north Wales (UK), was established in 1951. It is the second largest of the ten National Parks of England and Wales, covering 2142 km2 mainly of deep valleys, rugged mountains and a 37 km
234
“Sustainable Management and Development of Mountainous and Island Areas”

coastline (Figure 1). About 15% of the land is wooded and consists of broadleaves, conifers, mixed forest and scrub. In this study, ‘woodlands’ are defined as areas with at least 20% canopy cover of mature trees and distinct boundaries. ‘Scrub’ is defined as areas of shrubs with diffuse boundaries and < 20% cover of mature timber species.
Broadleaved woods in Snowdonia have small mean patch sizes (< 4 ha) [7], are isolated and unmanaged, but they have disproportionate cultural, landscape and wildlife conservation values because of their long-term presence and naturalness [1]. Coniferous forest plantations in the study area are wholly comprised of non-native species, chiefly Sitka spruce (Picea sitchensis (Bong.) Carr.). These have often been established on previously unwooded land, represent nearly 70% of the wooded area and dominate the upland tree cover in the National Park, as in many other parts of upland Britain.
Figure 1. Location of the study area, Snowdonia National Park, Wales (UK).
2.2. GIS Modelling approaches
2.2.1. Forest Restoration
The aim, in this study, was to develop a generic methodology of prioritising areas for woodland expansion in Snowdonia that could be applied elsewhere using objective ecological criteria. These would measure
desirability for new woodland creation at any given location. This was considered more straightforward than the alternative approach of trying to identify subjectively areas apparently particularly appropriate for woodland establishment. An objective set of criteria might also have the practical advantage that it could be seen by landowners as being less prescriptive and individually intrusive than a subjective assessment.
Constraints on the areas available for woodland creation were applied to this study based on experience gained in earlier work [9]. The land cover classes defined in a land cover map of Snowdonia made in the 1980s [14] were divided into two groups according to whether they were considered potentially suitable or unsuitable for conversion to woodland. This division was based primarily on nature conservation objectives, but landscape, archaeological and agri-economic constraints could also be of considerable significance in determining whether land would actually become available for woodland expansion.
The criteria developed for this native woodland expansion modelling (Table 1) give higher priority to ancient semi-natural woodlands, especially those within Sites of Special Scientific Interest (SSSIs), and to woodland creation close to existing woodland, than to expansion on other sites. For a more detailed description refer to [6].
The criteria were used to produce the Woodland creation model using the IDRISI v.32 rel.2.0 GIS [3]. Multi-criteria evaluation in IDRISI (MCE module), a method for assessing and aggregating many criteria, was applied. We used Weighted Linear Combination (WLC) within the MCE module because (a) it allowed us to retain all of the variability of our continuous data, (b) it gave us the ability to allow criteria to trade off with each other. Continuous criteria were standardised to a continuous scale of suitability from 0 (the least suitable) to 255 (the most suitable). Each standardised criterion was then multiplied by its corresponding weight (Table 1) and was added to each other. The different weights given to each of the criteria reflects their relative importance [3].
The last step was to identify and exclude all those areas that were not considered suitable for woodland creation. The constraints applied here were built-up areas, existing woodlands,
25
kilometres
500
N
Snowdonia National Park
U
235
“Sustainable Management and Development of Mountainous and Island Areas”

SSSIs and other important semi-natural habitats including 200m buffer zones around them. A flow-chart summarising the whole modelling procedure is given in Figure 2.
The output from all of this analysis was a suitability map in byte binary form with values ranging from 0-255. This raster image was made user-friendly by reclassifying the differing groupings into suitability classes, namely high, moderate, low and unsuitable.
Table 1. Criteria and their weightings of importance for new woodland creation in Snowdonia
Criteria Weighting of importance (0-10 scale)
Woodlandtypea /Conservation status
ASNW BL SSSI 10
ASNW BL 8 ASNW Scrub SSSI 6 ASNW Scrub 5 ASNW Mix SSSI 4 ASNW Mix 3 ASNW Conifer
(SSSI or not) 2
ASNW Other (SSSI or not)
2
BL SSSI 6 BL 4 Scrub SSSI 4 Scrub 3 Mix SSSI 3 Mix 2 Conifer (SSSI or
not)1
Other (SSSI or not) 0.5 Distance Distance from
ASNW sites recorded as woodlands
5
Distance from BL 4 Distance from Scrub 3 Distance from Mix 2 Distance from
Conifer 1
a ASNW, ancient semi-natural woodland; BL, bloadleaves; SSSI, sites of special scientific interest; Mix, mixed woodland; Other, clear felled/new plantings and all other land cover classes mapped as ancient semi-natural woodland or plantations on ancient woodland sites in the 1980s land cover map.
2.2.2. Forest predictive mapping
There is now an increasing interest and commitment to safeguard and expand the native woodland resource in Britain for
landscape and natural heritage value and its restoration is a conservation priority. Unfortunately very little is known about the potential distribution and extent of different woodland types to guide native woodland expansion at regional and local levels. Here we developed a site suitability model that predicts and maps the distribution of existing National Vegetation Classification (NVC) woodland sub-communities and communities for current environmental conditions using the IDRISI GIS. The NVC is currently the main classification system used by the statutory and voluntary conservation organisations to describe British woodland. The Snowdonia National Park in Wales, UK, was used as a pilot area for developing and testing the methodology.
The approach taken was to define the environmental spaces occupied by the fragments of NVC woodland types currently present in the National Park (Figure 3). The environmental spaces were then used as a template to produce maps of similar, potentially suitable sites for the occurrence of each NVC type.
Temperature and precipitation data for weather stations in north Wales were compiled covering the period 1961-1990. Geographical and topographic variables such as eastings, northings, altitude, aspect, slope and distance to the sea were quantified for each station, and multiple linear regression models were built using stepwise regression analysis in MINITAB for windows software [15]. The models were used to predict the spatial distribution of temperature and precipitation in north Wales and climatic maps were generated for the National Park using the IDRISI v.32 rel.2.0 [3] GIS.
Records for each NVC site were held in CCW in a computer database with fields for areas of NVC community and sub-community, along with information on site location, name, surveyor, reliability, date of survey and protected status. These records were provided and linked to the GIS IDRISI, allowing spatial and geographic analyses to be carried out. Only 29 of the survey sites had full NVC maps of 1:10 000 and 1:5 000 scale. From these maps the polygons of each NVC sub-community within each survey site were digitised on a Calcomp 9 500 tablet and processed using the CartaLinx v.1.2 software [16]. The resulting boundaries were drawn
236
“Sustainable Management and Development of Mountainous and Island Areas”

Figure 2. Flow-chart of modelling approach.
Figure 3. Flow-chart of forest predictive modelling.
Land cover data
NVC woodland data
Environmental data
Datasets
GIS Macro Language
Woodland community x Environment relationship
Site Suitability Model
Validation
Qualitative comparisons Quantitative comparisons
Land cover data
Ancient woodland sites
Conservation status
Datasets
GIS
Constraints
Woodland Creation Model
Ecological Criteria
Multi-criteria evaluation
•Nature conservation
•Specific policy aims
•Existing woodland
•Sites that cannot be planted
237
“Sustainable Management and Development of Mountainous and Island Areas”

together to form a map showing the distribution of NVC woodland sub-communities within the survey sites in Snowdonia. This map was exported to the GIS and was further analysed.
For those survey sites without mapped information, the grid reference of each site was used to create a file in IDRISI, allowing a distribution map of the survey sites to be produced. This map along with information on NVC woodland sub-communities present in each site was used to qualitatively assess the results of the model developed.
A site suitability model which links the NVC woodland sub-communities currently present in Snowdonia with current environmental conditions was produced using the IDRISI Macro Language. To achieve this, the map showing the distribution of NVC woodland sub-communities was reclassified so as to produce separate maps for each NVC sub-community. Each NVC sub-community map was, then, overlayed with each of the environmental variables. The cross-tabulation results were used to create matrices for each NVC woodland sub-community indicating the woodland sub-community x environment relationship. A detailed description of the model can be found in [17].
The matrices for each NVC sub-community were used to develop a series of decision rules linking site characteristics and climate to the existing NVC woodland resource in Snowdonia. This required reclassifying each environmental factor according to the requirements of each NVC sub-community as indicated in the matrices. The multi-criteria evaluation method in the GIS was then applied to aggregate all the reclassified environmental factors and map the suitable sites for each NVC woodland sub-community in Snowdonia. Finally, all maps showing the predicted distribution of NVC sub-communities were overlayed in turn to form a single image. This made it possible to detect any overlap between the sub-communities.
To evaluate the performance of the model and the quality of the simulated NVC woodland maps, qualitative and quantitative comparisons were made. The qualitative assessment involved the comparison of predicted NVC woodland types with those observed at survey sites in the National Park. To validate the predicted NVC distributions quantitatively and more objectively, the maps
showing the simulated distributions of each NVC woodland sub-community were compared with the map of their present distribution in the surveyed sites. This revealed how well the model predicted the present distributions of NVC sub-communities.
3. Results
Of the total area of the National Park (214162ha), about 2% fell within the category regarded as being of low suitability for woodland creation, 20% into the moderate suitability class and 5% into the high suitability class (Table 2). Improved pasture and rough pasture were the dominant land cover types in all suitability classes. All suitable areas for woodland creation lay between sea level and 650 m elevation.
Table 2. Area of woodland creation suitability classes in Snowdonia
Woodland creation suitability class Area (ha) Proportion (%)
Unsuitable land 155 654.12 72.68 Low 3 913.98 1.83 Moderate 43 347.28 20.24 High 11 246.62 5.25 Total 214 162.00 100.00
The analysis of NVC woodland sub-communities with the environmental data sets indicated that W11a oak sub-community has the greatest potential (41% of the study area) (Figure 4). W11a (Quercus petraea-Betula pubescens-Oxalis acetosella woodland, Dryopteris dilatata sub-community) the least heavily grazed W11 sub-community, typically forming closed-canopy high forests where sessile oak is abundant and often co-dominant with downy birch [11] is one of the commonest and most typical woodland communities in Wales.
Overlaying the predicted distributions of oak, ash, beech and wet woodland types revealed where there was some overlap between the preferred habitats for NVC woodland types. An example is given for ash wood types in Table 3. The analysis of ashwood types indicated that 33% of the land in Snowdonia is likely to sustain W9a (Fraxinus excelsior-Sorbus aucuparia-Mercurialis perennis woodland, typical sub-community) as an individual sub-community
238
“Sustainable Management and Development of Mountainous and Island Areas”

whereas all sites suitable for W9b sub-community (Fraxinus excelsior-Sorbus aucuparia-Mercurialis perennis woodland, Crepis paludosa sub-community) are also likely to sustain W9a. Only 0.4% of Snowdonia has the potential of W8e sub-community (Fraxinus excelsior-Acer campestre-Mercurialis perennis woodland, Geranium robertianum sub-community) and 0.3% is predicted equally suitable for W9a.
Figure 4. Predicted suitable sites for W11a sub-community.
Table 3. Area analysis of suitable sites for ash woodland types (W8 and W9).
NVC type Suitable area (ha) Percentage (%)
W9a 70 487.90 32.91 W9a/W9b 10 115.25 4.72 W8e 772.25 0.36 W9a/W8e 728.84 0.34 Total 82 104.24 38.33 Total area of Snowdonia 214 162.00 100.00
4. Discussion and Conclusions
This study generated GIS-based models to address the key question in woodland BAP implementation of prioritising sites for native woodland expansion and plantations on ancient woodland sites for conversion back to native woodland, including: (a) identification of priority areas for forest restoration; and (2)
predictive mapping of semi-natural woodland resource sites. As different as the applications are, each follows a similar process of problem conceptualization, implementation of a practical GIS-based model, and evaluation of results.
The models developed in this study may be used to aid broad and quantitative decision-making for new native woodlands in the National Park and elsewhere. GIS technology proved to be a powerful tool for decision making. Furthermore, the results of this work indicated that GIS may contribute significantly in forest management, particularly in issues such as conservation, restoration and biodiversity priorities.
5. References [1] CCW/FC Wales, 1999. A living environment for Wales. Published jointly by the Countryside Council for Wales and the Forestry Commission, Wales. [2] Council of the European Communities 1992. The Habitat and Species Directive. Council of the European Communities, Brussels. [3] Eastman, J.R., 2001. IDRISI for Windows, version 32, release 2.0. Clark University, Worcester, Mass, USA. [4] Forestry Commission, 2001. Wales’ Woodland Strategy. Forestry Commission, Aberystwyth. [5] Forestry Commission, 2002. National Inventory of Woodland and Trees: Wales. Forestry Commission, Edinburgh. [6] Gkaraveli, A., Good, J.E.G and Williams, J.H., 2004. Determining priority areas for native woodland expansion and restoration in Snowdonia National Park, Wales. Biological Conservation 115, 395-402. [7] Gkaraveli, A., Good, J.E.G. and Williams, J.H., 2002. Recent changes in woodlands of the Snowdonia National Park, Wales: a spatial analysis. Quarterly Journal of Forestry 96, 117-124. [8] Gkaraveli, A., Williams, J.H. and
Good, J.E.G., 2001. Fragmented native woodlands in Snowdonia (UK): assessment and amelioration. Forestry 74, 89-103.
[9] Good, J.E.G., Norris, D.A. and Stevens, P.A., 2000. Woodland habitat network for Wales: Ystwyth Valley. Countryside Council for Wales Policy
239
“Sustainable Management and Development of Mountainous and Island Areas”

Research Report, no. 99/5. Centre for Ecology & Hydrology, Bangor.
[10] HMSO, 1994. Biodiversity: the UK action plan. HMSO, London.
[11] Rodwell, J. 1991. British Plant Communities. I. Woodlands and scrub. Cambridge University Press, Cambridge.
[12] SNPA, 1999. Biodiversity in Snowdonia. Snowdonia National Park Authority, Penrhyndeudraeth, Gwynedd.
[13] Spencer, J.W. and Kirby, K.J., 1992. An ancient woodland inventory for England and Wales. Biological Conservation 62, 77-93.
[14] Taylor, J., 1991. Landscape change in the National Parks of England and Wales. Report Vol. XII-Snowdonia. Silsoe College, Bedford.
[15] MINITAB (2000). MINITAB statistical software, release 13.1 for windows. Minitab Inc, Pennsylvania.
[16] Hagan, J.E. and Eastman, J.R. (1999). Cartalinx: the spatial data builder, version 1.2. Clark University, Worcester, Mass.
[17] Gkaraveli, A. (2002). Forest conservation, expansion, restoration and management in a National Park; modelling ecology, suitability, biodiversity priorities, temporal and climate change using GIS and spatial data. Ph.D Thesis, School of Agricultural and Forest Sciences, University of Wales Bangor, pp 285.
240
“Sustainable Management and Development of Mountainous and Island Areas”

Application of Modern Automated Machines in Forest Opening-Up Works
Evangelos Karagiannis, assoc. professor Ploutarchos Kararizos, assist. professor
Athanasios Karagiannis, Forester, M.Sc. student
Aristotle University of Thessaloniki School of Forestry and Natural Environment
Laboratory of Mechanical Sciences and Surveying Tel.: 2310 998976, -8 Fax: 2310 998979
E-Mail: [email protected]. & [email protected] 24 Thessaloniki, Greece
Abstract. The planning of machines constitutes an integral part of the general planning of forest opening-up. The multi-functionality and the application of modern technology in the machines represents a basic objective of each forest enterprise aiming at the increase of working time, the reduction of non-productive time and the reduction of the operating cost of machines.
In new technology, earthmoving machines are necessary so that the potential of monitoring the discipline requirements for electronic organization is ensured. These machines are extremely useful and provide a variety of applications, especially in works that require precision. The machine which was studied in this paper is the grading blade, opening and maintenance of draining ditches of forest roads. The grading blade is equipped with a laser control system and is hauled by a tractor. The results that have arisen by the study of all components are very positive since great accuracy and greater speed in work was achieved, leading to higher productivity and low operating costs.
Keywords: automated guidance, laser transmitter, receiver, forest opening-up, applications of grading blade.
1. Introduction
The progress of technology during the recent years has resulted in the use of advanced earthmoving machines driven by laser in the opening-up forest works [8]. The need of using these machines was not only a result of the continuously increasing volume of works, the demand of reduction of the performance time
and the improvement of the quality of work but also of the high efficiency of the machines that resulted in lower production costs [3].
The systems of automatic control can be easily adjusted on the modern earthmoving machines and provide the potential of their application especially in the works that require high precision [12]. These systems have been put in the market during the last decade. The research programs related to this subject, which have been carried out in Europe, USA and Japan, are quite enough. Torii Toru [11] describes the research programs in the field of laser control machines that have been carried out and as an example he mentions that in 1998, 24 related programs were presented in the annual meeting of agricultural mechanics.
Jahns [4] is giving a synoptic review of the laser control machines and among other, he points out that forestry and agriculture are highly benefited from the developments and advances that have been made in the sector of high technology. The writer himself [5], presented a report on the automated control of machines. Blackmore et al., [1], report the specifications for control machines.
The control machines can find application in the forest – technical works such as forest roads preservation. Particularly, one of the preservation works that is considered as significant for the functionality of the forest roads and is constantly repeated is the flattening of the roadway forest roads because of erosion ([6] and [7]). For these works, a blade of grading and maintenance of drain ditches can be used, a mechanism which was constructed in order to fit and hauled by tractors. This mechanism is equipped with an automatic control system so that to provide accurate control of the machine.
241
“Sustainable Management and Development of Mountainous and Island Areas”

This research studies the blade of grading and maintenance of drain ditches. The blade is equipped with a laser control system in order to draw useful conclusions about the increase of productivity and the reduction of the working cost during the implementation of forest roads maintenance works.
2. Materials and method
As a research area, a forest road which connects the village Varvares with the rural area “alonia” in Veria was selected. The research was carried out in June 2003 and in cooperation with
the firm Laser Electronics which makes grading and excavation systems. Three (3) experimental sites (A, B, C) were established where the construction of a forest road requiring grading and pavement material was in progress.
For the spreading and grading of the material works a grading blade which is adjusted on a metallic base and is controlled by a laser system was used. The metallic frame – base along with the blade is moving via rubber wheels (Fig. 1) and is hauled by an ordinary tractor. The entire transmitter/receiver laser system consists of:
Figure 1. Grading blade
1. Rotating laser transmitter along with a tripod (Fig.2)
Figure 2. Rotating laser L1-ASM MAGNUM and tripod 210 442-002 with their technical characteristics
2. Receiver laser, control panel and electric mast (Fig. 3)
TECHNICAL CHARACTERISTICS Minimum height of operation….±1, 57 (m) Maximum height of operation .±3,98 (m) Height of folded tripod…….1,83 (m) Weight…….±13 (Kg) Tripod head……level ø 110 (mm) Telescopic part…….2-part Distance of telescopic part…595/600 (mm)
TECHNICAL CHARACTERISTICS Field range radius/diameter…400/800 (m) Precision …± 10 arc seconds (1,6mm in 30m) Maximum tilt ………….…±25%, 1 level Field range ………………………360o
Maximum angle for auto-leveling………±4o
Rotation speed ………………600 (r.p.m.) Call indication………Reader, .01% steps Height/Weight ……………24 (cm) / 2,5 (kg)
242
“Sustainable Management and Development of Mountainous and Island Areas”

Figure 3. Receiver, control panel and electric mast
The grading method, which is equipped with a laser control system, is easy and efficient and is carried out this way:
An off – board tripod – mounted laser transmitter emits a thin beam of light that rotates 360 at a fixed distance above the machine’s cutting edge, creating a grade reference over the work area. Grade information is transferred from a mast in the ground to the machine via the laser beam. A digital laser receiver, mounted on a telescopic mast above the machine’s cutting edge, detects the laser beam’s elevation and sends the information to a control box/operator interface/in – cab display.
The number of laser receivers used determines grade control. A single receiver provides single dimensional control – blade height; dual receivers provide two-dimensional control – height and tilt. The operator interface/in-cab display shows the blade's position relative to grade and indicates cut or fill requirements of the work area.
Previously, the three experimental plots (A, B, C) have been marked with stakes along the road with dimensions 8 m wide and 500 m long. The number of passes (going - return) and the required time t of the grader, were measured separately in all experimental plots.
In all experimental plots, the passes of the grader needed to be measured four times because the blade, 2,20 m length, does not cover the
entire width of the road (8 m). By the repeated passes (going - return) of the grader in the road surfacing progress, in plots A, B and C, short-strips were created from the difference of the blade's length and the road's width. These short – strips were surfaced with additional work of the machine which was not calculated in the total surfacing time.
The hourly production capacity of the grader is calculated by the formula ( [2] and [10] ):
hoursv
zTnIt
i
ii.
where: t= required time in hours TI = distance in km vi = speed in km/h ne = working factor (with delays usually 0,60) zi = number of passes and hourly production capacity Q is:
Q = Ti . b/t (m2/h) where:
b = width of work in m
3. Results - Discussion By the elaboration of all data resulting from
the measurements in the experimental plots (A, B, C), that is distances of grader works, number
TECHNICAL CHARACTERISTICS Field recognition radius………….……………...360o
Precision …………………………………..± 3 (mm) Maximum action field ……………… 450 (m) radius Operation voltage ……………………… 12 (V) DC Dimensions ………………. 265 (Y) x 110 (D) (mm)Weight ………………………………………2,8 (kg)
TECHNICAL CHARACTERISTICSOperation voltage ……………………… 12 (V) DC Precision display of receiver height (with electric mast) ….4 (mm) Dimensions … 250 (L) x 140 (W) x 88 (Y) (mm)Weight ………………………………………2,5 (kg) TECHNICAL CHARACTERISTICS Maximum range …………………………..600 (mm) Operation voltage …………………………... 12 (V) Height …………………………………....±130 (cm) Weight ……………………………………. ±21 (Kg)
243
“Sustainable Management and Development of Mountainous and Island Areas”

of passes, width of road surface as well as thickness of road layer, the required time t was calculated in each experiment depending on the traveling distance from the machine. The results are shown in tables 1, 2 and 3.
By the analysis of all results of tables 1, 2, and 3, the hourly productive capacity of grader Q (m2) in the experimental plots , , and C was calculated and this is shown in table 4.
By the analysis of results it comes out that the required time t of the grading blade as well as its hourly productive capacity are influenced by the number of passes because the experimental plots
have the same dimensions (500m long, 8m wide). So, we notice the following:
In the experimental plot A we had the bigger number of passes (110) along with the bigger required time t (19,48 h), but also the smaller hourly productive capacity (203 m2/h); in the experimental plot B we had the smaller number of passes (94) along with the smaller required time t (18,26 h) but also the bigger productive capacity (219 m2/h), whereas in the experimental plot C we had average values o passes (100), required time t (18,59 h) and hourly productive capacity (211 m2/h). The increasing number of passes
Table 1 Calculation of required time t of machine in the experimental plot A, in connection with the length of work
s.n. Length of work (m)
Volume of material (m3)
Working surface (m2)
Number of passes (zi)
Required
time t (h)
1
2
3
4
5
6
7
8
9
10
50
70
60
40
40
60
50
60
40
30
60
84
72
48
48
72
60
72
48
36
400
560
480
320
320
480
400
480
320
240
12
11
10
11
12
10
11
10
11
12
2,35
2,45
2,30
1,45
1,40
2,30
2,33
2,32
1,48
1,28
244
“Sustainable Management and Development of Mountainous and Island Areas”

Table 2. Calculation of required time t of machine in the experimental plot �, in connection with the length of work
s.n. Length of work (m)
Volume of material (m3)
Working surface (m2)
Number of passes (zi)
Required
time t (h)
1
2
3
4
5
6
7
8
9
10
70
40
50
30
40
60
40
60
50
60
84
48
60
36
48
72
48
72
60
72
560
320
400
240
320
480
320
480
400
480
10
8
9
7
9
11
9
10
9
11
2,25
1,35
2,10
1,39
1,38
2,10
1,25
2,15
2,12
2,17
Table 3 Calculation of required time t of machine in the experimental plot C, in connection with the length of work
s.n. Length of work (m)
Volume of material (m3)
Working surface (m2)
Number of passes (zi)
Required
time t (h)
1
2
3
4
5
6
7
8
9
10
30
50
40
70
40
60
40
60
50
60
36
60
48
84
48
72
48
72
60
72
240
400
320
560
320
480
320
480
400
480
9
11
10
12
10
10
8
10
9
11
1,42
2,18
1,45
2,37
1,42
2,14
1,39
2,24
2,20
2,18
Table 4. Hourly productive capacity of machine (Q), in the experimental plots �, �, C
Experimental plots
Length of work
(m)
Number of passes
(zi)
Required
time t
(h)
Hourly productive capacity
Q (m2/h)
500
500
500
110
93
100
19,48
18,26
18,59
203
219
211
was directly depended on the width of road pavement (8 m) while the grader blade amounts to 2,20 m. Double and triple passes were
required to cover the entire width of road surfacing. The performance of grading blade was
245
“Sustainable Management and Development of Mountainous and Island Areas”

considered satisfactory (average 211 m2/h) in the specific experimental plots.
The grading method, which is equipped with a laser control system, is easy and efficient. It is estimated that it improves the productivity and the accuracy of grading per 50%, than the conventional methods.
4. Conclusions – Proposals
From what has been mentioned above, about the equipped with a laser control system grading blade, the following conclusions come to light: 1. Working cost a. Preparing cost (Engineering’s time)
About 90% of the time for the survey and the staking of the working area are saved as the working area is covered 100% by the reference laser.
b. Machine’s function cost – productivity Fuel, machine’s working hours (less usage) and the operator’s labor time are saved, as the grading is reached in fewer passes than with hand coordination and no down time for grade checks is demanded. As a result, we
have an average 30% more productivity than in the traditional ways of grading.
c. Workers cost Hand work is reduced or eliminated, while no grade checker is required so in this way we have more accuracy as there are no communication errors between the operator and the grade checker.
d. Material cost We achieve accurate calculation of the amount of the materials that is needed so the material transportations for the performance of the work are in number those we need (material shortage or overages is eliminated).
2. Working conditions a. The levels of productivity can be sustained
constant the whole day, with less fatigue for the operator who works with safety in the cabin of the tractor.
b. More jobs can be scheduled; more flexibility in their scheduling (even at night) can be achieved.
c. Better quality of work can be achieved because of the neglecting of the objective skillfulness of various operators.
LITERATURE
[1] Blackmore, S., Have, H. and Fountas, S. (2001) A specification of behavioral requirements for an autonomous tractor. ASAE Conference on Automation Technology for off-Road Equipment.Chicago, USA, July 2002, p.: 3-42.
[2] Efraimidis, Ch. (1998) Structural machines. Teaching Book. Athens.
[3] Eskioglou, P. (2002) Forest Road Construction. Part B. Teaching Book. Aristotle Univ. of Thessaloniki.
[4] Jahns, G. (2000) Navigating of agricultural field machinery. Computers and Electronics in Agriculture, Volume 25, pp.:1-2.
[5] Jahns, G. (1983) Automatic guidance in agriculture: a review. Paper No. NCR 83-404. ASAE meeting. Weyburn, Saskatchewan, Canada, October 1983.
[6] Karagiannis, E. (2005). Forest Opening-up and Wood skidding. Teaching Book. Aristotle University of Thessaloniki.
[7] Karagiannis, K. (2003). Forest Road Construction. Part A. Teaching Book. Aristotle University of Thessaloniki.
[8] Kararizos, Pl. (1998) Applications of Machines in Hydronomic and Forest-Technical Works. Teaching Notes. Thessaloniki.
[9] Laser Electronics (2003). Firm of manufacturing laser grading blade systems.
[10] Nichols, H.L. (1962). oving the Earth. North Castle Books. Greenwich Connecticut, Chapt. 19, p.:29.
[11] Torii, T. (2000). Research in agricultural autonomous vehicles in Japan. Computers and Electronics in Agriculture. Volume 25, Issue 1-2, p.: 133-153.
[12] Tsatsarelis, K. 2003. Mechanical harvesting of agricultural products. Teaching Book. Aristotle University of Thessaloniki.
246
“Sustainable Management and Development of Mountainous and Island Areas”

Exploring the Environmental Knowledge and Attitudes of the Students in the School of Forestry and Natural Environment at the Aristotle University
of Thessaloniki
Karameris Athanasios, Ragkou Polyxeni, Kastani Louiza Studentstudy of Forest Recreation, Environmental Education and Sociology
School of Forestry and Natural Environment, Aristotle University of Thessaloniki [email protected], [email protected]
Abstract. The present study examines the level of environmental knowledge and the environmental attitudes and values of 1st year undergraduate forestry students and compares that level to that of 5th year undgraduate forestry students of the Aristotle University of Thessaloniki, in order to find out whether their university forestry studies have contributed to a better knowledge about environmental issues and have affected students’ environmental attitudes and values. While the 5th year students were found to possess higher levels of specific environmental knowledge (academic knowledge) than the younger students, the data seem to demonstrate that there is no difference in the environmental knowledge and awareness levels of 5th year students and that of the younger students regarding general environmental issues and problems. The findings of this investigation could be taken into consideration while designing and formulating a new program of forestry studies.
Keywords. Environmental studies,Environmental knowledge, Environmental attitudes, Environmental Education, Environmental awareness.
1. Introduction
It is becoming increasingly accepted in society that attitudes, values and behavior towards the environment need to change if we are to survive as a species. It is also generally believed that education has the possibility of making real change in people’s values, so that we move toward a society with strong environmental values and a more sustainable lifestyle (McMillan, 2003). Fien (1997) identifies that environmental studies can play a key role in creating awareness, and changing people’s values, skills and therefor they are crucial for the building of an environmentally proactive society.
It is through knowledge and awareness that positive values and attitudes emerge (Tan Geok-Chin Ivy et al., 1998). Therefore, it is important to make sure that high quality environmental studies are a part of our educational system. The environmental challenges demand an holistic, systemic and global way of thinking about environment that inextricably links environmental issues to socio-economic parameters (Ragou 2000) and new learning capacities, knwoledge, values and skills about environment, appropriate to the circumstances we now face : reconciling the demand for social justice with this of ecological integration for a sustainable development (Khan, 1995). Furthermore, societal and environmental changes create increasing pressures and developmental challenges for teachers in higher education who teaches environmental issues and may demand restructuring in higher education study programme, linked to global, social ecological and economic trends (Reddy & Schreuder, 2004). The purpose of this study is to examine the level of environmental knowledge and the environmental attitudes and values of undergraduate forestry students (1st year) and to compare that level to that of 5th year undegraduate forestry students of the Aristotle University of Thessaloniki, in order to find out whether their university forestry studies have contributed to a better knowledge about environmental issues and have affected students’ environmental attitudes and values. The need for collecting information on a nation-wide scale concerning University students’knowledge and attitudes towards environmental issues has been recognised in other countries (Richmond, 1976; Towler & Swan, 1972) as it would be useful for better planning, organisation and implementation of environmental programmes and projects in higher education.
247
“Sustainable Management and Development of Mountainous and Island Areas”

How well equipped are the students of Forestry Scool for a deep and global understanding of environmental issues? How well equipped are they as citizens in engaging themselves in environmental protection? Most research on environmental knowledge and attitudes has been conducted on elementary and secondary students(Ramsey et al., 1976; Kwan et al.,1998; Bonnett & Williams, 1998; Tan Geok-Chin Ivy etal.1998; Grodzinska and Jurczak, 2001,Grifford et al., 1983; Bord & O’Connor, 1997; Worsley & Skrzypiec, 1998; Eagles & Demare, 1999; Kuhlemeier et al., 1999; Loughland et al.,2003; Littledyke 2004; Ernst 2004; Tuncer 2005).There have been fewer studies on university and college-level students (McMillan, 2002; Kaplowitz et al., 2005) and few researchers have focused on universities’ role as means for increasing students’ environmental knowledge and concern (Orr, 1995; Wilke, 1995). Previous literature in this area tends to have focused on comparisons of knowledge levels of students with different majors (Benton, 1994; Synodinos, 1990; Lundholm, 2004;). Astudy of university students in Finland revealed biology, forestry and history students to be among those most knowledgeable about the environment while students in health care and pre-school teacher training were among those scoring lowest (Tikka et al., 2000). For the purpose of the present study a survey questionnaire of 36 items was designed and used as a means of collecting information about students’ knowledge attitudes and values about environmental issues.
2. Methodology
The first and fifth year students of the Forestry and Natural Environment School of the Aristotle University of Thessaloniki participated in this study. The collection of data took place with the help of surveys that were given to students from January to May 2006 The survey included 36 questions which were divided into five sections on the basis of research objectives. Section A : Questions Related to Students' Sociodemographic background. Section B : Questions Regarding Preexisting Awareness-Sensitivity Section C : Questions Regarding Environmental Knowledge. Section D : Questions Examining the Systemic View of Students on Environmental Issues.
Section E : Questions Registering the attitudes and values of the Students on Environmental Issues. One hundred one questionnaires were collected from 110 first year students, and 60 questionnaires were collected from 110 fifth year students. First year students showed a greater desire to participate in the study. Data treatment took place using the statistical package SPSS 12 in connection with the Excel program of Windows. The approximative significance of our research was .05. Eventhough the questionnaire included 36 questions, we include here only the most representative answers from each category.
2.1Section A- Students' Sociodemographic background
The main objective of the questions of this category was to find some identifying characteristics of the participating students such as gender, parents’ education, geographic origin, and orientation of studies in high school, in order to research the connection with certain answers and to further evaluate the results.
1st year Gender Frequency %
Frequency Female 52 51.5 Male 49 48.5 Total 101 100
5th year Gender Frequency %
Frequency Female 30 50 Male 30 50 Total 60 100
The ratio of male to female per year appear analytically in the tables. Sixty-two per cent and 48% of the parents (father, mother correspondingly) of the 1st year students have higher education while the corresponding percentages of the parents of the 5th year students are 51.7% and 40.1% (father, mother). Fifty per cent of the 1st year students come from inland provinces, 41.4% from coastal provinces, and 1.7% from island provinces.
2.2 Section B- Preexisting Awareness-Sensitivity
The goal of this category of questions is to study the degree of environmental awareness of the students before entering the School of Forestry.
248
“Sustainable Management and Development of Mountainous and Island Areas”

The main reason why 1st year students selected this particular School seems to be interest in the area of study (40.6%), while the reason for 5th year students seems to be their academic performance. Only 18.3% of 5th year students chose the School because of interest in the area of study. In other words, 1st year students choose their area of study consciously. Perhaps this is related to their sensitization due to their participation in environmental education programs during their school years (twice as many 1st year students participated in such programs as 5th year students).Finally, with regard to participation in ecological organizations, only 5% of 1st year students and 1.7% of 5th year students participate in these, while the main reason for not participating for both groups is “I just didn’t happen to” however, a significant number of 5th year students, 31.7%, do not trust the effectiveness of ecological organizations.
Yes No0
10
20
30
40
50
60
70
%
64,36%
35,64%
1st year students
Did you take part in environmental education programs during your school years?
Yes No0
10
20
30
40
50
60
70
%
33,33%
66,67%
5th year students
Did you take part in environmental education programs during your school years?
2.3 Section C- Environmental Knowledge
The goal of the survey is to research the level of knowledge of the Forestry students at the beginning of their university studies (1st year) and five ears later, just before their graduation. Questions specific to the science of forestry were selected for the survey, as well as questions on more general environmental subject areas.
The topsoil cosistent of organic and
inorganic material
The subsoil The subsoil cosistent of organic and
inorganic material
The bedrock The total plants in
forest
I don't know
0
10
20
30
40
50
60
70
%22,8
2 5 1
68,3
1st year of students
Q4. What is humus?
The topsoil consistent of organic and
inorganic material
The subsoil The subsoil consistent of organic and
inorganic material
I don't know
0
20
40
60
80
100
%
85
1,7 8,3 5
5th year of students
Q5. What is humus?
* For some questions the students can choose more than one correct answer. For these questions, all possible answers are given (correct and incorrect) and they are evaluated using a qualitative scale (excellent knowledge, good knowledge, moderate knowledge, insufficient knowledge).
Q5. The humus (Mark one or more right answers):
Can cause fire Protects soil from erosion and compression Takes part in food chain Doesn’t allow the forest plants to grow
normally I don’t know
249
“Sustainable Management and Development of Mountainous and Island Areas”

InsufficientKnowledge
AverageKnowledge
Good knowledge Excellent knowledge
0
20
40
60
80
%
1,98%
20,79%
0,99%
76,24%
1st year students
Q5. Answers about the ecological role of humus
Insufficient Knowledge Good knowledge Excellent knowledge
0
20
40
60
80
%
76,67%
13,33%10,0%
5th year students
Q5. Answers about the ecological role of humus
During the first year only 22.8% knows the correct definition of humus, while during the fifth year, the percent rises substantially and reaches about 85%. In regard to the ecological role of humus, in the first year, only 20.8% has good knowledge, responding mainly that it protects the soil from depletion and compression, while the corresponding percent for the fifth year becomes 76.7%. It is worth noting that even at the fifth year, complete knowledge (choice of both correct answers) of the question which concerns the ecological role of humus is just 13.3% despite the fact that discussion regarding the ecological role of humus takes place during many courses (e.g. forestry, soil science, forest fires etc.) and is repeated during all years in the School of Forestry.
Q18. Which of the followings do you think that are renewable energy sources (Mark with X your answers):
Oil Forest-biomass Fossil fuels Solar energy Hydroelectricity (water) Geothermic energy I don’t know
Insufficient knowledge
Average Knowledge
Good knowledge
Excellent knowledge
0
10
20
30
40
50
60
%
54,5
21,8
3
20,8
1st year students
Q18. Which of the following are rewable resources of energy?
Insufficient Knowledge
Average Knowledge
Good knowledge
Excellent Knowledge
0
10
20
30
40
50
60
%
53,3
208,3
18,3
5th year students
Q18. Which of the following are rewable resources of energy?
On the question regarding renewable sources of energy, it is worth noting that the students of the two years, (1st and 5th), show the same level of knowledge. One would expect the 5th year students to demonstrate a relatively higher level of awareness. Considering their level of education, the fact that only about half of the students have excellent knowledge of renewable energy sources is not encouraging. This fact has two possible explanations: a) the subject of energy is only taught in some elective courses in the School of Forestry. The awareness of students of important environmental matters, such as that of energy, especially of students at a higher educational level, is nonexistent and b) the knowledge of the first year students regarding energy seems to be due to their involvement in environmental education (E.E.) programs (where energy is a popular topic), because twice the number of them, in relation to the fifth year students, have attended E.E. school programs. In fact, there is positive correlation
250
“Sustainable Management and Development of Mountainous and Island Areas”

( 2=3.363, df=3, p=0.339) between the correct answers of the first year students and of those who attended environmental programs during their school years, as the following tables show.
Qualitative Scale Total
1st year students Excellent knowledg
e
Good knowle
dge
Average knowled
ge
Insufficient
knowledge
Yes 33 17 1 14 65 Environmental educationprogramms
No 22 5 2 7 36
Total 55 22 3 21 101
Chi-Square Tests(b) Value df Asymp. Sig. (2-sided)
Pearson Chi-Square 3,363(a) 3 0,339 Likelihood Ratio 3,404 3 0,333 Linear-by-Linear Association 0,182 1 0,670
N of Valid Cases 101
12. The most important environmental problem facing Greece is: (SEE APPENDIX)(Rank all of the following problems using the numbers from 1 to 13, with 1 being the most dangerous and 13 being the least dangerous.)
Both the 1st and 5th year students recognize as the six most important environmental problems facing Greece: the hole in the ozone layer and the Greenhouse Effect, deforestation, the lack of green space, the extinction of wild life, chemical pollution, an the mishandling of natural resources. In addition, the 5th year students believe that traffic is also a serious environmental problem (ranked as 4th by 18.3%). It is obvious that they rank the problems which are discussed in the MME as numbers 1 and 2, regardless of their importance to Greece, a fact that should not have been true, at least for the 5th year students. As far as what are the least dangerous environmental problems facing Greece, they believe that they are nuclear energy (13th place among 1st and 2nd year students) and overpopulation (13th place among 1st and 2nd year students). This answer seems logical since Greece shows underpopuation and does not use nuclear energy for is energy needs.
2.4 Section D- Questions which examine the systemic view of the students regarding environmental issues and the environment.
37
6
15
7 7
15 17
56
0
10
20
30
40
50
60
1st year students
Use car
Waste water
Overconsumption
Create and dump garbage
Waste energy
Smoke
Use plastics and chemicals
I don't know
Q23. In which ways, do you pollute the environment?
37
14 11
31
0 3
4046
0
10
20
30
40
50
5th year students
Use car
Waste water
Overconsumption
Create and dump garbage
Waste energy
Smoke
Use plastic and chemicals
I don't know
Q23. In which ways, do you pollute the environment?
In question 23, 53.5% of 1st year students and 58.3% of 5th year students admit that they believe they are polluting the environment. In other words, nearly half believe that they are not polluting. The ways that they are polluting it are shown in the above, charts, which were drawn according to the answers of the students. The dumping of garbage and the use of automobiles make up the largest percentage. At the same time, large percentages would also be expected in the other categories, especially in the indirect ways the environment is polluted and degraded, for example, by the wasting of water and energy (small percentages from the 1st year students and in part by the 5th year students) over consumption, the use of chemical and plastic, etc. Surprisingly, a large percentage of 5th year students do not know in which ways they pollute the environment.
Q27.Which of the following sentences are connected with qualitive or quantative problems of water?
47
77
11
58 61
37
49
69
54
19
58
48
0
10
20
30
40
50
60
70
80
90
1st year of students
Air pollution
Industrial Waste
Consuption of electricity
Domestic use of water
Deforestation
Garbage Dumps
Drought
Use of Fertilizers
Over popullation
Animal Husbandry
Use of water for intensivehusbandryClimatic Changes
251

Q27.Which of the following sentences are connected with qualitive or quantative problems of water?
58
82
10
58 58
50
43
68
48
33
58
33
0
10
20
30
40
50
60
70
80
90
5ft year of students
Air pollution
Industrial Waste
Consuption of electricity
Domestic use of water
Deforestation
Garbage Dumps
Drought
Use of Fertilizers
Over popullation
Animal Husbandry
Use of water for intensivehusbandryClimatic Changes
Both the 1st and 5th year students point out the direct recognizable factors that devalue the water, those factors which usually are mentioned in mass media and newspapers. They do not realize the indirect ways and they do not see the complex responsible relationships in the environment. Important factors receive low ratings of importance (garbage dumps, animal husbandry, drought, climate changes, deforestation, overpopulation) and factors with very indirect relationship are hardily recognized (energy consumption).
2.5 Section E – Questions that register the attitudes and values of the students in relation to environmental matters.
The questions, which appear here, register attitudes in relation to environmental matters.
Q33b.In which ways do you show practically your care for the environment?
810
17
23
9
31
6
25
4
8
2
16
0
5
10
15
20
25
30
35
1st year students
I try to inform other people
I take care of my daily actions
I participate in puplic actions for theenvironment
Keep myself wellinformed
Reforest- plant trees
I recycle materials
I use public trasportation
I don't dump garbage
I buy ecological products
I am a forestry student
I am member of ecological organisation
I don't do anything "special"
Q33b. In which ways do you show practically your care for the environment?
15
9
2022
7
22
2
15
2
11
54
0
10
20
30
40
50
60
5th year students
I try to inform other people
I take care of my daily actions
I participate in public actions for the environment
I keep myself well-informed
Reforest-plant trees
I recycle materials
I use puplic transportation
I don’t dump garbage
I buy ecological products
I am member of ecological organization
I don’t do anything special
Even though 81% of the 1st year students and 76.7% of the 5th year students report that they are interested in the environmental condition of their area, in practice it is not shown by high percentage (open question). Meanwhile, it is important to note that the 1st year students show higher percentages in most of the environmental activities. The percentage of students who “do not do anything special” for the environment is remarkably smaller among 1st year students (16%), compared to 54% of 5th year students. This may be due to the fact that more 1st year students have studied in environmental programs and have taken part in environmental activities during their school years. Forestry studies do not seem to have raised the environmental sensitivity of students.
Q27. What could you do personally to reduce green house effect
37
25
5
10
3 2 3 3
52
0
10
20
30
40
50
60
5th year students
use public transportation
don't use sprays
inform and activate otherpeople
reforest/ plant trees
Filters should be used inindustries
prevent fires
recycle materials
use alternative forms ofenergy
I don't know
252
“Sustainable Management and Development of Mountainous and Island Areas”

Q27. What could you do personally to reduce green house effect
34 35
6
9 8
3
9
46
2 1
33
0
5
10
15
20
25
30
35
40
1st year students
use public transportation
don't use sprays
inform and activate otherpeoplereforest/ plant trees
Filters should be used inindustriesprevent fires
recycle materials
consume less
don't use air-condition
participate in politicalactionsuse alternative forms ofenergyI don't know
This question is open and the results were categorized on the basis of the answers of the students. It is interesting that a large percentage of the answers were “I don’t know” for both years. The use of mass transportation is considered as the most important factor. The answer regarding not using sprays shows that both groups are confusing the greenhouse effect with ozone depletion. The low percentages in activities such as the use of alternative forms of energy, reforestation, and fire prevention are surprising, especially when these answers are coming from graduates of the School of Forestry.
7. Conclusions
The present study has attempted to register the level of environmental awareness and sensitivity of 1st and 5th year students of the School of Forestry and Natural Envinment of the Aristotle University of Thessaloniki. The statistical analysis of the data proves that:
The 5th year students have a higher level of knowledge in the specialized topics of their studies in contrast to the 1st year students, as was expected. Nevertheless, the middle percentages of correct answers in certain topics that require specialized scientific knowledge create skepticism about course content and the methods used for educating students. No difference was noticed between the two groups in their knowledge of more general environmental matters (e.g. global environmental problems). A remarkable 38.3% percent of the 5th year students themselves report (Question 36)
that their environmental knowledge is deficient. The dominant understanding of environmental matters of every day life is simple and limited. The complexity, holistic, and systemic character of the environment are absent. It seems that student understanding is influenced more by the information from mass media than from their studies. The majority of students for both groups state that they are environmentally sensitive. In fact 80% of the 5th year students believe that their studies in the school of forestry strengthen their environmental sensitivity. However this feeling is not reflected in the answers of both groups to questions, which examine this sensitivity in practice (e.g. undertaking environmental activity). When comparing the answers of the two groups, the 1st year students seem to be more energetic in the undertaking of environmental activity. The involvement in activities and programs of environmental education seems to contribute positively to the environmental awareness and sensitivity of the young. Environmental studies should change their direction in regard to subject matter and the concepts used as tools toward a systemic and holistic consideration of environmental reality in order to more effectively prepare scientist-citizens who will be able to respond to the challenges of a sustainable 21st century.
8. Acknowledgements
The authors would like to thank the 1st and 5th
year students of the Forestry and Natural Environment School of the Aristotle University of Thessaloniki for their cooperation in the implementation of this study and their professors. They would further like to thank Dr.Toupadakis Andreas and Dr.Toupadakis Barbara for their helpful comments.
9. References
[1] Benton R, Environmental knowledge and attitudes of undergraduate business students
253

compared to non-business students, Business and Society 1994, 33, 191–197.
[2] Bonnett M & Williams J, Environmental education and primary children’s attitudes towards nature and the environment, Cambridge Journal of Education 1998, 28(2), 159–174.
[3] Bord RJ & O’Connor RE, The gender gap in environmental attitudes: the case of perceived vulnerability to risk, Social Science Quarterly 1997, 78, 830–840.
[4] Eagles P & Demare R, Factors influencing children’s environmental attitudes, Journal of Environmental Education 1999, 30, 33–38.
[5] Ernst J and Monroe M, The effects of environment-based education on students' critical thinking skills and disposition toward critical thinking, Environmental Education Research, Vol. 10, No. 4, November 2004, 507-522.
[6] Fien J, “Stand up, stand up and be counted: undermining the myths of environmental education. Australian Journal of Environmental Education 1997, 13, 21-36.
[7] Flogaitis E, Environmental Education. Athens, Hellenic University Publications; Greek Letters Publications, 1993.
[8] Goffin L Bonniver M, "La perspective environnementale en pedagogie", Revue belge de la psychologie et de pedagogie 1982, 44 (19), 77-95.
[9] Grifford R, Hay R & Boros K, Individual differences in environmental attitudes, The Journal of Environmental Education 1983, 14, 19–23.
[10] Grodzinska-Jurczak MS. Management of industrial and municipal solid wastes in Poland. Resour Conserv Recy 2001,32, (2), 85-103.
[11] Kaplowitz M. and Levine R, How environmental knowledge measures up at a Big Ten university, Environmental Education Research, 2005,Vol. 11, No. 2, April 2005, 143–160
[12] Khan AM, “Sustainable Development. The Key Concepts, Issues and Implications, in Sustainable Development, 1995, 3, 63-69.
[13] Kuhlemeier H. Bergh V.D. & Lagerweij N. (1999) Environmental knowledge, attitudes, and behaviour in Dutch secondary education, Journal of Environmental Education, 30, 4–11.
[14] Kwan T & Miles J, In the words of children and young people: the opinions and
concerns about their environments of some Brisbane school students, Australian Journal of Environmental Education, 1998, 14, 11–18.
[15] Littledyke M, Primary children’s views on science and environmental issues: examples of environmental cognitive and moral development, Environmental Education Research, 2004, Vol. 10, No. 2, May 2004 pp.217-235
[16] Loughland T, Reid A, Walker K. & Petocz P, Factors influencing young people’s conceptions of environment, Environmental Education Research, 2003, 9, 3–20.
[17] Lundholm C, Case studies - exploring students’ meanings and elaborating learning theories, Environmental Education Research 2004 February, Vol. 10, No. 1, 115-124.
[18] McMillan EE, The impact of a university introductory environmental studies class on the environmental values of students. Masters Thesis, Dalhousie University, Halifax 2002.
[19] McMillan EE, A Method for Evaluating the Impact of an Introductory Environmental Studies Class on the Values of Students, Applied Environmental Education and Communication 2003, 2 : 91–98.
[20] Orr D. W. Educating for the environment: higher education’s challenge of the next century, Change 1995, 27, 43–46.
[21] Ragou P. (2000), « L'approche systémique et la modélisation - simulation: analyse critique de leur valeur didactique en Education pour l'Environnement », Doctoral Dissertation. Paris: Université Paris Sud-Onze-Orsay.
[22] Ragou P Souchon C (2000), " L’approche systémique : une méthode d’apprentissage et un outil d’évaluation en Education relative à l’Environnement", Education relative à l'Environnement : regards, recherches, reflexions, Volume 2, 95-200.
[23] Ramsey C. E. & Rickson R.E. Environmental knowledge and attitudes, The Journal of Environmental Education 1976, 8, 10–18.
[24] Reddy C and Schreuder D, Environmental education scholarship in a ‘marketised’ setting: a case study in a university environmental education programme, Environmental Education Research 2004 August, Vol. 10, No. 3, 297-311.
[25] Richmond J.M. (1976) A survey of the environmental knowledge and attitudes of fifth year students in England. Unpublished
254
“Sustainable Management and Development of Mountainous and Island Areas”

doctoral dissertation, The Ohio State University.
[26] Souchon C - Giordan A, “Une Education pour l’Environnement”, Ed. Z, Paris, 1992.
[27] Souchon C, Ziaka Y (1993), «Spécificités et exigences de l’ Education pour l’Environnement», in Environnement et Société,No 11, Fondation Universitaire Luxembourgeoise, 11-13.
[28] Synodinos NE, Environmental attitudes and knowledge: a comparison of marketing and business students with other groups, The Journal of Business Research 1990, 20, 61–170.
[29] Tan Geok-Chin Ivy et al. A Survey of Environmental Knowledge, Attitudes and Behaviour of Students in Singapore, International Research in Geographical and Environmental Education 1998, Vol. 7, No. 3, 181-202.
[30] Tikka P.M. Kuitunen M.T. & Tynys S.M. Effects of educational background on students’ attitudes, activity levels, and knowledge concerning the environment, Journal of Environmental Education 2000, 31, 12–19.
[31] Towler J. and Swan J.E. What do people really know about pollution? In C. Schoenfeld (ed.) Interpreting Environmental Issues, Research and Development in Conservation Communications 1972, pp. 245–248, Madison: Dembar Educational Research Services.
[32] Tuncer G., Ertepinar H., Tekkaya C. and Sungur S., Environmental attitudes of young people in Turkey: effects of school type and gender, Environmental Education Research, 2005 April, Vol. 11, No. 2, 215–233.
[33] Wilke R. Environmental literacy and the college curriculum: colleges and universities have a challenge to meet, EPA Journal 1995, 21, 28–30.
[34] Worsley A. & Skrzypiec G. Environmental attitudes of senior secondary school students in South Australia, Global Environmental Change 1998, 8, 209–255.
[35] United Nations Educational, Scientific and Cultural Organization (1978) Final report, Intergovernmental Conference on Environmental Education (Tbilisi, United Nations Educational, Scientific and Cultural Organization with UNEP).
255
“Sustainable Management and Development of Mountainous and Island Areas”

APP
END
IX
1st y
ear S
tude
nt F
requ
ency
%
1st
2nd
3rd
4th
5th
6th
7th
8th
9th
10th
11
th12
th13
th
Gre
enho
use
Effe
ct a
nd th
e ho
le in
the
ozon
e la
yer
18,8
9,9
7,9
7,9
7,9
9,9
6,9
5 3
4 5
9,9
4 O
verp
opul
atio
n 2
2 7,
9 6,
9 4
4 5
7,9
3 11
,9
7,9
14,9
20
,8
Def
ores
tatio
n 4
15,8
8,
9 5,
9 7,
9 11
,9
11,9
4
7,9
5 7,
9 5,
9 3
Lack
of g
reen
spa
ce
20,8
8,9
9,9
8,9
8,9
3 5
5,9
10,9
5,
9 4
4 4
Sou
nd p
ollu
tion
1 6,
9 9,
9 6,
9 5,
9 5
6,9
10,9
11
,9
8,9
11,9
12
,9
1E
xtin
ctio
n of
wild
life
4
4 7,
9 14
,9
11,9
9,
9 6,
9 12
,9
8,9
8,9
5 2
3 S
horta
ge o
f wat
er
2 3
4 5
2 9,
9 6,
9 8,
9 18
,8
9,9
15,8
7,
9 5,
9 N
ucle
ar e
nerg
y 5,
9 4
5,9
4 5,
9 5,
9 6,
9 2
4 10
,9
9,9
5,9
28,7
C
hem
ical
pol
lutio
n 16
,820
,8
11,9
13
,9
10,9
5,
9 5,
9 4
2 3
3 2
0 E
rosi
on
2 5
5 7,
9 9,
9 13
,9
8,9
21,8
4 4
11,9
2
4 Tr
affic
6,9
6,9
7,9
5 3
3 8,
9 5
11,9
8,
911
,9
8,9
11,9
G
arba
ge d
umps
4
6,9
2 8,
9 11
,9
10,9
7,
9 6,
9 7,
9 12
,93
12,9
4
Mis
hand
ling
of n
atur
al re
sour
ces
12,9
5,9
10,9
6,
9 8,
9 9,
9 9,
9 5,
9 4
5 4
6,9
8,9
5th
year
Stu
dent
Fre
quen
cy %
1s
t 2n
d 3r
d4t
h5t
h 6t
h7t
h8t
h9t
h 10
th
11th
12th
13th
G
reen
hous
e E
ffect
and
the
hole
in th
e oz
one
laye
r 15
5 11
,7
5 5
3,3
11,7
13
,3
8,3
3,3
6,7
6,7
5 O
verp
opul
atio
n 3,
3 3,
3 8,
3 6,
7 1,
7 0
8,3
5 15
3,
3 5
18,3
21
,7
Def
ores
tatio
n 13
,36,
7 13
,3
11,7
11
,7
11,7
5
6,7
5 3,
3 8,
3 3,
3 0
Lack
of g
reen
spa
ce
5 11
,7
6,7
18,3
8,
3 10
6,
7 6,
7 6,
7 11
,7
3,3
5 0
Sou
nd p
ollu
tion
0 6,
7 6,
7 1,
7 15
8,
3 1,
7 8,
3 8,
3 10
16
,7
10
6,7
Ext
inct
ion
of w
ild li
fe
1,7
6,7
3,3
11,7
13
,36,
7 8,
3 6,
7 6,
7 6,
7 13
,3
5 10
S
horta
ge o
f wat
er
8,3
3,3
1,7
5 10
11
,7
8,3
208,
3 11
,7
8,3
3,3
0 N
ucle
ar e
nerg
y 3,
3 6,
7 5
0 0
6,7
8,3
0 5
8,3
1,7
20
35
Che
mic
al p
ollu
tion
13,3
26,7
6,
7 3,
3 8,
3 1,
7 8,
3 11
,7
3,3
3,3
8,3
1,7
3,3
Ero
sion
8,
3 5
11,7
10
5
8,3
5 6,
7 10
15
10
5 0
Traf
fic6,
7 6,
7 6,
7 18
,3
0 8,
3 3,
3 8,
3 8,
3 13
,3
3,3
8,3
8,3
Gar
bage
dum
ps
1,7
5 10
3,
3 15
10
11,7
1,
7 13
,3
6,7
10
8,3
3,3
Mis
hand
ling
of n
atur
al re
sour
ces
21,7
6,7
11,7
3,
3 6,
7 13
,3
11,7
5
1,7
1,7
5 5
6,7
Tabl
e. T
he m
ost i
mpo
rtant
env
ironm
enta
l pro
blem
faci
ng G
reec
e is
:
256
“Sustainable Management and Development of Mountainous and Island Areas”

Investigation of Humidex bioclimatic index spatial pattern using geostatistical methods and GIS: The case of a green area in Nea Smyrni
Kontova Sofia, Charalampopoulos Ioannis, Chronopoulou – Sereli Aikaterini Lab. of General and Agricultural Meteorology, Agricultural University of Athens Greece, Iera Odos
75, 11855, Athens, Greece [email protected]
Abstract. Urban green areas, as parks and gardens, improve thermal comfort conditions because they modify local meteorological conditions. The human thermal comfort can be expressed using the appropriate bioclimatic indices. Urban planners and architects need more accurate information related to the bioclimatic performance of such green areas. Primarily, the related studies focus on the bioclimatic performance of a single point for a selected time period. This study aims to investigate the bioclimatic performance of an urban green area using spatial visualization of the Humidex index.
Air temperature and relative humidity measurements were carried out, inside and outside of the selected urban green area, in order to calculate Humidex. The measurement period lasted three days in September and October of 2004, under clear and calm meteorological conditions. In order to visualize the spatial pattern of Humidex, the Kriging geostatistical method was used. The spatial statistics of these patterns were calculated using G.I.S. software. The analysis of the results indicates striking influence of green area on thermal comfort. In addition, using this method, urban planners can spot the parts of the investigated area which have high or low bioclimatic performance. This type of information could be very important on urban green area planning.
Keywords. Bioclimate, thermal comfort, urban green
1. Introduction
Today, everybody has the technological capacity to regulate thermal comfort in indoor spaces. During his life-time, however, a person also spends a lot of time in outdoor spaces. It has
been observed that certain characteristics of outdoor spaces, as the existence of obstacles and the vegetation, affect considerably the configuration of thermal comfort [1], [2], [3]. Urban planners need more information related to the bioclimatic performance under outdoor conditions. This study aims to investigate the bioclimatic performance of an urban green area in Nea Smyrni, Athens, Greece during September and October 2004. In order to demonstrate the spatial variation of thermal comfort, a classic thermohigrometrical index (Humidex) was used.
2. Study area and methods
2.1 Study area
The park of Nea Smyrni is located in a residential – commercial area of Athens. This green area was established at 1930. The total size of the park is 5 ha and it is planted with pine trees (Pinus Halepensis, Pinus Brutia) and cypresses (Cupressus sempervirens). Also, other species of shrubs are planted. This park is a recreation area and it is used for sports and outdoor games. Inside the park (almost in the center of that) there is a small cinema and a playground. Also, there are narrow and wide paths crossing the park.
2.2 Parameters and methods
In order to investigate the bioclimatic influence of the selected urban green area on the local thermal environment, a number of diurnal mobile measurements were carried out during the period of September and October 2004. The survey was conducted by mobile equipment. The parameters which were measured on each sample point were air temperature (0C) and relative humidity (%). All data was sampled at 1.8 m height above the ground during dry anticyclone weather conditions when clear skies and light
257
“Sustainable Management and Development of Mountainous and Island Areas”

wind were reported. These data were recorded in a portable PC for further statistical and geostatistical analysis. In order to scan the study area, preliminary measurements in sparse sampling network were taken. A multi-focused, dense, sampling network was designed using those measurements. The survey was focused on green area, the adjacent build-up area and every area causing variation on the spatial pattern of air temperature and relative humidity. The sampling points located on the network were 20 in total. In order to collect the data, a double loop route [4] was performed passing from all sampling points. The measurements lasted less than 3 hours, starting at 09:00, 12:00, 15:00, 18:00, and 21:00 local time. The time-corrected data from every route were inserted in geostatistical software (Surfer 7) to produce rasters via the Kriging method [5] that illustrates the spatial pattern of the parameter (air temperature & relative humidity). The spherical model was the most appropriate for the spatial interpolation of the selected data. Using the overlaying method, the values of Humidex index were calculated for each route. The Humidex calculation formula is H = Ta+(5/9)(e-10) [6], [7], where H is Humidex (0C), Ta is air temperature (0C) and e is vapor pressure (hPa).The mean spatial patterns for each time are illustrated at the following figures.
3. Results and discussion
The results based on the 300 measurements during 15 routes, showed that the selected green area has a striking influence on the human thermal comfort as it is expressed by the Humidex index. As spatial patterns illustrate, the conditions inside the parks are always beneficial comparably with the adjacent residential area. Inside the park the thermal comfort is not (spatial) homogenous. The dense – planted area forms lower Humidex values than the spare planted (southern part of the park). Generally, Humidex took values between 36.5 and 27.5 0C.According to Humidex comfort classification (Table 1), the values they recorded during this survey indicate ‘Some discomfort’ and ‘Great discomfort’. As Figure 1 illustrates, the Humidex difference between the park area and the residential area reaches 2.5 0C at 09:00. The East side of the study area is under improved bioclimatic conditions inside and outside the
park. Over the park center a sector of more comfortable conditions was formed.
Table 1. Humidex values correspond to the following categories of comfort [8]
Comfort category Humidex 0CComfortable H<27
Some discomfort 27 H<30 Great discomfort 30 H<40
Dangerous 40 H<55 Very dangerous H 55
The western residential area is under ‘Some discomfort’ conditions while the eastern residential area is under more comfortable conditions. The main reason which causes this spatial inhomogeneity is the sun position at this time.
0 50 100meters
Figure 1. Humidex spatial pattern at 09:00 local time.
The buildings placed on the eastern side of the study area, block the direct sun radiation at morning. The impact of the position of the sun is obvious at each one of the five spatial patterns, especially over the area outside the park. Figure 2 illustrates the spatial pattern of Humidex at 12:00 over the study area. The range of recorded values is wider and reaches 4.2 0C. The park forms a sector of better bioclimatic conditions when the adjacent residential area tends to form discomfort conditions. Inside the park Humidex records values they correspond to class ‘some discomfort’ and ‘great discomfort’, according to the classification of table 1. Over the residential
258
“Sustainable Management and Development of Mountainous and Island Areas”

area, Humidex records values they correspond to class ‘great discomfort’. As the sun reaches the zenith position, the beneficial conditions close to the park’s borders decreased.
Inside the park there are two more comfort sectors (at south and north) and a sector in the center of the park having higher Humidex values.
0 50 100meters
Figure 2. Humidex spatial pattern at 12:00 local time.
At Figure 3, the Humidex range reaches the 2.2 0C. All of the study area is under ‘great discomfort’ conditions at 15:00 local time. As the spatial pattern indicates, the park forms better bioclimatological conditions than the adjacent residential area. Over the northern and southern part of the park, the lower Humidex values (near 32 0C) were recorded. On the other hand, the higher values were recorded over the northern part of the study area near the park’s borders. In perspective with the 12:00 conditions, the recorded values are lower inside and higher outside of the green area.
0 50 100meters
Figure 3. Humidex spatial pattern at 15:00 local time.
As Figure 4 illustrates, the thermal sensation is improved according to Humidex values. The recorded values range at this time reaches 1.6 0C.The park’s influence on bioclimatic conditions is obvious at this time. Higher values were recorded over the northwestern part of the study area while lower values were recorded over the northern part of the park. The green area tends to form a clear sector of more comfortable conditions than its surroundings. Once more, contours in the park indicate that the densely – planted area is under more comfortable conditions than the cinema and playground area.
0 50 100meters
Figure 4. Humidex spatial pattern at 18:00 local time.
259
“Sustainable Management and Development of Mountainous and Island Areas”

The human thermal comfort is improved at 21:00 over the study area as Figure 5 illustrates. According to Humidex classification (Table 1), the area is under ‘some discomfort’ conditions. The Humidex range reaches 1.0 0C when the higher value is 29.0 0C and the lower 28.00C.The Humidex spatial pattern formation is similar to the previous pattern at 09:00, 12:00, 15:00 and 18:00 local time.
0 50 100meters
Figure 5. Humidex spatial pattern at 21:00 local time.
4. Conclusion
It is obvious that urban green areas influence considerably thermal comfort conditions. Despite the fact that the selected green area is non – irrigated and the fact that the planted trees have low transpiration rate, the bioclimatic conditions are improved comparably with the surrounding residential area. The bioclimatic performance of the selected green area would be higher if the vegetation became more dense and the unshaded area of the park more sparse. The ‘open’ site (cinema and playground) of the park causes a rise of Humidex values, reducing the beneficial bioclimatic performance of the park.
The illustration of bioclimatic performance of such an urban green area can provide important information for the re-designing of this park. Also, the knowledge of the bioclimatic spatial function of urban parks may improve the landscape architects’ ability to design sites or areas having beneficial performance on human thermal comfort.
5. References
[1] Streiling, S., Matzarakis, A., 2003. Influence of single and small clusters of trees on the bioclimate of a study: A case study. Journal of Arboriculture, 29, 309 - 316
[2] Picot, X., 2004. Thermal comfort in urban spaces: impact of vegetation growth. Case study: Piazza della Scienza, Milan, Italy.Energy and Buildings, 36, 329 - 334
[3] Charalampopoulos, I., Chronopoulou – Sereli, 2005. Mapping the urban green area influence on local climate under windless and light wind conditions. The case study of western part of Athens, Greece. Acta Climatologica et Chorologica. Tom 38 – 39, 25 - 31.
[4] Kuttler, W., 1993: Planungsorientierte Stadtklimatologie. Meteorol. Rdsch. 2, 95-106
[5] Cressie, N., 1993: Statistics for spatial data. Revised edition, John Wiley & Sons.
[6] Bisanti L, Cadum E, Costa G, Michelozzi P, Perucci C, Russo C (2004) 2003 heat waves and mortality in Italy. Epidemiology 15: 97
[7] Masterton M, Richardson A (1979) Humidex, a method of quantifying human discomfort due to excessive heat and humidity. CLI 1-79. Environment Canada, Atmospheric Environment Service, Downsview, Ontario
[8] Conti S, Meli P, Menelli G, Solimini R, Toccaceli V, Vichi M, Beltrano C, Perini L (2005) Epidemiologic study of mortality during the summer 2003 heat wave in Italy. Environmental research 98: 390-399
260
“Sustainable Management and Development of Mountainous and Island Areas”

Description of vegetation types in Pylos Lagoon and Sfacteria Island, Greece
Korakis Giorgos
Democritus University of Thrace, Dept Forestry, Environment and Natural Resources P.O. Box 129, Pantazidou 193, 68200, Orestiada, - [email protected]
Abstract. This paper studies the vegetation types of the Pylos Lagoon and Sfacteria Island in the SW Peloponnese (Greece). Most of the study area comprises a combination of coastal and wetland ecosystems with vegetation that depends largely on soil-water conditions, and consists of a mosaic of wetland, halophytic and psammophytic plant communities. Also, zonal vegetation of sclerophyllous shrub and phrygana, characteristic of the thermo-Mediterranean zone, occurs to a large extent. Thirteen vegetation types that were identified in the field are presented and described in detail. They are assigned in corresponding habitat types and classified phytosociologically.
Keywords. Coastal plant communities, habitat types, Peloponnese, wetlands.
1. Introduction.
Pylos Lagoon (Yalova) and Sfacteria Island constitute one of the 265 sites that compose the Greek part of the European ecological network Natura 2000.
Figure 1. Map of the study area
The area comprises a wide variety of coastal and wetland ecosystems including the lagoon and salt marshes complex, reed-beds, sand-dunes, sea cliffs, riparian galleries and thermo-Mediterranean sclerophyllous vegetation (maquis and phrygana). The aforementioned habitat types compile a varied spatial patchwork of vegetation that supports equally varied and well-conserved fauna [7]. Identification, delineation and mapping of the plant communities provide valuable information for biodiversity assessment and are essential for the elaboration of management plans for the site.
The aim of this study is to identify, describe and classify phytosociologically the natural vegetation types and the corresponding EU habitat types that occur in Pylos Lagoon and on Sfacteria Island.
2. Materials and Methods
2.1. Study area
2.1.1. Location, geology and soil
The study area is located in SW Peloponnesus within the border of the Natura 2000 site, which has an area of 3350 ha. The biggest section (48%) consists of Navarino Bay (Fig 1). Natural habitat types are found mainly in the north section of the site, while in the west lies the elongated island of Sfacteria, which closes the bay’s entrance to the Ionian Sea. In the NW is the lagoon (Yalova), which is a shallow brackish water-body partly isolated from the adjacent sea and surrounded by sand and mud beaches interspersed with brackish marshes and thickets.
The geological substrate of the area comprises Tertiary formations such as conglomerates, flysch and Quaternary deposits [7]. These are Holocene deposits composed of alluvium rich in fine material such as clay and sand, whereas coarse sediment is present in the
GreeceTurkey
Bulgaria
Albania
F.Y.R.O.M
261
“Sustainable Management and Development of Mountainous and Island Areas”

vicinity of torrent beds. Wetland habitats have a clayey-loam or loamy-clay substrate, with relatively low sand content. Sfacteria is a hilly island (106 m asl) with a limestone bedrock.
2.1.2. Climate and bioclimate
Within the framework of the present research, data was used from the Meteorological Station of Methoni, which belongs to the National Meteorological Service. It is located at a distance of 10 km from the area at an altitude of 33 m and provides data from 45 years of operation (1954-1999).
In the study area the type of climate, which prevails is that of Mediterranean influenced by the sea, in combination with continental Mediterranean, while the area is classified climatically according to Gaussen as a Xerothermic type with dry periods of 125-150 days. The mean annual precipitation amounts to 706 mm with a min of 401 mm and a max of 1034 mm. The mean annual temperature is 17.90
C with a maximum monthly temperature of 25.70
C and a minimum monthly temperature of 11.30
C [7]. According to Mavrommatis’ [10]
methodology the bioclimate of the study area is Mediterranean with a character mild thermo-Mediterranean. The xerothermic index is 100<x<125, which indicates that the biologically dry days number between 100 and 125. The area belongs to the sub-humid bioclimatic layer with warm winters and a mean minimum temperature of the coldest month greater than 7oC (m>7).
2.1.3. Vegetation
The study area is located within the Mediterranean Quercetalia ilicis vegetation zone and in particular, in the Oleo-Ceratonion subzone. However, the study area’s vegetation should not be assigned to the above subzone in total, as it is to a high degree azonal and as such not climate-dependent, but rather dependent on the prevailing local substrate conditions.
2.2. Vegetation and habitat types research
The field research on vegetation and habitat types was undertaken in the spring and early summer of 1998. The plant specimens were identified in the Laboratory of Forest Botany and Geobotany, Aristotle University of Thessaloniki,
and taxa nomenclature follows Flora Hellenica [12] and Flora Europaea [13].
Habitat distinction, identification and classification was based on the characteristic and diagnostic taxa referred to in [8], [9], [5], [1], [4], [11], [2], [3].
3. Results and discussion
A variety of thirteen habitat types (two of them mixed) were distinguished within the study area.
3.1. Code: 1140 – Mudflats and sandflats not covered by seawater at low tide
In this habitat the mudflat areas are included, which remain uncovered by water for a long period of time and are thus able to be colonized by pioneer loose halophytic communities. It is the initial stage of vegetation establishment on these surfaces, and the total coverage does not exceed 30%. The type was located northern of the lagoon, with a participation of the species Salicornia europaea.Class: Zosteretea S. Pignatti 1953 Diagnostic species: Posidonia oceanica,Salicornia europaea.
3.2. Code: 1240 - Vegetated sea cliffs of the Mediterranean coasts
The habitat consists of coastal rocky ridges, which are subject to erosion caused by the sea. In these positions, the plant communities that grow are of a loose structure, tolerant to the affects of the wind and sea-spray. For this reason, it is usual to find halophytic vegetation, which occurs in formations of salt marshes or other coastal ecosystems. In the study area, the habitat is located on a limestone substrate, on the coast of the islands of Pylos and Sfacteria, on the rocky coasts around Paleokastro as well as a number of smaller positions among the coastal sand dunes of Petrochori.
In the rock crevices towards the sea edge are found sclerophyllous shrubs which grow in a dwarf form due to the effects of the sea wind, which limits their height. The shrubs, which appear in these positions are: Juniperusphoenicea, Pistacia lentiscus, Genista acanthoclada, Sarcopoterium spinosum, Anthyllis hermaniae and often, Smilax aspera in creeping form .
262
“Sustainable Management and Development of Mountainous and Island Areas”

The growth of evergreen, shrubby vegetation, which comes down low, close to the surface of the sea, along the leeside eastern coast of Sfakteria Island is characteristic, as well as the admixture of this formation with the bigger or smaller colonies which the dwarf shrub Ptilostemon chamaepeuce forms on steep rocky slopes. Finally, the presence of the rare endemic species, Arenaria peloponnesiaca in the habitat must be mentioned [6]. Class: Crithmo-Staticetea Br.Bl. in Br.-Bl. et
al. 1952 Diagnostic species: Crithmum maritimum, Helichrysum italicum, Limonium sinuatum, Capparis spinosa, Malcolmia flexuosa, Arthrocnemum macrostachyum, Sedum acre, Glaucium flavum, Ephedra fragilis, Anthemis tomentosa, Euphorbia terracina.
3.3. Code: 1410 – Mediterranean salt meadows
A habitat characterized by the high presence of Juncus spp., in particular the species Juncus acutus and Juncus maritimus. These species colonize soils of medium mechanical texture that are inundated or with a high ground water level, in transitional environments from a high salt-water content to fresh water. These types of brackish soil conditions are usually created in low, interior positions, which are affected to a medium extent by the ground salt-water level. As a result, the plant communities of Juncus spp.,are often accompanied in these zones by species with a significant gradation of tolerance in the salinity and moisture of the soil.
In the study area, the habitat is located in the west section of the island strip, which separates the Yalova Lagoon from Pylos Bay. Class: Juncetea maritimi R. Tx. et Oberd.
1958 Diagnostic species: Juncus acutus, Juncus maritimus, Saccharum ravannae, Tamarix hampeana, Juncus conglomeratus, Juncus articulatus, Rubus ulmifolius. In high salinity areas: Sarcocornia perennis, Salicornia europaea, Halimione portulacoides, Limonium vulgare, Aster tripolium.
3.4. Code: 1420 – Mediterranean and thermo-Atlantic halophilous scrubs
This type includes the pioneer plant communities of exclusively halophytic perennials. It grows on level, silt substrate, which
is affected by sea water either directly during high tide, or underground, via the capillary raising of the water from the water-body. The plant communities of this habitat are subject to constant succession resulting from the ability these species have of trapping and storing the silt with their vegetative parts and in this way raising gradually the level of the ground. This process in association with the annual addition of organic matter alters the conditions of the site and offers the possibility of colonization by new species, even from year to year.
In the study area, the habitat is located in positions on the periphery of the lagoon. The plant cover in these positions often alternates with bare expanses, whereas the ecological specialization of the halophytes has as a result their appearance in the form of facies (expanses of thick vegetation of individuals of one single species).
It is a poor type in floristic composition, with diagnostic species being, Sarcocornia perennis, Arthrocnemum macrostachyum and the annual Salicornia europaea. In addition, the species Aster tripolium, Polypogon maritimus are present, while there is a significant presence of the thick facies of Juncus maritimus, in the eastern section of the island strip. Class: Salicornietea fruticosae Br.-Bl. et R. Tx
ex A. de Bolós y Vayreda 1950Diagnostic species: Sarcocornia perennis, Arthrocnemum macrostachyum, Salicorniaeuropaea, Aster tripolium, Polypogon maritimus,Juncus maritimus.
3.5. Code: 2110 – Embryonic shifting dunes
The low sand dunes of the coastline are included in this habitat. These form the frontline elevation of the loose sandy substrate, after the zone of the winter waves and since they are the first stage of development in the sand dune system, they are also called ‘embryonic’. They are characterized by constant movement and change of shape, especially during the winter period when there is greater wind intensity. A result of this process is that their height remains low and the plant cover sparse.
In the study area, the habitat appears along the coastline in the islandstrip, which separates the lagoon from Pylos Bay and includes the front sand zone directly after the bare vegetation zone of the winter waves. This zone has a variable width, starting by being very narrow in the east
263
“Sustainable Management and Development of Mountainous and Island Areas”

(3-5 m.) and then becoming gradually wider to over 15 m, while the height of the front of the dunes is generally low, not higher than 1 m.
In the entire area of the habit there is a wide variety of typical flora with an excellent representation. In contrast, it has a medium structure, which, among other factors, is due to the increased pressure the area has been under in the last years largely because of campers and bathers.
The recording of the typical psammophytic species, of the classes Cakiletea maritimae and Ammophiletea, which was compiled in the habitat’s entire area, had the following results:
There is a significant presence of the rhizome geophyte Elymus farctus, characteristic of the plant community Agropyrion juncei,which grows in the low dunes.
There is a total absence of the species Ammophila arenaria, characteristic of
mmophiletum arundinaceae, which colonizes the high sand dunes.
There is a significant presence of the species: Euphorbia paralias, Xanthium strumarium, Silene nicaeensis, Otanthus maritimus. Class: Ammophiletea Br.-Bl. et R. Tx. ex
Westhoff et al. 1946 Diagnostic species: Elymus farctus, Ammophila arenaria, Euphorbia paralias, Polygonum maritimum, Xanthium strumarium, Silene nicaeensis, Otanthus maritimus, Salsola soda, Sporolobus pungens, Anthemis tomentosa, Eryngium maritimum, Cyperus capitatus, Cakile maritima, Matthiola tricuspidata, Rumex buckephalophorus, Medicago marina, Echinophora spinosa.
3.6. Code: 2120 – Shifting dunes along the shoreline with Ammophila arenaria
The habitat includes the formation of shifting sand dunes (the white dunes) of Voidokilias. It appears after the bare vegetation zone of the winter waves, which has a width of 20 m, with a height front of 1.5 – 3 m, which is characterized by the presence of the rhizome geophyte Ammophila arenaria. This species occupies exclusively the peaks of the sand dunes, which are usually higher than 2 metres [8]. Its ability to develop an almost unlimited root system in both length and depth, makes it capable of adapting to the changes in the size and shape of the sand dunes and enables it to form networks in the interior of the sand hills, achieving the first significant step in the process of stabilization.
Class: Ammophiletea Br.-Bl. et R. Tx. ex Westhoff et al. 1946
Diagnostic species: Ammophila arenaria,Eryngium maritimum, Otanthus maritimus, Silene nicaeensis, Medicago marina, Euphorbia paralias, Calystegia soldanella.
3.7. Code: 2250 - * Dune juniper thickets
The habitat includes the pure stand Juniperus phoenicea, which occurs in Voidokilia, as well as the linear stand of juniper-evergreen shrubs, which extends along the island strip. The entire stand of Voidokilia, resides on a sandy substrate, with loose to sparse coverage. The individuals of juniper present shrub growth with a mean height of 3 metres. Among the junipers, the sub-shrub Thymus capitatus often appears, with a characteristic cushion development. There are very few admixtures from other shrub species, such as Pistacia lentiscus, Sarcopoterium spinosum, and Osyris alba.
It must be noted that the shrubs of Juniperus phoenicea, in this area act as islands of biodiversity, creating micro-environments under their canopy, which moderate the extreme geo-climatic conditions of the sand dunes and favour the growth of other species, in particular Prasium majus (which is met practically everywhere under the canopy) as well as the climbers Rubiaperegrina and Smilax aspera.
In Voidokilia sand dunes flourish the whole of the psammophytic flora that occurs in the two other sand dune habitats of the area.
In the second site of the habitat, Juniperus phoenicea is found on a sandy substrate in the island strip and creates a dense linear stand with a strong mixture of evergreen shrubs. Class: Quercetea ilicis Br.-Bl. ex A. de Bolós y
Vayreda 1950 Diagnostic species: Juniperus phoenicea,Prasium majus, Rubia peregrine, Pistacia lentiscus, Cistus incanus, Olea europaea, Ruscus aculeatus, Calicotome villosa, Osyris alba, Smilax aspera, Rhamnus alaternus, Myrtus communis, Anthyllis hermanniae, Genista acanthoclada, Chrysanthemum coronarium, Pallenis spinosa, Thymus capitatus, Allium sphaerocephalon, Juncus conglomeratus, Lagurus ovatus, Alkanna tinctoria, Avena sterilis, Echium vulgare, Hordeum murinum, Helichrysum italicum, Asparagus acutifolius.
264

3.8. Code: 3190 - Reedbeds
The habitat of reedbeds spreads east of the lagoon beside the embankment (the Valtos position), where colonies of the tall helophyte Phragmites australis occur. In order for this species to grow, it requires fresh, or low salt content, still water. It also appears sporadically, along the canals and the irrigation trenches of the area. Class: Phragmito-Magnocaricetea Klika in
Klika et Novák 1941 Diagnostic species: Phragmites australis, Typha domignensis, Iris pseudacorus.
3.9. Code: 5331 – Tree-spruge formations
The habitat consists of stands of Euphorbiadendroides, in the thermo-Mediterranean zone. This species, which is a relic of the Tertiary, Macaronesian biogeographic origin, today comprises the only representative macrophanerophyton of the genus in the Mediterranean. Similar in physiognomy and development Euphorbia species today grow in Africa and the Canary Islands. It grows in the form of a shrub or small tree (2-3 metres high) and forms colonies in mainly limestone soils occupying the warm, south, south-east and south-west aspects. A characteristic adaptation to the xerothermic conditions of the environment in which it grows, is the shedding of leaves in the summer.
In the study area, it appears mainly on the hill of Paleokastro, on shallow, rocky limestone soils, where it forms a mixed, loose shrubland with the Juniperus phoenicea. In addition, it has a small presence in the eastern section of Sfakteria Island. Class: Cisto-Micromerietea julianae Oberd.
1954 Diagnostic species: Euphorbia dendroides
3.10. Code: 5420 – Sarcopoterium spinosumphrygana
The low formations of the phrygana, occupy the largest section of Sfakteria Island. They comprise, a partly anthropogenic habitat and indicator of animal grazing. It is a fact that the intense grazing in the past, favoured the spread of the habitat in the shallow limestone soils of the island even up to the highest point (151m.). In the last years grazing has stopped on the island and so the phrygana formations have been
able to acquire density, a physiognomy, which is rare, in contrast to the characteristic semi-spherical plants, which are widely spread. Therefore, nowadays, they appear as a continuous and uninterrupted low carpet, of uniform height (about 40cm. maximum), where the basic restrictive factor is only the sea wind.
The absence of annual and perennial herb species from the vegetation is noteworthy. This can be accounted for by the herb layer’s lack of light, which the closed canopy of the phrygana creates. Despite all this, the type comprises the basic biotope of two endemic bulb geophytes, Allium callimischon and Allium circinatum ssp.peloponnesiacum.
The island vegetation also includes Aleppo pine (Pinus halepensis ssp. halepensis) in groups and thickets in the central and southern section, the growth of evergreen shrubs in the eastern leeside, as well as the sporadic presence of Euphorbia dendroides in eastern and south-eastern exposures of the north section. Class: Cisto-Micromerietea julianae Oberd.
1954Diagnostic species: Genista acanthocladaSarcopoterium spinosum, Pistacia lentiscusQuercus coccifera, Asparagus acutifolius, Smilax aspera, Cistus incanus, Thymus capitatus, Helichrysum italicum, Asphodelus fistulosus, Phillyrea latifolia, Calicotome villosa, Lonicera implexa, Convolvulus altheoides.
3.11. Code: 92CO – Oriental plane woods
This habitat consists of the riparian forests of Platanus orientalis in Greece. These forests colonize, to a greater or lesser extent, loose alluvial substrata of large rivers and torrent beds of permanent or temporary flow. The soil in these positions is usually basic, rich in nutrients, with a high underground water level and/or periodic-seasonal flooding. The vegetation is characterized by a dense growth of sub-layer and the intense presence of climber species.
The habitat in the study area is located along the Selas River. It forms a forest- gallery, which in places extends in width greater than 100 m. The tree layer consists of the mature individuals Platanus orientalis with a maximum height of close to 20 metres and a mean maximum diameter of 70 cm. The tree cover is 90-95%. The presence in the tree layer of the ivy (Hedera helix) is impressive, which in most cases totally covers the trunks.
265
“Sustainable Management and Development of Mountainous and Island Areas”

The shrubs are dominated by the impressively tall species, Nerium oleander(which reaches 6 metres max. height) and Vitexagnus-castus (4 metres max. height), while there is also an intense presence of the species, Rubusulmifolius, rundo donax, Phragmites australis and Platanus orientalis. In the shrub layer the large variety and contribution of climber species in the riverside ecosystems and especially those of the thermo-Mediterranean zone is apparent. Hence, climbers such as Hedera helix, Clematis vitalba, Tamus communis, Vitis vinifera, Rubia peregrine and Calystegia sepium dominate.
In the herb layer, Urtica dioica dominates, while there is also participation of Carexpendula, Arum italicum, Orobanche sp. Class: Nerio-Tamaricetea Br.-Bl. et O. de
Bolós 1958 Diagnostic species: Platanus orientalis, Hedera helix, Nerium oleander, Vitex agnus-castus, Rubus ulmifolius, rundo donax, Clematis vitalba, Tamus communis, Vitis vinifera, Rubia peregrina, Calystegia sepium, Urtica dioica, Carex pendula, Arum italicum.
3.12. Code: 1410x92D0 – Mediterranean salt meadows with thermo-Mediterranean riparian galleries
This mixed type appears east of the lagoon in the position ‘Valtos’. It consists of wetlands dominated by Juncus acutus and is differentiated from type 1410 (Mediterranean salt marshes of Juncetalia maritimi) due to the increased presence of Tamarix hampeana. These wetlands have in the past been cultivated, at least in the highest and fresh water sections. Today, they are subject to light grazing. The presence of a canal, which enriches the water-body with fresh water, reflects the composition of the vegetation from which the exclusive halophytic species are absent. Apart from Tamarix hampeana andJuncus acutus, in this position as well as in other wetlands affected by canal water, there also appear, among others, the species, Iris pseudacorus, Orchis laxiflora, Parecuntellia viscosa, Calystegia sepium, Bromus hordaceus, Vitex agnus-castus, Salix alba, Arundo donax, Nerium oleander, Phragmites australis, Lythrum cf junceum, Typha sp., Equisetum sp.
The change of the environment during the transition to conditions of high salt content in the soil, is indicated by the appearance and dominance of species such as Aster tripolium, Polypogon maritimus, Atriplex halimus.
Class: Nerio-Tamaricetea Br.-Bl. et O. de Bolós 1958
Diagnostic species: Tamarix hampeana, Juncus acutus, Vitex agnus-castus.
3.13. Code: 2120x2250 - Shifting dunes along the shoreline with Ammophila arenaria with dune juniper thickets
The habitat of tall shifting sand dunes, in the interior positions in which shrub vegetation is found, with the predominant centurian individuals Juniperus phoenicea. It extends along the beaches of Petrochorio and Romanos, interrupted in positions by rocky pinnacles.
The habitat of sand dunes in this zone has excellent representation, not only in the physiognomy (max. width of tall dunes at points reaching 120-150 metres, and a height which surpasses 12 metres at Petrochori) but also in the floristic composition. Class: Ammophiletea Br.-Bl. et R. Tx. ex
Westhoff et al. 1946 Diagnostic species: Ammophila arenaria, Pancratium maritimum, Eryngium maritimum, Otanthus maritimus, Silene nicaeensis, Euphorbia paralias, Calystegia soldanella, Glaucium flavum.
4. Acknowledgements
This research was funded by the European Committee (11th General Division) and the Hellenic Ministry for the Environment, Physical Planning and Public Works (Environmental Division) within the framework of the European programme “Implementation of Management Plans for Pylos Lagoon and Evrotas Delta, Natura 2000 Sites, Greece” as undertaken by the Greek Ornithological Society (H.O.S.).
9. References
[1] Babalonas D. Phytosociological study of the vegetation of Evros Delta. Thessaloniki: Ph.D. Thesis, Aristotle University of Thessaloniki; 1979.
[2] Dafis S, Papastergiadou E, Lazaridou E,. Technical manual of identification, description and mapping of Greek habitat types. Thessaloniki: Greek Biotope-Wetland Center (EKBY); 1999.
[3] Dafis S, Papastergiadou E, Lazaridou E, Tsiafouli M. Technical manual of identification, description and mapping of
266
“Sustainable Management and Development of Mountainous and Island Areas”

Greek habitat types. Thessaloniki: Greek Biotope-Wetland Center (EKBY); 2001.
[4] Dimopoulos P, Papastergiadou E, Sykora K, Georgiadis T, Babalonas D, Dafis S. Collection and analysis of phytosociological data on the vegetation of Greece. Thessaloniki: Goulandris Natural History Museum. Greek Biotope-Wetland Center ( ); 1995.
[5] Horvat I, Glava V, Ellenberg H. Vegetation Südosteuropas. Stuttgart: G. Fischer; 1974.
[6] Iatrou G. Contribution to the study of the endemism of the Peloponnesian flora. Patra: Ph.D Thesis, University of Patra; 1986.
[7] Kardakari N, Sigalos G, editors. Special environmental study of Pylos lagoon and Sfacteria island. Athens: Hellenic Ornithological Society, Hellenic Ministry for the Environment, Physical Planning and Public Works, European Union DG XI; 2000.
[8] Lavrentiades G. 1964. The ammophilous vegetation of the Western Peloponnesos coasts. Vegetatio 1964; 12: 223-287.
[9] Lavrentiades G. On the vegetation of sand dunes of Greek coasts. Colloques Phytosociologiques 1971; 1: 91-98.
[10] Mavrommatis G. The bioclimate of Greece. Relationships between climate and natural vegetation. Athens; 1980.
[11] Romão C. Interpretation Manual of European Union Habitats. Bruxelles: Directorate General XI; 1996.
[12] Strid A, Tan K. Flora Hellenica. Vols 1, 2. Königstein: Koeltz Scientific Books; 1997-2002.
[13] Tutin T.G, Burges N.A, Chater A.O, Edmonson J.R, Heywood V.H, Moore D.M, Valentine D.H, Walters S.M, Webb D.A, editors. Flora Europaea, Vols. 2-5, Cambridge: Cambridge University Press; 1968-1980.
267
“Sustainable Management and Development of Mountainous and Island Areas”

A New Insight in the Photochemical Efficiency of Cynodon dactylon (C4species) Compared to Elymus hispidus (C3 species) under Drought
Conditions
P. Kostopoulou, Z. Koukoura and B. Noitsakis Laboratory of Range Science, Aristotle University of Thessaloniki, P.O. Box 236, 54 124
E-mail: [email protected]
Abstract. The photochemical efficiency of Elymus hispidus (C3 species) and Cynodon dactylon (C4 species), occurring naturally in a grassland of Northwestern Macedonia, Greece, was studied. Leaf water potential, assimilation rate, carboxylation efficiency, mesophyll resistance, photosystem II’s (PSII) photo-chemical efficiency and electron transport rate were measured at seven day intervals during the dry period. The C4 photosynthetic pathway was found to be more affected by water deficit establishment in plant tissues, contrary to what was expected. The lower assimilation rate of C. dactylon observed in this study could be due to the lower PSII efficiency and electron transport rate. The ecological coexistence of the two species could be attributed to their complementary phenology, rendering them capable of using the same limited water and/or nutrient resources at different periods of time.
Keywords. C3-C4 plants, water stress, photosynthesis, fluorescence.
1. Introduction
Plants possessing the C3 photosynthetic pathway dominate most terrestrial ecosystems and account for about 85% of all plant species. About 10% of the earth’s flora possess CAM photosynthesis and commonly grow in xeric sites. C4 plants dominate warm to hot, open sites, but on a floristic basis comprise the lowest percentage of the terrestrial flora [8].
The C4 photosynthetic pathway is most pronounced in species of the families Poaceae,Cyperaceae and Chenopodiaceae [7]. In particular, 407 out of 799 Poaceae genera contain C4 species, most of them being characteristic elements of tropical and temperate areas with abundant warm-season monthly precipitation above 25mm and average monthly temperature above 22oC [3].
The relationship between C4 cycle and hot climates derives from the utilization of a distinct photosynthetic pathway that uses more energy in relation to the C3 mechanism [15]. The theoretical energetic demand (CO2: ATP: NADPH) is 1:3:2 and 1:5:2 for C3 and C4 species respectively [21]. This additional energetic demand of the C4 pathway provides an ecological advantage to C3 plants under cool environments [15]. C4 plants have an efficient CO2 pump that concentrates CO2 at the site of Rubisco, consisting of two different cell types, mesophyll and bundle sheath cells, which form a joint metabolic system that is characterized by a division of labor [23]. This CO2 concentrating mechanism makes C4 plants less prone to photorespiration, accomplishing therefore higher yield rates and a higher water use efficiency (WUE) compared to C3 plants [16, 21]. This greater efficiency at competitive advantage renders C4 plants water savers, dominating areas or time periods with lower amounts of moisture. Yet within grasslands, which are at least seasonally dry, recent work has shown that C4 grass species seem to dominate in environments that are wetter, not drier [4, 9, 12, 19, 26]. Other works, however, report that the most important factor controlling the abundance of C4 species is temperature [17, 20, 24]. In any case, under certain environmental conditions the efficiency of the C4 photosynthetic pathway may drop to similar levels to that of C3 species [4, 15, 17, 21]. It is now clear that within C3 and C4 species a wide range of environmental adaptation exists, making the comparative study of photosynthetic control of C3 and C4 species coming from a variety of taxonomic groups and habitats extremely interesting. Aim of this study was to evaluate the photosynthetic efficiency of plants following these two different photosynthetic pathways, growing under the same natural environment with seasonal water deficit and to investigate the factors affecting any photochemical discrepancies observed.
268
“Sustainable Management and Development of Mountainous and Island Areas”

2. Materials and Methods
The experiment was carried out in natural grassland of Ptolemais basin, in Northwestern Greece (21o46’E, 40o25’N) at 723m altitude. The climate of the area is characterized as typical semi-arid Mediterranean having a mean annual rainfall of approximately 600mm [25] with the temperature (T) and the vapor pressure deficit (VPD) at noon ranging during the measurement period between 24.3 and 33.2oC and 2.3 and 4.37 KPa respe-ctively (Fig. 1) and the mean photosynthetic photon flux density value (PPFD) around noon being 2131 mol m-2 s-1. Two species, belonging to the Poaceae family, Elymus hispidus (Opiz) Melderis (C3) and Cynodon dactylon (L.) Pers (C4) were studied at photosynthetical and photochemical level.
Measurements were made every seven days during the dry season (June and July) of 2005. At each measurement five fully expanded, mature leaves of each species were chosen in a completely random way at noon (14:00) in order to measure leaf water potential, assimilation rate, substomatal CO2 concentration, and to estimate carboxylation efficiency (CE) and mesophyll resistance (rm).
The leaf water potential was measured using the pressure chamber technique [13]. An InfraRed Gas Analyser (LC Pro+) was used for the measurement of the assimilation rate, A ( mol m-2 s-1), and the substomatal CO2concentration, Ci (vpm) [10], while with the help of a fluorometer OS-30 (OPTI-SCIENCES) the photochemical efficiency of PSII, Fv/Fm was measured on the same leaves from which A was assessed, after a 20 minute dark adaptation [5, 22]. The carboxylation efficiency, CE (mol m-2
s-1), was calculated from the formula (2.1):
iCACE (2.1)
where : the compensation point, while the mesophyll resistance, rm (m2 s1 mol-1), derived as the reciprocal of CE [7].
The estimated maximal electron transport rate, ETR ( mol m-2 s-1), was obtained from (2.2) [22]:
5.084.0FF
PPFDETRm
v (2.2)
Mean values and standard deviations of all parameters were calculated for each species at each measurement date. To ascertain the significance of differences in physiological parameters between the two species the mean
values were further statistically evaluated with GLM Univariate Analysis of Variance for a P 0.05 confidence level with the help of SPSS Statistical Package. The correlation analysis between the variables was performed with the help of the Bivariate Correlation analysis procedure for a P 0.01, while the regression analysis was conducted using the REG procedure.
3. Results and Discussion
In C4 species the CO2 concentrating mechanism and the almost complete lack of photorespiration that it induces, allows C4 plants to have higher photosynthetic rates even under low atmospheric CO2 concentration [23]. On the other hand, C3 plants need high CO2concentration in order the photosynthetic apparatus to become saturated [7].
0
5
10
15
20
25
30
35
11/6 19/6 26/6 4/7 9/7 24/7
Tem
pera
ture
(C
)
0,00,51,01,52,02,53,03,54,04,55,0
V.P.
D. (
KPa
)
TV.P.D.
Figure 1. Seasonal changes of temperature (T) and vapor pressure deficit (V.P.D.).
The lower photosynthetic rates observed in C.dactylon compared to E. hispidus at the same value of leaf water potential (Fig. 2a, Table 1) indicate that C. dactylon’s photosynthetic pathway is more sensitive to water stress, since decline of assimilation rate is observed with decreasing values of water potential. C4 plants are generally considered to have a competitive advantage over C3 species under certain conditions at which the C4 photosynthetic rate is much higher than the C3 rate. In our case, the competitive advantage of C4 over C3 species has been inverted and the C4 species C. dactylonseems to be more sensitive to water stress as far as the assimilation rate is concerned. The argument that C. dactylon is more sensitive because it is grown under unfavorable ecological conditions is not very strong because the climatic data does not seem to be so much adverse for C4
269
“Sustainable Management and Development of Mountainous and Island Areas”

species (Fig. 1) [1, 21]. Furthermore, the existence of C3 species in hot and arid environments is not scarce [11] and in this case E. hispidus seems to belong to the above category of C3 plants. Thus, the explanation concerning the low assimilation rate of C. dactylon should be searched either at photosynthetic or at photochemical level.
As expected the Ci in C. dactylon is much lower than that in E. hispidus at the same values of leaf (Fig. 2b), indicating that more CO2 is used by C. dactylon for photosynthesis and that due to the CO2 concentrating mechanism C. dactylon appears to use CO2 more effectively, since the CO2 is quickly pumped to the site of CO2 carboxylation as well as to the bundle sheath chloroplast, diminishing Ci although leafvalues become more negative (Fig. 2b). Apparently, this behavior suggests an unaffected by water stress mesophyll resistance. Indeed, as the leaf decreases the rm in C. dactylon decreases dramatically in respect to E. hispidus where rmincreases as leaf decreases (Fig. 2c), suggesting that supply and movement of CO2 to carboxylation sites is not prevented by water stress in C. dactylon. Decreasing CO2assimilation in response to water stress has been ascribed to either stomatal closure, restricting CO2 entry into the leaves, or to changes in leaf biochemistry that results in inhibition or down regulation of photosynthesis [2, 18]. C4 plants are reported to be better adapted to water stress due to lower stomatal conductance, while at the same time are capable of carrying on photosynthesis under low CO2 concentrations, on account of their CO2 concentrating mechanism [16], indicating in our case the existence of non stomatal limitation of photosynhtesis.
Table 1. Analysis of variance of physiological parameters. Data are expressed as mean±S.E. Different indices within rows indicate that the data are statistically different at the level of P 0.05.
Physiological parameters
E. hispidus C. dactylon
A ( mol m-2 s-1) 2.25±0.32a 2.56±0.19a leaf (MPa) 2.07±0.24a 1.80±0.18b
Ci (vpm) 135.67±20.16a 23.83±10.17b CE (mol m-2 s-1) 0.035±0.01a 1.76±0.29b rm (m2 s mol-1) 45.25±9.99a 9.79±4.76b Fv/Fm 0.5±0.06a 0.54±0.05a ETR ( mol m-2 s-1) 459.8±57.27a 465.95±48.19a
Figure 2. Seasonal changes between leaf water potential and (a) assimilation rate, (b) intercellular CO2 concentration and (c) mesophyll resistance.
The last step at photosynthetic level is to investigate whether the low leaf affects the carboxylation efficiency (CE). This parameter has much higher values in C. dactylon (Table 1) and is maintained high even under the establishment of low leaf values, in comparison to CE values of E. hispidus which are slightly lower. Indeed, C4 plants are characterized by higher values of CE in relation to C3 plants, a fact attributed to the higher carboxylation capacity of PEP carboxylase, its higher affection for CO2 and the absence of its activity as an
R2 = 0,6595
R2 = 0,5922
0
20
40
60
80
100
1,00 1,50 2,00 2,50 3,00 3,50
leaf (MPa)
rm
(m2 s
mol
-1)
R2 = 0,227
R2 = 0,4947
0
50
100
150
200
250
1,00 1,50 2,00 2,50 3,00 3,50
Ci (
vpm
)
R2 = 0,4616
R2 = 0,5909
0,0
1,0
2,0
3,0
4,0
5,0
1,00 1,50 2,00 2,50 3,00 3,50
A (
mol
CO
2 m-2
s-1
)
E. hispidus
C. dactylon
(b)
(c)
(a)
270
“Sustainable Management and Development of Mountainous and Island Areas”

oxygenase [7]. CE could therefore not be considered as the limiting factor leading to low values of photosynthesis in C. dactylon.
Table 2. Correlation coefficients between physiological parameters. Asterisks denote the correlations’ significance at the level of P 0.01; ns=statistically not significant.
E. hispidus C. dactylon A vs 0.599 ** 0.026 ns Ci vs 0.679 ** -0.272 ns CE vs 0.155 ns 0.144 ns rm vs 0.689 ** -0.144 ns Fv/Fm vs 0.59 ** -0.23 ns Fv/Fm vs A 0.604 ** -0.23 ns ETR vs 0.636 ** -0.447 ns
Since at photosynthetic level C. dactylonappears to maintain its competitive advantages over E. hispidus its observed assimilative sensitiveness should be searched at photochemical level. The changes of Fv/Fmversus leaf (Fig. 3a) indicated that Fv/Fm remains almost constant (0.6-0.65) under the decrease of
leaf in E. hispidus, suggesting that the function of Photosystem II (PSII) is maintained relatively constant even under low values of leaf.Conversely, the initial increase of Fv/Fm in C. dactylon is followed by a decrease when the leafvalues attain -2.4 MPa. Water stress over the -2.4 MPa seems to alter the PSII’s efficiency in C. dactylon. However, the Fv/Fm values in both species are lower than 0.8-0.83, the optimal value of PSII’s efficiency, a fact indicating the existence of a stress factor affecting in both species the photochemical efficiency of PSII and leading to photoinhibition [5, 22]. It is obvious that this stress factor has a stronger impact on C.dactylon, which seems unable to maintain high photochemical efficiency under the establishment of severe water deficit, a fact that likely plays an important role in the formation of its assimilative values. Indeed, the relationship of Fv/Fm versus A (Fig. 4) is rendered negative in C. dactylon with values of Fv/Fm lower than 0.6, while it is strong and positive in E. hispidus (Table 2). Furthermore, at the same values of Fv/Fm E. hispidus exhibits higher values of assimilation rate compared to C. dactylon for values of Fv/Fm higher than 0.55. Water stress is reported to cause a blockage of electron flow on the water oxidation side of PSII in several plant species [6]. These data might support the argument that the photochemistry of PSII may be
a controlling factor resulting in C. dactylon’sassimilative sensitivity to water stress.
Figure 3. Seasonal changes between leaf water potential and (a) PSII photochemical efficiency and (b) electron transport rate.
The affected values of Fv/Fm by water stress probably decrease the electron transport rate (ETR) resulting in decreased total photosynthetic rate [14]. The establishment of water deficit in the tissues of E. hispidus seems to leave the ETR unaffected, since it remains high even over the lower values of water potential (Fig. 3b). The opposite behavior is observed in C. dactylon with the ETR decreasing after the threshold of ~2.0 MPa. The decline of ETR in this species for leafvalues lower than -2.0 MPa in combination with the greater energetic demand of C4 species for C fixation [15, 21] could explain its low photosynthetic values. On the other hand, although the ETR values in E. hispidus are increased under relatively low values of leaf its assimilation rate does not appear to follow the same trend, exhibiting a decreasing tendency with decreasing values of water potential (Fig. 2a). These high ETR values of E. hispidus under intense water stress could be attributed to the fact that even though the PPFD in the study is considered high (2131 mol m-2 s-1) for the demands of C3 species [21], this species manages to protect its photosynthetic apparatus
R2 = 0,1752
R2 = 0,4726
0,2
0,3
0,4
0,5
0,6
0,7
0,8
1,00 1,50 2,00 2,50 3,00 3,50
Fv/F
m
E. hispidus
C. dactylon
R2 = 0,5672R2 = 0,1258
0
200
400
600
800
1,00 1,50 2,00 2,50 3,00 3,50
leaf ( Pa)
ETR
(m
ol m
-2 s-1
)
(a)
(b)
271
“Sustainable Management and Development of Mountainous and Island Areas”

from the damaging effects of photooxidation by channeling the excess energy into alternative electron sinks apart from carbon fixation [14].
R2 = 0,2462R2 = 0,776
0,00,51,01,52,02,53,03,54,04,5
0,3 0,4 0,5 0,6 0,7 0,8
Fv/Fm
A (
mol
CO
2 m-2
s-1)
E. hispidusC. dactylon
Figure 4. Seasonal changes of PSII’s photo-chemical efficiency (Fv/Fm) in relation to assimilation rate.
Water stress has therefore a greater impact on the photosynthetic apparatus of the C4 species C. dactylon, through a direct effect on its photochemical efficiency enhancing previous arguments [4, 9, 12, 19, 26] that C4 grass species dominate grasslands where moisture is not a limiting factor. The question that arises is why C. dactylon is found in such a region, since the environmental conditions (especially moisture) are not the optimal for its development. The answer may lie to the fact that these two species have complementary phenology (E. hispidusstops its development in mid or the end of July, while Cynodon dactylon begins to develop in early June and spreads its seeds in late August), rendering them capable of using the limited water resources at different periods of time.
4. Conclusions
The photosynthetic apparatus of E. hispidus,though a C3 species, exhibits a remarkable tolerance to water stress and seems to be better adapted to the region’s environment, which is characterized by high PPFD and seasonal drought. On the other hand, C. dactylon’s photosynthetic mechanism, though following the C4 pathway, seems to be more affected by water stress, enhancing the belief that at least some C4 grass species are not as water stress tolerant as previously believed. The coexistence of C3 and C4 species in the same environment is attributed to their seasonal dominance shift, rendering them
capable of exploiting the same limited resources at different time intervals.
5. References
[1] Aggarwal PK, Sinha SK. Water stress and water-use efficiency in field grown wheat: A comparison of its efficiency with that of C4 plants. Agricultural Meteorology 1983, 29: 159-167.
[2] Berkowitz GA. Water and Salt Stress. In:. Raghavendra AS, editor. Photosynthesis, A Comprehensive Treatise. Cambridge: Cambridge University Press; 1998. p. 226-237.
[3] Boom A, Mora G, Cleef AM, Hooghiemstra H. High altitude C4 grasslands in the northern Andes: relicts from glacial conditions? Review of Paleobotany and Palynology 2001; 115: 147-160.
[4] Collatz GJ, Berry JA, Clark JS. Effects of climate and atmospheric CO2 partial pressure on the global distribution of C4 grasses: present, past, and future. Oecologia 1998; 114: 441-454.
[5] Critchley C. Photoinhibition. In: Raghavendra AS, editor. Photosynthesis, a Comprehensive Treatise. Cambridge: Cambridge University Press; 1998. p. 264-272.
[6] Downton WJS. Osmotic adjustment during water stress protects the photosynthetic apparatus against photoinhibition. Plant Science Letters 1983; 30: 137-143.
[7] Edwards G, Walker D, editors. C3, C4: mechanisms, and cellular and environmental regulation of photosynthesis Oxford: Blackwell Scientific Publications; 1983.
[8] Ehleringer JR, Sage RF, Flanagan LB, Pearcy RW. Climate change and the evolution of C4 photosynthesis. Tree 1991; 6: 95-99.
[9] Epstein HE, Lauenroth WK, Burke IC, Coffin DP. Productivity patterns of C3 and C4 functional types on the U.S. Great Plains. Ecology 1996; 78: 722-731.
[10] Field CB, Ball JT, Berry JA. Photosynthesis: principles and field techniques. In: Pearcy RW, Ehleringer J, Mooney HA, Rundel PW, editors. Plant Physiological Ecology. Field Methods and Instrumentation. London: Chapman and Hall; 1991. p. 209-253.
[11] Jones HG. Plants and Microclimate. A quantitative approach to environmental plant
272

physiology. Cambridge: Cambridge University Press; 1983.
[12] Koch PL, Diffenbaugh NS, Hoppe KA. The effects of late Quaternary climate and pCO2change on C4 plant abundance in the south-central United States. Palaeogeography, Palaeoclimatology, Palaeoecology 2004; 207: 331-357.
[13] Koide RT, Robichaux RH, Morse SR, Smith CM. Plant water status, hydraulic resistance and capacitance. In: Pearcy RW, Ehleringer J, Mooney HA, Rundel PW, editors. Plant Physiological Ecology. Field Methods and Instrumentation. London: Chapman and Hall; 1991. p. 161-183.
[14] Maxwell K, Johnson GN. Chlorophyll fluorescence – a practical guide. Journal of Experimental Botany 2000; 51: 659-668.
[15] Mora G, Pratt LM. Carbon isotopic evidence from paleosols for mixed C3/C4 vegetation in the Bogota Basin, Colombia. Quaternary Science Reviews 2002; 21 985-995.
[16] Nayyar H. Accumulation of osmolytes and osmotic adjustment in water-stressed wheat (Triticum aestivum) and maize (Zea mays)as affected by calcium and its antagonists. Environmental and Experimental Botany 2003; 50: 253-264.
[17] Nordt LC, Boutton TW, Jacob JS, Mandel RD. C4 Plant Productivity and Climate-CO2Variations in South-Central Texas during the Late Quaternary. Quaternary Research 2002; 58: 182-188.
[18] Pagter M, Bragato C, Brix H. Tolerance and physiological responses of Phragmites australis to water deficit. Aquatic Botany 2005; 81: 285-299.
[19] Paruelo JM, Lauenroth WK. Relative abundance of plant functional types in grasslands and shrublands of North America. Ecological Applications 1996; 6: 1212-1224.
[20] Pyankov VI, Gunin PD, Tsoog S, Black CC. C4 plants in the vegetation of Mongolia: their natural occurrence and geographical distribution in relation to climate. Oecologia 2000; 123: 15–31.
[21] Salisbury FB, Ross CW, editors. Plant Physiology. Belmont: Wadsworth Publishing Company; 1991.
[22] Schreiber U, Bilger W, Neubauer C. Chlorophyll fluorescence as a nonintrusive indicator for rapid assessment of in vivo photosynthesis. In: Schulze ED, Caldwell
MM, editors. Ecophysiology of Photo-synthesis. Berlin: Springer-Verlag; 1994. p. 49-70.
[23] Svensson P, Bläsing OE, Westhoff P. Evolution of C4 phosphoenolpyruvate carboxylase. Archives of Biochemistry and Biophysics 2003; 414: 180-188.
[24] Teeri JA, Stowe LG. Climatic patterns and the distribution of C4 grasses in North America. Oecologia 1976; 23: 1-12.
[25] Tsikritzis LI. Study of the bio-accumulation of heavy metals and radionuclides of plants in West Macedonia. PhD Thesis. Thessaloniki: Department of Biology, Aristotle University of Thessaloniki; 2002.
[26] Yang L, Wylie BK, Tieszen LL, Reed BC. An analysis of relationships among climate forcing and time-integrated NDVI of grasslands over the U.S. northern and central Great Plains. Remote Sens. Environ. 1998; 65: 25-37.
273
“Sustainable Management and Development of Mountainous and Island Areas”

Koronos: Keeping Cultural Architectural Identity
Manolis D. Manolas1 and Giannis D. Mellissourgos2
1Civil Engineer, President of the Cultural Organization of Koronos 2 Mathematician, Member of the Cultural Organization of Koronos
The Ecomuseum of Koronos and the Industrial Park of the Emery Mines of Naxos are located in the mountainous zone of the island of Naxos, the largest island of the Cyclades. The area includes the six emery villages (Koronos, Aperathou, Messi, Skado, Keramoti and Danakos) and administratively belongs to the Municipality of Drimalia, the largest and most mountainous municipality of Cyclades, with an area of 314 sq.km and a population of 6,000 permanent inhabitants.
The highest tops of the mountains of the area (Zas, Fanari, Koronos) have a height of about 1,000 m, the highest altitude in Cyclades. The area is infertile, mountainous and sparsely populated, with a population dispersed in numerous settlements.
The economy of mountainous Naxos is based on:
Important animal production (mainly sheep and goats), urgently needing improvement in quality Decreasing farm production Important but underexploited mine resources (emery, marble, marble slabs) Important production of crafts Low tourist development in coastal areas.
In a few words, the biggest part of the mountainous area of Naxos is underdeveloped (small volume of private and public investments – small participation in private and public financing instruments), which has led to population and economic decline in the last 40 years.
However, the area of mountainous Naxos has a significant unexploited potential:
Multidimensional and dispersed cultural heritage of an historical course of six
thousand years (monuments of the Geometric period, the Cycladic period, the Classic and Roman years, the Byzantine period, the Venetian era and the era of modern Greek democracy) Rich and lively popular tradition (in architecture, music, dance and local traditions – feasts) Rich natural environment and multi-faced natural and man-made landscapes (the three highest mountains of the Cyclades, endless areas with agricultural terraces, big number of coastal and mountainous biotopes which belong to the network Natura 2000 and Corine, sandy beaches with dunes and cedar trees, as well as beaches with famous pebbles, interesting caves, etc.) Numerous local agricultural products, aswell as crafts
Based on the above mentioned characteristics, which complement each other, but – mainly – on the preservation –restoration and promotion of the cultural heritage, the area of mountainous Naxos is trying to reverse the route of population and economic decline and to find a new development course, through:
The diffusion of the existing tourist movement of the islandThe development of new and quality tourist productsThe extension of the tourist period.
274
“Sustainable Management and Development of Mountainous and Island Areas”

The pre-industrial and industrial monuments of the Industrial Park of the Emery Mines
The Naxos emery mines are known since the Antiquity. Their exploitation was one of the main economic, social and cultural factors for the mountainous villages, and the island. From the beginning of the 20th century, till the Second World War, the emery produced was a very important national product, the third resource for the Greek State. The discovery of the artificial emery kicked the Naxian emery out of the market, bringing the abandonment of the mines and the desertion of the mountainous villages of Naxos. During this period there was a wave of exits from Naxos and the islands generally. Many of the inhabitants abandoned the village and immigrated to Naxos town and especially Athens. The operation of the Cableway ceased in 1984. In 1989, the installations of the mines – transport systems although in ruins, were recognized as monuments.
Today, there are approximately 500 underemployed mine workers, i.e. having work for only two months of the year. In the last years and thanks to the conscientious efforts of the local authorities and the inhabitants, progressive signs of prosperity within the
villages are beginning to show. The inhabitants of the mountainous villages by nature enterprising and hard - working with exceptional vivacity and action in communal life strive to maintain and make known the cultural richness of their inheritance as well as extend their household hospitality to a large number of visitors who are looking for an «alternative» welcome.
Among their efforts one can mention, the restoration of the installations for the production and transport of the emery and the creation of an Industrial Park in the mining areas.
In the framework of the LEADER II Programmefor the Cyclades Region (managed by ARIADNE S.A.), the following projects are being implemented:
In the area of Koronos:
The restoration of the engine-station in Stravolangada The restoration of the mine of Sarantara and the creation of a mine-museum The creation of an Information Centre in the village of Koronos
In the area of Aperathou
The restoration of buildings and surrounding areas at the port of Moutsouna
MEDSTONE is a project of inter-regional co-operation between three Mediterranean islands: Pantelleria (Italy), Mallorca (Spain) and Naxos (Greece), implemented in the framework of RECITE II Programme.
275
“Sustainable Management and Development of Mountainous and Island Areas”

Leading Organisation: LEADER ULIXES – Pantelleria, Italy Partners: - Consell Insular de Mallorca –Fodesma, Mallorca, Spain, - Naxos Development Company –ARIADNE S.A.
The project will last for three years and has a budget for Naxos of 528,260 Euro (20% of the total) and foresees the following inter-regional activities:
Creation of a CDD – Cooperation Development Department: employment of experts, creation of a data bank, production of a newsletter, a monograph, a final edition and a CD-rom. Organization of inter-regional seminars in each of the participating areas (Naxos – Koronos) Creation of a CEI –Centre for Enterprises Initiatives in each of the Regional Antennae (Naxos –Koronos): promotion of the creation of new SMEs, organization of meetings with high school students, seminars for new and existing SMEs and sessions for the know-how transfer. Realization of local pilot projects for the restoration of dry-stone works and the study of related ecosystems: in the areas of the medieval agricultural settlement at Atsipapi -Koronos, the buildings of workers at the engine station of the emery cableway at Stravolangada –Koronos, as well as of the spring area at Adisaru –Damarionas.
Short description of the project The proposed project in the framework of this proposal has the following aims:
To place the area of the Ecomuseum of Koronos – Industrial Park of the Emery Mines among the Network of the Ecomuseums of the Mediterranean Sea.
The maintenance and revitalization of different historical buildings of the area as: guest houses, trekking shelters, visiting stations of the Cableway, informative stands, exhibition cells.
The creation of a network of accessible traditional paths, and
The equipment of these buildings and areas, and some others already maintained through other Projects, in order to achieve
the functioning of this area as an integrated place for cultural, educational and ecological tourism.
The site of demonstration – Atsipapi
Atsipapi is a self-sufficient agricultural settlement surrounded by vegetable gardens and vineyards.
The area of Atsipapi is 6 km away from the village of Koronos, in the south-east and closer to the sea than Koronos. It can be reached by car through a road, which is asphalted until the nearby Monastery of Argokiliotissa, whereas the remaining part is to be asphalted in the coming years. It can be also reached on foot through footpaths from the village as well as from the Monastery- Pannaxian Pilgrimage of Panaghia Argokiliotissa, which is visited by thousands of faithful on the feast of Zoodochos Pigi. The settlement of Atsipapi lies on the way to the Byzantine monument of Panaghia Kera at Lioiri (9thC A.D.).
Today the village is not inhabited and the majority of the buildings are in ruins. The few houses which are in good condition are used by farmers as sheds. In the ruins, a visitor can see different types of dry-stone wall constructions and objects of interest, i.e. old ovens, thrashing places, wine-pits etc.
The settlement is surrounded by vegetable gardens and vineyards built on terraces on both sides of the small valley. A network of narrow paths connects the gardens and the settlement, the major part being with steps.
In the lower part, there is a water-source, which irrigates the whole area. There one can also find some big and nice walnut and apple trees, which provide a lot of shade and make the place a very nice, quiet and restful spot.
In the area of the settlement and the gardens, there are also several spots from which the visitor has great views to the sea and the neighboring islands.
The area is considered one of the most important agricultural areas of the mountainous Community of Koronos. In the last years the local authorities have been trying to help the
276
“Sustainable Management and Development of Mountainous and Island Areas”

farmers of the area and increase their income. So:
The road after Argokiliotissa and until Lioiri is now in use.
The opening of the access road to the lower part and the water source and the restoration of the walls of the agricultural terraces has been included in the Proterra Programme financed by FEOGA Article 8 and the works are on the way.
The opening of the road leading from the water source to nearby pasture lands has been included in a Programme for the Improvement of Pasture Lands and the works are on the way.
The restoration of the path connecting the settlement with the Monastery has been included as one of the pilot projects of the MEDSTONE –RECITE II Programme, co-financed by the Greek Ministry of Culture.
Efforts are being made to connect the area with the electricity lines, which stop at Argokili.
Terraces cultivation, a uniting element of the Mediterranean landscape
The area of Atsipapi presents another important element, the spectacular view of the agricultural land on the hills around the village, shaped in the form of terraces. Cultivated terraces are areas of land that are
flat or only slightly inclined and have been integrated into more steeply sloped hills. They are often supported by dry stone walls and are, in fact part of a complex system which also involves means of access (ramps or stairways), hydraulic systems (fountains and irrigation canals), and other constructed elements (sheds etc).Terraces retain the earth in many regions, which often suffer heavy rainfall and have,through the centuries, allowed numerous hilly areas to be cultivated, most notably in Mediterranean countries. Use of these terraces has evolved throughout history, with periods of growth or abandonment according to population expansion, social organization and the need to create land for cultivation. Variations in their economic value at different points in history were at the root of these fluctuations. Even today these terraces are an effective means of using and managing natural resources. They hold back earth and ground humidity, and capture the heat of the sun during the day whilst giving off the same warmth at night. The stones used in the walls, often taken from the land itself, are of ecological value as the technique of dry-stone walling is more economical in terms of energy consumption than cement built walls.
In accordance with article 8 of the FEOGA, the European Union agreed to support Proterra, a European demonstration project in favor of the rehabilitation of zones of cultivated terraces.Twelve demonstration projects were carried out in four countries of the European Union aiming to reclaim terraced lands through local efforts, which would bring together local groups, associations, development agencies and far-mers. The terraced areas were created by man for good reasons, notably to create new land resources. Hence, the rehabilitation of the terraced sites has been proven only to be feasible if they are integrated into local strategies. It is essential to take into account recent concerns in the area of rural development such as: agricultural diversity, quality production, environmentally friendly techniques and new uses of rural space for tourism and cultural activities.
277
“Sustainable Management and Development of Mountainous and Island Areas”

Terraces cultivation, a uniting element of the Mediterranean landscape
Proterra is, above all, the result of the determination of twelve rural territories in four countries of the European Union to create a fruitful relationship among countryside, agriculture, and rural development. This was to be rooted in the theme of rehabilitation of terraced cultivation.The promoters of Proterra were originally motivated, quite understandably, by their passion for terraced countryside, which is typical of the Mediterranean. Such images express the identity of many rural areas with their typical "art de vivre" which also represents a certain art of landscaping.
Terraces are of use in the fight against natural disasters such as fires and flooding. They serve as the foundation for certain original and specific ecosystems. Terraces are the result of the shaping of the countryside by mankind. They outline the hillsides of southern Europe with marked differences according to geographic zones. Their size, architecture and use vary widely. The horizontal lines of the walls, the contrast between stones and crops and the historical
heritage attached to the terraces creates strong complex landscapes. They testify to the capacity of civilizations to adapt to environmental constraints and reflect the immense human effort, which brought about their birth.
The twelve demonstration projects which were carried out allowed for the examination of questions related to terraced cultivations from the following viewpoints:
> Terraces as innovative, motivating areas > High Quality agricultural production and diversification on the terraces > Engineering aspects of the rehabilitation of terraces, professional training and job creation > New openings for tourist and cultural use of the terraces.
Enriched by these experiences in the field, anetwork of trans-national cooperation has sought to link up the various participants in the programme through seminars, workshops, and a periodical information letter.
278
“Sustainable Management and Development of Mountainous and Island Areas”

The Proterra association was created in order to bring together the different partners and with the aim to attract more members.
Terraces, as a source of diverse, high quality agricultural produce
Terraces are first and foremost areas of agricultural production. Historically they are linked with multi-crop cultivation and even multiple activities.
Since the 1950s the terraces have beenprogressively abandoned in many areas as agriculture became more intensive and centered on plains. Indeed terraces are difficult to mechanize and often prove expensive to cultivate compared to other parcels of land. However, in recent years, new mechanical methods such as the chenillard and otherequipments and techniques adapted to terraceshave appeared.
The mechanization on the terraces does not always necessitate great investments; creating ways of sharing equipment can reduce costs. Certain improvements to the parcels of land (notably access ramps) can facilitate the use of mechanical means. These make work easier on rehabilitation worksites and help reduce the costs of farming.
Cultural techniques may also be adapted to terraced parcels of land, as is the case in the nature and details of organic composts.
Terraces open up real possibilities regarding diversification of produce as they constitute a rich agronomical heritage.
Terraces present particular advantages for agricultural production of high quality. The Proterra programme proved, in the case of apple growing, that a product cultivated on terraces is of higher quality than the same product cultivated on other parcels of land. Of course, cultivated terraces have particular advantages for organic cultivation, as a number of Proterra sites have shown.
Terraces, a new source of activity and employment
Terraces, through dry stone construction techniques, reflect complex and ancient know-how. These techniques can be found across all continents, with variations and local specificities. At the present time, in many regions, this know-how is disappearing. It is therefore necessary to organize the preservation of these techniques before it is too late. In order to transmit this know-how it must first be analyzed. Technical manuals covering regional know-how are precious sources of information. Renovation sites can become training areas in dry stone techniques.Experimental worksite schools have become references across Europe. By developing other ideas in the same style it is possible to preserve this know-how but the image of these professions and of their methods must be improved. Only then will the profession of the wall builder be able to develop. It should be possible to develop this profession, as there is already a demand for dry stone constructions in many regions.
Terraces, a potential for new tourist and cultural uses
Cultivated terraces often form spectacular landscapes, which strike the visitor’s imagination. This heritage value of the terraces constitutes, above and beyond their ecological and agricultural value, a rich potential for exploitation by finding new uses for these rural territories. Of particular interest are certain tourism and cultural activities such as
279
“Sustainable Management and Development of Mountainous and Island Areas”

environmental education, cultural tourism and agrotourism.
It would seem important, whenever possible, to maintain a double use of the terraces (agriculture and tourism) so as to retain the link between the Quality of the countryside and the Quality of the products, thereby ensuring better sustainability.
Stravolangada
Loading station of the emery cableway used to transport the emery from the area of the Koronos mines until the port of Moutsouna. It includes the engine station and the seven buildings of the emery miners. The area is dominated by the emery cableway with its towers climbing up the mountain of Ammomaxi.
The local pilot project of the Community of Koronos in the area of Sravolangada will include: 1. Topographic-Graphic Architectural Survey 2. Restoration of the paths and staircases of the area of the station 3. Restoration of dry-stone walls along the roads and the paths 4. Restoration of the seven buildings of the workers around the area to be used as information points and other tourist services 5. Provision of materials and transport for the above mentioned works 6. Realization of stop points – sitting places as well as watch points in the area 7. Informative panels and signs placing in the area
This local project is well fitted into the other projects under execution or planned by the local authorities for the whole area of the Community and as described above, it will serve as a pilot project for other similar works to be realized in all the mountainous Naxos.
The port of Lyonas
Until 1924 the port of Lyonas was used for the export of emery produced in the area of Koronos.
Installations in the port of Lyonas include the administration building, the miners’ workshop as well as other port installations.
The project under realization – with financing from the Seam-Ecos Overture Programme includes the restoration of the miners workshop to be used as a local information point for the coastal environment.
The Sarantara mine – The Emery Museum
The emery mines at Sarantara-Koronos have been abandoned in the last twenty years and there are plans for their restoration so they can be visited by tourists with the use of a small train. The small building in the picture below was built to serve as the Emery Museum of the area.
280
“Sustainable Management and Development of Mountainous and Island Areas”

BIBLIOGRAPHY
[1] MEDSTONE: Mediterranean based programme tasked with the preservation and economic utilization of dry-stone work landscape, 1999-2002.
[2] Pilot Programme prmoting the restoration and tourist utilization of the Emery mines are of Koronos, Naxos 2000-2002
[3] PROTERRA : Restoration of terraces in the koronos region, 2000-2001
[4] TRADIMA: Professional training course and seminar series in the potential for utilizing traditional materials in building restoration, 1998.
281
“Sustainable Management and Development of Mountainous and Island Areas”

The Influence of Shade Conditions on the Young Radius (Ring Width) Growth of Juniperus excelsa Bieb. Trees in the Central Part of Nestos
Valley in Northeast Greece
Elias Milios Elias Pipinis Petros Petrou
Democritus University of Thrace, Department of Forestry and Management of the Environment and Natural Resources, Pantazidou 193, 682 00 Orestiada, Greece
Abstract. In order to analyse the young radius (ring width) growth of Juniperus excelsa trees in the stands found in the slopes of Nestos valley, 32 trees growing under different shade conditions were cut. From each tree, a cross-sectional disc was cut and removed from a 0.3 m (stump height) level. In these discs the width of the rings, to the nearest 0.01 mm was measured up to the age of 20 years. The main results of this research indicate that the J. excelsa trees growing under shade and side shade did not exhibit substantial differences in ring width growth in their young age period as compared to the dominant trees, which grew scattered, under full light, without any severe competition. This growth behaviour seems to be the result of the favourable soil conditions under which the shaded and side shaded trees were established in combination with grazing which probably retarded the ring width growth of the dominant trees.
Keywords. Disturbance, grazing, Juniperus excelsa Bieb., ring width growth, shade.
1. Introduction
Juniperus excelsa Bieb. expands from the central and south Balkans through Anatolia to Crimea, central and southwest Asia and east Africa [3], [7], [29]. In Greece it is found as a component of degraded scrublands and as scattered individuals or as very small aggregations of trees in open forests of altitude between 50 and 1600 m. In some cases it has been observed in larger units of mixed or pure stands. There is no study concerning the ring width growth analyses of J. excelsa trees in the stump height (0.3 m). Only Ahmed et al., [2] present some data about ring width growth at breast height (1.3 m) of adult J. excelsa trees. This study refers to high altitude stands found in
Pakistan. In contrast, our research focuses on radius growth analyses of J. excelsa trees growing in stands in low altitudes in the western part of species expansion.
In the present study, the main objective is to analyse the young ring width growth of J. excelsa trees growing under different shade conditions, in stands located in the slopes of the central part of Nestos valley.
2. Materials and methods
2.1. Study sites
The study was carried out in the central part of Nestos river valley. This area is located in the south of central Rhodope mountains in the northwest region of Xanthi, which lies in northeast Greece close to the Bulgarian borders. Juniper stands are located in the east part of Pascalia public forest (41o 12’ to 41o 16’ N, 24o
29’ to 24o 38’ E). The altitude there ranges from 100 to 350 m. The closest meteorological stations are a) this of Echinos situated on an elevation of 300 m about 43 kilometres away from our area and b) that of Xanthi which lies on an elevation of 50 m approximately 36 kilometres away. On average, the annual rainfall in Echinos is 771 mm and the mean yearly temperature is 12.1 oC while the corresponding values for Xanthi are 580.6 mm and 15.4 oC. The climatic conditions describing Nestos valley are estimated to be in the middle of these two climates.
J. excelsa trees were cut in stands located in moderate south facing slopes. The substratum is limestone and the soils are sandy – clay and rocky [20]. In many cases surface appearances of parent material are observed. The sample stands consist of J. excelsa and species such as Quercus coccifera, Phillyrea latifolia, Fraxinus ornus,
282
“Sustainable Management and Development of Mountainous and Island Areas”

Paliurus spina – christy, Juniperus oxycendrusand Quercus pubescens.
In these stands there are a) scattered, too old, bad-formed J. excelsa trees of great dimensions b) dominant J. excelsa trees more or less scattered (under full light), without any severe competition (in most cases) and c) J. excelsatrees with small diameters, which are aggregated around and beneath the trees that have great dimensions or (in a few cases) around and beneath some dominant trees and which create dense groups of junipers with dense branches and foliage that reach the ground. Under and around the dense tree crowns there is soil rich in humus, as a result of plant litter. In these groups many trees grew in shade or side shade. In these same groups some dead trees in deep shade were also found [22].
The establishment of the trees growing in shade, side shade as well as of those that are dead in deep shade, was the result of the facilitation process. They were established under the facilitation of J. excelsa trees that have great dimensions or (in a few cases) of dominant J. excelsa trees (nurse plants) [22].
2.2. Sampling
Eight sample plots each of 200 m2
(10mx20m) respectively were established at random in four stands (2 sample plots were randomly established in each stand).
In these plots 8 dominant (=D), under full light, without competition J. excelsa trees, 8 shaded (=S), 8 side shaded (=SS) and 8 dead, under deep shade J. excelsa trees (=SM) were cut. In particular in each one of the eight plots (or in an area nearby to each plot) 1 D, 1 S, 1 SS and 1 SM tree were selected and cut, according to the stratified random sampling method.
2.3. Stem analysis and anthropogenic disturbance regime investigation
In all trees the north side of the stem was colour – marked before felling. From each tree a cross-sectional disc was cut and removed from a 0.3 m (stump height) level. These discs were taken to the laboratory in order to measure the width of the rings, to the nearest 0.01 mm, up to the age of 20 years, with an ADDO instrument (a stereoscope with a ring width measurement device) [28]. Annual ring increments were measured along a mean radius (which had all the rings) orientated approximately in the same
direction, in all cross sections, using the color mark as a guide [21].
Moreover, information related to the human activities and the vegetation form and composition (in the area) during the previous decades was accumulated through communication with elderly residents of nearby villages.
2.4. Statistical analysis
The effect of shade conditions on the radius length of D, S, SS and SM trees at the ages of 5, 10, 15 and 20 years, was tested using the Duncan test [30]. All statistical analysis was carried out using SPSS 12.0 (SPSS, Inc., USA).
3. Results
The age of SS trees at the time of the cutting ranged from 53 to 91 years, while the corresponding values of S, D, and SM trees were 52 – 78 years, 73 – 111 years and 23 – 60 years respectively.
At all ages (5, 10, 15 and 20 years) the SS trees had the highest radius length on average (than the other trees) while the SM trees had the lowest radius length (Table 1). At all ages a statistically significant difference existed on average between the SS and SM trees. At the ages of 15 and 20 the D trees on average exhibited higher radius length than SM trees with a statistically significant difference.
The prevailing disturbances in the entire Nestos Valley area are grazing and illegal cutting of branches and small dimension sprouts for the livestock feeding. These disturbances have taken place over a long period of time with various intensities and intervals. Nowadays, about 1000 goats occasionally graze in our stands. There is no exact quantitative data about the grazing pressure in the past. According to our information thousands of goats used to graze in J. excelsa stands with more or less the same intensity, during the 19th century.
4. Discussion
According to the ring width analysis there are no statistically significant differences among the radius length of SS, S and D trees growing in different shade conditions, at all ages.
The dominant (D) trees (in the first years of their life) showed relatively low ring width
283

growth possibly until the development of a deep root system, which could supply them with the adequate water and mineral nutrients [14].
Table 1. Multiple comparisons among the radius length means of J. excelsa trees growing under
different shade conditions.
Radius length (mm) Groups of treesunder
different shade
conditions
Mean 1S. D. Min Max
N
Age of 5 years SS 1.92a 0.597 1.03 3.16 8 D 1.49ab 0.767 0.73 3.21 8 S 1.55ab 0.534 0.71 2.45 8
SM 0.98b 0.248 0.53 1.25 8 Age of 10 years
SS 4.55a 1.361 2.84 6.72 8 D 3.70ab 1.679 1.95 6.56 8 S 3.39ab 1.228 1.78 5.68 8
SM 2.37b 0.853 1.28 3.99 8 Age of 15 years
SS 8.11a 1.949 5.83 11.83 8 D 6.78a 3.212 3.59 13.44 8 S 5.78ab 1.928 3.44 8.73 8
SM 3.74b 1.379 2.03 5.35 8 Age of 20 years
SS 11.33a 2.917 7.55 16.48 8 D 11.14a 5.633 6.20 22.73 8 S 8.54ab 2.724 5.26 12.59 8
SM 5.41b 2.211 2.94 9.50 8 Means, in a column, are statistically different at p<0.05, when they share no common letter. The comparisons were made using the Duncan test.1S.D = Standard Deviation
Even though a deep root system was essential for the SS and S trees too, it is likely that the favourable soil conditions (soil rich in humus and nutrients, as a result of the nurse plant litter) under which the S and SS trees were established [22], promoted the ring width increment of the shaded (S) and side shaded (SS) trees during the period after their establishment. This type of soil under the denser tree crowns of Juniperusthurifera (a related to J. excelsa species) appears to be the most favourable place to the species regeneration [15], [16]. Moreover, the superiority of SS trees in ring width growth compared to the other tree categories (even though there was not
a statistically significant difference from the D and S trees) is the result of the combination of side shade (which did not retard the growth of SS trees) with the favourable soil conditions that promote their growth. In the case of S trees the possible negative effect of shade did not lead to a great reduction in their ring width growth so as to exhibit statistically significant lower radius length (at all ages) than SS and D trees.
The facilitation of nurse plants is related to the creation of certain microhabitats with favourable microclimate, adequate amount of nurse plant litter, improved soil conditions and high soil fertility [13], [9], [6], [25], [17], [23], [31], [27].
A substantial way of facilitation is the protection of seedlings from grazing by nurse plants [18], [8], [5], [26]. The present existence of many grazed seedlings and saplings that grow under full light suggests that grazing damages probably retarded the growth of many D trees too. On the other hand the great variance (standard deviation), which was observed in the radius length values of D trees and the existence of trees with high radius length values (see table 1: maximum values) at all ages implies that a site factor (such as grazing could have been) did not affect each D tree in a uniform way. The dominant trees, which had high ring width growth, were probably established in periods of low grazing pressure (see the results). On the contrary, the SS and mainly the S trees were in some degree protected from grazing by the nurse plants.
Ahmed et al. [2] analysed the breast height (1.3 m) cross sections of 16 randomly selected J. excelsa trees from Zierat site in Balouchistan that had a dbh (breast height diameter) of 20 – 30 cm and found that even though there is a great variation among individuals, the overall (of all trees) mean annual ring width increment (m.a.r.w.i.) was1 mm. This value is by far higher than the m.a.r.w.i. of our trees (up to the age of 20 years) in all shade categories. In any case, it cannot be compared with our data due to the fact that it represents growth rates of breast height (different stage of tree development), of possibly dominant trees, which did not grow under shade and under the pressure of grazing.
J. excelsa is considered to endure shade in its first stages of life [1], [2], [12]. The low ring width growth of SM trees in the first years of their life does not imply that the J. excelsa does not endure shade, since the great ages of S trees (at the time of cutting) proves that J. excelsa has
284
“Sustainable Management and Development of Mountainous and Island Areas”

the ability to endure shade for many decades. In addition, the great age variation of dead, under deep shade (SM) trees suggests that either they confronted different shade conditions during their life or their death is the result of water deficiency or biotic factors such as insects and fungal diseases [11], [4], [19].
Ring width growth has a strong relationship with stand density and competitive conditions, since the radial growth is in low priority in the allocation of photosynthesis products compared to height growth [24]. On the contrary, height growth is strongly affected by site quality differences. As a result, a low radius growth does not necessary imply a reduced ability of surviving or a reduced height growth, but to a great extent indicates competition. Hence, the statistically significant difference between the mean radius length of SS and SM trees at all ages and between the mean radius length of D trees and SM trees, at the ages of 15 and 20 years, is the result of competition among the SM trees and their taller competitors.
Even though diameter (radial) growth has a strong relationship with stand density and competitive conditions, the dominant (D) trees did not as one would expect have the greatest radius length at the age of 20 years compared to the other groups of trees since they grew without any severe competition. Moreover, they did not exhibit statistically significant difference in ring width growth from the shaded trees (S) trees. This growth behaviour empowers the possibility that grazing (which can affect the growth of trees with over 1 m height) was one of the main reasons for the reduced ring width growth of D trees, since the period of 20 years is adequate for the development of a robust root system that can supply D trees with water and mineral nutrients.
5. Conclusions
The J. excelsa trees growing under shade and side shade did not exhibit substantial differences in ring width growth in their young age period compared to the dominant trees, which grew scattered without any severe competition in Nestos valley. This growth behaviour seems to be the result of the favourable soil conditions under which the shaded and side shaded trees were established in combination to grazing which probably retarded the ring width growth of dominant trees.
6. References
[1] Ahmed M, Ahmed I, Anjum PI. A study of natural regeneration of Juniperus excelsa M. Bieb in Baluchistan, Pakistan. Pakistan Journal of Botany 1989; 21: 118-127.
[2] Ahmed M, Shaukat SS, Buzdar AH. Population structure and dynamics of Juniperus excelsa in Balouchistan, Pakistan. Journal of Vegetation Science 1990; 1: 271-276.
[3] Athanasiadis N. Forest botany (in Greek) Part II. Thessaloniki; 1986.
[4] Augsberger CK. Light requirements of neotropical tree seedlings: A comparative study of growth and survival. Journal of Ecology 1984; 72: 777-795.
[5] Auld TD. Seedling survival under grazing in the arid perennial Acacia oswaldii.Biological Conservation 1995; 72: 27-32.
[6] Belsky AJ. Influences of trees on savanna productivity: Tests of shade, nutrients and tree-grass competition. Ecology 1994; 75(4): 922-932.
[7] Boratynski A, Browicz K, Zielinski J. Chorology of trees and shrubs in Greece. Poznan/Kornik; 1992.
[8] Callaway RM. Effect of shrubs on recruitment of Quercus douglasii and Quercus lobata in California. Ecology 1992; 73:2118-2128.
[9] Callaway RM, Nadkarni NM, Mahall BE. Facilitation and interference of Quercus douglasii on understory productivity in central California. Ecology 1991; 72: 1484-1499.
[10] Carus S. Increment and growth in Crimean Juniper (Juniperus excelsa Bieb.) stands in Isparta-Sütcüler region of Turkey. Journal of Biological Sciences 2004; 4: 173-179.
[11] Evans GC, Rackham O, editors. Light as an Ecological Factor. Oxford: Blackwell; 1966.
[12] Fisher M, Gardner AS. The status and ecology of a Juniperus excelsa subsp. polycarpos woodland in the northern mountains of Oman. Vegetatio 1995; 119: 33-51.
[13] Franco AC, Nobel PS. Interactions between seedlings of Agave deserti and the nurse plant Hilaria rigida. Ecology 1988; 69: 1731-1740.
[14] Fritts HC. Tree Rings and Climate. New York: Academic Press; 1976.
[15] Gauquelin T. Dagnac J. Caractéristiques édaphiques des groupements à Genévrier
285
“Sustainable Management and Development of Mountainous and Island Areas”

thurifère de Atlas marocains: étude des niveaux superficiels des sols sous couvert et hors couvert. Oecologia Mediterranea 1988; 14: 43-56.
[16] Gauquelin T, Bertaudiére V, Montés N, Badri W. Cycle biogeochimique et hétérogénéité édaphique des groupements forestiers pré-steppiques à Genévrier thurifère du Haut Atlas de Marrakech (Maroc). Ecologie 1998; 29: 177-180
[17] Holmgren M, Scheffer M, Huston MA. The Interplay of facilitation and competition in plant communities. Ecology 1997; 78 (7): 1966-1975
[18] Jaksic FM, Fuentes ER. Why are native herbs in the Chilean matorral more abundant beneath shrubs: microclimate or grazing? Journal of Ecology 1980; 68: 665-669.
[19] Kozlowski TT, Kramer PJ, Pallardy SG. The physiological ecology of woody plant. U.S.A.: Academic Press Inc.; 1991.
[20] Maragos N. Management plan (in Greek) of Pascalia public forest. Forest commission of Stavroupolis; 1998.
[21] Milios E. The influence of stand development process on the height and volume growth of dominant Fagus sylvaticaL.s.l. trees in the central Rhodope Mountains of north-eastern Greece. Forestry 2004; 77: 17-26.
[22] Milios E, Pipinis E, Petrou P, Akritidou S, Smiris P, Aslanidou M. Structure and regeneration patterns of the Juniperus excelsa Bieb. stands in the central part of Nestos valley on northeast Greece. Submitted for publication in Ecological Research.
[23] Moro MJ, Pugnaire FI, Haase P, Puigdefabregas J. Effect of the canopy of Retama sphaerocarpa on its understorey in a semiarid environment. Functional Ecology 1997; 11:425-431.
[24] Oliver CD, Larson BC. Forest Stand Dynamics. U.S.A.: John Wiley & Sons, Inc.; 1996.
[25] Pugnaire F, Haase P, Puigdefabregas J. Facilitation between higher plant species in a semiarid environment. Ecology 1996; 77: 1420-1426.
[26] Rousset O, Lepart J. Positive and negative interactions at different life stages of a colonizing species (Quercus humilis). Journal of Ecology 2000; 88: 401-412.
[27] Siemann E, Rogers WE. Changes in light and nitrogen availability under pioneer trees
may indirectly facilitate tree invasions of grasslands. Journal of Ecology 2003; 91: 923-931.
[28] Smiris P. Silviculture research of Chestnut forests (in Greek), Sci. Ann. Of Agric. For. Sch., Thessaloniki; 1991 15: 411-427.
[29] Strid A, Tan K, editors. Flora Hellenica. Koeltz Scientific Books; 1997.
[30] Toothaker LE. Multiple comparison procedures. Sage University, Paper series on Quantitative Application in the Social Sciences, no 07-089. Newbury Park, CA: Sage Publications; 1993.
[31] Wied A, Galen C. Plant parental care: Conspecific nurse effects in Fraseraspeciosa and Cirsium scopulorum. Ecology 1998; 79: 1657-1668.
286
“Sustainable Management and Development of Mountainous and Island Areas”

The Genetic Component of Biodiversity in Sustainable Forest Management
Aristotelis C. Papageorgiou Department of Forestry and Management of the Environment and Natural Resources, Democritus
University of Thrace, Pantazidou 193, GR-68200 Orestiada, Greece. [email protected]
Dimitrios Kasimiadis Department of Forestry and Management of the Environment and Natural Resources, Democritus
University of Thrace, Pantazidou 193, GR-68200 Orestiada, Greece. [email protected]
Konstantinos Poirazidis Department of Forestry and Management of the Environment and Natural Resources, Democritus
University of Thrace, Pantazidou 193, GR-68200 Orestiada, Greece. [email protected]
Efstathios P. Tsachalidis Department of Forestry and Management of the Environment and Natural Resources, Democritus
University of Thrace, Pantazidou 193, GR-68200 Orestiada, Greece. [email protected]
Abstract. The importance of genetic diversity for biodiversity conservation and management is recognized broadly. However, genetic parameters are usually missing from traditional conservation strategies and management plans. Here we present an approach where forest management considers the maintenance and enhancement of the evolutionary dynamics of forest ecosystems and therefore includes the conservation of genetic diversity – as a component of biodiversity – in its main targets. A theoretical model, which combines traditional forest management techniques with gene conservation, is presented. This model can become a useful tool for the evaluation of a forest ecosystem to maintain its levels of genetic diversity and adapt to future climate changes.
Keywords. Biodiversity, forest, genetics, management, sustainable.
1. Introduction
The term “biological diversity” or “biodiversity” is broadly used and can be found in various environmental and development policy texts, such as international conventions, reports of world summits, global and regional environmental action plans. Furthermore, biodiversity has become an important concept of
conservation biology and other theoretical and applied sciences, such as forestry, agriculture and wildlife biology. Haila and Kouki [18] report of a rapid increase in the numbers of publications applying the term “biodiversity” over the period 1984 – 1992.
The first definitions of biodiversity (biological diversity or biotic diversity) were presented by the U.S. Office of Technological Assessment [48], IUCN, UNEP and WWF [20] and the Convention on Biological Diversity (CBD), during the 1992 Earth Summit in Rio. After reviewing these definitions, one could have the impression that a reasonable consensus exists on the meaning of the term biodiversity, including mainly two elements [36]: biodiversity is viewed in three different levels, thus genes, species and ecosystems; biodiversity is used to describe the number, variety and variability of living organisms, embracing many different parameters, and becomes essentially a synonym of “life on earth”.
These definitions seem to be simple and easy to be understood by various stakeholders and decision makers, who design and implement strategies for the conservation of biodiversity. However, after the first attempts to apply conservation strategies on the ground, we realize that such definitions turn out to be of limited use in practice [34].
287
“Sustainable Management and Development of Mountainous and Island Areas”

Several conceptual problems concerning the boundaries between taxonomical entities, the parallel reference of different hierarchical levels and the over-simplified bias of considering species richness as the main measure of biodiversity are the main reasons for the failure of the early definition of biodiversity as a concept for both scientific research and environmental policy [36] [13] [34].
Most conservation strategies at all levels include three main steps of action (i.e. [20]): An assessment of biodiversity, the choice of the conservation object and the methodology to be used and finally the implementation of the measures decided. Due to our inability to measure biodiversity, most attempts are still at the first stage [14]. It is evident, that a new approach of biodiversity, other than the one of a measurable entity, needs to be adopted. There seems to be a consensus on the importance in maintaining the integrity and functions of ecosystems. This means that biodiversity conservation strategies should focus more on the “dynamic” character of nature than on the endless count and maintenance of biotic entities [49] [34].
2. The genetic component of biodiversity
While most definitions of biodiversity refer to three levels including ecosystems, species and genes, the latter one is usually not included in conservation strategies and other environmental policy texts. We rarely see a conservation plan that focuses on genes as the primary element for protection [36]. Several authors mention that genes are too difficult to assess and therefore cannot become the basic unit of biodiversity (i.e. [6]), although the significance of genetic diversity within species is recognized [47].
There are two different meanings of “genetic diversity” found in the biodiversity literature; a) specific genes that should be protected for their value for humanity (i.e. the wild relatives of crop plants, that are resistant to certain disease) and b) the genetic diversity itself, which should be considered for its importance against inbreeding and the accumulation of lethal recessive alleles in populations [36].
The first approach is seen from a human point of view and refers to specific entities that are needed for primary production. Such elements are necessary for breeding of agricultural and forest plants and can be dealt with gene banks and other similar static measures. The second
approach is closer to the genetic diversity of wild populations of species, but it does not meet the adaptability aspect; the fact that genetic diversity is the most important prerequisite for evolution of all species. Perlman and Adelson [36] claim that measurements of genetic diversity are summary statistics within a subdiscipline of population genetics and do not have any connection with the real world.
It is evident that several authors consider the conservation of the genetic component of biodiversity either impractical [6] or meaningless [36]. The mistakes these authors make can be summarized in two points:
a) they believe that an assessment of genetic diversity is needed prior to the planning of any gene conservation measure;
b) they consider the alleles and genotypes identified in the laboratories as the targets of gene conservation.
It is true that if the above-mentioned points are valid, no actual conservation measure for genetic diversity has a meaning. It is well known to the genetic scientific community, that the genetic diversity found in the laboratories refer to gene markers, thus genes, the phenotypes of which are strongly connected with their phenotypes. Most, of these genes are irrelevant with the so-called “adaptive genes” and play a rather non-significant role for the survival of a population or a species. For this reason, the effort to conserve a certain rare allele at a marker gene locus is meaningless. Furthermore, even if this would have a meaning, the assessment of all possible genes of all populations of a species is technically impossible.
However, the conservation of genetic diversity should aim at the maintenance of the adaptability of populations and not at the maintenance of a specific status quo [16] [53] [34]. The task of gene conservation has a dynamic and not a static character. We are interested in having the species evolve, adapt and change. We do not wish to keep nature in a museum and for this reason we cannot consider conserving the genetic variants rather than the genetic diversity. Furthermore, genetic studies are not the aim of conservation, but a tool to conserve genetic diversity. Genetic studies often reveal the evolutionary history of populations and their capability for adaptation under new environmental conditions [12] [33]. They further indicate the effects of specific human activities on the genetic diversity and can lead us to improvements of our techniques to manage
288
“Sustainable Management and Development of Mountainous and Island Areas”

nature and its resources. For these reasons, the consideration of the genetic component of biodiversity is of crucial importance for both, the development of conservation biological concepts and the planning of conservation strategies.
Management techniques that will prevent disturbances in critical ecological and genetic processes need to be developed [34]. A new concept is needed. Biodiversity research should not become a fragmented assessment of genetics, ecology and wildlife biology, based mainly on endless assessments. It should focus on the understanding of the main processes that keep biodiversity alive and allow evolution in space and time.
Instead of trying to assess all possible genetic variants, genetic research should go on performing research and providing information on [2]:
the incorporation of genetic criteria into more general management procedures, the extrapolation of appropriate strategies for most taxa from the results of studies of a few model cases, the identification of the genetic aspects that may become limiting for certain species types and the monitoring and evaluation of demographic processes.
Besides the targeted conservation of specific resources and units, biodiversity principles of all levels should be integrated into management techniques. Furthermore, biodiversity knowledge and understanding should be included in the principles needed for the planning of all nature related human activities. The challenge is to create space for all possible approaches on biodiversity that exist in our society.
3. The genetic component of biodiversity in forest management
Conservation of forest ecosystems has gained a significant part of conventions, treaties and action plans for biodiversity conservation. One major reason is the fact that forests are in many parts of the world the most “wild”, impressive and complex terrestrial ecosystems. Another reason could be the knowledge that forests are decreasing worldwide. Yet, the most important reason is probably the fact that forest science is the most developed applied on the ground nature management scientific discipline.
Following the arguments presented in the previous chapter, the conservation of forest genetic diversity cannot be seen separately from the general use and management of forest resources [34]. Each country and each region can have different approaches on the subject. The same happens with different parties of interest as well (sectors). Any forest genetic conservation effort should recognize these differences and adjust the measures designed with them.
Taking the available information in account, management techniques should be developed, aiming at the optimization of achieving multiple targets. The preservation of genetic diversity and the evolutionary adaptability of forest species should be included in these targets, in order to secure the long term functioning of forest ecosystems and the production of goods and services for society. This “management-based” approach of biodiversity – and genetic diversity – conservation is more likely to become effective, since it can reconcile the targets of forest management for production and biodiversity conservation (Figure 1). Sustainable forest management (SFM) can be organized, based on the need to secure the long-term persistence of forest ecosystems [34]. As a result, multiple targets can be achieved.
Figure 1. Biodiversity conservation is a prerequisite and not only a target of SFM
4. The maintenance of genetic diversity in managed forests
The maintenance of genetic diversity within managed forests depends on all evolutionary factors acting on the genetic structures of forest tree populations, such as selection, drift, migration and mutation. However, the most crucial factor for the maintenance of genetic diversity from one generation to the other is the mating system, thus the procedure of mating among the female and male parents within a forest tree population [35].
289
“Sustainable Management and Development of Mountainous and Island Areas”

Mating success depends on several different parameters that affect pollen production and movement, fertilization and zygote production. Pollen dispersal is a major component of gene flow in plant populations [16]. Although it lacks the colonization function of seeds, the potential for long-distance transport of male gametes greatly influences genetic processes that have central evolutionary implications, such as ‘isolation by distance’ within continuous populations and gene exchange among spatially isolated populations [52] [5] [11]. Pollen movement depends greatly on the structure of forest stands [31] [35]. Since stand structure is a parameter that can be altered through management techniques, we have developed a mating success model that connects the ability of pollen to move from the male flower to the female flower with classical forest stand parameters from one hand (such as distance between trees and stand mixture) and the genetic diversity of the next generation on the other. The key measure of this model is the “effective number of pollen parents” that fertilizes each tree with female flowers.
Effective population size is a parameter of central importance in evolutionary biology and conservation because it provides a predictive measure of the rate of loss of genetic diversity [51] [24]. Several statistical methods have been developed for the estimation of effective population size using data that derive from genetic analyses and gene markers. Here we will present an approach using stand characteristics only, avoiding the expensive, laborious and time consuming genetic analyses in the laboratory.
The model presented here considers three main components: (a) the estimation of the effective number of pollen fathers from classical forest stand measurements, (b) the correlation between the effective number of pollen parents with the genetic constitution of the pollen cloud of a specific female tree and (c) the connection between the allelic diversity of pollen cloud with the genetic diversity of the half sib progeny lot deriving from each tree. This methodology will allow the researcher to evaluate the ability of a specific stand structure to maintain its diversity in the next generation and subsequently will lead to the formulation of management directions using different forest management scenarios.
4.1. Effective number of pollen parents
The information needed to estimate the effective number of pollen parents can be summarized in a map of a forest stand. Distances between trees, tree species constitution, height and diameter should be known. Additional information about crown size (lower crown edge on the trunk, crown diameter, etc.) can give more prediction to this method. These measurements are usually taken in plots defined for the creation of forest management plans. More information on the mating system of the trees, such as flower phenology and synchronization, flower sex balance and flower production can optimize the methodology, but their estimation needs complicated and laborious measurements that cannot be performed for a large number of sampling plots. However, they can be used to verify the accuracy of the model in selected representative cases, where gene markers can be used as well.
The only mating information for the tree species comprising the studied plots needed for this methodology is the distance of pollen dispersal. Since early experimental attempts to estimate contemporary pollen dispersal in tree populations using traps or dyes [23] [25], a number of analytical procedures have been developed to make best use of effective pollen dispersal information derived from molecular marker assays [41]. Among them, those based on paternity analysis have been widely used to characterize spatial patterns of pollen dispersal in tree species [1] [4] [44] [7] [21] [45] [22] [38] [26] [3] [37]. In many instances, the result of such a study is an accurate “pollen curve” for a specific tree species in a specific area and under specific conditions [8]. This pollen curve shows the decline of the amount of pollen grains with increasing distance.
Numerous genetic studies provide an estimate of pollen dispersal within stands, i.e. [40] [42] [9]. Although effective pollen dispersal seems to be spatially restricted, the high density of adult trees maintains a rich pollen pool, even on small scales (tens of meters). As a consequence, each tree is being pollinated by a large number of pollen donors. The largest percentage of pollen reaches only a few tens of meters away from the source (male tree). However, there is always a smaller percentage of pollen that reaches larger distances, as the pollen curve finally extends parallel to the distance axis in an asymptotic way [35].
290
“Sustainable Management and Development of Mountainous and Island Areas”

Stand structure and species mixture seems to influence the pollen dispersal curves in various ways. It has been shown that higher local canopy closure in mixed forests may be associated with lower pollen pool diversity of the target species [10], and that it can also affect local genotypic composition of adult trees [15]. When density is reduced, there is a smaller number of nearby individuals dispersing pollen around a given tree, but, at the same time, there remains a relatively large number of more distant pollen donors, which continue adding their contributions to the male gamete cloud surrounding the tree [8]. These two facts may enlarge the proportion of long distance effective mating (a greater proportion of distant fathers will mate with a given individual when a smaller proportion of nearby trees occur), raising the average effective pollination distance. Moreover, reductions in canopy density may enhance air movement within forests [31], which would also contribute to increased pollen dispersal [9].
The information provided by the existing pollen dispersal curves for species belonging to the same genera are often similar. Thus, in most managed forest trees, there is available information that can be used for the estimation of the effective number of pollen parents through the method of this study. The pollen dispersal curves reveal the percentages of pollen from a male tree that reach certain distances away from this tree. Transferring this information on a map, we can create homocentric cycles for each tree, each one declaring a different percentage of pollen amount reaching the distance where the cycle is drawn. The choice of the percentages for which these cycles will be drawn can vary according to the species and the pollen dispersal curve. Obviously, those percentages should be chosen, that mark significant changes in the steepness of the pollen curve.
The map of the stand including the pollen dispersal cycles is used for the definition of the pollen parents fertilizing a female tree. Each female flowering tree is located within one or more pollen dispersal cycle(s) belonging to one or pollen father(s) depending on their distance. Using this technique, not only the number of possible pollen parents can be counted (the number of pollen parents that are close enough to pollinate the specific tree), but also the percentage of the contribution of each pollen parent in the pollen cloud of the female tree can be estimated. For each female tree, the percentage cycle of each putative pollen parent is
described. These percentages are summed up and each pollen parent is characterized by a frequency of contribution to the pollen cloud, here symbolized pm. Thus, each pollen cloud of each female tree is characterized by the frequencies of the contributing pollen parents (pm1, pm2, … , pmn for the first, second and nth
pollen parent respectively). For each pollen cloud we have:
n
iipm
11 (1)
Each pollen cloud that pollinates a female tree is characterized by a specific pollen structure according to the pollen parents participating in it. Distant pollen parents will have a smaller contribution, while close pollen parents will influence the genetic constitution of the pollen cloud much more significantly. Based on these frequencies, an “effective number of pollen parents” can be estimated:
n
ii
e
pmNm
1
2
1 (2)
This measure defines the number of frequent pollen parents, thus the number of trees with male flowers that have a significant influence on the structure of the pollen cloud. The minimum value of the effective number of pollen parents is 1 when only one male tree contributes to the pollen cloud, while its higher value reaches the number of pollen parents, in the case when their contribution is equal.
After estimating the effective number of pollen parents for each female tree in a given plot, an average value over all trees can be estimated and used to describe the specific forest structure.
4.2. The genetic constitution of the pollen cloud
Pollen, the dominant vector of gamete exchange for most temperate tree species [11], determines the distribution of genotypes within and between populations. Restrictions in pollen movement can result in increasing isolation by distance among populations ([52] [28] [46]) with pollen pools having increased proportions of gametes from local pollen donors. Furthermore, extinction / recolonization events may further promote the creation of genetic structure in a pattern conforming to isolation by distance ([39] [50]). Conversely, extensive pollen movement
291
“Sustainable Management and Development of Mountainous and Island Areas”

overcomes local genetic differentiation resulting in populations that are in genetic equilibrium. Because pollen movement influences the creation, maintenance and erosion of genetic structure in adult populations, it is important to understand what factors influence the process of pollen movement [17]. Only through direct examination of the genetic structure of the pollen pool, can we gain insight into the scale of and the factors that influence pollen.
Pollen cloud heterogeneity depends on the effective number of pollen parents and the genetic differentiation these pollen parents have to each other. Independently seen from the genetic diversity of the parent stand, a large number of pollen parents increase the probability for two pollen grains of a pollen cloud to carry different alleles. Thus, the larger the effective number of pollen parents in a pollen cloud, the higher the genetic diversity of this pollen cloud. This relationship is direct. The genetic diversity existing within the parent stand defines the steepness of this relationship. Thus, the larger the diversity of the parent stand the more rapid the increase of the genetic diversity of the pollen cloud with the increase of the effective number of pollen parents. For this reason, we can safely assume that the number of effective pollen parents is positively related with the genetic diversity of the pollen cloud.
4.3. The genetic diversity of the progenies
The genetic structure of the pollen cloud fertilizing a tree with female flowers has a direct influence on the genetic diversity of the half sib progeny set this tree will produce. In order to quantify this relation we need to separate the alleles carried by the gametes in the pollen cloud in “maternal type” when they are similar to the alleles existing in the genotype of the female tree or “non-maternal type”, when these alleles are of different type than the ones existing in the genotype of the female tree. Previous studies have shown that only “non-maternal type” alleles increase heterozygosity in the progeny set [32].
Considering a sexually reproducing tree that is heterozygous at a specific gene locus A, its genotype is ji AA , where ji . This tree produces gametes of a specific sex, carrying the alleles iA and jA . We symbolize as ip and jpthe probability of a specific gamete, produced by
the organism, to carry allele iA and jA ,respectively and their relationship is:
1ji pp (3)
We further use the symbols ip and jp to describe the probability of a gamete of the opposite sex, that fertilizes successfully the given tree, to carry alleles iA and jA , respectively. Their relationship is then:
1kji ppp (4)
kp stands for the probability of a gamete, that fertilizes successfully the tree, to carry allele
kA , jik , . kA is the symbol for any allele in the gamete pool that is of different type than the alleles carried by the parent tree. Thus, the probability kp is the sum of the probabilities of all “non-parental-type” alleles to fertilize successfully the tree.
A heterozygous zygote occurs when two gametes carrying different allele types fuse. The probability of a progeny of this organism to be heterozygous (Phet) at the gene locus A will be:
jjiihet ppppP 11 (5)
By replacing ip and jp in equation (5) by equation (4) we then obtain:
kijkjihet ppppppP
kjijkiji pppppppp =
ijjikji ppppppp .Because of equation (3), this is simplified to
ijjikhet pppppP (6) Under the assumption of normal segregation
at the specific gene locus A, as described in the second law of Mendel, we consider
21
ji pp . Equation (6) will then become:
ijkhet pppP 21
21
kk pp 121 ,
and finally khet pP 2
121 (7)
The case of a homozygous parent ii AA is straightforward, since all parental gametes carry allele iA and all non-parental gametes, that fertilize the parent and carry any allele different than iA , are kA . Thus, the probability of a progeny of a homozygous parent to be heterozygous is:
khet pP (8)
292
“Sustainable Management and Development of Mountainous and Island Areas”

Equations (5) and (6) indicate that the heterozygosity of an individual progeny set depends solely on the frequency of the non-parental-type alleles in the gamete pool fertilizing the parent ( kp ), under the assumption of normal segregation during gamete production.
kp depends on the abundance of allele kA in the population and the mating system parameters that shape the allelic frequencies in the gamete pool. Hence, kp expresses the ability of an organism to produce heterozygous progenies and reflects the combined effect of the allelic diversity in a population and the ability of the mating system to increase heterozygosity in the next generation.
The progeny heterozygosity reaches its maximum, when kp equals 1, when the alleles carried by the successfully fertilizing gametes are of different type than the alleles of the parents. In contrast, when only parental-type alleles exist in the individual gamete pools in a population, then the heterozygosity of a population in the progeny generation reduces to the half of the one in the generation of the parents, as it is observed by numerous authors in the case of self-fertilization in plants [29].
In the case of a heterozygous parent, kp becomes 0 when the gene locus has only two
alleles and thus, the heterozygosity of the progeny of all heterozygous parents will be 1/2, regardless of the allelic frequencies in the gamete pools. This is in agreement with the observations described in previous studies [32]. Hence, changes in the population heterozygosity from generation to generation, at diallelic loci, can occur only through the progenies of the homozygous parents [29] [54].
The correlation between the allelic frequencies in the gamete pool fertilizing an individual and the heterozygosity of its progeny applies to all sexually reproducing diploid organisms and all nuclear gene loci. Viewed at the population level, this correlation describes the way heterozygosity is inherited from one generation to the next, without any assumptions concerning the randomness of mating [32]. This approach can be used in both theoretical studies and experiments, by means of gene markers, that measure the levels of heterozygosity in populations and individuals. Knowing the ability of an individual parent to produce heterozygous progenies can be helpful in the development of breeding programmes and conservation strategies
for endangered species. Furthermore, the comparison of heterozygosity between subsequent generations at the level of single parents and their progeny sets can be used for the description of mating systems, the performance of paternity analysis and the determination of expected fitness values when balanced selection is assumed.
5. Discussion
There is growing evidence that supports the idea that rational use of forest resources, rather than sequestering them, may be an effective option for the long-term conservation of many forest ecosystems [8] [37].
The work described here has shown that novel theoretical approaches to complex genetic processes can provide forest managers with valuable information that can inform conservation planning. Several studies on the genetic structure of pollen clouds in managed stands [43] indicate that small changes in landscape context can influence pollen movement. Silvicultural treatments, such as the creation of clearings and the thinning of the forest can promote changes in the density of the forest that subsequently alter the pattern of pollination and cause changes in the genetic structure of the next generation [37].
Here we expressed the influence of the stand structure on pollen movement and finally on the genetic diversity of the progeny using a theoretical approach. First, the stand structure parameters have resulted in the measure of the effective number of pollen parents. Then we can give each stand a “grade” for its connectivity between generations, using the fact that more effective pollen parents produce more “non-maternal type” alleles, which produce more heterozygous progenies in the next generation.
Extrapolating this information, we can for certain species in certain areas adjust a level of “genetic diversity maintenance” to a specific forest structure measure such as stand density, species mixture, crown projection and size, etc. Furthermore, using GIS and mapping techniques, we can describe the ability of larger areas to maintain their genetic diversity and identify the specific stands that have a structure that could be problematic in this concern.
This theoretical approach can be applied in all forests where stands and their structure are described through classical forest biometrical measures and the main pollination parameters
293
“Sustainable Management and Development of Mountainous and Island Areas”

(distance, curves) of the main tree species are available. This methodology provides a useful tool to forest managers, not only for identifying problematic stands and taking action to protect genetic diversity, but also for evaluating different management scenarios towards the conservation of genetic diversity in their forests. This approach is simple and more important cheap, as genetic laboratory analyses using DNA markers are not needed. However, researchers should often control the validity of this model through genetic studies in characteristic stand structures, management situations and areas. Furthermore, more detailed information on the mating behavior of trees in an area can improve the accuracy of this model and contribute towards the effective protection of genetic diversity within managed forests.
Acknowledgements
The present study was supported by the research project “EPEAEKII - PYTHAGORAS II: 1329-1”, co-funded by the European Social Fund & National Resources. The authors wish to thank Timo Pukkala and Marc Palahi for useful discussions and advice.
References
[1] Adams WT. Gene dispersal within forest tree populations. New Forest 1992; 6: 217-240.
[2] Boshier DH, Young AG. Forest conservation genetics: Limitations and future directions. In: Young A, Boshier D, Boyle T, editors. Forest Conservation Genetics: Principles and Practices. CSIRO Publishing, Australia; 2000. p. 289-297.
[3] Burczyk J, Adams WT, Moran GF, Griffin AR. Complex patterns of mating revealed in a Eucalyptus regnans seed orchard using allozyme markers and the neighbourhood model. Mol Ecol 2002; 11: 2379-2391.
[4] Burczyk J, Adams WT, Shimizu JY. Mating patterns and pollen dispersal in a natural knobcone pine (Pinus attenuata Lemmon.) stand. Heredity 1996; 77: 251-260.
[5] Crawford TJ. The estimation of neighbourhood parameters for plant populations. Heredity 1984; 52: 273-283.
[6] Dobson AP, Conservation and Biodiversity. New York: Scientific American Library; 1995.
[7] Dow BD, Ashley MV. Factors influencing male mating success in bur oak, Quercus macrocarpa. New Forest 1998; 15: 161-180.
[8] Dutech C, Sork VL, Irwin AJ, Smouse PE, Davis FW. Gene flow and fine scale genetic structure in a wind-pollinated tree species, Quercus lobata (Fagaceae). American Journal of Botany 2005; 92(2): 252-261.
[9] Dyer RJ. Contemporary pollen movement in shortleaf pine, Pinus echinata Mill. Ph.D. Dissertation, Department of Biology, University of Missouri, St. Louis; 2002.
[10] Dyer RJ, Sork VL. Pollen pool heterogeneity in shortleaf pine Pinus echinata Mill. Mol. Ecol. 2001; 10: 859-866.
[11] Ennos RA. Estimating the relative rates of pollen and seed migration among plant populations. Heredity 1994; 72: 250-259.
[12] Finkeldey R. Die Bedeutung allelischer Profile für die Konservierung genetischer Ressourcen bei Waldbäumen. Göttinger Forstgenetische Berichte 1993; 14: 1-176.
[13] Gaston KJ. What is biodiversity? In: Gaston KJ, editor. Biodiversity: A Biology in Numbers and Difference. Oxford: Blackwell Science; 1996 p. 1-12.
[14] Gaston KJ. Species richness: Measure and measurement. In: Gaston KJ, editor. Biodiversity: A Biology in Numbers and Difference. Oxford: Blackwell Science; 1996 p. 77-113.
[15] Gram WK, Sork VL. Population density as a predictor of genetic variation for woody plant species. Conserv. Biol. 1999; 13: 1079-1087.
[16] Gregorius H-R. Gene conservation and the preservation of adaptability. In: Seitz A, Loeschke V, editors. Species Conservation: A Population – Biological Approach. Basel: Birkhäuser Verlag; 1991 p. 31-47.
[17] Gregorius HR. Measurement of genetic differentiation in plant populations. New Forests 1992; 6: 276-285.
[18] Haila Y, Kouki J. The phenomenon of biodiversity in conservation biology. Ann. Zool. Fennici , 1994; 31: 5-18.
[19] Holsinger KE. Pollination biology and the evolution of the mating systems in flowering plants. Evolutionary Biology 1996; 29: 107-149.
294
“Sustainable Management and Development of Mountainous and Island Areas”

[20] IUCN, UNEP and WWF. Caring for the Earth: A Strategy for Sustainable Living. Gland: IUCN; 1991.
[21] Kaufman SR, Smouse PE, Alvarez-Buylla E. Pollenmediated gene flow and differential male reproductive success in a tropical pioneer tree, Cecropia obtusifolia Bertol. Moraceae): a paternity analysis. Heredity 1998; 81: 164-173.
[22] Konuma A, Tsumura Y, Lee CT, Lee SL, Okuda T. Estimation of gene flow in the tropical-rainforest tree Neobalanocarpus heimii (Dipterocarpaceae), inferred from paternity analysis. Mol Ecol 2000; 9: 1843-1852.
[23] Koski V. A study of pollen dispersal as a mechanism of gene flow in conifers. Commun Inst For Fenn 1970; 70: 1-78.
[24] Lande R, Barrowclough GF. Effective population size, genetic variation and their use in population management. In: Soule M, editor. Viable Populations for Conservation; Cambridge University Press, New York; 1987, p. 87-124.
[25] Levin DA, Kerster HW. Gene flow in seed plants. Evol Biol 1974; 7: 139-220.
[26] Lian C, Miwa M, Hogetsu T. Outcrossing and paternity analysis of Pinus densiflora (Japanese red pine) by microsatellite polymorphism. Heredity 2001; 87: 88-98.
[27] Makarieva AM. Variance of protein heterozygosity in different species of mammals with respect to the number of loci studied. Heredity 2001; 87: 41-51.
[28] Malécot G. Isolation by distance. In: Morton NE, editor. Genetic Structure of Populations. Honolulu: University of Hawaii Press; 1973. p. 72-75.
[29] Mitton JB, Schuster WSF, Cothran EG, De Fries JC. Correlation between the individual heterozygosity of parents and their offspring. Heredity 1993; 71: 59-63.
[30] Müller-Starck G. Inheritance of isoenzymes in European beech (Fagus sylvatica L.). J Hered 1993; 84: 291-296.
[31] Okubo A, Levin SA. A theoretical framework for data analysis of wind dispersal of seed and pollen. Ecology 1989; 70: 329-338.
[32] Papageorgiou AC. Genetische Untersuchungen zur Züchtung und Generhaltung bei der Mittelmeerzypresse (Cupressus sempervirens L.) in Griechenland. Göttingen Research Notes in Forest Genetics 1995; 18: 1-191.
[33] Papageorgiou AC. Genetic structure of Mediterranean tree species as influenced by human activities. IUFRO Information Bulletin for Developing Countries 1997; 1: 12-16.
[34] Papageorgiou AC, Arabatzis G, Tampakis S. Forest Development and Biodiversity in the Enlarged European Union. In: Hellas 2003: Events and Activities in the Forest Sector. CD-ROM, Hellenic Ministry of Agriculture; 1991.
[35] Papageorgiou AC, Kasimiadis D, Leinemann L. Influence of within-stand factors on the genetic structure of the seed production of a forest. In: Proceedings of the Hellenic Scientific Society for Plant Genetics and Breeding. Athens; 2006 (in press).
[36] Perlman DL, Adelson G. Biodiversity: Exploring Values and Priorities in Conservation. Malden, Massachusetts: Blackwell Science; 1997.
[37] Robledo-Arnuncio JJ, Smouse PE, Gil L, Alıá R. Pollen movement under alternative silvicultural practices in native populations of Scots pine (Pinus sylvestris L.) in central Spain. Forest Ecology and Management 2004; 197: 245-255.
[38] Schuster WSF, Mitton JB. Paternity and gene dispersal in limber pine (Pinus flexilis James). Heredity 2000; 84: 348-361.
[39] Slatkin M. Gene flow and genetic drift in a species subject to frequent local extinction. Theoretical Population Biology 1977; 12: 253-262.
[40] Smouse PE, Dyer RJ, Westfall RD, Sork VL. Two-generation analysis of pollen flow across a landscape. I. Male gamete heterogeneity among females. Evolution 2001; 55: 260-271.
[41] Smouse PE, Sork VL. Measuring pollen flow in forest trees: a comparison of alternative approaches. Forest Ecol Manage 2004; 197: 21-38.
[42] Sork VL, Davis FW, Smouse PE, Apsit VJ, Dyer RJ, Fernandez JF, Kuhn B. Pollen movement in declining populations of California valley oak, Quercus lobata: where have all the fathers gone? Mol. Ecol. 2002; 11: 1657-1668.
[43] Sork VL, Smouse PE, Apsit VJ, Dyer RJ, Westfall R.D. A two-generation analysis of pollen pool genetic structure in flowering dogwood Cornus florida (Cornaceae), in
295
“Sustainable Management and Development of Mountainous and Island Areas”

the Missouri Ozarks. American Journal of Botany 2005; 92(2): 262-271.
[44] Stacy EA, Hamrick JL, Nason JD, Hubbell JD, Foster RB, Condit R. Pollen dispersal in low-density populations of three Neotropical tree species. Am Nat 1996; 148: 275-298.
[45] Streiff R, Ducousso A, Lexer C, Steinkellner H, Gloessl J, Kremer A. Pollen dispersal inferred from paternity analysis in a mixed oak stand of Quercus robur L. and Q. petraea (Matt.) Liebl. Mol Ecol 1999; 8: 831-841.
[46] Turner MC, Stephens JC, Anderson WW. Homozygosity and patch structure in plant populations as a result of nearest neighbor pollination. Proceedings of the National Academy of Sciences of the USA 1982; 79: 203-207.
[47] United Nations Environmental Programme (UNEP). Global Biodiversity Assessment. Cambridge: Cambridge University Press; 1995.
[48] U.S. Office of Technological Assessment. Technologies to Maintain Biological Diversity. Washington D.C.: United States Government Printing Office; 1987.
[49] Western D. The biodiversity crisis: A challenge for biology. Oikos 1992; 63: 29-38.
[50] Whitlock MC, McCauley DE. Some population genetic consequences of colony formation and extinction: genetic correlations within founding groups. Evolution 1990; 44: 1717-1724.
[51] Wright S. Evolution in Mendelian populations. Genetics 1931; 16: 97–159.
[52] Wright S. Isolation by distance under diverse systems of mating. Genetics 1946; 31: 39-59.
[53] Ziehe M, Gregorius H-R, Glock H, Hattemer HH, Herzog S. Gene resources and gene conservation in forest trees: General concepts. In: Scholz F, Gregorius H-R, Rudin D, editors. Genetic Effects of Air Pollutants in Forest Tree Populations. Berlin - Heidelberg: Springer; 1989 p. 173-186.
[54] Ziehe M, Hattemer HH. The significance of heterozygosity in tree breeding and gene conservation. Forest Tree Improvement 1998; 26: 3-25.
296
“Sustainable Management and Development of Mountainous and Island Areas”

Weight dams for water saving in torrents: Sustainable utilization of water as
the solution for water shortages at Cyclades islands
Pavlidis Th.1 Marinos D.2 Maris F.3
1 Aussistant Professor, Aristotelian University of Thessaloniki, School of Forestry & Natural Environment, P.O. 268 Thessaloniki Hellas, [email protected]
2 Phd , Torrentialist & Environmentalist, Democritus University of Thrace, Department of Forestry & Management of the Environment & Natural Resources, 193 Padazidou str. Gr-68200 Orestiada,
Hellas, [email protected] Lecturer, Democritus University of Thrace, Department of Forestry & Management of the
Environment & Natural Resources, 193 Padazidou str. Gr-68200 Orestiada, Hellas, [email protected]
Abstract. Cyclades islands is a region of Greece with the biggest water problem. The islands are situated directly under the rainshadow of the Pindos mountain range and for this reason they are the region of Greece with the lowest heights of rain. This problem can be solved with the construction of weight dams at the torrents of the islands to keep the surface water that otherwise is «lost» at the Aegean Sea. In the present paper we present some examples of these kind of dams that -as we strongly believe and suggest- are the permanent solution for the water problem of the islands.
Keywords. Aeiforical water utilization, dams of soil, eternal use of water, water saving,.
1. Introduction
These kinds of constructions have been examined, studied and prepared in relevant scientific research programs of Aristotelian University of Thessaloniki (AUTH). They are products of applied research and pilot projects held by the Department of Forestry and Natural Environment (AUTH) at many places in Greece. One of these projects was applied at the island of Crete, a place with characteristics (climatic and torrential) similar to these of the Cyclades islands. The dams presented have been constructed at the center of Crete in the Municipality of “Nikos Kazantzakis” (villages Armanogeia, Damania) [1]. The experience gained from Crete can be applied to Cyclades because the case of Crete is very similar to that of Cyclades.
2. Meteorological-Climatic research
Our meteorological-climatic research uses meteorological data from the meteorological stations that are situated near the research areas. The station that has the nearest situation to the research area is named the basic meteorological station and is used as basis for the annual water balance calculation of the torrent researched.
3. Water Balance research
Work begins with the annual water balance calculation of the torrent. Water balances of the torrent are calculated for the period of years that exist measurements from the basic station. The years that are important are the ones with the highest, the lowest and these with the mean heights of rain. In the end we pinpoint the driest, mean and wettest year of the period of time examined, but the volumes of water are calculated for all the years of the period. To be sure of the results three different methods of Water Balance Determination are used.
4. Dam situation and dimension estimation
The dam is constructed at the lowest parts of the main bed of the torrent at the most suitable place. Our aim is to hold the bigger amount of water with the lowest construction cost. This happens when the main bed of the torrent
297
“Sustainable Management and Development of Mountainous and Island Areas”

narrows while at the nearest upper part is more wide. All places that are convenient have to be found and the possible construction costs and the amount of water that can be held in each one has to be examined. Normally 5 to 7 possible construction sites are examined for each dam. It is important that appropriate construction materials (clay, stone, wood etc) are found nearby so that the transport expenses are reduced. Another thing that is important is that the dam should be situated at the nearest place from the areas in which use of the water will be made. It is in our interest that the geological formation of the area has small penetration of water to minimize the loss of water. When the search is completed the possible construction costs are calculated with the view to achieving the lowest possible construction cost.
5. Dam designs
The dam designs presented are the result of the Research project of Aristotelian University of Thessaloniki as applied in Crete. They are weight dams made of soil that can hold approximately 500.000m3 of water, amount that can be stored at the torrents of Cyclades islands with the same type and size of dams.
Figure 1. Width cross-sections of irrigation- flood control dam of Armanogeia ([1]Municipality “N. Kazantzakis” Irakleio, Crete)
Figure 2. Length cross-sections of irrigation- floodcontrol dam of Armanogeia
([1]Municipality “N. Kazantzakis” Irakleio, Crete)
Figure 4. Cross-section of water-carrier irrigation- flood control dam of Armanogeia ([1]Municipality “N. Kazantzakis” Irakleio, Crete)
Figure 5. Topographic diagram from the irrigation- flood control dam of Armanogeia ([1]Municipality “N. Kazantzakis” Irakleio, Crete). The dam appears at the bottom of the figure.
6. Conclusion
These types of dams can be successfully applied to the islands of the Cyclades complex. These islands face serious water shortages, especially in summer. Yet, they have enough rain to save quantities of water to eliminate the scarcity of water at the islands. During summer the need of water per person for each day is in average about 80 liters [2].
7. References
[1] Research of torrential conditions and application of a complete hydronomic arrangement at Municipality “N. Kazantzakis”. Aristoteleian University of Thessaloniki, Research Committee 2002-2004.
[2] Koloulas D., 1997: Torrent arrangement (Mountain Hydronomics I). Thessaloniki
1:1
1:3
1:31:3
1:3
334,46
331,5
332,0
331,51:1
1:3
1:3
1:3
TOMH 4 - 4 (0 +105,0)
1:3
1:3
1:1
1:3
1
2
3
4
5
1
2
3
4
5
331,46 1:1 334,5
335,86
1:1
1:1334,8
334,27334,4
1:3 +344,0m
1:3
+344,0m
3 - 3 (0 +85,0)
331,0
334,0
340,0
331,48
340,0
331,99
335,4
1:200
340,0
335,0
328,0
333,82332,84
332,83
348,0
337,4
TOMH 5-5 (0 +125,0) 1:200
+344,0m
340,0
348,0
340,0
335,9
348,0
340,0
334,96
329,77
1:3,0348,0 348,0
334,7337,1
1
1:3,0A 344,90
337,0334,0
331,0
328,0 328,0
333,0329,77
329,45 700
3
340,8
344,54
* ( )
300
1(0
+45
)
2(0
+65)
3 (0
+85
)
4 (0
+10
5)
5 (0
+12
5)
6 (0
+14
5)
7 (0
+16
5)
8 (0
+18
5)
9 (0
+20
5)
11 (0
+23
3)
10 (0
+22
5)
340,0
344,0
342,54
1
347,0
344,0
2
345,0346,0
343,0
342,0
3
341,0
d=30cm
339,0
338,0
335,5
334,5
4
336,3336
(2,0x1,0x0,5)
5
:+344,9m
AMPELI
KO
ITH--->
KO
ITH--->
KO
ITH-- ->
<---KOITH
"A1
"A2
"A3"A4 "A5
"A6 "A7
"A8
"Y99
"Y78
"Y65
"E1
"E45
"E44
"E43
"E42
"Y164
"Y165
"Y159
"E40
"E39
"Y95
"Y73
"Y76
"Y51
"Y50"Y64
"E5
"Y55
"Y72
"Y52
"E4
"E3
"Y54
"Y53
"E2
9 (0
+20
5,0)
i= 0
,080
95
340,0
d=20,0cm.
d=30cm.
3
8
3
i= 0
,080
95
i= 0,08095
6
15,04
5
45
5,0
5 (0
+12
5,0)
6 (0
+14
5,0)
1 (0
+45,
0)
2 (0
+65
.0)
1:3
3 (0
+ 85
,0)
1:3
700mm d=0.6mm, l= 166,0m
300mm A 5,0mm, l=126,0m
7 (0
+16
5,0)
1:3
8 (0
+18
5,0)
9 (0
+20
5,0)
11 (0
+23
3,0)
10 (0
+22
5,0)
10 (0
+22
5,0)
11 (0
+23
3,0)
Q=30m /sec
700mm
AN
AN
TH
340,0
20mm
Q=1,44m sec
d=0.6mm, l= 166,0m
20
1:3
3
1:3
344,0
344,0
1:3
344,0
344,9m
344,0m344,0
1 (0
+45,
0)
4 )0
+ 10
5,0)
348,0
5 (0
+12
5,0)
2 (0
+65
.0)
1:3
5
5
0,3
0,3
3 (0
+ 85
,0)
3
4 )0
+ 10
5,0)
300mm A 5,0mm, l=126,0m
348,0
7 (0
+16
5,0)
1:3
8 (0
+18
5,0)
1:3
1:3
1:3
6 (0
+14
5,0)
344,0m
7 (0
+16
5,0)
8 (0
+18
5,0)
10 (0
+22
5,0)
9 (0
+20
5,0)
344,9m
11 (0
+23
3,0)
5 (0
+12
5,0)
6 (0
+14
5,0)
298
“Sustainable Management and Development of Mountainous and Island Areas”

Mapping the Animal Biodiversity in the Dadia National Park using Multi-Criteria Evaluation Tools and GIS
Konstantinos Poirazidis Department of Forestry and Management of the Environment and Natural Resources, Democritus
University of Thrace, Pantazidou 193, GR-68200 Orestiada, Greece. [email protected]
Aristotelis C. Papageorgiou Department of Forestry and Management of the Environment and Natural Resources, Democritus
University of Thrace, Pantazidou 193, GR-68200 Orestiada, Greece. [email protected]
Dimitrios Kasimiadis Department of Forestry and Management of the Environment and Natural Resources, Democritus
University of Thrace, Pantazidou 193, GR-68200 Orestiada, Greece. [email protected]
Abstract. There is a growing interest for multi-purpose forest management where wood production, ground water protection, biodiversity, and recreation are considered equally important objectives. The assessment of biodiversity for four taxa of animal species (micro-mammals, birds, herpetofauna and orthoptera) being the main prey for the unique raptor assemblage in the Dadia National Park was done applying the Multi-Criteria Evaluation (MCE) approach and using subjective knowledge of suitability with the IDRISI 32 software. FUZZY linear functions were used to evaluate the membership values (possibilities) in order to standardize factor images of eleven (11) critical environmental requirements identified for these animal taxa. A MCE module has been used with a 0-255 level standardization and in our area the values ranged from 79 to 220. The richest regions in terms of biodiversity were in the lowlands and the plains, while the mountainous regions received lower values.
Keywords. Biodiversity, Multi-Criteria, Fuzzy,habitat suitability map, Greece
1. Introduction
The objectives set for forestry are more diverse than in the past. Values such as recreation and conservation of biodiversity have gained prominence alongside traditional wood-production values. Due to their ecological, economic and social complexity, forests possess different values and meanings for different social
groups [20]. Balancing between conservation and production, forestry is called to provide for the production of goods and services in the long run. Nowadays, a great deal of discussion is made worldwide about the conservation of the biodiversity. Biological diversity is a complex issue, as is the implementation of diversity preservation in forest management. In most cases, both the changes in the ecosystems and decline in biodiversity are due to human activities [23].
In Greece, the intensification of human activities during the last decades resulted in a great degradation of the ecosystems and shrinking of the available habitats for many species of plants and animals. One of the few remaining natural areas is the National Park of Dadia-Lefkimi-Soufli (hereafter Dadia NP) where the high ecological quality of the environment supports many species of plants and animals, especially many raptor species in high population levels [1], [19]. These ecosystems are complicated units including many species in different spatial levels with varying habitat demands [13].
Raptors have been recognized as health indicators of ecosystems [16], [5]. Being organisms at the top of their food chain, raptors are biologically important and environmentally sensitive [17]. Prey and nest sites are the main factors affecting their habitat selection [16], [12], [2]. Estimating abundance and trends in all prey type populations, in order to record their sufficiency and availability, is almost impossible as most raptor species differ in dietary
299
“Sustainable Management and Development of Mountainous and Island Areas”

requirements and hunt their prey in different habitats. Additionally, the variety of methods needed in order to carry out all these measurements is huge.
One approach to solve this complex ecological problem is the use of multi-criteria evaluation (MCE) techniques and GIS-based modeling technologies [6]. Using these methodologies habitat suitability models could be estimated on the basis of expert judgments instead of empirical measurement data. In order to enable the use of ecological expert knowledge in habitat suitability modelling methods based on MCE, the expert knowledge must be transformed into a numerical form and standardized. Each score is calculated by multiplying each variable by its weight factor and then in a GIS environment the total score is calculated by adding the results (additive techniques).The integration of GIS and multicriteria decision analysis has attracted significant interest on the issue over the last 15 years [14].
The aim of this study was i) to assess the animal biodiversity in Dadia NP and their accessibility as prey for the raptors using MCE techniques and GIS and existing experts knowledge, and ii) to produce prey habitat suitability maps.
Figure 1. Map of the study area
2. Study area and methods
The study area, the Dadia NP, is situated in the Evros Prefecture, north-eastern Greece (40°59 to 41°15 N, 26°19 to 26°36 E). In 1980, it was declared as a reserve and in 2003 as a National Park. It constitutes of a forest complex extending 432.86 km2, including two zones of strict protection (core areas) covering a total of 72.93 km2 (Fig. 1). The study area is characterized by valleys of extensive oak and pine forests, and includes a variety of other
habitats such as cultivations, pastures, torrents and stony hills. Elevation ranges from 20 m to 640 m and the climate is sub-Mediterranean.
The evaluation of the animal biodiversity and their availability for the raptors was done using MCE tools [6]. The primary issue in MCE is concerned with how to combine the information from several criteria to form a single index of evaluation. All species have specific requirements, which can be described by habitat factors. These factors are connected to the critical characteristics of the habitat, e.g. to those of vegetation, to those of vertical structure of the forest, etc. Then habitat suitability is determined by habitat factors and it can be measured by a habitat suitability index, which is a unit-less variable describing the value of the habitat with respect to the needs of the species (or group of species) under consideration. Typically, it can get values between 0 and 1 (or 0 and 255), which are estimated on the basis of measurable habitat characteristics [6], [21].
At the first step the environmental variables were assessed in order to determine the suitable habitat factors on the basis of an analysis of existing studies and knowledge [1], [3], [10], [13]. In this approach we did not use deterministic habitat factors e.g. Boolean type of variables, which are used to eliminate areas from further consideration on the basis of certain attribute values. Nine environmental factors were chosen as the habitat variables affecting the distribution and abundance of the most studied animal species in Dadia NP (reptiles, passerines, micro-mammals and orthoptera), being also the main prey for the raptors in the study area. These factors were: the mature forest, the presence of oak-forest, the presence of other broadleaves, the forest openings, the presence of green zones around the agriculture fields, the presence of the wheat agriculture fields, the central and local streams and finally the presence of permanent fresh-water. In order to consider the availability of these animals to the raptors we included two more criteria in the analysis of the creation of the habitat suitability map: the presence of the rocky areas and the presence of the forest roads (Table 1).
A GIS image of the study area was created using satellite images (IKONOS, pixel size 1 m). These pictures were digitized on screen to produce a vectorial map of 14 different habitat types related to dominant forest tree and six categories of the percentage of mixed forest [19].
0 2 4 6 8 101 Km ±
Greece
Turkey
Bulgaria
AlbaniaTurkeyF.Y.R.O.M
Border of Greece
Dadia NP borderCore areas
300
“Sustainable Management and Development of Mountainous and Island Areas”

The environmental variables were calculated using ArcGIS software (ESRI).
Table 1. Variables that were used for the creation of the prey abundance and availability with multi-criteria technique.
Variable Lowest value Highest value
Mature forest 1 6
Percentage of oaks 0% 100%
Percentage of other broadleaves 0% 100%
Distance from the forest openings 0 m 2 650 m
Distance from green zones around fields 0 m 8 090 m
Distance from wheat agriculture fields 0 m 8 110 m
Distance from central streams 0 m 8 055 m
Distance from local streams 0 m 577 m
Distance from permanent water 0 m 3 873 m
Distance from rocky areas 0 m 6 379 m
Distance from forest roads 0 m 1 752 m
Because of the different scales upon which criteria are measured, it is necessary that factors are standardized before the combination and that they are transformed, if necessary, in order to calculate the suitability index as a combination of single habitat factors. The thematic map layers used in the MCE process may differ from each other regarding the measurements units. For this reason various kinds of standardization exist to make the raw scores commensurable.
In this study the module FUZZY in the GIS software IDRISI was used to provide the standardization of factors to a 0-255 byte scale [6]. FUZZY evaluates the fuzzy set membership values (possibilities) of data cells based on any of three membership functions: sigmoidal, j-shaped, and linear and all locations received a value representing their degree of suitability. The choice of the function will depend on the understanding of the relationship between the criterion and the decision set, and on the availability of information to infer fuzzy memberships [6]. In our study the absence of experimental data of the relationship between the studied animals and habitat factors didn’t allow us to use more complicated functions and we used the linear rescaling function because of its simplicity (Fig. 2). For continuous factors like the ones in our study, a weighted linear combination (WLC) is most commonly used in order to create a multi-criteria suitability image [22]. With a weighted linear combination, each standardized factor image is multiplied by its weight and then the results are summed. In our study assigning criteria weights accomplished by dividing 1.0 equally among the 11 criteria, so each factor received a weight of 0.09.
Figure 2. Example of the transformation of the file «distances from central streams» into a map with values 0 – 255 used the FUZZY module in the IDRISI software.
3. Results
According to the used function, the suitability of the habitat was increased with the percentage of mature forest, the percentage of oak forest and the percentage of other broadleaves in the forest coverage. The least distance from forest openings, green zones around the fields, wheat fields, rocky areas, roads as well as from the (central and local) streams and permanent water bodies had the highest suitability score (255) and the greatest distance had the lowest suitability score (0).
The potential range of values was 0 to 255 but in our study area the values of the multi-criteria habitat suitability index ranged between 79 to 220, and only few areas received values less than 100 or more than 200 (Fig. 3).
Figure 3. Total number of cells according to the range of value of the multi-criteria habitat suitability map for four animal taxa in Dadia NP.
301
“Sustainable Management and Development of Mountainous and Island Areas”

Figure 4. Habitat suitability map for animal biodiversity and accessibility for the raptors in Dadia NP, using Multi-Criteria evaluation techniques(Some absence data in the satellite images due to cloudiness was the reason for the observed low values in some zones of the lowlands at the northeast of the study area)
The mean value of the suitability related to the animal biodiversity in Dadia NP was 149.5 ± 40.9 (sd). As represented in Fig. 4 the mosaic created by plotting the suitability value of each cell shows a complex pattern, but it is possible to distinguish that the suitability index decreased very significantly with the elevation (Pearson correlation test: r = - 0.603, p < 0.01).
The results showed that very suitable areas extended at the lowlands where the mosaic type of habitats is dominant (scores more than 200). Rich areas also existed until the altitude of 300-400 m (scores >150), while low suitability was found in higher areas (scores less than 150) (Fig. 4, 5).
302
“Sustainable Management and Development of Mountainous and Island Areas”

Figure 5. Relationship between elevation and values of the animal suitability index in Dadia NP
4. Discussion
The main aim of this study was to investigate the use of tools that predict the animal’s habitat suitability using current ecological knowledge and available environmental data. The importance of model development for habitat assessment has been indicated by many authors [for a review see 8] and in the last two decades, interest in species distribution models of plants and animals has grown dramatically [9]
We applied a MCE approach to identify suitable areas for the animal biodiversity within a GIS context. The applied methodology was useful to evaluate multiple criteria and expert knowledge in a consistent way in order to obtain suitability maps. In this study the factors for the MCE were selected based on reviews of existing literature, and relatively simple environmental descriptors as land cover type, vegetation type, and distance from target land cover types were used to explain the distribution of the local biodiversity.
The work described in this study has shown that the lowlands, where rural mosaics of habitats exist, are species-rich areas. Preference of nesting of some of the endangered birds of Dadia NP like the lesser spotted eagle (Aquila pomarina), the goshawk (Accipiter gentiles) and the black stork (Ciconia nigra) in low altitudes was rather related to the vicinity of their good foraging habitats that are absent in higher altitudes [19]. A shift in the altitudes of the lesser spotted eagle’s nest sites from 100-200 m in the eighties (50% of nests) to below 100 m (67%) in recent years seems to have taken place due to a reduction of the forest heterogeneity and openings in the mountain zone resulted from the decrease of herd grazing [19], [Schindler &
Poirazidis, unpublished data], subsequently affecting the availability of the raptor’s prey [4], [18]. Most (54%) goshawk nests were below an altitude of 130 m [19] probably related to lower prey availability and prey densities in higher altitudes as indicated in this study.
The importance of these areas has been demonstrated also in other studies in the study area e.g. [10], [13] indicating the importance of habitat heterogeneity to preserve the local biodiversity. Anthropogenic disturbance to natural habitats is considered to be a mechanism increasing species diversity when applied at medium levels [11], but on the other hand it can lead to a dramatic decrease of species diversity and to severe disruption of key biological processes when applied intensively [15]. The high heterogeneity of the landscape due to a diversified and fine-grained use of the land creates favorable conditions for a more highly enriched flora and fauna than would have occurred in a landscape undisturbed by human occupation and use [7].
The suitability model approach suggested here provides a detailed and continuous representation of the biodiversity distribution based on generalized rules and expert knowledge. Multi criteria evaluation embedded in GIS seems to be sufficiently robust, constituting a powerful tool for evaluating complex ecological problems, which in our case consisted in the mapping the habitat suitability of different animal taxa. The results of this study could be useful for further research that tries to evaluate the accuracy of these estimations with experimental results.
5. Acknowledgements
The present study was supported by the research project “EPEAEKII - PYTHAGORAS II: 1329-1”, co-funded by the European Social Fund & National Resources. We are very grateful to WWF-Greece for the continuous support and Stefan Schindler for useful comments of the manuscript.
6. References
[1] Adamakopoulos T, Gatzoyannis S, Poirazidis K. Study on the assessment the enhancement of the legal infrastructure and the management of the protected area in
303
“Sustainable Management and Development of Mountainous and Island Areas”

the forest of Dadia, Specific Environmental Study WWF-Greece, Athens; 1995.
[2] Austin G.E. The distribution and breeding performance of the buzzard Buteo buteo in relation to habitat: an application using remote sensing and geographical information systems [dissertation]. University of Glasgow; 1992.
[3] Bakaloudis D, Vlachos C, Holloway G.J. Habitat use by Short-toed Eagle Circaetus gallicus and their reptilian prey during the breeding season in Dadia forest. Journal of Applied Ecology 1998; 38: 821-828.
[4] Baker J, Brooks R. Distribution patterns of raptors in relation to density of meadow voles. Condor 1981; 83: 42-47.
[5] Donazar J.A, Blanco G, Hiraldo F, Soto-Largo E, Oria J.. Effects of forestry and other land-use practices on the conservation of Cinereous Vultures. Ecological Applications 2002; 12(5): 1445-1456.
[6] Eastman J.R. Idrisi32, Guide to GIS and Image Processing, Volume 1 & Volume 2. Clark University, USA; 2001.
[7] Farina A. Landscape structure and breeding bird distribution in as sub-Mediterranean agro-ecosystem. Landscape Ecology 1997; 12: 365-378.
[8] Guisan A, Zimmermann N.E. Predictive habitat distribution models in ecology. Ecological Modelling 2000; 135: 147–186.
[9] Guisan A, Thuiller W. Predicting species distribution: offering more than simple habitat models. Ecology Letters 2005; 8: 993-1009.
[10] Helmer W, Scholte P. Herpetological research in Evros, Greece: Proposal for a biogenetic reserve. Research Institute for Nature Management, Arnhem and Department of Animal Ecology, Catholic University, Nijmegen; 1985.
[11] Huston M.A. Biological Diversity. The coexistence of species in changing landscapes. Cambridge University Press, Cambridge; 1994.
[12] Janes S.W. Habitat selection in raptorial birds. In: Cody M.L, editor. Habitat Selection in Birds, Academic Press, London; 1985 p. 159-188.
[13] Kati V. Methodological Approach on Assessing and Optimizing the Conservation of Biodiversity; a Case Study
in Dadia Reserve (Greece) [dissertation]. Universite Catholique de Louvain; 2001.
[14] Malczewski J. GIS based multicriteria decision analysis: a survey of the literature. International Journal of Geographical Information Science 2006; 20 (7): 703-726.
[15] McNeely J.A, Gadgil M, Leveque C, Padoch C, Redford K. Human influences on biodiversity. In: United Nations Environment Programme, editor. Global biodiversity assessment. Cambridge University Press, United Kingdom; 1995 p. 715-821.
[16] Newton I. Population ecology of raptors. Poyser, Berkhamsted; 1979.
[17] Olendorff R.S, Bibles D.D, Dean J.R., Haugh J.R, Kochert M.N. Raptor habitat management under the U.S. Bureau of Land Management Multiple-use Mandate. Raptor Research Reports 1989; 8: 1-80
[18] Preston C.R. Distribution of raptor foraging in relation to prey biomass and habitat structure. The Condor 1990; 92:107-112.
[19] Poirazidis K. Breeding habitat selection from co-existing raptor species in the National Park of Dadia-Leukimi-Soufli [dissertation]. Aristotle University of Thessaloniki; 2003: [In Greek].
[20] Rojas Briales E. Forest Management Planning as an Instrument for Monitoring, Optimizing and Incentivating Sustainable Forest Management. In: Proceedings of the Research Course ‘The Formulation of Integrated Management Plans (IMPs) for Mountain Forests’ Italy; 2002 p. 55-62.
[21] Store R, Kangas J. Integrating spatial multi-criteria evaluation and expert knowledge for GIS-based habitat suitability modeling. Landscape and Urban Planning 2001; 55: 79-93.
[22] Voogd H. Multicriteria Evaluation for Urban and Regional Planning. Pion, Ltd., London; 1983.
[23] Wilson E.O, Peter F.M. BioDiversity. National Academy Press, Washington, D.C.; 1988.
304
“Sustainable Management and Development of Mountainous and Island Areas”

Error Assessment of a Telemetry System for Eurasian Black Vultures (Aegypius monachus).
Stefan Schindler Schönbrunner-Strasse 205/1/21, A-1120 Wien, Austria
Dimitris Vasilakis WWF Greece, Dadia project, Dadia , GR - 68400 Soufli, GREECE
Kostas Poirazidis WWF Greece, Dadia project, Dadia , GR - 68400 Soufli, GREECE
Abstract. Telemetry is commonly used to study animals, but rarely its precision is considered. We evaluated the accuracy of a VHF telemetry system applied for Eurasian Black Vulture (Aegypius monachus) in the Dadia National Park, Greece. The system was without directional bias, the bearing standard deviation was 9.7°, and the most accurate location estimator was the Andrews estimator. The average linear error was 1 km for three-bearing estimates and 1.6 km for two-bearing estimates. Confidence ellipses were an accurate measure of confidence areas. We conclude that the applied system is precise enough to serve the purposes of the telemetry study.
Keywords. bearing analysis, Dadia National Park, linear error, location estimators, radio telemetry.
1. Introduction
The globally endangered Eurasian Black Vulture is the largest bird of the Western Palaearctic and considered an umbrella species for the conservation of biodiversity [3]. Its breeding population in the National Park of Dadia-Lefkimi-Soufli Forest (hereafter DNP) is the last remaining in the Balkan Peninsula, and has been considered a central subject of conservation [4,26,32]. In 1979 the population was estimated at 26 individuals and 4-5 breeding pairs [12], but it recovered due to several conservation measures and increased from 6 breeding pairs in 1987 to 21 pairs in 2002 [32]. The present situation of the species in the area remains critical as many of the mortality factors
continue to affect the population negatively [8,32]. Research has focused until now on the nesting areas, including monitoring of the breeding activities [8,33] and modeling nest site availability [26], while our knowledge of ranging habits remains limited.
Black Vultures are large scavenging birds that travel quickly and cover large and remote areas. Information about range use and movement patterns of the population, as well as the threats that the birds encounter in their foraging area, is essential for the management and conservation of the species [32]. To obtain these data a radio telemetry project with the Eurasian Black Vulture has been developed in the DNP [37].
An important concept essential to telemetry is that observed bearings and the resulting point locations are only estimates of the actual ones [38]. However, few investigators have tested the accuracy of their telemetry systems, and point estimates derived from bearing intersections often were considered to be exact locations (for criticisms see [13,16,27]). No matter how much time and thought an investigator devotes to designing a radio tracking system, the quality of the produced location estimates is unknown until it has been tested in the field [38]. The importance of testing the accuracy of telemetry systems was first suggested by Heezen and Tester [14] and cannot be overemphasized [13,27,29,30,38,40]. Precise error estimates are needed for locations derived by triangulation in order to be used in an assessment of range use patterns or habitat selection, which are sensitive to location error [21]. A radio telemetry system must be tested to determine the precision of the directional bearings [29,34], the linear error
305
“Sustainable Management and Development of Mountainous and Island Areas”

between estimated and true locations [20,38,40], and thus whether the system can produce location estimates of adequate accuracy to meet the objectives of the study [16,38].
To obtain results that direct towards recommendations for the telemetry, the error must be assessed mimicking the study of radio tracking. Test transmitters should be placed in a variety of known locations through the study area and multiple bearing estimates on each transmitter location from the receiver stations should be obtained [15,20,38,40]. When using telemetry concerning raptors, it is of advantage to lift transmitters in the air to avoid additional error due to the low position of the transmitter on ground level [20].
The main aim of this study was to optimize the telemetry of Eurasian Black Vulture in DNP, concerning the best estimation of the point locations and the determination of their precision. Specifically, the objectives were: (1) to calculate method bias and sampling error of the directional bearings, (2) to find the optimal location estimators for the telemetry system applied in the study area, (3) to calculate the average linear error between estimated and true locations, and (4) to describe the confidence areas for the point locations and to evaluate their accuracy.
2. Materials and Methods
Data on the test transmitter were collected exactly like those for the telemetry study of the Eurasian Black Vulture [37], using the same receiver stations (compass rosettes fixed on the ground), antennas (four-element Yagi, Televilt), receivers (ICOM R10 and Communication Specialists Inc. R-1000), methods to take bearings, and involved personnel. The study area was located in northeastern Greece, ranging from the Evros River forming the border with Turkey to the Bulgarian border in the Eastern Rhodope Mountains (Fig. 1). It covered the breeding colony of the population of Eurasian Black Vulture in DNP, as well as a large part of the potential foraging area of this population. The mountainous landscape ranged in elevation from 20 to 1200 m, for detailed descriptions see [37] or [36]. The study area was divided in six watersheds, which were covered by twelve receiver stations, established at exposed hilltops. The study of error assessment was implemented in all the watersheds using three receiver stations per watershed.
Figure 1. The study area located in Evros, northeastern Greece.
Two different methods were used to obtain the bearings. One is based on the direction of the loudest signal (strongest bearing) and the other on the middle-direction between the directions where the signal disappears (null average) [34]. As for the vultures, strongest bearing was used, when the signal could be detected optically on the screen of the receiver, null average for the cases where the signal was received only acoustically. Observers communicated to permit simultaneous bearings and to detect signal bounce like erroneous bearings from the reverse side. Ten triangulation attempts were made per transmitter station. Transmitter stations were unknown for the observers, they consisted in a transmitter lifted in the air with a balloon. The balloon was filled up with Helium to a diameter of 1.2 m and fixed with a line of 50 m onto a car. The software LOAS 3.0.1 (LOAS, Ecological Software Solution, Sacramento, USA) was used to calculate the true bearings from receiver to transmitter stations. The error angle, which equals the difference in degrees between true bearing and bearing taken by the observer, was calculated for each bearing. The magnetic declination [2,38] of the study area is 3.783° and it has been included in the bearing analyses. We tested for differences in accuracy between the bearings obtained by the methods “strongest bearing” and “null average”. Finally, bias and precision of the bearings were determined, calculating mean and standard deviation of the error angle data set. As the procedure of estimating the location of a signal depends on the amount of bearings that can be used to realize this estimation, triangulation attempts were classified according to the number of observers who obtained a bearing. Thus, three data sets resulted: (1) three bearing estimates (3BE) – three observers
306
“Sustainable Management and Development of Mountainous and Island Areas”

succeeded a bearing, (2) two bearing estimates (2BE) – two observers succeeded a bearing, and (3) single bearings – only one observer succeeded a bearing. Single bearings were not used in further analyses, the both remaining data sets 3BE and 2BE were analyzed separately. Seven different estimators (Andrews, Huber, Maximum Likelihood, Best Biangulation, Harmonic Mean, Geometric Mean, and Arithmetic Mean, for explanations see [10]) were used to estimate the point locations of the 3BE data. Thus, seven result data sets of location estimates were obtained and the linear error (LE) was measured for each of the location estimates in order to determine which estimator is optimal for the used telemetry system. For the 3BE data we also evaluated an optimal substitute for the cases the optimal estimator failed to produce a location estimate. For the 2BE data set the point estimates are located at the bearing intersections and for this reason only one estimator was used. For each point estimate, the linear error was calculated and compared with the linear error of each of the seven result data sets obtained from 3BE.The confidence areas of the point estimates were calculated for the following data sets: (1) for the data set “3BE – best performing estimator”, (2) for the data set “3BE – best substitute”, and (3) for the data set “2BE”. To compute the confidence areas, the evaluated bias and precision of the bearings were used. For the Maximum Likelihood (ML) based estimators (Andrews, Huber, and ML estimator), the Chi-Squared distribution was used to calculate 95% confidence ellipses, for the other estimators (Best Biangulation, Harmonic, Geometric and Arithmetic Mean) 95% error polygons were calculated. After the computation of the confidence interval areas, their accuracy was examined by evaluating the coverage, i.e. the proportion of true locations falling inside their corresponding confidence area.
2.1. Statistical treatment.
Directional data like telemetry bearings are best described by a Von Mises distribution [19,39], but the standard deviation of error angles, the common measure of bearing precision, assumes a normal distribution. The obtained distribution of error angles differed significantly from normality (Kolmogorov – Smirnov P = 0.009) and was leptokurtic. To obtain a normal distributed sample, extreme values and outliers
were determined by box-plots and eliminated. For the detection of differences in accuracy between the bearings obtained by the methods “strongest bearing” and “null average”, the independent sample t-test was applied. The two sample paired t-test was used to test if the evaluated bias of the bearings was significantly different from zero. To detect the best location estimators, statistical differences between the linear errors provided by the different estimators were evaluated. First K-S was applied to test for normality. Being not normal distributed, the data were transformed using natural logarithm, square root, cubic root and 4th root. Lacking still normality, non-parametric approaches were used. Wilcoxon Signed Ranks test for paired related samples were applied to compare among the seven linear error data sets obtained by triangulation, and Mann-Whitney U tests for two independent samples were applied to compare each of these data sets with the 2BE linear error data set. The statistical procedures were completed using SPSS.
3. Results
3.1. Evaluation of bias and precision of bearings
In total 760 bearings were taken by six different observers. 29 transmitter stations were used, covering all six watersheds in the study area. Error angles obtained during this study did not show significant difference from normality (Kolmogorov – Smirnov Z = 0.953, P = 0.32) after eliminating 35 extreme values and outliers using box-plots. Using independent sample t-tests, no significant differences were detected between the two methods of taking bearings (P = 0.76), thus “strongest bearing” and “null average” data were pooled. For the resulting 725 bearings, method bias was 0.53˚ and the standard deviation 9.68˚. The obtained bias was not significantly different from 0 (two sample paired t-test t724 = 1.49, P = 0.14), thus it was ignored for the following analyses.
3.2. Determination of the linear error and the optimal location estimator
The data set of 725 bearings was obtained during 288 attempts of triangulation. 164 three bearing estimates, 109 two bearing estimates,
307
“Sustainable Management and Development of Mountainous and Island Areas”

and 15 single bearings resulted. Regarding the 3BE data set, the locations of the transmitter station were estimated seven times, each time with another estimator based on the same 164 location estimates. The resulting distributions of linear error of the location estimates were not normally distributed and were examined with non-parametric approaches. The median of the linear error ranged from 1032 m when applying the Andrews estimator (Fig. 2) to 1303 m when the Arithmetic Mean estimator was used, the 95% percentiles as measure of variance ranged from 2422 m to 3772 m (Table 1).
Table 1. Linear error (m) between estimated and true location of the transmitter station.
Percentiles Estimator Na Medb
25% 75% 90% 95% Maxc
3BE data set Andrews Estimator 156 1032 533 1529 2016 2422 4651 Huber Estimator 155 1033 522 1543 2024 2425 4648 ML Estimator 155 1033 522 1543 2024 2425 4648 Best Bian. Est. 163 1274 463 2047 2510 2886 5441 Harmonic Mean Est. 163 1303 774 1784 2788 3761 27860 Geometric Mean Est. 163 1303 774 1784 2788 3761 27882 Arithmetic Mean Est. 163 1303 774 1785 2788 3772 287622BE data set 108 1570 1049 2198 3234 3984 19937
anumber of estimates, bmedian, cmaximum value
According to the evaluated precision, the estimators could be classified in two groups: the ML-based estimators (Andrews, Huber, and ML estimator) performed better than the second group, consisting in Best Biangulation, Arithmetic, Geometric, and Harmonic Mean estimator. The differences were highly significant when comparing any of the ML-based estimators with Arithmetic, Geometric and Harmonic Mean estimator (Wilcoxon Signed Ranks tests P < 0.001). Highly significant differences resulted when comparing the Huber and the ML estimator with the Best Biangulation estimator (Wilcoxon Signed Ranks tests P < 0.01), and significant differences for the comparison of the Andrews estimator with the Best Biangulation estimator (Wilcoxon Signed Ranks test P = 0.011).
Figure 2. Linear error (LE) between true locations and locations estimates by three bearings. The Andrews estimator was used for location estimation.
The Andrews estimator was the best performing estimator, providing smaller linear error than Huber and ML estimator (Wilcoxon Signed Ranks tests, P = 0.029). The later two provided exactly the same result data set (P = 1.00), and they failed in the same cases like the Andrews estimator. Thus, to find an optimal substitute for the Andrews estimator, the most adequate not-ML-based estimator was evaluated. Out of the four remaining location estimation techniques, no statistically significant differences were detected (Wilcoxon Signed Ranks tests, P values ranging from 0.06 to 0.33). Finally, the Best Biangulation estimator was chosen as the best performing out of this group, for having lower median, 25%, 90% and 95% percentile and maximum LE value than the other estimators (Table 1). In the seven special cases that the Andrews estimator failed to estimate a location, the Best Biangulation estimator performed worse than generally. When considering only these seven cases, the linear error ranged from 1585 to 2528 m and its median increased from 1274 to 1897 m.
The analysis of the 2BE data set resulted in a median of 1570 m and a 95% percentile of 3984 m (Table 1, Fig. 3). The precision of the 2BE locations was less than that of the 3BE locations. The differences were very highly significant when comparing the 2BE data set with the 3BE data sets of the ML-based estimators and the Best Biangulation estimator (Mann Whitney U tests P < 0.001), and highly significant when comparing the 2BE data set with the 3BE data
Linear Error (LE) in m
44004000
36003200
28002400
20001600
1200800
4000
Freq
uenc
y 30
20
10
0
Median: 1032 m N: 156
308
“Sustainable Management and Development of Mountainous and Island Areas”

Linear Error (LE) in m
2000018000
1600014000
1200010000
80006000
40002000
0
Freq
uenc
y 50
40
30
20
10
0
Median: 1570 m N: 108
sets of the estimators Arithmetic, Geometric and Harmonic Mean (Mann Whitney U tests P < 0.01).
Figure 3. Linear error (LE) between true locations and locations estimated by two bearings.
3.3. Description of the confidence areas of the location estimates
The confidence areas of the point location estimates were computed using the evaluated SD of the bearing errors of 9.68˚. Being not normal distributed, a non-parametric approach was used for their description. For the data set “3BE – Andrews estimator” (N = 156), the median value of the area of the 95% Confidence Interval Ellipse was 1048 ha (Fig. 4). The true location was 141 times inside the 95% CI Ellipse, thus the coverage was 90.4% (Table 2).
For the data set “3BE – Best Biangulation estimator” (N = 163), the median value of the area of the 95% Error Polygon was 301 ha and the coverage was only 42.3% (Table 2). Regarding the 2BE data set (N = 108), the median value of the area of the 95% Error Polygon was 842 ha (Fig. 5) and the coverage was only 54.6% (Table 2).
Table 2. Confidence Areas (ha) of the point location estimates.
Na Medb Percentiles Maxc Cove-rage
Data set 25% 75% 90% 95% (%)
3BE-Andrews 156 1048 516 2254 3941 4298 6588 90.4
3BE-Best 163 301 122 704 1069 1458 1799 42.3
Biang.
2BE 108 842 580 2205 3571 27093 1.6 105 54.6 anumber of estimates, bmedian, cmaximum value
Note that confidence ellipses were computed for the Andrews estimator, but confidence polygons for the other data sets.
Figure 4. Area of the 95 % Confidence Interval Ellipses (in ha) of the estimates obtained with three bearings. Location estimation by Andrews estimator.
Figure 5. Area of the 95 % Confidence Interval Ellipses (in ha) of the estimates obtained with two bearings. 4. Discussion
The analyses of the bearing errors clarified that the applied system of telemetry was without directional bias, thus the used equipment, the rosette, the observers and the net of established receiver stations provided accurate bearings. The evaluated bearing precision (SD = 9.68°) was similar to the values detected by other researchers with standard deviations ranging
Confidence area in ha
65006000
55005000
45004000
35003000
25002000
15001000
5000
Freq
uenc
y 30
20
10
0
Median: 1048 ha N: 156
Confidence area in ha
4000035000
3000025000
2000015000
100005000
0
Freq
uenc
y 70
60
50
40
30
20
10
0
Median: 842 ha N: 108
309
“Sustainable Management and Development of Mountainous and Island Areas”

from 1.1° to 16.4° [1,6,7,15,20,22,31,34,40]. Researchers use and recommend different methods of taking bearings [16,21,34,40]. We could demonstrate that in our case there was no significant difference between “strongest bearing” and “null average” method, although we had a large sample of bearings to detect any differences.
Small sample sizes of bearing error lead researchers to assume normality when their data may not be normal distributed [40]. For the large sample of bearings obtained in this study (N = 760), the approach of the elimination of extreme values and outliers [17] was chosen to eliminate their pronounced effects on the estimation of bias and precision and to obtain normal distributed data. After excluding these outliers, all location estimates were retained (although some of them were acquired under unfavourable conditions like small intersection angles close to 0°), in order to examine the total range of the possible linear errors and confidence areas.
In this study of error assessment, the telemetry study of Eurasian Black Vulture was imitated as much as possible. After some preliminary attempts with test transmitters placed at the ground, a balloon was used to lift the transmitters in the air. Marzluff et al. [20], comparing the accuracy of various methodologies of telemetry, found out that using a balloon the bearing precision was higher. Obtained values using a balloon should be more realistic when applied for flying or exposed animals than values obtained from ground level. However, Marzluff et al. [21] also detected larger errors for moving test transmitters than for stationary ones. Also Schmutz and White [31] and Zimmerman and Powell [40] state that all methods of error analysis using stationary test transmitters may be biased towards underestimating true location error, when data are collected on moving animals. For the applied telemetry study of Eurasian Black Vulture in DNP this problem was minimized, because each triangulation of the bird location was coordinated to provide simultaneous bearings [37].
Vultures are fast and wide ranging raptors, travelling over huge areas when searching for food. In a study concerning the Eurasian Black Vulture in Extremadura (Spain), a maximum distance from the nest of 80 km was determined for breeders, while the maximum annual home-range of non-breeding individuals was 500 000 ha [5]. In the Sierra Morena, south-western Spain, Black Vultures cover home ranges of
135,430 ha (N = 14) during the breeding season and of 77,775 ha (N = 6) during the non-breeding season [3]. The preliminary analyses of telemetry data obtained in Dadia National Park showed that the vultures are covering similar areas like in Spain, for the breeding season 2004, the average home range of 6 birds was about 90,000 ha [37].
Point locations estimated by three bearings were more accurate than point locations estimated by two bearings. The linear error of the point locations obtained by three bearings was on average about 1000 m, a distance easily travelled by Black Vultures. Only 5% of the point estimates were further than 2420 m from the true location (Fig. 2, Table 1). Considering the amount of covered area and the distances between the receiver stations, the linear error was in the expected range, and was similar to findings of other researchers using large study areas with average linear errors ranging from of 261 m to 3000 m [15,20,21,40]. The average LE for locations obtained by two bearings was 1570 m, the 95% percentile of LE was 3900 m. Most of the locations obtained by two bearings should be precise enough for the telemetry study but care must be taken when using these data and they should be inspected. Marzluff et al. [20] assessed an average linear error of 3000 m for data they used to compare the ranging behaviour of the Prairie Falcon (Falco mexicanus), a territorial raptor, much smaller than vultures, which range over smaller areas. The evaluated linear error in our study confirms that the applied telemetry system is precise enough to detect the patterns of range use and movement of the vultures.
All three estimators based on maximum likelihood theory provided precise location estimates. The Maximum Likelihood Estimator, developed by Lenth [18], evaluates the most likely location for a given set of bearings using an iterative algorithm that tries to find the minimum angular error between the observed set of bearings and the estimated location of the signal. But the ML Estimator assumes data without outliers, an unrealistic assumption for data collected from wide-ranging animals in a mountainous study area [38]. The M estimators [18] are also based on ML theory, but weight the bearings involved in a triangulation depending on their relative contribution to the estimated location [18,38]. The most robust estimator, i.e. the estimator most insensitive against outliers, is the Andrews estimator and it is recommended for calculating location estimates when signal
310
“Sustainable Management and Development of Mountainous and Island Areas”

reflections are common, but it fails more often to produce successful estimates than the other ML-based estimators [38]. In our study it was the most accurate estimator with significant difference. The Andrews estimator also provided in one more case a successful estimate than Huber and ML estimator.
The other, not-ML-based, estimators were less precise, but they always produced a location estimate. The Best Biangulation estimator only uses the two bearings with the intersection angle closest to 90˚ [10,38]. The Arithmetic, the Geometric and the Harmonic Mean of the bearing intersections use all available bearings, but they are estimators that are very sensitive for outliers. If one intersection point is very distant, the estimated location may be greatly displaced [38]. In our study they produced some dislocated point locations, expressed as very high values of maximum linear error (Table 1). They performed worse then the Best Biangulation estimator (Table 1), thus the later was chosen to be the optimal substitute for the Andrews estimator. Concerning only the seven special cases, when the Andrews estimator failed to estimate the location, the Best Biangulation estimator performed worse than generally. The median linear error of these seven cases was 1897 m. Also Garrott et al. [11] using a three-tower triangulation system evaluated the performance of other estimators for cases that the Andrews estimator failed to produce an estimate. They found out that MLE and Huber estimator provided correct estimates in only 12% and 10% of these cases. For these reasons, care must be taken when using locations obtained by substitutes of the failing Andrews estimator. For analyses that need high accuracy, these triangulations should be rejected or inspected with awareness.
Three factors determine the precision of a location estimated by telemetry [28]: variance around the bearings (error arc), distance from the receiving site (receiver station) to signal source (transmitter) and intersection angle of the bearings. The confidence ellipse [18] includes all these three independent factors, while knowledge of only one of them provides limited insight into the total variance of the estimated location [27]. Other advantages of the confidence ellipse are that it can be computed easily and explicitly for each point estimate of the research data when the overall bearing error is assessed, and that it permits to set an objective threshold for data rejection [9,20,23,28,35]. The average size of the
95% confidence ellipses was about 1000 ha in our study, which is an area that can be described by a circle with a radius of 1800 m. The obtained coverage of 90.4% was close to the theoretical 95% and better than coverages evaluated by other researchers for ellipses ranging from 41% to 88% [11,29,40]. The coverage of the ellipse increased in a simulation study [29] when the SD of the bearing errors was increased form 1° to 5°. A precision of 5° appears to be more realistic for real data obtained by telemetry and closer to the value of 9.68° that was evaluated in our study and used for the computations of the ellipses. We recommend to compute confidence ellipses and to use them to describe confidence areas of telemetry data. Based on the distribution of ellipses we obtained in this study (Fig. 4), a threshold for data rejection between 2500 ha and 5000 ha can be recommended for DNP Eurasian Black Vulture data. Enderson and Craig [9] applied a threshold of 5000 ha for location estimates of Peregrine Falcons (Falco peregrinus) after the evaluation of ellipses resulting from a study of error assessment. For point locations estimated by only two bearings, confidence ellipses are not available and were substituted by error polygons [24,27,34], which consider also all three independent factors mentioned above. The computed error polygons offered a worse coverage than the ellipses (Table 2). Only 55% of the true locations obtained by two bearings were actually inside the corresponding 95% error polygons. In the simulation study of Saltz and White [29] the accuracy of the 95% Error Polygons increased from 75% to 89% when increasing the bearing precision from 5° to 1°, thus it seems that Error Polygons only describe confidence areas accurately for very low bearing errors. Regarding the study of Eurasian Black Vulture it is not recommended to use Error Polygons to determine confidence areas of the estimated point locations, but their shape can provide a useful tool to detect situations with unfavourable intersection angles.
5. Conclusions and Recommendations
1) The system of telemetry applied for the studies of Eurasian Black Vulture in DNP is without directional bias. 2) The accuracy of the applied telemetry system is determined with the evaluated standard deviation of 9.68°, and both methods of taking bearings provide the same accuracy.
311
“Sustainable Management and Development of Mountainous and Island Areas”

3) The average linear error of three bearing point estimate is 1032 m. 4) The value of 2416 m can be applied as an overall 95% confidence distance around each point estimate obtained by DNP Eurasian Black Vulture telemetry. 5) The best performing estimator for the applied system in the topography of DNP is the Andrews estimator. 6) For the cases that the Andrews estimator fails to produce an estimate, the Best Biangulation estimator can be used, but the resulted point locations should be inspected carefully. 7) Two-bearing point estimates are less accurate than three-bearing point estimates. They provide on average a linear error of 1570 m. Point locations based on only two bearings should be inspected and locations with suboptimal intersection angle should be rejected. 8) The 95% confidence ellipses should be computed for each point location. They provide an accurate measure of the confidence area and a useful tool for data rejection. 9) The 95% error polygons provide an inaccurate estimate of the confidence area. They can be used to detect situations with unfavourable intersection angles. 10) The average error distance of about 1000 m leads to the conclusion that the system is precise enough to estimate home ranges of the vultures and to determine main areas of foraging and the patterns of their movements.
6. Acknowledgements
This research was implemented by WWF Greece under the LIFE-Nature project “Conservation of Birds of Prey in the Dadia Forest Reserve, Greece (LIFENAT02/GR/8497). We are kindly indebted to Javier Elorriaga, Beatriz Cárcamo, Lise Pomarede, Raquel Rodríguez, Reyes Martínez, Myriam Serrano, Florent Raoux, Alexandre Knochel and Andrea Alexiou for data collection, help during the fieldwork and methodological discussions. Victoria Saravia made linguistic improvements.
7. References
[1] Burger LW, Ryan MR, Jones DP, Wywialowski AP. Radio transmitters bias estimation of movement and survival. Journal of Wildlife Management 1991; 55: 693–97.
[2] Boshoff AF, Robertson AS, Norton PM. A radio-tracking study of an adult Cape griffon vulture Gyps coprotheres in the south-western Cape Province. South African Journal of Wildlife Research 1984; 14: 73–78.
[3] Carrete M, Donázar JA. Application of central place foraging theory shows the importance of Mediterranean dehesas for the conservation of the cinereous vulture, Aegypius monachus. Biological Conservation 2005; 126: 582-90.
[4] Collar NJ, Crosby MJ, Stattersfield AJ. Birds To Watch 2: The World List of Threatened Birds. Cambridge, UK: BirdLife International (BirdLife Conservation Series No. 4); 1994.
[5] Corbacho C, Costillo E, Morán R. Areas de forrajeo y home range de Buitre Negro (Aegypius monachus): un análisis preliminar. In: Contributions to the International Symposium on the Black Vulture Aegypius monachus. 2004 Oct 21-23. Cordoba, Spain.
[6] D’Oleire-Oltmanns W, Mäck U, Bögel R. Radiotracking of Bearded Vultures Gybaetus barbatus and Griffon Vultures Gyps fulvus in the Alps. In: Meyburg B-U, Chancellor RD, editors. Raptors in the Modern World. WWGBP, Berlin, London & Paris: WWGBP; 1989. p. 345-52
[7] Edge WD, Marcum CL. Movements of elk in relation to logging disturbances. Journal of Wildlife Management 1985; 49: 926–30.
[8] Elorriaga J, Skartsi Th, Vasilakis, D. Black Vulture and Griffon Vulture Monitoring in the National Park of Dadia-Lefkimi-Soufli Forest. Annual Technical Report. Athens, Greece: WWF Greece; 2004.
[9] Enderson JH, Craig GR. Wide ranging by nesting Peregrine Falcons (Falcoperegrinus) determined by radiotelemetry. Journal of Raptor Research 1997; 31: 333–38.
[10] ESS. LOAS Location of a Signal. Version 3.0.1. Sacramento, CA: Ecological Software Solutions; 1999.
[11] Garrott RA, White GC, Bartmann RA, Weybright DM. Reflected signal bias in biotelemetry triangulation systems. Journal of Wildlife Management 1986; 50: 747–52.
[12] Hallmann B. Guidelines for the conservation of birds of prey in Evros (unpublished report). IUCN/ WWF; 1979.
312
“Sustainable Management and Development of Mountainous and Island Areas”

[13] Harris S, Cresswell WJ, Forde PG, Trewhella WJ, Woollard T, Wray S. Home-range analysis using radio-tracking data – a review of problems and techniques particularly as applied to the study of mammals. Mammal Review 1990; 20: 97–123.
[14] Heezen KL, Tester JR. Evaluation of radiotracking by triangulation with special reference to deer movements. Journal of Wildlife Management 1967; 31: 124–41.
[15] Jenkins AR, Benn GA. Home range size and habitat requirements of peregrine falcons on the cape peninsula, South Africa. Journal of Raptor Research 1998; 32: 90–97.
[16] Kenward RE. A Manual for Wildlife Radio Tagging. San Diego, CA: Academic Press; 2001.
[17] Lee JE, White GC, Garrott RA, Bartmann RA, Alldredge, AW. Assessing accuracy of a telemetry system for estimating animal locations. Journal of Wildlife Management 1985; 49: 658–63.
[18] Lenth RV. On finding the source of a signal. Technometrics 1981; 23: 149–54.
[19] Mardia KV. Statistics of directional data. New York: Academic Press; 1972.
[20] Marzluff JM, Kimsey BA, Schueck LS, McFadzen ME, Vekasy MS, Bednarz JC. The influence of habitat, prey abundance, sex, and breeding success on the ranging behavior of Prairie Falcons. The Condor 1997; 99: 567–84.
[21] Marzluff JM, Vekasy MS, Coody C. Comparative accuracy of aerial and ground telemetry locations of foraging raptors. The Condor 1994; 96: 447–54.
[22] Mooty JJ, Karns PD Fuller TK. Habitat use and seasonal range size of white-tailed deer in northern Minnesota. Journal of Wildlife Management 1987; 51: 644–48.
[23] Morrison SF, Forbes GJ, Young SJ, Lusk S. Within-yard habitat use by white-tailed deer at varying winter severity. Forest Ecology and Management 2003; 172: 173–82.
[24] Nams VO, Boutin S. 1991. What is wrong with error polygons? Journal of Wildlife Management 55: 172–76.
[25] Olesen CR, Kristiansen NU. Design and Evaluations of an Automatic Localization System Based on Doppler Antennas Used in Wildlife Studies. In: Eiler JH, Alcorn DJ, Neuman MR, editors. Biotelemtry 15. Proceeding of the 15th international Symposium of Biotelemetry; 1999 May 9-
14; Juneau, AK. Wageningen, The Netherlands: International Society on Biotelemetry; 2000. p. 474-87.
[26] Poirazidis K, Goutner V, Skartsi Th, Stamou G. Modelling nesting habitat as a conservation tool for the Eurasian black vulture (Aegypius monachus) in Dadia Nature Reserve, northeastern Greece. Biological Conservation 2004; 118: 235–48.
[27] Saltz D. Reporting error measures in radio location by triangulation: a review. Journal of Wildlife Management 1994; 58: 181–84.
[28] Saltz D, Alkon PU. A simple computer aided method for estimating radio-location error. Journal of Wildlife Management 1985; 49: 664–68.
[29] Saltz D, White GC. Comparison of different measures of error in simulated radio-telemetry locations. Journal of Wildlife Management 1990; 54: 169–74.
[30] Samuel MD, Fuller MR. Wildlife radiotelemetry. In: Bookhout TA, editor. Research and Management Techniques for Wildlife Habitats, 5th edn. Bethesda, MD: The Wildlife Society; 1994. p 370–418.
[31] Schmutz JA, White GC. Error in telemetry studies: Effects of animal movement on triangulation. Journal of Wildlife Management 1990; 54: 506–10.
[32] Skartsi Th, Poirazidis K. Management plan of the Black Vulture population in the Protected Area of Dadia-Lefkimi-Soufli Forest. unpublished report (Greek). Athens, Greece: WWF Greece; 2002.
[33] Skartsi Th, Vasilakis D, Elorriaga J. Black Vulture and Griffon Vulture Monitoring in the National Park of Dadia-Lefkimi-Soufli Forest. Annual Technical Report. Athens, Greece: WWF Greece; 2003.
[34] Springer JT. Some sources of bias and sampling error in radio triangulation. Journal of Wildlife Management 1979; 43: 926–35.
[35] Tweed EJ, Foster JT, Woodworth BL, Oesterle P, Kuehler C, Lieberman AA, Powers AT, Whitaker K, Monahan WB, Kellerman J, Telfer T. Survival, dispersal, and home-range establishment of reintroduced captive-bred puaiohi, Myadestes palmeri. Biological Conservation 2003; 111: 1–9.
[36] Vasilakis D, Poirazidis K. Radio-telemetry of a Black Vulture population in Dadia National Park – strategy and methodology. Technical report. Athens, Greece: WWF Greece; 2004.
313
“Sustainable Management and Development of Mountainous and Island Areas”

[37] Vasilakis D, Poirazidis K, Elorriaga J. Breeding season range use of a Eurasian Black Vulture (Aegypius monachus)population in the Dadia National Park and the adjacent regions. Proceedings of the International Congress on the Conservation and Management of Vulture Populations; 2005 Nov 14-16; Thessaloniki, Greece. Athens, Greece: NHMC / WWF Greece; 2006. in press.
[38] White GC, Garrott, RA. Analyses of Wildlife radiotracking data. San Diego, CA: Academic Press; 1990.
[39] Zar JH. Biostatistical Analysis (4th Edition). Upper Saddle River, NJ: Prentice Hall; 1998.
[40] Zimmerman JW, Powell RA. Radiotelemetry error: location error method compared with error polygons and confidence ellipses. Canadian Journal of Zoology 1995; 73: 1123–33.
314
“Sustainable Management and Development of Mountainous and Island Areas”

Cohabitation of Farmers with Brown Bear (Ursus arctos) in Slovenia
Antoine SINQUIN1, Jeanne BAILLY2, Jean-Pierre CABARET2, Fabien DESCHIZEAUX2,Nicolas DESPAS2, Alexandre FOREL2, Julien LEONARD2, Aurelien MANCEAU2, Jocelyn PRIGENT2, Sandrine SCHWOB2, Maxime de TRAVERSAY2, Nešo VU KOVI 1, Andreja
BOREC1 and Avrelija CENCI 1
1University of Maribor, Faculty of Agriculture, Vrbanska c.30, 2000 Maribor, Slovenia 2ESITPA, 13 rue du Nord, 76000 Rouen, France
E-mail(s): [email protected]; [email protected]; [email protected];[email protected]; [email protected]
Abstract. The brown bear population is present in Slovenia for centuries, although it is not an endemic species. The objective was to ascertain the farmer’s perception about cohabitation with brown bears.The study took place in the south part of the Bear Core Conservation Area (BCCA) in Ko evski rog (dinaric region) Forty-two farms were surveyed in the area and following topics were evaluated: the knowledge of bears, the damage caused by bears and its tourism impact for the studied area. It was pointed out that the main problem of cohabitation arised from the lack of informations by the responsible national policy management.
Keywords. Brown bear, Cohabitation, Farmers, Slovenia, Ursus arctos
1. Introduction
The brown bear (Ursus arctos) vanished during the 18th and 19th centuries from all regions of high human activity in Europe because of direct persecution and environmental changes [1]. Large carnivors, including bears, need large homeranges, consequently, their conservation requires habitat protection and managament at the landscape scale [2,3]. Slovenia, a country of 20 273 square kilometers is one of the first in Europe to have an efficient management program policy of bear protection [6]. In the bear core area in southern Slovenia bears have always been present and are important species. Due to the efficient management policy, the bear population in Slovenia increased to about 300 bears (estimated) in the country [4]. The efficient policy is recognised by other countries aiming at reintroduction of the bear to restore extinct populations, like Austria, Italy and France [1,5].
However, especially in France, the protective legislation in not backed up by a cooperative action of inhabitants in those areas. In rural areas, the brown bear is still regarded as a killer of livestock. Due to the erradication of large carnivors, stockmen have lost any tradition of coexistence with the brown bear. Therefore, the rural people have to change the lifestyle and the system of sheep-husbandry. Unfortunatelly, the rural people are not yet willing to do so [1,3]. It was clearly shown that nature conservation, including the reintegration of large predators must be integrated into rural development with significant involvement of local people [1]. In Slovenia, the general public attitude including hunters is very positive towards bears but those studies did not involve farmers and sheep-breeders [2,4,5]. The cohabitation between bears and humans has never been a matter of conflicts thanks to supplementary feeding which keeps bears away from the villages and decreases attacks on flocks.
However, because of the both, increase of brown bear population and sheep breeding in the BCCA, and the interdiction of supplementary feeding, the question is posed – how the cohabitation between farmers and bears will be in the future. Is there a risk for sheep flocks if brown bears lack of food? Consequently, this study aimed at understanding the relations between farmers and bears within the Bear Core Conservation Area (BCCA) in Ko evski rog in southern Slovenia.
2. Methods
The sample comprised 42 farms in 26 villages (study area of nearly 1500 km2 ) in the area of the BCCA in the south eastern Slovenia, region Bela krajina. In this region the sheep density is quite
315
“Sustainable Management and Development of Mountainous and Island Areas”

0%5%
10%15%20%25%30%35%40%45%
0 - 2,9 ha 3 - 5,9 ha 6 - 9,9 ha 10 – 14,9 ha 15 – 29,0 ha > 30 ha
0%5%
10%15%20%25%30%35%40%45%
0 - 2,9 ha 3 - 5,9 ha 6 - 9,9 ha 10 – 14,9 ha 15 – 29,0 ha > 30 ha
0%
10%
20%
30%
40%
50%
60%
70%
80%
90%
100%
0-2,9ha
3-6 ha 6-9 ha 10-14,9ha
15-30ha
> 30ha
Pure Mixed Aged
0%
10%
20%
30%
40%
50%
60%
70%
80%
90%
100%
0-2,9ha
3-6 ha 6-9 ha 10-14,9ha
15-30ha
> 30ha
Pure Mixed Aged
0%
5%
10%
15%
20%
25%
30%
35%
40%
primary
school
secondary
vocational
school or
gymnasium
higher
professional
school
university
degree
post-graduate
degree
vocational
school
secondary
vocational
school
higher
professional
school
university
degree
post-graduate
degree
Non agricultural education (76 %) Agricultural education (24 %)
high. The farm survey was carried out with the questionnaire. For analyzing the data descriptive statistics was calculated. Three main topics were analyzed: the knowledge of bears, the damage caused by bears and its tourism impact for the studied area. The questionnaire was composed of 32 questions organized in 4 parts: The first part was about farm characteristics and animal breeding information in order to know what kind of exploitation and production the farmers are dealing with. The second part concerned knowledge about brown bears and bear management, the behaviour to have toward a bear and their way of life. Evaluation of damage made by bears and the financial consequences were included in this part. The last part of the questionnaire was to evaluate the relationship between bears and tourism in the BCCA.
3. Results
3.1. Characteristics of the farms in the BCCA
More than 75% of the farms in the study area are larger than 10 hectares and 12% are less than 3 hectares. Therefore there is diversity in the farms size. The majority of the analyzed farms are either over 10 hectares or under 3 hectares (Fig.1).
Figure 1. Average farm size
The farms were classified in three socio-economic farm types, where full time farm is classified as a farm where all active members of the family are employed at the farm. In mixed farm, at least one active member of the family is employed at he farm and at least one outside the
farm and aged farm where all family members are older than 65 years. We documented that more than half of the farms in the study area are full time farms (55%) with the largest farm size (more than 30 ha), whereas 31% of the farm sample are mixed farms and 14% are aged farms. We divided socio-economic farm types also in the farm size classes. (Fig.2). .
Figure 2. The interrelation between farm size and farm type.
The research result on education level of the farms in the studied area shows that only 24% of the farmers have an agricultural degree. None of them within this group has the university or higher degree. Among the group of non-agricultural degree the percent of university or higher degree is below 5%. It was estimated that the highest that education level is, the lowest is the number of the people on the farm (Fig.3).
Figure 3. Education level of the farmers in BCCA. Nom-agricultural education (grey box), agricultural education (blax box).
Thirty percent of sampled farms in the BCCA are ecological, while only 2% of them have integrated production. Looking to the agricultural production orientation of the farms diversified
316

05
1015202530
Cattle Pigs Goats Sheep Poultry Bees Horses
Types of animals
Num
bers
of f
arm
s
production predominates. According to this we classified the production orientation into the four cathegories: 1) farms with mixed plant production, 2) farms with mixed animal breeding, 3) farms with both – mixed plant production and animal breeding and 4) others. In the cathegory “other”, there are only specialized farmers which mean farmers who have only one plant production or breeding. This category represents almost one third of the sampled farm (29%). Ninty-two percent of the sampled farms deal with animal breeding (beekeeping included). Fifteen farmers have sheep but for only four of them sheep breeding is the only farm activity. The average size was ninety sheep per farm and the standard variation was high due to variation of sheep number (two to 300 animals per farm) Cattle is the most present animal in the animal breeding. The average size of the herd was twenty-seven cows per farm, two farms have more than hundred cows (100 and 260) and others have only few animals. Other animals are considered as secondary production on the farm, mainly for their own needs (Fig.4).
Figure 4. Species variety in animal breeding farms.
Grazing animals is the predominant activity in all animal breeding farms. Most of the farms are small, as 77% of the animal breeding farms have less then 15 ha of grazing land while twenty-one percent of them possess between 30 and 190 ha of grazing land. Only ten farms are full grazing, whereas others supplementary feed the animals.
3.2. Is a cohabitation with brown bear a problem for the farmers in the BCCA?
Ten questions have been asked to the farmers to test if the cohabitation with brown bear is a
problem because of a) their presence, b) the lack of knowledge of the behaviour towards bear and c) the lack of knowledge of the way of bear’s life. 28 out of 42 farmers interviewed, declare to have already seen a bear, among them 14 see the bear regularly. As seen from the Figure 5, 60% of the farmers are not afraid of the bear. It was observed, that women feel much more endagered by the bear that men (Fig.5). Seeing the bear did not increase the fear of the farmers, neither men nor women.
Figure 5. Survey on a subjective feeling of the fear towards brown bear. Men (grey box), women (white box).
On the contrary, most of the farmers feel that their flocks are endagered by the presence of the bear in the area. However, it is observed that farmers who are afraid of the bear by themselves are consequently more afraid for their flocks too.
In our sample, only 6 farmers (14%) have already received some information about the appropriate behaviour towards the bear. The sources were numerous: television, farming adviser, hunting magazines… However the communication is not spread enough to be efficient. Indeed, 5 out of the 6 are not afraid of bears because they follow the instructions. But the problem is still to solve: they are afraid for their flock. There is still a big lack of information: only 6 farmers are informed on the behaviour to have if they meet a bear and no information at all is given on the way to prevent the attack risks on flocks. In order to ease the cohabitation of brown bear and farmers, farmers were further interviewed on the bear management policy. In spite of the fear for the flocks, only 29% of interviewed people disagree with the bear preservation. Bears are well accepted in this area
818
106
0%
20%
40%
60%
80%
100%
Yes No
%of
ans
wer
s
317
“Sustainable Management and Development of Mountainous and Island Areas”

in so far as it has been there for a long time and he has never disappeared.
Nevertheless, the current management policy does not seem to be efficient: 84% of people think that this policy is unsuited with the situation. Two main reasons are put forward: 1) The interdiction of bear feeding and 2) Two high number of the bears in the area. These two points have the same consequence: as bears do not find enough food in the forests, they come in the villages to find it and close contacts between people and bears can raise conflicts and may present danger to the people and to the animals.
3.3. Do brown bears cause damage and reduce the income of the farmers in the BCCA?
Seven questions have been asked to the farmers to obtain the general view on this problem. Four were axed on the damage due to the bears and theirs consequences and three questions were about the economical impact of the bear’s presence around the farm.
In spite of the great number of bears in the area, majority of the farmers (57%) had never noted any damage due to bears. 21 farmers had already noticed damage on trees in their area. Only 5 farms out of the 42 sampled have been damaged by the bear attack. Most of the attacks (80%) were oriented towards the flocks in the area of Kocevje. These flocks, victims of the bears, were only composed of sheep and were all large flocks (32 to 800 sheep by flocks). Consequently, three farms that suffered bear’s attack changed their way of animal breeding by setting up protection systems. Some of the other farms in the area followed in order to prevent bear’s attacks. Majority of those farmers (57%) installed electric fences as to their opinion are the best way of protection. The second system widely used is the combination between electric fences and dogs. Twenty percent of the farmers do not use any protection system against bears. But it has to be pointed out that those farmers mainly breed cattle, pigs, horses or poultry that are much less endagedered (Fig. 6). In the case of the damage, farmers are not satisfied with the financial compensation from the government. All the farmers agreed that the time scale between
Figure 6. Protection systems used to protect flocks against the bears.
the time of occurrence of damage and the reimbursement is much too long. In general it takes over one year. However, bears are not considered as a threat for the farm durability.
3.4. Are brown bears an agro-touristic attraction that can increase the income of the farmers in the BCCA?
Four questions have been asked to the farmers to obtain the answers to this question. Two were dealing with the tourist’s interest in bears and two dealing with the economic impact of the bear to the potential income increase of the farmers. In this survey it was documented that in the studied area, there are very few farms dealing with agro-tourism. Apparently, only one farmer had this type of activity on his farm. Therefore the answers were not surprising, as 73% of the farmers believe that bears are not a touristic attraction. The sole farmer, who could take any advantages of the presence of the bears, does not think that bears attract tourist. We can conclude that bears are not yet of any economic interest for farmers in the BCCA.
4. Discussion
In this study we investigated if the cohabitation between farmers and bears is possible in the bear-living area. As to our knowledge, this is the first survey dealing with farmers and bears. The results obtained may be of great importance for countries that intent to reintegrate the bear in their naural habitats, e.g. France. The most important result in this survey is that most of the farmers living in the BCCA are not afraid of the bear, in spite of their large
electric fences53%
dogs+electric fences
31%
dogs10%
dogs+other3%
other3%
318
“Sustainable Management and Development of Mountainous and Island Areas”

number. This finding supports the results obtained by Kaczensky et al., where they showed that 59 % of the Slovenian people think that bear is not a threat [3]. Surprisingly, the positive opinion exists in spiteo of the fact that only 14 % of the farmers are informed about the bear’s life or of the behaviour to have in front of a bear. The hunter’s opinion is an interesting attitude as they believe that people in the BCCA do not need additional information because the cohabitation has existed for a long time, so people know how to react in front of a bear instinctively. As expected, only 17 % of the farmers agree with the bear management policy. Farmers disagree because the bears are too numerous in their area and about the end of the bear’s feeding in the forest that might bring problems in the villages. Bears could be a source of conflicts becasue they are predators for the breeding animals, because the current management policy is rejected and because of not knowing the bear’s way of life. Hunters agree with the farmers’ opinion. They are trying to obtain the permission to feed the bears by coordinated action of the veterinaries (as they used to do before Slovenia joined EU). However, even that farmers disagree with the current management policy, majority of them agree with bears protection in Slovenia. This is in accordance with the currently published data [5] In fact, 82 % of the farmers believe that it is important to maintain the bear in the country for the future generations [5]. Actually, no fact-based data have been found on the damage (indemnity given in the area studied) caused by the bears and the economic consequences for the farms. However, as we have seen in our study, bears make almost no damage in the area studied. Nevertheless, bears could potentially represent the source of damage, but cannot be considered as a threat for the farm durability. Majority of farmers in this survey think that bears are not a tourist attraction. On the contrary, bears are attraction for the tourists in hunters’ point of view as for wider public (2). For the farmers, bears are the part of the nature and they have to be conserved for the future generations. To conclude, we found out that in spite of the disagreement of the Slovenian farmers with the national conservation strategy for the brown bear in the “Bear Core Conservation Area”, the cohabitation between farmers and bears is possible. Even if this wild animal causes certain damage, only half of the farmers in the area find
the bears as a threat for their flock and it does not affect the farms’ durability. The fear seems to be linked with a lack of information about the bear’s way of life and the behaviour to have in front of a bear. Moreover, the current management policy prohibits the feeding of bears in the forest because of the sanitary legislation of Europe. Since the end of this practice in 2004, bears have got closer to the villages to find food. However, the Slovenian farmers have adapted their production methods to the presence of the bears and the majority of them think that it is necessary to protect this species. They use effective systems of livestock’s protection like dogs and/or electric fences to protect their flocks. To limit conflicts and to improve the cohabitation, it would be useful to restore the feeding of bears. Furthermore, it seems to be necessary to develop the communication in order to decrease the fear of the farmers. During the spring 2006, Slovenian brown bears have been introduced in the French Pyrenean in order to reinforce the French bear’s management. The results of this survey could be important to the success of this reintroduction. The Slovenian example proves that a harmonious cohabitation between farmers and bears is being possible.
5. References
[1] Breitenmoser U. Large predators in the Alps: The fall and rise of man’s competitors. Biological Conservation 1998; 83(3): 279-289.
[2] Preatoni D., Mustoni A., Martinoli A., Carlini E., Chiarenzi B., Chiozzini S., Van Dongen S., Wauters LA, Tosi G. Conservation of brown bear in the Alps: space use and settlement behaviour of reintroduced bears. Acta Oecologica 2005; 28(3): 189-197.
[3] Kaczensky P., Blazic M., Gossow H. Public attitudes towards brown bears (Ursus arctos) in Slovenia. Biological Conservation 2004; 118(5): 661-674.
[4] Kaczensky P., Wagner A., Walzer C. Activity Monitoring of a brown bear – a model approach to test field methods. Mammalian Biology 2004; 69(6):444-448.
[5] Krystufek B., Flajsman B., Griffiths HI, Living with bears. Ljubljana: LDS Ekoloski Forum; 2003.
319
“Sustainable Management and Development of Mountainous and Island Areas”

Distribution of the genus Trifolium L. in Greek mountainous and island areas
Theodoridis I., Pappas P. and Koukoura Z. School of Forestry and Natural Environment, Range Science Laboratory, Aristotle
University of Thessaloniki, Postcode 54124, Thessaloniki, Greece.
Abstract. The genus Trifolium L. includes a great native species number that are widespread at low and mountainous regions of our country. These species are the most important plants in rangelands because of their high forage quality and the increase that cause in soil fertility. The aim of this study was to record the Greek species of genus Trifolium L. Distribution of these species according to the altitude and list of endemics and rare species are given. The long term effects of grazing and weathering conditions on the participation of these species to the vegetation composition of the rangelands are presented.
Keywords: Trifolium, clovers, distribution, altitude.
Introduction
Trifolium ssp. (clovers) are important floristic elements of most of the natural ecosystems of the world. Their ecological significance, common to all legumes, is mostly found on the clover-Rhizobium symbiosis, enriching the soil with atmospheric nitrogen, and their beneficial role on soils (Taylor, 1985). Clovers are well appreciated as forage material of high quality as they contain from 60-80% (w w-1) digestible dry matter (Knight and Watson, 1977). Consequently, the indigenous Trifolium ssp. of a country is an important asset which can used for many purposes (Papanastasis and Papachristou, 2000). The present study researching the genus Trifolium L. in Greece, contributes to the knowledge of the species that are present in Greece and investigates their distribution according to the altitude.
Materials and methods
The bibliographic sources that were used to accomplish the research included the following
floristic catalogues: Flora Europaea vol. 2 and Mountain Flora of Greece vol. 1. For the taxa located in these sources a data base was made that included information about the discoverer of each one and the more ancient reference that confirms their presence in Greece. Trifoliumtaxa were classified on the basis of their distribution according to the altitude. The results were evaluated on the basis of endemism, growing patterns and adaptation to specific environmental conditions, such as in mountainous island areas.
Results and discussion
According to the processed information there are 80 taxa (74 species and 6 subspecies) of Trifolium in Greece, belonging to the 8 sections of the genus. There were many taxa synonyms used in the past. Four species that are represented by subspecies [T. hybridum (ssp.anatolicum, ssp. hybridum), T. incarnatum (ssp.incarnatum), T. medium (ssp. balcanicum), and T. nigrescens (ssp. nigrescens, ssp. petrisavii)] were excluded from the analysis and only their subspecies are considered. Twenty seven Trifolium taxa out of 76 (35.5 %) have been found over 1500 m. These are: T. alpestre, T. arvense, T. aurantiacum, T. aureum,T. badium, T. campestre, T. fragiferum, T. heldreichianum, T. hybridum ssp. anatolicum, T. hybridum ssp. hybridum, T. medium ssp.balcanicum, T. michelianum, T. micranthum, T. noricum, T. ochroleucon, T. ottonis, T.pallescens, T. parnassi, T. patens, T. physodes,T. pignantii, T. pilczii, T. pratense, T. repens, T.spadiceum, T. uniflorum and T. velenovskyi. 18 taxa of them have been also found under 1500m. These are: T. alpestre, T. arvense, T. aurantiacum, T. aureum, T. campestre, T.fragiferum, T. heldreichianum, T. hybridum ssp.hybridum, T. medium ssp. balcanicum, T. michelianum, T. ochroleucon, T. patens, T.
320
“Sustainable Management and Development of Mountainous and Island Areas”

physodes, T. pignantii, T. pratense, T. repens, T. uniflorum and T. velenovskyi. The rest 49 Trifolium taxa out of 76 (64.5%) are found exclusively under 1500m. These, low land species, are: T. alexandrinum, T.angustifolium, T. barbeyi, T. bocconei, T.boissieri, T. cherleri, T. clypeatum, T. dalmaticum, T. dasyurum, T.desvauxii, T. diffusum, T. dolopium, T. dubium, T. echinatum,T. globosum, T. glomeratum, T. hirtum, T.incarnatum ssp. incarnatum, T. lagrangei, T.lappaceum, T latinum, T. leucanthum, T. mutabile, T. nervulosum, T. nigrescens ssp. nigrescens, T. nigrescens ssp. petrisavii, T. pallidum, T. pannonicum, T. patulum, T. pauciflorum, T. phleoides, T. purpureum, T. resupinatum, T. scabrum, T. sebastianii, T. smyrnaeum, T. speciosum, T. spumosum, T. squamosum, T. squarrosum, T. stellatum, T. striatum, T. strictum, T. subterraneum, T. suffocatum, T. tenuifolium, T. tomentosum, T. trichopterum and T. vesiculosum.
The endemic species of the genus in Greece are: T. aurantiacum, T. barbeyi, T. dolopium, T. ottonis and T. parnassi. The majority of them are grown on limestone in the peaks of high mountains or in islands (Vrahnakis et al., 2006). The rare Trifolium species in Greece are: T. pilczii, T. spadiceum, T. micranthum and the endemic T. dolopium. ]
Five perennials (T. alpestre, T. medium ssp.balcanicum, T. ochroleucon, T. patulum and T. physodes) are phytosociologically typical forest taxa adaptive to oak and beech ecosystems. Consequently, these taxa should be used as understory species in silvopastoral ecosystems. The reptant type of growth of seven taxa (T. fragiferum, T. patens, T. repens, T. resupinatum,T. scabrum, T. subterraneum and T. tomentosum) has great agronomic importance as they resist very well to grazing (Vrahnakis et al., 2006). Only four species out of 18 (22.2 %), that are found both under and over the altitude of 1500 m, are grown in mountainous island areas. This is mainly attributed to the long term intense grazing on these areas, a fact that has caused decrease of their biodiversity. The latter inevitably leads to their degradation. These species are: T. alpestre, T. physodes, T. repensand T. uniflorum. T. alpestre occurs only in Thasos (Ipsarion Oros) (Map 1). T. physodes is found in the islands: Kefallonia (Enos), Lefkada
(Elati), Kerkira (Pantokrator), Karpathos, Ikaria, Andros and Skopelos. In Crete, it occurs in many localities, such as, Floria, Lasithi, Khandras, Omalos and Kedhros (Map 2), where it is sometimes found in overgrazed communities with unpalatable plants like Marrubium sp. and Astragalus creticus (Preston, 1986). T. repens occurs in the islands Lefkada (Elati), Kerkira (Pantokrator), Thasos (Ipsarion Oros), Mitilini (Olimbos), Samothraki (Fengari) and in the localities Lefka Ori, Nida and Zaros of Crete (Map 3). Finally, T. uniflorum (Map 4) has been recorded from several sites in the mountains of Crete, where it occurs up to 2000 m (Zaffran, 1976). It has been also found in Samothraki (Fengari) over 1500 m (Preston, 1986).
321
“Sustainable Management and Development of Mountainous and Island Areas”
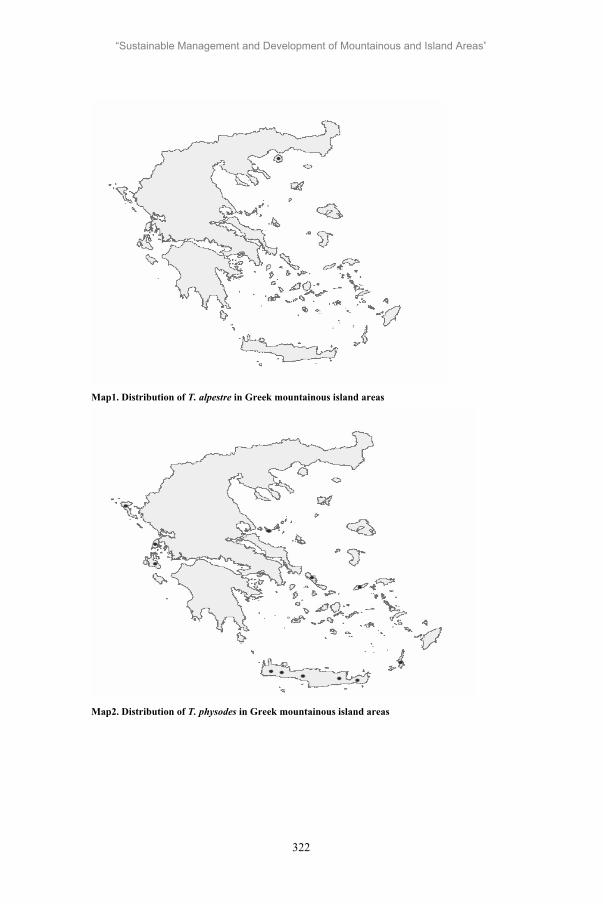
Map1. Distribution of T. alpestre in Greek mountainous island areas
Map2. Distribution of T. physodes in Greek mountainous island areas
322
“Sustainable Management and Development of Mountainous and Island Areas”

Map3. Distribution of T. repens in Greek mountainous island areas
Map4. Distribution of T. uniflorum in Greek mountainous island areas
323
“Sustainable Management and Development of Mountainous and Island Areas”

Conclusions
There are at least 80 Trifolium Taxa in Greece. Five of them are endemics and four are rare. The majority of them are exclusively found less than 1500 m. Only four species are grown in mountainous island areas, a fact that is attributed to the long term intense grazing on these areas.
References
[1] Knight, W.K. and V.H. Watson. 1977. Legume variety development and seed needs in the South eastern United States. In Loden, H.D. and D. Wilkenson (eds.): Proc. 23rd Farm Seed Conference, Kansas City, MO, 8 November 1977, American Seed Trade Association, Washington, DC, USA.
[2] Papanastasis, V.P. and T.G. Papachristou. 2000. Agronomic aspects of forage legumes: management and forage quality. CahiersOptions Méditerranéenes, 45: 113-126.
[3] Preston, C.D. 1986. Fabaceae - 11. Trifolium L. In Strid, A. (ed.): Mountain Flora of Greece, Volume 1. Cambridge University Press, Cambridge, p. 497-516.
[4] Taylor, N.L. 1985. Clovers around the world . In Taylor, N.L. (ed.): Clover Science and Technology. Agronomy, series 25, American Society of Agronomy, Madison, Wisconsin, USA, pp. 1-26.
[5] Vrahnakis, M.S., Fotiadis, G., Merou, Th. and S. Plastargia. 2006. Genus Trifolium in Greece: distributional aspects and life traits. In Lloveras, J., Gonzalez-Rodriguez, A., Vazquez-Yanez, O., Pineiro, J., Santamaria, O., Olea, L. and M.J. Poblaciones (eds.): Sustainable Grassland Productivity. Proc. 21st
General Meeting of the European Grassland Federation, Badajoz, Spain, 3-6 April 2006, pp. 321-323.
324
“Sustainable Management and Development of Mountainous and Island Areas”

The Australian Crow Trap and the Larsen Trap: Their capture success in Greece
E. P. Tsachalidis1, C. K. Sokos2, P. K. Birtsas2 and N. K. Patsikas1
1Department of Forestry and Environmental Management and Natural Resources, Laboratory of Wildlife Ecology, Democritus University of Thrace, 68200, Orestiada, Hellas,
e-mail: [email protected] Federation of Macedonia and Thrace, Ethnikis Antistasis 173-175,
551 34, Thessaloniki, Hellas, e-mail: [email protected]
Abstract. The overpopulation of species of the Corvidae family causes serious problems to both people and wildlife. For this reason many damage prevention and control methods have been developed. Here, we report spring and summer capture success of Australian Crow Trap and Larsen Trap for Hooded Crow (Corvus corone cornix) and Magpie (Pica pica) in an agricultural – wetland complex near the city of Thessaloniki. The main aim of this study was the evaluation of effectiveness and selectivity of the two traps for future use in avian predator control programs, and also for use in research programs for the collection of biological samples. The Australian Crow Trap was the most successful trap after the application of some construction improvements and the use of call-birds and proper bait.
Keywords. Corvid predation, trap operation, non-target species, EU Birds Directive (79/409/EU)
1. Introduction
Species of Corvidae family have worldwide range [1]. In Hellas the following species have been recorded: hooded crow (Corvus corone cornix), jackdaw (Corvus monedula), magpie(Pica pica), jay (Garrulus glandarius), rook(Corvus flugilegus), raven (Corvus corax), nutcracker (Nucifraga caryocatactes), chough (Pyrrhocorax pyrrhocorax) and alpine chough (Pyrrhocorax graculus) [2].
Hooded crow and magpie live in lowlands, cultivated areas and pastures. Their populations are increasing in most countries of Europe, reflecting their ability to adapt to artificial changes in the environment [3]. In Hellas hooded crow and magpie (thereafter corvids) are very ubiquitous [2], are considered pests and their hunting is permitted [4].
Corvids cause damages in crops [5, 6] and hazards in urban areas [7]. Corvids are also predators for endangered [8, 9] and hunting species [10]. Corvids predate mainly on eggs and nestlings of other bird species [9, 11, 12]. The relationship between corvid predation rate and corvid abundance is strong in some cases [11], but not in others [12].
Given the overall impact of human management on ecosystems, and the changes occurring in predator guilds in recent years, predator control is sometimes claimed as an important management tool [13]. Proposed methods for the damage prevention and predation control of corvids are exclusion, frightening, shooting and trapping [14, 15].
Trapping is a selective and legal method. However, it is often less attractive than other techniques because of the wide-ranging movements of corvids, the time necessary to maintain and manage traps, and the number of corvids that can be captured compared to the total number in the area. Yet, the capture and removing of corvids, can be a successful method of control at locations where a small resident population is causing damage or where other techniques cannot be used. Examples include capture damage-causing crows near a high-value crop or in an area where nesting galliforms and waterfowls are highly concentrated [14].
The most commonly used trap for crows is the Australian Crow Trap [14] (or Ladder Entrance Trap [16] or the Norwegian Large-Scale Crow Trap [17]) while for magpies is the Larsen Trap [15]. Capture success depends on how well the trap is constructed, the place where it is located, the time of the year, the bait, the call-bird and how well the trap is maintained [6, 14]. These traps may catch non-target birds like owls and diurnal birds of prey [14, 16, 17].
Despite widespread application of these traps in Continental countries, little information is
325
“Sustainable Management and Development of Mountainous and Island Areas”

reported in Mediterranean countries. Wildlife managers may have to conduct tests on the effectiveness of traps at local level [18]. The aim of this study is to evaluate the effectiveness and selectivity of the two traps for future use in avian predator control programs as well as research programs on the collection of biological samples.
2. Methods
The study area is located 14 Km south-east of the city of Thessaloniki in the Aristotelian University Farm (40° 45 N, 22° 58 E). The study area is characterized by a cereal-saltmarsh complex and is an important habitat for the reproduction of grey partridge (Perdix perdix)and pratincole (Glareola pratincola). The avian predators that were observed in the study area were: common buzzard (Buteo buteo), kestrel (Falco tinnunculus), short-eared owl (Asio flammeus), and also the corvids hooded crow, magpie, jackdaw.
Figure 1. The Australian Crow Trap.
After approval by the Ministry of Rural Development and Foods two Australian Crow Traps and one Larsen Trap were placed in the study area. The distance between the Australian Crow Traps was about one kilometer. The Larsen Trap was placed in different places, but always about 50 m from each Australian Crow Trap.
The Australian Crow Trap (Fig. 1) was constructed according to [14] and Larsen Trap (Fig. 2) was constructed according to [19]. The Australian Crow Trap was covered with a five cm square metal mesh and the lower one meter of the trap was covered with a 2 cm wire mesh to prevent escape of corvids and the entrance of small predators. All sides of the Larsen Trap were covered with a two cm wire mesh. Scraps, eggs, bread and meat were utilized as bait. Call-
birds (hooded crow and/or magpie) were used in most capture days [14, 15].
Capture and escape were recorded through continuous watching of the traps during the first days of the placement of the traps in the study area. After this period the traps were controlled daily (one or two visits). The results refer to the period from April 1st until July 15th of 2006. Captured corvids were euthanized humanely according to [14].
The research is part of a greater project about the feeding ecology of corvids in North Hellas. The duration of the research is two years and is going to be completed at the end of 2007. In this study we compare the effectiveness and the selectivity of traps according to the influence of ladder gap opening, the calendrical time, the call-bird, the different baits and the capture of non-target species.
Figure 2. The Larsen Trap.
3. Results and discussion
3.1 The Australian Crow Trap
The total capture was 75 hooded crows and 26 magpies. The maximum daily capture was 10 hooded crows (at 06/07/2006) and four magpies (at 07/04/2006). The ratio between the captured species (1/3, 26/75) was not due to any selectivity of the trap, but to the lower population of magpies in the study area.
During the first days of the operation of the Australian Crow Trap, it was ascertained that because of the large ladder gap opening the captured corvids (mainly magpies) escaped. To prevent escaping, the ladder gap opening was reduced progressively from 35 × 15 cm to 17,5 × 15 cm (Table 1).
326
“Sustainable Management and Development of Mountainous and Island Areas”

Table 1. The escaping of Corvids by different ladder gap opening sizes. It is considered that a bird escaped if flew away within 24 hours after capture.
Hooded crow Magpie Ladder gap opening size Captured Escaped Captured Escaped 35 × 15 cm 1 (20%) >* 4 (80%) 0 (0%) > 10 (100%) 25 × 15 cm 3 (50%) > 3 (50%) 0 (0%) > 10 (100%) 17,5 × 15 cm 71 (100%) 0 (0%) 21 (81%) > 5 (19%)
* The symbol > means that more birds may escaped, but these birds were not recorded by the researchers.
The openings of 30-45 × 15 cm that are suggested in the American and Israel models by Johnson [14] give many chances for escaping for hooded crows and no capture for magpies. The opening of 20 × 10 cm is recommended by Falcon Environmental Services [20], and it approximates the opening of our trap.
During the reproduction period (April – May) capture decreased (Fig. 3). This may be attributed to the limited movements of birds due to egg-laying, incubation, hatching and rearing of nestlings [1]. After this period capture increased, and this can be attributed to: 1) the increasing of the movement of families after the fledging of juveniles, 2) the increasing of the population because of the juveniles, and 3) the harvest of cereals that attracted the birds to the area.
The capture of hooded crows increased with the use of a call-bird of the same species. This result is in agreement with previous observations [6, 14]. In contrast, for magpies, with or without
the use of a call bird, there is no difference in capture (Table 2).
Bread and corn baits did not attract the corvids. Meat seems to be the most effective bait for the Hooded crow and Magpie too (Table 2).
The only non-target species which was captured was the common buzzard. This species was captured twice at 5/4/2006 and 26/4/2006. The captured individuals were released immediately without any serious stress for the birds. In some other cases the Australian Crow Trap captured more non-target species and numbers [16, 17]. This difference may be due to the lower numbers of non-target species and higher food supplies for them in our study area in a certain season. Also, the construction improvement (decreasing of ladder gap opening) seems to increase the selectivity toward the corvids.
0
10
20
30
40
50
60
1-15April
16-30April
1-15May
16-31May
1-15June
16-30June
1-15July
Period
Num
ber
of c
aptu
red
corv
ids
Hooded crowMagpie
Figure 3. Number of captured corvids in relation with time.
327
“Sustainable Management and Development of Mountainous and Island Areas”

Table 2. The influence of call-bird and bait on the capture success (number of corvids/day/trap).
BaitBread and corn Eggs and scraps Meat
Captured speciesCall-bird P. pica C. corone P. pica C. corone P. pica C. coroneNo call-bird 0 0 0,5 - 0 0P. pica 0 0 - - 0,67 0C. corone - - 0,45 1,9 1 -P. pica and C. corone - - 0,18 0,1 0,3 0,85
3.2 The Larsen Trap
The effectiveness of Larsen Trap has not been satisfactory until now. The trap was active for 45 capture days, in three different positions and captured only one hooded crow. This result was surprising and may be attributed to the wire mesh of two cm that frightened the birds or to a weakness in our trapping mechanism.
4. Conclusions and management implications
Although these results are preliminary and require more detailed analysis as well as further collection of data, they highlight a number of important management implications:
1) Decreasing the dimensions of the ladder gap opening to 17,5 × 15 cm increased the effectiveness of the Australian Crow Trap for the capture of hooded crows and mainly magpies. An even smaller opening may be more effective for magpies and may decrease the capture of non-target species.
2) Capture success was reduced during the reproduction period of corvids which is mainly due to the restricted movements of the corvids. In the same period the bird species vulnerability to corvid predation is higher and for this reason the capture effort using the Australian Crow Trap must be carried out before the reproduction period (end of winter and beginning of spring).
3) The capture of hooded crows increased when call-bird of the same species was used; also meat was the most attractive bait.
4) Magpie capture is not influenced by the use of call-birds; meat was the most attractive bait.
5) A combination of call-bird species (crow and magpie) is possible, but the influence on trap effectiveness is doubtful.
6) The Australian Crow Trap was a selective trap in this study and can be used according to the EU Birds Directive (79/409/EU).
7) The Larsen Trap was an ineffective tool for the capture of corvids.
8) The Australian Crow Trap is more effective than Larsen Trap from a labor cost point of view because the entrance mechanism (ladder gap openings) gives the possibility of multiple captures continuously. In contrast, the mechanism of the Larsen Trap consists of two – four spring doors which must be opened after each capture.
9) The Australian Crow Trap seems to be a more attractive construction for corvids than the Larsen Trap. This is due to its larger size and to the fact that call-birds can move more freely, which, in turn, can attract free corvids. Surely, the Larsen Trap can be moved more easily to deal with specific pairs of crows or magpies during the reproduction period.
5. Acknowledgements
We are grateful to Kostas Dimitriou for his help in traps operation, and the Council of the Aristotelian University Farm which has allowed the placement of traps in the study area.
6. References
[1] Cramp S, Perrins CM. Birds of the Western Palearctic: Handbook of the Birds of Europe, the Middle East and North Africa. Oxford Univ. Press, Oxford; 1994.
328
“Sustainable Management and Development of Mountainous and Island Areas”

[2] Handrinos G., Akriotis T. The Birds of Greece. Christopher Helm. A & C Black London; 1997.
[3] Hagemeijer WJM, Blair M (Editors). The EBCC Atlas of European Breeding Birds: Their Distribution and Abundance. T & AD Poyser, London. 1997.
[4] Ministry of Agriculture (2005). Hunting Regulations for the Hunting Season 2005 - 2006. [5] Conover MR. Protecting vegetables from
crows using an animated crow-killing owl model. Journal of Wildlife Management 1985; 49: 643-645.
[6] Moran S. Control of hooded crows by modified Australian traps. Phytoparasitica 1991; 19 (2): 95-101.
[7] Corenzel WP, Salmon TP. Tape-recorded calls disperse American crows from urban roosts. Wildlife Society Bulletin 1993; 21: 334-338.
[8] Liebezeit JR, George TL. A Summary of Predation by Corvids on Threatened and Endangered Species in California and Management Recommendations to Reduce Corvid Predation. Calif. Dept. Fish and Game, Species Conservation and Recovery Program Rpt. 2002-02, Sacramento, CA. 103 pp.; 2002.
[9] Ivan JS, Murphy RK. What preys on piping plover eggs and chicks? Wildlife Society Bulletin 2005; 33 (1): 113-119.
[10] Tapper SC, Potts GR, Brockless MH. The effect of an experimental reduction pressure on the breeding success and population density of grey partridges Perdix perdix. Journal of Applied Ecology 1996; 33: 965-978.
[11] Luginbuhl JM, Marzluff JM, Bradley JE, Raphael MG, Varland DE. Corvid survey techniques and the relationship between corvid relative abundance and nest predation. Journal of Field Ornithology 2001; 72 (4): 556-572.
[12] Gooch S, Baillie SR, Birkhead TR. Magpie pica-pica and songbird populations - retrospective investigation of trends in population-density and breeding success. Journal of Applied Ecology 1991; 28 (3): 1068-1086.
[13] Suarez F, Yanes M, Herranz J. Nature reserves and the conservation of Iberian shrubsteppe passerines: the paradox of nest predation. Biological Conservation 1993; 64: 77-81.
[14] Johnson, R. American crows. In: Hygnstrom SE, Timm RM., Larson GE, editors. Prevention and control of wildlife damage. Cooperative Extension Division Institute of Agriculture and Natural Resources University of Nebraska. US Department of Agriculture. Animal and Plant Health Inspection Service Animal Damage Control. Great Plains Agricultural Council Wildlife Committee; 1994. http://icwdm.org/handbook/birds/AmericanCrows.asp [10/3/2006]
[15] Game Conservancy. Hints for using Larsen traps. http://www.gct.org.uk/uploads/NGK%20PCS%20Factsheet%205%20Using%20predator%20control.pdf [10/3/2005].
[16] Bub H. Bird trapping and bird banding. Cornell Univ. Press, New York; 1991.
[17] Epple W, Helb HW, Mäck U. Selectivity and Suitability of the Norwegian Large-Scale Crow Trap with Respect to Animal Conservation and the Protection of Species, Based on a Specific Example: a Project for Mass Trapping of Carrion Crows and Magpies conducted by the Hunting Community in the District Leer/Ostfriesland/Niedersachsen. Berichte zum Vogelschutz 2004; 41: 45-63. (in german)
[18] Gerald ID, Schemnitz SD, Taber RD. Capture and marking wild animals. In Schemnitz SD editor. Wildlife management technique manual. The Wildlife Society. Washington; 1980.
[19] Game Conservancy. Predator Control. Game Conservancy Limited. UK; 1994.
[20] Falcon Environmental Services at JKF Airport 2006. http://www.rci.rutgers.edu/~lreed/dimensions.htm [20/5/2006]
329
“Sustainable Management and Development of Mountainous and Island Areas”

Use of Terraces in the Mediterranean Environment: A physical, sociohistorical, and economic approach.
The case of Greece
Gregory Varras TEI Epirus, PO box 110,47100 Arta
[email protected] Kantartzis
TEI Epirus, PO box 110,47100 Arta [email protected] Kakouri
TEI Epirus, PO box 110,47100 Arta [email protected] Koutsikou
TEI Epirus, PO box 110,47100 Arta [email protected] Papadopoulou
Aristotelian University of Thessaloniki [email protected]
Abstract. Terraces are an integral part of the Mediterranean mainland mountainous and island landscape. Its roots in the Greek territory can be traced as far back as 4000 b.c. Still today they are used as struggling agricultural lands or economically viable ecotouristic regions. In any case they receive public recognition and are considered landmarks. By definition, their presence and proximity have been socially and physically intertwined with traditional settlements.
Today, Greece poses some of the best standing examples, but their maintenance is not on a par, due to the contemporary lifestyle which discourages traditional vocational activities (agriculture, farming).
This paper examines terraces in the aforementioned Greek –typical Mediterranean-context and proposes sustainable solutions for their conservation and development.
Keywords. Conservation and development,Mediterranean environment, traditional landscapes, terraces.
1. Introduction / Terms Stone is the most ancient structural
material used by man since prehistoric and historic civilizations. Dry stone terraces and structures form the foundation of human landscape shaping, a human activity as well as
technique used globally [12]. Being part of folk architecture, they were used primarily throughout agricultural uses, offering local physical, sociocultural and economic identity. The retention of agricultural land within terraces in hilly regions with intense rainfall was the appropriate crop cultivation mechanism for centuries, especially in the Mediterranean basin. Dependant on demographic influxes, increase of cultivated lands, social cohesion, organization and structure, as well as level of machinery involved, the use of terraces followed history‘s course offering periods of development and abandonment. Technological evolution - revolution and agricultural machinery along with extensive use of cement pushed man further away from terraces rendering obsolete these pre-industrial structures which were the basic way of structuring the agricultural landscape that was based primarily on domestic economies. Even to date, Mediterranean civilizations exhibit a rich display of archeological findings revealing extensive terrace use.
2. Natural Physical landscape and terraces
For many years terraces carried a very important role in landscape conservation.
330
“Sustainable Management and Development of Mountainous and Island Areas”

Initially terraced walls of pasture lands were constructed in order to delineate pastures in periods of lack of timber or in regions where there where no timber, replacing the wooden fencings. This practice has also other reasons for existence. On one hand it was difficult to stake stakes in rocky soils and on the other hand the pasture lands were full of stones. Thus, stone terrace construction was implemented from available stones that were gathered from the clearing of fields [7].
Terraced walls, over one hundred years old, constitute an integral part of many Mediterranean landscapes. They protect territory from erosion in inclined soils and even today, they characterize a lot of European regions of vine or olive culture. Today, all the more, these walls are being replaced from concrete walls (beton), because: a) people do not trust anymore dry stone walls and b) there aren’t anymore masons who know how to build them. Concrete however has disadvantages: a) it is an element obviously foreign to the natural landscape, b) walls of this type consist of one large block, c) they are completely waterproof, d) they cannot adapt in the permanent pressure of soil and water, and e) they present deep cracks. Such types of cracks mean total replacement of wall in relatively short time interval.
On the contrary, dry stone walls are marvelous examples of recycling of useless materials, made of stones that are gathered from the clearing of fields and are valuable witnesses of traditional masonry techniques that offer a lot of advantages lost through the centuries. They do not present the rigidity of concrete walls, but they have an adaptable structure that can be deformed with the passage of years without suffering cracks and reacting with limited and specific deformities. They are not influenced from frost, even when individual stones break in smaller pieces. [9] The survival of this ancient method of building is confirmed by the maintenance of ancient walls that are still to date live witnesses of this technique.
Dry stone walls support and enrich rural landscapes. These structures, very well adapted in the environment, are witnesses of continuous human activity. Their protection contributes in the conservation of landscape structure in which they execute three missions: they delineate pasturages, they become
physical ownership obstacles and they support soil.
Dry stone walls cavities offer shelter in many species of animals as lepidoptera, reptiles and birds. These walls favor various species of plants which sink their roots or occupy adjacent spaces. Continuous walls constitute real biological networks that offer favorable living conditions for the local fauna and flora of a region.
Dry stone walls can be compared with other arid land environments such as limestone plates, rocky outcrops etc. The microclimate of dry stone walls is characterized by limited water availability and intense as well as permanent solar radiation. In this microhabitat, moisture content and temperature fluctuations determine extreme life conditions. Therefore choice of living organisms that survive the intense environment is very strict.
Naturally the species of plants that live in dry walls vary a lot depending on geographic locus (climate, altitude, distance from sea etc).
Regarding animals, small fauna finds temporal or permanent shelter in surfaces and cavities of dry stone walls. Often one can observe various species of lizards and snakes. Hedgehog, various rodents and certain small birds find shelter in bigger cavities as well as.
However dry stone walls constitute mainly residence for spineless and other species that bear extreme conditions (eg. temperatures up to 60oC).
There are also a number of insects that gather in these walls, mainly in spring and autumn finding increased heat compared to ambient temperature. Within stone slots various insects such as ladybirds spend their dormancy. This is also a favored biotope for various butterflies as they undergo various stages of their metamorphosis. Still various spiders find there food and many snail species gather within limestone walls.
Culture of soil is a hard task, as it requires continuous effort and maintenance. The problem of limited resources was solved with the creation of terraces that: a) allowed successful culture in inclining slopes, b) made the exploitation of well waters possible, c) protected these regions from erosion, d) provide rain water retention, and e) supplied rural domestic products to inhabitants. Work in mountain slopes and hills, where often even domestic animals cannot be used, is hard and
331
“Sustainable Management and Development of Mountainous and Island Areas”

time consuming. The soil, full of stones, should be cleared by hands and should be retained in order not to be washed away. Use of terraces neutralize mountain or hill slope by making use of stones that need to be removed from cultivated lands. Terraces prolong the time of rain water eve in soil surface and contribute accordingly to infiltration and underground water stratum and aquifers, potentially appearing in lower regions in the form of spring or wells.
By this miraculous way the minimal available spring and well waters can be used in gardens or orchards, for vegetable and fruit production and can nourish domestic animals after harvest.
Under terraced cultivated trees, such as olives, fruit trees, and oaks, other basic alimentary species like wheat, barley, legumes and vines are being grown. It is not accidental that in antiquity each Greek island was famous for its specific wine variety.
Summarizing it could be said that still to date, terraced walls are being effective means of management of natural resources. They retain soil and ground humidity, they function as solar collectors that store daily heat and release it during the night. The stones of walls that often come from the clearing of fields constitute ecological material, while dry stone technique is more energy saving than cement mortared stone masonry as it behaves better under seismic vibrations. The slots between the stones constitute a paradise for microscopic infrequent species of flora and fauna that find their shelter there. Terraces handle well natural disasters, such as fires and floods. Finally, terraces constitute the ideal background for prototype and special ecosystems.
3. Terraced landscapes as spaces of social interaction
Through the passage of centuries regions of terraced landscapes received thousands of inhabitants. They have entertained external populations, political or religious refugees as well as alternation of local generations. Today, these spaces of inclined soils offer new prospects for individuals in search of a new life quality that offers tranquility, slower pace of living and a
healthy environment. These are individuals that seek ways to settle and initiate professional activity and participate within collective social interaction. This medium and long term prospect is encouraged by programs and initiatives that aim to transform these regions into dynamic and hospitable spaces.
In order to shape the mountains, man needed to invest many years of land care and shaping knowing that the earth is the most valuable resource that sustains himself and his descendants.
Common search for productive agricultural land, created communities in which harmonious inhabitant coexistence was a prerequisite in order to manage collectively natural resources.
Terraced landscapes have developed methods of work that are acceptable by all, and sustainable growth that takes into consideration natural and social requirements. These practices were initiated and implemented long before the conference of Rio and before any formal solutions for management of non renewable resources. All initiatives developed towards the exploitation of these landscapes aim in the local population’s awareness on values of landscape, ecological, and agricultural heritage that these represent. Thus recapturing of these spaces can only be achieved through collective efforts. In these regions dynamics are been created that result in wide range social actions spanning from a new business to an ecomuseum, and from upgrading of agricultural exploitation to restoration of terraced walls. Because terraced landscapes are places of collective resource management, their reuse requires both public and administrative participation.
Observation of communities within island and mountain regions exhibits Mediterranean life’s high dynamics that surpasses all obstacles deriving from a hostile land relief. Soil sustainability of these areas is dependant on human coexistence and labor. The value of sculpting the landscape proves the presence and wise management of human use to a non hospitable and hostile environment. Determination of human survival and extraordinary man will has transformed rocky lands with limited physical access into fertile regions.
It is evident that life in mountainous and island regions of the Mediterranean basin has been directly connected with terraces.
332
“Sustainable Management and Development of Mountainous and Island Areas”

From a social point of view their conservation is necessary because they preserve accumulated human effort and activities through centuries which ought to be respected, and passed on to future generations.
In these inherently agricultural regions, social web is reinforced by human relationships of mutual understanding and support. Men understand the fellow men’s labor and collectively experience a good or bad production year and life in general. In such places one may find warm people than are more friendly and eager to offer their help and render their services.
Development of alternative tourism in terraced landscapes, escorted by high quality human resources and services can reinforce rural demographics. Immigration of younger population towards metropolitan centers is an obstacle for the development of agricultural regions. By making appropriate interventions towards conservation and renewal of terraced landscapes, economic prosperity will lead to the end of this phenomenon. Young people settling in a healthy and hospitable environment can turn to a more natural way of living within original landscapes, reinforcing local communities that have been suffering demographically during the past four decades.
Special attention is been made to cobble stone paving of settlements. They make up for healthy appearance of well preserved settlements and form the basic element and connecting link between private and communal areas. Their construction, their preservation, and their meticulous maintenance were and still are a witness to social development and cultural wealth of a region, a “base” that supports and “connects” the built space entity.
In a summary fashion, terraces are living proof of societies and civilization’s ability to adapt to harsh environments and are witnesses of the magnitude of labor that has created them.
4. Terraces elements of economic growth
Since antiquity terraces have been associated with agricultural production, rural and domestic economy. Terraces have hosted much cultivation such as vines, olives, citrus fruits etc. The quality products were specially taken care of. Terraces had better solar orientation than flat lands. Today such landscapes once densely populated have been
deserted. Agricultural infrastructure along with shacks and storage huts offered a comprehensive cycle of production and consumption along with all necessary equipment ranging from mills and crashing stones to the dense network of paths for transportation of people and goods.
Today’s form of development is not akin to these old methods of production. But if these stone infrastructures can be integrated within a mesh of economically growing structures, compatible with contemporary social needs for alternative ways of living and eating, great economic results can be achieved. Government, organizations, and private sector alike must heed to a better exploitation of terraced landscapes not only for cultural reasons but mainly for them becoming living entities of work and production. Threefold is the direction on which government and new businessmen can turn to in order to exploit these terraced landscapes: a) Agricultural economy, b) Education – Training c) Alternative tourism a) Agricultural economy
In order for population to return to these regions, it is necessary to develop an economic system that favors high quality-low mechanization-extensive care cultivations. It is an agriculture that derives from old needs, but capable of meeting demands of contemporary markets that prefer all the more quality biological products. This is in reference to wine, oil, fruits, vegetables, pharmaceutical herbs, and their processed products such as canned goods, marmalades, honey etc. These “different” products contribute a great wealth of knowledge and money to conservation of unique terraced landscapes and economic viability of small scale producers. With the right land use of terraces there can be developed quality sealed products offering great economic benefits.
From a historical point of view terraces for a long period of time have been integrated within systems of multi cultivations and multi human activities. Since the 1950’s terraces have been gradually abandoned in many regions and agricultural farming has become more intense and accumulated to lower flat fields. Abandonment of terraces changed their land use into places of pasture resulting in further landscape degradation and ultimately destruction for animal herds. It is true that terraces can not be easily cultivated
333
“Sustainable Management and Development of Mountainous and Island Areas”

by mechanical means and generally have a raised cost of production when compared to other types of agricultural land. Lately there has been improvement on mechanical means and other infrastructure as well as new techniques adapted to terraces which do not always require notable investments. The cost of investment can be reduced through collective management agencies or organizations. Cultivating techniques can be adapted to agricultural terraces such as use of organic material and the way it is been deposited on the terraced lands. Terraced agricultural production can be restructured and exploited in new ways enriching inherent agricultural heritage. For example in France they use culture of edible fungi at the roots of chestnut trees in terraced cultivations, increasing the productive values of these areas. At Piedmont, Italy cultivation of rock garden plants is extremely profitable since there is a great demand for decorative landscaping and an even more increased demand for herbaceous plants for their use in high valued traditional recipes. Terraces are extremely privileged spaces for quality agricultural production as well as biological agricultural production. According to types of production there can grow quality sealed products and products of specific name origin. The derived overvalue through such formal high quality sealed products allows to a degree for the increased cost of production that is associated with terraced cultivations. So one can see that return to small scale farming in terraced lands can be extremely viable.
When compared to greenhouse products, terraced agricultural products are of extremely high quality because they are biological, require more care, and grow in a natural way, placing them in a more advantageous marketing position. Such products are mainly olive oil, wine, and pharmaceutical herbs.
In reality terraces make up privileged innovative laboratories that invent new ways of agricultural growth acquiring environmental, social and economic overvalue.
b) Education – trainingCreation of job positions can be
offered through the spreading of knowledge of terrace building construction techniques. Terrace building techniques verify an old and
complex knowledge base that can be found in all continents enriched by local characteristics and variations. Today many regions experience graduate but steady loss of such a knowledge base. Organizing the passing of knowledge from generation to generation before it vanishes completely is imperative. In order for the knowledge to pass on it needs to be analyzed. Printing material such as a practical guide for restoring terraces would contribute to the passing on of this knowledge. Terrace restoration crews can become valuable learning resource of such a technique. There are expert crews that have become reference schools in Europe. Such schools operate at Mallorca, Spain, Epirus and elsewhere. Young unemployed people are being trained for large periods of time in these building techniques acquiring specialty, and a high percentage of them finds fills job positions in the market. In such a way a terrace restoration profession can be established. Such a profession can be part of public works and a new more aggressive exposure can attract privateers. The cost of constructing dry stone walls is estimated to be very competitive when compared to reinforced concrete, if one is to take into account its aesthetic and technical advantages.
Through past experiences it has been proved that establishment of specialized businesses in the sector of terrace construction is feasible with the help of government subsidy so young people can combine agricultural activities with terrace construction. As in any kind of activity within the agricultural sector so it is that specialize dry stone terrace building technicians can follow common quality work methods to promote and make their profession widely known to the market. Specialized dry stone building centers can be established for people who want to be employed in this profession. c) Alternative tourism
Terraced landscapes are spectacular landscapes that provoke the visitors’ imagination. Under their ecological importance, lies a hidden wealth that can be exploited by application of new tourist and cultural uses within agricultural regions that are thriving today: cultural tourism, environmental education and agro tourism.
Tourist clientele seeks quality and genuine physical spaces. From this point of view terraced landscapes represent an exquisite tourist resource. This approach is appropriate
334
“Sustainable Management and Development of Mountainous and Island Areas”

for agricultural regions that are close to tourist centers ornamented with terraced landscapes available nearby. Such regions can be selected to promote sites with impeccable character so impacts of interventions will enjoy maximum effect.
In order for agricultural terraced landscapes to become tourist and cultural attractions, some new land uses must be formed: eco museums for educational character can be created avoiding any alteration of the genuineness of space, or spectacles of cultural and educational happenings can take place within these landscapes. Then, these sites must be integrated within a network of other tourist and cultural sites and activities by creating cultural and eco tourist greenways. These green ways can be connected with urban spaces or other spaces of human segregation or places of agro tourist market. It is very important that there are mixes of agricultural and tourist uses within terrace landscapes so there can be a profound connection between landscape quality and product quality in order to assure upgraded viability.
5. Mediterranean examples/case studies (commonalities / differences of physical landscape and structures)
Soil topography in Mediterranean countries of cultures encourages the use of stone as building material as there is a great variety of stone around the Mediterranean basin.
In all Mediterranean countries the use of terraces is visible at traditional settlements that have remained intact from the whirlwind of tourism. More dry stone terraced landscapes are located in countries of southern Europe, where stone exists in abundance. Northern Africa and the Middle East prefer brick construction.
The examples below emanate from European countries that have tradition and history in technical expertise and have advanced in programs of complete architectural management of dry stone construction. In these countries the creation of a specialized park joins forces with administrative or economic management and even private interests.
Southern France.Natural park Les Monts d'Ardeche It is a natural Regional Park that was
created in southern France with the initiative of chestnut producers. It is found in the Rhone-Alps region at the foothills of central mountainous region of France. It is the place from where Léger, one of the largest rivers of France springs, including a multitude of torrents, volcanoes, and chestnut cultures in terraces. Within the framework of park programs of education, there is public briefing on landscape preservation and quality of living. This area has been characterized as a live terrace museum.
In order to preserve and promote terraced landscapes, an eco museum has been created and a centre for terrace construction training. The eco museum is found in a mountainous settlement, typical of the region’s characteristics. Around the settlement there are many old cultivated terraces that have provided job positions for its residents. They had been abandoned last century, but recently they were cleared and restored to show the inventiveness of the persons that constructed them, the life of these farmers that were also builders, as well as their traditional habits.
The eco museum is open for all, residents or visitors of the region, for a unique acquaintance with the cultural heritage of terraces or to work and be trained in the technique of dry stone building and construction.
In another region of the park, at Bareze, there is a large scale property, constituted from monumental terraces. They are constructed from sculpted blocks of stone. Many irrigation configurations give to the landscape a special interest regarding the comprehension of collaboration among stone, soil and water in sloped regions.
An extensive terraced system is found at Logeres, towards the Mediterranean side of the park. Around an 18th century tower there have been developed terraces for the cultivation of fruit trees. There are old varieties of apple, pear, cherry, and chestnut trees. The public can find a variety of activities acquainting him with terraces and technical construction [5].
Southern Italy.Alta Langa Region In a region south of Piedmont, where
five rivers have engraved the territory with a
335
“Sustainable Management and Development of Mountainous and Island Areas”

system of hills, ten villages define the hill tops and sides of a valley, a landscape that must be perceived as an entity. Much cultivation is developed at the hill tops, but mainly at the hillsides that are supported from a multitude of terraces. Thanks to the terraces found by the ancestors, the residents gained new agricultural land for rural cultivations, even there where ground inclination, forests and adverse climatic conditions were not suitable.
This landscape determined also the choices of growth strategies in the region. The products are of exceptional quality and local network of tourist service give the possibility for one to enjoy the pace of life, the landscape, the local particularities and the rural products of this region.
The collaboration of an automobile and a textile industry that were seeking natural plant fibers based on the Mediterranean plant spartium led to the implementation of a pilot experimental program "spartium" at terraces. The experiment gave the expected results and the production now satisfies the requirements of industry. So a productive phase began for the manufacture of car seats. Terraces have been functionally restored with spartium cultivation, once abandoned.
At the same time entrepreneur activity has advanced in the restoration of a storage barn and exploitation of terraces for the creation of a restaurant and hotel at the "Gallo" region. Stone, a sovereign element of buildings and terraces around the region, was selected as an element of symbolism in this place of reception. Both buildings – restaurant and hotel – are connected via a way that follows an old terrace, which has been extended with a new dry stone wall, landscaped with aromatic rock plants.
Cortemilia RegionIt is also found in the Piedmont
province, where an important terrace and vine eco museum have been created. This park functions at the hill sides terraces along with auxiliary spaces. Its purpose is to inform the visitors about the importance and overall values that terraces encompass
Initiatives in collaboration with local agencies, thematic attractions and exchanges with terrace sites in Italy and other countries, help to promote a deeper understanding and awareness concerning the importance of maintaining the special character of a place and its heritage.
Southern Spain.Sierra de Tramuntana RegionNorth of Majorca are the Northern
Mountains with abrupt slopes and many valleys. The region has a tradition in the use of terraces for qualitative cultivations, but during the past years agriculture and livestock farming is plagued with recession. With the re-establishment of a dense terrace network many problems with regard to region revitalization, agricultural production and soil erosion were resolved.
Around the Cami des Correu settlement these impressive terrace building can be found. The technique is not applied only at terraces, but is extended in many pathways. This region offers the possibility of studying building techniques not only of terraces but also of streets, paths and steps. Up to date there have been restored more than 250 dry stone structures, where visitors can admire. The most impressive terraced landscape of the region is found at the Banyalbufar settlement. The hill sides are organized in terraces for the culture of a local variety of vine, Malvasia and a specific dried tomato.
Denia RegionIt is found in South-western Spain near
Valencia. A big park has been created around the medieval tower of Denia and the largest part is shaped with terraces.
The region exhibited a glorious history at 19th and beginning of 20th century in the export of grape from vines cultivated mostly at terraces. The city's ethnological museum rebuilds and promotes this history by educating the public on these terraced landscapes. Shaped by terraces, it has been promoted as a tourist walk with educational character. Visitors by touring the terraces and the museum form a general and complete picture of the history of vine culture in the region. Through rich collection of printed material and informative plates, they can learn about terrace construction techniques and local agricultural products. The undertaking is rendered even more impressive by understanding the environmental pressures being imposed on the region from the multitude of northern-European tourists that overcrowd the region at tourist peak periods.
It is a particularly rich tourist experience, as it combines a museologic approach with the direct acquaintance of a region.
336
“Sustainable Management and Development of Mountainous and Island Areas”

Southern Albania.The region of Southern Albania
constitutes a geographic, cultural and ethnological extension of Epirus. Peculiar political situation up to recent times and underdevelopment has resulted in the preservation of traditional lifestyle, corresponding only to fundamental needs. Accordingly forms of production and product processing followed pre-industrial stages of growth. Any type of architecture was based on the rich limestone rocks of the region. Southern Albania, as well as the entire country within its misfortune was lucky to preserve and maintain her unique cultural and architectural heritage, not because there was a particular legal framework of protection, but because any anarchic development was non-existent, so society drew its examples from the traditional way of living and its vernacular architecture.
Dropolis RegionThe eminent valley of Dropolis is
found along the Kakavia–Argyrokastro road. At the hill sides of Platovounio and Lintzouria since medieval years many settlements were developed with common and main characteristic: extensive use of stone.
The landscape is unique because it gives one the enjoyment to cherish a real stone kingdom, a landscape that climaxes at the city of Argyrokastro, very recently nominated by UNESCO a monument of international cultural heritage precisely for its particular architecture and the absolute use of stone. The villages of Dropolis, Georgoutsates, Vouliarates, Dervitsani, etc, are living terrace museums, where not only rural buildings and dry stone walls, but entire houses and temples are built with the use of this technique from masons that still know very well each secret of dry stone building. One can admire in each village architectural stone clusters built with abundant mastery and taste.
6. Greek examples/case studies (commonalities/differences, physical structures and processes)
Taking into account the particularity of terraced landscapes in Greece, the following characteristic examples are described. All the examples that are being presented emanate from regions where terraces constituted a
chronic economic, cultural and social reality. Mainly rural and built-up entities, they are found at Epirus, Continental Greece, and the Cyclades islands.
Epirus
In the region of Epirus there are many terraced landscapes but only a few of them have been exploited appropriately with organized preservation interventions, and for even fewer regions there have been carried out studies. Most of these landscapes remain abandoned monuments of prosperity past. The examples concern mainly cultivated terraces which are found in almost all regions visited. There are also a large number of dry stone –non-mortared structures such mills, huts, property ownership walls, bridges, while in certain cases entire paths, castles or even homes are built with this technique. The examples are focused in regions where terraces are preserved in relatively good condition and are presented as an architectural entity, while many times they simultaneously contribute to local economy. These regions do not correspond in administrative, but in geographic divisions.
Konitsa Region.Konitsa. In today’s town only but few
of terraces have been saved on the east part of town. There are some recently renovated bridges at nearby regions.
Drosopigi. A large number of terraces are used mainly for vegetables and fruit tree cultivations, as well as pasturages made of black stone.
Agia Paraskevi. Terraces are developed in a concentric fashion around the settlement for cultures of fruit trees, vegetables and vines. Old dyke like terraces, encompass pasturages. Limestone pebbles of intermediate size constitute the primary construction material.
Gannadio[3]. Here one finds terraces with cultivated vines, and vegetables. At higher settlement elevations are beautiful local vine terraces. Construction material is orthogonal black stones.
Nikanoras. In the abrupt side of settlement one sees terraces that retain vegetable and vine cultivations made of black stones of various sizes.
337
“Sustainable Management and Development of Mountainous and Island Areas”

Zagori Region Kapesovo. In the village there is a
terrace system with accompanying dry stone buildings, used for rural activities. In the periphery of the settlement are wheat cultivated terraces. Construction material is mixed, limestone and black stone. The use of mixed material reflects also the variety of these two rock deposits at Zagori.
Vradeto. Apart from the terraces near the village, characteristic example of dry stone construction are the eminent stone stairway of Vradeto, the path that connected Kapesovo with Vradeto and 1100 steps have been engraved in a stair way form at abrupt slopes[10]. It also constitutes the best maintained path at the Zagori region
Negades. In and around the village is a multitude of terraces choked however in wild vegetation. Near the village are two dry stone watermills, and two bridges, as well as cisterns along the path that leads to Kipi.
Kipi. At the Kipi region apart from many terraces, one can see some of the most spectacular dry stone bridges of the Zagori region[8]. Here are the well known dry stone bridges of Petsioni, Mirisi, and Mill Bridge. Temples, mills, taps, terraces and huts supplement the rich architectural landscape.
Koykkoyli The forest has covered a large portion of many terraces around the village, but some of them are still visible especially when entering the village and on its north side. Nearby are the bridges of Kokori, Kalogriko, and Lazaridi [8].
Dilofo. The village presents an appreciable and well preserved system of cobble stone paths constructed of local flagstone placed either horizontally or vertically, without connective mortar. In combination with stone walls and the built-up area, they create a sense of absolute stone domination.
Ano Pedina. The settlement is developed in a narrow ravine with many vegetable terraces. Tall walls encompass the houses. Characteristic is the one that surrounds abbey Evaggelistria [4]. Construction material is limestone that abounds in region . Kato Pedina. In the outskirts are many wheat terraces with tall curvy walls. They constitute a complete architectural entity along with huts, stables and other auxiliary spaces. They all require preservation because of deteriorations that were caused by soil erosion
and excessive pasturage. Local limestone is used here as well.
Monodendri-Vitsa. Between these two villages lies the ancient Molossic settlement [11]. Near the villages are wheat, vegetable and vine terraces, along with old paths and bridges.
Elafotopos. North of the village is an old castle with rich history. It is built entirely of large lime stones and its dry stone parts of walls and towers are impressively maintained. Few wheat cultivation terraces and huts constitute also important architectural entities at the outskirts of the village.
Metsovo Region.Megalo Peristeri. At the hill slopes
around the village are very beautiful local terraces of small height. Their main uses are of ownership boundaries and pasturage, while within the settlement they are used to cultivate vegetables and fruit trees Balntouma. around the settlement and at length of valley of Arahthos there are impressive terraced landscapes many of which are still in use as vineyards or walnut, almond, apple and cherry cultivations.
Anatoliki. It is a typical terraced settlement that reaches from the village down to the river. In the village’s entry a small portion of terraces have been restored for biological products culture. At the outskirts one meets four watermills, a sample of the importance of the network of irrigation and watermills. Old residences, auxiliary spaces and other architectural elements supplement the landscape.
Tzoumerka Region. Kalentzi-Monolithi. On the road that
connects these villages there lies an exquisite landscape of terraces. They are mainly used for the cultivation of olive trees, chestnuts, pomegranates, vines and vegetables. The use of dry stone is also apparent in a lot of the settlement’s buildings.
Petrovouni-Paliohori. The existence of a particularly steep landscape calls for many terraces. These are visible at the slopes around the villages and the ones that were not abandoned are still used for vine and vegetable cultivation.
Kalarites-Sirako. At these two villages one sees an extensive use of dry stone in the construction of terraces, buildings, and bridges. The landscape has not changed dramatically: existing mills, auxiliary spaces and property
338
“Sustainable Management and Development of Mountainous and Island Areas”

walls, but unfortunately many of the terraces have been destroyed because of lack of maintenance and use of pasture.
Pogonio Region. Geroplatanos. An extensive use of dry
stone, that is mainly visible in auxiliary buildings, property walls and terraces with mainly vine and vegetable cultivations. Terraced walls are constructed with limestone. Most architectural elements are covered today by dense vegetation.
Meropi. This village exhibits centuries of tradition in the use of terraces, given the fact that a lot of ancient tombs and buildings have been discovered [1]. Today many of the settlement’s buildings, and terraces of the predominantly mountainous landscape, use the same technique.
Pogoniani. In this village terraces always had a special role, but today most of them have been covered by vegetation or have been destroyed by pasturage use. Many terraces and auxiliary buildings are also visible around the village.
Oreokastro. On the right side of the village’s entry there is a Byzantine castle with dry stone walls. Abundant traditional architecture can be found using dry stone techniques at auxiliary buildings, and terraces.
Dodoni Region.Manteio-Meliggoi. The villages are
located at the Eastern side of Mt. Tomaros and have vegetable and vine cultivations. Existing terraces are in a good shape, but covered with vegetation.
Kopani. The road that leads to Derviziana offers an astonishing view towards the terraces of the valley. Terraces are of low height, usually made from lime stones and generally not been well maintained.
West of Ioannina RegionDovla-Vereniki. Terraces of these
settlements are mainly used for the cultivation of vegetables, but one also sees fruit trees or even olive trees. Certain terraces are also used for pasturage.
Kourenta-Hinka. In this region one finds agricultural infrastructures with huts, stables, wheat fields and property walls. There are also terraces where vegetables, vine and few fruit trees are cultivated.
CYCLADES
All of the Cycladic islands create the impression that they are barren, dry land. The landscape is characterized from irregular and intense relief. Folds and cracks create a geographical and topographical entity comprised of hills, mountains of medium altitude and abrupt slopes as well as rocky outcrops. With a few exceptions, flat lands are almost non existent, construction materials are scarce and water a valuable commodity. The problem of limited resources was faced since ancient years with the creation of terraces.[2] At the same time extensive use of local stone can be found in built-up, paths and auxiliary spaces. Examples from all the islands are many, but in this paper the regions of Naxos and Andros will presented indicatively, where one can observe impressive construction of terraced landscapes.
Naxos.Naxos is the largest island of Cyclades
and presents a big diversity of landscapes in different geographic areas. The landscape at the Eastern and particularly the north-northeastern mountainous area that presents many inclinations is impressive. Its main characteristic is the agricultural system of terraces. They are integral structural elements of the agricultural landscapes connected with agricultural production, but simultaneously they are monuments of cultural heritage: mainly paved paths and scattered windmills-watermills, as well as springs and oil production facilities. At the south-eastern part some of the most important agricultural regions of mountainous Naxos with medieval settlements that present exceptional variety in the use of dry stone in buildings, wheat fields, etc can be found.
Koronos Region. An important medieval settlement of Naxos, that includes almost all structures made of stone and is used as a typical example of the use of dry stone construction in the island. The current settlement of Atsipati dated between the 15th -16th century, but there are also previous discoveries as well as ruined buildings. Among the ancient monuments that are found in the settlement is one of greatest importance: the ruins of Ammomaxis castle (15th century B.C.), which in the medieval years was property of Cr. Somaripa [6]. In our days, the village is no longer inhabited and most of the
339
“Sustainable Management and Development of Mountainous and Island Areas”

buildings are ruined. Some lodges are used by the farmers as farm houses and are maintained in good state. In the ruins the visitor can see various types of construction and interesting buildings, as well as old ovens, wheat fields, etc
The settlement is surrounded by fruit and vine cultivations built in terraces on both sides of the small valley. Various properties and the settlement are connected with a network of narrow stone paths and stairways. At the lower part there is a spring which irrigates part of the region. There are a lot of wells, water tapping galleries and tanks for the irrigation of all properties, all built with dry stone. Properties are protected with walls of dry stone construction that are up to 2, 00 m. high.
Andros. It is the northern island of Cyclades,
rich in natural beauty and dramatic oppositions in its landscape. The abundant waters create additional opportunities for cultivations at its green slopes. The largest part of the island slopes is full of terraces. Architecturally the use of stone is prevalent. Worth mentioning are the hydraulic works of water transport, retention, storage and drainage, constructed entirely of flagstones.
Korthi Region At the slope bellow Kapparia village one sees the most typical terraced landscape of Andros with kappari cultivations.
7. European reality and prospects: Programs – Objectives
During past years European Union is exploiting economic funds that are being provided by the Regional Growth Fund, FEOGA and European Community initiatives such as LEADER, INTERREG and LIFE, in order to support actions of promotion and reuse or terraced landscapes. In collaboration with its member countries, local administrations, academic institutions, NGOs, growth development companies, and also private individuals it is materializing a series of programs aiming to reuse and recapture abandoned terraced landscapes. With a policy of sensitizing local institutions and simultaneous funding cross-country collaborations, it accomplished corporate
networks towards mild and environmentally sensitive forms of growth. In its planning it has included nature and landscape protection, as well as promotion and preservation of cultural particularities of each region. Below, indicatively are presented aims and actions of programs relevant to dry stone terraced landscapes in Greece and other European countries.
A. Under the European community initiative LEADER II run the program "Terraced landscapes, millenia of innovation". Since June 1998, four local action teams from four regions of the European Union, gathered in order to work and study jointly the problems associated with terraced agriculture. The participants were: a) Chataigneraie et Sysc d' Ardeche, Rhone – Alpes, France, b) Alta Langa, Piemonte, Italy, c) Serra de Tramuntana, Mallorca Spain, and d) Growth Development Company "Epirus" S.A., Greece.
Collective work was focused on economic, social, cultural, historical, environmental and aesthetic importance of landscapes terraces for mankind. The program attempted to contribute in the promotion of the rebirth of terraces based on three following objectives with regard to terraced landscapes:
- To be recognized in each country and at European level as common cultural heritage of primary importance.
- To experience rebirth through new innovative uses and practices that will give new economic prospects.
- To be preserved, especially those that contribute to environmental protection, to comprehension of past and sense of belonging in these spaces.
The program through common efforts collected common reflections, knowledge and opinions, despite the great separating distance.
In order to sensitize institutions, public and local populations, the following actions were produced: - Creation of visual identity, logo and slogan. - Video production presentation for public awareness. - Publication of a “terrace restoration guide”. - Calendar publication (year 2001) with subjects exhibiting terraced landscapes. - Search of sponsors that would strengthen the actions for promotion of terraced landscapes. - Mass media sponsorship.
340
“Sustainable Management and Development of Mountainous and Island Areas”

- Organizing of training seminars on the subjects of terraced landscapes. - Creation of "Technical Handbook" for dry stone terrace construction.
B. Under the framework of LEADER II a local program called MEDSTONE was established whose main objective was the restoration of stone paths of medieval settlements at Koronos Naxos.
The program exploiting the results of previous pilot actions, aimed at farmers’ income increase by: a) attracting walkers and special interest tourists at the region by creating a local economy of domestic products, and b) improving the network of communications of rural streets and stone steps.
The actions taken for the settlement of Atsipati were the following: a) topographic– photographic architectural inventory study, b) restoration of paths and steps of settlement, c) restoration of dry stone terraces, where needed, (streets, paths and steps), d) aesthetic restoration of the region and the spring near the village, e) supply of materials and their transport, f) creation of resting points and observatories, g) informative plates and signs at the region.
C. Under the European Community initiative Interreg II another ambitious program was financed for the promotion, preservation and protection of monuments named "Stone",spanning from Epirus-Greece to Skodra- Albania.
The main objective of the program covered the technique and know-how of dry stone construction that is analyzed below: a) maintenance and preservation of characteristic cultural and architectural heritage with parallel promotion of dry stone monuments, b) learning of technical characteristics of work and the preservation of anthropogenic cultural landscape in the rural and urban space, c) exploitation, promotion and recovery of traditional techniques, d) improvement of living standard, e) increase of tourist infrastructures and attraction of alternative forms of tourism, f) population retention at mountainous and frontier regions of cross-border zones Epirus – Southern Albania, g) upgrading of traditional architecture at this particular cross-border area, increased
employment of craftsmen and aid of low per capita income at mountainous regions. The Proterra program expresses first and for most the will of twelve agricultural regions in 4 countries EU members to form a fertile relationship among landscape, agriculture and agricultural development in order to exploit terrace cultivation. It aims to reform terraces, in order to become spaces of innovation, using innovating methods such as: a) trans-cultural Proterra character, b) wide range of multidisciplinary approach, c) integrated approach of terraces recovery (biological culture, aromatic plants, arboriculture, agro-tourism, cultural action).
The twelve involved regions shared the experiences/comparisons exchange of innovative methods that led to the rebirth of rural regions. A dynamic was created stemming from a wide range of actions such as the creation of dry stone terraced craftsmen businesses and associations and creation of terrace eco museums in order to financially support agricultural exploitation in the mountainous regions and restore hundreds of meters of terraces. The results it produced are: - Aid of rural infrastructure with terraces. - Promotion and connection of terraces with quality agriculture. - Distribution of technical information to farmers. - Resurgence of profession of stone craftsman. - Growth of "sustainable" tourism base on the acquaintance of terraced regions and their products. - Communication, briefing and public awareness on the subject of terraces. - Organization of collaboration between regions with terraces.
8. Discussion: Evaluation/Restrictions and Potentials in Greece. Proposal for a Terraced oriented Greenway Network
. The physical configuration of terraced landscapes manifests the man-made re-designing of abrupt hillside topography. Terraced landscapes are not only places of astonishing beauty. They are also valuable witnesses of human inventiveness, patience, humility and labor that have been developed by man through the millennia in order to use
341
“Sustainable Management and Development of Mountainous and Island Areas”

and manage natural resources without destroying them. Today, these terraced landscapes of impeccable beauty, valuable for maintaining color at mountains and countryside, responsible for torrent interceptions, erosion control, enrichment of underground aquifer recharge, traditional-healthy agricultural production, and human communication, are in immediate danger and threatened by wall deterioration and collapse. Problems of weathering, soil erosion, loss of traditional agricultural communities and the abandonment of countryside in exchange for an easier life in the city delivered terraces at the mercy of the elements of nature and man’s ignorance. "Counterproductive" investments for the repair of terrace restoration and abandonment of the agricultural workforce, has brought their maintenance to a critical point. Today, the construction techniques that shaped them are being lost and forgotten. Techniques that were passed on from generation to generation, for millennia, deserve to be rescued as an appreciable element of every culture. Government grants and subsidies for repairs and exploitation of these landscapes and structures are considered direct and imperative in order to assure economic viability and sustainability of productive agricultural landscapes.
In order to promote compatible and environmentally sensitive forms of growth and development, that observes and respects natural laws by achieving harmonious coexistence of man-space, a thematic network of terrace greenways is proposed to facilitate easy access to present and future generations.
It is the research team’s prediction that if such a project is implemented, some of the medium to long range beneficial goals of this thematic network of terrace greenway will be:
o Increased ease of transportation (accessibility).
o Promotion of terraced landscapes. o Increased number of visitors. o Increased income influx. o New job positions. o Increased contact and awareness of
nature’s ecological processes. o Increased contact and awareness of a
valid traditional lifestyle (social processes).
o Regeneration of abandoned terraced communities.
Selected References
[1] Andreou E, Meropi, Pogoni tombs Archaeology 1982. vol 3; 54-60
[2] Glotz G. The Aegean Civilization. London;1925.
[3] Goutos C. Molistina: HistoricData on the Villages of Molista, Konitsa, Gannadio, Mesaria, Monastiri. Athens;1983.
[4] Kamaroulias D. Monasteries of Epirus. Vol.A. Athens; 1996.
[5] Lassure C. Une architecture populaire et anonyme: l’ architecture rurale en piere seche de la France. Maisons Paysannes de France. Paris 1978; 50:12-16.
[6] Sfyroeras B. History of Naxos since 1207. Kathimerini;13/7/1997.
[7] Sprague De Camp L. The Ancient Engineers. Garden City. New York 1963.
[8] Sykas B. Zagorohoria. The treasure behind the mountain. Peraeus; 2003.
[9] Tufuell R. Better Dry Stone Walling. The Dry Stone Walling Association of Great Britain. Kenilworth 1991.
[10] Vertodoulos A. Epirus, Cultural Heritage and Nature.1990.
[11] Vokotopoulou I. Vitsa. Tombs of a Molosic village. Athens, 1986.
[12]http://www.international.icomos.org/ centre_documentation/drystone_eng.pdf.
342
“Sustainable Management and Development of Mountainous and Island Areas”

Assessment and Application of Random Amplified Polymorphic DNA PCR analysis as a Fecal Source Tracking Technique
D. Venieri1, G. Komninou2, E. Bezirtzoglou3, M. Papapetropoulou4
1Faculty of Agricultural Development, Democritus University of Thrace, 193 Pantazidou St, 68200, Orestiada, Greece. Email address: [email protected]
2Lab of Hygiene, Medical School, University of Patras, Patras 26500, Greece. Email address: [email protected]
31Faculty of Agricultural Development, Democritus University of Thrace, 193 Pantazidou St, 68200, Orestiada, Greece. Email address: [email protected]
4Lab of Hygiene, Medical School, University of Patras, Patras 26500, Greece. Email address: [email protected]
Abstract RAPD-PCR analysis was assessed as a fecal source tracing method evaluating its basic typing characteristics using Escherichia coli isolates. We determined technique’s parameters discriminating E.coli isolates of known origin and we applied the method for the possible source tracing of E.coli isolates from tap water samples. Overall, 128 E.coli isolates of known origin were discriminated successfully with a high average rate of correct classification with two selected primers (>80%). Tap water isolates were classified providing a profile of each sampling site. In urban areas most isolates were classified as human while in the agricultural ones as animal. Our findings demonstrate RAPD analysis as a credit genotypic method that could be applied for environmental studies protecting water resources.
Keywords. Fecal pollution, E.coli, molecular typing, RAPD.
1. Introduction
Maintenance of the microbiological quality and safety of water systems is imperative, as their fecal contamination may exact high risks to human health and result in significant economic losses [4], [36]. Human population growth, inadequate sewage systems, and management of animal waste (especially related to concentrated animal feeding operations) are some of the issues associated with maintenance of supplies of pure water.
Fecal pollution can originate from human and nonhuman sources but without knowing the precise source of fecal input, the human health risk cannot be accurately predicted. Simple detection of fecal pollution, by counting
commensal coliform bacteria, is not sufficient in order to apply appropriate management plans to remedy the problem and to predict the human health risk accurately [27]. Fecal material from humans indicates the possible presence of human enteric pathogens such as Salmonella spp., Shigella spp., Hepatitis A virus and Noro viruses [10], [13], [27], while less risk is posed by non-human fecal material as the aforementioned pathogens are mainly associated with human diseases. Thus, it would be desirable to determine the source of the fecal material, especially if monitoring and management plans are to be developed [13], [43].
To meet this challenge, there have been various attempts to develop microbial source tracking (MST) methods that differentiate the origin of fecal pollution. Examples of these methods include detection of specific bacteriophages [11], the ratio of fecal coliforms to streptococci [11, [27], [31], [44], study of phenotypic structure and diversity of populations of fecal coliforms [10], [27], [28], [37] or even patterns of antibiotic resistance in certain populations of microorganisms [8], [9], [10], [11], [13], [18]. Current experimental data indicate that the aforementioned techniques are based on unstable parameters and may thereby lead to erroneous conclusions. More recently, DNA fingerprinting techniques such as ribotyping [3], [4], [12], [33], [34], pulsed-field gel electrophoresis [16], [21], [39], PCR of repetitive intergenic sequences [6], [14], [21], [22], [35], 16S ribosomal DNA length heterogeneity PCR with terminal restriction fragment length polymorphism [3] and RAPD-PCR [7], [19], [39] have been described as promising for discriminating between fecal origin bacteria from humans and animals.
343
“Sustainable Management and Development of Mountainous and Island Areas”

No single method has yet emerged as the best one, and there is a clear lack of comparative studies to determine the relative strength and weakness of each method [9], [28]. The most important selection criteria are specific characteristics of each method such as discriminatory power, reproducibility, typeability and stability. Also, the number of the bacterial isolates, the difficulty of the protocol, the necessary equipment and the cost of each analysis are taken into account [25]. What is generally recommended is the application of two or more MST methods in order to obtain comparing and valid classification results [28], [37].
Four bacterial genera have been used as target organisms in MST studies: Escherichia coli,Enterococcus, Bacteroides and Bifidobacterium.E. coli, which normally inhabits the intestine tract of human and warm-blooded animals, has long been used as an indicator of fecal pollution. [10], [13], [15], [20], [21], [22], [24], [26], [27], [34], [35].
In the present study the development and assessment of Randomly Amplified Polymorphic DNA-PCR Analysis (RAPD-PCR – genotypic method) was established as MST method. Parameters of the technique were determined for the discrimination of E. coli isolates of known origin and subsequently, the method was applied for the classification and the source tracing of E.coli isolates derived from tap water samples.
Furthermore, an evaluation of RAPD’s basic characteristics as a typing method (discriminatory power, reproducibility) was obtained. The main objective was the application of the method on a routine basis for the microbiological monitoring of aquatic environment with the view to assess the source of its fecal pollution as accurately as possible.
2. Materials and Methods
2.1. Bacterial strains
In total, 128 E. coli isolates were collected directly from fresh human and animal faeces according to standard procedures [27]. Human fecal samples (10 g) were obtained from healthy volunteers and hospitalised patients with gastroenteritis (children and adults). Animal fecal samples (20 g) derived from the veterinary department of Ministry of Agriculture and Food. Animal faeces come from numerous farm breeding cattle, goats and sheep from the same
geographical region (Table 1). All isolates (human and animal) come from different individuals sampled.
Fecal samples were diluted in 10-fold serial increments and 0.1ml of each dilution was plated on MacConkey agar (Becton Dickinson, Maryland, USA) and incubated at 37oC for 18-20 h. Typical E. coli colonies were screened on Tryptone Bile X-Glucoronide Medium-TBX (Oxoid LTD, Basingstoke, Hampshire, England) and incubated at 44oC for 18-20 h. E. coliisolates were confirmed depending on their biochemical characteristics and using standardized identification system API 20E (BioMérieux, 69280 Marcy-l’Étoile, France) and by a negative oxidase reaction (Dryslide, Difco, Detroit, MI, USA).
Bacterial strains of unknown origin were derived from tap water samples. In total 116 isolates were collected from 73 water samples from 11 sites (Table 1). From these areas A2, A3, A4, A6 and A10 are described as “urban”, while the rest of them are considered “agricultural”. A 100ml of each water sample was filtered through nitrocellulose membranes (0.45 m pore size, 47 mm diameter, Pall-Gelman Laboratory), which were transferred on T.B.X. medium (OXOID). The incubation conditions and the biochemical confirmation of E. coli isolates are the same as mentioned for the strains of known origin.
Table 1. E. coli isolates obtained from fecal material and municipal tap water samples
E. coli isolates of known origin Fecal sample obtained from: No. of isolates
Cattle 14 Sheep 24 Goat 22 Human-adult patients 39 Human-children patients 21 Human-healthy 8 Total 128
E. coli isolates of unknown origin Sample type (No.) No. of isolates Tap water (73) 116 Total 116
344
“Sustainable Management and Development of Mountainous and Island Areas”

2.2. DNA extraction
Genomic DNA was extracted from 1.5ml of stationary phase E. coli cells with the use of proteinase K and phenol-chloroform-isoamylalcohol (25:24:1) [40]. Namely, the cells were spun for 2 min in a microcentrifuge, suspended in 567 l of 50 Tris, 50 mM EDTA, pH 8.0 plus 30 l 10% SDS and 3 l of 20 mg/ml proteinase K and incubated 1 hr at 37o
C. Then 80 l of 10% CTAB in 0.7% NaCl was added and the mixture was incubated for 10 min at 65 C. The solution was extracted with 750 lof chloroform/isoamyl alcohol (24:1), spun, and the aqueous phase was re-extracted with phenol/chloroform/isoamyl alcohol (25:24:1). DNA was precipitated from the aqueous phase with 500 l of isopropanol. The precipitate was washed with 70% ethanol, dried briefly and resuspended in 100 l of 50 mM Tris, 50 mM EDTA, pH 8.0. The quantity of all DNA samples was determined by measuring their absorbance value at 260nm. The purity of nucleic acid was also determined by the ratio of samples’ absorbance values at 260 nm and 280 nm.
2.3. RAPD fingerprinting
In total, 18 different 10-nt primers of arbitrary sequence were tested and two of them (1254: 5 -CCGCAGCCAA-3 and 1290: 5 -GTGGATGCGA-3 ) were chosen for further study as they gave the most discriminating RAPD fingerprints [32]. PCR was performed with the use of Peltier Thermal Cycler PTC-200 (MJ Research) in 50 l reaction volumes containing approximately 50 ng of bacterial DNA, Mg Cl2 2.5 mM (Applied Biosystems, Foster City, USA), 10 X PCR buffer (Applied Biosystems, Foster City, USA), 20 pmol of the primer, 1 U of AmpliTaq DNA polymerase (Applied Biosystems, Foster City, USA) and 250 M of each dNTP (Amersham Pharmacia Biotech Inc, USA). All data used in the present analysis were generated in a cycling program of 45 cycles of 94oC, 1min; 38oC ramp to 72oC,3min and 72oC, 2 min. After PCR 20 l aliquots of the products were electrophoresed in 2% Nuisive agarose gels containing 0.5 g/ml ethidium-bromide. A molecular size marker (100bp-New England BioLabs, Hertfordshire U.K) was used for reference in all gels. All gels were photographed under UV light and RAPD profiles were analyzed with the LabWorksTM
Analysis Software UVP-Version 3.0.02.00.
2.4. Statistical Analysis of data
The normalization of each RAPD profile was accomplished by using the equation proposed by Plikaytis [30], and with the use of the profile ofE. coli NCTC 9001, as reference. Hierarchical cluster analysis (CA) was performed using the unweighted-pair group method with arithmetic average algorithm (UPGMA) and the Pearson product moment correlation coefficient. The clustering results obtained with the two selected primers were subjected to discriminant analysis (DA, prior probabilities, equal; covariance matrix, pooled). The average rate of correct classification (ARCC) for each analysis was determined by averaging the percentages of correctly classified isolates for each source as described by Wiggins (1996). Relationships were also demonstrated with plot of principal-component similarity coefficients.
The discriminatory power of the two methods was estimated according to Simpson coefficient of variance. The range of values is between 0 and 1.
All computations were performed with the SPSS v12.0 software (SPSS Inc.,USA).
2.5. Assessment of reproducibility of RAPD analysis
The reproducibility of the technique was assessed in four ways: a) Independent RAPD assays were applied three times with each of the two selected primers using the same DNA templates from five human and five animal isolates, b) RAPD assay was applied twice using DNA templates from five human and five animal isolates extracted at different times, c) RAPD assays were applied to E. coli isolates obtained from different colonies of the reference strain E. coli NCTC 9001 grown on the same Petri dish and d) RAPD assay was applied with the two selected primers using DNA templates from three E. coli isolates (one human and two animal isolates) and five different Taq DNA polymerases obtained from five different commercial companies.
The similarity index of RAPD profiles was defined as the fraction of shared bands [17], [29]. Specifically, for individuals x and y, it is the number of common bands in their RAPD profiles (nxy) divided by the average number of bands scored for both individuals: Sxy=2nxy/(nx+ny). Sxycan take values between 0 and 1 if bands are
345
“Sustainable Management and Development of Mountainous and Island Areas”

completely reproducible. Band repeatability was also defined as Rb = 2b12 / (b1+b2) [30], where b12 is the number of individuals possessing band b in both replicates and b1 and b2 are the numbers of individuals possessing that band in the first and the second replicate, respectively. Rb can take values between 0 and 1.
3. Results
In total 128 E. coli isolates derived from human and animal fecal material were subjected to RAPD-PCR in order to establish a classification according to their source, based on their genetic diversity. Eighteen primers that have been useful in RAPD studies were screened with a few (thirty) E. coli isolates and two of them (1254 and 1290) that yielded the largest number of clear and discriminatory bands were selected for detailed testing of sequence divergence among isolates [32]. All isolates were typeable with both primers, yielding a variety of amplification bands.
3.1. Primer 1254
With primer 1254, RAPD profiles were consisted of 3 to 16 amplification bands ranging from 332 bp to 2325 bp. Screening the patterns obtained from human and animal isolates separately, different combinations of amplification bands were obvious. Specifically, apart from the shared bands among all isolates tested, E. coli derived from human fecal material showed 6 distinct amplification DNA bands compared to 14 bands present in animal RAPD profiles. Based on these differences of generated genetic profiles, Cluster Analysis (CA) divided the 128 isolates into two major groups separating human from animal E. coli isolates. One cluster was consisted of the majority of human isolates (98.6%) while the other major cluster contained all animal isolates (100%). The misclassification of human E. coli concerned one isolate obtained from a child patient. The dissimilarity level between the large groups formed, reached a value of 85%, providing a discrete and satisfactory separation between human and animal isolates. Principal-component analysis resulted in the grouping of isolates demonstrated in Fig. 1. As it is shown, human isolates were well distinguished from animal isolates with distinct group centroids (Fig. 1). Although cattle,
sheep and goat isolates were not classified separately in distinct subgroups, they were pooled together and were separated from human isolates. Similarly, human isolates were not distinguished among adult, children and isolates from healthy volunteers. Furthermore, there was an incidence of many subgroups, generated especially by animal isolates, indicating unique RAPD profiles (Fig. 1).
Discriminant analysis (DA) was performed in order to validate the classification and separation of the 128 E. coli isolates of animal and human source. The sources of isolates (human, cattle, sheep and goat) were analysed based on the differences observed in their RAPD profiles. Table 2 shows that human isolates were better classified in contrast to animal E. coli, which were classified at lower levels. The average rate of correct classification (ARCC) using separate human or animal sources was 77.7%. Pooling all animal isolates together in one group and human isolates in another, since the most important goal was to differentiate between animal and human sources, the classification rate was improved. When DA of these two sources (human or animal) was performed the ARCC increased to a value 98.4%.
Figure 1. Two-dimensional plot of RAPD patterns, using primer 1254, by principal
component analysis. : Group Centroids, :1. human isolates, : 2.cattle isolates, :
3. sheep isolates, : 4. goat isolates
-6 -4 -2 0 2 4 6
Function 1
-3
-2
-1
0
1
2
3
4
Func
tion
2
1
2 3
4
a) Primer 1254
346
“Sustainable Management and Development of Mountainous and Island Areas”

Table 2. Discriminant analysis of RAPD profiles using primer 1254 of E. coli isolates from human and animal fecal material.
% of isolates classified as: Source(No. of isolates) Human Cattle Sheep Goat Total Human (68) 91.2 0 0 8.8 100Cattle (14) 0 71.4 7.1 21.4 100Sheep (24) 0 12.5 70.8 16.7 100Goat (22) 0 0 22.7 77.3 100
% of isolates classified as: Human Animal Total
Human (68) 100 0 100Animal (60) 3.3 97.7 100
3.2. Primer 1290
Similar results were obtained by performing RAPD analysis under the same conditions with the primer 1290. RAPD patterns of the 128 E.coli isolates were consisted of 2 to 15 amplification bands with a range of 182 bp to 2342 bp. As far as the distinct amplification bands among isolates are concerned, 8 DNA bands were mainly present in human isolates compared to 6 different ones observed in animal isolates. These differences of generated genetic profiles resulted in the formation of a dendrogram (data not shown), applying CA, which separated the 128 isolates into two major groups, according to the source of the fecal material. Two major clusters were formed, the one consisted of human and the other of animal isolates, respectively. The dissimilarity level between the two large groups formed was 60%, separating satisfactory human from animal isolates. As it was observed with primer 1254 animal isolates were also not classified separately in distinct subgroups. Nevertheless, they were pooled together and were separated from human isolates.
Principal-component analysis, with data obtained from the analysis with primer 1290, separated E. coli isolates, showing well the distinct groups (Fig. 2).
The DA performed validated the classification mentioned. As it occurred with primer 1254, human isolates were better
classified, in contrast to animal E. coli (Table 3). The ARCC was 79%. Pooling all animal isolates together the ARCC was significantly improved to a value of 98.4%.
Figure 2. Two-dimensional plot of RAPD patterns, using primer 1290, by principal
component analysis. : Group Centroids, :1. human isolates, : 2.cattle isolates, :
3. sheep isolates, : 4. goat isolates
-10 -5 0 5
Function 1
-4
-3
-2
-1
0
1
2
3
Func
tion
2 12
3
4
b)Primer 1290
347
“Sustainable Management and Development of Mountainous and Island Areas”

Table 3. Discriminant analysis of RAPD patterns using primer 1290 of E. coli isolates from human and animal fecal material.
% of isolates classified as: Source(No. of isolates) Human Cattle Sheep Goat Total Human (68) 98.5 1.5 0 0 100Cattle (14) 0 50.0 35.7 14.3 100Sheep (24) 0 4.2 70.8 25.0 100Goat (22) 0 0 3.4 96.6 100
% of isolates classified as: Human Animal Total
Human (68) 98.6 1.4 100Animal (60) 1.7 98.3 100
3.3. Reproducibility of RAPD analysis
The reproducibility of the technique was assessed in four ways, as mentioned previously. The similarity index Sxy of the RAPD profiles generated using primers 1254 and 1290 separately and their band repeatability Rb are shown in Table 4. Generally, applying RAPD analysis (a) at different times, (b) using different DNA extracts and (c) using different colonies of the same Petri dish the results were highly
reproducible with both primers, as average Sxyand Rb reached values close to 1.00 for the isolates tested. The similarity of RAPD profiles and band repeatability were considerably lower when different AmpliTaq DNA polymerases were used (d). Screening the isolates’ patterns, the number of amplification bands varied depending on the enzyme used. Thus the two human isolates tested generated 7 to 10 bands with primer 1254 and 5 to 10 with primer 1290. The animal isolate tested with the five different enzymes showed 8 to 11 bands with primer 1254 and 3 to 6 with primer 1290, respectively.
Table 4. Assessment of reproducibility of RAPD analysis.
Assessment of reproducibility of RAPD analysis with primer 1254 a1 b2 c3 d4
Human isolates
Animal isolates
Human isolates
Animal isolates
E. coli NCTC 9001
Human isolates
Animal isolates
Average S 0.95 0.89 0.86 0.95 1.00 0.75 0.77 Average Rb 0.89 0.78 0.76 0.92 1.00 0.71 0.62 Assessment of reproducibility of RAPD analysis with primer 1290
a1 b2 c3 d4
Human isolates
Animal isolates
Human isolates
Animal isolates
E. coli NCTC 9001
Human isolates
Animal isolates
Average S 0.98 0.98 0.86 0.89 1.00 0.71 0.65 Average Rb 0.98 1.00 0.75 0.80 1.00 0.56 0.43 1 Performance of RAPD analysis with the same DNA extracts at different times. 2 Performance of RAPD analysis with different DNA extracts. 3 Performance of RAPD analysis with DNA extracts obtained from different colonies of the same reference strain E. coli NCTC 9001. 4 Performance of RAPD analysis using AmpliTaq DNA polymerase obtained from five different brands.
348
“Sustainable Management and Development of Mountainous and Island Areas”

Table 5. Discriminant analysis for the classification of E. coli isolates from tap water samples with the selected methods.
% of E. coli isolates from sampling sites A1 A11 classified as: Human Animal Sampling
site RAPD primer 1254
RAPD primer 1290
RAPD primer 1254
RAPD primer 1290
A1 31.58 26.32 68.42 73.68 A2 100.00 100.00 0.00 0.00 A3 64.29 64.29 35.71 35.71 A4 100.00 66.67 0.00 33.33 A5 38.89 38.89 61.11 61.11 A6 100.00 100.00 0.00 0.00 A7 20.00 20.00 80.00 80.00 A8 100.00 100.00 0.00 0.00 A9 62.96 62.96 37.04 37.04
A10 100.00 100.00 0.00 0.00 A11 80.00 70.00 20.00 30.00
3.4. Classification of the E. coli isolates of unknown origin with the two selected methods.
E. coli of unknown origin were classified as human or animal according to the database of RAPD profiles generated by the 128 strains of known source. Classification of E. coli isolates from tap water samples is shown in Table 5. Classification results with the primers selected did not vary significantly (P>0.05) as they were in accordance for 94% of the isolates.
4. Discussion
In the last 10 years, microbial source tracking, using phenotypic and genotypic methods, has been carried out in a variety of studies to identify point and non point sources of fecal pollution [4], [6], [27]. In the present study RAPD fingerprinting was developed and evaluated as MST method. The parameters of the technique were strictly defined for the discrimination of E.coli isolates of known origin. The host strain library was consisted of 128 E. coli isolates (Table 1), sampled one isolate per individual. The selection of the isolates of known origin was designed according to other studies [16], for the further classification of unknown E. coli isolates as animal or human. When using host strain libraries, taking multiple isolates from the same animal may be problematic in analyses because these isolates may inflate the estimated frequency of a particular stain in the overall
population and bias assessments of the host strain library as they will self-identify rather than reflect true similarities across the greater E. colipopulation [6], [15], [21].
RAPD with appropriate statistical analysis was proved to be suitable for the discrimination of the E. coli isolates. Experimental data indicated that there were considerably different RAPD fingerprints between the human and animal isolates, resulting in high ARCC, when applying DA (Tables 2 and 3). Although there is not an established standard of accuracy that has been defined for any MST method, any technique with an ARCC of over 50% has been considered as a worthwhile tool for predicting the potential sources of fecal pollution in the aquatic environment [34], [43], [45].
Evaluating the method applied there were some concerns regarding the reproducibility of the RAPD procedure, as it has already been stated [2], [29]. What our control tests show (Table 4) is that when an appropriate set of primers is chosen and all parameters are strictly defined RAPD analysis may provide a rapid, reproducible and powerful method for the discrimination of fecal pollution in the aquatic environment [1]. The two selected primers produced highly reproducible RAPD profiles and gave an extended flexibility and sensitivity to the typing method. The use of more than one primer seems to be advantageous, since it adds to the consistency of the established groups [23], [42].
After stabilizing the parameters of the methods we proceeded with the differentiation
349
“Sustainable Management and Development of Mountainous and Island Areas”

and discrimination of the origin of fecal pollution in tap water samples (Table 1). Discriminant analysis of the RAPD profiles classified the isolates from tap water samples according to their human or animal source. The geographic variation of the isolates resulted in DNA fingerprints considerably different with both primers used [38]. The classification based on the genotypic fingerprints of the isolates conduced to an accurate profile of the sampling areas, especially given that the categorization was in compliance with both primers in 91% of the sites. Therefore, in urban sampling areas the majority of the E. coli isolates having been classified as human, were due to possible malfunction of the sewage system and sewers’ outfalls [8]. Furthermore, in agricultural areas isolates were more divided into the two distinct groups indicating the presence of both human and animal fecal material in the water system, suggesting management plans such as checking of sewage conductors and control of animal circulation in each territory.
Although the combination of a genotypic along with a phenotypic method is recommended [28], [37], our results render RAPD fingerprinting as a DNA based technique, which could fulfill MST environmental studies. What ads to its consistency are the high discriminatory power, sensitivity and reproducibility under conditions strictly defined [41]. Furthermore, RAPD has a relatively low cost and is considered appropriate methodology for the examination of a large number of bacterial isolates [1], [5]. Taking into account parameters such as the necessary periodic expansion of the database of the known isolates, or the critical statistical analysis of experimental data RAPD may be a valuable molecular MST method for testing the quality of aquatic environment, protecting water resources and public health.
5. References
[1] Bentancor L, Schelotto F, Martinez A, Pereira M, Algorta G, Rodríguez MA, Vignoli R, Chabalgoity JA. Random amplified polymorphic DNA and phenotyping analysis of Salmonella enteritidis isolates collected from humans and poultry in Uruguay from 1995 to 2002. Journal of Clinical Microbiology. 2004; 42:1155-1162.
[2] Benter T, Papadopoulos S, Pape M, Manns M, Poliwoda H. Optimization and
reproducibility of Random Amplified Polymorphic DNA in human. Analytical Biochemistry 1995; 230:92-100.
[3] Bernhard AE, Field KG. A PCR assay to discriminate human and animal feces on the basis of host differences in Bacteroides-Prevotella genes encoding 16S rRNA Applied and Environmental Microbiology 2000; 66:4571-4574.
[4] Carson CA, Shear BL, Ellersieck MR, Asfaw A. Identification of fecal Escherichia coli from humans and animals by ribotyping. Applied and Environmental Microbiology 2001; 67(4): 1503-1507.
[5] Dautle M.P, Ulrich RL, Hughes TA. Typing and subtyping of 83 clinical isolates purified from surgically implanted silicone feeding tubes by Random Amplified Polymorphic DNA Amplification. Journal of Clinical Microbiology. 2002 ; 40:414-421.
[6] Dombek PE, Johnson LK, Zimmerley SJ, Sadowsky MJ. Use of repetitive DNA sequences and the PCR to differentiate Escherichia coli isolates from human and animal sources. Applied and Environmental Microbiology 2000; 66:2572-2577.
[7] Gelsomino R, Vancanneyt M, Cogan TM, Condon S, Awings J. Source of enterococci in a farmhouse raw-milk cheese. Applied and Environmental Microbiology 2002; 68:3560-3565.
[8] Goñi-Urriza M, Capdepuy M, Arpin C, Raymond N, Caumette P, Quentin C. Impact of an urban effluent on antibiotic resistance of riverine Enterobacteriaceae and Aeromonas spp. Applied and Environmental Microbiology 2000; 66:125-132.
[9] Graves AK, Hagedorn C, Teetor A, Mahal M, Booth AM, Reneau Jr RB. Antibiotic resistance profiles to determine sources of fecal contamination in a rural Virginia Watershed. Journal of Environmental Quality 2002; 31:1300-1308.
[10] Guan S, Xu R, Chen S, Odumeru J, Gyles C. Development of a procedure for discriminating among Escherichia coli isolates from animal and human sources. Applied and Environmental Microbiology 2002; 68(6):2690-2698.
[11] Hagedorn C, Robinson SL, Flitz JR, Grubbs SM, Angier TA, Reneau RB. Determining sources of fecal pollution in rural Virginia watershed with antibiotic resistance patterns in fecal streptococci Applied and
350

Environmental Microbiology 1999; 65:5522-5531.
[12] Hartel PG, Summer JD, Hill JL, Collins V, Entry JA, Segars WI. Geographic variability of Escherichia coli ribotypes from animals in Idaho and Georgia. Journal of Environmental Quality 2002; 31:1273-1278.
[13] Harwood VJ, Whitlock J, Withington V. Classification of antibiotic resistance patterns of indicator bacteria by discriminant analysis: use in predicting the source of fecal contamination in subtropical waters Applied and Environmental Microbiology 2000; 66:3698-3704.
[14] Johnson JR, O’Bryan TT. Improved repetitive-element PCR fingerprinting for resolving pathogenic and non-pathogenic phylogenetic groups within Escherichia coli.Clinical and Diagnostic Laboratory Immunology 2000; 7:265-273.
[15] Johnson LK, Brown MB, Carruthers EA, Ferguson JA, Dombek PE, Sadowsky MJ. Sample size, library composition and genotypic diversity among natural populations of Escherichia coli from different animals influence accuracy of determining sources of fecal pollution. Applied and Environmental Microbiology 2004; 70:4478-4485.
[16] Khan A, Das SC, Ramamurthy T, Sikdar A, Khanan J, Yamasaki S, Takeda Y, Nair GB. Antibiotic resistance, virulence gene and molecular profiles of shiga toxin-producing Escherichia coli isolates from diverse sources in Calcutta, India. Journal of Clinical Microbiology 2002; 40(6):2009-2015.
[17] Lynch M. The similarity index and DNA fingerprinting. Molecular Biology and Evolution 1990; 7:478-484.
[18] Mathew AG, Saxton AM, Upchurch WG, Chattin SE. Multiple antibiotic resistance patterns of Escherichia coli isolates from swine farms. Applied and Environmental Microbiology 1999; 65:2770-2772.
[19] Mättö J, Malinen E, Suihko ML, Alander M, Palva A, Saarela M. Genetic heterogeneity and functional properties of intestinal bifidobacteria. Journal of Applied Microbiology 2004; 97:459-470.
[20] Maynard C, Bekal S, Sanschagrin F, Levesque RC, Brousseau R, Masson L, Larivière S, Harel J. Heterogeneity among virulence and antimicrobial resistance gene profiles of extraintestinal Escherichia coli
isolates of animal and human origin. Journal of Clinical Microbiology 2004; 42:5444-5452.
[21] McLellan S, Daniels AD, Salmore AK. Genetic characterization of Escherichia colipopulations from host sources of fecal pollution by using DNA fingerprinting. Applied and Environmental Microbiology 2003 ; 69:2587-2594.
[22] McLellan S. Genetic diversity of Escherichia coli isolated from urban rivers and beach water. Applied and Environmental Microbiology 2004; 70:4658-4665.
[23] Micheli MR, Bova R, Calissano P, D’Ambrosio E. Randomly amplified polymorphic DNA fingerprinting using combinations of oligonucleotide primers. Biotechniques 1993; 15:388-390.
[24] Nagashima K, Hisada T, Sato M, Mochizuki J. Application of new primer-enzyme combinations to terminal restriction fragment length polymorphism profiling of bacterial populations in human feces. Applied and Environmental Microbiology 2003; 69:1251-1262.
[25] Olive DM, Bean P. Principles and applications of methods for DNA-based typing of microbial organisms. Journal of Clinical Microbiology 1999; 37:1661-1669.
[26] Parveen S, Murphree RL, Edmiston L, Kaspar CW, Portier KM, Tamplin ML. Association of multiple-antibiotic-resistance profiles with point and nonpoint sources of Escherichia coli in Apalachicola Bay. Applied and Environmental Microbiology 1997; 63:2607-2612.
[27] Parveen S, Portier K, Robinson K, Edmiston L, Tamplin M. Discriminant analysis of Ribotype profiles of Escherichia coli for differentiating human and non human sources of fecal pollution. Applied and Environmental Microbiology 1999; 65(7):3142-3147.
[28] Parveen S, Hodge NC, Stall RE, Farrah SR, Tamplin ML. Phenotypic and genotypic characterization of human and nonhuman Escherichia coli. Water Research 2001; 2:379-386.
[29] Pérez T, Albornoz J, Dominguez A. An evaluation of RAPD fragment reproducibility and nature. Molecular Ecology 1998; 7:1347-1357.
[30] Plikaytis BD, Carlone GM, Plikaytis BB. Numerical analysis of normalizes whole-cell
351
“Sustainable Management and Development of Mountainous and Island Areas”

protein profiles after sodium dodecyl sulphate-polyacrylamide gel electrophoresis. Journal of General Microbiology 1986; 132:2653-2660.
[31] Poucher AM, Devriese LA, Hernandez JF, Delattre JM. Enumeration by a miniaturized method of Escherichia coli, Streptococcus bovis and enterococci as indicators of the origin of fecal pollution of waters. Journal of Applied Bacteriology 1991; 70:525-530.
[32]Regua-Mangia HA, Guth BC, da Costa Adrade JR, Irino K. Genotypic and phenotypic characterization of enterotoxigenic Escherichia coli (ETEC) strains isolated in Rio de Janeiro City, Brasil. FEMS Immunology and Medical Microbiology 2004; 40:155-162.
[33] Samadpour M, Roberts MC, Kitts C, Mulugeta W, Alfi D. The use of ribotyping and antibiotic resistance patterns for identification of host sources of Escherichia coli strains. Letters in Applied Microbiology 2005; 40:63-68.
[34] Scott TM, Parveen S, Portier KM, Rose JB, Tamplin ML, Farrah SR, Koo A, Lukasik J. Geographic variation in ribotype profiles of Escherichia coli isolates from humans, swine, poultry, beef and dairy cattle in Florida. Applied and Environmental Microbiology 2003; 69: 1089-1092.
[35] Seurinck S, Verstraete W, Siciliano SD. Use of 16S-23S rRna intergenic region PCR and repetitive extragenic palindromic PCR analyses of Escherichia coli isolates to identify nonpoint fecal sources. Appl ied and Environmental Microbiology 2003; 69:4942-4950.
[36] Sinton LW, Finlay RK, Hannah DJ. Distinguishing human from animal fecal contamination in water: a review. New Zeal. Journal of Marine Freshwater Research 1998; 32:323-348.
[37] Stefani S. Molecular epidemiology of antibiotic resistance. International Journal of Antimicrobial Agents 2000; 13:143-153.
[38] Szczuka E, Kaznowski A. Typing of clinical and environmental Aeromonas sp. strains by random amplified polymorphic DNA PCR, repetitive extragenic palindromic PCR, and enterobacterial repetitive intragenic consensus sequence PCR. Journal of Clinical Microbiology 2004; 42:220-228.
[39] Vancanneyt M, Lombardi A, Andrighetto C, Knijff E, Torriani S, Björkroth KJ, Franz CMAP, Moreno MR, Revets H, de Vuyst L,
Swings J, Kersters K, Dellaglio F, Holzapfel WH. Intraspecies genomic groups in Enterococcus faecium and their correlation with origin and pathogenicity. Applied and Environmental Microbiology 2002; 68:1381-1391.
[40] Wang G, Whittam TS, Berg CM, Berg DE. RAPD PCR is more sensitive than multilocus enzyme electrophoresis for distinguishing related bacterial strains. Nucleic Acids Research 1993; 21:25-27.
[41] Weder JKP. Influence of experimental conditions on the reproducibility of RAPD-PCR identification of legumes and cereals. Lebensmittel-Wissenschaft und-Technologie 2002; 35:233-238.
[42] Welsh J, McClelland M. Fingerprinting genomes using PCR with arbitrary primers. Nucleic Acids Research 1990; 18(24):7213-7218.
[43] Wiggins B. Discriminant Analysis of Antibiotic resistance patterns in fecal streptococci, a method to differentiate human and animal sources of fecal pollution in natural waters. Applied and Environmental Microbiology 1996; 62(11):3997-4002.
[44] Wiggins BA, Andrews RW, Conway RA, Corr CL, Dobratz EJ, Dougherty DP, Eppard JR, Knupp SR, Limjcoco MC, Mettenburg JM, Rinehardt JM, Sonsino J, Torrijos RL, Zimmerman ME. Use of antibiotic resistance analysis to identify nonpoint sources of fecal pollution. Applied and Environmental Microbiology 1999; 65(8):3483-3486.
[45] Wiggins BA, Cash PW, Creamer WS, Dart SE, Garcia PP, Gerecke TM, Han J, Henry BL, Hoover KB, Johnson EL, Jones KC, McCarthy JG, McDonough JA, Mercer SA, Noto MJ, Park H, Phillips MS, Purner SM, Smith BM, Stevens EN, Varner AK. Use of antibiotic resistance analysis for representativeness testing of multiwatershed libraries. Applied and Environmental Microbiology 2003; 69:3399-3405.
352
“Sustainable Management and Development of Mountainous and Island Areas”

Profiles of Antibiotic Resistance in Escherichia coli Strains Isolated from Municipal Tap Water and Raw Sewage Samples in Greece.
D. Venieri1, G. Komninou2, E. Bezirtzoglou3, M. Papapetropoulou4
1Faculty of Agricultural Development, Democritus University of Thrace, 193 Pantazidou St, 68200, Orestiada, Greece. Email address: [email protected]
2Lab of Hygiene, Medical School, University of Patras, Patras 26500, Greece. Email address: [email protected]
3Faculty of Agricultural Development, Democritus University of Thrace, 193 Pantazidou St, 68200, Orestiada, Greece. Email address: [email protected]
4Lab of Hygiene, Medical School, University of Patras, Patras 26500, Greece. Email address: [email protected]
Abstract. The disk diffusion method was applied using 13 antibiotics to determine and compare resistance patterns in 234 Escherichia coli isolates recovered from municipal tap water and raw sewage samples in Greece. The objective was to evaluate the distinct resistance profiles and their correlation to drug use in these sampling sites. 87.18% of the isolates expressed resistance to one or more antibiotics developing discrete profiles according to their sampling site. Higher resistance rates were recorded in raw sewage samples with multiple resistance reaching 11 antibiotics. These findings pose crucial issues regarding resistance transfer among environmental strains and the effectiveness of drugs currently used.
Keywords. Antibiotic, E. coli, resistance pattern, water.
1. Introduction
The presence and persistence of antibiotic resistant (AR) and multiple antibiotic resistant (MAR) bacteria in the environment, including sewage and tap water is a growing public health concern [11]. These microorganisms may be shed in faeces with subsequent contamination of aquatic environments [12]. Their large-scale dissemination is due to the extensive use of antibiotics in human and veterinary medicine as well as in agriculture worldwide [17].
The increased prevalence of resistant isolates raises many concerns, since the antibacterial value of many drugs is threatened seriously [9]. Furthermore, resistance can easily be transferred among strains via R-factor plasmid vectors [1]. Particularly, wastewater and raw sewage are potential hot spots for horizontal transfer and
selection of antibiotic resistance genes among aquatic bacteria, due to the large microbial biomass and the quantity of nutrients [7].
Although it is well known that large quantities of enteric bacteria are released into water sources, a better understanding is needed about the prevalence of their antibiotic resistance and the significance of their occurrence [3].Differences in antibiotic usage and climate conditions may result in an extended variety of resistance profiles among enteropathogenic bacteria, as they are imposed to variable selective pressure in the aquatic environment [2]. Widespread and indiscriminate use of drugs does provide selection pressure in favour of organisms possessing genes that code for resistance [20].
Most studies, on the occurrence of antimicrobial resistant bacteria, focus on bacteria of faecal origin because they are commonly used as indicators of faecal pollution in water and food and may be associated with infectious diseases [5]. Specifically, Escherichia coli is a useful enteric bacterium as it is adapted to human and other warm-blooded animal gastrointestinal tract, and is readily exposed to a variety of medical and veterinary antibiotic treatments [18].
The present study was undertaken to determine and compare antibiotic resistance patterns in E. coli isolates recovered from (i) municipal drinking water sampled from 11 areas and (ii) from raw sewage samples derived from 4 treatment plants in Greece. The choice of the antibiotics was based on their common use in veterinary practice and human treatment. To date there have been no data regarding the prevalence of antibiotic resistance in E. coli isolates occurring in the aquatic environment of the areas selected. Hence, there was an overall effort to evaluate the distinct resistance profiles of the
353
“Sustainable Management and Development of Mountainous and Island Areas”

isolates and their possible correlation to the drug use in these areas in Greece.
2. Materials and methods
2.1. Bacterial strains
a) 116 E. coli isolates were derived from tap water samples collected from 11 sampling sites (Table 1). Areas A1, A2, A3, A4, A6 and A10 are described as “urban”, while the rest of them are considered “agricultural”. A 100ml of each water sample was filtered through nitrocellulose membranes (0.45 m pore size, 47 mm diameter, Pall-Gelman Laboratory), which were transferred on Tryptone Bile X-Glucoronide Medium-TBX (OXOID LTD, Basingstoke, Hampshire, England) and incubated at 44oC for 18-20 h. E. coli isolates were confirmed, using standardized identification system API 20E (BioMérieux, 69280 Marcy-l’Étoile, France).
b) 118 E. coli isolates derived from raw sewage samples collected from 4 treatment plants S1, S2, S3 and S4 (Table 1). Sewage samples were diluted in 10-fold serial increments and 0.1ml of each dilution was plated on MacConkey agar (Becton Dickinson, Maryland, USA) and incubated at 37oC for 18-20 h. Lactose positive colonies were screened on Nutrient Agar (OXOID) and incubated at 37oC for 18-20 h. E. coli isolates were confirmed using the system API 20E (BioMérieux).
2.2. Antibiotics
Thirteen antibiotics were tested. Their corresponding disk quantities were as follows: amikacin (30 g), amoxicillin (25 g), ampicillin (10 g), cephalothin (30 g), chloramphenicol (30 g), gentamicin (10 g), nalidixic acid (30 g), neomycin (30UI), nitrofurantoin (300mcg), norfloxacin (10 g), oxytetracycline (30 g), sulfathiazole (0.25mg) and tetracycline (30 g) (Becton Dickinson).
Antibiotics tested in the present study were selected depending on their common use in veterinary practice and in hospitals.
2.3. Disk diffusion susceptibility testing
Antibiotic susceptibility testing was determined by the agar diffusion method in accordance with National Committee for Clinical
Laboratory Standards (NCCLS) guidelines M23–A2 [16], [14], using E. coli NCTC 9001 as reference strain. Isolates were recorded as resistant to an antibiotic if growth was indistinguishable from that on a control plate without antibiotic. Interpretation of results was carried out using the NCCLS guidelines [15]. All strains showing “resistant” or “intermediate” behavior were subsumed under the category “resistant”. All others were classified as “sensitive”.
2.4. Statistical Analysis
The chi-square ( 2) test was used to determine whether statistically significant differences existed in the resistance of E. coliisolates to the antibiotics tested, suggesting diverse resistance patterns for each one of the selected sampling sites.
Table 1. E. coli isolates obtained from tap water and raw sewage samples
Sample type (No.) No. of isolates
Tap water samples A1 (9) 19 A2 (7) 7 A3 (8) 14 A4 (1) 3 A5 (14) 18 A6 (4) 4 A7 (5) 5 A8 (4) 5 A9 (14) 27 A10 (2) 4 A11 (5) 10 Raw sewage samples S1 (32) 32 S2 (32) 32 S3 (31) 31 S4 (23) 23 Total 234
354

3. Results
In total, 234 E. coli isolates from tap water and raw sewage samples obtained from various regions in Greece showed multiple resistance
patterns to the 13 antibiotics tested. The majority of E. coli isolates (87.18 %) expressed resistance to one or more antibiotics. Resistant isolates to single antibiotics are shown in Tables 2 and 3.
Table 2. Percentages of E. coli obtained from tap water samples resistant to antibiotics
% of resistant E. coli from tap water by region: Antibiotic
A1 A2 3 4 A5 A6 A7 A8 A9 A10 A11 Amikacin ND* ND ND ND ND ND ND ND ND ND ND Amoxicillin 100 71.43 85.71 33.33 22.22 75 20 60 51.85 ND 90 Ampicillin 84.21 71.43 85.71 33.33 66.67 50 60 60 51.85 ND 90 Cephalothin 63.16 57.14 85.71 66.67 50 75 60 60 62.96 50 90 Chloramphenicol 5.26 14.29 ND ND 11.11 ND ND ND 11.11 ND ND Gentamicin ND ND 7.14 ND ND ND ND ND ND ND ND Nalidixic acid 10.53 ND 7.14 ND ND 25 ND ND ND ND ND Neomycin 26.32 28.57 21.43 33.33 5.56 50 ND 40 22.22 ND ND Nitrofurantoin 5.26 28.57 28.57 ND 11.11 ND 20 20 11.11 ND ND Norfloxacin 10.53 ND 7.14 ND ND 25 ND ND ND ND ND Oxytetracycline 10.53 28.57 14.29 33.33 22.22 25 ND ND 40.74 50 ND Sulfathiazole 47.37 14.29 ND 100 11.11 25 ND 20 14.81 ND ND Tetracycline 10.53 28.57 14.29 33.33 22.22 25 ND ND 40.74 50 ND
* ND, none detected
Table 3. Percentages of E. coli from raw sewage samples resistant to antibiotics
% of resistant E. coli from raw sewage samples: Antibiotic
S1 S2 S3 S4 Amikacin 3.13 53.13 35.48 8.70 Amoxicillin 71.88 56.25 64.52 47.83 Ampicillin 71.88 56.25 64.52 56.52 Cephalothin 65.63 84.38 74.19 56.52 Chloramphenicol 43.75 ND* 25.81 13.04 Gentamicin 6.25 53.13 6.45 8.70 Nalidixic acid 40.63 65.63 64.52 30.43 Neomycin 6.25 68.75 38.71 39.13 Nitrofurantoin 34.38 3.13 ND 4.35 Norfloxacin 3.13 43.75 64.52 8.70 Oxytetracycline 59.38 43.75 74.19 56.52 Sulfathiazole 50.00 53.13 64.52 52.17 Tetracycline 59.38 43.75 70.97 56.52
* ND, none detected
355
“Sustainable Management and Development of Mountainous and Island Areas”

Comparing the two groups of the isolates (tap water and raw sewage) there was significant difference in levels of resistance rates to all antibiotics tested (P<0.05). Specifically, there was a considerable increased prevalence of resistant isolates in raw sewage samples, whereas tap water isolates were more sensitive. Screening the resistance of E. coli isolates to combinations of the antibiotics the predominant MAR patterns are shown in Tables 4 and 5, from which it is
obvious that 21 distinct resistance patterns were observed for tap water isolates compared to 30 patterns for raw sewage isolates. In general, patterns were significantly different (P<0.05) among the sampling sites and the treatment plants. The only exception was the profile of resistance to amoxicillin-ampicillin-cephalothin, scanned in seven areas (Table 4) and the profile of cephalothin, scanned in all treatment plants.
Table 4. Predominant antibiotic resistance patterns of E. coli from tap water samples
% of resistant E. coli from tap water by region: Pattern of antibiotic resistance* A1 A2 3 4 A5 A6 A7 A8 A9 A10 A11 AMP ND† ND ND ND 16.67 ND ND ND 3.7 ND ND AMX 5.26 ND ND ND ND ND ND ND 7.41 ND ND CEPH ND ND ND ND 5.56 ND 20 20 3.7 25 ND CEPH-AMP ND ND ND ND 11.11 ND 20 ND ND ND ND OX-TET ND ND ND ND 5.56 ND ND ND 7.41 25 ND OX-TET-CEPH ND ND ND ND ND ND ND ND 7.41 25 ND OX-TET-SU ND ND ND ND ND ND ND ND ND ND ND AMP-AMX-CEPH 31.58 ND 42.86 ND 11.11 25 20 ND 11.11 ND 90 OX-TET-AMP-CEPH ND ND ND ND 5.56 ND ND ND 7.41 ND ND AMP-AMX-CEPH-NIT ND 14.29 14.29 ND ND ND ND ND 3.7 ND ND
N-AMP-AMX-CEPH 5.26 14.29 ND ND ND ND ND 20 7.41 ND ND OX-TET-N-C-CEPH ND ND ND ND ND ND ND ND 3.7 ND ND OX-TET-AMP-CEPH-NIT ND ND ND ND 5.56 ND ND ND ND ND ND
OX-TET-N-AMP-AMX-CEPH ND ND 7.14 ND ND ND ND ND ND ND ND
NAL-NOR-AMP-AMX-CEPH-NIT ND ND 7.14 ND ND ND ND ND ND ND ND
S-AMP-AMX-C-CEPH-NIT 5.26 ND ND ND ND ND ND ND ND ND ND
OX-TET-SU-N-AMP-AMX-CEPH ND ND ND ND ND ND ND ND 3.7 ND ND
OX-TET-SU-AMP-AMX-CEPH-NIT ND ND ND ND 5.56 ND ND ND 3.7 ND ND
OX-TET-SU-N-AMP-AMX-CEPH-NIT ND ND ND ND ND ND ND ND 3.7 ND ND
OX-TET-SU-N-NAL-NOR-AMP-AMX-CEPH
10.53 ND ND ND ND 25 ND ND ND ND ND
Resistance to all antibiotics tested ND ND ND ND ND ND ND ND ND ND ND
Sensitivity to all antibiotics tested ND 28.57 14.29 ND 22.22 25 20 ND 11.11 25 10
* AN, amikacin; AMX, amoxicillin; AMP, ampicillin; CEPH, cephalothin; C, chloramphenicol; GM, gentamicin; NAL, nalidixic acid; N, neomycin; NIT, nitrofurantoin; NOR, norfloxacin; OX, oxytetracycline; SU, sulfathiazole; TET, tetracycline; †ND, none detected
356
“Sustainable Management and Development of Mountainous and Island Areas”

Table 5. Predominant antibiotic resistance patterns of E. coli from raw sewage samples
% of resistant E. coli from raw sewage samples: Pattern of antibiotic resistance*
S1 S2 S3 S4
CEPH 3.13 18.75 9.68 8.7
N ND† 12.5 ND ND
NAL ND 3.13 ND ND
CEPH-AMP ND ND ND 8.7
OX-TET ND ND 3.23 ND
AMP-AMX 12.5 ND ND ND
CEPH-AMP-AMX 6.25 ND ND ND
AMP-AMX-C ND ND ND 4.35
OX-TET-N ND ND 6.45 ND
OX-TET-SU ND ND ND 8.7
OX-TET- SU -CEPH 3.13 ND ND ND
AMP-AMX-AN-CEPH ND ND ND ND
AMP-AMX-NAL-CEPH ND 9.38 ND 4.35
OX-TET-AMP-AMX-CEPH 3.13 ND ND ND
OX-TET-AMP-AMX-CEPH-SU 9.38 ND ND ND
OX-TET-SU-N-AMP-AMX ND ND ND 17.39
SU-N-GM-AN-NAL-CEPH ND 6.25 ND ND
OX-TET-SU-N-AMP-AMX-CEPH ND ND ND 4.35
OX-TET-SU-NAL-AMP-AMX-CEPH ND ND ND 4.35
OX-SU-NAL-NOR-AMP-AMX-CEPH ND ND 3.23 ND
OX-TET-SU-N-GM-AN-NOR-CEPH 3.13 ND ND ND
OX-TET-SU-GM-NAL-AMP-AMX-C 3.13 ND ND ND
OX-TET-NAL-AMP-AMX-C-CEPH-NIT 9.38 ND ND 4.35
OX-TET-SU-N-GM-AN-NAL-CEPH ND ND ND 8.7
OX-TET-SU-NAL-AMP-AMX-C-CEPH-NIT 25 ND ND ND
OX-TET-SU-AN-NAL-NOR-AMP-AMX-CEPH ND ND 22.58 ND
SU-N-GM-AN-NAL-AMP-AMX-CEPH-NIT ND 3.13 ND ND
OX-TET-SU-N-AN-NAL-NOR-AMP-AMX-CEPH ND ND 12.9 ND
OX-TET-SU-N-NAL-NOR-AMP-AMX-C-CEPH ND ND 19.35 8.7 OX-TET-SU-N-GM-AN-NAL-NOR-AMP-AMX-CEPH ND 43.75 ND ND
Resistance to all antibiotics tested ND ND ND ND
Sensitivity to all antibiotics tested 15.63 ND 16.13 17.39 * AN, amikacin; AMX, amoxicillin; AMP, ampicillin; CEPH, cephalothin; C, chloramphenicol; GM, gentamicin; NAL, nalidixic acid; N, neomycin; NIT, nitrofurantoin; NOR, norfloxacin; OX, oxytetracycline; SU, sulfathiazole; TET, tetracycline; †ND, none detected
357
“Sustainable Management and Development of Mountainous and Island Areas”

What seemed to be of interest was to evaluate the overall resistance of the isolates to multiple antibiotics by determining the MAR indices of the strains, according to Kaspar et al. (1990). E. coli isolates from tap water exhibited multiple resistance reaching 9 of the antibiotics tested (Table 6), while isolates derived from treatment plants reached an overall resistance to 11 of the antibiotics tested (Table 7).
Furthermore, a diverse profile of each sampling site was obtained by evaluating the average MAR index of its isolates. More specifically, isolates from raw sewage samples displayed the highest values of MAR index compared to isolates from tap water samples,
which exhibited higher susceptibility rates. Hence, isolates from S3 had an average MAR index of 0.63, followed by E. coli isolates from S2, S1 and S4 with average values of MAR index of 0.48, 0.40 and 0.34, respectively. Proceeding with the isolates from tap water samples, lower average values of MAR indices were observed, ranging from 0.10 to 0.30. Among them the highest values of MAR index were displayed from isolates derived from sampling sites A1, A2, A3, A4 and A6, followed by E. coli isolates from A11. The profile of the rest of sampling areas was consisted of strains with lower rates of resistance to the selected antibiotics.
Table 6. Multiple antibiotic resistance and MAR indices of resistant E. coli from tap water samples
% of resistant E. coli from tap water by region: Multiple antibiotic resistance A1 2 3 4 A5 A6 A7 A8 A9 A10 A11
MAR index
9 antibiotics 10.53 ND* ND ND ND 25 ND ND ND ND ND 0.69
8 antibiotics ND ND ND ND ND ND ND ND 3.7 ND ND 0.62
7 antibiotics ND 14.29 7.14 ND 5.56 ND ND ND 7.41 ND ND 0.54
6 antibiotics 5.26 ND 14.29 ND ND ND ND ND 0 ND ND 0.46
5 antibiotics ND 14.29 7.14 ND 11.11 ND ND ND 7.41 ND ND 0.39
4 antibiotics 15.79 42.86 14.29 66.67 5.56 ND ND 40 22.22 ND ND 0.31
3 antibiotics 52.63 ND 42.86 ND 16.67 66.67 20 ND 18.51 25 90 0.23 * ND, none detected
Table 7. Multiple antibiotic resistance and MAR indices of resistant E. coli from raw sewage Samples
* ND, none detected
% of resistant E. coli from raw sewage samples Multiple antibiotics resistance S1 S2 S3 S4
MAR index
11 antibiotics ND* 43.75 ND ND 0.85 10 antibiotics ND ND 38.71 8.70 0.77 9 antibiotics 25.00 3.13 22.59 ND 0.69 8 antibiotics 18.75 ND ND 13.04 0.62 7 antibiotics ND ND 3.23 8.70 0.54 6 antibiotics 9.38 6.25 ND 17.39 0.46 5 antibiotics 3.13 ND ND ND 0.39 4 antibiotics 3.13 9.38 ND 4.35 0.31 3 antibiotics 9.38 ND 6.45 13.04 0.23
358
“Sustainable Management and Development of Mountainous and Island Areas”

4. Discussion
The framework of the present study focused on screening the resistance of E. coliisolates derived from aquatic environment, to a variety of antimicrobial compounds commonly used. There was an effort to determine to what extend MAR isolates are disseminated, posing crucial matters for public health.
Generally, resistance was most commonly directed toward cephalothin, ampicillin and amoxicillin, with nearly 50% of the strains expressing resistance to these antibiotics. These results are in agreement with those of Galland et al. (2001), McKeon et al.(1995), and Jones et al. (1986), who investigated the resistance of coliforms isolated from the aquatic environment. Isolates resistant to cephalothin were derived from all regions, even the agricultural ones, despite the fact that this drug is not approved in veterinary practice [4]. A possible explanation is cross-resistance, observed most commonly among antibiotics belonging to the same chemical family [19]. The high resistance of the study’s isolates to ampicillin and cephalothin has probably arisen from cross-resistance, as both drugs are inactivated by chromosomal beta-lactamases produced by many species of Enterobacteriaceae [5]. This high resistance to cephalosporins and beta-lactamases confirms the overall trend in antimicrobial resistance among Enterobacteriaceae,documented toward these drugs [9]. Specifically, the wide use of third-generation cephalosporins has led to the emergence of resistant strains, especially throughout the aquatic environment [4].
Isolates from tap water developed discrete MAR patterns according to their specific sampling site, indicating possible different usage of the antibiotics in each area tested [19]. Moreover, these differences were also recorded on the basis of the different profile of the areas and their characterization as “urban” or “agricultural”. Hence, the majority of MAR isolates with higher values of MAR index were derived from the “urban” regions, whereas isolates from “agricultural” sites were more sensitive.
Screening all isolates tested, higher resistance rates were observed in the inflow of the sewage plants, with patterns of resistance similar to those recorded previously [7], [13], [17]. The extensive dissemination of resistant bacteria in raw sewage comes as a proof of the
increased frequency, with which antibiotic substances are found in the inflow of treatment plants. Furthermore, given the selection pressure, bacterial strains with appropriate mechanisms of resistance may have a better chance of survival. Generally, it is proved that bacteria with the most characteristic resistance behaviour are isolated from areas contaminated with antimicrobial substances [17]. Among the raw sewage isolates of the study the higher rates of resistance were recorded in plant S3. This could be attributed to the fact that this specific plant takes in sewage from a hospital, where antibiotic use is in excess and often uncontrolled. As for the rest of the plants, they are located and receive inflow from large urban areas of high population density. Hence, high resistance rates of the isolates counteract for the widespread use of antimicrobial agents.
The majority of the E. coli isolates tested revealed multiple resistance as it is shown in tables 6 and 7. This finding is of public health concern as resistance to a number of drugs over the level of three is transferable [2]. As pointed by others [17] resistance may be transferred by conjugation, which is possible wherever bacteria concentration is high and thus the chance of contact between two suitable bacteria cells is high. Moreover, Grabow and Prozesky (1973) have shown that transfer of resistance is more common among coliforms from hospital sewage rather than from municipal sewage. This increased prevalence of MAR isolates, documented in the present study raises concerns regarding their dissemination in the aquatic environment, as well as the effectiveness of the antibiotics currently used in medicine, veterinary practice and agriculture. Nevertheless, to what degree existing resistance mechanisms affect the natural ecosystem and subsequently humans is still difficult to decide but undoubtedly, current findings indicate meticulous caution in antibiotic usage.
5. Conclusions
There was a large-scale dissemination of MAR E. coli in the aquatic environment investigated, growing many concerns in the field of public health. The resistance documented was most commonly directed toward beta-lactamases and cephalosporins. Distinct MAR patterns were observed among the isolates tested, according to their
359
“Sustainable Management and Development of Mountainous and Island Areas”

derivation from the specific sampling sites, indicating possible different drug usage in each area. Tap water from “urban” areas and sewage from a hospital contained E. coli with higher resistance rates than E. coli from “agricultural” areas and municipal sewage, respectively. The increased prevalence of MAR isolates in the environment is of considerable importance, since this resistance is transferable among bacteria, affecting the aquatic environment. Hence, further investigation is required concerning the affects of MAR strains released from water supplies on the natural ecosystem.
6. References
[1] Armstrong JL, Shigeno DS, Calomiris JJ and Seidler RJ. Antibiotic-Resistant Bacteria in Drinking Water. Applied and Environmental Microbiology 1981; 42(2): 277-283.
[2] Arvanitidou M, Tsakris A, Constantinidis TC and Katsouyannopoulos VC. Transferable Antibiotic Resistance among SalmonellaStrains Isolated from Surface Waters. Water Research 1997; 31(5): 1112-1116.
[3] Edge TA and Hill S. Occurrence of antibiotic resistance in Escherichia coli from surface waters and fecal pollution sources near Hamilton, Ontario. Canadian Journal of Microbiology 2005; 51: 1-5.
[4] Galland JC, Hyatt DR, Crupper SS and Acheson DW. Prevalence, antibiotic susceptibility and diversity of Escherichia coli O157:H7 isolates from a longitudinal study of beef cattle feedlots. Applied and Environmental Microbiology 2001; 67(4): 1619-1627.
[5] Goñi-Urriza M, Capdepuy M, Arpin C, Raymond N, Caumette P and Quentin C. Impact of an urban effluent on antibiotic resistance of riverine Enterobacteriaceae and Aeromonas spp. Applied and Environmental Microbiology 2000; 66(1): 125-132.
[6] Grabow WOK and Prozesky OW. Drug resistance of coliform bacteria in hospital and city sewage. Antimicrobial Agents and Chemotherapy 1973; 3: 175-180.
[7] Guardabassi L, Lo Fo Wong DMA and Dalsgaard A. The effects of tertiary wastewater treatment on the prevalence of antimicrobial resistant bacteria. Water Research 2002; 36(8): 1955-1964.
[8] Jones JG, Gardener S, Simon BM and Pickup RW. Factors affecting the measurement of antibiotic resistance in bacteria isolated from lake water. Journal of Applied Bacteriology 1986; 60: 455-462.
[9] Jones RN, Jenkins SG, Hoban DJ, Pfaller MA and Ramphal R. In vitro efficacy of six cephalosporins tested against Enterobacteriaceae isolated at 38 North American medical centres participating in the SENTRY Antimicrobial Surveillance Program, 1997-1998. International Journal of Antimicrobial Agents 2000; 15(2): 111-118.
[10] Kaspar CW, Burgess JL, Knight IT and Colwell RR. Antibiotic resistance indexing Escherichia coli to identify sources of fecal contamination in water. Canadian Journal of Microbiology 1990; 36: 891-894.
[11] Karlowsky JA, Jones ME, Thornsberry C, Friedland IR and Sahm DF. Trends in Antimicrobial Susceptibilities among Enterobacteriaceae Isolated from Hospitalized Patients in the United States from 1998 to 2001. Antimicrobial Agents and Chemotherapy 2003; 47(5): 1672-1680.
[12] McKeon DM, Calabrese JP and Bissonnette GK. Antibiotic resistant gram-negative bacteria in rural groundwater supplies. Water Research 1995; 29(8): 1902-1908.
[13] Mezrioui N and Baleux B. Resistance patterns of E. coli strains isolated from domestic sewage before and after treatment in both aerobic lagoon and activated sludge. Water Research 1994; 28(11): 2399-2406.
[14] Miller RA, Walker RD, Baya A, Clemens K, Coles M, Hawke JP, Henricson BE, Hsu HM, Oaks JL, Papapetropoulou M and Reimschuessel R. Antimicrobial Susceptibility Testing of Aquatic Bacteria: Quality Control Disk Diffusion Ranges for Escherichia coli ATCC 25922 and Aeromonas salmonicida subsp. salmonicidaATCC 33658 at 22 and 28oC. Journal of Clinical Microbiology 2003; 41(9): 4318-4323.
[15] NCCLS National committee for clinical laboratory standards (2000). Supplemental Tables M100-S10 (M2).
[16] NCCLS National committee for clinical laboratory standards (2001). Development of in vitro susceptibility testing criteria and quality control parameters. Approved guideline M23-A2. National committee for clinical laboratory standards, Wayne, Pa.
360
“Sustainable Management and Development of Mountainous and Island Areas”

[17] Reinthaler FF, Posch J, Feierl G, Wüst G, Haas D, Ruckenbauer G, Mascher F and Marth E. Antibiotic resistance of E. coli in sewage and sludge. Water Research 2003; 37(8): 1685-1690.
[18] Scott TM, Rose JB, Jenkins TM, Farrah SR and Lukasik J. Microbial source tracking: current methodology and future directions. Applied and Environmental Microbiology 2002; 68(12): 5796-5803.
[19] Van den Bogaard AE and Stobberingh EE. Epidemiology of resistance to antibiotics: links between animals and humans. International Journal of Antimicrobial Agents 2000; 14(4): 327-335.
[20] Wenzel RP, Sahm DF, Thornsberry C, Draghi DC, Jones ME and Karlowsky JA. In Vitro Susceptibilities of Gram-Negative Bacteria Isolated from Hospitalized Patients in Four European Countries, Canada, and the United States in 2000-2001 to Expanded-Spectrum Cephalosporins and Comparator Antimicrobials: Implications for Therapy. Antimicrobial Agents and Chemotherapy 2003; 47(10): 3089-30.
361
“Sustainable Management and Development of Mountainous and Island Areas”