Proc Means
25
Proc Means The Friendliest PROC Jayson H. Shurgold
Transcript of Proc Means

Proc MeansThe Friendliest PROC
Jayson H. Shurgold

1. Introduction to PROC Means
2. Integrating PROC Means with MS Excel
3. Using PROC Means for ‘Data Manipulation’
Overview

Data
PROC
Line by line instructions primarily used to manipulate data
Pre-existing programs that generate specific outcomes

Data
PROC
Line by line instructions primarily used to manipulate data
Pre-existing programs that generate specific outcomes
PROC SQLPROC SQL

PROC Means• One of the oldest and most widely used PROC functions• Used to analyze and summarize numeric data• Able to stratify statistics by classification• Able to output to datasets
Default StatisticsNMEANSTDMAXMIN

PROC Means Example 1
PROC MEANS Data=Library.Example1 N Mean Median Min Max MaxDec = 2;
VAR Age;
CLASS Gender;
WHERE BirthYear = 1990;
RUN;
Calculate average age by gender for participants born in 1990

PROC Means Example 1
PROC MEANS Data=Library.Example1 N Mean Median Min Max MaxDec = 2;
VAR Age;
CLASS Gender;
WHERE BirthYear = 1990;
RUN;
Specify the dataset Custom Statistics Provide only 2 Decimals
Specify the analysis variable
Specify stratifications
Specify conditions
Calculate average age by gender for participants born in 1990

PROC Means Example 1
PROC MEANS Data=Library.Example1 N Mean Median Min Max MaxDec = 2;
VAR Age;
CLASS Gender;
WHERE BirthYear = 1990;
RUN;
Must be numeric data
Note the difference between ‘CLASS’ and ‘BY’
Can be any existing TEXT or NUMERIC dataCan use derived conditions using functions
WHERE YEAR(DateOfBirth)=1990
Calculate average age by gender for participants born in 1990

PROC Means Example 1Calculate average age by gender for participants born in 1990

Integrating PROC Means with MS Excel
• Analysts are often asked to provide data summaries to investigators in MS Excel• Copy and paste does not work well• Manual transcription is time consuming and prone to errors

PROC Means Example 2 – Part 1
PROC MEANS Data=Library.Example2 N Mean Median Min Max Noprint nway; VAR Age;CLASS Gender;WHERE BirthYear = 1990;
OUTPUT out = Example2_Result (drop= _TYPE_ _FREQ_)
n = Mean =Median =Min =Max = / autoname;
RUN;
Calculate average age by gender for participants born in 1990Present in Excel

PROC Means Example 2 – Part 1
PROC MEANS Data=Library.Example2 N Mean Median Min Max Noprint nway; VAR Age;CLASS Gender;WHERE BirthYear = 1990;
OUTPUT out = Example2_Result (drop= _TYPE_ _FREQ_)
n = Mean =Median =Min =Max = / autoname; *noinherit;
RUN;
Calculate average age by gender for participants born in 1990Present in Excel
Write results to a new Dataset
Statistics to be written as variables
Instructs SAS to autoname the new variables based on the requested statistic and analysis variable
Suppresses overall

PROC Means Example 2– Part 1Calculate average age by gender for participants born in 1990Present in Excel
Without NOINHERITWithout NWAY
With NOINHERITWith NWAY
FILENAME DDE_Dataset DDE “Excel|Sheet1!r3c3:r4c7” notab;
DATA _NULL_;SET Example2_ResultFILE DDE_DatasetPUT n ‘09’x mean ‘09’x median ‘09’x Min ‘09’x Max;RUN;
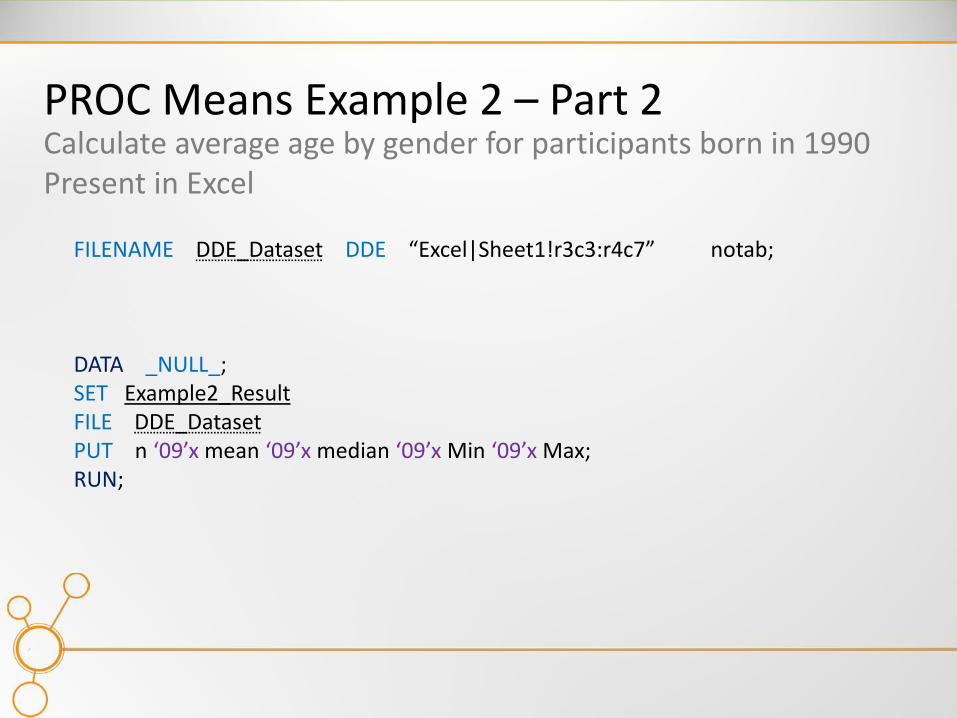
PROC Means Example 2 – Part 2Calculate average age by gender for participants born in 1990Present in Excel

FILENAME DDE_Dataset DDE “Excel|Sheet1!r3c3:r4c7” notab;
DATA _NULL_;SET Example2_ResultFILE DDE_DatasetPUT n ‘09’x mean ‘09’x median ‘09’x Min ‘09’x Max;RUN;
PROC Means Example 2 – Part 2Calculate average age by gender for participants born in 1990Present in Excel
Set filename Use DDE: write to Excel (Sheet1)Row3 Col C : Row4 Col G
Disables autotab
• Ensure ‘SET’ matches ‘SET’• Ensure ‘FILE’ matches ‘FILENAME’• PUT desired variable names• ‘09’x manually places each variable into a new cell

PROC Means Example 2Calculate average age by gender for participants born in 1990Present in Excel

PROC MEANS Data=Library.Example2 N Mean Median Min Max Noprint Nway; VAR Age;CLASS Gender;WHERE BirthYear = 1990;OUTPUT out = Example2_Result (drop= _TYPE_ _FREQ_)
n = Mean =Median =Min =Max = / autoname;
RUN;
FILENAME DDE_Dataset DDE “Excel|Sheet1!r3c3:r4c7” notab;
DATA _NULL_;SET Example2_Result FILE DDE_DatasetPUT n ‘09’x mean ‘09’x median ‘09’x Min ‘09’x Max;RUN;
PROC Means Example 2Calculate average age by gender for participants born in 1990Present in Excel

%LET Q = Age;%LET DDE = r3c3:r3c7;%QuickMean;
PROC Means Example 2Calculate average age by gender for participants born in 1990Present in Excel

PROC Means for ‘Data Manipulation’
• PROC Means can be an easy to use and efficient way to create 1:1 analysis datasets from ∞:1 datasets
Consider a prospective cohort study, investigating specific behavioural patterns among spinal cord injury patients, where participants are interviewed every 6 months following injury.
Data Elements:• ID Unique ID repeated for each interview• InterviewDate Date of interview• Age / Gender Age and Gender at interview• Pain [Yes / No] of a specific type of pain • Independence_score Numeric score reflecting independence• Behaviour1 [Yes / No] of a specific behaviour

PROC Means for ‘Data Manipulation’ID InterviewDate Age Gender Pain Independence_Score Behaviour1
1 01/12/2012 39 1 0 54 0
1 01/06/2013 40 1 1 95 0
1 01/12/2013 40 1 1 85 0
1 01/06/2014 41 1 1 88 0
1 01/12/2014 41 1 0 71 0
2 01/12/2012 35 2 0 87 1
2 01/06/2013 36 2 0 75 0
2 01/12/2013 36 2 0 77 0
2 01/06/2014 37 2 0 89 0
2 01/12/2014 37 2 1 63 0
3 01/12/2012 35 1 1 53 0
3 01/06/2013 36 1 0 62 0
3 01/12/2013 36 1 0 54 0
3 01/06/2014 37 1 1 92 0
4 01/12/2013 49 2 1 94 1
4 01/06/2014 50 2 0 51 0
4 01/12/2014 50 2 0 95 0
5 01/12/2011 21 1 1 87 0
5 01/06/2012 22 1 1 48 1
5 01/12/2012 22 1 1 42 1
5 01/06/2013 23 1 1 79 0
5 01/12/2013 23 1 1 68 0
5 01/06/2014 24 1 1 37 1
5 01/12/2014 24 1 0 53 1

PROC Means Example 3Create a 1:1 analysis database that:1. Only contains interviews conducted on or after 2013.2. Reports the average independence score for each
participant from eligible interviews.3. Dichotomizes behavioural pattern 1 among eligible interviews.4. Identifies participants reporting pain in at least 50% of
eligible interviews.
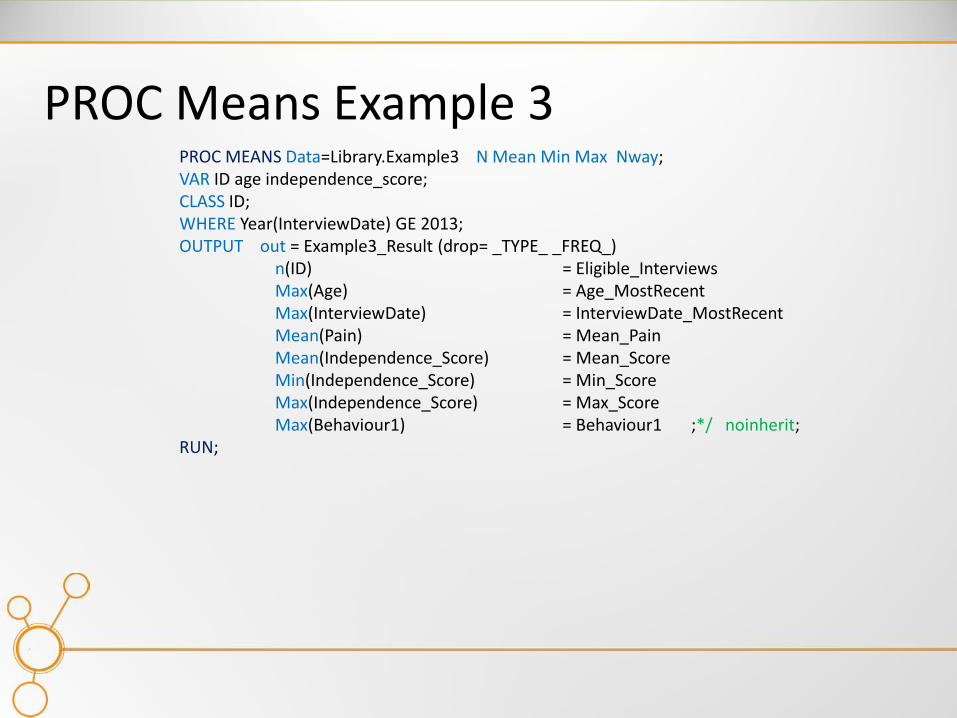
PROC MEANS Data=Library.Example3 N Mean Min Max Nway; VAR ID age independence_score;CLASS ID;WHERE Year(InterviewDate) GE 2013;OUTPUT out = Example3_Result (drop= _TYPE_ _FREQ_)
n(ID) = Eligible_InterviewsMax(Age) = Age_MostRecentMax(InterviewDate) = InterviewDate_MostRecentMean(Pain) = Mean_PainMean(Independence_Score) = Mean_ScoreMin(Independence_Score) = Min_ScoreMax(Independence_Score) = Max_ScoreMax(Behaviour1) = Behaviour1 ;*/ noinherit;
RUN;
PROC Means Example 3

PROC Means Example 3PROC MEANS Data=Library.Example3 N Mean Min Max Noprint Nway; VAR ID InterviewDate age gender pain independence_score Behaviour1;CLASS ID;WHERE Year(InterviewDate) GE 2013;OUTPUT out = Example3_Result (drop= _TYPE_ _FREQ_)
n(ID) = Eligible_InterviewsMax(Age) = Age_MostRecentMax(InterviewDate) = InterviewDate_MostRecentMean(Pain) = Mean_PainMean(Independence_Score) = Mean_ScoreMin(Independence_Score) = Min_ScoreMax(Independence_Score) = Max_ScoreMax(Behaviour1) = Behaviour1 ;*/ noinherit;
RUN;
Indicate variable for analysis
Manually name each variable

PROC Means Example 3

Thanks!


![Proc] Proc] Data Modell / Model Kategorie / Category ...€¦ · Proc] Proc] Data Modell / Model Kategorie / Category Energieeffizienzklasse Energieverbrauch (kWh / h / annum) Energy](https://static.fdocuments.in/doc/165x107/5ead02c5c9995c41470efc29/proc-proc-data-modell-model-kategorie-category-proc-proc-data-modell.jpg)