From Shapefiles to Maps Via PROC MAPIMPORT and PROC GMAP
13
-1- Member # Name Type File Size Last Modified 1 AFGHANI2 DATA 9216 22Dec08:18:05:02 2 AFGHANIS DATA 95232 22Dec08:18:05:02 3 AFRICA DATA 2991104 22Dec08:18:05:02 4 AFRICA2 DATA 17408 22Dec08:18:05:02 5 ALGERIA DATA 62464 22Dec08:18:05:02 6 ALGERIA2 DATA 9216 22Dec08:18:05:02 MEMNAME ANOMALY CNTYNAME COUNTIES COUNTY STATES US US2 USCENTER USCITY USCOUNTY From Shapefiles to Maps Via PROC MAPIMPORT and PROC GMAP Mike Zdeb, University at Albany School of Public Health, Rensselaer, NY ABSTRACT SAS/Graph® comes with a large library of map data sets that allows a user to create maps at various levels of world geography (the world, continents, countries, country subdivisions). When creating maps of the United States, the lowest level of geography provided in the SAS map data set library is county. If one wants to create maps at a lower level, for example census tract or zip code, one must look elsewhere for mapping files. The search for mapping files for use with SAS/Graph has been made easier with the availability of PROC MAPIMPORT, a procedure that allows a user to convert shapefiles (a commonly available type of file used to create maps) into map data sets that can be used with PROC GMAP. This paper shows how to use PROC MAPIMPORT to convert shapefiles into SAS/Graph map data sets using some of the 2010 TIGER shapefiles that were released as part of the decennial congressional redistricting process. Once the shapefiles are created, they are used with PROC GMAP and recently released 2010 census population data to create maps at the census tract and place level. In addition to creating maps, some newer SAS features related to mapping are demonstrated ...the %CENTROID macro, the GEODIST function, and PROC GEOCODE. INTRODUCTION If you have access to SAS/Graph, you also have access to a library of map data sets. If you run the following short SAS job ... proc datasets lib=maps; quit; and check the log, you will see a list of data sets in the maps library. You should notice many pairs of data set names that look almost identical except that one of the name ends with a "2" ... for example, the first six lines from the log are shown above. The entry without the "2" is the map data set (the one that can produce a map) while the one with the "2" contains metadata the gives you information about the geographic areas in the associated map data set. For most countries, it is easy to see the available maps by just looking at the names of the map data sets. However, there are instances when the data set name does not give a user information about the data set contents. There is another way to determine what maps are available for any given country. To find what maps area available to produce maps of the United States, you can use the METAMAPS data set ... proc print data=maps.metamaps; where memtype eq 'DATA' and type eq 'GRAPH' and country eq 'UNITED STATES'; var memname; run; Not all the data sets listed on the right are maps data sets. One way to determine the actual map data sets is to look to see if the data set contains a variable named SEGMENT. You can do that with a short data step ... data _null_; set maps.metamaps; if memtype eq 'DATA' and type eq 'GRAPH' and country eq 'UNITED STATES' and find(cats(of label:),'SEGMENT') ne 0; put memname; run; In the log, you will see a list of five data sets: COUNTIES, COUNTY, STATES, US, USCOUNTY. Graphics and Reporting NESUG 2011
Transcript of From Shapefiles to Maps Via PROC MAPIMPORT and PROC GMAP
-1-
Member # Name Type File Size Last Modified
1 AFGHANI2 DATA 9216 22Dec08:18:05:02 2 AFGHANIS DATA 95232 22Dec08:18:05:02 3 AFRICA DATA 2991104 22Dec08:18:05:02 4 AFRICA2 DATA 17408 22Dec08:18:05:02 5 ALGERIA DATA 62464 22Dec08:18:05:02 6 ALGERIA2 DATA 9216 22Dec08:18:05:02
MEMNAME
ANOMALYCNTYNAMECOUNTIESCOUNTYSTATESUSUS2USCENTERUSCITYUSCOUNTY
From Shapefiles to Maps Via PROC MAPIMPORT and PROC GMAPMike Zdeb, University at Albany School of Public Health, Rensselaer, NY
ABSTRACT SAS/Graph® comes with a large library of map data sets that allows a user to create maps at various levels ofworld geography (the world, continents, countries, country subdivisions). When creating maps of the United States,the lowest level of geography provided in the SAS map data set library is county. If one wants to create maps at alower level, for example census tract or zip code, one must look elsewhere for mapping files. The search formapping files for use with SAS/Graph has been made easier with the availability of PROC MAPIMPORT, aprocedure that allows a user to convert shapefiles (a commonly available type of file used to create maps) into mapdata sets that can be used with PROC GMAP.
This paper shows how to use PROC MAPIMPORT to convert shapefiles into SAS/Graph map data sets using someof the 2010 TIGER shapefiles that were released as part of the decennial congressional redistricting process. Oncethe shapefiles are created, they are used with PROC GMAP and recently released 2010 census population data tocreate maps at the census tract and place level. In addition to creating maps, some newer SAS features related tomapping are demonstrated ...the %CENTROID macro, the GEODIST function, and PROC GEOCODE.
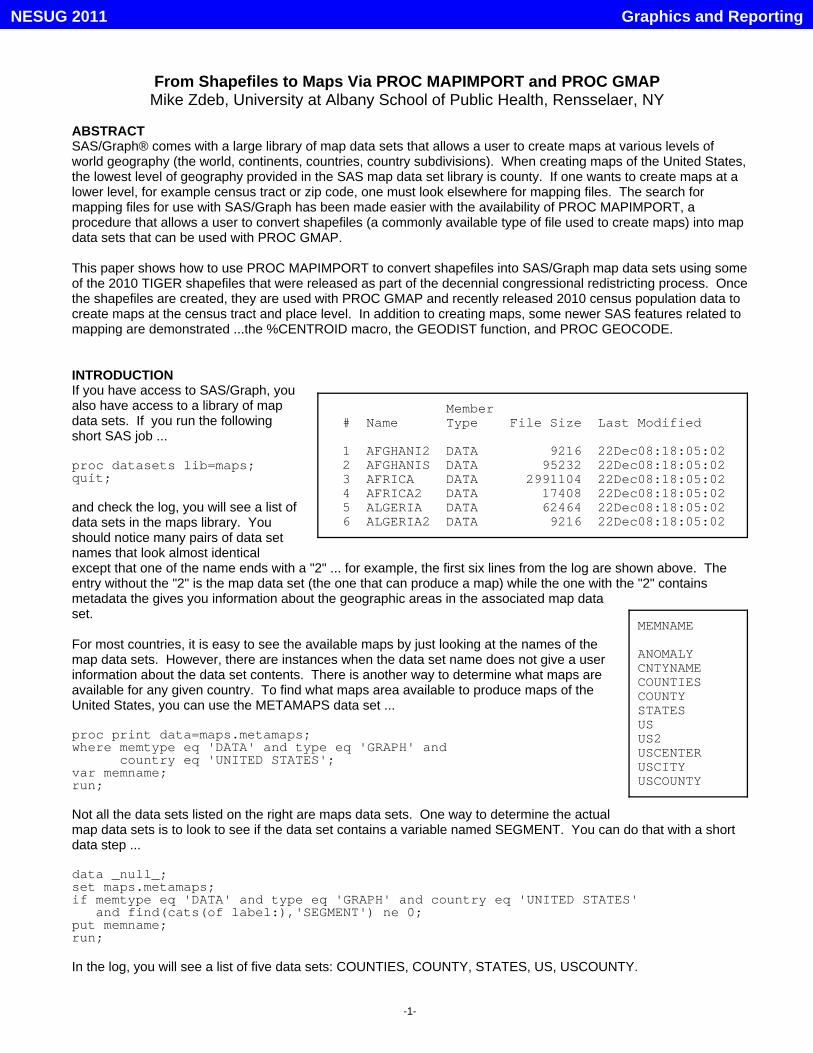
INTRODUCTIONIf you have access to SAS/Graph, youalso have access to a library of mapdata sets. If you run the followingshort SAS job ...
proc datasets lib=maps;quit;
and check the log, you will see a list ofdata sets in the maps library. Youshould notice many pairs of data setnames that look almost identicalexcept that one of the name ends with a "2" ... for example, the first six lines from the log are shown above. Theentry without the "2" is the map data set (the one that can produce a map) while the one with the "2" containsmetadata the gives you information about the geographic areas in the associated map dataset.
For most countries, it is easy to see the available maps by just looking at the names of themap data sets. However, there are instances when the data set name does not give a userinformation about the data set contents. There is another way to determine what maps areavailable for any given country. To find what maps area available to produce maps of theUnited States, you can use the METAMAPS data set ...
proc print data=maps.metamaps;where memtype eq 'DATA' and type eq 'GRAPH' and country eq 'UNITED STATES';var memname;run;
Not all the data sets listed on the right are maps data sets. One way to determine the actualmap data sets is to look to see if the data set contains a variable named SEGMENT. You can do that with a shortdata step ...
data _null_;set maps.metamaps;if memtype eq 'DATA' and type eq 'GRAPH' and country eq 'UNITED STATES' and find(cats(of label:),'SEGMENT') ne 0;put memname;run;
In the log, you will see a list of five data sets: COUNTIES, COUNTY, STATES, US, USCOUNTY.
Graphics and ReportingNESUG 2011
-2-
tl_2010_23_tract10.dbftl_2010_23_tract10.prjtl_2010_23_tract10.shptl_2010_23_tract10.shp.xmltl_2010_23_tract10.shx
SHAPEFILESThe five data sets listed on the bottom of page one can produce maps of the United States at either the state orcounty level. To create maps at a lower level of geography (census tracts, county subdivisions such as towns andvillages, zip codes), you have to acquire map data sets elsewhere. Now that PROC MAPIMPORT is available toconvert shapefiles into map data sets, shapefiles are a good source for adding maps to your SAS map library.
For the purpose of creating maps with SAS/Graph, there are only a few things that you have to know aboutshapefiles. First, a shapefile contains the information you need to create a map (just like a SAS map data set). That information includes coordinates (for example, longitude and latitude) that define area boundaries and areaidentifiers (for example, a county number). Next, a shapefile comprises a group of files (there are three at aminimum, but there may be more). A shapefile cannot be used directly with SAS/Graph procedures that are relatedto mapping (GMAP, GPROJECT, GREMOVE, GINSIDE, GREDUCE) but can be converted to a SAS map data setusing PROC MAPIMPORT. Finally, a very important point, there are lots of free shapefiles available for download,conversion, and use with SAS/Graph. If you still would like to know more about shapefiles (not essential), look atthe references at the end of the paper. The references also have some suggestions for finding shapefiles on theweb.
One source for current shapefiles is the US Census Bureau web site, specifically ...
http://www.census.gov/geo/www/tiger/tgrshp2010/tgrshp2010.html
Many different shapefiles for each state are available, with the above web site containing the statement ... "All legalboundaries and names are as of January 1, 2010." Several shapefiles for the state of Maine are used in thesubsequent examples (why Maine ... hint: where was NESUG held in 2011).
IMPORTING MAPS: CENSUS TRACTSThe first shapefile to be converted to a map data set can be used to create a map of census tracts. According theUS Census Bureau ...
"Census tracts are small, relatively permanent statistical subdivisions of a county delineated by local participants aspart of the U.S. Census Bureau's Participant Statistical Areas Program ... The primary purpose of census tracts is toprovide a stable set of geographic units for the presentation of decennial census data ... When first delineated,census tracts are designed to be homogeneous with respect to population characteristics, economic status, andliving conditions."
The last portion of the above definition is important, the mention of tracts being "homogeneous". When you createa map and assign a color or pattern to a map area based on some attribute of that area, it is good to know that thelevel of that attribute is consistent across the area. This contrasts to creating a small area map based on zip codeboundaries. Since the only purpose of the zip code is to facilitate mail delivery, there is no reason to think that anyattribute of a zip code is consistent over that area.
There is not much SAS code required to convert a shapefile to a data set. Assuming that the shapefile is located inthe folder z:\ , all you need is ...
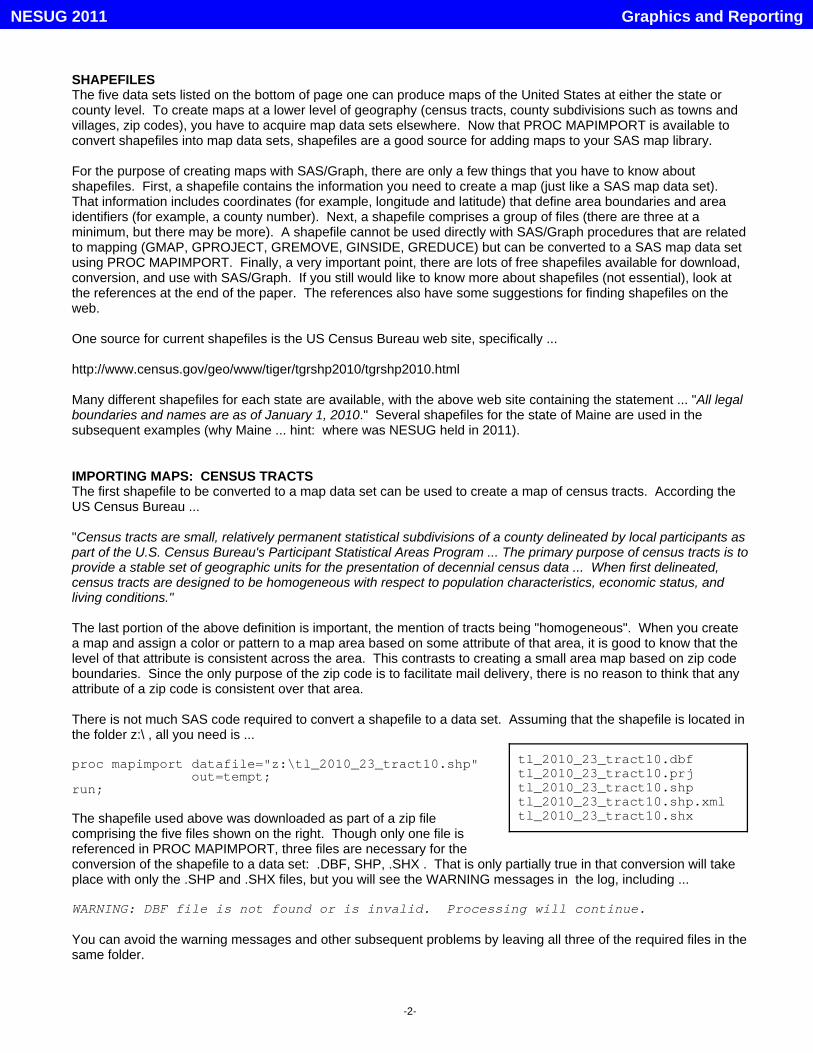
proc mapimport datafile="z:\tl_2010_23_tract10.shp" out=tempt;run;
The shapefile used above was downloaded as part of a zip file comprising the five files shown on the right. Though only one file isreferenced in PROC MAPIMPORT, three files are necessary for theconversion of the shapefile to a data set: .DBF, SHP, .SHX . That is only partially true in that conversion will takeplace with only the .SHP and .SHX files, but you will see the WARNING messages in the log, including ...
WARNING: DBF file is not found or is invalid. Processing will continue.
You can avoid the warning messages and other subsequent problems by leaving all three of the required files in thesame folder.
Graphics and ReportingNESUG 2011
-3-
# Variable Type Len 4 ALAND10 Num 8 5 AWATER10 Num 8 6 COUNTYFP10 Char 3 7 FUNCSTAT10 Char 1 8 GEOID10 Char 11 9 INTPTLAT10 Char 1110 INTPTLON10 Char 1211 MTFCC10 Char 512 NAME10 Char 713 NAMELSAD10 Char 20 3 SEGMENT Num 814 STATEFP10 Char 215 TRACTCE10 Char 6 1 X Num 8 2 Y Num 8
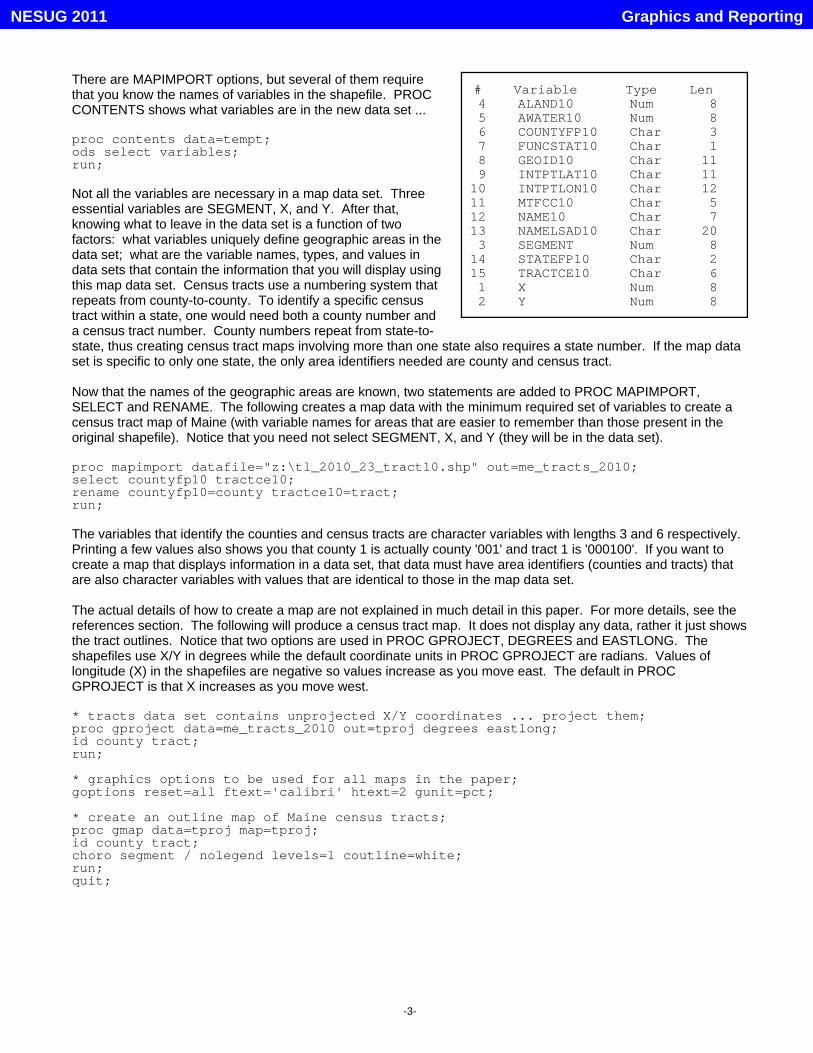
There are MAPIMPORT options, but several of them requirethat you know the names of variables in the shapefile. PROCCONTENTS shows what variables are in the new data set ...
proc contents data=tempt;ods select variables;run;
Not all the variables are necessary in a map data set. Threeessential variables are SEGMENT, X, and Y. After that,knowing what to leave in the data set is a function of twofactors: what variables uniquely define geographic areas in thedata set; what are the variable names, types, and values indata sets that contain the information that you will display usingthis map data set. Census tracts use a numbering system thatrepeats from county-to-county. To identify a specific censustract within a state, one would need both a county number anda census tract number. County numbers repeat from state-to-state, thus creating census tract maps involving more than one state also requires a state number. If the map dataset is specific to only one state, the only area identifiers needed are county and census tract.
Now that the names of the geographic areas are known, two statements are added to PROC MAPIMPORT,SELECT and RENAME. The following creates a map data with the minimum required set of variables to create acensus tract map of Maine (with variable names for areas that are easier to remember than those present in theoriginal shapefile). Notice that you need not select SEGMENT, X, and Y (they will be in the data set).
proc mapimport datafile="z:\tl_2010_23_tract10.shp" out=me_tracts_2010;select countyfp10 tractce10;rename countyfp10=county tractce10=tract;run;
The variables that identify the counties and census tracts are character variables with lengths 3 and 6 respectively. Printing a few values also shows you that county 1 is actually county '001' and tract 1 is '000100'. If you want tocreate a map that displays information in a data set, that data must have area identifiers (counties and tracts) thatare also character variables with values that are identical to those in the map data set.
The actual details of how to create a map are not explained in much detail in this paper. For more details, see thereferences section. The following will produce a census tract map. It does not display any data, rather it just showsthe tract outlines. Notice that two options are used in PROC GPROJECT, DEGREES and EASTLONG. Theshapefiles use X/Y in degrees while the default coordinate units in PROC GPROJECT are radians. Values oflongitude (X) in the shapefiles are negative so values increase as you move east. The default in PROCGPROJECT is that X increases as you move west.
* tracts data set contains unprojected X/Y coordinates ... project them;proc gproject data=me_tracts_2010 out=tproj degrees eastlong;id county tract;run;
* graphics options to be used for all maps in the paper;goptions reset=all ftext='calibri' htext=2 gunit=pct;
* create an outline map of Maine census tracts;proc gmap data=tproj map=tproj;id county tract;choro segment / nolegend levels=1 coutline=white;run;quit;
Graphics and ReportingNESUG 2011
-4-
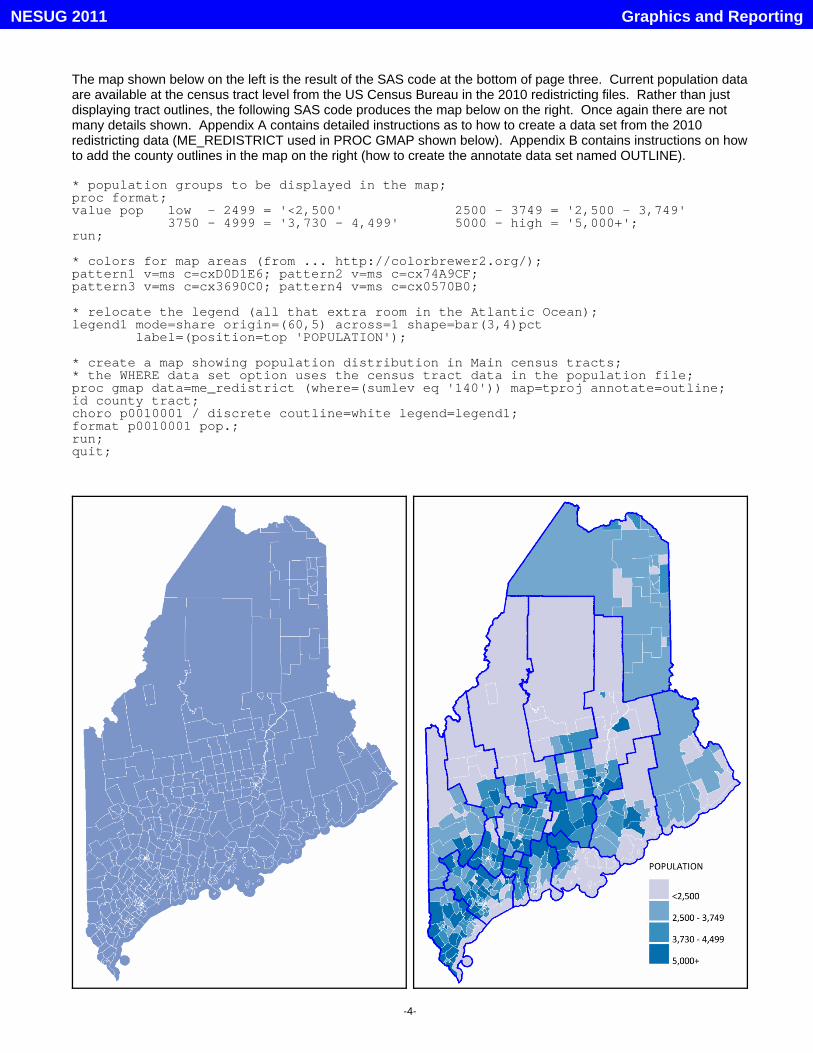
The map shown below on the left is the result of the SAS code at the bottom of page three. Current population dataare available at the census tract level from the US Census Bureau in the 2010 redistricting files. Rather than justdisplaying tract outlines, the following SAS code produces the map below on the right. Once again there are notmany details shown. Appendix A contains detailed instructions as to how to create a data set from the 2010redistricting data (ME_REDISTRICT used in PROC GMAP shown below). Appendix B contains instructions on howto add the county outlines in the map on the right (how to create the annotate data set named OUTLINE).
* population groups to be displayed in the map;proc format;value pop low - 2499 = '<2,500' 2500 - 3749 = '2,500 - 3,749'
3750 - 4999 = '3,730 - 4,499' 5000 - high = '5,000+';run;
* colors for map areas (from ... http://colorbrewer2.org/);pattern1 v=ms c=cxD0D1E6; pattern2 v=ms c=cx74A9CF; pattern3 v=ms c=cx3690C0; pattern4 v=ms c=cx0570B0;
* relocate the legend (all that extra room in the Atlantic Ocean);legend1 mode=share origin=(60,5) across=1 shape=bar(3,4)pct label=(position=top 'POPULATION');
* create a map showing population distribution in Main census tracts;* the WHERE data set option uses the census tract data in the population file;proc gmap data=me_redistrict (where=(sumlev eq '140')) map=tproj annotate=outline;id county tract;choro p0010001 / discrete coutline=white legend=legend1;format p0010001 pop.;run;quit;
Graphics and ReportingNESUG 2011
-5-
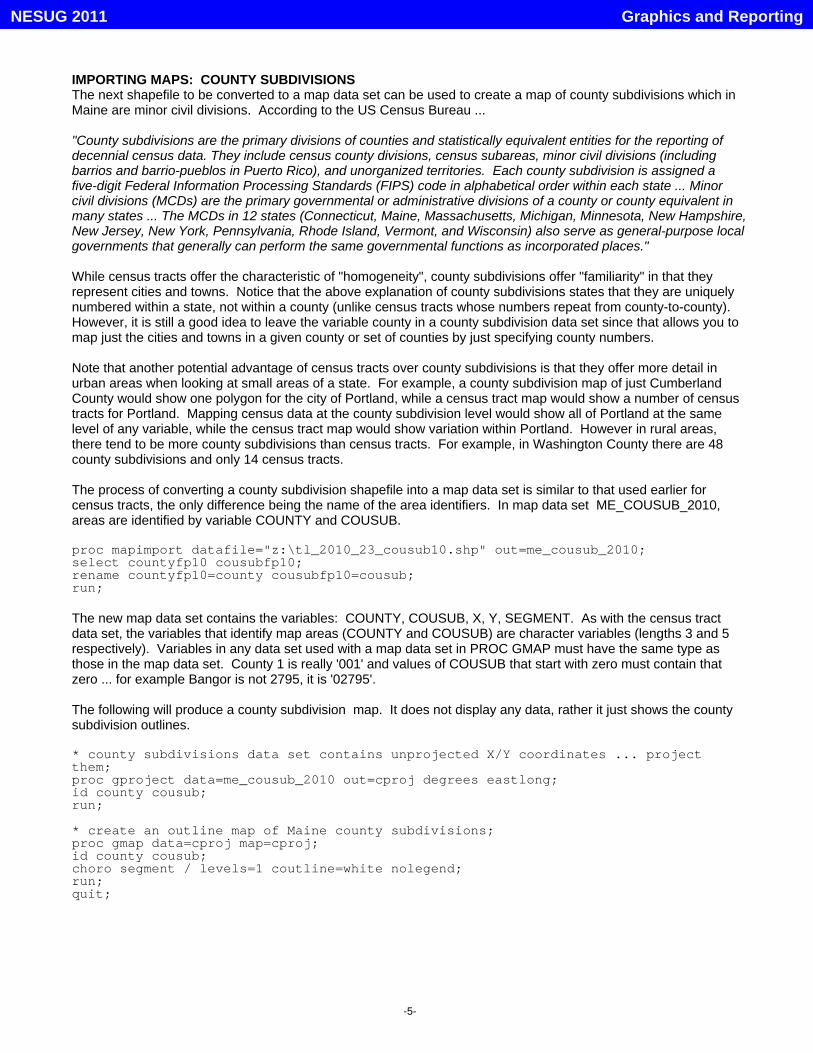
IMPORTING MAPS: COUNTY SUBDIVISIONSThe next shapefile to be converted to a map data set can be used to create a map of county subdivisions which inMaine are minor civil divisions. According to the US Census Bureau ...
"County subdivisions are the primary divisions of counties and statistically equivalent entities for the reporting ofdecennial census data. They include census county divisions, census subareas, minor civil divisions (includingbarrios and barrio-pueblos in Puerto Rico), and unorganized territories. Each county subdivision is assigned afive-digit Federal Information Processing Standards (FIPS) code in alphabetical order within each state ... Minorcivil divisions (MCDs) are the primary governmental or administrative divisions of a county or county equivalent inmany states ... The MCDs in 12 states (Connecticut, Maine, Massachusetts, Michigan, Minnesota, New Hampshire,New Jersey, New York, Pennsylvania, Rhode Island, Vermont, and Wisconsin) also serve as general-purpose localgovernments that generally can perform the same governmental functions as incorporated places."
While census tracts offer the characteristic of "homogeneity", county subdivisions offer "familiarity" in that theyrepresent cities and towns. Notice that the above explanation of county subdivisions states that they are uniquelynumbered within a state, not within a county (unlike census tracts whose numbers repeat from county-to-county). However, it is still a good idea to leave the variable county in a county subdivision data set since that allows you tomap just the cities and towns in a given county or set of counties by just specifying county numbers.
Note that another potential advantage of census tracts over county subdivisions is that they offer more detail inurban areas when looking at small areas of a state. For example, a county subdivision map of just CumberlandCounty would show one polygon for the city of Portland, while a census tract map would show a number of censustracts for Portland. Mapping census data at the county subdivision level would show all of Portland at the samelevel of any variable, while the census tract map would show variation within Portland. However in rural areas,there tend to be more county subdivisions than census tracts. For example, in Washington County there are 48county subdivisions and only 14 census tracts.
The process of converting a county subdivision shapefile into a map data set is similar to that used earlier forcensus tracts, the only difference being the name of the area identifiers. In map data set ME_COUSUB_2010,areas are identified by variable COUNTY and COUSUB.
proc mapimport datafile="z:\tl_2010_23_cousub10.shp" out=me_cousub_2010;select countyfp10 cousubfp10;rename countyfp10=county cousubfp10=cousub;run;
The new map data set contains the variables: COUNTY, COUSUB, X, Y, SEGMENT. As with the census tractdata set, the variables that identify map areas (COUNTY and COUSUB) are character variables (lengths 3 and 5respectively). Variables in any data set used with a map data set in PROC GMAP must have the same type asthose in the map data set. County 1 is really '001' and values of COUSUB that start with zero must contain thatzero ... for example Bangor is not 2795, it is '02795'.
The following will produce a county subdivision map. It does not display any data, rather it just shows the countysubdivision outlines.
* county subdivisions data set contains unprojected X/Y coordinates ... projectthem;proc gproject data=me_cousub_2010 out=cproj degrees eastlong;id county cousub;run;
* create an outline map of Maine county subdivisions;proc gmap data=cproj map=cproj;id county cousub;choro segment / levels=1 coutline=white nolegend;run;quit;
Graphics and ReportingNESUG 2011
-6-
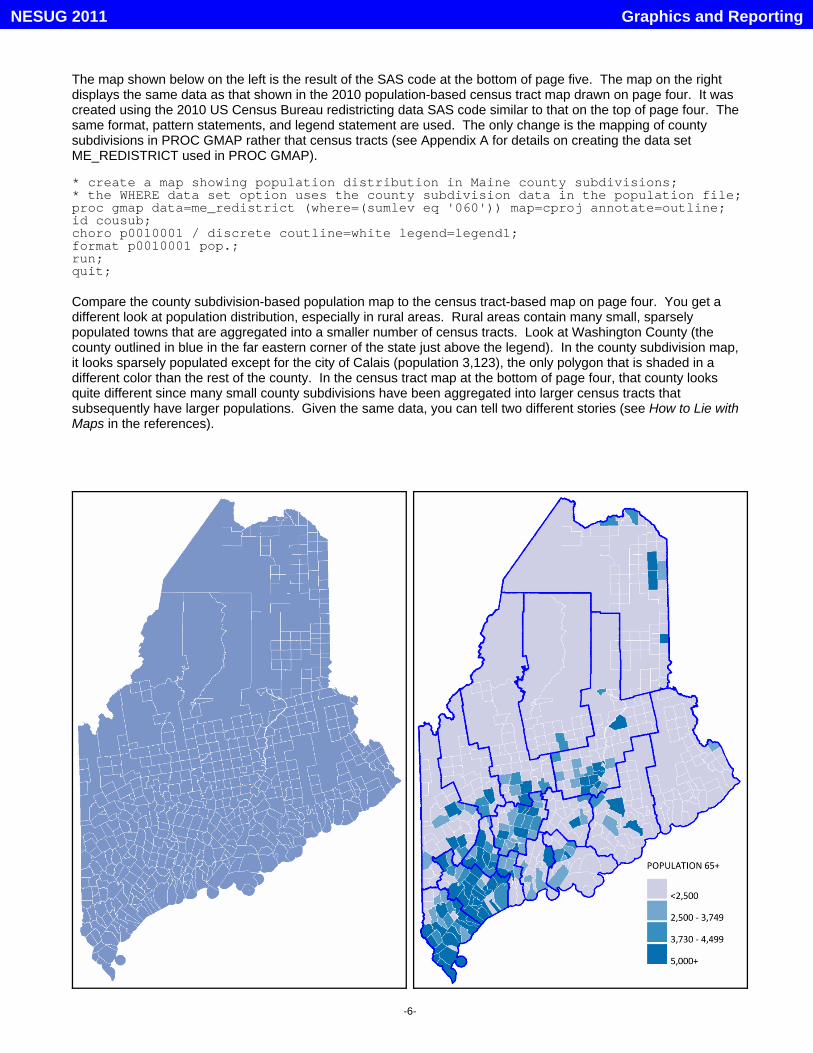
The map shown below on the left is the result of the SAS code at the bottom of page five. The map on the rightdisplays the same data as that shown in the 2010 population-based census tract map drawn on page four. It wascreated using the 2010 US Census Bureau redistricting data SAS code similar to that on the top of page four. Thesame format, pattern statements, and legend statement are used. The only change is the mapping of countysubdivisions in PROC GMAP rather that census tracts (see Appendix A for details on creating the data setME_REDISTRICT used in PROC GMAP).
* create a map showing population distribution in Maine county subdivisions;* the WHERE data set option uses the county subdivision data in the population file;proc gmap data=me_redistrict (where=(sumlev eq '060')) map=cproj annotate=outline;id cousub;choro p0010001 / discrete coutline=white legend=legend1;format p0010001 pop.;run;quit;
Compare the county subdivision-based population map to the census tract-based map on page four. You get adifferent look at population distribution, especially in rural areas. Rural areas contain many small, sparselypopulated towns that are aggregated into a smaller number of census tracts. Look at Washington County (thecounty outlined in blue in the far eastern corner of the state just above the legend). In the county subdivision map,it looks sparsely populated except for the city of Calais (population 3,123), the only polygon that is shaded in adifferent color than the rest of the county. In the census tract map at the bottom of page four, that county looksquite different since many small county subdivisions have been aggregated into larger census tracts thatsubsequently have larger populations. Given the same data, you can tell two different stories (see How to Lie withMaps in the references).
Graphics and ReportingNESUG 2011
-7-
MAP CENTROIDS AND THE GEODIST FUNCTIONGiven the 2010 population data for the state of Maine, what if you were interested in determining the percentage ofthe population that lived with a given distance of Portland? What if you also wanted to create a map that illustratedthe distance to Portland for the various cities and towns in Maine? An example of such a situation might be adesire to get an initial idea (and illustrate) as to how may people might make access of a new medical serviceoffered in Portland. A SAS-supplied macro (%CENTROID) and a SAS-supplied function (GEODIST) allow you tocreate a data set that can be used to answer the questions posed above.
Make the assumption that you are willing to assign the same distance to Portland for all the people who live in thesame city or town. The 2010 redistricting data has a population for each county subdivision (cities and towns). Thefirst task is to find out how far each county subdivision is from Portland, This can be done using the GEODISTfunction, but that requires that we know the location (longitude and latitude, from now on X/Y) first for Portland, thenfor each county subdivision. One way to find X/Y for Portland is to use PROC GEOCODE (see the references) witha data set that specifies only a city and state. If only a city and state are specified, PROC GEOCODE uses thedata set SASHELP.ZIPCODE (if you do not know about that data set, see the references) to compute the meanX/Y for all observation that match the city and state in the data set PORTLAND (note ... there are nine observationsin SASHELP.ZIPCODE for Portland, Maine).
To find X/Y for the county subdivisions, you can use the %CENTROID macro. That will give you X/Y for center ofcities and towns. All of this logic is put together in the following ...
* a data set with two variables (city, state) and one observation (Portland, ME);data portland;retain city 'Portland' state 'ME';run;
* use the above data set in PROC GEOCODE;* with only a city and state, PROC GEOCODE will give the mean X/Y;* of all observations in SASHELP.ZIPCODE that match the city and state;proc geocode data=portland out=portland_xy (keep=x y);run;
* the %CENTROID macro expects data set sorted by geographic area;* sort the county subdivision map data set created with MAPIMPORT on page five;proc sort data=me_cousub_2010 out=temp;by cousub;run;
* to use the %CENTROID, you must use %ANNOMAC once during the SAS session;%annomac;* find the center of each COUSUB (city/town) in data set TEMP;* create data set CENTERS ... contains X/Y for the center of each COUSUB;%centroid(temp,centers,cousub);
* add an index (COUSUB) to data set CENTERS (for use in the next data step);proc datasets lib=work nolist;modify centers;index create cousub;quit;
* create a data set with both population and distance to Portland (in miles);data pop_100;set portland_xy (rename=(x=x0 y=y0));do until (done);* read observations for cities and towns from the redistricting data set; set p.me_redistrict (where=(sumlev eq '060')) end=done;* read the CENTERS data set based on the value of COUSUB (gives you X/Y); set centers key=cousub;* use the GEODIST function to find the distance to Portland;* use M to compute distance is in miles (default is kilometers); dist = round(geodist(x0,y0,x,y,'M')); output;end;stop;keep cousub p0010001 dist;run;
Graphics and ReportingNESUG 2011
-8-
Now that you have a data set with population and distance to Portland, there are number of ways to determine howmany people live a given distance from Portland. One is PROC SQL ...
* group distances as follows;proc format;value dist low -<50 = '<50 MILES' 50 -<100 = '50 - 99 MILES'100 - high= '100+ MILES';run;
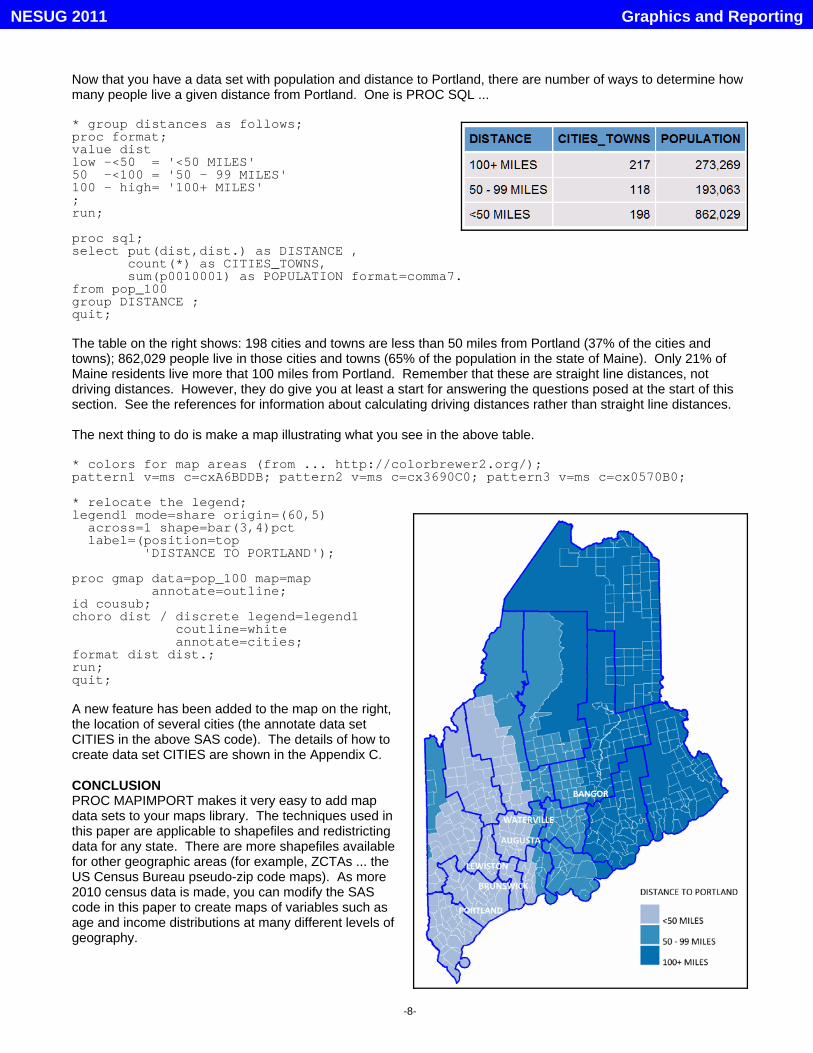
proc sql;select put(dist,dist.) as DISTANCE , count(*) as CITIES_TOWNS, sum(p0010001) as POPULATION format=comma7.from pop_100group DISTANCE ;quit;
The table on the right shows: 198 cities and towns are less than 50 miles from Portland (37% of the cities andtowns); 862,029 people live in those cities and towns (65% of the population in the state of Maine). Only 21% ofMaine residents live more that 100 miles from Portland. Remember that these are straight line distances, notdriving distances. However, they do give you at least a start for answering the questions posed at the start of thissection. See the references for information about calculating driving distances rather than straight line distances.
The next thing to do is make a map illustrating what you see in the above table.
* colors for map areas (from ... http://colorbrewer2.org/);pattern1 v=ms c=cxA6BDDB; pattern2 v=ms c=cx3690C0; pattern3 v=ms c=cx0570B0;
* relocate the legend;legend1 mode=share origin=(60,5) across=1 shape=bar(3,4)pct label=(position=top 'DISTANCE TO PORTLAND');
proc gmap data=pop_100 map=map annotate=outline;id cousub;choro dist / discrete legend=legend1 coutline=white annotate=cities;format dist dist.;run;quit;
A new feature has been added to the map on the right,the location of several cities (the annotate data setCITIES in the above SAS code). The details of how tocreate data set CITIES are shown in the Appendix C.
CONCLUSIONPROC MAPIMPORT makes it very easy to add mapdata sets to your maps library. The techniques used inthis paper are applicable to shapefiles and redistrictingdata for any state. There are more shapefiles availablefor other geographic areas (for example, ZCTAs ... theUS Census Bureau pseudo-zip code maps). As more2010 census data is made, you can modify the SAScode in this paper to create maps of variables such asage and income distributions at many different levels ofgeography.
Graphics and ReportingNESUG 2011
-9-
REFERENCES
Source for more information about shapefiles ...
ESRI Shapefile Technical Descriptionhttp://www.esri.com/library/whitepapers/pdfs/shapefile.pdf
Where to find shapefiles ... (easy way is use Google and search for "free shapefiles")
the URL from page 2 for for US 2010 shapefiles ...http://www.census.gov/geo/www/tiger/tgrshp2010/tgrshp2010.html
US shapefiles used in the 2000 census can be found at ...http://www.census.gov/geo/www/cob/index.html
http://arcdata.esri.com/data/tiger2000/tiger_download.cfm
international shapefiles can be found at ...http://www.gadm.org/country
http://wwwn.cdc.gov/epiinfo/script/shapefiles.aspx(though the web site does state that "These boundary files are not in the public domain and are intended for usewith Epi Info and Epi Map only.")
More details about creating maps with SAS/Graph and PROC GMAP ...
The Basics of Map Creation with SAS/GRAPHhttp://www.albany.edu/~msz03/251-29.pdf
Maps Made Easy Using SAShttps://support.sas.com/pubscat/bookdetails.jsp?pc=57495
Creating Maps with SAS/GRAPH - Drill Downs, Pop-Ups, and Animationhttp://www2.sas.com/proceedings/sugi29/120-29.pdf
Wow! You Did That Map with SAS/GRAPH?http://www.nesug.org/proceedings/nesug07/np/np01.pdf
Tips and Tricks: More SAS/GRAPH Map Secrets http://mwsug.org/proceedings/2010/dataviz/MWSUG-2010-134.pdf
Robert Allison's SAS/Graph Exampleshttp://www.robslink.com/SAS/Home.htm
search for GMAP at ... http://www.lexjansen.com/
How the same data can look different depending on choices made when creating maps ...
How to Lie with Maps (2nd Edition)http://www.amazon.com/How-Lie-Maps-Mark-Monmonier/dp/0226534219
More information about PROC GEOCODE ...
PROC GEOCODE: Creating Map Locations from Your Datahttp://support.sas.com/rnd/datavisualization/papers/sgf2009/087-2009.pdf
PROC GEOCODE: Now with Street-Level Geocodinghttp://support.sas.com/resources/papers/proceedings10/332-2010.pdf
Graphics and ReportingNESUG 2011
-10-
More information about the data set SASHELP.ZIPCODE ...
ZIP Code 411: A Well-Kept SAS Secrethttp://www2.sas.com/proceedings/sugi31/143-31.pdf
ZIP Code 411: Decoding SASHELP.ZIPCODE and Other SAS® Maps Online Mysterieshttp://support.sas.com/resources/papers/proceedings10/219-2010.pdf
Computing driving distances with SAS and Google Maps ...http://www.sascommunity.org/wiki/User:Msz03
and select: Driving Distances and Drive Times using SAS and Google Maps
ACKNOWLEDGMENTSI would like to thanks Robert Allison for his paper review, comments, and suggestions
TRADEMARK CITATIONSAS and all other SAS Institute Inc. product or service names are registered trademarks or trademarks of SASInstitute Inc. in the USA and other countries. ® indicates USA registration. Other brand and product names areregistered trademarks or trademarks of their respective companies.
CONTACT INFORMATIONThe author can be contacted using e-mail... Mike Zdeb [email protected]
APPENDIX A: How to create data set ME_REDISTRICT from US Census Bureau 2010 Redistricting Data
The 2010 redistricting data for Maine can be found at ...http://www2.census.gov/census_2010/01-Redistricting_File--PL_94-171/Maine/
Technical documentation for the redistricting data can be found at ...http://www.census.gov/prod/cen2010/doc/pl94-171.pdf
* location of redistricting data in ZIP file;filename maine saszipam 'j:\census_2010\redistrict\me2010.pl.zip';
* create data set GEO specifying only COUNTY, COUNTY SUBDIVISION, and CENSUS TRACTsummary levels '050' '060' '140' respectively; data geo;infile maine(megeo2010.pl) lrecl=500 truncover;input @009 sumlev $3. @;if sumlev in ('050' '060' '140');input@009 sumlev $3.@019 logrecno $7.@030 county $3.@037 cousub $5.@055 tract $6.;run;
Graphics and ReportingNESUG 2011
-11-
* read data for tables P1 and P2 (see Technical Documentation)use a hash data step object to select COUNTY, COUNTY SUBDIVISIONand CENSUS TRACT data;data part1 (compress=binary);set geo (obs=1);declare hash h(dataset:'geo');h.defineKey('logrecno');h.defineData('sumlev', 'county', 'cousub', 'tract');h.defineDone();infile maine(me000012010.pl) lrecl=20000 dsd truncover end=done;do until(done); input (d1-d4) (: $1.) logrecno p0010001-p0010071 p0020001-p0020073 ; if h.find() eq 0 then output;end;stop;drop d1-d4;run;
* read data for tables P3, P4, and H1 (see Technical Documentation)use a hash data step object to select COUNTY, COUNTY SUBDIVISIONand CENSUS TRACT data;data part2 (compress=binary);set geo (obs=1);declare hash h(dataset:'geo');h.defineKey('logrecno');h.defineData('sumlev', 'county', 'cousub', 'tract');h.defineDone();infile maine(me000022010.pl) lrecl=20000 dsd truncover end=done;do until(done); input (d1-d4) (: $1.) logrecno p0030001-p0030071 p0040001-p0040073 h0010001-h0010003 ; if h.find() eq 0 then output;end;stop;drop d1-d4;run;
* combine all tables into one data set;libname maine 'j:\census_2010\redistrict\maine\datasets';
data maine.me_redistrict (compress=binary);merge part1 part2;by logrecno;drop logrecno;run;
Note ... additional 2010 census data are available in SUMMARY FILE 1 (SF1). SAS code for converting data fromSF1 into SAS data sets can be found at ...
http://www.sascommunity.org/wiki/User:Msz03
and select: Converting 2010 Census Summary File 1 (SF1) Data into SAS Data Sets
Graphics and ReportingNESUG 2011
-12-
APPENDIX B: How to make the annotate data set OUTLINE
(The annotate data set OUTLINE is used to add the county outlines to maps on pages 4, 6, and 8.)
Each observation in data set TPROJS (created using PROC GPROJECT on the bottom of page 3) contains thevariables COUNTY and TRACT. PROC GREMOVE is used to remove the TRACT boundaries within the variouscounties. A data step creates the annotate data set OUTLINE from the data set created by PROC GREMOVE.
* sort the data set TPROJS by countyrequired in PROC GREMOVE when creatinga data set of county boundarieswithout internal tract boundaries;proc sort data=tproj out=tprojs;by county;run;
proc gremove data=tprojs out=cproj;id tract;by county;run;
data outline;length function $8;retain xsys ysys '2' hsys '3' size 3 color 'blue' when 'a';set cproj;by county segment;function = ifc(first.segment or (lag(x)=. and lag(y)=.), 'poly', 'polycont'); if x and y then output;run;
APPENDIX C: How to make the annotate data set CITIES
(The annotate data set CITIES is used to add the city names to the map at the bottom of page 8.)
* data set with two variables (CITY and STATE)and six observations (six cities in Maine);data mecities;retain state 'ME';input city : $20. @@;datalines;Augusta Bangor Brunswick Lewiston Portland Waterville;run;
* if data set used as input for PROC GEOCODEcontains only city and state, the average X/Y foreach city is found using the data set SASHELP.ZIPCODE;proc geocode data=mecities out=mecities_xy (keep=city x y);run;
* combine data set MECITIES_XY with data set ME_COUSUB_2010 (created on page 5);
data map_plus;set me_cousub_2010 mecities_xy;run;
Graphics and ReportingNESUG 2011
-13-
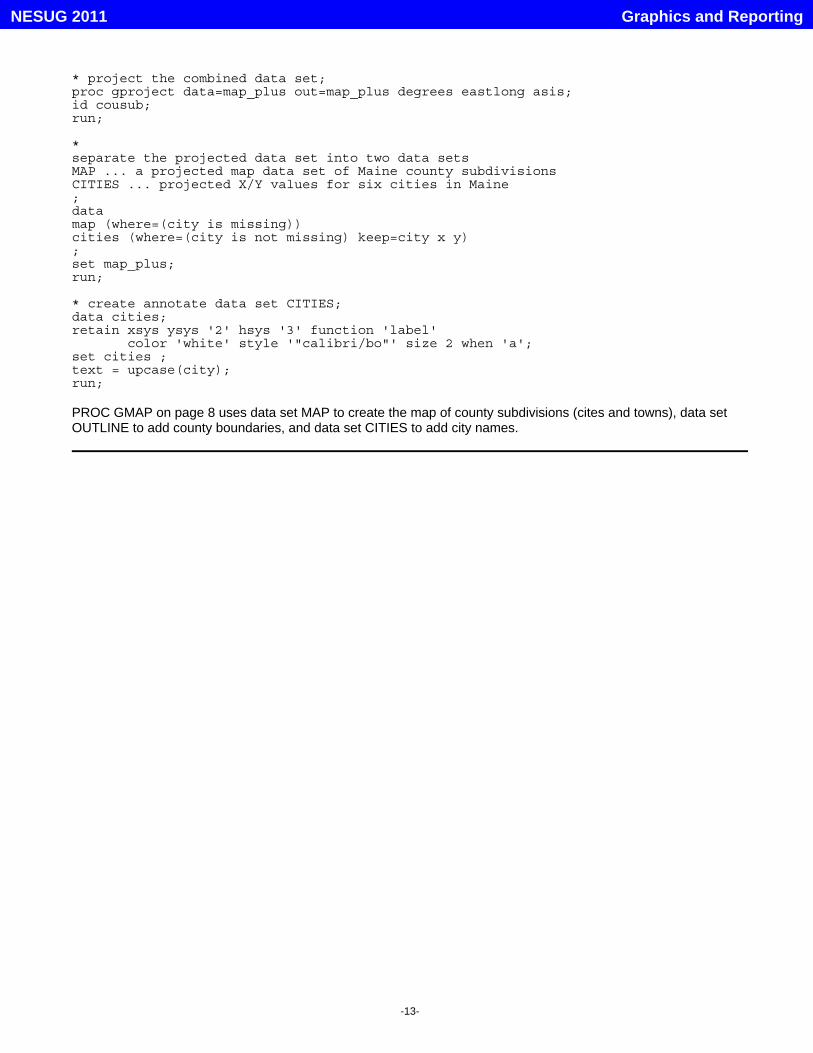
* project the combined data set;proc gproject data=map_plus out=map_plus degrees eastlong asis;id cousub;run;
* separate the projected data set into two data setsMAP ... a projected map data set of Maine county subdivisionsCITIES ... projected X/Y values for six cities in Maine;data map (where=(city is missing))cities (where=(city is not missing) keep=city x y);set map_plus;run;
* create annotate data set CITIES;data cities;retain xsys ysys '2' hsys '3' function 'label' color 'white' style '"calibri/bo"' size 2 when 'a';set cities ;text = upcase(city);run;
PROC GMAP on page 8 uses data set MAP to create the map of county subdivisions (cites and towns), data setOUTLINE to add county boundaries, and data set CITIES to add city names.
Graphics and ReportingNESUG 2011