PROBE TACK TESTS AS A CHARACTERIZATION TOOL … · PROBE TACK TESTS AS A CHARACTERIZATION TOOL IN...
14
PROBE TACK TESTS AS A CHARACTERIZATION TOOL IN PRESSURE- SENSITIVE-ADHESIVES Bernard Lestriez, Dr., Ecole Sup6rieure de Physique et Chimie, Paris, F. Hamed Lakrout, Dr., U.S. Naval Research Laboratory, Washington, D.C., U.S. Arnaud Chiche, Mr., Ecole Sup6rieure de Physique et Chimie, Paris, F. Alexandra Roos, Ms., Ecole Sup6rieure de Physique et Chimie, Paris, F. Costantino Creton, Dr., Ecole Sup6rieure de Physique et Chimie, Paris, F. I. INTRODUCTION A variety of adhesion tests serving, different purposes have been developed in the PSA industry. The fiat-punch test, also called probe tack test, is widely used to test the short-time, low-pressure adhesion. This test has the advantage of applying a fairly uniform displacement (uniform stress field and strain rate) to the adhesive film over the whole surface of the probe, and for those soft systems where failure involves the formation of cavities and fibrils 1, it facilitates the analysis of the process. A set of probe-tack curves obtained for different PSA's and varying experimental conditions are displayed on Figure 1. The maximum nominal stress t~max, the maximum nominal strain emax, and the adhesion energy, Wadh,def'med as the integral under the stress-strain curves, are the main relevant parameters to characterises the performances of a PSA, and provide clues for the practical design of the molecular structure of the polymeric material for a given application. However, for a more refined optimisation of the properties, it is helpful to understand what really happens when testing the adhesive film and how its molecular structure is involved. New developments in both instrumentation and interpretation of the results have provided insights in the debonding mechanisms of soft adhesive layers. In particular the breakdown of the debonding process in separate stages allows a better understanding of the role of the molecular features of the adhesive and the coupling between the rheological properties of the adhesive and the surface properties of the adherent. Some of these new concepts are reviewed here with the help of experimental examples. II. INSTRUMENTED PROBE TACK TEST We perform the mechanical measurement as following : the adhesive layer is deposited as a 50- 100 ~tm thick layer on a clean glass slide, and a flat cylindrical probe, of radius 3 to 5 mm, usually made of glass or stainless steel, is brought into contact with it and subsequently removed as shown on Figure 2. If desired, the surface of the probe can be coated with a molecularly thin mineral or organic layer (soft/hard polymer...) in order to modify surface interactions. During the compression phase, we apply a nominal contact pressure of 1 MPa, in order to achieve a maximum contact area. The contact time can be varied between 1 sec and more than 1 hour, and the probe is then removed from the film at a constant probe velocity which can be varied between 1 and 1000 lam/s. The temperature is controlled, and can be varied between -20°C and 60°C. Our custom-designed probe tack apparatus allows the observation of the adhesive film from underneath the transparent substrate with a microscope and/or a video camera along with the simultaneous acquisition of a nominal stress and strain curves. The nominal stress or, is def'med as the force divided by the contact area, and the strain e, is def'med as the displacement divided by the thickness of the film. Details on the experimental setup can be found elsewhere 2. 17 .i~ ¸ i/~ i • ? -.-..
Transcript of PROBE TACK TESTS AS A CHARACTERIZATION TOOL … · PROBE TACK TESTS AS A CHARACTERIZATION TOOL IN...

PROBE TACK TESTS AS A CHARACTERIZATION TOOL IN PRESSURE- SENSITIVE-ADHESIVES
Bernard Lestriez, Dr., Ecole Sup6rieure de Physique et Chimie, Paris, F. Hamed Lakrout, Dr., U.S. Naval Research Laboratory, Washington, D.C., U.S. Arnaud Chiche, Mr., Ecole Sup6rieure de Physique et Chimie, Paris, F. Alexandra Roos, Ms., Ecole Sup6rieure de Physique et Chimie, Paris, F. Costantino Creton, Dr., Ecole Sup6rieure de Physique et Chimie, Paris, F.
I. INTRODUCTION
A variety of adhesion tests serving, different purposes have been developed in the PSA industry. The fiat-punch test, also called probe tack test, is widely used to test the short-time, low-pressure adhesion. This test has the advantage of applying a fairly uniform displacement (uniform stress field and strain rate) to the adhesive film over the whole surface of the probe, and for those soft systems where failure involves the formation of cavities and fibrils 1, it facilitates the analysis of the process. A set of probe-tack curves obtained for different PSA's and varying experimental conditions are displayed on Figure 1. The maximum nominal stress t~max, the maximum nominal strain emax, and the adhesion energy, Wadh, def'med as the integral under the stress-strain curves, are the main relevant parameters to characterises the performances of a PSA, and provide clues for the practical design of the molecular structure of the polymeric material for a given application. However, for a more refined optimisation of the properties, it is helpful to understand what really happens when testing the adhesive film and how its molecular structure is involved. New developments in both instrumentation and interpretation of the results have provided insights in the debonding mechanisms of soft adhesive layers. In particular the breakdown of the debonding process in separate stages allows a better understanding of the role of the molecular features of the adhesive and the coupling between the rheological properties of the adhesive and the surface properties of the adherent. Some of these new concepts are reviewed here with the help of experimental examples.
II. INSTRUMENTED PROBE TACK TEST
We perform the mechanical measurement as following : the adhesive layer is deposited as a 50- 100 ~tm thick layer on a clean glass slide, and a flat cylindrical probe, of radius 3 to 5 mm, usually made of glass or stainless steel, is brought into contact with it and subsequently removed as shown on Figure 2. If desired, the surface of the probe can be coated with a molecularly thin mineral or organic layer (soft/hard polymer...) in order to modify surface interactions. During the compression phase, we apply a nominal contact pressure of 1 MPa, in order to achieve a maximum contact area. The contact time can be varied between 1 sec and more than 1 hour, and the probe is then removed from the film at a constant probe velocity which can be varied between 1 and 1000 lam/s. The temperature is controlled, and can be varied between -20°C and 60°C. Our custom-designed probe tack apparatus allows the observation of the adhesive film from underneath the transparent substrate with a microscope and/or a video camera along with the simultaneous acquisition of a nominal stress and strain curves. The nominal stress or, is def'med as the force divided by the contact area, and the strain e, is def'med as the displacement divided by the thickness of the film. Details on the experimental setup can be found elsewhere 2.
17
. i ~ ¸
i / ~
i •
?
- . - . .

=
: H
:~. , .
..
. . •
i . i i ~
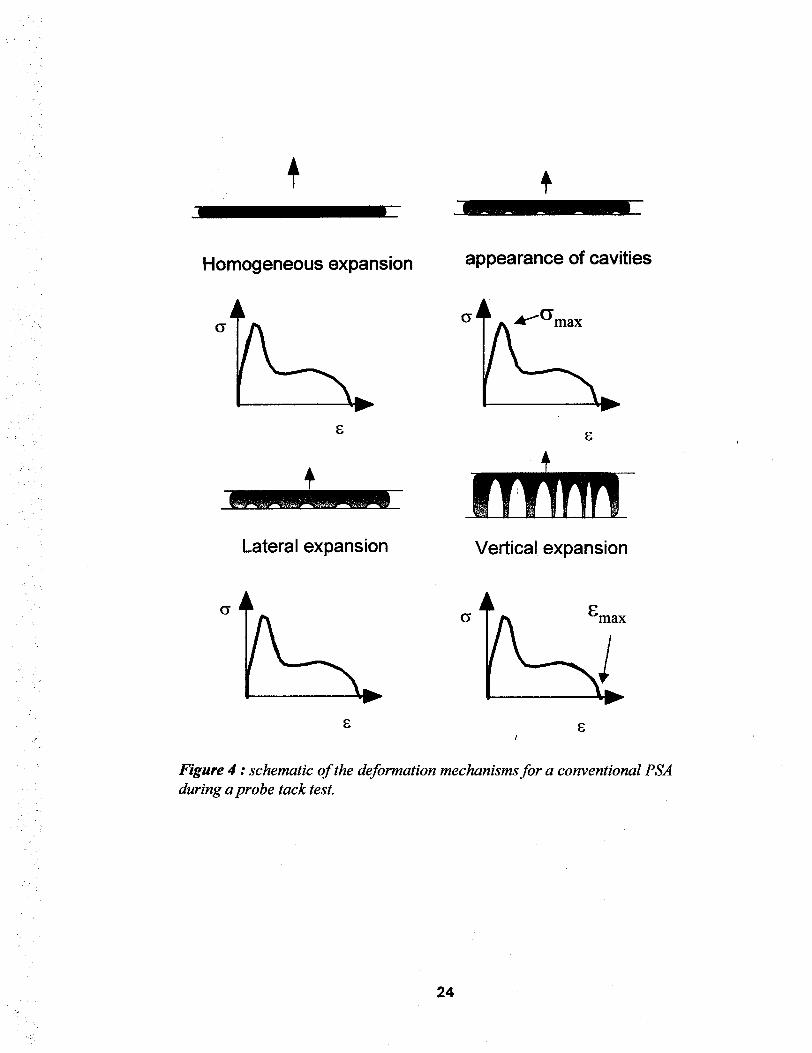
Video captures during the probe tack test of an acrylic PSA with a steel probe (high energy surface) are displayed on Figure 3. The debonding process can be broken into separate stages, which are described schematically in Figure 4 •
1. Bonding to the surface of the adherent. 2. Initiation of the failure process at low deformation through the formation of microscopic cavities
at the interface between the film and the probe or in the bulk of the adhesive layer. The load- bearing area decreases, and as a direct consequence, crgoes through a maximum, defming amax.
3. Expansion of these cavities, both in the lateral and vertical dimensions until, from the underneath, the structure looks like a foam.
4. Elongation of walls in between the cavities in the direction of the applied stress, at an approximately constant level of nominal stress, defining a plateau value, Crplatea,.
5. Fracture occurs by creeping (cohesive failure) or debonding of the foot of the polymer ligament from the probe, def'ming e-max.
For permanent PSA's, most of the total adhesion energy is dissipated during step 4, i.e. elongation of the polymer ligaments as walls between cavities and / or fibrils.
IlL MECHANICAL ANALYSIS AND EXPERIMENTAL RESULTS
Recent mechanical analyses of the flat-probe adhesion test of a soft viscoelastic polymer film have shed some light on the reasons for such behaviour 3-5. The most common way for a sticky material to release the elastic strain energy when pulled off from a surface, where non covalent bonds act, is to propagate an interfacial crack. For soft adhesives, i.e. polymer melts or gels of low elastic modulus, this process is not favoured as it requires large bulk viscoelastic dissipations and the available strain elastic energy is not very large. Moreover, in the probe tack geometry, the lateral dimensions of the compliant adhesive layer, i.e. diameter of the probe, are significantly greater than its thickness, h, Consequently, as the layer is deformed in the thickness direction, lateral strains cannot be accommodated and significant lateral stresses develop. The resulting strong hydrostatic pressure induces an alternative deformation mode to the propagation of a crack, namely the cavitation process 3.
Cavitation
Figure 5 shows magnified video captures of the cavitation process for a styrene-isoprene-styrene (SIS) based PSA on a steel surface observed with a microscope working in reflection mode. Focusing was done on the grooves of the polished steel surface probe. When cavities appear as a result of the applied tensile stress, they are sharply outlined, implying therefore that nucleation occurred at / or very near the interface, and expanded both in the bulk of the adhesive layer and at the interface. Many years ago, it was noted by Gent 6 that a cross-linked elastomer could not sustain a hydrostatic stress higher than approximately its elastic modulus without undergoing cavitation, that is the unstable expansion of an existing defect into a macroscopic visible cavity. This mechanical analysis was extended to a polymer melt by considering its time dependent modulus 7. For a polymer melt, the rapid growth of a cavity is predicted when"
Ohyd > E(O (1)
18
where E(t) is the time dependant elastic modulus. Video captures taken at a 2 second interval (where the probe has moved vertically by 2 ~tm) on Figure 4 clearly underline that cavitation is a fast (unstable) process. Measurement of the true load bearing area from the projected area of the cavities shows that the macroscopic average true stress is in fact nearly constant during the cavitation process, and is therefore the maximum sustainable stress by the adhesive layer in this probe tack test geometry, Figure 6. In agreement with Kaelble predictions', and applying time-temperature superposition, we indeed observed a direct correlation between the shear elastic modulus G'(co) and the maximum stress a,~x (Vaeb) for different model acrylic PSA's over a large range of frequency / debonding rates and temperatures 2. An increase in ~rm~x with an increasing rate ofdebonding or a decreasing temperature was observed, and that increase closely matched the increase of the elastic component of the shear modulus G'(~o), as shown on Figure 7.
Intuitively, both the adhesive and the probe surface roughness should impact the cavitation process, since air bubbles could be trapped at the interface 8 or an inhomogeneous strain field could be created from asperities on the surface. Both could act as nucleation sites for the formation of cavities. Such effects are observed for example, when the roughness of the probe is varied. Recent systematic experiments have shown that the amplitude of the surface asperities has a direct effect on the level of stress at which the cavities are formed 9. Figure 8 shows that the maximum stress decreases with increasing roughness of the probe.
Foam formation
It can be observed from Figure 5 that the unstable character of the growth of an individual cavity changes at some point to a more steady-state process. As already discussed, a cavity grows into the bulk material to release the local hydrostatic pressure over a certain volume. The relieved volume is determined by a balance between the relaxing hydrostatic strain energy and the shear strain energy necessary to expand the polymeric material around the growing bubble l°. The resulting volume is calculated to be proportional to h(K/G') ~/2, where h is the thickness of the adhesive layer and K is the bulk modulus, quantity which does not change much from one soft adhesive to the other. In agreement with this argument, we observed that high debonding rates and low temperatures, i.e. higher values of G', favour a population of small cavities, whereas high temperature and low debonding rates favour the formation of a smaller number of larger cavities.
Once a few cavities have appeared and as the adhesive film is further strained in the tensile direction, either the growth of existing cavities, or the appearance of new bubbles in between the existing ones can be observed. Comparison of Figures 3 and 9 shows that the first mechanism is more typical of a slightly cross-linked acrylic adhesive, while the second is more typical of block copolymer based PSA. Following our mechanical argument, the nucleation of new cavities should stop when the reduced confmement of the remaining load-bearing area allows sufficient lateral strain accommodation. At this point, any further tensile displacement of the polymer film leads to two competing deformation mechanisms"
Stretching in the tensile direction of the polymer ligament in between the cavities lateral propagation of cavities if the energy release rate G at the cavity edge is higher than the critical energy release rate Ge. • . . .
19 k
/" .
, , , , .
. : -
. , .
.,
" . : _ "
- .
. ,
?" .
" . , . :
- - . ; .
.
• .
" ,
. "
• f
Substantial deformation in the polymer film occurs prior to failure only if the first situation is favoured. Otherwise, rapid detachment of the walls between cavities can be observed if the local critical energy release rate is rather low. This kind of mechanism is detailed for a crosslinked acrylic adhesive at room temperature and low debonding speed on Figure 10.
Using a spherical probe that reduces viscoelastic losses in the vicinity of the circular propagating crack, and a JKR type analysis, it was shown that the energy release rate G for acrylic elastomers could be adequately described by the following equation ll"
G = Go (1 + (v/v*) n) (2)
Go is the value of the energy release rate at a vanishing crack velocity, which can sometimes be equated to the thermodynamic work of adhesion of the polymer melt on the surface, and the parameters v* and n characterise the velocity dependence arising from viscoelastic dissipation in the vicinity of the crack tip. Although equation 2 cannot be applied directly in the confmed geometry of a probe-tack test or for very viscoelastic materials, it gives an insight into the type of coupling existing between the rheological properties of the adhesive and the surface properties of the adherent. Go, for typical PSA's on steel surfaces, is rather high and prevents extensive lateral crack propagation, favouring the foam formation and fibril stretching mechanism. Insight on the nature of the coupling can however be obtained from studies on model systems.
Substantial changes in Go can be induced by varying the surface probe chemistry, for example when a steel surface is coated by a thin layer ofpoly(dimethyl siloxane) (PDMS). In this case, Go is low on most PSA's and the cavities grow mainly at the interface and their coalescence lead to a rapid adhesive failure, or eventually, the cavitation process is suppressed for materials with a high elastic modulusl2-14.
At the opposite, on a high energy surface, the energy release rate is mainly determined by the rheological properties of the adhesive. Values ranging from 0.5 to 0.6 are typically obtained for n, and the velocity dependence is mainly determined by v*. For poly(n-butyl acrylate) (PnBA), it was found that l/v*, i.e. G, increases when incorporating acrylic acid units that increases the relaxation times of the elastomer. In the probe tack test geometry, for the same polymers, this induced a transition from a lateral growth dominated for a pure PnBA to an extensional growth dominated for a PnBA-AA 15. In fact, for a given set of experimental parameters or applications, the relaxation times / rheological properties of the adhesive can be tuned by varying the molecular structure of its components, i.e. monomers polarity, cross-linking, chain branching, in order to favour the extensional growth regime.
Elongation
The vertical elongation of the walls between cells implies that, at the molecular scale, there is a progressive orientation of the polymer chains in the direction oftractionl6,17. Some of the extensional growth is a result of a creeping process and some is due to the drawing of unoriented polymer from the film. The respective importance of the two mechanisms will depend on the rheological properties of the adhesive in elongation (large strain regime). For example, Figure 11 shows video captures of the elongation part of the probe-tack curve for a SIS based PSA. In this case, the ultimate failure occurs by detachment of the foot of the fibril from the surface of the adherent, while for a weakly strain hardening acrylic adhesive, some cohesive fracture of the fibrils could be observed 2. The maximum extension achieved, and therefore the adhesion energy, depends on the balance between the elongational properties of the adhesive and the interfacial strength still characterised by Go.
20

V. CONCLUSION
The performance of PSA's is critically dependent on the free control of their yielding behavior under relatively small stresses. This yielding behavior often occurs in highly confined geometries, and the ability to design tests with realistically large values of the confinement ratio is one of the advantages of theprobe tack test. Moreover, because of the uniform strain and strain rate which are applied by a flat probe test, the debonding process can be easily broken down into more elementary steps and analyzed. As opposed to a more conventional test such as peel, an instrumented tack test provides information on the sensitivity of each specific step to the molecular features and experimental conditions. In particular we have been able to distinguish between the initiation of failure (controlled by the linear viscoelastic G'), the interfacial propagation of a crack (controlled by G~) and the extension of a fibril (controlled by the nonlinear extensional properties of the adhesive).
REFERENCES
(1) Zosel, A. Adv. Pressure Sensitive Adhes. Technol. 1992, 1, 92-127.
(2) Lakrout, H.; Sergot, P.; Creton, C. J. Adhes. 1999, 69, 307-359.
(3) Crosby, A. J.; Shull, K. R.; Lakrout, H.; Creton, C. JAppl.Phys. 2000, 88, 2956-2966.
(4) Creton, C.; Lakrout, H. J.Polym.Sci. B Polym.Phys. 2000, 38, 965-979.
(5) Lin, Y. Y.; Hui, C. Y.; Conway, H. D. J.Polym.Sci. B Polym.Phys. 2000, 38, 2769-2784.
(6) Gent, A. N.; Lindley, P. B. Proc. Roy. Soc. London, A 1958,.249 A, 195-205.
(7) Kaelble, D. H. Trans. Soc. Rheol. 1971, 15, 275-296.
(8) Gay, C.; Leibler.L. Phys. Rev. Lett. 1999, 82, 936-939.
(9) Chiche, A.; Pareige, P.; Creton, C. C.R. Acad.Sci. Paris, IV2000, 1, 1197-1204.
(10) Chikina, I.; Gay, C. Phys. Rev. Lett. 2000, 85, 4546-4549.
(11) Ahn, D.; Shull, K. R. Langmuir 1998, 14, 3646-3654.
(12) Creton, C.; Hooker, J. C.; Shull, K. R., submitted to Langmuir
(13) Hooker, J. C.; Creton, C.; Tordjeman, P.; Shull, K. R., Proceedings of 22nd Annual Meeting ofthe Adhesion Society; Panama City; 1999, pp 415-417.
(14) Josse, G.; Creton, C.; Dorget, M., Proceedings of Euradh 2000; Lyon; 2000, pp 165-169.
(15) Lakrout, H.; Creton, C.; Ahn, D.; Shull, K. R., submitted to Macromolecules
(16) Good, R. J.; Gupta, R. K. J. Adhes. 1988, 26, 13-36.
(17) Creton, C.Materials Science of Pressure-Sensitive-Adhesives; 1 st ed.; Meijer, H. E. H., Ed.; VCH: Weinheim, 1997; Vol. 18, pp 707-741.
21
• :

0.8
0.6
~ 0.4
0.2
0.0
i . . . .
: . j
/
• . , , .
2.5
2.0 ft.
1.5
1.0 09
0.5
0.0
5 0 0 p . m . s "1
/ 100 p.m.s "~
10 l .u 'n .s "1
I ' i ' i t ' I
0 1 2 3 4 0 5 10 15 20 Strain Strain (~)
Figure I • stress - strain curves at room temperature as a function o f debonding speed for (a) a cross-linked acryfic adhesive, anal (b) a SIS based adhesive.
Approach Contact
I i I i
I I ! I I I
Debonding
Displacement
Time
i I
I I I i
v.l I I
I i
Pcztc [~
Figure 2 • schematic o f a probe-tack test
I~ - I
2 2

..,(
l ol ~a~~~ °~ t/ ! ~ ~
~ ~ i ~ ~e~ 0 . 4
I I I - - -
0 2 4 6 8 Strain (8)
Figure 3 • typical stress-strain curve obtained for a cross- linked acryfic adhesive during a probe tack test on a steel surface, at 100 izm/sec. The video captures show the different stages of the debondingprocess as observed from underneath the glass slide.
23
. _ : ~+i
.~.
13" i . . ~- ,
13"
+
+ + l-:+i++:_+:+,,+_+ ......... : ~ _ + ........... _ : I
Homogeneous expansion
+
13"
Lateral expansion
appearance of cavities
+
Vertical expansion
t~ ~max
Figure 4 • schematic of the deformation mechanisms for a conventional PSA during a probe tack test.
.
24

0.5 -
0 . 4 5 -
0.4 _ 2:54:66 ~ . 3:02:72
~ 0 . 3 ~
~ 0 . 2 5 ~[ 2:39:82 ~
2:29:82
0.2 r~
r 2:11:56 0.15
0.1
0.05
0 1 ~ T ~ ~ - - - - - ' - - - " r ' - - ~
0 0.2 0.4 0.6 0.8 1 1.2
strain
Figure 5 • cavitation process for a SIS based PSA on a steel surface at a debonding speed of 1 /,tm/sec, 21°C, observed through an optical microscope
25

i / / • .
:>
. - , :
• ... :
o.~ I I [ ~o e W m a W
~ 0.4 " ,. I
0.35 : ~ " i 2 0 :
0.3 •
: In ' ~ 0.25 • ~ "u ~ 15,~ 6,d
i q ' L 0.2 .L' ~ , ~
lO 0.15 • ~
~7 . . . . . . 4~. . . . . t r u e s t r e s s 0.1 7in - 5
0.05
, , , , , , , o /
- o . l l o.1 o., o., o.z
e o o - . • e o ~ ~ o ~ . .
• ~ . - , , . . , - . o ~ _ l l - ~.~ o~oO " 0 ~ ~ o ~ . a e • e ~ e ~ _~o-'e,.~,Oeo
5 o : '-o, , . , o . % • • "-o.:= o @ ° $ 0 .
6 1 P D _ - . . . g qP esann~ ql'A IP-- • _ u lip o o 9 . . ~ c ° d , ~ . . " o ~ o % ~ v o - - 9 -
"~e6 " O - vo w eO e- "e o " . w e "
. ' o ; _. \ / • ~ e 0 • - ' - ' ~ r ,.. -. a~ 0 I O o o ~
00. - ~ - o t'o. "9 5 . z',.o • ,~ o"%
• 0 0 • L ~ o e ' - o o" 0 e ,
\ . e o .. • ,;ee / \ ' ~ o ' o e - - - ~ ; . ; . . ' / ,
I, m"
! o
!
6ram
• t • IO • •
e • o t
• b • e ° o
• . . • o, • e .
0 0 • • o •
" ~ • qu, • • , • •
o~ •
Figure 6 • measurement of the true load bearing area from the projected area of the cavities, SIS based PSA on a steel surface at a debonding speed of 1 lzm/sec, 21°C.
2 6

1 0 ,
0.1
0.01
log [d /dt (s)]
-2 0 2 4 ' ! I' I i' / '
_ • e qb e ~ e y
e
0 . 0 0 1 I. I I i , ,
-4 -2 0 2 4 6 I
tog (raT)
0 ¢~max(aT V)
____ G ' ( ¢ ~ )
Figure 7" shear storage modulus G ' and the maximum stress a as a function of the reduced shear frequency f*a T or o f the reduced strain rate a~ /dt for an acryfic adhesive. The a T are the rheological shift factors, and it is assumed that a frequency of 1 Hz is equivalent to a strain rate o f d~ ~dr = 1 s "1. (data from reference 2). r ~
0.7
0.6
-~ o.5
O.4
~ o.3
O.2
0.1
0 . 0 " 0.0
i ]Ra=150nm, rough[
0.2 0.4 0.6 0.8 1.0 1.2
Strain
Figure 8 • stress-strain curves for a PEHA on steels surfaces with different roughness average ampfitudes, data from reference 9.
2 7
/

1 (,0
~,
r ,~ : '-t
" : -" ." t
r
5 mm
(t,) 0 .7 "
0 . 6 - (a),~% 0 - 0 . 4 - -
,.,_.,
~ 0 . 3 -
~0.2
0 .1 -
0.0
0 I I I I I I I
2 4 6 8 10 12 14 Strain (c)
Figure 9 • typical stress-strain curve obtained f o r a SIS based PSA during a probe tack test on a steel surface, at 10/um/sec.
/
28

. .
. . . . .
i
( a ) ~ " , . , ~ ~i " . "
-~, _ .
lalL j m l . • J ~ " ._ .,,,o~,.
(b)
0.4-
c ~
~ 0 . 3 -
0.2-
0.1-
0 . 0 I
0.0 1.0
j (a)
I i I i 0,2 0.4 0.6 0.8
Strain
Figure 10 • typical stress-strain curve obtained for a cross-linked acrylic adhesive during a probe tack test on a steel surface, at 10 l~m/sec, 21 °C.
. . : , - .
: ~ ...,17
: 5 .<
-v,
,• : ii •
i , . i ~
i i • .~ • '
29
. . .

3 8 - ! 8 ~ 8 8 MON 888 1 5 " 4 4 " 1 3 3 nuna-2h-~
•
(,l)
. : ' i ?
. .
:
.:~Id-.:-ll~- I~I~ HUN -,Id~Id 1 6 " 4 0 ' 21 3 !10" 22" =i:!" i21-i
0.3
0.25
0.2
0.15
0.1
0.05
0 2 4 6 8 10 12
Strain
Figure 11 • elongation o f the polymer ligaments Oqbrils) for a SIS based PSA during a probe-tack test at 1 pm /sec, on a steel surface, at 21 °C.
30