Probability Grid Mapping System for Aerial Search (PGM)... · Probability Grid Mapping System for...
55
1 MSc Project Report York University Computer Science and Engineering Department August, 2009 Probability Grid Mapping System for Aerial Search (PGM) Muna Shabaneh
-
Upload
hoangtuyen -
Category
Documents
-
view
224 -
download
0
Transcript of Probability Grid Mapping System for Aerial Search (PGM)... · Probability Grid Mapping System for...

1
MSc Project Report
York University
Computer Science and Engineering Department
August, 2009
Probability Grid Mapping System for Aerial Search
(PGM)
Muna Shabaneh

2
1. Table of Contents
Abstract ............................................... 5
1. Introduction ............................................... 7 1.1. Enhanced and Synthetic Vision ... 8
1.2. Enhanced Vision for Aerial Search ... 11
2. Background ............................................. 14
2.1. Synthetic and Enhanced Vision Systems ........ 14 2.1.1. Enhanced Vision Systems ........ 15
2.1.2. Synthetic Vision Systems ........ 15
2.2. See-Through Head Mounted Display
(HMD) .................................................. 16 2.2.1. The History of See-Through HMD’s ... 16
2.2.2. The Characteristics of Optical See-
Through HMD ............................... 18
2.3. Representation of Terrain and Landscape ....................... 23

3
2.4. Global Coordinate Systems ....... 24
2.5. Universal Transverse Mercator (UTM) Coordinate System ............................. 26
2.6. Aerial Search and Rescue Missions ... 29 2.6.1. Description of Search and Rescue
Techniques ................................... 29
3. Probability Grid Mapping System for Aerial Search (PGM) ..................................................... 31
3.1. PGM System Concept ............... 31
3.2. PGM Implementation ............... 33
3.2.1. Probability Maps ...................... 34
3.2.2. Terrain Data Repository ........... 37
3.2.3. Motion Tracking and Pose Estimation .. 38
3.2.4. Display and Image Generation ... 40
3.3. Software Architecture .................. 42 3.3.1. Map Data .................................. 42

4
3.3.2. View Point Computation and Registration ............ 43
3.3.3. Scene Augmentation ................ 44
3.4. Experiments ............................. 46
3.4.1. Experiment (1) ........................... 47
3.4.2. Experiment (2) ........................... 49
4. Discussion .............................................. 50
5. Acknowledgment .................................... 51
6. References
5
Abstract Aerial search for targets on the ground is a challenging task
and success depends on providing proper intelligence to the
searchers. Recent advances in avionics enhanced and synthetic
vision systems (ESVS) offer new opportunities to present this
information to aircrew. This paper describes the concept and
implementation of a new ESVS technique intended to support
flight crews in aerial search for search and rescue missions and
other guided search scenarios.
The PGM provides the searcher with an augmented,
conformal, digital moving map of the search area that encodes
the estimated probability of the target being found in various
locations. A priori estimation of these probabilities allows for
prioritization of search areas, reduces search duplication and
improves coverage and ideally maximizes search effectiveness.
Priorities are encoded with a colour-coded highlighting scheme
indicating probability of finding the target in each area.
Probability estimates can be adaptively modified (a posteriori
probabilities) as the search progresses and various parts of the
search area covered. The displayed probabilities and

6
highlighting can be adaptively modified to reflect these changes.
The conformal 3D map is displayed with appropriate perspective
projection using a head-slaved optical see-through Head-
Mounted Display (HMD) allowing it to be registered with and
augment the real world. To evaluate the system prior to flight
test, a simulation environment was developed for study of the
effectiveness of highlighting methods, update strategies, and
probability mapping methods.

7
1. Introduction Nature has provided humans with different sensory systems
sensitive to visual, auditory, olfactory, haptic and gustatory
information coupled with cognitive capabilities that allow
decisions and behavioural responses to these stimuli. Despite
this flexibility human perception and cognition is still limited in
many ways [1]. For example, visible light represents only a small
part of the electromagnetic spectrum and our field of view is
limited.
Over the centuries we have developed aids to overcome
sensory deficits (glasses and hearing aids) or to augment and
extend our senses (e.g. telescopes, compasses or ultrasonic
imagers). Until recently, these aids were designed primarily to
enhance our sensory or motor capabilities and we have had less
ability to enhance our cognitive capabilities [1]. The development
of writing, maps, calculating instruments, mathematical tools and
other aids certainly extend cognitive capabilities but real-time
cognitive processing of sensory information remained largely
unassisted. With the recent fusion of computer technology and

8
personal digital technology, we can now develop and wear digital
devices that mainly enhance our cognitive capabilities. Wearable
computers and augmented reality offer a mobile user pervasive
access to rich sources of information and tools to help manage
and process that information [1].
1.1 Enhanced and Synthetic Vision
Augmented reality (AR) refers to the addition of synthetic
components to visual, auditory or other sensory scenes, typically
through specialised displays such as a see-through head
mounted display (HMD). The addition of the computer generated
entities is performed in such a way that they become
perceptually integrated into the user’s perceptual ‘reality’. The
user of such a system perceives and interacts with the real
world, but has valuable additional information, such as
descriptions of important features or instructions for performing
physical tasks, superimposed on the world. For example, the
computer could identify objects and overlay them with graphic
outlines, labels and/or schematics [2]. Such techniques have
proven effective in many domains including aviation [3],
medicine [1,4], military training [1,5] and manufacturing [1].

9
Piloting an aircraft and working from an aerial platform can be
demanding perceptual and cognitive tasks. Military aircraft pilots
have relied on sophisticated sensors such as night vision and
thermal imaging equipment to aid in their missions for decades.
These capabilities have increasingly become available in civilian
aviation especially in areas such as policing or search and
rescue [6]. With the development of augmented reality systems,
new systems have been developed for fixed- and rotary-wing
aircraft that are known as enhanced synthetic vision systems.
The goal of these systems is to augment and extend the pilot’s
visual and cognitive capabilities based on data from other
sensors, navigation instruments and geospatial databases.
The concept of synthetic vision, an artificial view of the terrain
and flight environment to aid navigation, dates from the
nineteen-fifties. At the time, a number of systems were
conceived to provide military pilots with terrain information linked
to an image of the approach. Putting these ideas into practice
had to wait for the development of adequate processing power,
accurate positioning systems, geographical databases and
advances in three-dimensional displays and graphics that made

10
it possible display geo-referenced 3D information in the 1990’s
[7].
A synthetic vision concept called “Tunnel-in-the-sky”
originated with George Hoover and the Army Navy
Instrumentation Program in the 1950s. Early work dealt explored
the effectiveness of symbology to aid the pilot in control of the
aircraft although technology limitations did not allow practical
systems to be fielded at the time [7, 8]. In the 1990’s researchers
revived the “Tunnel-in-the-sky” concept and developed design
rules for display of three-dimensional path information and
navigation aids to help pilots follow precise paths during flight or
landing [3].
Another synthetic vision system was developed by the
National Research Council of Canada’s Institute for Aerospace
Research (NRC_IAR) in 2004. In this system a helicopter
augmented reality enhanced vision system was developed to
assist pilots in landing helicopters at night and in adverse
weather conditions by following a computer generated path to
the landing zone [9]. Synthetic vision systems produce artificial

11
views of the world to support navigation and situational
awareness despite variable or poor visibility conditions.
1.2 Enhanced Vision for Aerial Search
This MSc project developed and prototyped a new technique
that will help pilots and their crew in their search and rescue
missions. Specifically an enhanced vision system called the
Probability Grid Mapping System (PGM) was developed.
The main objectives behind search and rescue missions are
to recover persons or objects in emergency situations, police
and security missions. For instance, some persons with
dementia are at risk of wandering away from their homes
becoming lost and confused. Such a situation can be life
threatening particularly in extreme cold or heat making an
effective and timely search essential.
Finding the target of the search is a critical first step in a
successful rescue. Search is a time consuming process that
depends critically on the expertise of the crew. When airborne
personnel are searching for a person or an object on the ground
they have to depend on their visual abilities and the verbal data

12
provided by the search and rescue coordination centre. Many
factors affect the efficiency and success of these missions such
as the terrain, visibility, temperatures, time of day or night, the
life or limit determination and the available resources [25].
Typically police helicopter search and rescue or
surveillance operations are done in teams of at least two in the
aircraft. One person typically flies the aircraft and assists with the
search while the other is primarily responsible for performing the
operational task. Most enhanced vision systems for aviation
have targeted the pilot in order to support flight and navigation
tasks, with the notable exception of military weapons targeting
[5, 6]. The PGM system is unique in that it aims to improve the
effectiveness of the other officer in the aircraft who is managing
and performing the tactical mission, in this case the search task.
The PGM System aims to make the search task easier
and more effective by supplying the searcher with an augmented
digital mapping system for the search area. Also it provides the
searchers with probability of target locations presented as
conformal symbology. The probability is estimated by the search

13
and rescue coordinator or equivalent on the ground prior to the
flight based data obtained about the situation. i.e. the last place
the person was seen, areas already searched, etc. The map is
displayed using a see-through Head Mounted Display (HMD) to
superimpose it on a view of the real world.

14
2. Background The PGM system is based on integrating geographically
referenced symbology into an aviation AR system in the context
of standard operating procedures for airborne search and rescue
missions. This chapter describes the relevant background
related to augmented reality, visual displays, terrain modeling
and helicopter search and rescue techniques.
2.1 Synthetic and Enhanced Vision Systems
Augmented Reality (AR) involves enhancing or
augmenting the user’s perception of the real world. It
supplements reality, rather than completely replacing it as in
Virtual Reality [1, 2 and 5]. Ideally, in an AR environment, virtual
and real objects coexist in the same space and merge together
seamlessly. The enhancement can take the form of textual
labels, symbology, virtual objects, or shading modifications.
Synthetic Vision (SV) and Enhanced Vision (EV) systems
are specialised augmented reality systems that augment the real
world with additional data about physical or logical features of
the environment. Typically the synthetic imagery is generated

15
based on databases of known items, such as terrain, runways,
roads and buildings or based on sensor inputs (e.g. lidar data).
Since the generated imagery represents entities
associated with a specific location in the real world, the virtual
camera used in the rendering must accurately traverse the
representation of the world based on incoming navigation sensor
data [18]. The reference models and coordinate systems used in
rendering affect the fidelity with which the synthetic world
matches the real world. Minimizing registration errors is essential
for useable SV and EV systems [18, 19].
2.1.1 Enhanced Vision Systems
An enhanced vision system (SVS) combines computer-
generated elements (graphics, outlines, labels or texts) with live
imagery. The live image can be from imaging sensors or from
direct views of the real world itself through the use of a head-up
display (HUD) or see-through HMD [18].

16
2.1.2 Synthetic Vision Systems
A synthetic vision system (SVS) uses navigation sensors
along with data about the external world, for example terrain
databases, to display a 3D perspective image to a user. In a
pure SVS no real-time imagery is combined with the SV image.
Thus, a SVS system is analogous to a VR system except that
the user’s vantage point in the synthetic world matches their
location and movement in the real world.. Usually however the
synthetic view is combined with a direct view of the real world or
with an EV system [18]. Such a system is called an Enhanced
and Synthetic Vision Systems (ESVS)
2.2 See-Through Head Mounted Display (HMD)
The graphical overlays in an ESVS system could be
generated using stationary monitors but is more typically
displayed using a see-through head-mounted display (HMD)
providing a natural ‘first-person’ view of the world.
17
2.2.1 The History of See-Through HMD’s
The first see-through head mounted display (HMD)
system was developed in the 1960s by Ivan Sutherland and
consisted a see-through stereoscopic display based on miniature
CRTs and optical combiners to superimpose images of the
displays with a view of the real world, a mechanical tracker to
provide head position and orientation in real time, and a hand-
tracking device [1, 13]. The tracker was necessary to couple the
synthetic view to the user’s viewpoint as they moved about.
The acronym HMD can also refer to helmet-mounted
displays, where the display is attached to a military or aviator
helmet. Notable systems include the HMD sighting system for
the Cobra helicopter and the Integrated Helmet and Display
Sighting System (IHADSS) used on the AH-64 Apache
helicopter [9], both fielded by the US Army.
Head-mounted display (HMD) designs may be classified
as immersive—also known as standard closed-view—or see-
through. While immersive optics refer to designs that block the
direct real-world view, see-through optics refers to designs that

18
allow augmentation of synthetic images onto the real world [5,
14]. Closed view displays can be combined with head mounted
image sensors to create a video see-through HMD. Alternatively,
with an optical see-through HMD, the real world is seen through
semi-transparent mirrors (optical combiners) placed in front of
the user’s eyes.
2.2.2 The Characteristics of an Optical See-Through
HMD
Optical see-through HMDs work by placing optical
combiners in front of the user’s eyes. The user can see the real
world through the optical combiners since they are partially
transmissive. The combiners are also partially reflective, so that
the user can also see computer generated images bounced off
the combiners. Figure 1 shows two optical see-through HMDs
and Figure 2 shows a conceptual diagram of an optical see-
through HMD [5].

19
Figure 1. Two optical see-through HMDs, made by Hughes Electronics [5].
Figure 2. Optical see-through HMD conceptual diagram [5].
Choosing the reflection to transmission ratio and hence
the level of blending is a design problem. The ratio can be
chosen to match the brightness of the displays with the expected

20
light levels in the real-world environment [13]. Most existing
optical see-through HMDs reduce the amount of the incoming
light from the real world. Without power the optical see-through
HMD works as a pair of sunglasses [1, 5]. The synthetic images
appear as semitransparent ghosts floating in front the real scene
[15]. Optical see-through displays have relatively simple
structures and they are widely used [15]. Optical see-through
HMDs have the advantage that the real world image is
preserved without any degradation except for a reduction in light
levels.
There are many advantages and disadvantages in using
optical see-through HMDs in augmented reality systems due to
their characteristics.
The major disadvantages of optical see-through HMDs
are sensitivity to latency and inability to support realistic
occlusion. The system latency or lag is the largest source of
registration errors in most current HMD systems [13]. If the head
moves in the presence of latency the synthetic imagery will not
be immediately updated and will appear to move or ‘swim’ with

21
respect to scene. Typically latency is minimized through system
design [5, 13] and prediction is used to minimize the effects of
head movements [1, 5]. However, sudden movements will still
cause misregistration. In real life, an opaque object can block the
view of another object so that part or all of it is not visible and
occlusion is a compelling monocular depth cue. In computer
graphics it is not a problem to generate computer objects that
occlude each other. However, it is more difficult to make real
objects occlude virtual objects and vice versa since proper
occlusion requires that the depth of real objects must be
determined and, furthermore, real objects cannot be easily
removed from the scene [13].
Some of the major advantages of using optical see-
through HMDs include safety, simplicity, and visual fidelity. From
safety point of view the user still has a direct view of the real
world even when the device fails or is not powered. Optical
blending is simple and cost effective as there is only one stream
of video to process and the images of the real world are from the
eyes natural vantage point. Field of view for the real world image
is not linked to the display size and can be relatively unrestricted.

22
A resolution close to that obtained with the naked eye is
provided and distortion is minimal [1, 5 and 13]. Similarly, the
depth of field when viewing objects in the scene is not degraded
and the eye can naturally focus on objects at various distances.
In contrast in a video see-through display the resolution,
field of view and depth of field is restricted by the camera and
display characteristics and there needs to be compensation for
the offset between the camera and eye vantage points.
However, video and computer generated imagery can be
matched for latency, focus and geometrical registration.
Recovery of depth and structure of the real world is facilitated by
having a video image and realistic occlusion is possible.
The field of view using see-through HMDs is different from
the user perspective by being one of three kinds: Monocular,
Biocular or Binocular [14].
Optical see-through HMDs typically provide from 20° to
60° overlay FOV which may appear somewhat limited. Larger
FOVs have been obtained, up to 82.5 x 67 degrees, at the
23
expense of reduced brightness, increased complexity, and
massive, expensive technology [13].
However; in optical see-through HMDs the user can still
use his/her peripheral vision around the device, thus increasing
the total real-world FOV to numbers that match closely one's
natural FOV [1].
2.3 Representation of Terrain and Landscape
A digital elevation model (DEM) is a digital representation
of ground surface topography or terrain. It is also widely known
as a digital terrain model (DTM). Typically a DEM is represented
as a raster (a grid of squares) or as a triangular irregular
network. It is generally refers to a representation of the Earth's
surface or subset of it, excluding features such as vegetation,
buildings, bridges, etc [20].
Data for DEMs are usually obtained using remote sensing
or land surveying techniques such as LIDAR, Topographic Maps
and Inertial surveys. DEMs are used often in geographic
information systems, and are the most common basis for

24
digitally-produced relief maps. In addition DEMs are widely used
in flight simulators and navigation and localization tools based on
the Global Positioning System (GPS) [20].
2.4 Global Coordinate Systems
In order to express a DEM in a meaningful way a
coordinate system needs to be associated with physical features
of the local terrain or of the globe it self. The latitude-longitude
coordinate system uses angular measurements to describe a
position on the surface of the earth relative to arbitrary but
standard reference coordinates. Latitude-longitude systems date
from Ptolemy’s first world atlas in A.D. 150, have been used by
mariners and aviators ever since [21] and remain the basis of
many modern maps, charts and navigation systems.
Currently, the most common lat-long standard among
geographical coordinate systems is the global coordinates
system, where the Prime Meridian and the Equator are the
reference planes used to define latitude and longitude [21].
The geodetic latitude of a point is the angle from the
equatorial plane to the vertical direction of a line normal to the

25
reference ellipsoid. The geodetic longitude of a point is the
dihedral angle between a reference plane and a plane passing
through the point, both planes being perpendicular to the
equatorial plane and passing through the centre of the reference
ellipsoid. The third coordinate, the geodetic height is the
distance from the point to the nearest point on the reference
ellipsoid [22] Figure 3. The most recent world geodetic system
that defines a reference frame for the earth is WGS84 dating
from 1984, which will be valid up to 2010 [21].
Figure 3. The Geodetic Coordinate System, picture is taken from [22].

26
2.5 Universal Transverse Mercator (UTM) Coordinate System
The Mercator projection is a map projection of the globe
onto a cylinder. The cylinder has its axis aligned with polar axis
and tangent to the equator. Lines of latitude (parallels) and
longitude (meridia) map to horizontal and vertical lines in this
projection. Scale is true at the equator or at two standard
parallels equidistant from the equator. Distortions of scale,
distance, direction and area increase away from the central
meridian which is why it cannot be used at high latitudes [22].
The projection is often used for marine navigation, where all
straight lines on the map are lines of constant azimuth, since it
easy to find the shortest route between any two points. Also it is
easy to index any position on the map or at any particular
geographical feature using x, y coordinates.
In spherical coordinate systems like latitude and
longitude, the distance covered by a degree of longitude differs
as you move towards the poles and only equals the distance
covered by a degree of latitude at the equator. However as land
navigation typically only considers a very small part of the world

27
at any one time local coordinates specified in distance would be
convenient. The UTM system allows the coordinate numbering
system to be associated with distances on the earth [23].
The Universal Transverse Mercator (UTM) projection was
developed by the US Army Corps of Engineers. It is used to
define locations on the earth’s surface world-wide by dividing the
surface of the Earth into grid. The world is divided into 60
longitudinal zones, each 6º wide and a Transverse Mercator
projection performed for each zone. A Transverse Mercator
projection is a cylindrical map projection like the Mercator except
that the cylinder is rotated 90º so that its axis lies in the
equatorial plane. The meridian at which the cylinder is tangent to
the sphere is known as the central meridian. Distortions of scale,
distance, direction and area increase away from the central
meridian [22]. In UTM, a Transverse Mercator projection is
defined for each longitudinal zone with the central meridian of
the projection aligned with the centre of each longitudinal strip.
Use of a separate projection for each strip minimizes distortion
since all projections are centred on the area of interest.
28
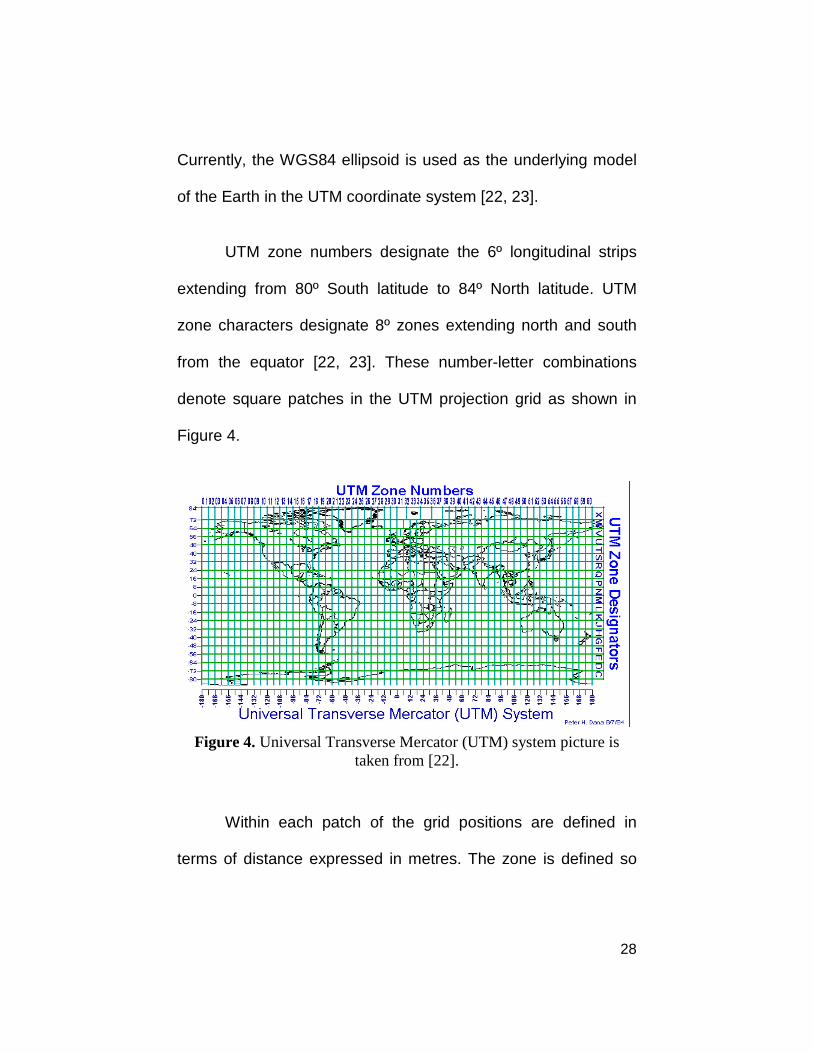
Currently, the WGS84 ellipsoid is used as the underlying model
of the Earth in the UTM coordinate system [22, 23].
UTM zone numbers designate the 6º longitudinal strips
extending from 80º South latitude to 84º North latitude. UTM
zone characters designate 8º zones extending north and south
from the equator [22, 23]. These number-letter combinations
denote square patches in the UTM projection grid as shown in
Figure 4.
Figure 4. Universal Transverse Mercator (UTM) system picture is
taken from [22].
Within each patch of the grid positions are defined in
terms of distance expressed in metres. The zone is defined so

29
that the central meridian through the zone is aligned with the
vertical dimension of the zone—all other meridian in the zone will
map to curved lines. Also there are no negative numbers or
East-West designators. Within each patch positions are specified
as distance eastward to the point (known as the Easting) and
northward to the point (known as the Northing) as in an X-Y
Cartesian coordinate system, and thus Cartesian coordinate
mathematics can be used [23]. The Eastings are defined relative
to the central meridian of the zone which is assigned an arbitrary
Easting of 500,000 m which prevents the need for negative
numbers. The Northing is defined as distance relative to the
equator, which is assigned a Northing of 0 m for measurements
in the Northern hemisphere [23].
2.6 Aerial Search and Rescue Missions
2.6.1 Description of Aerial Search and Rescue
Techniques
As defined by the national SAR manual [24] “search and
rescue (SAR): comprises the search for, and provision of aid to,
persons, ships or other craft which are, or are feared to be, in
distress or imminent danger.”

30
Any SAR mission aims to prevent loss of life and injury;
also it aims to minimize damage to or loss of property if possible.
The SAR operations in Canada are divided into two categories;
aeronautical SAR and maritime SAR [24]. Aeronautical incident
involves search and rescue of aircraft, while maritime incidents
involves search and rescue of ships and boats.
In response to the occurrence of an air incident,
controllers at one of the three Canadian Rescue Coordination
Centers (RCC) must make a series of critical decisions on the
appropriate procedures to follow in order to deal with the
incident. These decisions and procedures (called case
prosecution) include an assessment of the degree of emergency,
a formulation of the hypotheses on what might have happened
and where, the development of a plan for the search and rescue
(SAR) missions and in the end, the generation of reports [25].

31
3. Probability Grid Mapping System for Aerial Search (PGM) 3.1 PGM System Concept
The Probability Grid Mapping System (PGM) aims to
make the search task easier and more effective by supplying the
searcher with an augmented digital mapping system for the
search area. The goal of PGM is to superimpose indicators of
search probability directly onto the user’s view of the real world
as they search. The symbology is conformal and geographically
referenced so that it remains fixed to the appropriate portion of
the real world terrain as the aircraft travels or pilot moves their
head.
The goal is to have markers to direct the searchers’
scanning activity without obstructing their view of the terrain to
be searched. Ideally, these markers would reflect both the a
priori search estimates and be dynamically updated to reflect the
probability of finding the target in given areas as they are
covered and searched during the flight. By presenting the
symbology in an ESVS display, the searcher can automatically

32
associate markers that code the search priorities with physical
locations.
This augmented reality can help automatically guide the
searcher’s scan behaviour to high probability regions by
providing fixation cues and visual highlights to attend to.
Presenting the display as a geo-referenced augmented reality
also avoids the need to look, interpret and transform data
presented on traditional paper maps or 2-D moving map displays
into coordinates in the scene viewed out the window.
The view of the real world can be either direct as in the
current implementation or could be itself an ESVS display based
on sensors such as LIDAR, infrared cameras and other sensors.
Challenges in implementing this vision include the typical
challenges of effective and precise augmented reality—tracking,
latency, registration, world modeling, and so on—as well as the
requirements of effective highlighting of the areas to be searched
without interfering with the search process within those areas.
This paper describes a prototype implementation that embodies

33
much of the PGM concept for evaluation of the concepts in both
simulation and in real aircraft.
3.2 PGM Implementation
Figure 5 shows a block diagram of the PGM system. As an
aviation AR system, the PGM must present synthetic data
appropriate for the current aircraft location and in the context of
standard operating procedures for airborne search. The system
relies on a helmet-mounted display to present the augmentation
to the user, sensors on the helmet and aircraft to estimate the
current pose, and databases of terrain to be flown over and of
search probability estimates. The PGM System integrates four
different sources of data: head position and orientation data,
navigation data, terrain data and input search data and fuses
these to present the required highlighted probability map
augmentation, registered with the real world, onto the see-
through HMD.
We have developed two variants of the PGM, one for
integration into a research helicopter platform and the other for
integration in a simulation environment. The actual flight testing

34
is designed for the National Research Council of Canada NRC
Bell 412 helicopter, where the NRC provides the helicopter and
the crew for testing the PGM system.
Figure 5. Block diagram of the PGM system.
3.2.1 Probability Maps
The PGM system provides searchers with probability of
target locations. The probability is estimated by the search
coordinator or equivalent on the ground based on data obtained
about the situation. i.e. the last place the person has seen, or if
any areas has been already searched, etc. The map is displayed

35
using a see-through head mounted display (HMD) to augment it
with the real world.
Providing the searcher with an optical see-through head
mounted display allows them to see the real world highlighted
with different colors while the helicopter is flying over it. For each
region of the search area, a probability of detection (in the
region) is estimated and the colours are assigned to code the
likelihood of detection in the area. Table 1 illustrates the five
different colors currently used in the PGM system with their
probability ranks.
Table1. The priority of the search area in the PGM system is displayed using one of the different colors. Red indicates the highest priority search area.
Probability Ranks Color
1 Red
2 Yellow
3 Pink
4 Orange
5 Purple
These colours were chosen based on their ease of
discrimination from natural vegetation and terrain colouring. A
continuum of color was not chosen because of the risk that it

36
might be confusing for the searcher. The probability ranks could
be interpreted literally as the expected likelihood of finding the
target at any given point in the coloured area. Alternatively, the
rankings can indicate degree of coverage in previous search
(i.e., red indicates 0-15% coverage with 85% of the area
unsearched previously). Most often the rankings will represent
relative likelihood of finding the target in the various areas – for
instance on a scale from 1 to 5. In any case, a higher probability
ranking indicates a higher priority for searching the specified
area.
A point and click user interface was developed for
coloring the probability map and defining the search priority
areas Figure 6. The system provides a 2-D map view of the area
to be searched and allows for zooming and panning. The user
selects colors from the coding scheme and paints a geo-
registered overlay layer defining the probability map. This
overlay is then exported to the serve as the input probability grid
for the PGM system.

37
Figure 6. The 2D map picture for the Ottawa region with areas of interest highlighted according to the probabilities.
3.2.2 Terrain Data Repository
The PGM symbology is overlaid and conforms to the
terrain flown over. To register and align the symbology with the
appropriate part of the scene, the system needs an accurate
terrain model. In the PGM system this is provided by a repository
of terrain data in the form of digital elevation models (DEM).
Typically a DEM is represented as elevation samples along a
raster (a grid of squares) or as a triangular irregular network. It
represents the elevation and contour of the surface of the earth
and usually excludes features such as vegetation, buildings,
bridges, etc [20]. DEMs are widely used to represent terrain

38
shape in flight simulators and navigation and localization tools
based on the Global Positioning System (GPS) [20].
The Universal Transverse Mercator (UTM) coordinate
system is used in PGM. In this system, the surface of the Earth
(modeled as the WGS84 ellipsoid [22, 23]) is divided into 60
longitudinal zones, each 6º wide and a Transverse Mercator
projection performed for each zone. Use of a separate projection
for each strip minimizes distortion since all projections are
centered on the area of interest. Within each patch of the grid
positions are defined in terms of distance expressed in meters.
The DEM used in the PGM system is provided by
Geobase Canada (www.geobase.ca). For our experiments we
used data from the Ottawa region (Geobase sections 031G11
and 031G12). The Canadian Digital Elevation Data (CDED)
consists of an ordered array of ground elevations at regularly
spaced intervals. The DEM map was converted to ESRI ASCII
grid known as ARC/INFO ASCII grid which holds the geodetic
data in UTM format.

39
3.2.3 Motiom Tracking and Pose Estimation
The Bell 412 helicopter is equipped with a differential
GPS receiver integrated with an Inertial Navigation System (INS)
and radar altimeter that provide the necessary geodetic data to
specify the helicopter location. The flight computer estimates
navigational data (a NovAtel model 3151M OEM GPS card
receiver, Micropack IMU, LN-200 IMUs and medium accuracy
LTN-90-100 [26]) and passes navigation data packets over
Ethernet. The PGM is designed to receive these packets to
obtain the current aircraft position and orientation in world
coordinates so that the terrain digital elevation map can be
aligned with current aircraft position.
In the simulation environment, the INS packets are
generated by running an instance of the open-source flight
simulator Flightgear, augmented with a custom GPS sender
simulator. The simulator runs on a separate Linux-based
computer than the PGM and sends simulated navigation packets
appropriate for current aircraft position to the PGM system via
Ethernet. Thus, in both simulator and real aircraft cases,
identical PGM software processes incoming navigation data to

40
update the displayed 3-D map so that it is aligned and
appropriate for the current position in the scene.
Since the display is head mounted, the displayed scene
must be updated to reflect the user’s head pose for the synthetic
imagery to be correctly registered with the scene. For the
simulation environment we use an IS900 hybrid acoustic-inertial
six degree of freedom (6DOF) position and orientation tracking
system to track the head movements. In the aircraft, the acousto-
inertial tracker is not feasible and a 6DOF Laser BIRD 2 head
tracker Figure 7 is used to track the head position and
orientation relative to the cockpit [27]. Both devices use a similar
protocol interface and appear equivalent to the software.
Figure 7. Laser BIRD 2 head tracker

41
3.2.4 Display and Image Generation
An optical see-through helmet-mounted display
superimposes the geo-referenced imagery onto the user’s view
of the scene. For the flight system a see-through Liteye HMD
(LE-750) is used as the display. It uses a 800x600 pixel
resolution microdisplay and it weights 78 grams see Figure 8 For
the simulation system a see-through N-Vision Datavisor HMD is
used as a helmet mounted devise is not necessary. It is a full-
colour micro-CRT based display with 1280x1024 resolution at 60
Hz (180Hz colour sequential).
Image generation and sensor data collection to present
augmented imagery is performed by COTS hardware on a
standard personal computer (CentOS5 Linux, dual Intel® core 2
dual™ CPU [email protected] GHz, 2025 MB memory, and NVIDIA
GeoForce 8800 GTS video card).

42
Figure 8. Liteye Head Mounted Display (LE-750) [28].
3.3 Software Architecture
Custom C code generates the augmented images in real
time using the OpenGL application programming interface (API).
The VE (Virtual Environment) API is used to display the virtual
environment. VE provides abstractions for both the output
displays the input devices allowing for run-time re-configuration
and substitution of input and display devices [29].
3.3.1 Map Data
The total area of each map segment is 2,171,407,920 m2.
The map is divided into small squares; each corresponding to
200X200 meters in the real world with 54,285 squares per map

43
segment. The highlighted PGM maps are saved in portable gray
map image format (.pgm) for import by the PGM system.
The data from the PGM image is stored in a 2D array that
represents input search data in the form of x-y coordinates each
with an associated probability value p. The p value ranges from
1 to 5 representing the probability rank.
The (x,y,p) values are compared with another 2D array
containing the terrain pixels during rendering in real time. In the
terrain 2D array the x and y values are space on a 50 m square
grid and the z value represents the elevation.
3.3.2 Viewpoint Computation and Registration
3.3.2.1 Head Pose Estimation
The Navigation data provided through the INS/GPS, as
well as head tracker data are converted to x, y and z coordinates
in order to connect the terrain map with the current location of
the aircraft. The aircraft orientation is combined with the head
tracking data to computer the view direction and vantage point.
The terrain map is converted to UTM Cartesian system

44
coordinates for registration purposes. Figure 9 illustrates the
head pose estimation dataflow.
Figure 9. Head pose estimation data.
3.3.3 Scene Augmentation
Since the HMD’s used both in the simulation and in the
helicopter are see through HMDs, the searcher will be able to
see the real world, as well as the highlighted areas. For
illustration see Figure 10 and Fig 11.

45
Figure 10. A simulation for real world and an area of interest highlighted with red.
Figure 11. A screen shot illustrates the terrain map highlighted with different colours accordin to probabilities.
Recall that the terrain map in the PGM system is divided
into small sections or grids of 200x200 meters. By associated
each section with the corresponding input search data, the
search priority will be linked to the spatial map. During the
rendering process the sections will be coloured with the

46
appropriate colour indicating the priority of the search. Two
different methods of highlighting the terrain map will be
evaluated: In the first method the colour will be filled over the
whole section (the shading method), while in the second method
the color will be given to the borders of the section (the wire
frame method) as shown in Figure 12.a and Figure 12.b. Both
methods will be tested to determine which way is more effective.
In both methods, only areas of interest will be highlighted while
areas not of interest will not be rendered to minimize latency and
visual clutter. We also plan to explore other highlighting schemes
such as marker and flagpole analogies that have better visibility
in rugged terrain.
Figure 12. (a) Different areas highlighted with the shading method (b) Different areas highlighted with the wireframe method.
For flexible effects to cope with variations in lighting and
terrain coloring, the ability to blend the transparent object’s color
a b

47
with the real world behind it is important. When an object is
rendered on the screen, an RGB color and a z-buffer depth are
associated with each pixel. Another component, called alpha (α),
can also be generated and optionally stored to represent the
degree of opacity of the highlights [29]. OpenGL blending is used
with these alpha parameters to make areas of interest appears
transparent to enhance visibility and clarity for the search.
3.4 Experiments
Two sets of experiments were designed to evaluate the
PGM system, the first simulation experiment will be held in the
lab prior to flight test while the second experiment is the actual
flight test.
3.4.1 Experiment 1
A simulation of the helicopter visual environment and the
aircraft hardware was needed to evaluate the grid mapping
system. The augmented reality hardware and software
configuration for this simulation setup were described previously.
For the simulation environment, three linux based computers are
used, one for displaying the PGM system and two to run

48
Flightgear simulator as a master and slave to mimic the pilot and
the tactile officer tasks.
The flight simulation environment is displayed in large
immersive projection environment to simulate the cockpit view
and make the experiment more realistic. The pilot (an
experimenter) controls the flight path using a joystick. The user
playing the role of tactical officer wears the helmet-mounted
display which augments view of the simulated world presented
on the projected display. Button presses on another joystick are
used for them to indicate the locations and the time of finding a
target.
The objective behind detecting the time and the location
of the target is to test whether the time of the search will
decrease using the PGM system and if so by how much. Also it
tests if the probability of detection for the searcher will increase
and if false positives will be reduced. The essential question is
whether the efficiency of the search will improve with the
augmentation.

49
A four-level between-subject design will be used (i.e., four
groups of ten participants each). Each participant will participate
in one session; the length of the session is half an hour. All
groups will be given a 2D map of the search area. The first group
of participants will also use the PGM system with the shaded
method through the HMD. The second group will see the PGM
system with the wireframe method through the HMD. The third
group will not use the PGM system and will be only given the 2D
paper map with no areas highlighted. The fourth group will not
use the PGM system and they will be given the 2D paper map
but with areas highlighted on it.
Each participant will be given the same scenario about
the missing targets, the target sizes and colors will be different
e.g. people, cars, pets, etc. When a participant sees a target he
will be asked to push a button on the joystick for the detection
and when the helicopter is hovering above the target and he/she
discovers it is true target he/she will push another button for the
discrimination purpose. Each time a button is pushed the
navigation data and the time will be recorded. Also information
about which target was found will be manually recorded.

50
3.4.2 Experiment 2
In experiment 2, subjects will be asked to perform the
same tasks as in the simulation in the real aircraft. The searcher
will perform one or more sessions from the levels described in
the experiment 1. The 2D static maps will be displayed on a
head down display placed in the center of the instrument panel.
The limitation of the number of trials is due to time and cost. The
searcher will be asked to flick one of the toggle switches on the
helicopter collective stick up in the detection task and down in
the discrimination task Figure 13. As in the simulation the
navigation data and the time will be recorded. Also the
information about the target type will be recorded.
Figure 13. The switches in Bell 412 helicopter which will be used in the detection and discrimination process.

51
4. Discussion The PGM system is a novel ESVS system concept that
aims to improve the effectiveness of airborne personnel that are
not flying the aircraft. In security applications the system is
intended to aid the other officer in the aircraft who is managing
and performing the tactical mission.
PGM is specifically intended for guided aerial search. The
PGM helps the searcher by guiding his scan behavior to high
probability regions through augmented reality markers.
By presenting the markers as a geo-referenced
augmented reality the system aims to avoid the need for
cognitively demanding tasks of interpreting and transforming the
data presented on traditional maps.
The PGM system could be applied in the future to night
vision systems, permitting a similar augmented capability at
night.

52
5. Acknowledgment Many thanks to all who helped me through my master
study, and special thanks to my supervisor Dr. Robert Allison,
Dr. James Edler, and to my colleagues in percept lab.
Also I would like to thank my husband for his patient and
support, to my family and friends. Thank you every one!

53
6. References
1. J. P. Rolland and H. Fuchs. ‘‘Optical versus video seethrough head-mounted displays,’’ in Fundamentals of Wearable Computers and Augmented Reality, W. Barfield and T. Caudell, eds. (Erlbaum, Mahwah, N.J., 2001, pp. 113–156.
2. C. Jennings, A. K. Barrows,, K. Alter, And J. D. Powell. “Synthetic vision displays instrument landings and traffic awareness-development and flight testing,” IEEE Philadelphia, PA, USA, vol. 1, pp. 2A2/1-2A2/8, 2000.
3. W. A. Hoff, ,and K. Nguyen.. “Computer vision-based registration techniques for augmented reality,” proceeding of Intellegent Robots and Computer Vision XV, vol. 2904, pp. 18-22, November 1996 [Boston, MA, pp. 538-548.]
4. M. Rosenthal, A. State, H. Lee, G. Hirota, J. Ackerman, K. Keller, E. D. Pisano, M. Jiroutek, K. Muller and H. Fuchs. “Augmented reality guidance for needle biopsies: An initial randomized controlled trial in phantoms,” Medical Image Analysis, vol. 6, no. 3, pp. 313-320, 2002.
5. R. T. Azuma. “A survey of augmented reality,” Presence Teleoperators and Virtual Environments, vol. 6, no. 4, pp. 355-385, 1997.
6. Young, Warren R. and the editors of Time-Life Books. “The Helicopters,” Time-Life Books, Alexandria, Virginia. 1982.
7. E. Theunissen, and M. Mulder. “Open and closed loop control with a perspective tunnel-in-the-sky display”. AIAA Flight simulation technologies conference, Scottsdale, pp. 32-42, August 1-3, 1994.
8. S. Julier, M. Lanzagarto, Y. Baillot, L. Rosenblum, and S. Feiner. “Information filtering for mobile augmented reality,” IEEE Int’l Symp. Augmented Reality, pp. 3-11, 2000.
9. “New virtual-reality helmets designed to help save more lives-Canada,” http://www.ncerce.gc.ca/media/success/geoide99204_e.htm captured on April 28th, 2009.
10. Youngblut C., Johnson R., Nash S., Wienclaw R., and Will C. Review of Virtual Environment Interface Technology, IDA Paper P-3186, Log: H96-001239, Institute for Defense Analysis, 1996.
11. Keller, John. Laser tracker fits the bill for helicopter augmented-reality system. (optoelectronics watch), Military and Aerospace. Electronics,01 May 2004.

54
12. Perry R. A.; and Robertson S. Virtual Terrain for a Helicopter Mission Simulator, Defence Science Technology Organization, 1998.
13. Rolland, J.P., Holloway, R.L. and Fuchs, H., A comparison of optical and video see-through head-mounted displays.In Proceedings of the SPIE, Vol. 2351-35, 1994.
14. Rolland, J.P. and Hua, H., Head-mounted display systems. In Encyclopedia of Optical Engineering, Johnson, R. B. and Driggers, R. G., eds. (Dekker, 2005), 1–13.
15. Kiyokawa, K., Kurata, Y. and Ohno, H., An Optical See-through Display for Mutual Occlusion of Real and Virtual Environments. In Proceedings of the Int"l Symp. Augmented Reality 2000 (ISAR 00), IEEE CS Press, Los Alamitos, Calif., 2000, 60-67.
16. Milgram, P., Takermura, H., Utsumi, A. and Kishino, F., Augmented reality: a class of displays on the reality-virtuality continuum. In SPIE, Telemanipulator and Telepresence Technologies, Vol. 235, 1994, 282-292.
17. Carolina Cruz-Neira , Daniel J. Sandin , Thomas A. DeFanti, Surround-screen projection-based virtual reality: the design and implementation of the CAVE, Proceedings of the 20th annual conference on Computer graphics and interactive techniques, p.135-142, September 1993.
18. Barrows, A.K., Nav3D Corp., Palo Alto, CA, USA; Registration of synthetic vision imagery: issues and pitfalls. In Proceeding the 21st Digital Avionics Systems Conference, Vol. 2, pp. 11C3-1- 11C3-10, 2002.
19. Hines, G. D., Rahman Zia-ur, Jobson, D. J., Woodell, G. A.; Harrah, S. D., AA(NASA Langley Research Ctr. (USA)), AB(College of William & Mary (USA)), AC(NASA Langley Research Ctr. (USA)), AD(NASA Langley Research Ctr. (USA)), AE(NASA Langley Research Ctr. (USA)), Real-time enhanced vision system. In Proceedings of the SPIE, Vol. 5802, pp. 127-134, 2005.
20. Wilson, J.P.; Gallant, J.C., Terrain Analysis: Principles and Applications. pp. 1–27, 2000.
21. National Imagery and Mapping Agency. Department of Defence, NIMA Technical Report TR8350.2, World Geodetic System 1984: Its Definition and Relationships with Local Geodetic Systems. Third Edition 4 July 1997. Bethesda, MD: National Imagery and Mapping Agency.
22. Dana, Peter H. Entries: National Map Accuracy Standards (NMAS), 304-305, Projection, 348-351, Universal Transverse Mercator (UTM), 497-498. In Encyclopedia of Geographic

55
Information Science. Ed. Karen K. Kemp. Los Angeles: Sage Publications, 2008.
23. Snyder, John P. Map Projections - A Working Manual. U.S. Geological Survey Professional Paper 1395. United States Government Printing Office, Washington, D.C., 1987.
24. B–GA–209–001/FP–001 DFO 5449, “National SAR manual,” May 2000.
25. I. Abi-Zeid, Q. Yang, and L. Lamontangne, “Is CBR applicable to the coordination of search and rescue operations? A feasibility study,” In Proceeding of the third International Conference on Case-Based Reasoning, Springer, Seeon, Germany, pp. 358-371, 1999.
26. B. W. Leach, and k. Hui. “Low Cost Strapdown Ineertial/DGPS Intergration for Flight Test Requirements”. Aeronaut. Space J., vol. 45, No. 3, Canada, pp. 253-263, September 1999.
27. “Ascension laserBIRD 2™,” 5DT Fifth dimention technologies virtual relaity for the real world, http://www.5dt.com/products/plaserbird.html, captured on April 29th, 2009.
28. Inition, “LE-750 see-through head mounted displays” http://www.inition.co.uk/inition/product.php?URL_=product_hmd_liteye_700&SubCatID_=15, captured on May, 27th, 2009.
29. “The VE 2.2 user manual,” http://www.cse.yorku.ca/~ivy/ve-2.2/. Captured on April 20th, 2009.
30. M. Woo, J. Neider, and T. Davis. “OpenGL programming guide,” Second Edition. Addison Wesley, 1997.