Probability and Samples: The Distribution of Sample Means
41
Chapter 7 Probability and Samples: The Distribution of Sample Means PowerPoint Lecture Slides Essentials of Statistics for the Behavioral Sciences Eighth Edition by Frederick J. Gravetter and Larry B. Wallnau
-
Upload
jasondroesch -
Category
Education
-
view
224 -
download
5
Transcript of Probability and Samples: The Distribution of Sample Means

Chapter 7Probability and Samples: The Distribution of Sample Means
PowerPoint Lecture Slides
Essentials of Statistics for the Behavioral Sciences Eighth Edition
by Frederick J. Gravetter and Larry B. Wallnau

Chapter 7 Learning Outcomes
• Define distribution of sampling means1
• Describe distribution by shape, expected value, and standard error2
• Describe location of sample mean M by z-score3
• Determine probabilities corresponding to sample mean using z-scores, unit normal table4

Tools You Will Need
• Random sampling (Chapter 6)
• Probability and the normal distribution (Chapter 6)
• z-Scores (Chapter 5)

7.1 Samples and Population
• The location of a score in a sample or in a population can be represented with a z-score
• Researchers typically want to study entire samples rather than single scores
• Sample provides estimate of the population
• Tests involve transforming sample mean toa z-score

Sampling Error
• Error does not indicate a mistake was made
• Sampling error is the natural discrepancy, or the amount of error, between a sample statistic and its corresponding populationparameter
• Samples are variable; two samples are very, very rarely identical

7.2 Distribution of Sample Means
• Samples differ from each other
– Given a random sample it is unlikely that sample means would always be the same
– Sample means differ from each other
• The distribution of sample means is the collection of sample means for all the possible random samples of a particular size (n) that can be obtained from a population

Sampling distribution
• Distributions in earlier chapters were distributions of scores from samples
• “Distribution of Sample Means” is called a sampling distribution
– The “Distribution of Sample Means” is a special kind of population
– It is a distribution of sample means obtained by selecting all the possible samples of a specific size (n) from a population

Figure 7.1 PopulationFrequency Distribution Histogram

Figure 7.2 Distribution ofSample Means (n=2)

Important Characteristics ofDistributions of Sample Means
• The sample means pile up around the population mean
• The distribution of sample means is approximately normal in shape

Central Limit Theorem
• Applies to any population with mean μ andstandard deviation σ
• Distribution of sample means approaches a normal distribution as n approaches infinity
• Distribution of sample means for samples of size n will have a mean of μM
• Distribution of sample means for samples of size n will have a standard deviation =
n

Shape of theDistribution of Sample Means
• The distribution of sample means is almost perfectly normal in either of two conditions
– The population from which the samples are selected is a normal distributionor
– The number of scores (n) in each sample is relatively large—at least 30

Expected Value of M
• Mean of the distribution of sample means is μM and has a value equal to the mean of the population of scores, μ
• Mean of the distribution of sample means is called the expected value of M
• M is an unbiased statistic because μM , the expected value of the distribution of sample means is the value of the population mean, μ

Standard Error of M
• Variability of a distribution of scores is measured by the standard deviation
• Variability of a distribution of sample means is measured by the standard deviation of the sample means, and is called the standard error of M and written as σM
• In journal articles or other textbooks, the standard error of M might be identified as “standard error,” “SE,” or “SEM”

Standard Error of M
• The standard error of M is the standard deviation of the distribution of sample means
• The standard error of M provides a measure of how much distance is expected on average between M and μ

Standard Error Magnitude
• Law of large numbers: the larger the sample size, the more probable it is that the sample mean will be close to the population mean
• Population variance: The smaller the variancein the population, the more probable it is that the sample mean will be close to the population mean
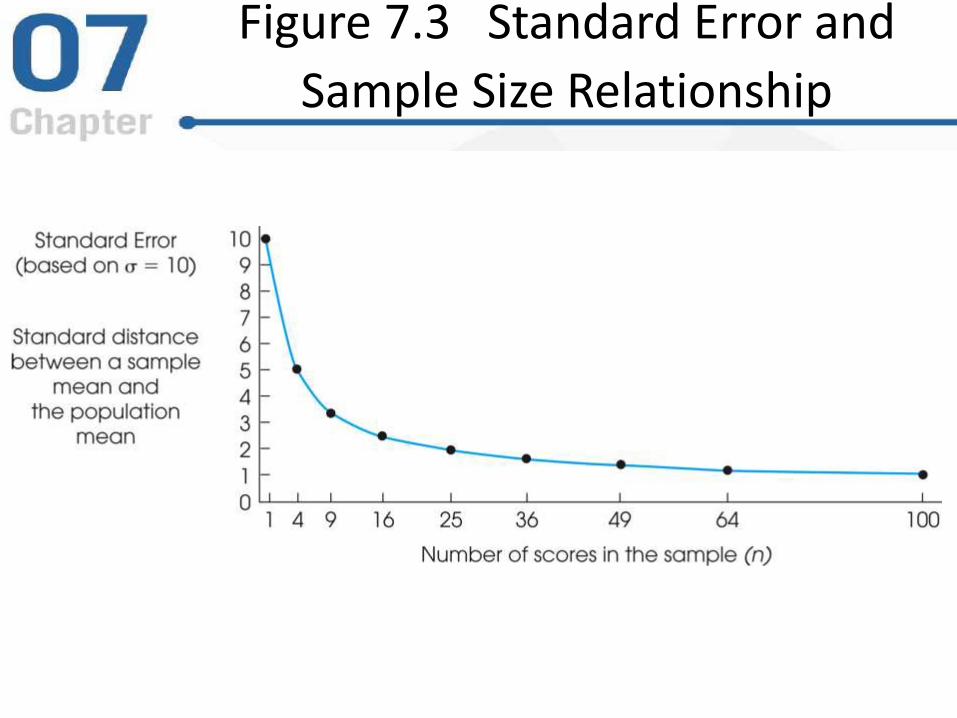
Figure 7.3 Standard Error and
Sample Size Relationship

Figure 7.4 Distributions of Scores vs. Sample Means

7.3 Probability and the Distribution of Sample Means
• Primary use of the distribution of sample means is to find the probability associated with any particular sample (sample mean)
• Proportions of the normal curve are used to represent probabilities
• A z-score for the sample mean is computed
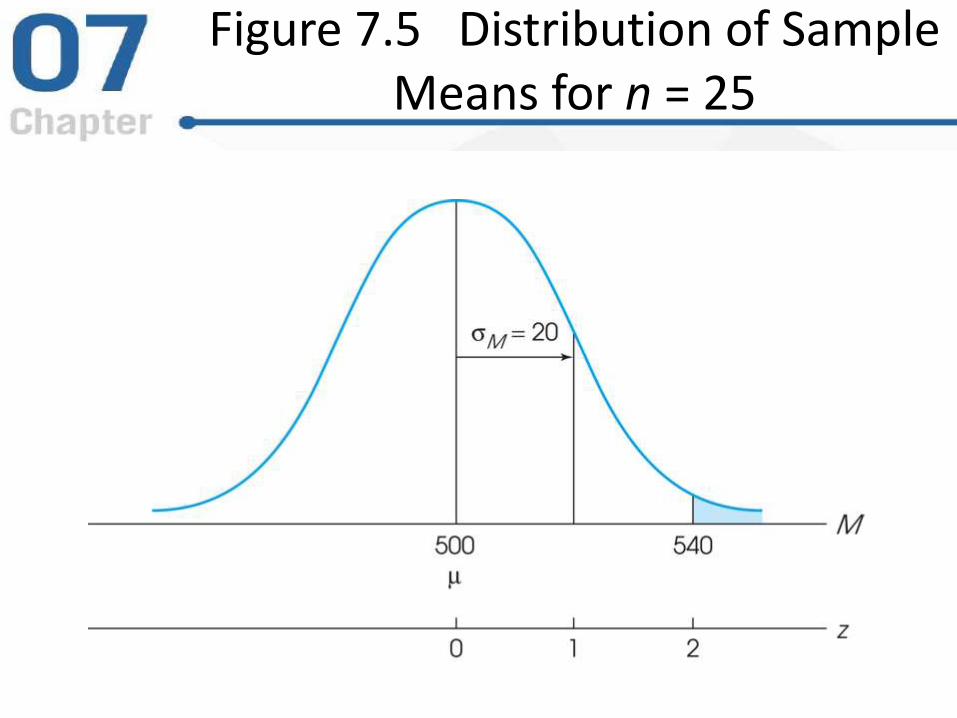
Figure 7.5 Distribution of Sample Means for n = 25

A z-Score for Sample Means
• Sign tells whether the location is above (+) or below (-) the mean
• Number tells the distance between the location and the mean in standard deviation (standard error) units
• z-formula:M
Mz

Figure 7.6 Middle 80% of the Distribution of Sample Means

Learning Check
• A population has μ = 60 with σ = 5; the distribution of sample means for samples of size n = 4 selected from this population would have an expected value of _____
• 5A
• 60B
• 30C
• 15D

Learning Check - Answer
• A population has μ = 60 with σ = 5; the distribution of sample means for samples of size n = 4 selected from this population would have an expected value of _____
• 5A
• 60B
• 30C
• 15D

Learning Check
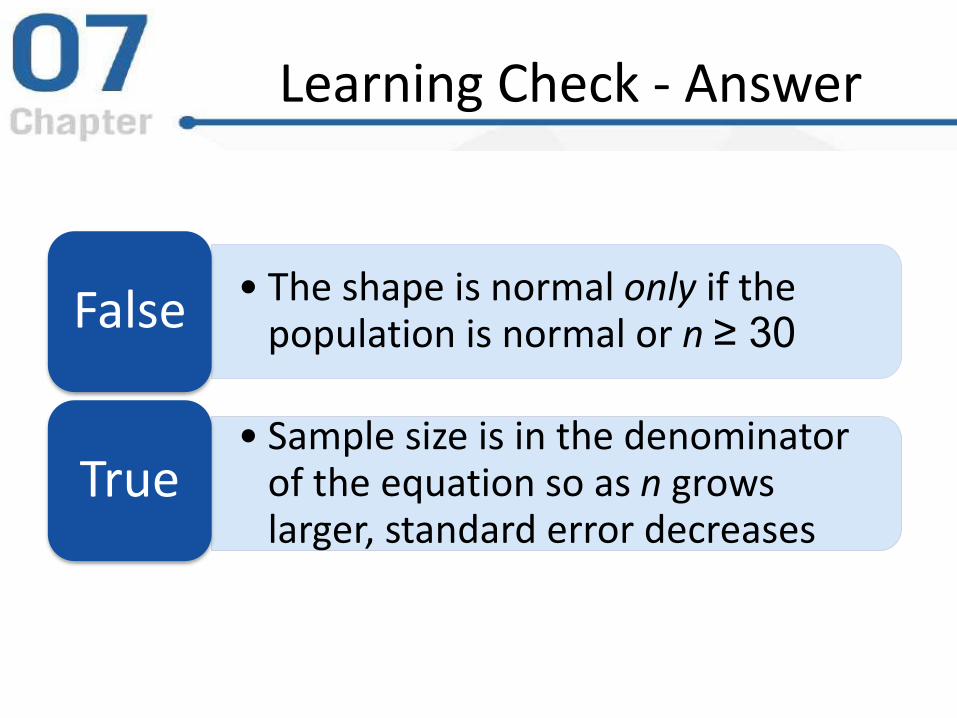
• Decide if each of the following statements is True or False
• The shape of a distribution of sample means is always normalT/F
• As sample size increases, the value of the standard error decreasesT/F
Learning Check - Answer
• The shape is normal only if the population is normal or n ≥ 30False
• Sample size is in the denominator of the equation so as n grows larger, standard error decreases
True
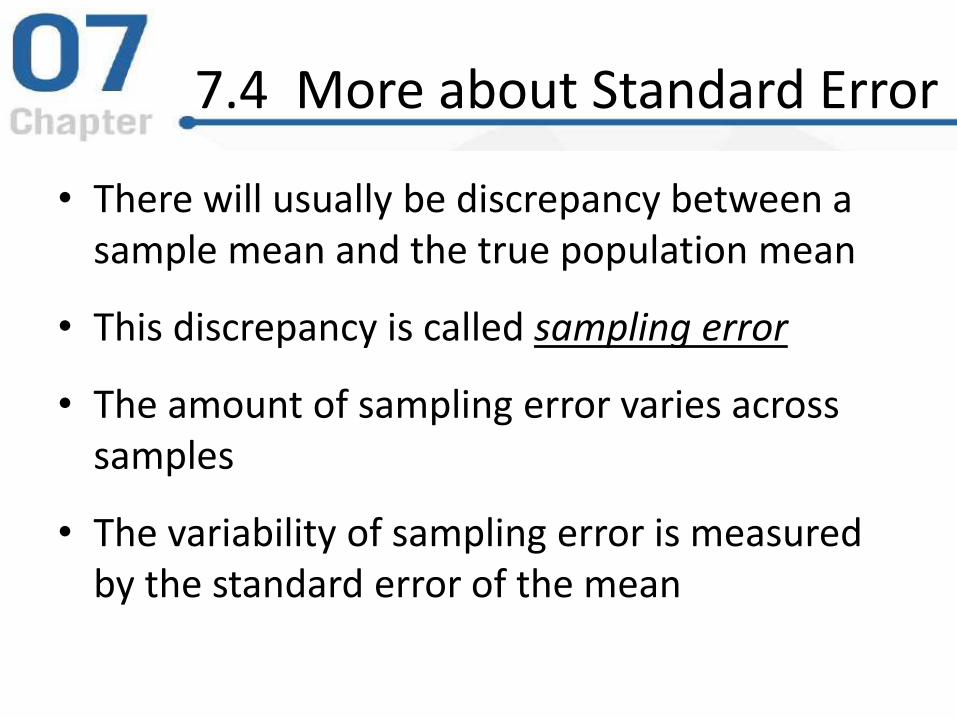
7.4 More about Standard Error
• There will usually be discrepancy between a sample mean and the true population mean
• This discrepancy is called sampling error
• The amount of sampling error varies across samples
• The variability of sampling error is measured by the standard error of the mean

Figure 7.7 Example of typical distribution of sample means

Figure 7.8 Distribution of Sample Means when n = 1, 4, and 100

In the Literature
• Journals vary in how they refer to the standard error but frequently use:
– SE
– SEM
• Often reported in a table along with n and M for the different groups in the experiment
• May also be added to a graph

Figure 7.9Mean (±1 SE) in Bar Chart

Figure 7.10Mean (±1 SE) in Line Graph

7.5 Looking Ahead toInferential Statistics
• Inferential statistics use sample data to draw general conclusions about populations
– Sample information is not a perfectly accurate reflection of its population (sampling error)
– Differences between sample and population introduce uncertainty into inferential processes
• Statistical techniques use probabilities to draw inferences from sample data

Figure 7.11 Conceptualization of research study in Example 7.5

Figure 7.12 Untreated Sample Means from Example 7.5

Learning Check• A random sample of n = 16 scores is obtained
from a population with µ = 50 and σ = 16. If the sample mean is M = 58, the z-score corresponding to the sample mean is ____?
• z = 1.00A
• z = 2.00B
• z = 4.00C
• Cannot determineD

Learning Check - Answer• A random sample of n = 16 scores is obtained
from a population with µ = 50 and σ = 16. If the sample mean is M = 58, the z-score corresponding to the sample mean is ____?
• z = 1.00A
• z = 2.00B
• z = 4.00C
• Cannot determineD

Learning Check
• Decide if each of the following statements is True or False
• A sample mean with z = 3.00 is a fairly typical, representative sampleT/F
• The mean of the sample is always equal to the population meanT/F

Learning Check - Answers
• A z-score of 3.00 is an extreme, or unlikely, z-scoreFalse
• Individual samples will vary from the population mean
False

Figure 7.13 Sketches of Distribution in Demonstration 7.1

AnyQuestions
?
Concepts?
Equations?