Determinants of Non Performing Loans in Commercial Banks ...
1
Pro-cyclical Management of Banks’ Non-Performing Loans by the Indian Public Sector Banks
B M Misra and Sarat Dhal*
This study provides an analysis of pro-cyclicality of bank indicators with a focus on the non-performing loans (NPAs) of India‟s public sector banks. The empirical analysis demonstrates that banks‟ NPAs are influenced by three major sets of factors, i.e., terms of credit, bank specific indicators relating to asset size, credit orientation, financial innovations (non-interest income), and regulatory capital requirement and the business cycle shocks. Using panel regression model, the study found that the terms of credit variables such as interest rate, maturity and collateral and bank specific variables had significant effect on the banks' non-performing loans in the presence of macroeconomic shocks. The empirical findings support the policy approach to the banking in the Indian context. The credit culture as reflected in the terms of credit variables could play an important role in the banks‟ management of business cycle impact on loans and credit risk.
JEL Classification : G21, E51, G11, C23 Key Words : Bank credit, non-performing loans, terms of credit, panel regression.
1. INTRODUCTION
Following the implementation of the Basel Accord across several countries, a large
literature including Borio, Furpine and Lowe (2001), Borio and Lowe (2002), White (2006) has
emerged on the subject of procyclicality of bank indicators. Economists‟ concern derives from
the key lesson learned from the various crises including the recent global crisis originating
from an advanced economy like the US, i.e., the procyclicality of financial indicators could
contribute to the amplification of the business cycle and thereby, pose problems for
macroeconomic policies for stabilization purposes. From policy perspective, many studies
have suggested that regulators could adopt counter-cyclical prudential measures for
maintaining financial stability and ensuring sustained economic progress. According to White
(2006), such a policy framework could entail a new macroeconomic stabilization framework
and symmetric policy response to the expansionary and contractionary phases of the financial
cycle. Taking inspirations from the literature, this study focuses on the Indian context. There
are several motivations for the study. The Indian context could provide crucial insights about
the experience of a leading emerging market economy. India adopted financial sector reform
in the early 1990s, with a focus on the banking sector that constitutes the predominant
component of the financial system. As part of the banking sector reform, India adopted
various prudential norms in line with the Basel Accord, apart from introducing measures
aimed at strengthening price discovery process in the financial markets and competition in the
banking sector based on the recommendations of the two high level committees on banking
* B. M. Misra is Adviser and Sarat Dhal is Assistant Adviser, Department of Economic Analysis and Policy,
Reserve Bank of India, Central Office, Mumbai. The views expressed are of the authors only, and they have no
bearing on the organization to which the authors belong.
2
sector. Reflecting the success of financial sector reform, the Indian economy witnessed rapid
progress during the post reform period, notwithstanding the episodes of contraction in the
economy during the late 1990s and the early part of the current decade due to various
adverse external and domestic developments such as the Asian crisis, the world recession
and the poor monsoon. The average growth rate of real Gross Domestic Product (GDP)
increased to 6.4 per cent and 8.8 per cent during the 1990s and 2003-08, respectively, from
the growth rates of 5.8 per cent during the 1980s and 3.5 to 4.0 per cent, the latter often
referred to „hindu growth’ rate, during the 1950s through the 1970s. In tandem with the
economic progress, the banking sector also showed significant improvement in terms of
various prudential indicators relating to capital, asset quality, management, efficiency and
liquidity. In this milieu, several pertinent questions arise. How did Indian banks manage to
show improved performance? How did Indian banks overcome the business cycle? Whether
bank indicators in India are procyclical in nature? Whether there were several other variables
which contributed to the banks‟ performance over the years. This study is focused on non-
performing loans, which reflect on the credit risk management by the banks*.There is a
considered view that loan defaults could be managed by appropriate risk pricing of loans
encompassing the terms of credit variables such as interest rate, maturity, collateral, and
credit culture. For the empirical evidence, the study uses pooled regression analysis based on
the balance sheet data of 27 public sector banks over the period 1996 to 2008. These public
sector banks account for the bulk of the banking system in terms of aggregate deposits,
credit, and investments. Deriving from the literature on the subject, we demonstrate that apart
from the business cycle, the terms of credit variables played an important role with statistically
significant effects on the banks' non-performing loans in the presence of bank size induced
risk preferences and macroeconomic shocks. The changes in the cost of credit in terms of
higher interest rate induce rise in the NPAs. On the other hand, factors like maturity of credit,
better credit culture and favorable macroeconomic and business conditions lead to lowering
of the NPAs. Business cycle may have differential implications adducing to differential
response of borrowers and lenders. These findings have implications for regulation and
policy. The remainder of the study is structured in three sections comprising the review of
literature, empirical findings, policy implications and conclusion in that order.
*According to the Reserve Bank of India, the credit risk is most simply defined as the potential that a bank’s borrower or
counterparty may fail to meet its obligations in accordance with agreed terms. The goal of credit risk management is to
maximize a bank’s risk-adjusted rate of return by maintaining credit risk exposure within acceptable parameters. Banks need to
manage the credit risk inherent in the entire portfolio, as well as, the risk in the individual credits or transactions. Banks should
have a keen awareness of the need to identify measure, monitor and control credit risk, as well as, to determine that they hold
adequate capital against these risks and they are adequately compensated for risks incurred (see the Master Circular No.
DBOD.No.BP.BC. 6 /21.01.002/2009-10 dated July 1, 2009, RBI/2009-2010/37, RBI, www.rbi.org.in ).

3
2. THE LITERATURE
From a cross-country perspective, studies on the problem of loan defaults or non-
performing loans (NPLs) bring to the fore several useful perspectives. Sergio (1996) in a
study of non-performing loans in Italy found that an increase in the riskiness of loan assets is
rooted in a bank‟s lending policy adducing to relatively unselective and inadequate
assessment of sectoral prospects. Business cycle could be a primary reason for banks‟ non-
performing loans. But the increase in bad debts as a consequence of recession alone was not
empirically demonstrated. In a study of loan losses of US banks, McGoven (1993) argued that
„character‟ has historically been a paramount factor of credit and a major determinant in the
decision to lend money. Banks have suffered loan losses through relaxed lending standards,
unguaranteed credits, the influence of the 1980s culture, and the borrowers‟ perceptions.
Thus, the study suggested that bankers should make a fairly accurate personality-morale
profile assessment of prospective and current borrowers and guarantors. In addition, banks
could minimise risks by securing the borrower‟s guarantee, using Government guaranteed
loan programs, and requiring conservative loan-to-value ratios. Bloem and Gorter (2001)
suggested that a more or less predictable level of non-performing loans, though it may vary
slightly from year to year, is caused by an inevitable number of „wrong economic decisions‟ by
individuals and plain bad luck (inclement weather, unexpected price changes for certain
products, etc.). Under such circumstances, the holders of loans can make an allowance for a
normal share of non-performance in the form of bad loan provisions, or they may spread the
risk by taking out insurance. Enterprises may well be able to pass a large portion of these
costs to customers in the form of higher prices. For instance, the interest margin applied by
financial institutions will include a premium for the risk of non-performance on granted loans.
Bercoff, Giovanniz and Grimardx (2002) using accelerated failure time (AFT) model in their
study of Argentina‟s banking sector‟s weakness measured by the ratio of non-performing
loans to total loans found that both bank specific indicators such as asset growth, the ratio of
net worth to net assets, the ratio of operating cost to assets, exposure to peso loans, and
institutional characteristics relating to private bank and foreign bank and macroeconomic
variables including credit growth, foreign interest rate, reserve adequacy and monetary
expansion, besides the tequila effect were reasons behind the banking fragility. Their
empirical results suggested that the bank size measured by assets had a positive effect but
asset growth had a negative effect on NPLs. The variables such as operating cost, exposure
to peso loans, credit growth, and foreign interest rate had negative effect on NPLs. The
macroeconomic variables such as money multiplier, and reserve adequacy, institutional
characteristics and tequila effect had positive influence on NPLs. Fuentes and Maquieira
(1998) undertook an in-depth analysis of loan losses due to the composition of lending by
4
type of contract, volume of lending, cost of credit and default rates in the Chilean credit
market. Their empirical analysis examined different variables which may affect loan
repayment such as the limitations on the access to credit, macroeconomic stability, collection
technology, bankruptcy code, information sharing, the judicial system, prescreening
techniques, and major changes in the financial market regulation. They concluded that a
satisfactory performance of the Chilean credit market, in terms of loan repayments hinges on
a good information sharing system, an advanced collection technology, macroeconomic
performance and major changes in the financial market regulation. In another study of Chile,
Fuentes and Maquieira (2003) analysed the effect of legal reforms and institutional changes
on credit market development and the low level of unpaid debt in the Chilean banking sector.
Using time series data on yearly basis (1960-1997), they concluded that both information
sharing and deep financial market liberalisation were positively related to the credit market
development. They also reported less dependence of unpaid loans with respect to the
business cycle compared to interest rate of the Chilean economy. Altman, Resti and Sironi
(2001) analysed corporate bond recovery rate adducing to bond default rate, macroeconomic
variables such as GDP and its growth rate, the amount of bonds outstanding, amount of
default, return on default bonds, and stock return. It was suggested that default rate, amount
of bonds, default bonds, and economic recession had negative effect, while the GDP growth
rate, and stock return had positive effect on corporate recovery rate. Lis, et.al.,(2000) used a
simultaneous equation model in which they explained bank loan losses in Spain using a host
of indicators, which included GDP growth rate, debt-equity ratios of firms, regulation regime,
loan growth, bank branch growth rates, bank size (assets over total size), collateral loans, net
interest margin, capital-asset ratio (CAR) and market power of default companies. They found
that GDP growth (contemporaneous, as well as one period lag term), bank size, and CAR,
had negative effect while loan growth, collateral, net-interest margin, debt-equity, market
power, regulation regime and lagged dependent variable had positive effect on problem
loans. The effect of branch growth could vary with different lags. Kent and D‟Arcy (2000) while
examining the relationship between cyclical lending behaviour of banks in Australia argued
that the potential for banks to experience substantial losses on their loan portfolios increases
towards the peak of the expansionary phase of the cycle. However, towards the top of the
cycle, banks appear to be relatively healthy; non-performing loans are low and profits are
high, reflecting the fact that even the riskiest of borrowers tend to benefit from buoyant
economic conditions. While the risk inherent in banks‟ lending portfolios peaks at the top of
the cycle, this risk tends to be realized during the contractionary phase of the business cycle.
At this time, banks‟ non-performing loans increase, profits decline and substantial losses to
capital may become apparent. Eventually, the economy reaches a trough and turns towards a
new expansionary phase, as a result the risk of future losses reaches a low point, even

5
though banks may still appear relatively unhealthy at this stage in the cycle. Jimenez and
Saurina (2003) used logit model for analysing the determinants of the probability of default
(PD) of bank loans in terms of variables such as collateral, type of lender and bank-borrower
relationship while controlling for the other explanatory variables such as size of loan, size of
borrower, maturity structure of loans and currency composition of loans. Their empirical
results suggested that collateralised loans had a higher PD, loans granted by savings banks
were riskier and a close bank-borrower relationship had a positive effect on the willingness to
take more risk. At the same time, size of bank loan had a negative effect on default while
maturity term of loans, i.e., short-term loans of less than 1-year maturity had a significant
positive effect on default.
In the Indian context, there is a considered view that banks‟ lending policy could have
crucial influence on non-performing loans (Reddy, 2004). He critically examined various
issues pertaining to terms of credit of Indian banks and argued that „the element of power has
no bearing on the illegal activity. A default is not entirely an irrational decision. Rather a
defaulter takes into account probabilistic assessment of various costs and benefits of his
decision‟. Reddy (2004) raised various critical issues pertaining to credit delivery mechanism
of the Indian banking sector. The study focused on the terms of credit such as interest rate
charged to various productive activities and borrowers, the approach to risk management,
and portfolio management in general. There are three pillars on which India‟s credit system
was based in the past; fixing of prices of credit or interest rate as well as quantum of credit
linked with purpose; insisting on collateral; and prescribing the end-use of credit. Interest rate
prescription and fixing quantum has, however, been significantly reduced in the recent period.
The study also highlighted the issues in security-based or collateralised lending, which need
careful examination in the context of growing services sector. Given the fungibility of
resources, multiple sources of flow of resources, as well as application of funds, the relevance
and feasibility of end-use restrictions on credit need a critical review. The link between formal
and informal sectors shows that significant divergence in lending terms between the two
sectors still persists, despite the fact that the interest rate in informal markets is far higher
than that of the formal sectors- the banking sector. The convergence between formal and
informal sectors could be achieved by pushing the supply of credit in the formal sector
following a supply leading approach to reduce the price or interest rate. Furthermore, in the
context of NPAs on account of priority sector lending, it was pointed out that the statistics may
or may not confirm this. There may be only a marginal difference in the NPAs of banks‟
lending to priority sector and the banks lending to private corporate sector. Against this
background, the study suggested that given the deficiencies in these areas, it is imperative
that banks need to be guided by fairness based on economic and financial decisions rather

6
than system of conventions, if reform has to serve the meaningful purpose. Experience shows
that policies of liberalisation, deregulation and enabling environment of comfortable liquidity at
a reasonable price do not automatically translate themselves into enhanced credit flow.
Although public sector banks have recorded improvements in profitability, efficiency (in terms
of intermediation costs) and asset quality in the 1990s, they continue to have higher interest
rate spreads but at the same time earn lower rates of return, reflecting higher operating costs
(Mohan, 2004). Consequently, asset quality is weaker so that loan loss provisions continue to
be higher. This suggests that, whereas, there is greater scope for enhancing the asset quality
of banks, in general, public sector banks, in particular, need to reduce the operating costs
further. The tenure of funds provided by banks either as loans or investments depends
critically on the overall asset-liability position. An inherent difficulty in this regard is that since
deposit liabilities of banks often tend to be of relatively shorter maturity, long-term lending
could induce the problem of asset-liability mismatches. The maturity profile of commercial
bank deposits shows that less than one fifth is of a tenor of more than three years. On the
asset side, nearly 40 per cent has already been invested in assets of over three year maturity.
Banks also have some capacity to invest in longer term assets, but this capacity will remain
highly limited until the fiscal deficit remains as high as it is and the Government demand for
investment in long dated bonds remains high. Some enhancement of their capacity to invest
in infrastructure, industry and agriculture in longer gestation projects can be achieved by
allowing a limited recourse to longer term bond issues.
In an another study, Mohan (2003) observed that lending rates of banks have not come
down as much as deposit rates and interest rates on Government bonds. While banks have
reduced their prime lending rates (PLRs) to some extent and are also extending sub-PLR
loans, effective lending rates continue to remain high. This development has adverse
systemic implications, especially in a country like India where interest cost as a proportion of
sales of corporates are much higher as compared to many emerging economies. The
problem of NPAs is related to several internal and external factors confronting the borrowers
(Muniappan, 2002). The internal factors are diversion of funds for expansion, diversification
and modernisation, taking up new projects, helping/promoting associate concerns, time/cost
overruns during the project implementation stage, business (product, marketing, etc.) failure,
inefficient management, strained labour relations, inappropriate technology/technical
problems, product obsolescence, etc., while external factors are recession, non-payment in
other countries, inputs/power shortage, price escalation, accidents and natural calamities. In
the Indian context, Rajaraman and Vasishtha (2002) in an empirical study provided an
evidence of significant bivariate relationship between an operating inefficiency indicator and
the problem loans of public sector banks. In a similar manner, largely from lenders‟

7
perspective, Das and Ghosh (2003) empirically examined non-performing loans of India‟s
public sector banks in terms of various indicators such as asset size, credit growth and
macroeconomic condition, and operating efficiency indicators. The Indian viewpoint alluding
to the concepts of „credit culture‟ owing to Reddy (2004) and „risk pricing‟ owing to Mohan
(2003a) confirm with several studies mentioned in the above that apart from the business
cycle, banks‟ lending policy could play an important role in the management of loan defaults.
3. EMPIRICAL ANALYSIS
A comparative picture of the trends Gross NPA ratio and various other bank indicators
including the terms of credit variables relating to maturity (share of term loans in total
advances), interest cost of deposits, operating expenses to asset ratio, loan collateral (the
share of unsecured loans), credit-deposit ratio deriving from the balance sheets of 26 public
sector banks in India since 1995-96 is presented in Table 1 and Annex 1.
The average credit-deposit ratio of banks increased from slightly less than 50 per cent in
the second half of the 1990s to 71 per cent by March 2009, reflecting the impact of financial
sector reform and the changes in monetary policy such as the reduction of statutory liquidity
requirement and cash reserve ratio and softening of interest rates. However, the growth of
credit did not show the deterioration in asset quality as the management of NPAs showed
significant improvement. The gross NPAs as percentage to advances declined from about 18
per cent in 1995-96 to 1.7 per cent in 2008-09. The declining trend in the Gross NPA ratio
was accompanied by the rising trend in the loan maturity, declining loan interest rate, the
improvement in managerial efficiency through the reduction in banks‟ operating cost,
strengthening of capital to risk weighted assets and the improvement in the banks profitability
(return on assets).
3.1 Panel Regression Results
The essence of a cross section analysis is to provide meaningful analysis of inter-
linkages among economic and financial variables after duly recognising the heterogeneous
nature of economic agents and their behavior. If economic agents were similar, a time series
analysis would serve a meaningful purpose. The panel regression methodology recognises
individual characteristics as well as regularity and/or continuity in the cross-section units in
order to establish a meaningful relationship between different economic and financial
variables. In this context, a pertinent question arises whether public sector banks are
homogeneous or heterogeneous in nature. From an institutional perspective, it may be
argued that public sector banks are similar entities. However, it was evident that the economic
8
behaviour of each bank as reflected in various stylized facts about the loan portfolio, the cost
structure and the performance could not be similar. This was evident from cross-section
maximum and minimum values and the variability of various indicators (Annex 1). Thus, a
cross section analysis assumes importance.
The basic regression equation for the NPA indicator is postulated in terms of various
factors affecting the loan market from the demand side (borrowers) and supply side (banks)
as follows:
Gross NPA Ratio = F (Loan Interest, Cost burden of banks, Collateral,
Loan Maturity, Credit orientation, Policy rate,
Regulatory Capital Requirement, Business Cycle,
Lag Dependent variable)
Annex 2 provides the description of the variables. The study uses gross NPAs rather than the
net NPAs because the latter affected by banks‟ provisions may not adequately reflect on the
underlying credit risk and loan defaults faced by the banks. For robustness of the empirical
findings, the regression equations were estimated with alternative measures of business cycle
variable: the deviation of GDP over logarithm scale from its trend (using Hodrick-Prescott)
method, the actual GDP growth rate, actual GDP growth rate less expected GDP growth rate
(one period lag), actual GDP growth less the expected medium term GDP growth rate
(average of last three years GDP growth rate). The key findings arising from the estimated
equations as shown in Annex 3 are as follows.
First, the terms of credit variables were statistically significant with appropriate sign.
Loan interest rate had positive impact on Gross NPA ratios.
Second, the maturity of loans had negative impact on gross NPA ratio; a bank
providing longer term loans could benefit form lower NPAs. Longer term loan contracts could
be attributable to better relationship between the banks and borrowers.
Third, the bank size variable had positive impact on gross NPA ratios. This could imply
that large banks are more likely to have relatively more NPAs. This finding is in line with the
literature. Due to the balance sheet constraint, small banks could show greater managerial
efficiency than large banks in terms of loans screening and post loan monitoring, leading to
lower defaults.

9
Table 1: Trends in Bank Indicators
GNPA Ratio Lending Rate Loan Maturity
Collateral (secured loans to total
loans)
1996 18.12 12.65 26.89 93.05
1997 18.53 13.87 29.62 92.91
1998 17.04 11.85 32.23 92.35
1999 16.35 11.45 33.88 92.40
2000 14.20 10.91 35.02 91.84
2001 12.72 10.66 35.16 89.81
2002 11.39 9.85 35.67 88.11
2003 9.87 9.37 39.20 88.62
2004 7.58 8.21 45.24 87.17
2005 5.38 7.37 49.75 84.76
2006 3.87 7.20 52.50 82.83
2007 2.55 7.77 55.65 82.83
2008 1.93 8.74 55.65 80.62
2009 1.74 9.40 54.95 81.81
CRAR Provisions Return on Assets Operating Expenses
1996 8.76 1.75 -0.43 3.04
1997 9.21 1.00 0.47 2.92
1998 11.13 0.86 0.71 2.76
1999 11.24 0.91 0.43 2.72
2000 11.42 0.96 0.54 2.59
2001 11.38 1.02 0.38 2.78
2002 11.45 1.26 0.73 2.40
2003 12.47 1.46 1.01 2.34
2004 13.13 1.63 1.22 2.24
2005 12.54 1.45 0.85 2.19
2006 12.11 1.07 0.77 2.08
2007 12.21 0.95 0.84 1.78
2008 11.93 0.74 0.86 1.55
2009 13.34 0.89 0.89 1.47
Interest on
Deposits
Net Interest
Margin
Non-interest income
ratio Credit-deposit Ratio
1996 7.88 4.76 1.27 50.72
1997 8.08 5.79 1.22 47.54
1998 7.57 4.28 1.29 47.25
1999 7.57 3.87 1.19 46.35
2000 7.58 3.33 1.32 47.30
2001 7.30 3.37 1.24 48.45
2002 7.14 2.72 1.59 50.57
2003 6.40 2.97 1.79 51.41
2004 5.29 2.92 2.01 51.87
2005 4.59 2.78 1.39 56.83
2006 4.63 2.57 0.97 64.88
2007 4.98 2.79 0.94 69.15
2008 6.08 2.66 1.00 71.04
2009 6.36 3.04 1.06 71.29

10
Fourth, the terms of credit variables like the interest rate, loan maturity, and bank size
the collateral variable (the proportion of unsecured loans) did not show invariably significant
positive impact on the NPAs. It may be mentioned here that the unsecured loans included
credit cards, where are treated as unfunded loans. Moreover, credit cards served the
transaction needs of customers.
Fifth, the lag dependent variable, reflecting on the persistence of loan defaults, was
also positive and statistically significant. But the size of this coefficient was less than 0.5;
indicative of moderate legacy effect due better loan management by banks.
Sixth, banks having credit-deposit ratio greater than the industry average could have
more NPAs. This could be attributable to better customer centric credit culture adopted by the
banks.
Seventh, non-interest income, reflecting upon technological progress and financial
innovations, had a favourable impact of moderating the NPAs.
Eighth, the coefficient of policy variable, i.e., changes in the interest rate signals, had
positive impact on NPAs. This implied contractionary (expansionary) policy had positive
association with the NPAs.
Finally, we come to the business cycle variable. Alternative measures of business
cycle variable had differential association with the NPAs. The cyclical output and lagged GDP
growth rate (expected GDP growth) had inverse relationship with the NPAs. The current GDP
growth showed a positive but statistically insignificant association with the NPAs. On the
other hand, unanticipated GDP growth rate (current GDP growth rate less previous GDP
growth rate) showed a positive association with the NPAs. But the unanticipated GDP growth
over a medium term (the deviation of current GDP growth rate from the past three-year
average GDP growth) showed a positive but insignificant effect on the NPAs.
3. Policy Implications
In India, macroeconomic stabilization in terms of monetary and fiscal policies
appropriate for sustained economic progress is the hallmark of India‟s policy approach to a
sound and stable banking sector. The operating procedures of monetary policy witnessed a
shift in emphasis from direct instruments to indirect instruments of monetary management
during the reform period. During the reform period, the reduction in the cash reserve
requirement (CRR) from 15 per cent to 5 per cent and the SLR from 38 per cent to 25 per
cent was aimed at reducing statutory pre-emption of banks‟ funds so that they could lend
more to productive sectors. The monetary policy increasingly relied on short-term policy
interest rate, the repo and reverse rates, for signaling to financial markets apart from using

11
the open market operations to manage liquidity conditions. As part of the banking sector
reform, the policy approach to sound and stable banking sector banking focused on instituting
an appropriate credit culture encompassing effective terms of credit, efficient asset-liability
management (ALM) and strict adherence to prudential norms in line with Basel Accord. As
part of the ALM, Reserve Bank had issued guidelines on Asset Liability Management in
February 1999, which covered, among others, interest rate risk and liquidity risk
measurement, reporting frameworks and prudential limit. Further in April 2006, the Reserve
Bank issued guidelines on ALM to the banks to follow Duration Gap Analysis (DGA) along
with the traditional gap analysis for some banks. In line with the policy approach, banks are
managing the maturity structure of deposits and loans and investments. They are increasingly
mobilizing term deposits in order to provide long-term loans for productive sectors such as
infrastructure. Recently, the Reserve Bank of India constituted a Committee (Chairman: Mr.
Deepak Mohanty) to look into the prime lending rates of banks and suggest recommendations
for further strengthening of the credit culture. The Committee submitted its report in October
2009, with a host of recommendations for enhancing transparency in the pricing of loans and
determinations of lending rates. According to the Committee, the existing benchmark prime
lending rate (BPLR) system should be replaced with a new Base Rate System (BRS). The
constituents of the Base Rate would include (a) the card interest rate on retail deposit
(deposits below Rs.15 lakh) with 1-year maturity adjusted for current account and savings
account (CASA) deposits; (b) adjustment on account of negative carry in respect of CRR and
SLR; (c) unallocatable overhead cost for banks; and (d) average return on net worth. The final
lending rates would include the Base Rate plus variable or product specific operating
expenses, credit risk premium and tenor premium. In order to make the lending rates
responsive to the Reserve Bank‟s policy rates, the Group recommends that banks may review
and announce their Base Rate at least once in a calendar quarter with the approval of their
Boards. The Base Rate alongside actual minimum and maximum lending rates may be
placed in public domain. It is possible that some banks charge unduly high product specific
operating expenditure, credit risk and term premium from some borrowers. In order to avoid
such unhealthy practices, the banks should continue to provide the information on lending
rates to the Reserve Bank and disseminate information on the Base Rate. In addition, banks
should also provide information on the actual minimum and maximum interest rates charged
to borrowers. This would give both existing and prospective borrowers an idea of variable
operating cost, credit risk and term premium charged by different banks.
The empirical findings of the study broadly support the policy approach to the banking
sector in India. While the credit risk as reflected in non-performing loans could be influenced
by the business cycle, it could be managed by appropriate terms of credit variable such as

12
loan interest rate and maturity and capital buffers, which have significant influence on non-
performing loans. From this perspective, the proposed new system of lending rate is expected
to enable banks to better manage credit risk.
4. Conclusion
This study analyzed the non-performing loans of public sector banks in India in terms of
the response of NPLs to terms of credit, bank size and macroeconomic condition variables.
Using the pooled regression analysis, the study found that the terms of credit variables had
significant effect on the banks‟ non-performing loans in the presence of bank size and
macroeconomic shocks. Moreover, alternative measures of business cycle could give rise to
differential impact on bank‟s non-performing loans. The results of the study provide important
insights for banks‟ lending behavior. From policy perspective, these findings are in line with
the policy approach to banking sector in India, which emphasizes on the appropriate credit
culture and lending policy designed with relevant economic and financial factors. The
business cycle impact on non-performing loans could be managed with appropriate terms of
lending in terms of maturity, loan interest rate and capital requirement.

13
References
Altman, E.L., Andrea Resti and Andrea Sironi, (2001), „Analysing and Explaining Default Recovery Rates ‟, A
Report Submitted to the International Swaps & Derivatives Association.
Ambrose, B.W. and Charles A. Capone, Jr. (1996), „Do Lenders Discriminate in Processing Defaults?‟ Cityscape: A Journal of Policy Development and Research • Volume 2, Number 1 • February. Badu, Y.A., Kenneth N Daniels and Francis Amagoh (2002) „An empirical analysis of net interest cost, the probability of default and the credit risk premium, the case study of Virginia‟, Managerial Finance; 2002; 28, 4. Bercoff, J.J, Julian di Giovanniz and Franque Grimardx(2002),‟Argentinean Banks, Credit Growth and the Tequila Crisis: A Duration Analysis. Bhide, M.G., A Prasad, and S. Ghosh, (2002), „Banking Sector Reform: A Critical Overview‟, Economic and Political Weekly, February 2.
Bloem, A.M., and Cornelis N. Gorters, (2001) „The Macroeconomic Statistical Treatment of Nonperforming Loans‟, Discussion Paper, Statistics Department of the International Monetary Fund , December 1, 2001 Borio, CEV, C. Furfine and P Lowe (2001), Procyclicality of financial system and financial stability: Issues and policy options, BIS Papers No.1, March
Borio, C E V and P Lowe (2002): “Asset prices, financial and monetary stability: exploring the nexus”, BIS Working Papers, no 114, July. Borio, C E V and W R White (2004): “Whither monetary and financial stability? The implications of evolving policy regimes”, BIS Working Papers, no 147, February. CHIU, Ming and Sung Wook JOH, (2003) „Bank Loans to Distressed Firms: Cronyism, bank governance and economic crisis‟, Center for Economic Institutions at Hitotsubashi University.
Das, A., and S. Ghosh (2003), „Determinants of Credit Risk‟, paper presented at the Conference on Money, Risk and Investment held at Nottingham Trent University in November 2003 Fuentes, R and Carlos Maquieira (1998) Determinants of loan repayment in Chile, School of Business and Economics, Universidad de Chile Fuentes, R and Carlos Maquieira (2003) Institutional arrangements, credit market development and loan repayment in Chile, School of Business and Economics, Universidad de Chile
Gerard Caprio Jr. and Daniela Klingebiel (1996) „Bank Insolvency: Bad Luck, Bad Policy, or Bad Banking?‟ Annual World Bank Conference on Development Economics 1996, Policy Research Working Paper, 1620, World Bank. Herr, K.E., and Goe Miyazaki (1999) „A Proposal for The Japanese Non-Performing Loans Problem: Securitization as a Solution, Bankruptcy and Reorganization‟, Eds, Professor E. Altman, Japan, Tokyo, April 14, 1999
Keeton, William R.; Morris, Charles S., „Why Do Banks’ Loan Losses Differ?‟ (1987) : Economic Review - Federal Reserve Bank of Kansas City; May; 72, 5;
Jiménez, G. and J. Saurina (2003) „Collateral, Type of Lender and Relationship Banking as Determinants of Credit Risk, Bank of Spain‟. Kent, C and Patrick D‟Arcy, (2000) „Cyclical prudence - credit cycles in Australia’, BIS Papers No 1 Klonner, S and Ashok S. Rai, (2004), „Does Credit Rationing Reduce Defaults? Evidence from Rotating Savings and Credit Associations‟, Cornell University, U.S.A.
Laeven L, and Giovanni Majnoni (2003) „Does Judicial Efficiency Lower the Cost of Credit?‟, World Bank Policy Research Working Paper 3159, October 2003 Lis, S.F. de, J.M. Pages, and J. Saurina (2000), „Credit Growth, Problem Loans And Credit Risk Provisioning‟ In Spain, Banco de España — Servicio de Estudios, Documento de Trabajo no 0018 McGoven, John (1998), „Why bad loans happen to good banks‟, The Journal of Commercial Lending. Philadelphia: Feb 1993. Vol. 75, Issue. 6
Mohan, Rakesh (2003), „Transforming Indian Banking: In Search of a Better Tomorrow‟, Reserve Bank of India”, Speeches, Reserve Bank of India Bulletin, January.

14
Mohan, Rakesh (2004), „Finance for Industrial Growth‟, Reserve Bank of India Bulletin, Speech article, March. Moody‟s Investor Serviecs, (1998), „Report on Bankrupt Bank Loan Recoveries‟, June.
Mor, Nachiket and Bhavna Sharma, (2003), „Rooting Out Non-Performing Assets‟, Fifth Annual Conference on Money and Finance in the Indian Economy Indira Gandhi Institute of Development Research (IGIDR), Mumbai, January 30-February 1, 2003 Muniappan, G, (2002), The NPA Overhang, Magnitude, Solutions and Legal reforms‟, Reserve Bank of India. Paulo A. De Britto(2003), „Firm Financing: Debt Relief, Equity, and the Judicial System and Bankruptcy Code‟, Universidade de Brasillia -Departamento de Economia. Pain, Darren (2003) The provisioning experience of the major UK banks: a small panel investigation, Working Paper no. 177, Bank of England
Rajaraman, Indira, and G. Vasistha, (2002), „Non-performing Loans of Public Sector Banks-Some Panel results‟, Economic and Political weekly, February, 2002
Reddy, Y.V., (2004), “Credit Policy, Systems, and Culture”, Reserve Bank of India Bulletin, March. Santiago Fernández De Lis, Jorge Martínez Pagés And Jesús Saurina,(2000) „Credit Growth, Problem Loans And Credit Risk Provisioning in Spain‟, Paper presented in the BIS Autumn Central Bank Economists‟ Meeting, October 2000. Samy Ben Naceur (2003), „The Determinants Of The Tunisian Banking Industry Profitability: Panel Evidence‟, Department of Finance, Université Libre de Tunis Sergio, M, (1996), „Non-performing bank loans: Cyclical patterns and sectoral risk‟, Review of Economic Conditions in Italy. Rome: Jan-Jun 1996. , Issue. 1 White, W R (2006), „Procyclicality in the financial system: do we need a new macrofinancial stabilization framework?‟, BIS Working papers No 193, January.

15
Annex 1: Indicators of Indian Banks’ Performance
Summary Statistics (Cross section)
Year ending March Average Median Maximum Minimum
Standard deviation
Capital to Risk Weighted Assets Ratio (CRAR)
1996 8.76 8.81 16.99 2.63 3.07
1997 9.21 10.26 17.53 -18.81 6.06
1998 11.13 10.86 18.14 1.41 3.07
1999 11.24 10.87 14.35 9.57 1.41
2000 11.42 11.50 14.48 9.15 1.26
2001 11.38 11.50 23.11 0.00 3.48
2002 11.45 11.81 17.90 1.70 2.67
2003 12.47 12.41 18.50 9.33 1.89
2004 13.13 12.82 20.12 9.48 1.99
2005 12.54 12.15 18.16 9.21 1.87
2006 12.11 11.94 14.00 10.62 1.04
2007 12.21 12.29 14.14 10.40 0.80
2008 11.93 12.04 13.25 10.09 0.83
2009 13.34 13.21 18.41 11.37 1.31
Gross NPA Ratio
1996 18.12 16.16 38.00 5.68 7.41
1997 18.53 16.31 39.12 7.36 7.75
1998 17.04 15.06 38.96 6.16 7.34
1999 16.35 15.56 38.70 5.66 6.91
2000 14.20 13.71 32.77 5.39 5.86
2001 12.72 11.81 25.31 5.21 4.96
2002 11.39 9.96 26.53 4.21 5.31
2003 9.87 8.92 21.16 3.45 4.15
2004 7.58 7.40 18.16 3.44 3.38
2005 5.38 5.01 10.85 2.46 2.23
2006 3.87 3.43 9.61 1.94 1.74
2007 2.55 2.42 4.81 1.15 0.87
2008 1.93 1.73 3.16 0.74 0.68
2009 1.74 1.68 2.88 0.65 0.60
Contd.

16
Year ending March Average Median Maximum Minimum
Standard deviation
Provisions Ratio
1996 1.75 1.52 6.94 0.11 1.54
1997 1.00 1.04 1.88 0.14 0.51
1998 0.86 0.79 1.78 0.19 0.41
1999 0.91 0.78 2.87 0.12 0.57
2000 0.96 0.93 1.92 0.24 0.43
2001 1.02 1.02 1.86 0.22 0.38
2002 1.26 1.25 2.16 0.33 0.41
2003 1.46 1.43 2.09 0.80 0.37
2004 1.63 1.72 2.35 0.94 0.40
2005 1.45 1.34 2.30 0.79 0.41
2006 1.07 1.02 1.99 0.53 0.31
2007 0.95 0.90 1.38 0.52 0.18
2008 0.74 0.75 0.98 0.27 0.17
2009 0.89 0.91 1.17 0.62 0.18
Profitability per 100 Employee
obs 1996 -0.22 0.17 1.32 -4.91 1.26
1997 0.32 0.31 1.33 -1.43 0.53
1998 0.54 0.53 1.74 -1.12 0.53
1999 0.41 0.43 1.89 -2.91 0.79
2000 0.59 0.51 2.19 -1.62 0.66
2001 0.50 0.57 2.54 -2.43 0.87
2002 1.13 1.10 3.01 0.10 0.67
2003 1.75 1.58 3.88 0.04 0.88
2004 2.48 2.31 5.05 0.09 1.02
2005 2.06 2.06 4.99 -0.74 1.18
2006 2.11 2.22 3.92 0.36 1.04
2007 2.83 2.81 4.51 1.22 0.90
2008 3.57 3.66 6.12 0.74 1.23
2009 4.56 4.71 7.64 1.22 1.64
Return (Profitability) on Assets Ratio
1996 -0.43 0.38 1.64 -7.51 2.03
1997 0.47 0.55 1.56 -2.28 0.79
1998 0.71 0.81 1.50 -1.55 0.64
1999 0.43 0.51 1.28 -3.63 0.88
2000 0.54 0.58 1.38 -1.81 0.57
2001 0.38 0.43 1.33 -1.49 0.57
2002 0.73 0.73 1.34 0.06 0.34
2003 1.01 1.01 1.76 0.03 0.38
2004 1.22 1.22 1.73 0.06 0.36
2005 0.85 0.91 1.59 -0.45 0.42
2006 0.77 0.76 1.32 0.16 0.33
2007 0.84 0.80 1.35 0.42 0.22
2008 0.86 0.88 1.43 0.24 0.28
2009 0.89 0.87 1.48 0.30 0.29

17
Contd. Year ending March Average Median Maximum Minimum Stdev
Loan Maturity (Term Loans to Total Loans)
1996 26.89 25.55 44.59 11.86 8.98
1997 29.62 27.49 57.27 13.87 10.72
1998 32.23 30.13 75.52 14.68 12.71
1999 33.88 34.76 61.43 17.78 10.28
2000 35.02 34.54 64.29 18.79 10.19
2001 35.16 34.55 54.83 22.63 8.18
2002 35.67 37.01 45.01 23.38 5.95
2003 39.20 40.05 47.30 27.38 5.43
2004 45.24 45.03 57.39 31.97 6.40
2005 49.75 50.34 61.80 38.16 6.46
2006 52.50 53.90 62.97 37.74 6.97
2007 55.65 59.03 72.44 39.01 7.59
2008 55.65 56.29 71.87 38.73 8.83
2009 54.95 55.56 72.88 40.65 9.32
Collateral Indicator ( Unsecured Loans to Total Loans)
1996 6.95 4.94 27.23 1.22 5.91
1997 7.09 5.55 28.14 1.01 6.05
1998 7.65 6.72 25.04 0.82 6.08
1999 7.60 6.29 27.97 1.25 6.27
2000 8.16 6.23 36.86 0.59 7.50
2001 10.19 8.67 24.60 2.68 5.80
2002 11.89 10.52 33.05 3.71 6.21
2003 11.38 10.73 24.84 3.00 5.19
2004 12.83 12.46 34.04 3.15 6.31
2005 15.24 15.08 25.39 4.86 5.82
2006 17.17 17.53 26.84 7.09 5.13
2007 17.17 17.67 28.79 6.85 5.70
2008 19.38 20.75 28.32 8.58 5.74
2009 18.19 19.71 29.20 6.96 5.90
Contd.

18
Year ending March Average Median Maximum Minimum Stdev
Operating Efficiency (Operating Expenditure/Assets)
1996 3.04 3.05 3.73 2.14 0.41
1997 2.92 2.94 3.56 2.19 0.35
1998 2.76 2.75 3.43 2.04 0.38
1999 2.72 2.67 3.58 1.81 0.43
2000 2.59 2.56 3.42 1.74 0.37
2001 2.78 2.79 3.81 1.73 0.44
2002 2.40 2.40 3.33 1.63 0.42
2003 2.34 2.28 3.27 1.72 0.42
2004 2.24 2.14 4.00 1.57 0.49
2005 2.19 2.09 3.63 1.47 0.46
2006 2.08 2.08 2.76 1.48 0.31
2007 1.78 1.73 2.38 1.35 0.27
2008 1.55 1.55 1.99 1.19 0.22
2009 1.47 1.53 1.70 1.14 0.18
Spread (Return on advances and investments less return on deposits)
1996 4.94 5.11 7.48 1.13 1.17
1997 4.98 5.05 5.97 2.72 0.81
1998 4.65 4.82 5.75 1.50 0.80
1999 4.39 4.43 5.75 2.35 0.77
2000 3.99 3.95 5.32 2.51 0.62
2001 4.05 4.01 5.75 2.56 0.71
2002 3.57 3.60 4.54 2.50 0.54
2003 3.40 3.25 4.33 2.54 0.47
2004 3.46 3.52 4.22 2.58 0.47
2005 3.50 3.46 4.55 2.35 0.45
2006 3.27 3.31 4.18 2.53 0.42
2007 2.93 2.87 4.40 2.14 0.49
2008 2.32 2.38 3.17 1.16 0.49
2009 2.32 2.32 3.38 1.46 0.40

19
Annex 2: Definition of the Variables 1. Gross NPA Ratio: Gross NPA to Gross Advances Ratio
2. Loan Interest rate for a bank is defined as actual interest income to loans ratio (RL,j). In
order to account for competitive pricing effect on credit risk, the cross-section loan interest rate is benchmarked to industry average in terms of a spread variable: (RL,j-1/n∑j RL,j)
3. Cost Condition: Interest cost on deposits and operating expenses to asset ratio
4. Other income: non-interest income (fees and commissions etc) to asset ratio to account for financial innovation.
5. Bank size is defined as the asset of a bank as ratio to industry wide aggregate asset.
6. Collateral: the ratio of unsecured loans to total loans.
7. Maturity of loan portfolio : the ratio of a bank‟s term loans to its total loans
8. CRAR: the capital to risk weighted asset ratio. In order to reflect on the capital buffer approach, each banks CRAR is benchmarked to the regulatory requirement i.e., 9 per cent in the India.
9. Credit orientation: credit-deposit ratio of bank as compared with industry average.
10. Business Cycle: Actual GDP (in logarithm scale) less its trend component (using Hodrick-
Prescott trend)
11. Expected Growth : One period lag of GDP growth rate
12. Unexpected GDP Growth: Actual GDP growth less expected GDP growth (the variation GDP growth rate)

20
Annex 3: Estimated Equations
Dependent Variable: Gross NPA Ratio Variable Coefficient Std. Error t-Statistic Prob. C 8.590818 2.719720 3.158714 0.0018
Interest on loans 0.318377 0.114563 2.779050 0.0058
Cost 0.384232 0.101435 3.787962 0.0002
Credit orientation 0.117971 0.016390 7.197576 0.0000
Other Income -0.757433 0.225154 -3.364066 0.0009
Bank Size 0.035649 0.006841 5.211106 0.0000
Lag Dependent 0.765200 0.027623 27.70204 0.0000
Business Cycle -0.116898 0.062033 -1.884455 0.0605
Policy rate 0.567774 0.079296 7.160189 0.0000
Collateral 0.034227 0.017156 1.995060 0.0470
Maturity -0.048915 0.017052 -2.868520 0.0044 R-squared 0.967452 Mean dependent var 12.94944
Adjusted R-squared 0.963369 S.D. dependent var 9.576993
S.E. of regression 1.724587 Sum squared resid 853.5952
F-statistic 236.9646 Durbin-Watson stat 1.829217
Prob(F-statistic) 0.000000 Redundant Fixed Effects Tests: F Statistic (Significance): 2.09 (0.002) . The F statistic
has degrees of freedom (26,285).
Dependent Variable: Gross NPAs
Variable Coefficient Std. Error t-Statistic Prob. C 9.039986 2.649374 3.412122 0.0007
Interest on loans 0.261298 0.109959 2.376318 0.0181
Cost 0.478968 0.103408 4.631828 0.0000
Credit orientation 0.123436 0.015956 7.735793 0.0000
Other income -0.790640 0.205939 -3.839204 0.0002
Bank size 0.035811 0.006734 5.317480 0.0000
Lag dependent 0.759637 0.026963 28.17377 0.0000
Policy rate 0.439878 0.054910 8.010830 0.0000
Collateral 0.039342 0.016879 2.330820 0.0205
Loan maturity -0.056286 0.016317 -3.449492 0.0006
D(Growth rate) 0.079929 0.029353 2.723054 0.0069
Regression Statistics R-squared 0.968917 Mean dependent var 13.17993
Adjusted R-squared 0.965018 S.D. dependent var 9.925581
S.E. of regression 1.728871 Sum squared resid 857.8416
F-statistic 248.5096 Durbin-Watson stat 1.744991
Prob(F-statistic) 0.000000 Redundant Fixed Effects Tests: F Statistic (Significance): 2.28 (0.00)

21
Dependent Variable: Gross NPA Ratio Variable Coefficient Std. Error t-Statistic Prob. C 10.33676 2.602577 3.971740 0.0001
Loan interest rate 0.294778 0.108491 2.717083 0.0070
Cost condition 0.339017 0.100042 3.388737 0.0008
Credit orientation 0.126728 0.015832 8.004379 0.0000
Other income -0.863133 0.197735 -4.365097 0.0000
Bank size 0.034792 0.006588 5.281404 0.0000
Lagged dependent 0.761471 0.026460 28.77820 0.0000
Policy rate 0.528473 0.057062 9.261313 0.0000
Collateral 0.040872 0.016455 2.483869 0.0136
Loan Maturity -0.047457 0.016288 -2.913639 0.0039
Expected GDP growth -0.188934 0.047021 -4.018088 0.0001 Weighted Statistics R-squared 0.970031 Mean dependent var 13.27579
Adjusted R-squared 0.966272 S.D. dependent var 10.09919
S.E. of regression 1.713348 Sum squared resid 842.5057
F-statistic 258.0443 Durbin-Watson stat 1.751997
Prob(F-statistic) 0.000000 Redundant Fixed Effects Tests: F Statistic (Significance): 2.47(0.00)
Dependent Variable: Gross NPAs ratio Variable Coefficient Std. Error t-Statistic Prob. C 9.325787 2.765992 3.371589 0.0008
Loan interest rate 0.285677 0.116714 2.447674 0.0150
Cost condition 0.449245 0.126440 3.553020 0.0004
Credit orientation 0.120260 0.016365 7.348401 0.0000
Other Income -0.634115 0.214549 -2.955568 0.0034
Size 0.036805 0.006953 5.293795 0.0000
Lag Dependent 0.762444 0.027809 27.41741 0.0000
Policy rate 0.436004 0.066055 6.600614 0.0000
Collateral 0.037522 0.017219 2.179043 0.0301
Loan maturity -0.058740 0.016814 -3.493597 0.0006
GDP Growth rate 0.030682 0.058692 0.522758 0.6015 Weighted Statistics R-squared 0.967722 Mean dependent var 13.08012
Adjusted R-squared 0.963673 S.D. dependent var 9.844455
S.E. of regression 1.740508 Sum squared resid 869.4286
F-statistic 239.0136 Durbin-Watson stat 1.778621
Prob(F-statistic) 0.000000 Redundant Fixed Effects Tests: F Statistic (significance: 2.17(0.001)
22
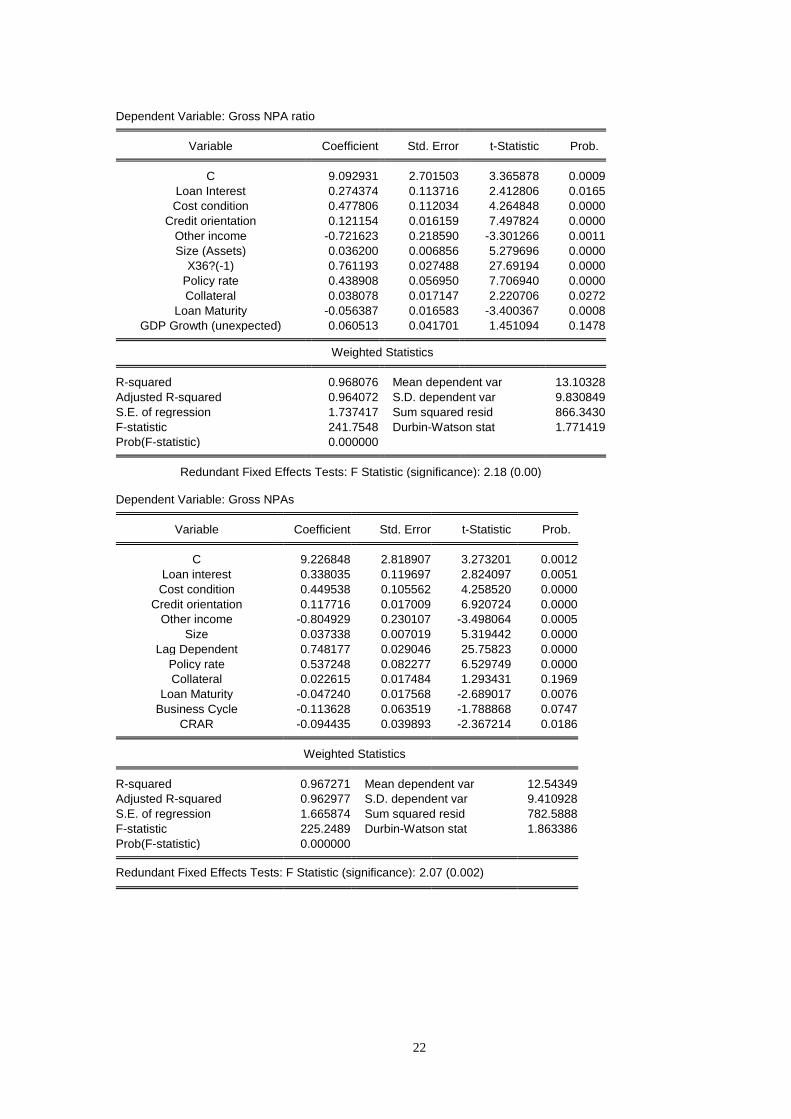
Dependent Variable: Gross NPA ratio Variable Coefficient Std. Error t-Statistic Prob. C 9.092931 2.701503 3.365878 0.0009
Loan Interest 0.274374 0.113716 2.412806 0.0165
Cost condition 0.477806 0.112034 4.264848 0.0000
Credit orientation 0.121154 0.016159 7.497824 0.0000
Other income -0.721623 0.218590 -3.301266 0.0011
Size (Assets) 0.036200 0.006856 5.279696 0.0000
X36?(-1) 0.761193 0.027488 27.69194 0.0000
Policy rate 0.438908 0.056950 7.706940 0.0000
Collateral 0.038078 0.017147 2.220706 0.0272
Loan Maturity -0.056387 0.016583 -3.400367 0.0008
GDP Growth (unexpected) 0.060513 0.041701 1.451094 0.1478 Weighted Statistics R-squared 0.968076 Mean dependent var 13.10328
Adjusted R-squared 0.964072 S.D. dependent var 9.830849
S.E. of regression 1.737417 Sum squared resid 866.3430
F-statistic 241.7548 Durbin-Watson stat 1.771419
Prob(F-statistic) 0.000000 Redundant Fixed Effects Tests: F Statistic (significance): 2.18 (0.00)
Dependent Variable: Gross NPAs
Variable Coefficient Std. Error t-Statistic Prob. C 9.226848 2.818907 3.273201 0.0012
Loan interest 0.338035 0.119697 2.824097 0.0051
Cost condition 0.449538 0.105562 4.258520 0.0000
Credit orientation 0.117716 0.017009 6.920724 0.0000
Other income -0.804929 0.230107 -3.498064 0.0005
Size 0.037338 0.007019 5.319442 0.0000
Lag Dependent 0.748177 0.029046 25.75823 0.0000
Policy rate 0.537248 0.082277 6.529749 0.0000
Collateral 0.022615 0.017484 1.293431 0.1969
Loan Maturity -0.047240 0.017568 -2.689017 0.0076
Business Cycle -0.113628 0.063519 -1.788868 0.0747
CRAR -0.094435 0.039893 -2.367214 0.0186 Weighted Statistics R-squared 0.967271 Mean dependent var 12.54349
Adjusted R-squared 0.962977 S.D. dependent var 9.410928
S.E. of regression 1.665874 Sum squared resid 782.5888
F-statistic 225.2489 Durbin-Watson stat 1.863386
Prob(F-statistic) 0.000000 Redundant Fixed Effects Tests: F Statistic (significance): 2.07 (0.002)

23
Dependent Variable: Gross NPA Ratio Variable Coefficient Std. Error t-Statistic Prob. C 9.602098 2.801448 3.427549 0.0007
Loan interest 0.293927 0.120282 2.443655 0.0152
Cost condition 0.563679 0.118025 4.775943 0.0000
Credit orientation 0.119750 0.016867 7.099856 0.0000
Other income -0.789818 0.225992 -3.494899 0.0006
Size 0.037996 0.007038 5.398496 0.0000
Lag dependent 0.742748 0.029138 25.49109 0.0000
Policy rate 0.407048 0.058397 6.970341 0.0000
Collateral 0.024873 0.017657 1.408665 0.1600
Maturity -0.052157 0.017189 -3.034427 0.0026
CRAR (lag) -0.106295 0.039664 -2.679863 0.0078
GDP Growth (unexpected) 0.064888 0.043242 1.500575 0.1346 Weighted Statistics R-squared 0.967505 Mean dependent var 12.63016
Adjusted R-squared 0.963242 S.D. dependent var 9.497641
S.E. of regression 1.674340 Sum squared resid 790.5629
F-statistic 226.9280 Durbin-Watson stat 1.809092
Prob(F-statistic) 0.000000
Redundant Fixed Effects Tests: F Statistic (significance): 2.07 (0.002)