Privatization of Motorways and Bridges Information Brief
61
Privatization of Privatization of Mo Mo Informa Informa REPUBLIC REPUBLIC PRIME M PRIME M PRIVATIZATION A PRIVATIZATION A July July otorways otorways and Bridges and Bridges ation Brief ation Brief OF TURKEY OF TURKEY MINISTRY MINISTRY ADMINISTRATION ADMINISTRATION y 2010 y 2010
Transcript of Privatization of Motorways and Bridges Information Brief

Privatization of Privatization of Motorways Motorways Information BriefInformation Brief
REPUBLIC OF TURKEYREPUBLIC OF TURKEYPRIME MINISTRYPRIME MINISTRY
PRIVATIZATION ADMINISTRATIONPRIVATIZATION ADMINISTRATION
July 2010July 2010
Motorways Motorways and Bridgesand BridgesInformation BriefInformation Brief
REPUBLIC OF TURKEYREPUBLIC OF TURKEYPRIME MINISTRYPRIME MINISTRY
PRIVATIZATION ADMINISTRATIONPRIVATIZATION ADMINISTRATION
July 2010July 2010
Ø All the information in this document has been compiledneither its correctness, nor its appropriateness has beenTurkey (“TSKB”), nor the Privatization AdministrationHighways (“KGM”), nor any other institution or organizationwarranties concerning the information contained in thisinformation.
DISCLAIMER
information.
Ø Under no condition can this document be interpretedAll the persons and institutions that have accessed and
Ø This document contains preliminary information aboutand will be subject to updates with more detailed information
compiled from sources which are accessible by the public andbeen confirmed. Neither Industrial Development Bank of
Administration of Turkey (“PA”), nor the General Directorate oforganization makes any representations, nor gives any
this document and also, cannot be held liable for any such
1
interpreted as an offer, call for an offer, or a pre-contract document.and used this document will be doing so at their own risk.
about the privatization of motorways and bridges in Turkey,information.

§ Privatization of Motorways and Bridges: Scope ………………………………………………………………………
§ Bridges ……………………………………………………………………………………………………………………
§ Motorways …………………………………………………………………………………………………………………
§ Service Facilities …………………………………………………………………………………………………………
TABLE OF CONTENTS
§ Service Facilities …………………………………………………………………………………………………………
……………………………………………………………………….2
……………………………………………………………………………………………………………………...13
…………………………………………………………………………………………………………………24
…………………………………………………………………………………………………………..51
2
…………………………………………………………………………………………………………..51
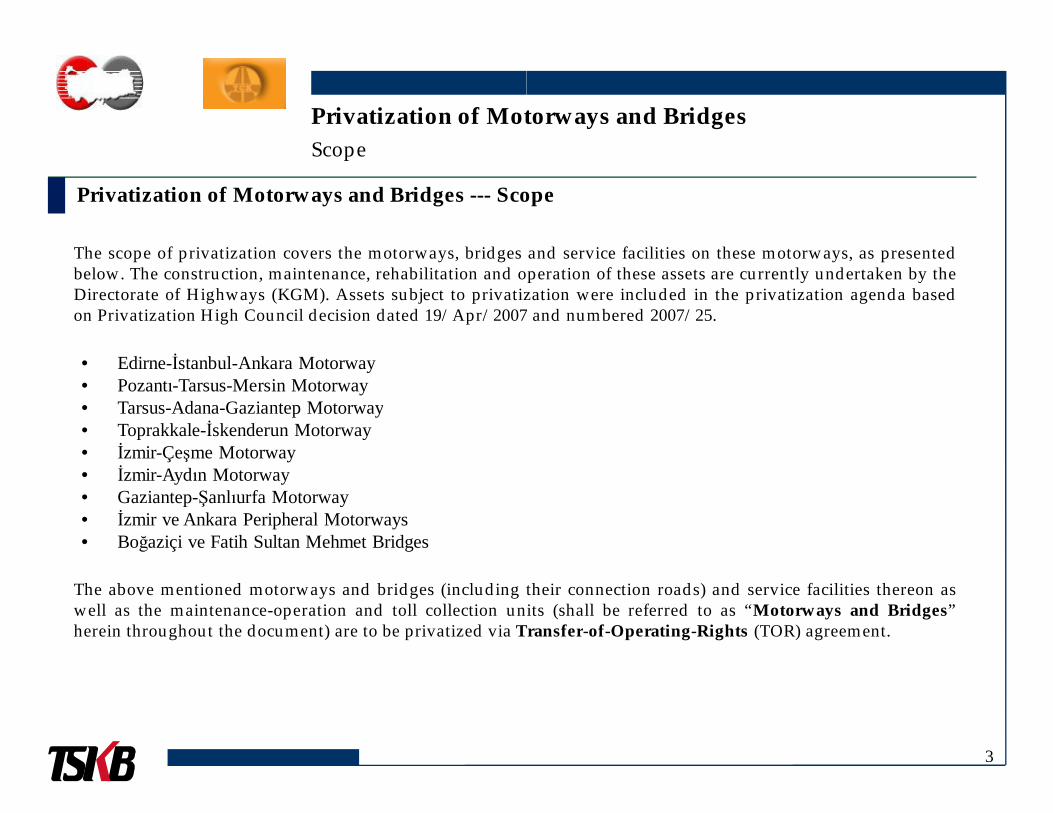
The scope of privatization covers the motorways, bridgesbelow. The construction, maintenance, rehabilitation and operationDirectorate of Highways (KGM). Assets subject to privatizationon Privatization High Council decision dated 19/Apr/2007
Privatization of Motorways
Privatization of Motorways and Bridges --- Scope
Scope
• Edirne-İstanbul-Ankara Motorway• Pozantı-Tarsus-Mersin Motorway• Tarsus-Adana-Gaziantep Motorway• Tarsus-Adana-Gaziantep Motorway• Toprakkale-İskenderun Motorway• İzmir-Çeşme Motorway• İzmir-Aydın Motorway• Gaziantep-Şanlıurfa Motorway• İzmir ve Ankara Peripheral Motorways• Boğaziçi ve Fatih Sultan Mehmet Bridges
The above mentioned motorways and bridges (including theirwell as the maintenance-operation and toll collection unitsherein throughout the document) are to be privatized via Transfer
and service facilities on these motorways, as presentedoperation of these assets are currently undertaken by the
privatization were included in the privatization agenda based2007 and numbered 2007/25.
Motorways and Bridges
Scope
3
their connection roads) and service facilities thereon asunits (shall be referred to as “Motorways and Bridges”
Transfer-of-Operating-Rights (TOR) agreement.

Privatization of Motorways Motorway Network in Turkey
Motorway Network in Turkey
XXFatih Sultan Mehmet
BridgeBoğaziçi Bridge
Motorways and BridgesMotorway Network in Turkey
4
IN OPERATION

Motorways and Bridges Subject to Privatization
Motorways and Bridges Opening Date
EDIRNE – İSTANBUL – ANKARA MOTORWAY
O-3 Edirne – İstanbul Motorway 1987-1997
O-4 İstanbul – Ankara Motorway 1990-2007
O-20 Ankara Peripheral Motorway 1993-1998
Privatization of Motorways Assets Subject to Privatization
O-20 Ankara Peripheral Motorway 1993-1998
FATİH SULTAN MEHMET BRIDGE AND PERIPHERAL MOTORWAY
O-20 İstanbul – Fatih Sultan Mehmet Bridge –Anatolia Motorway 1988
BOĞAZİÇİBRIDGE
O-1 Boğaziçi Bridge (K-9, Barbaros – K12 AltunizadeJunctions) 1973
İZMİR – ÇEŞME MOTORWAY
O-32 İzmir – Urla – Çeşme Motorway 1993-1996
İZMİR – AYDIN MOTORWAY
O-31 İzmir – Aydın Motorway 1996-2004
O-30 İzmir Peripheral Motorway 1993-2006
Note: (1) Length figures are given as Motorway Length + Connection Road Length
Motorways and Bridges Subject to Privatization --- Detailed Overview ( 1 / 2 )
Opening Constr.
Cost(US$
million)
Length (km) (1)
Number of
Lanes
Number of
Tunnels
Number of
Viaducts
2.000 232 +47 2x3; 2x2 - 20
4.000 403 +42 2x3; 2x2 6 36
888 110 +4 2x4; 2x3 - 1
Motorways and BridgesAssets Subject to Privatization
5
888 110 +4 2x4; 2x3 - 1
FATİH SULTAN MEHMET BRIDGE AND PERIPHERAL MOTORWAY
391,5 35 + 0 2x4; 2x3 1 7
44,5 6 + 0 2x3; 2x3 - 3
607 79+12 2x3; 2x2 - 2
1.391 96+17 2x3 1 3
460 52+8 2x3 2 5
as Motorway Length + Connection Road Length

Motorways and Bridges Subject to Privatization
Motorways and Bridges (2) Opening Date
POZANTI – TARSUS – MERSİN MOTORWAY
O-21 Pozantı – Tarsus
O-51 Tarsus – Mersin
TARSUS – ADANA – GAZİANTEP MOTORWAY
Privatization of Motorways Assets Subject to Privatization
1981 -2006
TARSUS – ADANA – GAZİANTEP MOTORWAY
O-51, O-52 Tarsus – Adana – Toprakkale – Gaziantep
TOPRAKKALE – İSKENDERUN MOTORWAY
O-53 Toprakkale – İskenderun
GAZİANTEP – ŞANLIURFA MOTORWAY
O-52 Gaziantep - Şanlıurfa
Notes: (1) Length figures are given as Motorway Length + Connection Road Length(2) Technical details regarding motorways presented on this page are provided under motorway sections in the following pages.
Motorways and Bridges Subject to Privatization --- Detailed Overview ( 2 / 2 )
Opening Constr.
Cost(US$
million)
Length (km) (1)
Number of
Lanes
Number of
Tunnels
Number of
Viaducts
Motorways and BridgesAssets Subject to Privatization
6
5.750 696+1722x2; 2x3; 2x4
7 29
as Motorway Length + Connection Road LengthTechnical details regarding motorways presented on this page are provided under Pozantı-Adana-Mersin and Adana-İskenderun- Şanlıurfa

Motorways and Bridges Subject to Privatization
Privatization of Motorways Assets Subject to Privatization
Ø Highly significant geopolitical location, situated acrossincreasing trade relations with surrounding countries;
Ø Positive outlook in macroeconomic conjuncture; therefore,
Ø Large geographical area and associated need for new motorways
Ø Constantly increasing traffic averages (Annual 8% increaseØ Constantly increasing traffic averages (Annual 8% increasevs. nearly 0% in EU);
Ø 95% share of highways in passenger and goods transportation90% in USA);
Ø Increasing traffic on Motorways and Bridges (Over 314
Ø High potential for an increase in the number of vehicles
Ø A high-return investment opportunity, leading to verticaleconomy;
Ø Turkey’s candidacy and expected accession to EU.
Motorways and Bridges Subject to Privatization --- Attractiveness for Investors
Motorways and BridgesAssets Subject to Privatization
across continents; important industrial and trade hub owing to
therefore, an ideal country for investments;
motorways at international standards;
increase in vehicle/km on highways & 15% on motorways
7
increase in vehicle/km on highways & 15% on motorways
transportation (vs. approx. 80% in EU countries and approx.
314 million vehicles in 2009);
vehicles per capita (compared to developed countries);
vertical integration with multiple sectors in a fast developing

Motorways and Bridges Subject to Privatization
Privatization of Motorways Assets Subject to Privatization
Number of Vehicles (million)
Gross Income(1)
(million TL)Gross Income(million US$)
2007 2008 2009 2007 2008 2009 2007 2008 2009
Edirne-İstanbul Motorway 50.7 51.5 52.8 105.9 102.2 101.3 81.5 79.0 65.5
İstanbul-Ankara Motorway 66.2 69.5 71.6 191.0 194.4 194.0 146.9 150.3 125.4
Notes: (1) Motorway Gross Income figures include 18% VAT, Bridge Income figures include 18% VAT and 10% municipality share. (2) Motorway Net Income figues exclude 18% VAT and 10% municipality share. (3) Expenses of İzmir Peripheral Motorway amounting to 5.8 million TL (4.5 million US$)
TL (2.4 million US$) in 2009 are included into the İzmir - Aydın Motorway expense
FSM Bridge and Peripheral Motorway 81.0 78.8 78.4 155.3 122.8 114.6 119.4 95.0 74.1
Boğaziçi Bridge 66.3 67.2 65.7 98.5 87.7 84.9 75.8 67.8 54.9
İzmir-Çeşme Motorway 7.3 7.8 8.9 11.4 11.6 12.8 8.8 9.0 8.3
İzmir-Aydın Motorway 11.2 12.1 11.7 23.1 23.4 23.0 17.8 18.1 14.8
Pozantı-Adana-Mersin Motorway 9.3 10.0 11.0 23.6 23.5 25.2 18.1 18.2 16.3
Adana-İskenderun-Şanlıurfa Motorway 11.0 12.9 14.2 32.6 37.8 48.2 25.1 29.3 31.1
TOPLAM 303.1 309.8 314.2 641.5 603.4 603.9 493.3 466.7 390.4
Motorways and Bridges Subject to Privatization – 2007, 2008 and 2009 Summary Figures
Motorways and BridgesAssets Subject to Privatization
Gross Income(million US$)
Net Income(2)
(million TL)Net Income
(million US$)Expenses(3)
(million TL)Expenses
(million US$)
2009 2007 2008 2009 2007 2008 2009 2007 2008 2009 2007 2008 2009
65.5 89.8 86.6 85.9 69.0 67.0 55.5 27.6 33.2 31.5 21.2 25.7 20.4
125.4 161.9 164.7 164.4 124.5 127.4 106.3 69.7 70.9 82.1 53.6 54.9 53.1
8
figures include 18% VAT, Bridge Income figures include 18% VAT and 10% municipality share. 18% VAT and 10% municipality share.
5 million US$) in 2007, 3.5 million TL (2.7 million US$) in 2008 and 3.8 million expenses.
74.1 118.4 93.7 87.4 91.1 72.5 56.5 17.2 18.9 27.1 13.2 14.6 17.5
54.9 75.2 66.9 64.7 57.8 51.7 41.8 6.1 3.1 3.2 4.7 2.4 2.0
8.3 9.6 9.8 10.9 7.4 7.6 7.0 7.7 8.3 8.7 5.9 6.4 5.7
14.8 19.6 19.8 19.5 15.1 15.3 12.6 20.6 17.7 21.4 15.8 13.7 13.8
16.3 20.0 19.9 21.3 15.4 15.4 13.8 10.7 13.4 15.2 8.2 10.4 9.9
31.1 27.6 32.1 40.8 21.3 24.8 26.4 18.1 20.9 26.7 13.9 16.2 17.2
390.4 522.1 493.5 494.9 401.5 381.7 319.9 177.7 186.5 215.9 136.6 144.2 139.5
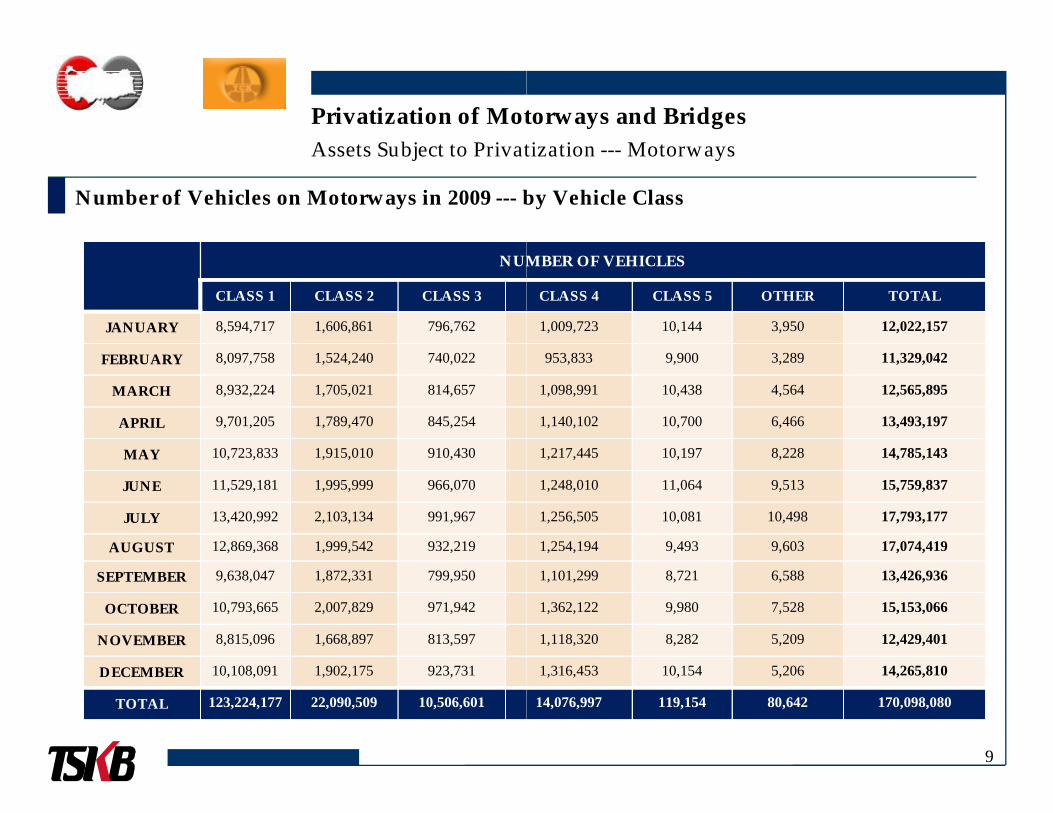
Number of Vehicles on Motorways in 2009 --- by Vehicle Class
NUMBER OF VEHICLES
CLASS 1 CLASS 2 CLASS 3
JANUARY 8,594,717 1,606,861 796,762
FEBRUARY 8,097,758 1,524,240 740,022
MARCH 8,932,224 1,705,021 814,657
Privatization of Motorways Assets Subject to Privatization
APRIL 9,701,205 1,789,470 845,254
MAY 10,723,833 1,915,010 910,430
JUNE 11,529,181 1,995,999 966,070
JULY 13,420,992 2,103,134 991,967
AUGUST 12,869,368 1,999,542 932,219
SEPTEMBER 9,638,047 1,872,331 799,950
OCTOBER 10,793,665 2,007,829 971,942
NOVEMBER 8,815,096 1,668,897 813,597
DECEMBER 10,108,091 1,902,175 923,731
TOTAL 123,224,177 22,090,509 10,506,601
by Vehicle Class
NUMBER OF VEHICLES
CLASS 4 CLASS 5 OTHER TOTAL
1,009,723 10,144 3,950 12,022,157
953,833 9,900 3,289 11,329,042
1,098,991 10,438 4,564 12,565,895
Motorways and BridgesAssets Subject to Privatization --- Motorways
9
1,140,102 10,700 6,466 13,493,197
1,217,445 10,197 8,228 14,785,143
1,248,010 11,064 9,513 15,759,837
1,256,505 10,081 10,498 17,793,177
1,254,194 9,493 9,603 17,074,419
1,101,299 8,721 6,588 13,426,936
1,362,122 9,980 7,528 15,153,066
1,118,320 8,282 5,209 12,429,401
1,316,453 10,154 5,206 14,265,810
14,076,997 119,154 80,642 170,098,080

GROSS INCOME
CLASS 1 CLASS 2 CLASS 3
JANUARY 14,999,358 2,957,093 3,464,741
FEBRUARY 14,324,396 2,817,399 3,215,289
MARCH 16,025,114 3,209,192 3,601,181
Privatization of Motorways Assets Subject to Privatization
Income Breakdown for Vehicles on Motorways in
APRIL 17,899,456 3,375,624 3,766,149
MAY 19,951,081 3,684,461 4,114,090
JUNE 22,017,701 3,855,443 4,431,363
JULY 27,419,706 4,132,075 4,455,622
AUGUST 26,024,724 3,935,725 4,130,773
SEPTEMBER 17,982,549 3,580,532 3,528,229
OCTOBER 20,125,315 3,854,827 4,378,411
NOVEMBER 15,582,236 3,142,755 3,688,953
DECEMBER 18,163,617 3,560,274 4,122,412
TOTAL 230,515,253 42,105,400 46,897,213
Not: (1) Includes 18% VAT.
GROSS INCOME (TL) (1)
CLASS 4 CLASS 5 OTHER TOTAL
5,964,526 70,662 5,116 27,461,496
5,710,468 69,012 4,355 26,140,919
6,669,129 75,514 6,017 29,586,147
Motorways and BridgesAssets Subject to Privatization --- Motorways
Income Breakdown for Vehicles on Motorways in 2009 --- by Vehicle Class
10
6,917,280 78,095 9,114 32,045,718
7,382,884 72,617 11,780 35,216,913
7,318,444 74,002 13,523 37,710,476
7,538,107 71,800 14,920 43,632,230
7,387,071 70,428 14,037 41,562,758
6,475,408 61,733 9,376 31,637,827
8,111,545 71,398 10,400 36,551,896
6,658,002 60,473 6,970 29,139,389
7,830,855 74,843 6,784 33,758,785
83,963,719 850,577 112,392 404,444,554

NUMBER OF VEHICLES
CLASS 1 CLASS 2 CLASS 3
JANUARY 10,265,272 996,476 203,934
FEBRUARY 9,529,372 930,632 190,746
MARCH 10,573,096 1,052,898 213,670
Privatization of Motorways Assets Subject to Privatization
Number of Vehicles on Bridges in 2009 --- by Vehicle Class
APRIL 10,686,742 1,072,830 220,796
MAY 11,182,192 1,114,326 229,758
JUNE 10,776,368 1,131,234 238,060
JULY 10,491,540 1,112,616 244,974
AUGUST 10,500,218 1,084,816 234,176
SEPTEMBER 9,694,112 1,070,464 223,454
OCTOBER 11,131,110 1,134,348 241,438
NOVEMBER 9,756,944 1,025,850 214,518
DECEMBER 11,049,546 1,110,512 228,028
TOTAL 125,636,512 12,837,002 2,683,552
NUMBER OF VEHICLES
CLASS 4 CLASS 5 OTHER TOTAL
139,566 1,536 33,786 11,640,570
138,210 1,478 32,282 10,822,720
178,840 1,456 40,314 12,060,274
Motorways and BridgesAssets Subject to Privatization --- Bridges
by Vehicle Class
11
193,492 1,742 50,890 12,226,492
201,374 1,618 61,420 12,790,688
205,574 1,640 69,246 12,422,122
207,862 1,668 69,790 12,128,450
201,572 1,382 66,334 12,088,498
208,232 1,548 53,794 11,251,604
228,090 1,444 57,362 12,793,792
197,586 1,256 40,052 11,236,206
223,744 1,414 42,080 12,655,324
2,324,142 18,182 617,350 144,116,740
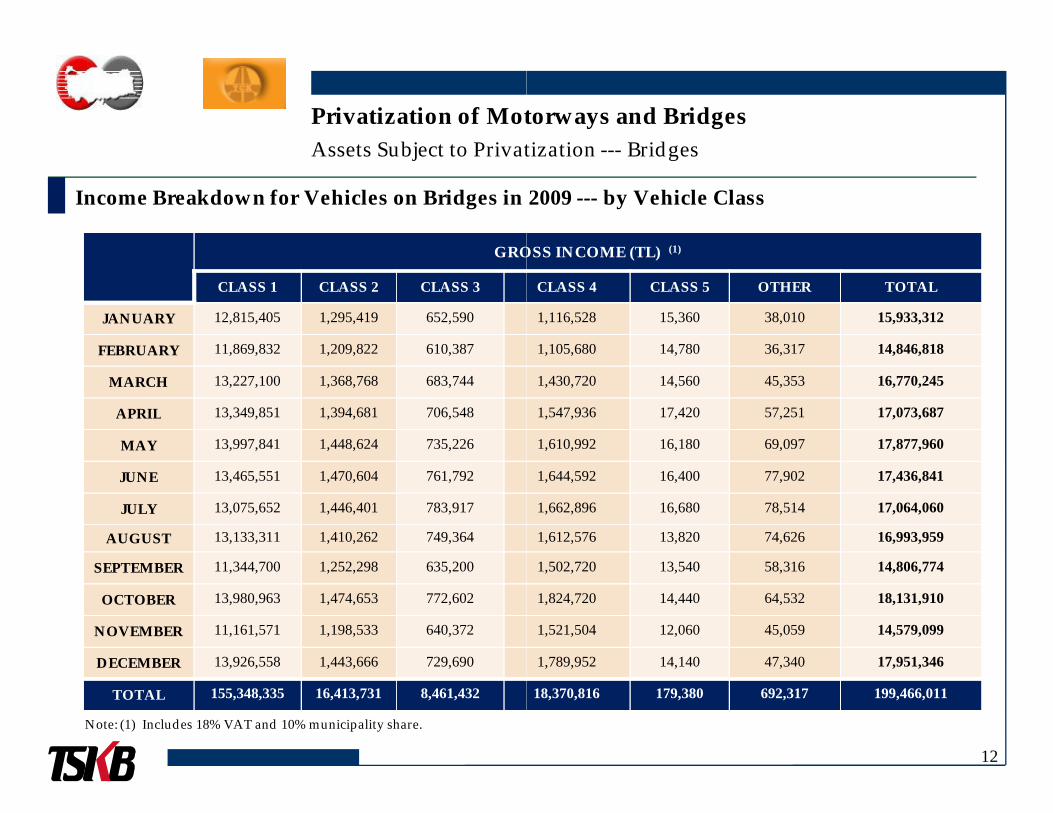
GROSS INCOME
CLASS 1 CLASS 2 CLASS 3
JANUARY 12,815,405 1,295,419 652,590
FEBRUARY 11,869,832 1,209,822 610,387
MARCH 13,227,100 1,368,768 683,744
APRIL 13,349,851 1,394,681 706,548
Privatization of Motorways Assets Subject to Privatization
Income Breakdown for Vehicles on Bridges in
APRIL 13,349,851 1,394,681 706,548
MAY 13,997,841 1,448,624 735,226
JUNE 13,465,551 1,470,604 761,792
JULY 13,075,652 1,446,401 783,917
AUGUST 13,133,311 1,410,262 749,364
SEPTEMBER 11,344,700 1,252,298 635,200
OCTOBER 13,980,963 1,474,653 772,602
NOVEMBER 11,161,571 1,198,533 640,372
DECEMBER 13,926,558 1,443,666 729,690
TOTAL 155,348,335 16,413,731 8,461,432
Note: (1) Includes 18% VAT and 10% municipality share.
GROSS INCOME (TL) (1)
CLASS 4 CLASS 5 OTHER TOTAL
1,116,528 15,360 38,010 15,933,312
1,105,680 14,780 36,317 14,846,818
1,430,720 14,560 45,353 16,770,245
1,547,936 17,420 57,251 17,073,687
Motorways and BridgesAssets Subject to Privatization --- Bridges
Income Breakdown for Vehicles on Bridges in 2009 --- by Vehicle Class
12
1,547,936 17,420 57,251 17,073,687
1,610,992 16,180 69,097 17,877,960
1,644,592 16,400 77,902 17,436,841
1,662,896 16,680 78,514 17,064,060
1,612,576 13,820 74,626 16,993,959
1,502,720 13,540 58,316 14,806,774
1,824,720 14,440 64,532 18,131,910
1,521,504 12,060 45,059 14,579,099
1,789,952 14,140 47,340 17,951,346
18,370,816 179,380 692,317 199,466,011

§ Privatization of Motorways and Bridges: Scope ………………………………………………………………………
§ Bridges ……………………………………………………………………………………………………………………
§ Motorways …………………………………………………………………………………………………………………
§ Service Facilities …………………………………………………………………………………………………………
TABLE OF CONTENTS
§ Service Facilities …………………………………………………………………………………………………………
……………………………………………………………………….2
……………………………………………………………………………………………………………………...13
…………………………………………………………………………………………………………………24
…………………………………………………………………………………………………………..51
13
…………………………………………………………………………………………………………..51

Assets Subject to Privatization
Boğaziçi Bridge (The Bosphorus Bridge)
Bridges
Ø Opening Date : 29 October 1973
Ø Length : 1,074 meters (main body)
Ø Height : 64 meters
Ø Type : Suspension Bridge
Ø Number of Lanes : 2x3 lanes
Ø Number of Toll Areas : 1
Ø Number of Toll Booths : 12
Ø Toll Collection Systems : 7 OGS Automated Payment Units
5 KGS Automated Payment Units
ØMaintenance-Ops Center: 1
Ø Construction Cost : USD 44.5 million (at 1973 prices
Assets Subject to Privatization
14
Automated Payment Units (Exit)
Automated Payment Units (Exit)
prices)

Number of Vehicles, Income and Expenses on
YEARNUMBER OF VEHICLES (1)
(million)
GROSS INCOME (2)
(TL million)
2000 67.3 33.1
2001 62.7 53.6
2002 64.5 52.2
Assets Subject to PrivatizationBridges
2003 65.8 65.8
2004 66.3 82.1
2005 64.9 86.0
2006 63.2 83.3
2007 66.3 98.5
2008 67.2 87.7
2009 65.7 84.9
Notes: (1) Vehicles have been taken for both ways.(2) Includes 18% VAT and 10% municipality share. Due to a court decision that decreased the toll rates in 2008realized below than that of previous year’s. (3) Expenses of year 2000 could not be provided due to not having the proper
Number of Vehicles, Income and Expenses on Boğaziçi Bridge, 2000-2009GROSS
INCOME(US$ million)
EXPENSES (3)
(TL million)EXPENSES
(US$ million)
53.0
43.8 1.7 1.4
34.7 1.9 1.3
Assets Subject to Privatization
15
44.1 2.7 1.8
57.7 3.2 2.3
64.2 6.9 5.1
58.4 6.7 4.7
75.8 6.1 4.7
67.5 3.1 2.4
54.9 3.2 2.0
(2) Includes 18% VAT and 10% municipality share. Due to a court decision that decreased the toll rates in 2008, the gross income in 2008 was
not having the proper separation of data among the motorway sections.

YEAR CLASS 1 CLASS 2 CLASS 3
2000 61,384,260 745,614 3,618,470
2001 58,585,800 1,330,414 1,965,118
2002 62,778,832 1,687,604 61,042
Assets Subject to PrivatizationBridges
Number of Vehicles on Boğaziçi Bridge, 2000 –
1,687,604 61,042
2003 63,337,320 2,200,212 223,902
2004 63,678,544 2,398,848 259,986
2005 61,966,412 2,692,298 280,396
2006 59,766,174 2,977,718 287,024
2007 62,375,702 3,340,376 219,250
2008 63,029,630 3,482,012 204,108
2009 61,555,824 3,265,238 151,066
Note: (1) Vehicles have been taken for both ways.
CLASS 4 CLASS 5 OTHER TOTAL (1)
275,412 255,172 972,380 67,251,308
134,428 205,776 470,200 62,691,736
764 264 --- 64,528,506
Assets Subject to Privatization
– 2009 --- by Vehicle Class
16
764 264
1,018 88 --- 65,762,540
788 28 --- 66,338,194
796 48 --- 64,939,950
714 52 139,594 63,171,276
804 92 377,522 66,313,746
1,770 144 474,238 67,191,902
303,744 228 461,412 65,737,512

Income from Boğaziçi Bridge, 2000 - 2009 --- by Toll Collection System
YEAR OGS Income(TL)
KGS Income(TL)
2000 3,917,694 ---
2001 10,603,517 ---
2002 12,112,085 ---
Assets Subject to PrivatizationBridges
2003 21,115,541 ---
2004 32,206,898 ---
2005 39,529,707 1,599,326
2006 61,208,405 13,110,432
2007 73,540,172 24,990,005
2008 61,979,556 25,682,864
2009 56,090,779 28,788,002
Note: (1) Includes 18% VAT and 10% municipality share.
by Toll Collection System
Income(TL)
Cash Income(TL) TOTAL (1)
--- 29,144,977 33,062,671
--- 43,012,983 53,616,500
--- 40,100,312 52,212,397
Assets Subject to Privatization
17
--- 44,701,588 65,826,129
--- 49,926,780 82,133,678
1,599,326 44,857,596 85,986,629
13,110,432 8,988,934 83,307,771
24,990,005 --- 98,530,177
25,682,864 --- 87,662,420
28,788,002 --- 84,878,781

Income from Boğaziçi Bridge, 2009 --- by Toll Collection System and Vehicle Class
VEHICLE CLASS
OGS KGS
INCOME(TL) (1) VEHICLES(2) INCOME
(TL) (1) VEHICLES
CLASS 1 50,184,906 40,444,810 27,014,327 21,111,014
Assets Subject to PrivatizationBridges
CLASS 1 50,184,906 40,444,810 27,014,327 21,111,014
CLASS 2 3,053,322 2,348,708 1,191,492 916,530
CLASS 3 440,327 137,602 43,086 13,464
CLASS 4 2,412,224 301,528 17,728 2,216
CLASS 5 0 0 2,280 228
OTHER 0 0 519,089 461,412
TOTAL 56,090,779 43,232,648 28,788,002 22,504,864
Notes: (1) Includes 18% VAT and 10% municipality share.(2) Vehicles have been taken for both ways.
by Toll Collection System and Vehicle Class
CASH TOTAL
VEHICLES(2) INCOME(TL) (1) VEHICLES(2) INCOME
(TL) (1) VEHICLES(2)
21,111,014 --- --- 77,199,233 61,555,824
Assets Subject to Privatization
18
21,111,014 --- --- 77,199,233 61,555,824
916,530 --- --- 4,244,814 3,265,238
13,464 --- --- 483,413 151,066
2,216 --- --- 2,429,952 303,744
228 --- --- 2,280 228
461,412 --- --- 519,089 461,412
22,504,864 --- --- 84,878,781 65,737,512
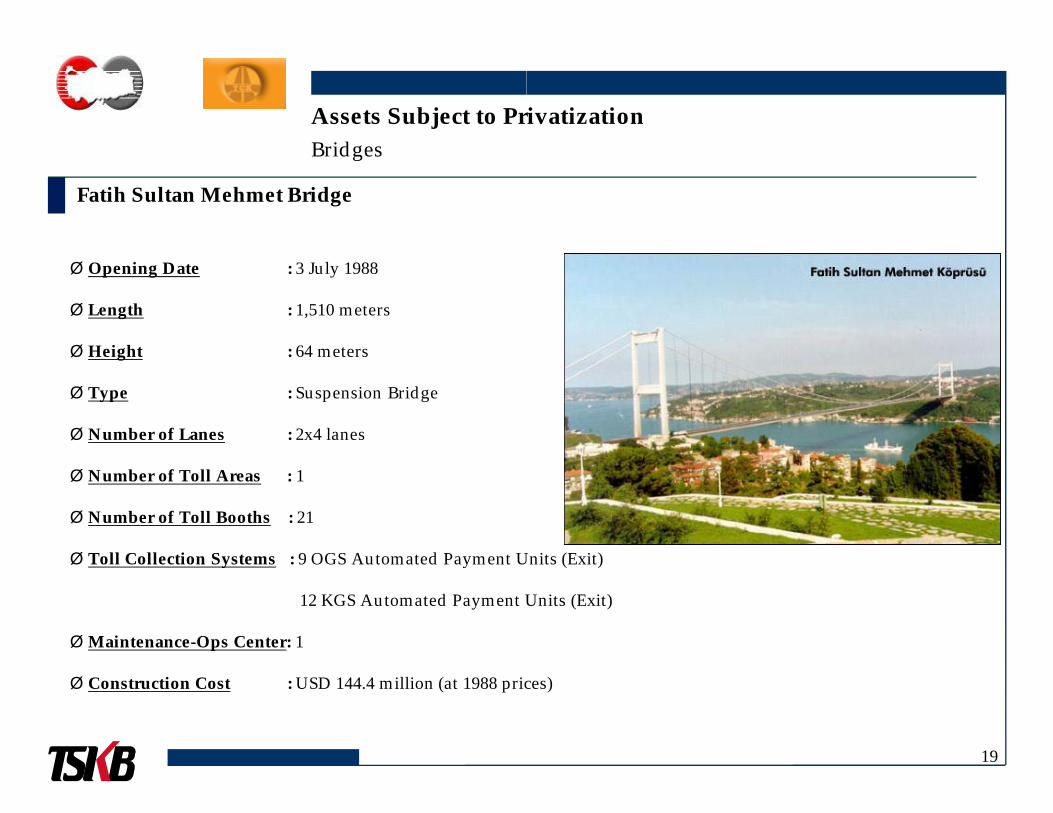
Fatih Sultan Mehmet Bridge
Ø Opening Date : 3 July 1988
Ø Length : 1,510 meters
Ø Height : 64 meters
Ø Type : Suspension Bridge
Assets Subject to PrivatizationBridges
Ø Number of Lanes : 2x4 lanes
Ø Number of Toll Areas : 1
Ø Number of Toll Booths : 21
Ø Toll Collection Systems : 9 OGS Automated Payment Units (Exit)
12 KGS Automated Payment Units (Exit)
ØMaintenance-Ops Center: 1
Ø Construction Cost : USD 144.4 million (at 1988 prices
Assets Subject to Privatization
19
Automated Payment Units (Exit)
Automated Payment Units (Exit)
prices)

YEARNUMBER OF VEHICLES (1)
(million)
GROSS INCOME (2)
(TL million)
2000 62.7 38.9
2001 57.2 55.9
2002 56.3 49.7
Assets Subject to PrivatizationBridges
Number of Vehicles, Income and Expenses on Fatih Sultan Mehmet Bridge,
2003 60.4 70.2
2004 67.6 98.5
2005 71.7 111.6
2006 76.2 129.4
2007 81.0 155.3
2008 78.8 122.8
2009 78.4 114.6
Notes: (1) Vehicles have been taken for both ways.(2) Includes 18% VAT and 10% municipality share. Due to a court decision that decreased the toll rates in 2008, the gross inrealized below than that of previous year’s. (3) Expenses of year 2000 could not be provided due to not having the proper
GROSS INCOME
(US$ million)
EXPENSES (3)
(TL million)EXPENSES
(US$ million)
62.4
45.6 6.9 5.6
33.0 8.8 5.9
Assets Subject to Privatization
Number of Vehicles, Income and Expenses on Fatih Sultan Mehmet Bridge, 2000-2009
20
47.0 10.5 7.0
69.2 14.2 10.0
83.3 20.0 15.0
90.7 17.2 12.1
119.4 17.2 13.2
95.0 18.9 14.6
74.1 27.1 17.5
(2) Includes 18% VAT and 10% municipality share. Due to a court decision that decreased the toll rates in 2008, the gross income in 2008 was
not having the proper separation of data among the motorway sections.

YEAR CLASS 1 CLASS 2 CLASS 3
2000 42,194,440 134,096 13,223,932
2001 42,355,540 2,390,636 7,891,738
2002 46,290,740 6,935,992 2,223,450
Assets Subject to PrivatizationBridges
Number of Vehicles on Fatih Sultan Mehmet Bridge, 2000
2003 49,603,648 7,428,308 2,284,372
2004 56,032,770 7,850,136 2,366,206
2005 60,007,148 7,850,498 2,329,236
2006 59,663,957 11,687,226 3,012,508
2007 67,216,728 9,033,092 2,662,924
2008 64,144,822 9,640,364 2,715,916
2009 64,080,688 9,571,764 2,532,486
Note: (1) Vehicles have been taken for both ways.
CLASS 4 CLASS 5 OTHER TOTAL (1)
245,026 1,255,082 5,652,224 62,704,800
409,696 1,580,628 2,549,978 57,178,216
891,848 4,016 --- 56,346,046
Assets Subject to Privatization
Bridge, 2000–2009 --- by Vehicle Class
21
---
1,097,098 4,666 --- 60,418,092
1,392,822 4,400 --- 67,646,334
1,532,428 10,604 --- 71,729,914
1,777,400 20,966 21,636 76,183,693
2,043,520 21,708 63,310 81,041,282
2,147,660 24,192 144,138 78,817,092
2,020,398 17,954 155,938 78,379,228

YEAR OGS Income(TL)
KGS Income(TL)
2000 3,462,932 ---
2001 8,909,760 ---
2002 9,452,580 ---
Assets Subject to PrivatizationBridges
Income from Fatih Sultan Mehmet Bridge, 2000
2003 20,108,211 ---
2004 33,133,639 ---
2005 42,064,459 4,606,872
2006 52,087,600 19,157,261
2007 59,750,112 32,739,888
2008 56,242,674 52,660,521
2009 52,825,543 61,761,687
Note: (1) Includes 18% VAT and 10% municipality share.
Income(TL)
Cash Income(TL) TOTAL (1)
--- 35,434,289 38,897,221
--- 46,990,651 55,900,411
--- 40,234,917 49,687,497
Assets Subject to Privatization
2000 - 2009 --- by Toll Collection System
22
--- 50,139,030 70,247,241
--- 65,372,445 98,506,084
4,606,872 64,940,759 111,612,090
19,157,261 58,116,780 129,361,641
32,739,888 62,793,993 155,283,993
52,660,521 13,939,783 122,842,978
61,761,687 --- 114,587,230

VEHICLE CLASS
OGS KGS
INCOME(TL) (1) VEHICLES(2) INCOME
(TL) (1) VEHICLES
CLASS 1 45,273,407 37,335,984 32,875,695 26,744,704
Assets Subject to PrivatizationBridges
Income from Fatih Sultan Mehmet Bridge, 2009 Class
CLASS 2 6,162,432 4,880,112 6,006,485 4,691,652
CLASS 3 1,372,520 440,196 6,605,499 2,092,290
CLASS 4 17,184 2,214 15,923,680 2,018,184
CLASS 5 0 0 177,100 17,954
OTHER 0 0 173,228 155,938
TOTAL 52,825,543 42,658,506 61,761,687 35,720,722
Notes: (1) Includes 18% VAT and 10% municipality share.(2) Vehicles have been taken for both ways .
CASH TOTAL
VEHICLES(2) INCOME(TL) (1) VEHICLES(2) INCOME
(TL) (1) VEHICLES(2)
26,744,704 --- --- 78,149,102 64,080,688
Assets Subject to Privatization
2009 --- by Toll Collection System and Vehicle
23
4,691,652 --- --- 12,168,917 9,571,764
2,092,290 --- --- 7,978,019 2,532,486
2,018,184 --- --- 15,940,864 2,020,398
17,954 --- --- 177,100 17,954
155,938 --- --- 173,228 155,938
35,720,722 --- --- 114,587,230 78,379,228

§ Privatization of Motorways and Bridges: Scope ………………………………………………………………………
§ Bridges ………………………………………………………………………………………………………………………
§ Motorways …………………………………………………………………………………………………………………
§ Service Facilities …………………………………………………………………………………………………………
TABLE OF CONTENTS
§ Service Facilities …………………………………………………………………………………………………………
………………………………………………………………………..2
………………………………………………………………………………………………………………………13
………………………………………………………………………………………………………………….24
…………………………………………………………………………………………………………...51
24
…………………………………………………………………………………………………………...51

Assets Subject to Privatization
Edirne – İstanbul – Ankara Motorway
Edirne – İstanbul – Ankara
Light Vehicles
Total Indicates Annual Average Daily Traffic
Heavy Vehicles
Assets Subject to PrivatizationAnkara Motorway
25

Assets Subject to Privatization
Edirne – Istanbul Motorway
Edirne – Istanbul – Ankara Assets Subject to Privatization
Ankara Motorway
26
Assets Subject to Privatization
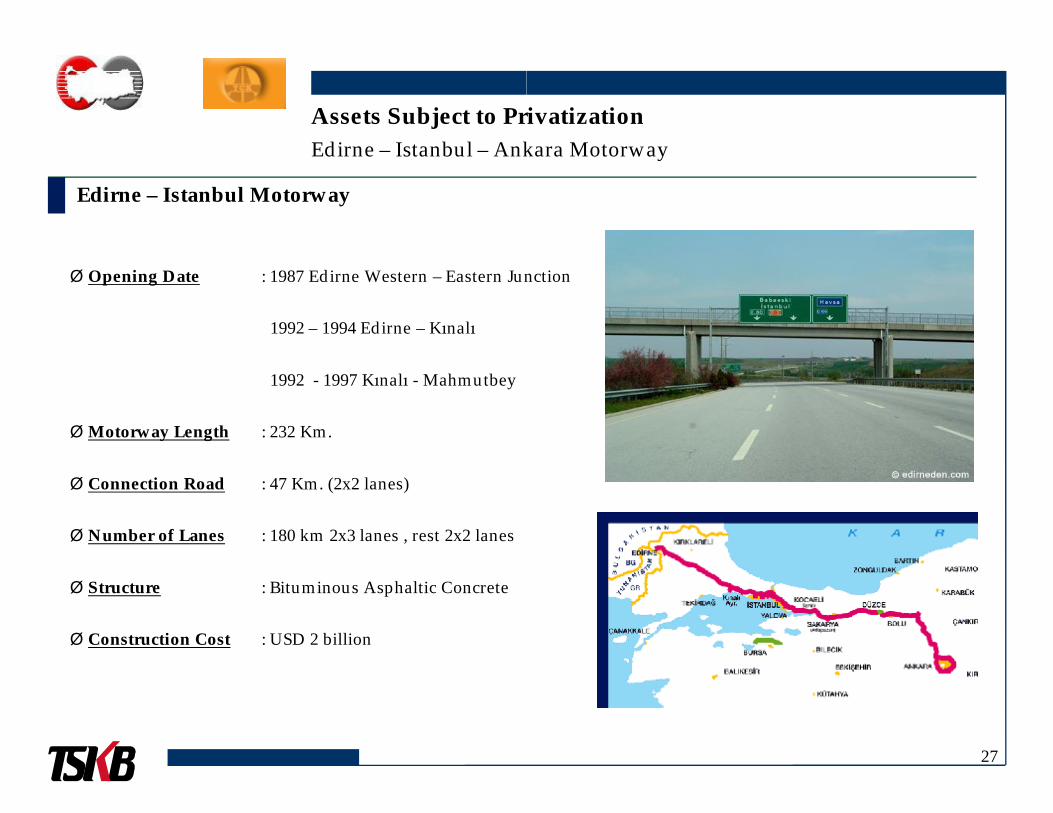
Edirne – Istanbul Motorway
Edirne – Istanbul – Ankara
Ø Opening Date : 1987 Edirne Western – Eastern Junction
1992 – 1994 Edirne – Kınalı
1992 - 1997 Kınalı - Mahmutbey
ØMotorway Length : 232 Km.
Ø Connection Road : 47 Km. (2x2 lanes)
Ø Number of Lanes : 180 km 2x3 lanes , rest 2x2 lanes
Ø Structure : Bituminous Asphaltic Concrete
Ø Construction Cost : USD 2 billion
Assets Subject to PrivatizationAnkara Motorway
Junction
27

Assets Subject to Privatization
Edirne – Istanbul Motorway
Edirne – Istanbul – Ankara
Ø Tunnels : N/A
Ø Viaducts : 20 Viaducts (10,461 meters)
Ø Number of Toll Areas : 16
Ø Number of Toll Booths : 199
Ø Parking Areas : 8
Ø Service Areas : 3
YEAR NUMBER OF INCOME INCOME
Ø
Ø
Ø
YEAR NUMBER OF VEHICLES (Million)
INCOME(TL Million)
INCOME(US$ Million
2000 25.1 18.8 30.1
2001 19.9 38.8 31.7
2002 23.3 36.8 24.5
2003 30.1 42.5 28.5
2004 37.0 62.9 44.2
2005 41.4 73.6 54.9
2006 46.2 87.5 61.3
2007 50.7 105.9 81.5
2008 51.5 102.2 79.0
2009 52.8 101.3 65.5
Notes: (1) Only the toll collectionphysically locatedexpenses of the Center
Assets Subject to PrivatizationAnkara Motorway
INCOME INCOME (US$) EXPENSES (1) EXPENSES
Ø Toll Collection Systems:53 OGS Automated Payment Units (26 Entry, 27 Exits)
60 KGS Automated Payment Units (29 Entry, 31 Exits)
86 Cash Payment Units (42 Entry, 44 Exits)
ØMaintenance-Ops Centers: 4 Centers
Ø Toll Collection Centers : 16 Centers
28
INCOMEMillion)
INCOME (US$) / VEHICLE
EXPENSES(TL Million)
EXPENSES(US$ Million)
30.1 1.20
31.7 1.59 8.1 6.6
24.5 1.05 10.9 7.3
28.5 0.94 16.1 10.8
44.2 1.19 18.7 13.1
54.9 1.33 22.1 16.5
61.3 1.33 28.2 19.8
81.5 1.61 27.6 21.2
79.0 1.53 33.2 25.7
65.5 1.24 31.5 20.4
collection expense of Kavacık Maintenance and Operations Center, which wasin Edirne – Istanbul Motorway, was included to this section’s expenses. Other
Center are assumed as belonging to the FSM Bridge and Peripheral Motorway.

Edirne – İstanbul Motorway --- Number of Vehicles and Income by Section,
EDİRNE
EDİRNE – KINALI SECTION
VEHICLES INCOME (
JANUARY 287,917 1,008,434
FEBRUARY 269,445 947,106
MARCH 313,608 1,110,167
Assets Subject to PrivatizationEdirne – Istanbul – Ankara
MARCH 313,608 1,110,167
APRIL 343,241 1,193,161
MAY 378,502 1,312,929
JUNE 393,900 1,349,059
JULY 424,595 1,440,606
AUGUST 470,731 1,705,590
SEPTEMBER 322,093 1,148,159
OCTOBER 381,947 1,358,419
NOVEMBER 288,756 1,028,782
DECEMBER 340,217 1,198,265
TOTAL 4,214,952 14,800,677
Number of Vehicles and Income by Section, 2009
EDİRNE – İSTANBUL MOTORWAY
SECTION KINALI – MAHMUTBEY SECTION
INCOME (TL) VEHICLES INCOME (TL)
1,008,434 3,480,288 6,089,113
947,106 3,268,751 5,750,999
1,110,167 3,650,711 6,479,045
Assets Subject to PrivatizationAnkara Motorway
29
1,110,167 3,650,711 6,479,045
1,193,161 3,901,254 6,953,472
1,312,929 4,264,504 7,607,272
1,349,059 4,532,673 8,137,023
1,440,606 4,867,627 8,958,134
1,705,590 4,624,276 8,315,069
1,148,159 3,609,313 6,445,641
1,358,419 4,483,688 7,932,644
1,028,782 3,567,148 6,303,026
1,198,265 4,304,241 7,547,651
14,800,677 48,554,474 86,519,089
Assets Subject to Privatization
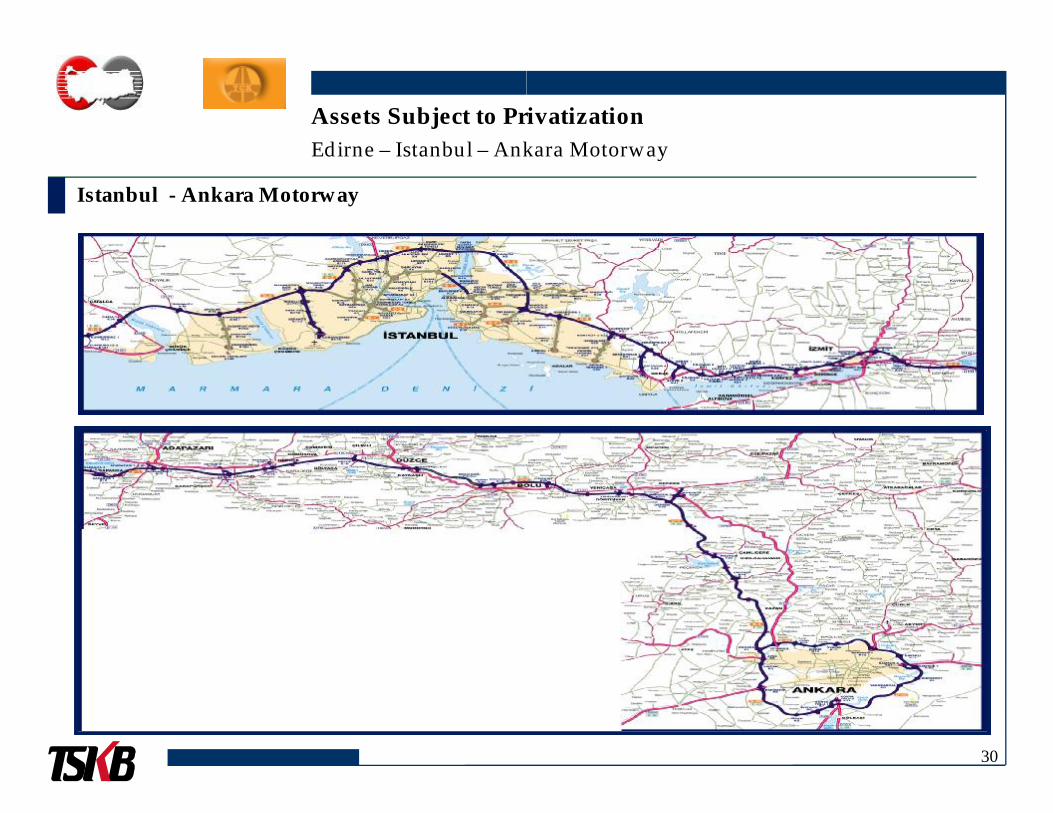
Istanbul - Ankara Motorway
Edirne – Istanbul – Ankara Assets Subject to Privatization
Ankara Motorway
30

Assets Subject to Privatization
İstanbul – Ankara Motorway
Edirne – Istanbul – Ankara
Ø Opening Date : 1990 – 1992 Çamlıca – Gebze
1990 – 1992 İzmit – Sakarya
1992 – 1994 Kazancı-Gerede-Ankara
2007 Bolu Mountain Passage
ØMotorway Length : 403 Km.
Ø Connection Road : 42 Km. (36 km. 2x2, 6 km. 1x1 lanes)
Ø Number of Lanes : 2x3 lanes
Ø Structure : Bituminous Asphaltic Concrete
Ø Construction Cost : USD 4 billion
Assets Subject to PrivatizationAnkara Motorway
Ankara
31
42 Km. (36 km. 2x2, 6 km. 1x1 lanes)

Assets Subject to Privatization
Istanbul – Ankara Motorway
Edirne – Istanbul – Ankara
Ø Tunnels : 6 Tunnels (Appr. 5,835 meters)
Ø Viaducts : 36 Viaducts (Appr. 13,760 meters
Ø Number of Toll Areas : 26
Ø Number of Toll Booths: 250
Ø Parking Areas : 14
Ø Service Areas : 9
YEAR NUMBER OF VEHICLES (Million)
INCOME(TL Million)
INCOME(US$ Million
2000 38.8 31.9 51.1
2001 32.0 63.4 51.8
2002 34.2 57.9 38.4
2003 38.9 61.7 41.3
2004 45.2 89.2 62.7
2005 50.0 104.0 77.6
2006 61.3 133.7 93.8
2007 66.2 191.0 146.9
2008 69.5 194.4 150.3
2009 71.6 194.0 125.4
Note: (1) Expenses of year 2000 could not be provided due to not having the proper
Assets Subject to PrivatizationAnkara Motorway
ers)
Ø Toll Collection Systems:123 OGS Automated Payment Units (57 Entry, 66 Exits)140 KGS Automated Payment Units (65 Entry, 75 Exits)12 Cash Payment Units (7 Entry, 5 Exits)
ØMaintenance-Ops Centers: 8 CentersØ Toll Collection Centers : 28 CentersØ Tunnel Operation Centers: 2 Center
32
INCOMEMillion)
INCOME (US$) /VEHICLE
EXPENSES (1)
(TL Million)EXPENSES
(US$ Million)
51.1 1.32
51.8 1.62 17.3 14.2
38.4 1.12 27.0 17.9
41.3 1.06 31.7 21.2
62.7 1.38 40.5 28.4
77.6 1.55 52.9 39.5
93.8 1.53 62.3 43.7
146.9 2.22 69.7 53.6
150.3 2.16 70.9 54.9
125.4 1.75 82.1 53.1
proper separation of data among the motorway sections.
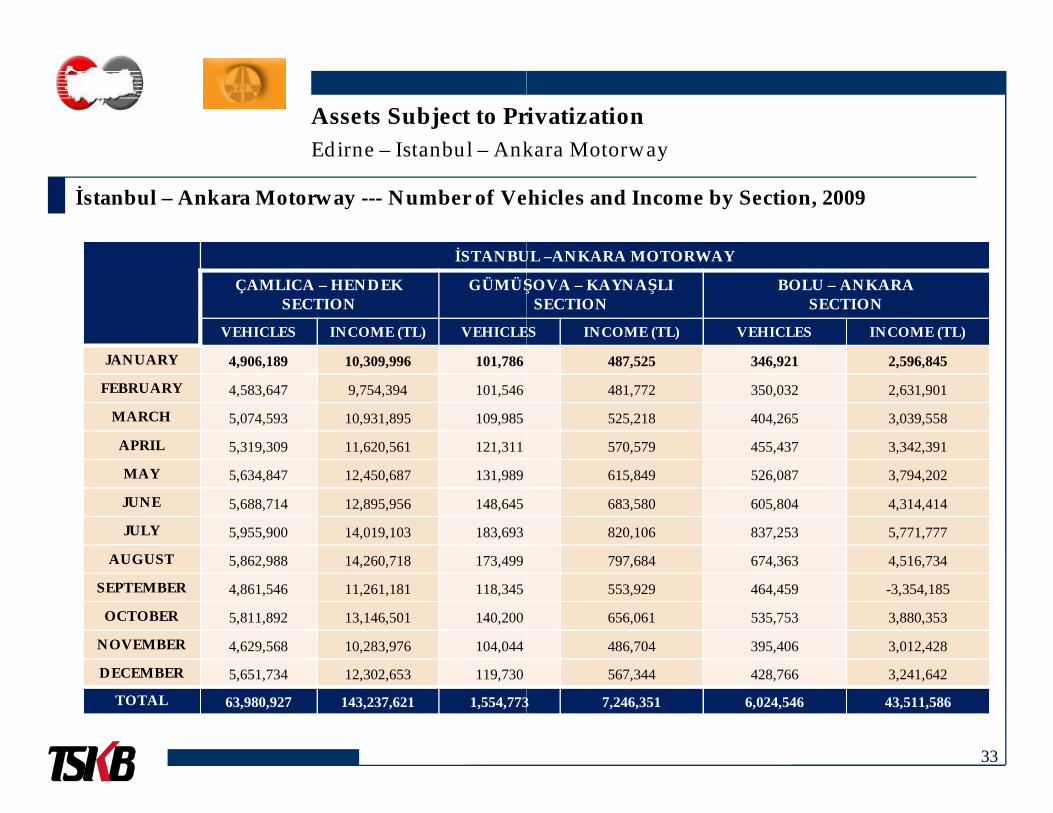
İstanbul – Ankara Motorway --- Number of Vehicles and Income by Section,
İSTANBUL
ÇAMLICA – HENDEK SECTION
GÜMÜŞOVA
VEHICLES INCOME (TL) VEHICLES
JANUARY 4,906,189 10,309,996 101,786
FEBRUARY 4,583,647 9,754,394 101,546
Assets Subject to PrivatizationEdirne – Istanbul – Ankara
MARCH 5,074,593 10,931,895 109,985
APRIL 5,319,309 11,620,561 121,311
MAY 5,634,847 12,450,687 131,989
JUNE 5,688,714 12,895,956 148,645
JULY 5,955,900 14,019,103 183,693
AUGUST 5,862,988 14,260,718 173,499
SEPTEMBER 4,861,546 11,261,181 118,345
OCTOBER 5,811,892 13,146,501 140,200
NOVEMBER 4,629,568 10,283,976 104,044
DECEMBER 5,651,734 12,302,653 119,730
TOTAL 63,980,927 143,237,621 1,554,773
Number of Vehicles and Income by Section, 2009
İSTANBUL –ANKARA MOTORWAY
GÜMÜŞOVA – KAYNAŞLI SECTION
BOLU – ANKARA SECTION
VEHICLES INCOME (TL) VEHICLES INCOME (TL)
487,525 346,921 2,596,845
481,772 350,032 2,631,901
Assets Subject to PrivatizationAnkara Motorway
33
525,218 404,265 3,039,558
570,579 455,437 3,342,391
615,849 526,087 3,794,202
683,580 605,804 4,314,414
820,106 837,253 5,771,777
797,684 674,363 4,516,734
553,929 464,459 -3,354,185
656,061 535,753 3,880,353
486,704 395,406 3,012,428
567,344 428,766 3,241,642
1,554,773 7,246,351 6,024,546 43,511,586

Assets Subject to Privatization
Ankara Peripheral Motorway
Edirne – Istanbul – Ankara
Ø Opening Date : Opened in 1993; construction work
was completed in 1998
ØMotorway Length : 110 Km.
Ø Connection Road : 4 Km. (2x2 lanes)
Ø Number of Lanes : 2x4 lanes (107 km), 2x3 lanes (3 km)
Ø Structure : Bituminous Asphaltic Concrete
Ø Construction Cost : USD 888 million
Ø Viaducts : 1 Viaduct (588 meters)
Assets Subject to PrivatizationAnkara Motorway
; construction work
34
lanes (3 km)

Istanbul – Fatih Sultan Mehmet Bridge – Anatolia Motorway
Istanbul – Fatih Sultan Mehmet
Ø Opening Date : 1988
ØMotorway Length : 35 Km.
Ø Number of Lanes : 34 km 2x4 lanes, rest 2x3 lanes,
Assets Subject to Privatization
Ø Structure : Bituminous Asphaltic Concrete
Ø Construction Cost : USD 391.5 million
Ø Number of Tunnels : 1 Tunnel (245 meters)
Ø Number of Viaducts : 7 Viaducts (Appr. 2,705 meters)
Anatolia Motorway
Fatih Sultan Mehmet Bridge - Anatolia MotorwayAssets Subject to Privatization
35

Assets Subject to Privatization
İzmir – Çeşme Motorway
İzmir – Çeşme Motorway
Light Vehicles
Total Indicates Annual Average Daily Traffic
Heavy Vehicles
Assets Subject to PrivatizationMotorway
36

Assets Subject to Privatization
İzmir – Çeşme Motorway
İzmir – Çeşme Motorway
Ø Opening Date : 1993 İzmir – Karaburun Junction
1993 – 1995 Karaburun – Zeytinler
1996 Alaçatı - Çeşme
Construction was completed in 1996
ØMotorway Length : 79 Km.
Ø Connection Road : 12 Km. (2x2 lanes)
Ø Number of Lanes : 2x2 lanes (11 km.), 2x3 lanes (68 km
Ø Structure : Bituminous Asphaltic Concrete
Ø Construction Cost : USD 607 million
Assets Subject to PrivatizationMotorway
Zeytinler Junction
37
1996
68 km.)

Assets Subject to Privatization
İzmir – Çeşme Motorway
İzmir – Çeşme Motorway
Ø Tunnels : N/A
Ø Viaducts : 2 Viaducts (1,230 meters)
Ø Number of Toll Areas : 7
Ø Number of Toll Booths: 75
Ø Parking Areas : 1
Ø Service Areas : 1
YEAR NUMBER OF INCOME INCOMEYEAR NUMBER OF VEHICLES (Million)
INCOME(TL Million)
INCOME(US$ Million
2000 3.7 2.2 3.5
2001 2.6 3.6 2.9
2002 4.2 3.7 2.5
2003 4.8 4.9 3.3
2004 5.3 6.7 4.7
2005 5.9 7.5 5.6
2006 6.5 9.3 6.6
2007 7.3 11.4 8.8
2008 7.8 11.6 9.0
2009 8.9 12.8 8.3
Note: (1) Expenses of year 2000 could not be provided due to not having the proper separation of data among the motorway sections.
Assets Subject to PrivatizationMotorway
INCOME INCOME (US$) EXPENSES (1) EXPENSES
Ø Toll Collection Systems:
19 OGS Automated Payment Units (8 Entry, 11 Exits)
29 KGS Automated Payment Units (13 Entry, 16 Exits)
27 Cash Payment Units (13 Entry, 14 Exits)
ØMaintenance – Ops Centers: 1 Center
Ø Toll Collection Centers : 7 Centers
38
INCOMEMillion)
INCOME (US$) / VEHICLE
EXPENSES (1)
(TL Million)EXPENSES
(US$ Million)
3.5 0.94
2.9 1.13 1.9 1.6
2.5 0.60 3.3 2.2
3.3 0.70 3.8 2.6
4.7 0.89 5.3 3.7
5.6 0.95 8.0 6.0
6.6 1.00 8.1 5.7
8.8 1.21 7.7 5.9
9.0 1.15 8.3 6.4
8.3 0.94 8.7 5.7
Expenses of year 2000 could not be provided due to not having the proper separation of data among the motorway sections.

İzmir – Çeşme Motorway --- Number of Vehicles and Income by Section,
VEHICLES
JANUARY 448,134FEBRUARY 417,766
MARCH 498,595APRIL 601,108
Assets Subject to Privatizationİzmir – Çeşme Motorway
APRIL 601,108MAY 781,735JUNE 968,743JULY 1,322,577
AUGUST 1,288,361SEPTEMBER 794,459
OCTOBER 633,509NOVEMBER 569,651DECEMBER 530,082
TOTAL 8,854,720
Number of Vehicles and Income by Section, 2009
İZMİR – ÇEŞME MOTORWAY
VEHICLES INCOME (TL)
448,134 642,432
417,766 602,136
498,595 716,214
601,108 871,650
Assets Subject to PrivatizationMotorway
39
601,108 871,650
781,735 1,142,187
968,743 1,331,077
1,322,577 1,970,832
1,288,361 1,914,204
794,459 1,167,155
633,509 903,943
569,651 823,225
530,082 742,514
8,854,720 12,827,569
Assets Subject to Privatization
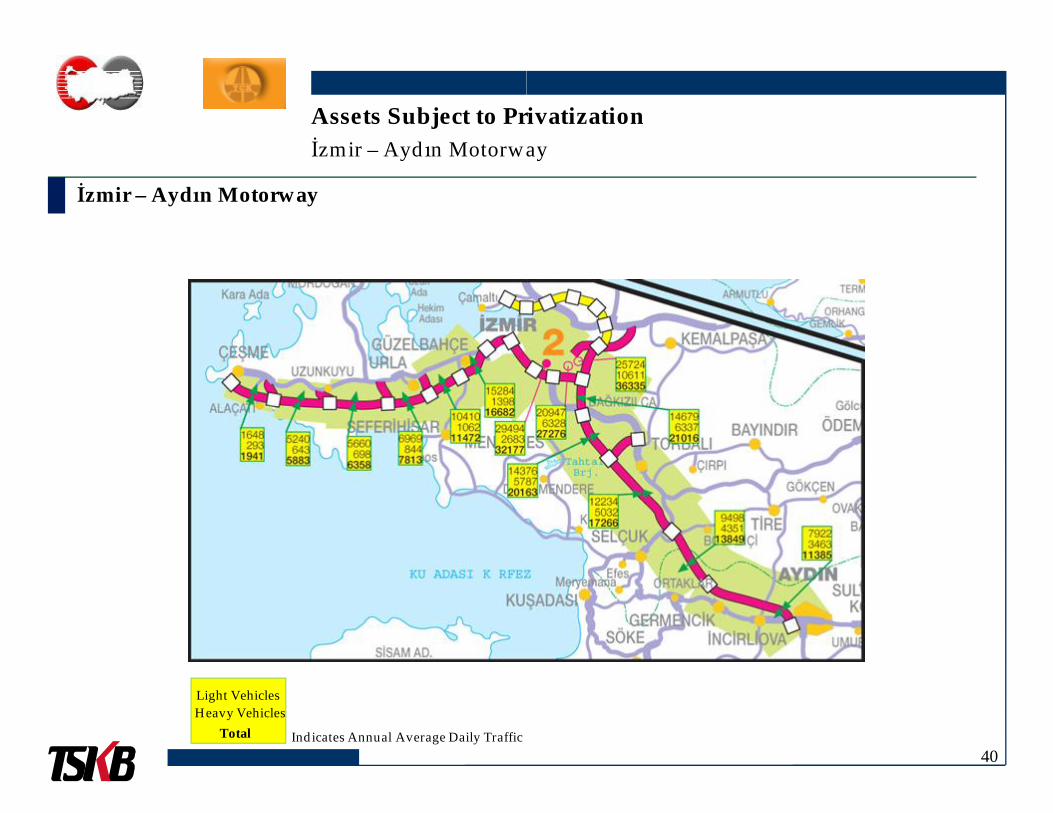
İzmir – Aydın Motorway
İzmir – Aydın Motorway
Light Vehicles
Total Indicates Annual Average Daily Traffic
Heavy Vehicles
Assets Subject to PrivatizationMotorway
40

Assets Subject to Privatization
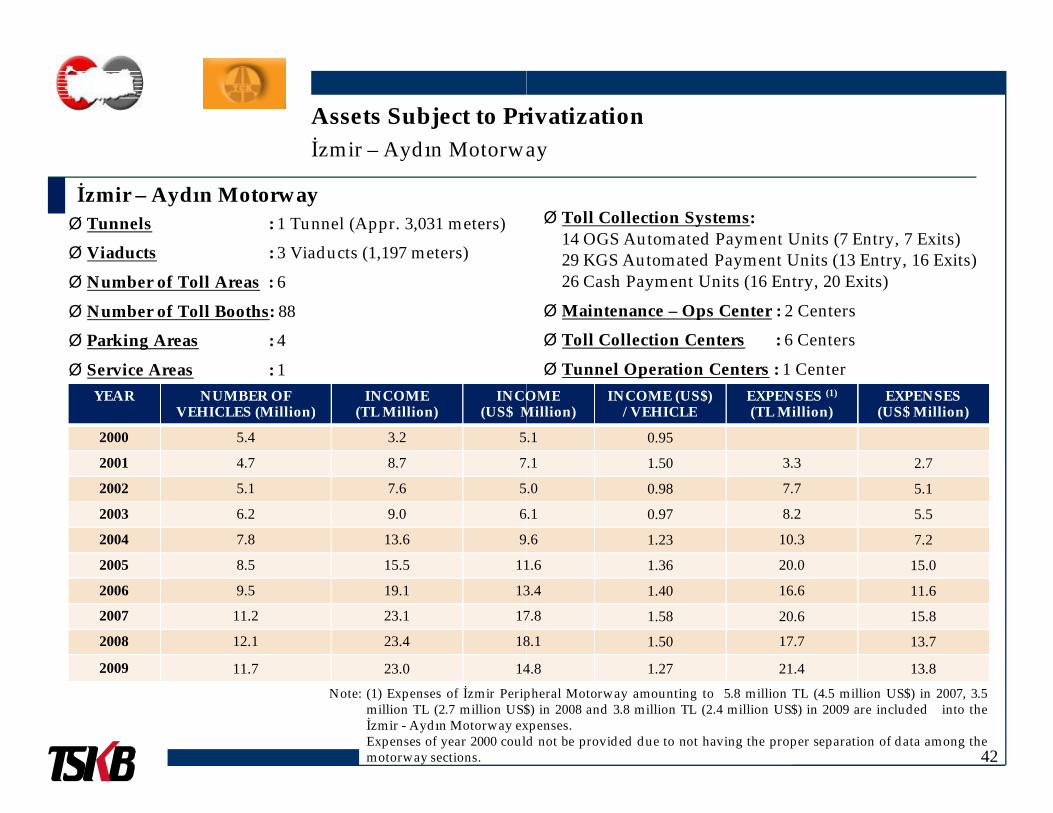
İzmir – Aydın Motorway
İzmir – Aydın Motorway
Ø Opening Date : 1996 Tahtalı Junction
1998 Belevi – Şevketiye
2003 – 2004 Germencik – Aydın
Construction was completed in 2004
ØMotorway Length : 97 Km.
Ø Connection Road : 17 Km. (2x2 lanes)
Ø Şerit Sayısı : 2x3 lanes
Ø Structure : Bituminous Asphaltic Concrete
Ø Construction Cost : USD 1.391 billion
Assets Subject to PrivatizationMotorway
41
2004
Assets Subject to Privatization
İzmir – Aydın Motorway
İzmir – Aydın Motorway
Ø Tunnels : 1 Tunnel (Appr. 3,031 meters)
Ø Viaducts : 3 Viaducts (1,197 meters)
Ø Number of Toll Areas : 6
Ø Number of Toll Booths: 88
Ø Parking Areas : 4
Ø Service Areas : 1YEAR NUMBER OF
VEHICLES (Million)INCOME
(TL Million)INCOME
(US$ MillionVEHICLES (Million) (TL Million) (US$ Million
2000 5.4 3.2 5.1
2001 4.7 8.7 7.1
2002 5.1 7.6 5.0
2003 6.2 9.0 6.1
2004 7.8 13.6 9.6
2005 8.5 15.5 11.6
2006 9.5 19.1 13.4
2007 11.2 23.1 17.8
2008 12.1 23.4 18.1
2009 11.7 23.0 14.8Note: (1) Expenses of İzmir Peripheral
million TL (2.7 million US$İzmir - Aydın Motorway expenseExpenses of year 2000 couldmotorway sections.
Assets Subject to PrivatizationMotorway
INCOMEMillion)
INCOME (US$) / VEHICLE
EXPENSES (1)
(TL Million)EXPENSES
(US$ Million)
Ø Toll Collection Systems:14 OGS Automated Payment Units (7 Entry, 7 Exits)29 KGS Automated Payment Units (13 Entry, 16 Exits)26 Cash Payment Units (16 Entry, 20 Exits)
ØMaintenance – Ops Center : 2 Centers
Ø Toll Collection Centers : 6 Centers
Ø Tunnel Operation Centers : 1 Center
42
Million) / VEHICLE (TL Million) (US$ Million)
5.1 0.95
7.1 1.50 3.3 2.7
5.0 0.98 7.7 5.1
6.1 0.97 8.2 5.5
9.6 1.23 10.3 7.2
11.6 1.36 20.0 15.0
13.4 1.40 16.6 11.6
17.8 1.58 20.6 15.8
18.1 1.50 17.7 13.7
14.8 1.27 21.4 13.8Peripheral Motorway amounting to 5.8 million TL (4.5 million US$) in 2007, 3.5
$) in 2008 and 3.8 million TL (2.4 million US$) in 2009 are included into theexpenses.
could not be provided due to not having the proper separation of data among the

İzmir – Aydın Motorway --- Number of Vehicles and Income by Section,
VEHICLES
JANUARY 754,859FEBRUARY 715,439
MARCH 779,870
APRIL 877,980
Assets Subject to Privatizationİzmir – Aydın Motorway
APRIL 877,980
MAY 988,034
JUNE 1,101,730
JULY 1,406,002
AUGUST 1,334,365
SEPTEMBER 1,055,921
OCTOBER 946,650NOVEMBER 900,495DECEMBER 849,877
TOTAL 11,711,222
Number of Vehicles and Income by Section, 2009
İZMİR – AYDIN MOTORWAY
VEHICLES INCOME (TL)
754,859 1,482,326715,439 1,409,249
779,870 1,537,917
877,980 1,738,423
Assets Subject to PrivatizationMotorway
43
877,980 1,738,423
988,034 1,941,029
1,101,730 2,153,369
1,406,002 2,717,650
1,334,365 2,570,929
1,055,921 2,075,317
946,650 1,874,445
900,495 1,784,810
849,877 1,680,236
11,711,222 22,965,700
Assets Subject to Privatization
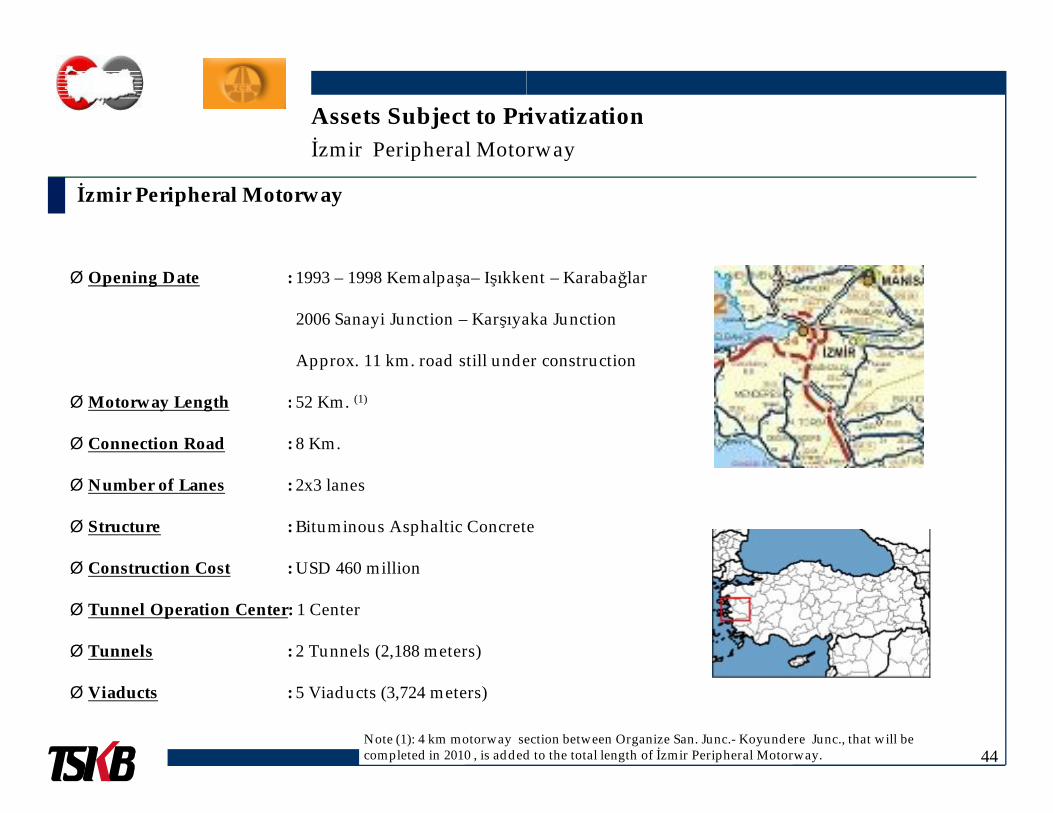
İzmir Peripheral Motorway
İzmir Peripheral Motorway
Ø Opening Date : 1993 – 1998 Kemalpaşa– Işıkkent
2006 Sanayi Junction – Karşıyaka
Approx. 11 km. road still under construction
ØMotorway Length : 52 Km. (1)ØMotorway Length : 52 Km.
Ø Connection Road : 8 Km.
Ø Number of Lanes : 2x3 lanes
Ø Structure : Bituminous Asphaltic Concrete
Ø Construction Cost : USD 460 million
Ø Tunnel Operation Center: 1 Center
Ø Tunnels : 2 Tunnels (2,188 meters)
Ø Viaducts : 5 Viaducts (3,724 meters)
Note (1): 4 km motorway section between Organize San. Junc.completed in 2010 , is added to the total length of İzmir Peripheral Motorway.
Assets Subject to PrivatizationPeripheral Motorway
Işıkkent – Karabağlar
Karşıyaka Junction
km. road still under construction
44
Bituminous Asphaltic Concrete
Note (1): 4 km motorway section between Organize San. Junc.- Koyundere Junc., that will be completed in 2010 , is added to the total length of İzmir Peripheral Motorway.

Assets Subject to Privatization
Pozantı – Adana – Mersin Motorway
Pozantı – Adana – Mersin
Light Vehicle
TotalHeavy Vehicle
Assets Subject to PrivatizationMersin Motorway
45
Light Vehicles
Total Indicates Annual Average Daily Traffic
Heavy Vehicles
Assets Subject to Privatization
Pozantı – Adana – Mersin Motorway
Pozantı – Adana – Mersin
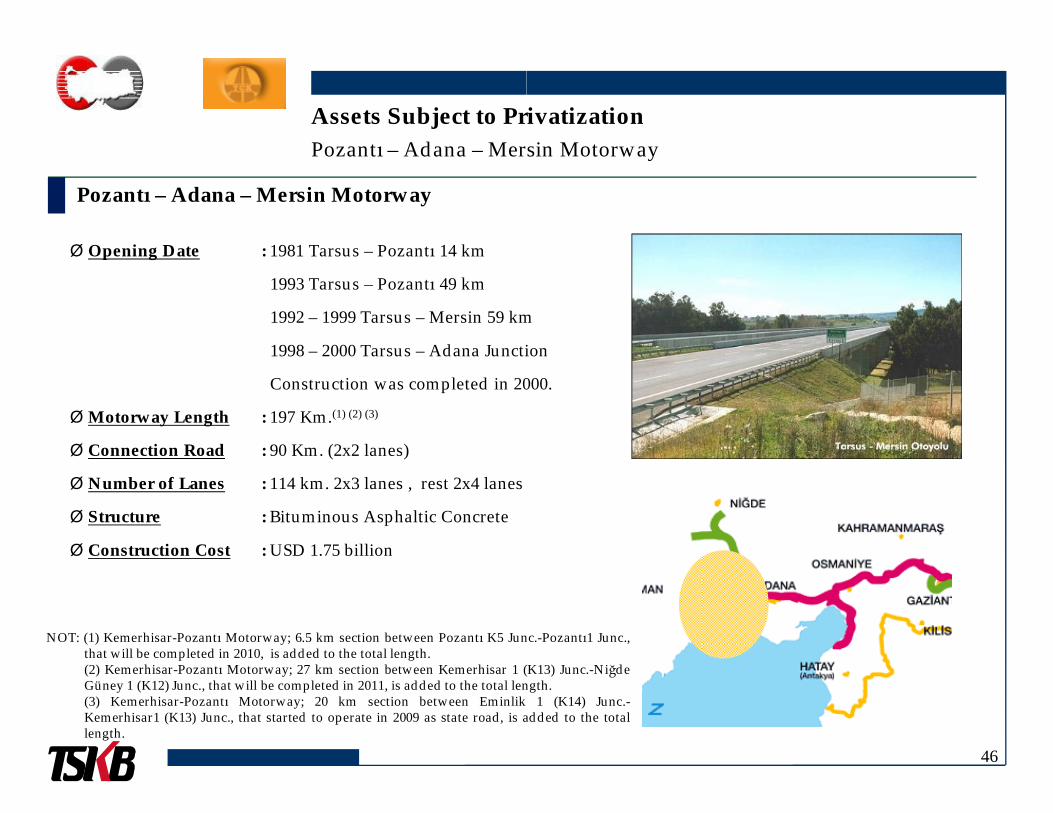
Ø Opening Date : 1981 Tarsus – Pozantı 14 km
1993 Tarsus – Pozantı 49 km
1992 – 1999 Tarsus – Mersin 59 km
1998 – 2000 Tarsus – Adana Junction
Construction was completed in 2000
ØMotorway Length : 197 Km.(1) (2) (3)
Ø Connection Road : 90 Km. (2x2 lanes)
Ø Number of Lanes : 114 km. 2x3 lanes , rest 2x4 lanes
Ø Structure : Bituminous Asphaltic Concrete
Ø Construction Cost : USD 1.75 billion
NOT: (1) Kemerhisar-Pozantı Motorway; 6.5 km section between Pozantı K5 Juncthat will be completed in 2010, is added to the total length.(2) Kemerhisar-Pozantı Motorway; 27 km section between Kemerhisar 1 (KGüney 1 (K12) Junc., that will be completed in 2011, is added to the total length(3) Kemerhisar-Pozantı Motorway; 20 km section between EminlikKemerhisar1 (K13) Junc., that started to operate in 2009 as state road, is addedlength.
Assets Subject to PrivatizationMersin Motorway
Mersin 59 km
Junction
2000.
46
lanes
Junc.-Pozantı1 Junc.,
(K13) Junc.-Niğdelength.
1 (K14) Junc.-added to the total

Assets Subject to Privatization
Pozantı – Adana – Mersin Motorway
Pozantı – Adana – Mersin
Ø Tunnels : 2 Tunnels (500 meters)
Ø Viaducts : 5 Viaducts (4,235 meters)
Ø Number of Toll Areas : 8
Ø Number of Toll Booths: 86
Ø Parking Areas : 6
Ø Service Areas : 4YEAR NUMBER OF INCOME INCOMEYEAR NUMBER OF
VEHICLES (Million)INCOME
(TL Million)INCOME
(US$ Million
2000 5.3 5.3 8.6
2001 4.4 11.7 9.6
2002 4.6 9.7 6.5
2003 5.3 10.3 6.9
2004 6.4 15.7 11.0
2005 6.0 15.5 11.6
2006 8.4 19.9 14.0
2007 9.3 23.6 18.1
2008 10.0 23.5 18.1
2009 11.0 25.2 16.3
Note: (1) Adana MaintenanceAdana–İskenderun–ŞanlıurfaCenter was distributed equallydue to not having the proper
Assets Subject to PrivatizationMersin Motorway
INCOME INCOME (US$) EXPENSES (1) EXPENSES
Ø Toll Collection Systems:16 OGS Automated Payment Units (8 Entry, 8 Exits)
35 KGS Automated Payment Units (16 Entry, 19 Exits)
35 Cash Payment Units (14 Entry, 21 Exits)
ØMaintenance-Ops Centers: 2 Centers
Ø Toll Collection Centers : 8 Centers
47
INCOMEMillion)
INCOME (US$) / VEHICLE
EXPENSES(TL Million)
EXPENSES(US$ Million)
8.6 1.61
9.6 2.18 3.0 2.4
6.5 1.39 5.9 3.9
6.9 1.29 4.8 3.2
11.0 1.71 6.5 4.6
11.6 1.93 9.4 7.0
14.0 1.67 11.1 7.8
18.1 1.95 10.7 8.2
18.1 1.82 13.4 10.4
16.3 1.48 15.2 9.9
Maintenance and Operations Center serves both Pozantı–Adana–Mersin Motorway andŞanlıurfa Motorway. Therefore, expenses of Adana Maintenance and Operations
equally to both Motorway sections. Expenses of year 2000 could not be providedproper separation of data among the motorway sections.

Assets Subject to Privatization
Adana – İskenderun – Şanlıurfa Motorway
Adana – İskenderun – Şanlıurfa
Light Vehicles
Total Indicates Annual Average Daily Traffic
Heavy Vehicles
Assets Subject to PrivatizationŞanlıurfa Motorway
48

Assets Subject to Privatization
Adana – İskenderun – Şanlıurfa Motorway
Adana – İskenderun – Şanlıurfa
Ø Opening Date : 1993 – 2000 Toprakkale - İskenderun
1993 – 1996 Toprakkale – Gaziantep
Western Junction
2001 Toprakkale – İskenderun Section4
2006 Birecik – Şanlıurfa (State Road
ØMotorway Length : 499 Km.(1)
Ø Connection Road : 82 Km. (2x2 lanes)
Ø Number of Lanes : 453 km. 2x3 lanes , rest 2x2 lanes
Ø Structure : Bituminous Asphaltic Concrete
Ø Construction Cost : USD 4 billion
Note: (1) Y Gaziantep-Ş.Urfa Motorway; 25 km section between Ş.Urfa North1 JunctionJunction , that will be completed in 2010, is added to the total length.
Assets Subject to PrivatizationŞanlıurfa Motorway
İskenderun
Gaziantep
Section4
49
State Road)1
Ş.Urfa Motorway; 25 km section between Ş.Urfa North1 Junction-University Junction , that will be completed in 2010, is added to the total length.

Assets Subject to Privatization
Adana – İskenderun – Şanlıurfa Motorway
Adana – İskenderun – Şanlıurfa
Ø Tunnels : 5 Tunnels (Appr. 4,838 meters)
Ø Viaducts : 24 Viaducts (Appr. 7,105 meters
Ø Number of Toll Areas : 21
Ø Number of Toll Booths: 184
Ø Parking Areas : 12
Ø Service Areas : 5YEAR NUMBER OF
VEHICLES (Million)INCOME
(TL Million)INCOME
(US$ MillionVEHICLES (Million) (TL Million) (US$ Million
2000 3.9 3.7 5.9
2001 3.9 8.5 6.9
2002 4.1 7.3 4.8
2003 5.8 10.0 6.7
2004 7.5 16.3 11.4
2005 8.9 20.9 15.6
2006 9.7 23.6 16.6
2007 11.0 32.6 25.1
2008 12.9 37.8 29.1
2009 14.2 48.2 31.1
Note: (1) Adana MaintenanceMotorway and Pozantı–AdanaOperations Center was distributedbe provided due to not having
Assets Subject to PrivatizationŞanlıurfa Motorway
rs)
INCOMEMillion)
INCOME (US$ ) / VEHICLE
EXPENSES (1)
(TL Million)EXPENSES
(US$ Million)
Ø Toll Collection Systems:42 OGS Automated Payment Units (21 Entry, 21 Exits)
72 KGS Automated Payment Units (34 Entry, 38 Exits)
70 Cash Payment Units (33 Entry, 37 Exits)
ØMaintenance – Ops Centers: 4 Centers
Ø Toll Collection Centers : 21 Centers
50
Million) / VEHICLE (TL Million) (US$ Million)
5.9 1.50
6.9 1.75 5.8 4.7
4.8 1.18 9.8 6.5
6.7 1.16 9.2 6.2
11.4 1.53 9.5 6.7
15.6 1.75 12.4 9.3
16.6 1.71 16.1 11.3
25.1 2.28 18.1 13.9
29.1 2.27 20.9 16.2
31.1 2.19 26.7 17.2
Maintenance and Operations Center serves both Adana–İskenderun–ŞanlıurfaAdana–Mersin Motorway. Therefore, expenses of Adana Maintenance and
distributed equally to both Motorway sections. Expenses of year 2000 could nothaving the proper separation of data among the motorway sections.

§ Privatization of Motorways and Bridges: Scope ………………………………………………………………………
§ Bridges ………………………………………………………………………………………………………………………
§ Motorways …………………………………………………………………………………………………………………
§ Service Facilities …………………………………………………………………………………………………………
TABLE OF CONTENTS
§ Service Facilities …………………………………………………………………………………………………………
………………………………………………………………………..2
………………………………………………………………………………………………………………………13
………………………………………………………………………………………………………………….24
…………………………………………………………………………………………………………...51
51
…………………………………………………………………………………………………………...51
General Overview
There are 4 types of Motorway Service Facilities; namelydining, resting, accommodation and fuel supply needs of motorway
Ø A-Type Facility: Fuel sales and service station, cafeteria,are included. A-type facilities are allowed within a minimum
Assets Subject to PrivatizationMotorway Service Facilities
Ø B-Type Facility: Fuel sales and service station, cafeteria,included. B-type facilities are allowed within a minimum
Ø C-Type Facility: Fuel sales and service station, cafeteria,facilities are allowed within a minimum of 50 km. distance
Ø D-Type Facility: Parking area, drinking fountain, WCallowed within a minimum of 20 km. distance.
namely Type A, Type B, Type C and Type D, which serve themotorway users.
cafeteria, restaurant, canteen, WC, telephone and motel facilitiesminimum of 200 – 250 km. distance.
Assets Subject to PrivatizationMotorway Service Facilities
52
cafeteria, restaurant, canteen, WC, telephone facilities areminimum of 50 km. distance.
cafeteria, canteen, WC, telephone facilities are included. C-typedistance.
WC and canteen facilities are included. D-type facilities are

Motorway Service Facilities (1 / 7)
Assets Subject to PrivatizationMotorway Service Facilities
MOTORWAYMOTORWAY SERVICE FACILITIY
NAME TYPE
Edirne TIR
Köseçiftliği D
Köseömer D
BABAESKİ C
Note: (1) BOT: Build-Operate-Transfer(2) Rent tender will be realized by General Directorate of National Estate Authority (3) Rent tender was realized by General Directorate of National Estate Authority .
O-3 Edirne-İstanbul (Mahmutbey)
BABAESKİ C
Hamitabad D
Akçaköy D
ÇERKEZKÖY B
Ağırmeşe D
Alipaşa (2) D
Muratbey (Single) (2) D
Ispartakule (2) D
SELİMPAŞA (3) A
Assets Subject to PrivatizationMotorway Service Facilities
MOTORWAY SERVICE FACILITIY CONTRACT TERMINATION DATE (1)TYPE KM.
TIR 15+700 Empty (No superstructure)
22+600 Operational 23-Sep-2031 (BOT)
37+750 Operational 23-Sep-2031 (BOT)
57+750 Operational 23-Sep-2031 (BOT)
53
Estate Authority . Tender process still continuing.(3) Rent tender was realized by General Directorate of National Estate Authority .
57+750 Operational 23-Sep-2031 (BOT)
75+665 Operational 23-Sep-2031 (BOT)
100+080 Operational 03-Nov-2013 (BOT)
124+920 Operational 03-Nov-2013 (BOT)
147+100 Operational RENT
168+894 Operational RENT
196+000 Operational RENT
220+441 Operational RENT
182+735 Operational RENT

Motorway Service Facilities (2 / 7)
Assets Subject to PrivatizationMotorway Service Facilities
MOTORWAYMOTORWAY SERVICE FACILITIY
NAME
Samandıra (3)
KURTKÖY (3)
Yumrukaya (2)
Tavşancıl (Single) (2)
O-4 İstanbul (Çamlıca)-Ankara
Tavşancıl (Single)
Hatipköy (Single) (2)
Gültepe (2)
TÜTÜNÇİFTLİK (2)
SAPANCA (Tepetarla)
SAPANCA (Derbent)
Yüzevler (Single)
Uzunkum (Single)
Alancuma
Note: (1) BOT: Build-Operate-Transfer(2) Rent tender will be realized by General Directorate of National Estate Authority (3) Rent tender was realized by General Directorate of National Estate Authority .
Assets Subject to PrivatizationMotorway Service Facilities
MOTORWAY SERVICE FACILITIY CONTRACT TERMINATION DATE (1)TYPE KM.
D 11+500 Operational RENT
B 27+450 Operational RENT
D 38+700 Operational RENT
D 56+600 Operational RENT
54
D 56+600 Operational RENT
D 82+600 Operational RENT
D 87+800 Operational RENT
B 76+000 Operational RENT
B 100+500 Operational RENT
B 112+600 Empty
D 120+250 Operational RENT
D 123+200 Operational RENT
D 133+800 Operational RENT
Estate Authority . Tender process still continuing.(3) Rent tender was realized by General Directorate of National Estate Authority .

Motorway Service Facilities (3 / 7)
Assets Subject to PrivatizationMotorway Service Facilities
MOTORWAYMOTORWAY SERVICE FACILITIY
NAME TYPE
HENDEK
Yeşilyayla (Single) D
Yeşilyayla (Single) D
ÜÇKÖPRÜ (2)
O-4 İstanbul (Çamlıca)-Ankara
ÜÇKÖPRÜ
ELMALIK A
Bolu D
Çaydurt D
DÖRTDİVAN
CANKURTARAN A
Tatlak TIR
Çamlıdere (3) D
ÇELTİKÇİ (3)
Note: (1) BOT: Build-Operate-Transfer(2) Rent tender will be realized by General Directorate of National Estate Authority (3) Rent tender was realized by General Directorate of National Estate Authority .
Assets Subject to PrivatizationMotorway Service Facilities
MOTORWAY SERVICE FACILITIY CONTRACT TERMINATION DATE (1)TYPE KM.
B 157+500 Operational 06-Feb-2019 (BOT)
D 172+500 Operational 06-Feb-2019 (BOT)
D 173+200 Operational 06-Feb-2019 (BOT)
B 207+500 Operational RENT
55
B 207+500 Operational RENT
A 227+800 Transfer of facility to be realized.
D 247+190 Operational 05-Oct-2024 (BOT)
D 268+090 Operational 05-Oct-2024 (BOT)
B 287+097 Operational 05-Oct-2024 (BOT)
A 314+597 Under Court
TIR 337+797 Empty
D 349+797 Operational RENT
B 387+597 Operational RENT
Estate Authority . Tender process still continuing.(3) Rent tender was realized by General Directorate of National Estate Authority .
Motorway Service Facilities (4 / 7)
Assets Subject to PrivatizationMotorway Service Facilities
MOTORWAYMOTORWAY SERVICE FACILITIY
NAME TYPE
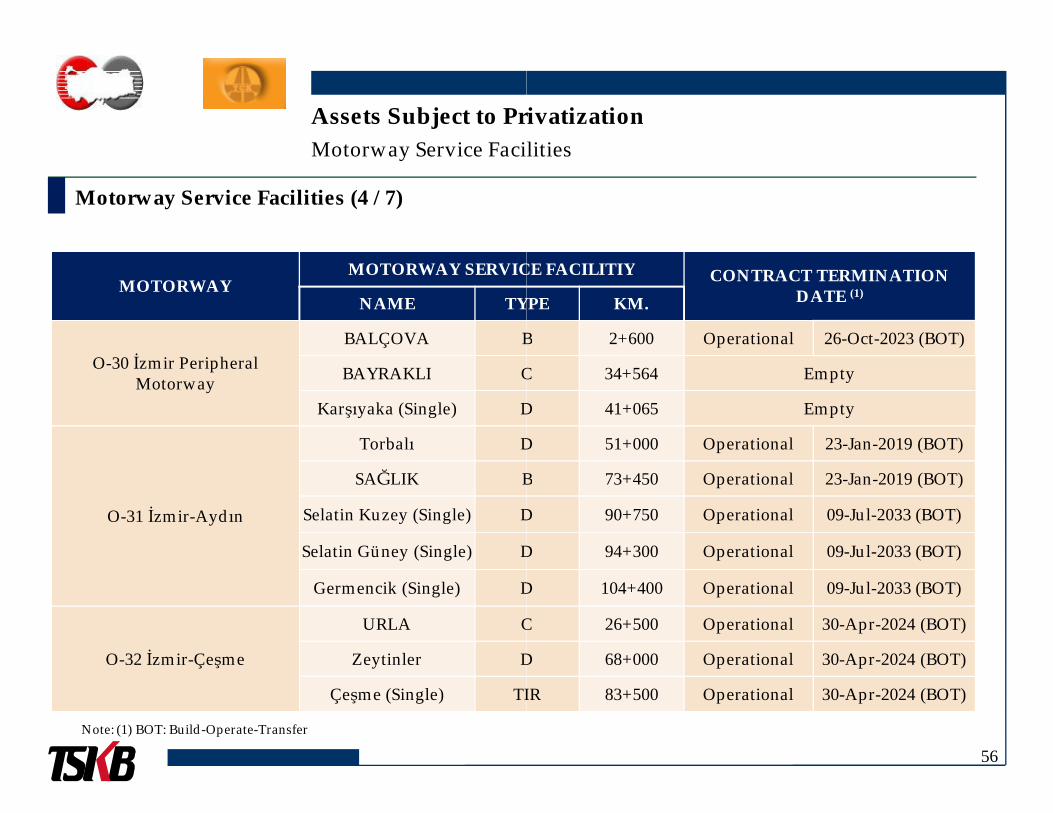
O-30 İzmir Peripheral Motorway
BALÇOVA B
BAYRAKLI C
Karşıyaka (Single) D
Note: (1) BOT: Build-Operate-Transfer
Karşıyaka (Single) D
O-31 İzmir-Aydın
Torbalı D
SAĞLIK B
Selatin Kuzey (Single) D
Selatin Güney (Single) D
Germencik (Single) D
O-32 İzmir-Çeşme
URLA C
Zeytinler D
Çeşme (Single) TIR
Assets Subject to PrivatizationMotorway Service Facilities
MOTORWAY SERVICE FACILITIY CONTRACT TERMINATION DATE (1)
TYPE KM.
B 2+600 Operational 26-Oct-2023 (BOT)
C 34+564 Empty
D 41+065 Empty
56
D 41+065 Empty
D 51+000 Operational 23-Jan-2019 (BOT)
B 73+450 Operational 23-Jan-2019 (BOT)
D 90+750 Operational 09-Jul-2033 (BOT)
D 94+300 Operational 09-Jul-2033 (BOT)
D 104+400 Operational 09-Jul-2033 (BOT)
C 26+500 Operational 30-Apr-2024 (BOT)
D 68+000 Operational 30-Apr-2024 (BOT)
TIR 83+500 Operational 30-Apr-2024 (BOT)

Motorway Service Facilities (5 / 7)
Assets Subject to PrivatizationMotorway Service Facilities
MOTORWAYMOTORWAY SERVICE FACILITIY
NAME TYPE
O-21 Pozantı-Tarsus-MersinYeniköy D
DAMLAMA B
Bozön D
Note: (1) BOT: Build-Operate-Transfer
O-51 Mersin-Tarsus ZİYARETTEPE B
Akgedik D
O-52 Tarsus-Adana-G.Antep
Yenice D
ŞAMBAYADI A
Seyhan TIR
İncirlik D
YILANKALE C
Ceyhan D
O-53 Toprakkale-İskenderun Toprakkale D
Assets Subject to PrivatizationMotorway Service Facilities
MOTORWAY SERVICE FACILITIY CONTRACT TERMINATION DATE (1)KM.
41+600 Operational 16-Mar-2028 (BOT)
52+000 Operational 16-Mar-2028 (BOT)
9+500 Operational 08-Jun-2027 (BOT)
57
40+300 Operational 08-Jun-2027 (BOT)
53+105 Operational 08-Jun-2027 (BOT)
55+500 Operational 07-Jun-2023 (BOT)
68+200 Operational 07-Jun-2023 (BOT)
85+500 Operational 07-Jun-2023 (BOT)
93+200 Operational 07-Jun-2023 (BOT)
114+500 Operational 16-Mar-2028 (BOT)
129+000 Operational 16-Mar-2028 (BOT)
6+400 Operational 10-Mar-2028 (BOT)

Motorway Service Facilities (6 / 7)
Assets Subject to PrivatizationMotorway Service Facilities
MOTORWAYMOTORWAY SERVICE FACILITIY
NAME TYPE
O-52 Tarsus-Adana-G.Antep
Kürek DOSMANİYE C
Bahçe DÇAKMAK
Notes: (1) BOT: Build-Operate-Transfer (2) Facility was transferred to Hatay Tax Authority for 9 years via a protocol signed at (3) Left side of the Facility was transferred to the Directory of Education .
O-52 Tarsus-Adana-G.AntepÇAKMAK C
Narlı DGaziantep D
O-53 Toprakkale-İskenderun
Leçelik DERZİN B
Kuzuculu DKonaklı D
Karayılan DBEKBELE B
Assets Subject to PrivatizationMotorway Service Facilities
MOTORWAY SERVICE FACILITIY CONTRACT TERMINATION DATE (1)KM.
147+300 Operational 10-Mar-2028 (BOT)
164+500 Operational 10-Mar-2028 (BOT)
196+230 Operational 10-Mar-2028 (BOT)
Operational 09-Mar-2027 (BOT)
58
(2) Facility was transferred to Hatay Tax Authority for 9 years via a protocol signed at 06 /02/2007. (3) Left side of the Facility was transferred to the Directory of Education . Right side of the Facility is empty.
237+400 Operational 09-Mar-2027 (BOT)
261+600 Operational 09-Mar-2027 (BOT)
280+800 Operational 09-Mar-2027 (BOT)
180+500 Operational 09-Apr-2027 (BOT)
190+200 Operational 09-Apr-2027 (BOT)
200+000 Operational 09-Apr-2027 (BOT)
210+700 Operational 09-Apr-2027 (BOT)
220+000 Empty (2)
230+800 Empty (No superstructure)(3)

Motorway Service Facilities (7 / 7)
Assets Subject to PrivatizationMotorway Service Facilities
MOTORWAYMOTORWAY SERVICE FACILITIY
NAME TYPE
GAZİANTEP B
Kocatepe D
Nizip TIR
Note s: (1) BOT: Build-Operate-Transfer (2) Facility was transferred to the Directorate of Land Transportation and to be used as Weight Control Facility.
O-52 Gaziantep-ŞanlıurfaNizip TIR
BİRECİK B
Suruç D
ŞANLIURFA B
Kemerhisar-PozantıBAŞMAKÇI B
Kırkgeçit D
Assets Subject to PrivatizationMotorway Service Facilities
MOTORWAY SERVICE FACILITIY CONTRACT TERMINATION DATE (1)KM.
8+165 Under construction 04-Nov-2011 (BOT)
21+800 Under construction 04-Nov-2011 (BOT)
38+750 Under construction 04-Nov-2011 (BOT)
59
Facility was transferred to the Directorate of Land Transportation and to be used as Weight Control Facility.
38+750 Under construction 04-Nov-2011 (BOT)
69+150 Operational 20-Nov-2012 (BOT)
87+430 Operational 20-Nov-2012 (BOT)
106+300 Empty (No superstructure)(2)
330+000 At expropriation stage
340+050 At project stage
Türkiye Sınai Kalkınma BankasıCorporate Finance Department
Meclis-i Mebusan Cad. No: 161 34427 Fındıklı/ İstanbul TURKEY
Contact Information
Contact Details
Hakan Aygen
Head of Corporate Finance
(: + 90 (212) 334 53 40
6: + 90 (212) 243 29 75
Türkiye Sınai Kalkınma Bankası (TSKB)Corporate Finance Department
No: 161 34427 Fındıklı/ İstanbul TURKEY
Contact Information
60
Esin Yıldırım Uzun
Corporate Finance Manager
(: + 90 (212) 334 53 15
6: + 90 (212) 243 29 75