Private Saving and Its Determinants: The Case of … determinant of long-run saving in most of the...
22
The Pakistan Development Review 35 : 1 (Spring 1996) pp. 49—70 Private Saving and Its Determinants: The Case of Pakistan AASIM M. HUSAIN Despite a gradual increase over the past twenty years, the rate of private saving in Pakistan remains low as compared with many of the developing economies in Asia. Empirical analysis of the long-run behaviour of saving in Pakistan suggests that financial deepening, though still at a relatively early stage of development, accounted for much of the rise in private saving. In contrast with the experience in the economies of Southeast Asia, where the demographic structure of the population changed significantly over the past two decades, high rates of population growth have kept the age structure of Pakistan’s population virtually unchanged and appear to account for the disparity between the saving rates in Pakistan and Southeast Asia. Hence, an increase in the long-run rate of private saving will likely require further financial development and a decline in the growth rate of the population. I. INTRODUCTION Compared to the rapidly-growing economies in Southeast Asia, the Pakistan economy has been characterised by low saving and investment rates over the past two decades. Indeed, the low rate of domestic investment is often attributed to the low rate of domestic saving. 1 Hence, the difference in economic performance between Pakistan and the Southeast Asian countries may relate to differences in the rate of saving. An understanding of the fundamental determinants of saving in Pakistan, therefore, assumes critical importance. This paper reviews trend developments in private saving behaviour in Pakistan, and compares these trends with those observed in the Southeast Asian economies during the period since 1970. While the rate of private saving in Pakistan has exhibited a trend increase since the mid-1970s, the rise came after a sharp decline in the early 1970s, and at present the rate of private saving is broadly equivalent to the level of twenty years ago. By contrast, rates of private saving in many of the Southeast Asian economies, currently about twice that of Pakistan, doubled during the past two decades and are now among the highest in the world. Aasim M. Husain currently works as an Economist at the International Monetary Fund, Washington, D. C. Author’s Note: The author was visiting ABN AMRO Bank Pakistan, on leave from the International Monetary Fund, when this paper was written. Useful comments by Ashfaque H. Khan and an anonymous referee on previous drafts of this paper are gratefully acknowledged. The views contained in this paper are those of the author and do not necessarily reflect those of the International Monetary Fund or of ABN AMRO Bank. 1 See, for example, Haque, Husain, and Montiel (1994).
Transcript of Private Saving and Its Determinants: The Case of … determinant of long-run saving in most of the...
The Pakistan Development Review 35 : 1 (Spring 1996) pp. 49—70
Private Saving and Its Determinants: The Case of Pakistan
AASIM M. HUSAIN
Despite a gradual increase over the past twenty years, the rate of private saving in
Pakistan remains low as compared with many of the developing economies in Asia. Empirical analysis of the long-run behaviour of saving in Pakistan suggests that financial deepening, though still at a relatively early stage of development, accounted for much of the rise in private saving. In contrast with the experience in the economies of Southeast Asia, where the demographic structure of the population changed significantly over the past two decades, high rates of population growth have kept the age structure of Pakistan’s population virtually unchanged and appear to account for the disparity between the saving rates in Pakistan and Southeast Asia. Hence, an increase in the long-run rate of private saving will likely require further financial development and a decline in the growth rate of the population.
I. INTRODUCTION
Compared to the rapidly-growing economies in Southeast Asia, the Pakistan economy has been characterised by low saving and investment rates over the past two decades. Indeed, the low rate of domestic investment is often attributed to the low rate of domestic saving.1 Hence, the difference in economic performance between Pakistan and the Southeast Asian countries may relate to differences in the rate of saving. An understanding of the fundamental determinants of saving in Pakistan, therefore, assumes critical importance.
This paper reviews trend developments in private saving behaviour in Pakistan, and compares these trends with those observed in the Southeast Asian economies during the period since 1970. While the rate of private saving in Pakistan has exhibited a trend increase since the mid-1970s, the rise came after a sharp decline in the early 1970s, and at present the rate of private saving is broadly equivalent to the level of twenty years ago. By contrast, rates of private saving in many of the Southeast Asian economies, currently about twice that of Pakistan, doubled during the past two decades and are now among the highest in the world.
Aasim M. Husain currently works as an Economist at the International Monetary Fund, Washington, D. C.
Author’s Note: The author was visiting ABN AMRO Bank Pakistan, on leave from the International Monetary Fund, when this paper was written. Useful comments by Ashfaque H. Khan and an anonymous referee on previous drafts of this paper are gratefully acknowledged. The views contained in this paper are those of the author and do not necessarily reflect those of the International Monetary Fund or of ABN AMRO Bank. 1See, for example, Haque, Husain, and Montiel (1994).
Aasim M. Husain 50
Using cointegration analysis, this paper examines the long-run behaviour of saving in Pakistan. The trend properties of private saving and its potential determinants are verified, and the long-run impact of these variables on saving is estimated. In addition, an error correction model, capturing the short-term dynamics of saving, is estimated.
The principal finding of this study is that about one half of the trend increase in saving appears to be related to financial development and deepening. In contrast to the results obtained by Faruqee and Husain (1994) and Husain (1995) for the Southeast Asian countries, demographics appear not to have played an important role in determining saving behaviour in Pakistan, possibly because high rates of population growth in Pakistan during this period have resulted in a virtually unchanged age structure of the population.2
The remainder of the paper is organised as follows: Section II reviews various factors that may influence the long-run rate of saving. Developments in saving and growth in Pakistan are compared with Southeast Asia in Section III. Section IV contains a review of developments in the demographic structure and financial deepening in Pakistan, and contrasts this with the evolution of these variables in the Southeast Asian economies. Data issues and the econometric methodology are discussed in Sections V and VI, respectively. The estimation results are presented in Section VII. Section VIII concludes the discussion.
II. LONG-RUN DETERMINANTS OF SAVING
Economic models of saving and consumption behaviour identify several factors that affect an economy’s long-run rate of saving. Under the overlapping generations framework, for example, in which individuals work and save in the first period of their lives, then retire and dissave during the second period, a principal factor influencing the rate of saving is the demographic structure of the population. In these models, an increase in the proportion of working members of the population, by raising the ratio of savers to dissavers in the economy, is associated with an increase in the steady-state average propensity to save.
Empirical investigations of the relationship between demographics and the overall rate of private saving have found supporting evidence in both developed and developing countries. Masson, Kremers, and Horne (1993), for example, showed that the demographic structure of the population affected the long-run net foreign asset positions of the United States, Germany, and Japan. In a study covering eight developing countries in Asia, Lahiri (1989) reported evidence indicating that
2In estimations using micro-level data, Burney and Khan (1992) find a negative impact of the dependency ratio on household saving in Pakistan. Since a significant change in the overall demographic structure has not occurred over the past three decades, however, such an effect was not picked up in our aggregate time series estimations.
Private Saving and Its Determinants 51
demographics was one of the principal determinants of saving. Finally, Faruqee and Husain (1994), in a study of saving behaviour in Indonesia, Malaysia, Singapore, and Thailand, found that demographics was the principal factor explaining the long-run movement of the saving rate in these countries. Moreover, they found that the relationship between demographics and saving was identical in three of the four countries in their sample.3
The growth rate of disposable income can also be shown to be a determinant of the saving rate in the steady state. Although an increase in steady-state growth has no impact on the individual’s saving decision, it raises saving in the aggregate by making the current period’s young savers more affluent than the young savers of the previous period, who are now the older dissavers.
Empirical evidence supporting this relationship in developing countries has been mixed, however. On the one hand, Lahiri (1989) found growth to be an important determinant of long-run saving in most of the countries in his sample. Faruqee and Husain’s (1994) results, on the other hand, indicated that changes in income growth did not have an impact on long-run developments in private saving, although differences in growth rates across countries may have accounted for inter-country differences in saving rates.
Financial development and deepening can also affect the saving performance of an economy. Financial deepening in a developing economy is associated with the increased availability of saving instruments and the increased use of financial assets to hold wealth, potentially resulting in an increase in the rate of saving. Moreover, financial development brought about by a liberalisation of financial markets would tend to raise the real rate of return on financial assets, thereby possibly also boosting the saving rate. Limited support of the latter effect has been reported in the empirical literature, however, though Ogaki, Ostry, and Reinhart (1994) have recently found evidence indicating that the sensitivity of the rate of saving to changes in the rate of return rises with income.
Finally, other factors including interest rates, wealth, and public sector debt are also important determinants of the rate of saving in economic models. Their use in empirical work on developing countries, however, is complicated by various factors. Interest rates in many developing economies have tended to be either controlled or administered, limiting their usefulness as measures of the true cost of borrowing and lending. As regards wealth, time series data on financial, physical, and human wealth are simply not available for most developing countries, although real money balances and stock market capitalisation have been used as proxies for financial and physical capital, respectively. Data on public sector debt are available for most countries, but information on government assets, including real estate and
3Surveys of saving trends in industrial and developing countries may be found in Dean et al. (1990) and Chandavarkar (1993), respectively.
Aasim M. Husain 52
state enterprises, is limited. Hence, accurate measures of net public sector debt, the variable that is important in models of saving behaviour, cannot be obtained for most developing countries.
III. SAVING AND GROWTH—INTERNATIONAL COMPARISONS
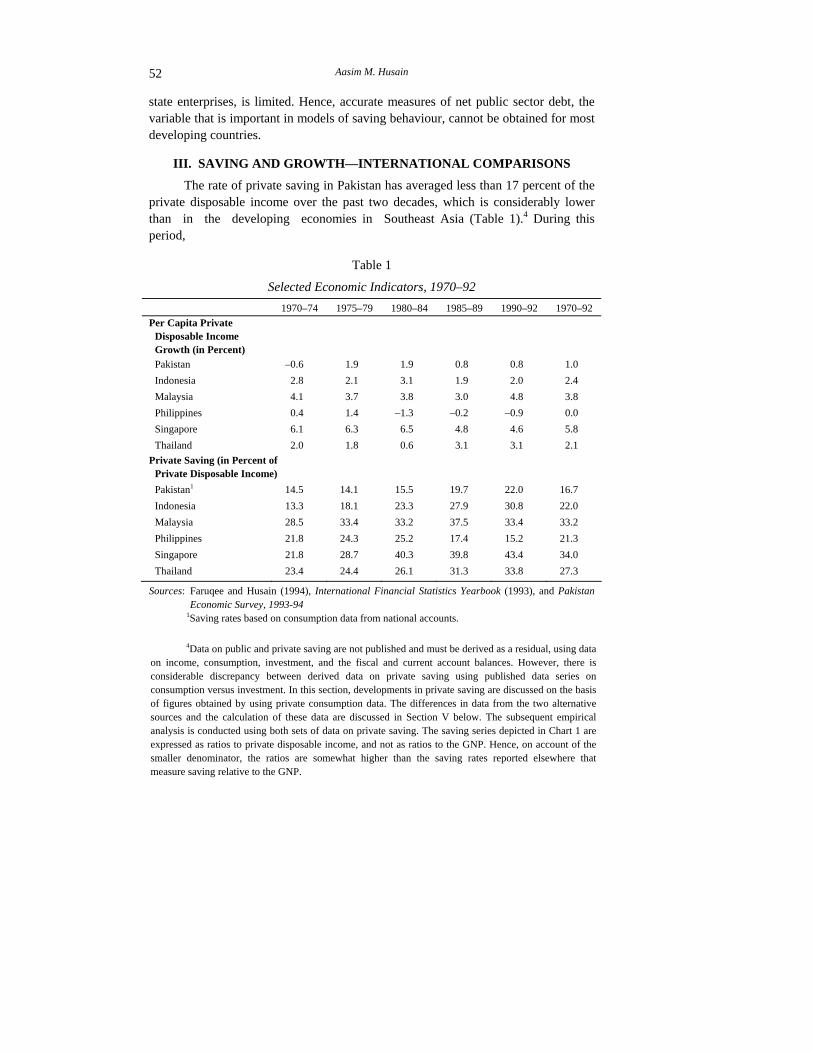
The rate of private saving in Pakistan has averaged less than 17 percent of the private disposable income over the past two decades, which is considerably lower than in the developing economies in Southeast Asia (Table 1).4 During this period,
Table 1
Selected Economic Indicators, 1970–92 1970–74 1975–79 1980–84 1985–89 1990–92 1970–92
Per Capita Private Disposable Income Growth (in Percent)
Pakistan –0.6 1.9 1.9 0.8 0.8 1.0 Indonesia 2.8 2.1 3.1 1.9 2.0 2.4 Malaysia 4.1 3.7 3.8 3.0 4.8 3.8 Philippines 0.4 1.4 –1.3 –0.2 –0.9 0.0 Singapore 6.1 6.3 6.5 4.8 4.6 5.8 Thailand 2.0 1.8 0.6 3.1 3.1 2.1
Private Saving (in Percent of Private Disposable Income)
Pakistan1 14.5 14.1 15.5 19.7 22.0 16.7 Indonesia 13.3 18.1 23.3 27.9 30.8 22.0 Malaysia 28.5 33.4 33.2 37.5 33.4 33.2 Philippines 21.8 24.3 25.2 17.4 15.2 21.3 Singapore 21.8 28.7 40.3 39.8 43.4 34.0 Thailand 23.4 24.4 26.1 31.3 33.8 27.3
Sources: Faruqee and Husain (1994), International Financial Statistics Yearbook (1993), and Pakistan Economic Survey, 1993-94
1Saving rates based on consumption data from national accounts.
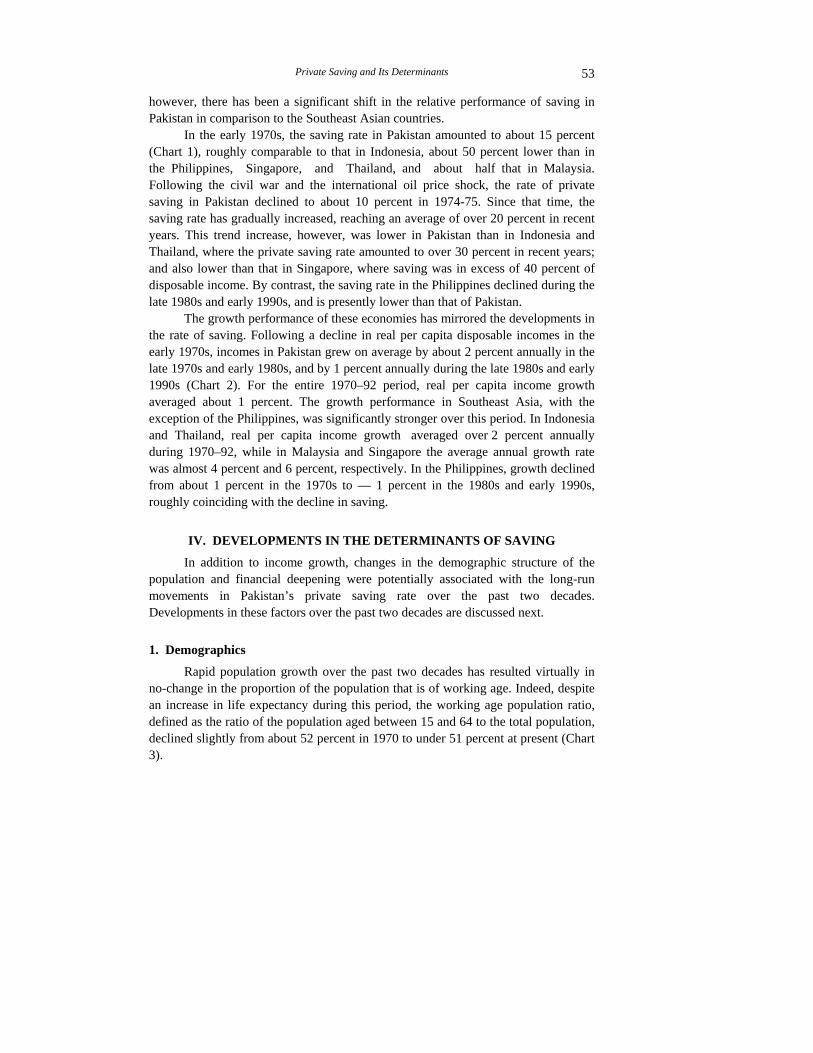
4Data on public and private saving are not published and must be derived as a residual, using data on income, consumption, investment, and the fiscal and current account balances. However, there is considerable discrepancy between derived data on private saving using published data series on consumption versus investment. In this section, developments in private saving are discussed on the basis of figures obtained by using private consumption data. The differences in data from the two alternative sources and the calculation of these data are discussed in Section V below. The subsequent empirical analysis is conducted using both sets of data on private saving. The saving series depicted in Chart 1 are expressed as ratios to private disposable income, and not as ratios to the GNP. Hence, on account of the smaller denominator, the ratios are somewhat higher than the saving rates reported elsewhere that measure saving relative to the GNP.
Private Saving and Its Determinants 53
however, there has been a significant shift in the relative performance of saving in Pakistan in comparison to the Southeast Asian countries.
In the early 1970s, the saving rate in Pakistan amounted to about 15 percent (Chart 1), roughly comparable to that in Indonesia, about 50 percent lower than in the Philippines, Singapore, and Thailand, and about half that in Malaysia. Following the civil war and the international oil price shock, the rate of private saving in Pakistan declined to about 10 percent in 1974-75. Since that time, the saving rate has gradually increased, reaching an average of over 20 percent in recent years. This trend increase, however, was lower in Pakistan than in Indonesia and Thailand, where the private saving rate amounted to over 30 percent in recent years; and also lower than that in Singapore, where saving was in excess of 40 percent of disposable income. By contrast, the saving rate in the Philippines declined during the late 1980s and early 1990s, and is presently lower than that of Pakistan.
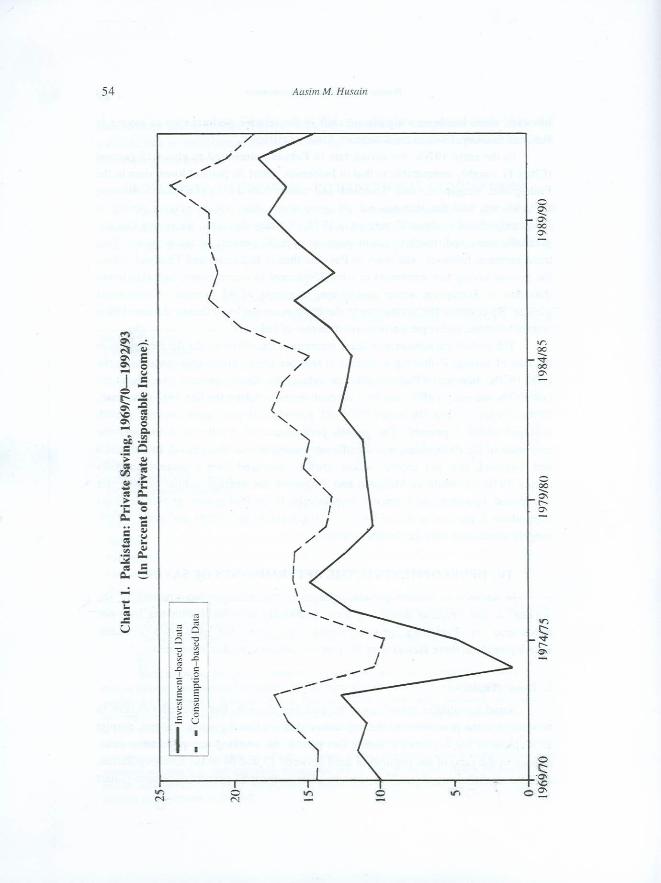
The growth performance of these economies has mirrored the developments in the rate of saving. Following a decline in real per capita disposable incomes in the early 1970s, incomes in Pakistan grew on average by about 2 percent annually in the late 1970s and early 1980s, and by 1 percent annually during the late 1980s and early 1990s (Chart 2). For the entire 1970–92 period, real per capita income growth averaged about 1 percent. The growth performance in Southeast Asia, with the exception of the Philippines, was significantly stronger over this period. In Indonesia and Thailand, real per capita income growth averaged over 2 percent annually during 1970–92, while in Malaysia and Singapore the average annual growth rate was almost 4 percent and 6 percent, respectively. In the Philippines, growth declined from about 1 percent in the 1970s to — 1 percent in the 1980s and early 1990s, roughly coinciding with the decline in saving.
IV. DEVELOPMENTS IN THE DETERMINANTS OF SAVING
In addition to income growth, changes in the demographic structure of the population and financial deepening were potentially associated with the long-run movements in Pakistan’s private saving rate over the past two decades. Developments in these factors over the past two decades are discussed next.
1. Demographics
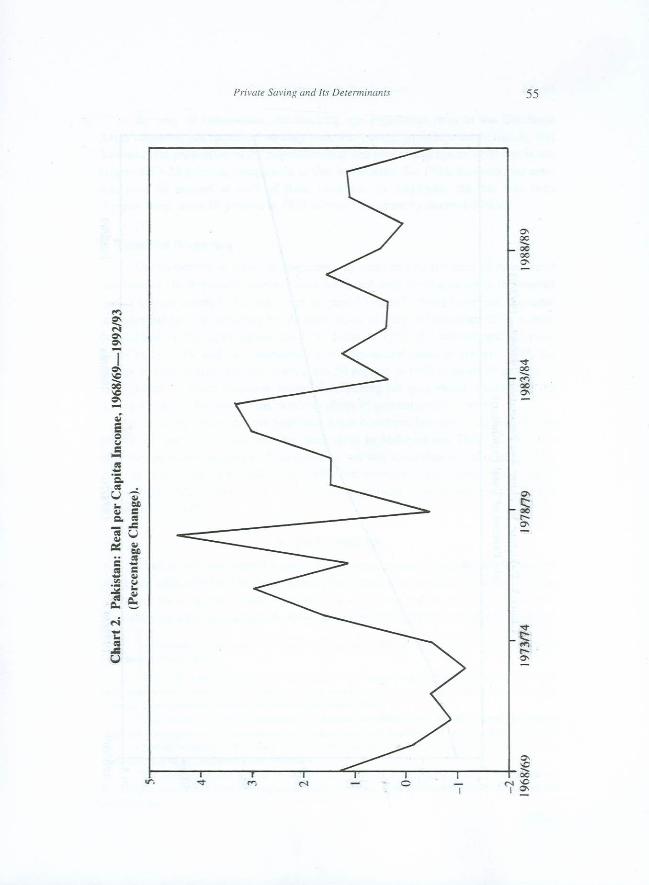
Rapid population growth over the past two decades has resulted virtually in no-change in the proportion of the population that is of working age. Indeed, despite an increase in life expectancy during this period, the working age population ratio, defined as the ratio of the population aged between 15 and 64 to the total population, declined slightly from about 52 percent in 1970 to under 51 percent at present (Chart 3).
Private Saving and Its Determinants 57
By way of comparison, the working age population ratio in the Southeast Asian countries has increased steadily over this period. In Indonesia, Malaysia, and Thailand, the proportion of the population that was of working age in 1970 was in the range of 50–55 percent, comparable to that in Pakistan. By 1992, however, the ratio was over 60 percent in each of these countries. In Singapore, the rise was even sharper, from about 58 percent in 1970 to over 70 percent by the mid-1980s.5
2. Financial Deepening
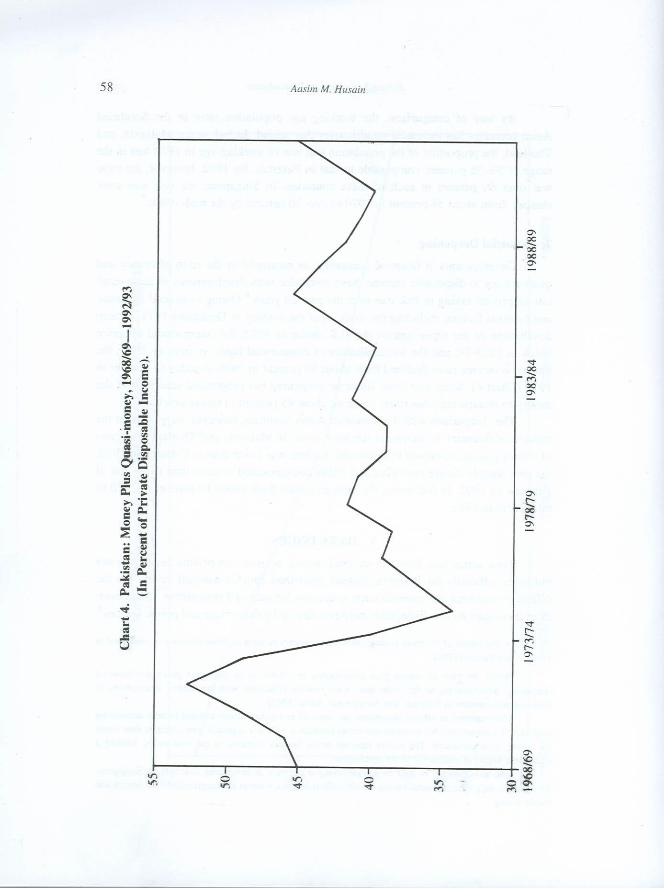
Developments in financial deepening, as measured by the ratio of money and quasi-money to disposable income, have coincided with developments in the overall rate of private saving in Pakistan over the past 20 years.6 Owing to several domestic and external factors, including the division of the country in December 1971, a steep devaluation of the rupee against the U.S. dollar in 1972, the international oil price shock in 1973-74, and the nationalisation of commercial banks in January 1975, the money to income ratio declined from about 50 percent in 1970 to under 35 percent in 1975 (Chart 4). Since that time, financial deepening has progressed steadily and the money to income ratio has risen, reaching about 45 percent in recent years.
The comparison with the Southeast Asian countries, however, suggests that the process of financial development has been slow. In Malaysia and Thailand, the ratio of money plus quasi-money to disposable income was lower than in Pakistan in 1970, but rose sharply during the 1970s and 1980s and amounted to more than twice that of Pakistan by 1992. In Indonesia, the ratio increased from about 10 percent in 1970 to 60 percent in 1992.
V. DATA ISSUES
Time series data from the national income accounts on private saving are not published officially for Pakistan. Instead, published data on national saving are the difference between the external current account balance and investment.7 Moreover, even these data do not distinguish between saving by the private and public sectors.8
5A discussion of the main demographic developments in each of these countries is contained in Faruqee and Husain (1994).
6While the ratio of money plus quasi-money to income is an imperfect proxy for financial deepening, developments in this ratio have been broadly consistent with qualitative descriptions of financial development in Pakistan. See, for example, Klein (1992).
7Data reported in official documents are obtained as residuals from national income accounting identities. To compensate for measurement errors associated with this approach, two alternate time series for saving were calculated. The results reported below are not sensitive to the data series, lending a reasonable degree of confidence to the conclusions.
8The unavailability of data on private saving is common in developing countries. In Singapore, for example, only data on overall saving are officially published, without a disaggregation into private and public saving.
Private Saving and Its Determinants 59
For this reason, time series data for private saving were obtained by applying standard national income accounting identities to available data series. Because of inconsistencies between data in the national income accounts and those in the balance-of-payments accounts, two alternative series for private saving were calculated.
The first series for private saving, referred to as the “consumption-based” series in the discussion of the empirical results below, is comparable to that obtained by Faruqee and Husain (1994) in their study of private saving in Southeast Asia. This series was derived by subtracting private consumption from private disposable income. Private disposable income was calculated as national income less tax revenue of the consolidated Federal Government. The second series, referred to as the investment-based data series below, was obtained by first subtracting the external current account deficit (reported in the balance-of-payments accounts) from total domestic investment (reported in the national accounts) to yield national saving. Public saving, measured as national income less private disposable income less public consumption, was then subtracted from national saving to yield private saving.9
The resulting data for private saving are significantly different across the two series, although changes in the rate of saving in each series are broadly similar. The empirical analysis was conducted for both sets of data. The results reported below, however, indicate that the factors influencing long-run developments in private saving in Pakistan during the period 1970–93 were common across both series. Hence, complications related to the unavailability of raw data on private saving appear not to seriously affect the analysis of long-run movements in private saving behaviour.
In addition to the complications surrounding saving data, data for the working age population are available only for the years in which population censuses were conducted. The only census years within the sample period used in this analysis were 1970 and 1981, and estimates for the working age population ratio during the remainder of the sample period were constructed on the basis of the growth rates of the working age population and total population during each sub-period. Hence, the interpolation involved in this exercise likely results in a correlation between the constructed demographic variable and the time trend.
VI. ECONOMETRIC METHODOLOGY
Cointegration analysis provides a useful framework for identifying and estimating the long-run relationship between saving and its fundamental
9Data for private consumption, private investment, GNP, tax revenue, public consumption, and the external current account balance were obtained from various issues of the Pakistan Economic Survey and International Financial Statistics Yearbook of the International Monetary Fund.
Aasim M. Husain 60
determinants. By way of definition, a set of N difference-stationary variables is said to be cointegrated if there exists at least one linear combination, or cointegrating vector, of these variables that is stationary. While cointegrated variables may drift apart in the short run, they must converge systematically over time.
In order to obtain a cointegrating vector relating long-run movements in the rate of private saving to its determinants, the estimation strategy employed below involves determining first the order of integration of each time series using standard Dickey-Fuller (DF) and Augmented Dickey-Fuller (ADF) tests for stationarity. Once the order of integration is determined, long-run saving equations are estimated and the Engle-Granger cointegration tests are applied. Finally, error correction equations capturing the short-run dynamics of saving are estimated using ordinary least squares (OLS) estimation (the Engle-Granger estimates). As a check of the robustness of the results, non-linear least squares (NLS) estimates (the Phillips-Loretan estimates) of the long-run determinants and short-run dynamics of saving were also obtained.
VII. ESTIMATION RESULTS
The empirical results are described in this section. The upward drift in the rate of saving evident in Chart 1 is statistically verified, motivating the estimation of its long-run determinants.
1. Tests of Order of Integration
Test statistics were calculated to indicate the order of integration for each of the univariate time series—saving (S/Y), demographics (DEM), growth (GROWTH), and financial deepening (M/Y). The results of the unit root tests, based on a unit root null hypothesis versus a stationary alternative, are reported in Table 2.10
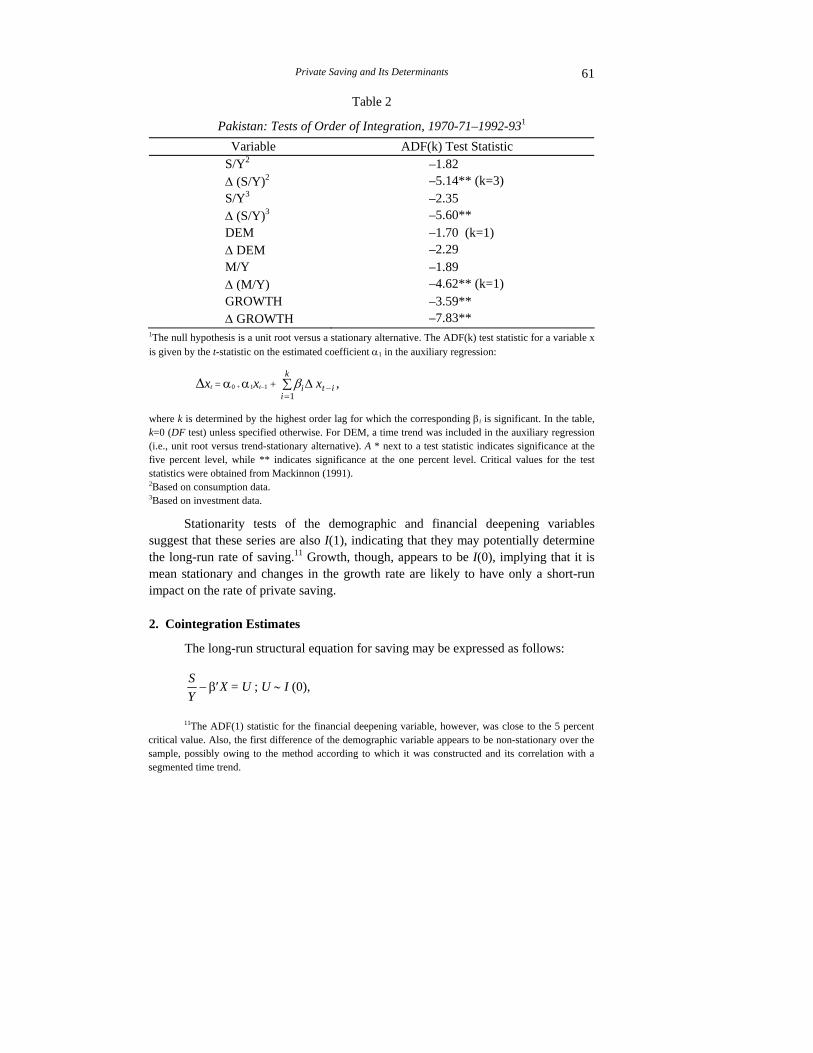
The most important result in Table 2 is the finding that the saving rate, calculated using either consumption-based or investment-based data, appears to be difference stationary (I(1) or integrated of order one) over the period 1970-71–1992-93. Specifically, the ADF tests fail to reject a unit root in levels but not in first differences of the time series data for private saving. This suggests that the rate of saving exhibits a stochastic trend or non-stationary drift, rather than mean-reversion to a given long-run level over the sample period. The cointegration analysis that follows attempts to explain this trend movement in saving behaviour by identifying its long-run determinants, or I(1) explanatory variables, which share a common variable trend, or cointegrate, with saving. On the basis of the cointegration estimates, the saving rate can be decomposed into its trend (permanent) and cyclical (transitory) components.
10It should be noted, however, that the sample period is small and the ADF test is low-powered, too often accepting a false null hypothesis (unit root)—i.e., prone to making type II errors.
Private Saving and Its Determinants 61
Table 2
Pakistan: Tests of Order of Integration, 1970-71–1992-931 Variable ADF(k) Test Statistic
S/Y2 ∆ (S/Y)2
–1.82 –5.14** (k=3)
S/Y3 ∆ (S/Y)3
–2.35 –5.60**
DEM ∆ DEM
–1.70 (k=1) –2.29
M/Y ∆ (M/Y)
–1.89 –4.62** (k=1)
GROWTH ∆ GROWTH
–3.59** –7.83**
1The null hypothesis is a unit root versus a stationary alternative. The ADF(k) test statistic for a variable x is given by the t-statistic on the estimated coefficient α1 in the auxiliary regression:
∆xt = α0 + α1xt–1 + βi t ii
kx∆ −
=∑ ,
1
where k is determined by the highest order lag for which the corresponding βi is significant. In the table, k=0 (DF test) unless specified otherwise. For DEM, a time trend was included in the auxiliary regression (i.e., unit root versus trend-stationary alternative). A * next to a test statistic indicates significance at the five percent level, while ** indicates significance at the one percent level. Critical values for the test statistics were obtained from Mackinnon (1991). 2Based on consumption data. 3Based on investment data.
Stationarity tests of the demographic and financial deepening variables suggest that these series are also I(1), indicating that they may potentially determine the long-run rate of saving.11 Growth, though, appears to be I(0), implying that it is mean stationary and changes in the growth rate are likely to have only a short-run impact on the rate of private saving.
2. Cointegration Estimates
The long-run structural equation for saving may be expressed as follows:
SY− β′X = U ; U ∼ I (0),
11The ADF(1) statistic for the financial deepening variable, however, was close to the 5 percent critical value. Also, the first difference of the demographic variable appears to be non-stationary over the sample, possibly owing to the method according to which it was constructed and its correlation with a segmented time trend.
Aasim M. Husain 62
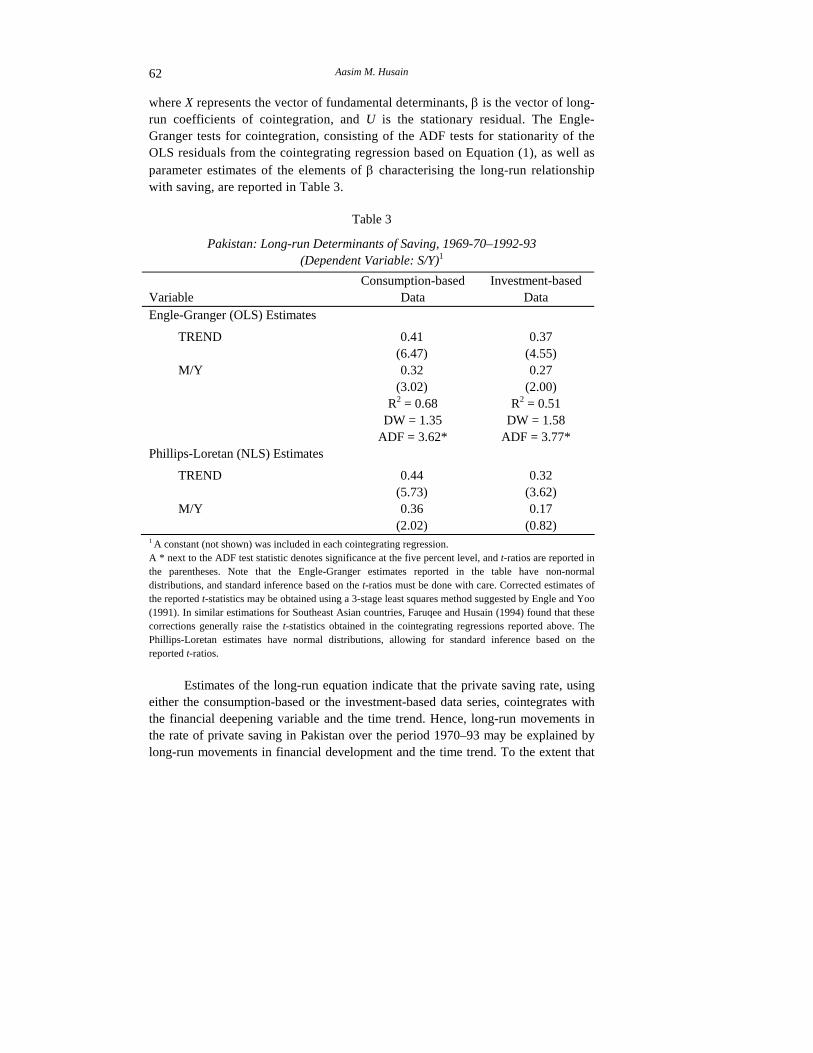
where X represents the vector of fundamental determinants, β is the vector of long-run coefficients of cointegration, and U is the stationary residual. The Engle-Granger tests for cointegration, consisting of the ADF tests for stationarity of the OLS residuals from the cointegrating regression based on Equation (1), as well as parameter estimates of the elements of β characterising the long-run relationship with saving, are reported in Table 3.
Table 3
Pakistan: Long-run Determinants of Saving, 1969-70–1992-93 (Dependent Variable: S/Y)1
Variable
Consumption-based Data
Investment-based Data
Engle-Granger (OLS) Estimates
TREND 0.41 (6.47)
0.37 (4.55)
M/Y 0.32 (3.02)
0.27 (2.00)
R2 = 0.68 DW = 1.35
ADF = 3.62*
R2 = 0.51 DW = 1.58
ADF = 3.77* Phillips-Loretan (NLS) Estimates
TREND 0.44 (5.73)
0.32 (3.62)
M/Y 0.36 (2.02)
0.17 (0.82)
1 A constant (not shown) was included in each cointegrating regression. A * next to the ADF test statistic denotes significance at the five percent level, and t-ratios are reported in the parentheses. Note that the Engle-Granger estimates reported in the table have non-normal distributions, and standard inference based on the t-ratios must be done with care. Corrected estimates of the reported t-statistics may be obtained using a 3-stage least squares method suggested by Engle and Yoo (1991). In similar estimations for Southeast Asian countries, Faruqee and Husain (1994) found that these corrections generally raise the t-statistics obtained in the cointegrating regressions reported above. The Phillips-Loretan estimates have normal distributions, allowing for standard inference based on the reported t-ratios.
Estimates of the long-run equation indicate that the private saving rate, using
either the consumption-based or the investment-based data series, cointegrates with the financial deepening variable and the time trend. Hence, long-run movements in the rate of private saving in Pakistan over the period 1970–93 may be explained by long-run movements in financial development and the time trend. To the extent that
Private Saving and Its Determinants 63
variables not included in the estimations, such as net wealth and net government debt, were correlated with the time trend, the estimates in Table 3 appear to suggest that these variables also influenced long-run movements in the rate of saving.12
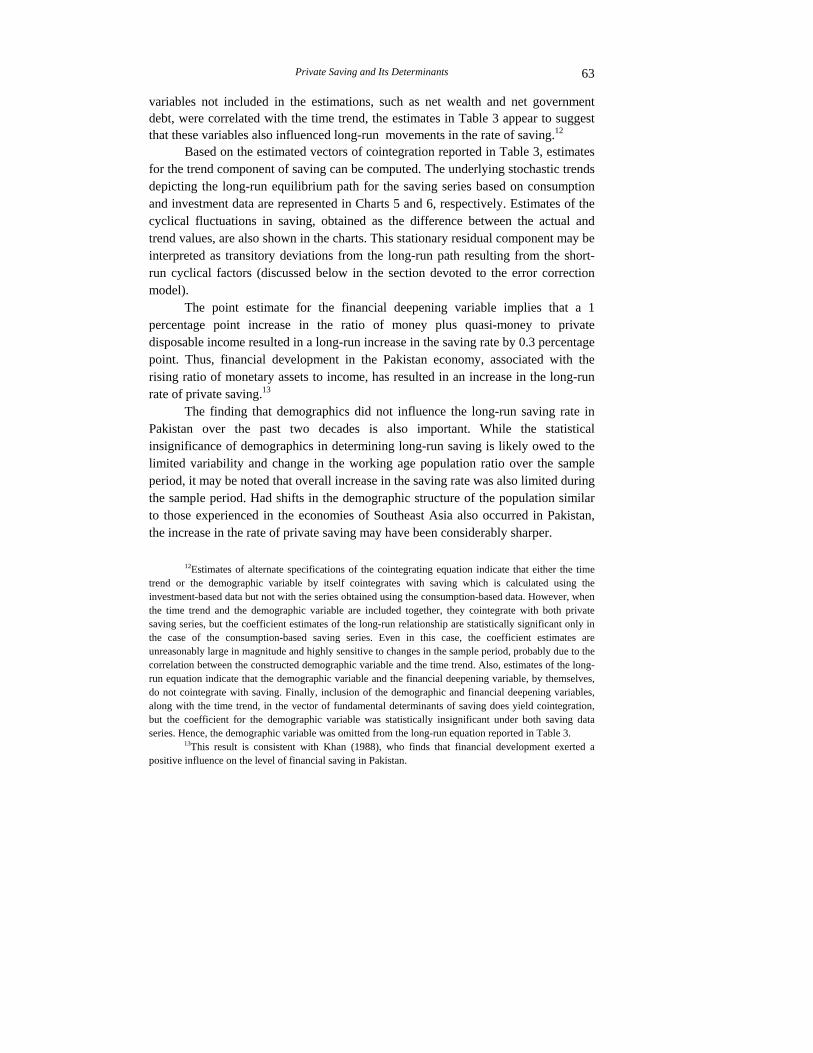
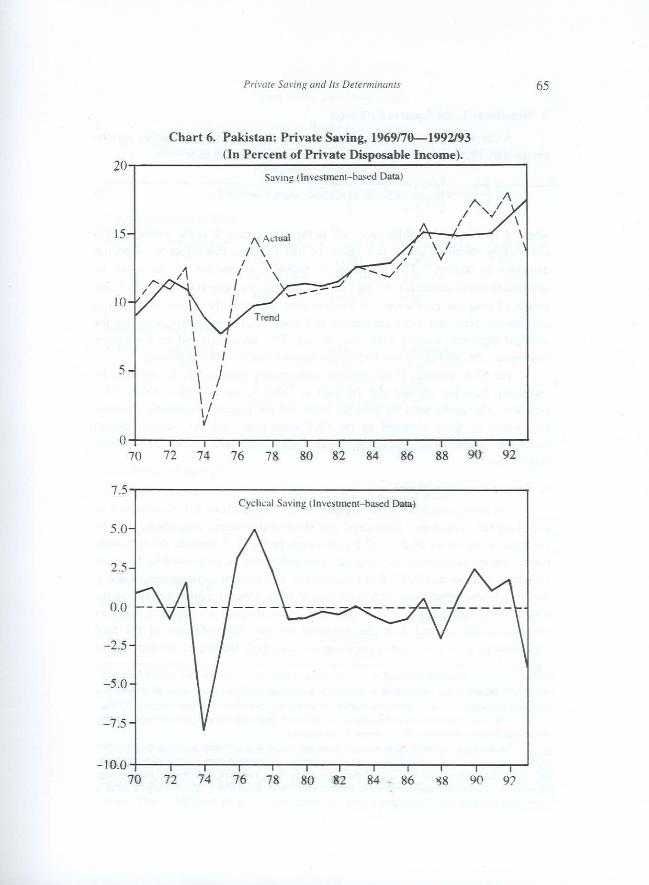
Based on the estimated vectors of cointegration reported in Table 3, estimates for the trend component of saving can be computed. The underlying stochastic trends depicting the long-run equilibrium path for the saving series based on consumption and investment data are represented in Charts 5 and 6, respectively. Estimates of the cyclical fluctuations in saving, obtained as the difference between the actual and trend values, are also shown in the charts. This stationary residual component may be interpreted as transitory deviations from the long-run path resulting from the short-run cyclical factors (discussed below in the section devoted to the error correction model).
The point estimate for the financial deepening variable implies that a 1 percentage point increase in the ratio of money plus quasi-money to private disposable income resulted in a long-run increase in the saving rate by 0.3 percentage point. Thus, financial development in the Pakistan economy, associated with the rising ratio of monetary assets to income, has resulted in an increase in the long-run rate of private saving.13
The finding that demographics did not influence the long-run saving rate in Pakistan over the past two decades is also important. While the statistical insignificance of demographics in determining long-run saving is likely owed to the limited variability and change in the working age population ratio over the sample period, it may be noted that overall increase in the saving rate was also limited during the sample period. Had shifts in the demographic structure of the population similar to those experienced in the economies of Southeast Asia also occurred in Pakistan, the increase in the rate of private saving may have been considerably sharper.
12Estimates of alternate specifications of the cointegrating equation indicate that either the time trend or the demographic variable by itself cointegrates with saving which is calculated using the investment-based data but not with the series obtained using the consumption-based data. However, when the time trend and the demographic variable are included together, they cointegrate with both private saving series, but the coefficient estimates of the long-run relationship are statistically significant only in the case of the consumption-based saving series. Even in this case, the coefficient estimates are unreasonably large in magnitude and highly sensitive to changes in the sample period, probably due to the correlation between the constructed demographic variable and the time trend. Also, estimates of the long-run equation indicate that the demographic variable and the financial deepening variable, by themselves, do not cointegrate with saving. Finally, inclusion of the demographic and financial deepening variables, along with the time trend, in the vector of fundamental determinants of saving does yield cointegration, but the coefficient for the demographic variable was statistically insignificant under both saving data series. Hence, the demographic variable was omitted from the long-run equation reported in Table 3.
13This result is consistent with Khan (1988), who finds that financial development exerted a positive influence on the level of financial saving in Pakistan.
Aasim M. Husain 66
3. Non-linear Least Squares Estimates
A check for the robustness of the estimated cointegrating relationship may be obtained by NLS estimation of an error correction model of the form:
∆ SY
SY
X Z⎛⎝⎜
⎞⎠⎟= − ⎛
⎝⎜⎞⎠⎟
− ′⎡
⎣⎢
⎤
⎦⎥ + ′
−−α β γ
11 , ... ... ... (2)
where ∆ denotes a first difference, S/Y is the saving rate, X is the vector of I(1) explanatory variables, and Z is a vector of I(0) variables that affect the short-run dynamics of saving.14 The parameter α provides a measure of the speed of adjustment (error correction) in the saving rate to its long-run level, β is the vector of long-run coefficients of cointegration, and γ is the vector of short-run coefficients. Note that every component in Equation (2) is stationary, allowing for standard regression analysis. Moreover, as long as the saving rate and the X variables cointegrate, the error correction term in the square brackets is also stationary.
The NLS estimates of the long-run cointegrating relationship (β), obtained by estimating Equation (2) and also reported in Table 3, are very close to the OLS estimates. The coefficients for both the trend and the financial deepening variables are similar to those obtained in the OLS estimation, and the t-ratios, though somewhat lower than the corresponding OLS estimates, generally indicate significance.15 4. Error Correction Model
The error correction model in Equation (2), which allows the incorporation of both long-run economic relationships and short-term dynamic adjustment, may be estimated using either OLS or NLS techniques. In the OLS version, the first-stage Engle-Granger estimates of the long-run relationship may be substituted for the error correction mechanism (ECM) β in Equation (2). The remaining parameters, α and γ, may then be estimated using OLS at the second stage. Under the NLS method, all the parameters are estimated jointly. In both techniques, insignificant short-run variables are sequentially omitted from the estimated version. The estimates of the final parsimonious error correction representation using both techniques are reported in Table 4.16
14Included in the vector Z in Equation (2) are present and past innovations in X reflecting transitory fluctuations in the long-run determinants of saving that may affect short-run changes in saving.
15The t-ratio for the estimated coefficient for financial deepening in the regression employing the investment data-based saving series, however, is not significant.
16Including contemporaneous innovations in the explanatory variables in the error correction representation gives the model more structural interpretation with regard to short-run dynamics. However, this specification also raises the risk of the simultaneity bias. Fortunately, based on the Lagrange Multiplier (LM) tests for serial correlation reported in Table 4, simultaneity does not appear to be a serious problem.
Private Saving and Its Determinants 67
Table 4
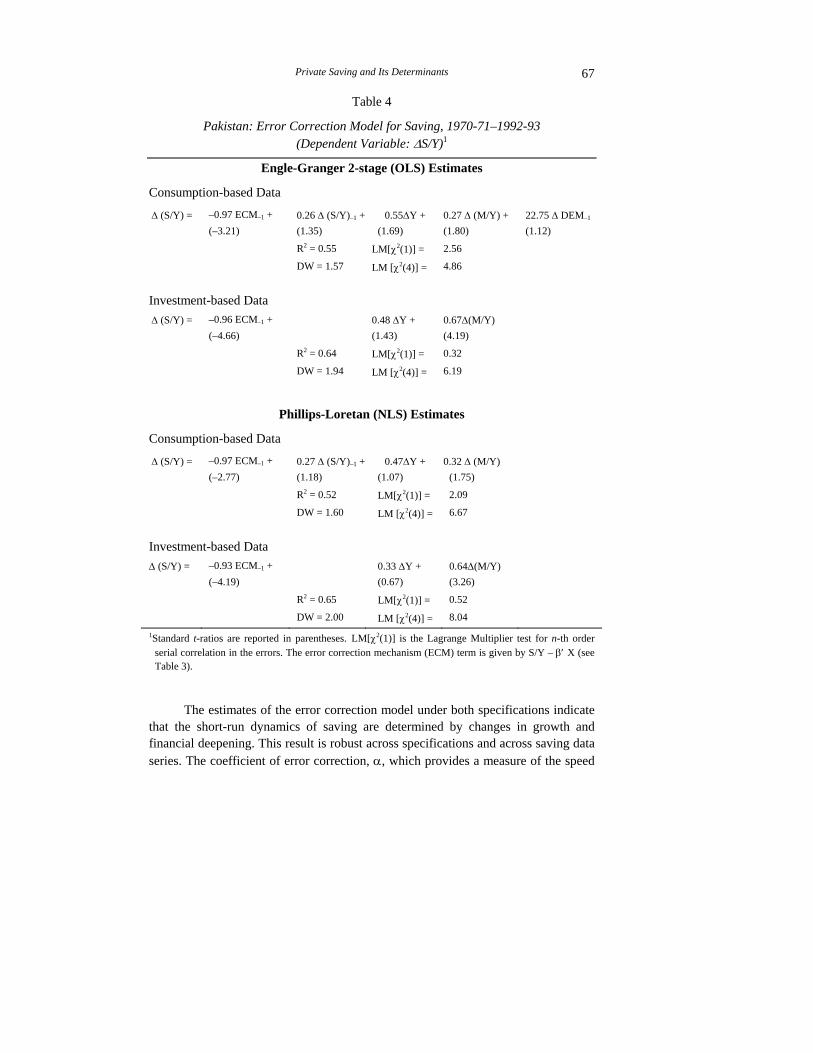
Pakistan: Error Correction Model for Saving, 1970-71–1992-93 (Dependent Variable: ∆S/Y)1
Engle-Granger 2-stage (OLS) Estimates
Consumption-based Data
∆ (S/Y) = –0.97 ECM–1 + 0.26 ∆ (S/Y)–1 + 0.55∆Y + 0.27 ∆ (M/Y) + 22.75 ∆ DEM–1 (–3.21) (1.35) (1.69) (1.80) (1.12)
R2 = 0.55
DW = 1.57 LM[χ2(1)] =
LM [χ2(4)] =
2.56
4.86
Investment-based Data
∆ (S/Y) = –0.96 ECM–1 + 0.48 ∆Y + 0.67∆(M/Y) (–4.66) (1.43) (4.19)
R2 = 0.64
DW = 1.94 LM[χ2(1)] =
LM [χ2(4)] =
0.32
6.19
Phillips-Loretan (NLS) Estimates
Consumption-based Data
∆ (S/Y) = –0.97 ECM–1 + 0.27 ∆ (S/Y)–1 + 0.47∆Y + 0.32 ∆ (M/Y) (–2.77) (1.18) (1.07) (1.75)
R2 = 0.52
DW = 1.60 LM[χ2(1)] =
LM [χ2(4)] =
2.09
6.67
Investment-based Data
∆ (S/Y) = –0.93 ECM–1 + 0.33 ∆Y + 0.64∆(M/Y) (–4.19) (0.67) (3.26)
R2 = 0.65
DW = 2.00 LM[χ2(1)] =
LM [χ2(4)] =
0.52
8.04
1Standard t-ratios are reported in parentheses. LM[χ2(1)] is the Lagrange Multiplier test for n-th order serial correlation in the errors. The error correction mechanism (ECM) term is given by S/Y – β′ X (see Table 3).
The estimates of the error correction model under both specifications indicate that the short-run dynamics of saving are determined by changes in growth and financial deepening. This result is robust across specifications and across saving data series. The coefficient of error correction, α, which provides a measure of the speed
Aasim M. Husain 68
of adjustment in saving, indicates that full adjustment to equilibrium following a transitory shock takes 1.3–1.7 years, depending on which estimated version of the error correction model is considered.17 To the extent that consumption displays habit persistence or is subject to adjustment costs, saving rates may display some inertia and depend on past innovations. The estimation results, however, suggest that such an effect was not significant in Pakistan over the sample period.
Changes in the rate of income growth, as expected, raise the overall rate of private saving in the short run. This finding, as well as its point estimate, is robust across saving data series and empirical model specifications. An increase in the rate of growth, relative to its long-run level, results in a level of disposable income that is high relative to its long-run path. According to the permanent income hypothesis, much of this transitory income should be saved, thereby resulting in an increase in the overall saving rate. Also, short-term deviations in the financial deepening variable, possibly reflecting transitory changes in financial wealth, are positively related to innovations in the rate of saving. Again, this finding, which is also robust across specifications and saving data series, appears consistent with the permanent income/life cycle hypothesis.
VIII. CONCLUSION
Following a sharp decline in the early 1970s, the rate of saving by the private sector in Pakistan economy has shown a gradual rise during the past two decades. Compared with the sharp increases recorded in the saving rates in the rapidly-growing economies of Southeast Asia, however, the saving performance of the Pakistan economy appears weak. To the extent that the high rates of saving in Southeast Asia helped finance higher rates of investment, the difference in the growth performance of that region and Pakistan may be owed to differences in the rate of saving. Hence, an understanding of the determinants of private saving in Pakistan would appear to be of critical importance.
Between the mid 1970s and the early 1990s, the ratio of private saving to income in Pakistan rose by about 8 percentage points. The empirical analysis in this paper suggests that financial deepening and development accounted for about 3 percentage points of this increase. Other factors, such as wealth and public sector indebtedness, to the extent that they were correlated with the time trend, may have also influenced the long-run evolution of saving, thereby accounting for the
17The ECM term in Table 4 captures the effect of equilibrium errors on the short-term adjustment of saving to its long-run value, while the short-run factors capture the effects of disequilibrium disturbances. The speed of adjustment to the long-run trend rate of saving may be calculated as follows: the number of periods T required for all but x percent of a shock to remain is (1–α)T=x. A value of 1 percent was used for x.
Private Saving and Its Determinants 69
remainder of the increase.18 Demographic shifts, which accounted for the bulk of the increase in saving rates in Southeast Asia, appear not to have mattered in Pakistan, mainly because the overall structure of the population remained essentially unchanged during the past two decades. Had the working age population ratio increased in Pakistan as it did in the Southeast Asian economies, and had its impact been similar to what it was in those economies, the present rate of private saving in Pakistan would have been comparable to the saving rates in the Southeast Asian countries.
REFERENCES
Burney, Nadeem A., and Ashfaque H. Khan (1992) Socio-economic Characteristics and Household Savings: An Analysis of the Households’ Saving Behaviour in Pakistan. The Pakistan Development Review 31:1 31–48.
Chandavarkar, Anand (1993) Saving Behaviour in the Asian-Pacific Region. Asian–Pacific Economic Literature 7: 9–27.
Dean, Andrew, Martine Durand, John Fallon, and Peter Hoeller (1990) Saving Trends and Behaviour OECD Countries. OECD Economic Studies 14: 7–58.
Engle, Robert F., and B. Sam Yoo (1991) Forecasting and Testing in Co-integrated Systems. In R. Engle and C. Granger (eds) Long-run Economic Relationships: Readings in Cointegration. Oxford: Oxford University Press.
Faruqee, Hamid, and Aasim M. Husain (1994) Determinants of Private Saving in Southeast Asia. A Cross-country Analysis. International Monetary Fund. December. (Mimeographed.)
Haque, Nadeem U., Aasim M. Husain, and Peter J. Montiel (1994) An Empirical Dependent Economy Model for Pakistan. World Development 22: 1585–1597.
Husain, Aasim M. (1995) Determinants of Private Saving in Singapore. In K. Bercuson (ed) Singapore: A Case Study in Rapid Development. International Monetary Fund. (Occasional Paper No.119, February.)
International Monetary Fund (1993) International Financial Statistics Yearbook. Khan, Ashfaque H. (1988) Financial Repression, Financial Development, and
Structure of Savings in Pakistan. The Pakistan Development Review 29:4 701–711.
18Inflows of workers’ remittances, which started rising sharply in the mid-1970s and amounted to about 10 percent of private disposable income in the mid-1980s, played an important role in Pakistan’s economy. Indeed, Haque, Husain, and Montiel (1994) find that remittances were critical in achieving Pakistan’s high growth-low inflation performance during the past three decades. While the ratio of remittances to private disposable income was found to be non-stationary—I(1) over the sample period—this ratio did not, by itself, cointegrate with the private saving rate. Moreover, when used jointly with other explanatory variables in the long-run specification, the remittances ratio did not add any explanatory power.

Aasim M. Husain 70
Klein, Michael U. (1992) Commercial Banking in Pakistan. In Anjum Nasim (ed) Financing Pakistan’s Development in the 1990s. Karachi: Oxford University Press.
Lahiri, Ashok K. (1989) Dynamics of Asian Saving: The Role of Growth and Age Structure. International Monetary Fund Staff Papers 36: 228–261.
Mackinnon, James (1991) Critical Values for Cointegration Tests. In R. Engle and C. Granger (eds) Long-run Economic Relationships: Readings in Cointegration. Oxford: Oxford University Press.
Masson, Paul, Jeroen Kremers, and Jocelyn Horne (1993) Net Foreign Assets and International Adjustment: The United States, Japan, and Germany. International Monetary Fund. (Working Paper No. WP/93/33.)
Ogaki, M., Jonathan Ostry, and Carmen Reinhart (1994) Financial Liberalisation, Saving, and Growth. International Monetary Fund. November. (Mimeographed.)
Pakistan, Government of (Various Issues) Economic Survey.