Private Financing of Long‑Term Care: Income, Savings and ...
20
5 ECONOMIE ET STATISTIQUE / ECONOMICS AND STATISTICS N° 507‑508, 2019 Received on 6 June 2017, accepted after revisions on 18 May 2018 Private Financing of Long‑Term Care: Income, Savings and Reverse Mortgages Carole Bonnet*, Sandrine Juin** and Anne Laferrère*** Abstract – To what extent would older Europeans be able to pay for their long‑term care needs out of their income and assets if they had no access to informal care or public insurance? To answer this question, we build a microsimulation model and estimate the disability trajecto‑ ries of those currently aged 65 or older in nine European countries using the Survey of Health, Ageing and Retirement in Europe (SHARE). We focus on the potential role of reverse mortgages in home equity release. According to the simulations, 57% of people 65 and over will experience disability. Conditional on need, care will be required for 4.4 years on average. Of those with no partner, 6% of dependent individuals could pay for their long‑term care out of their income alone, 22% if they used all their savings except their home. The proportion would reach 49% if they took out reverse mortgages on their main residence. However, one‑quarter would be able to finance less than 10% of their long‑term care expenses. JEL Classification: J140, D140, I130, C530 Keywords: long‑term care, housing, reverse mortgage, microsimulation To cite this article: Bonnet, C., Juin, S. & Laferrère, A. (2019). Private Financing of Long‑Term Care: Income, Saving and Reverse Mortgages. Economie et Statistique / Economics and Statistics, 507‑508, 5–24. https://doi.org/10.24187/ecostat.2019.507d.1972 * French Institute for Demographic Studies (INED) ([email protected]) ** ERUDITE, Université Paris-Est Créteil and French Institute for Demographic Studies (INED) ([email protected]) *** University Paris-Dauphine ([email protected]) We are grateful to two anonymous reviewers for their comments. We also thank André Masson and Thomas Barnay for their advice, Alexandre Cazenave‑ Lacroutz and Fanny Godet for sharing their Stata program on SHARE mortality. We are also grateful to Eric Bonsang, Joan Costa‑i‑Font, Jérôme Wittwer and to participants at the 5 th SHARE Users Conference, the Labex OSE Rencontres d'Aussois, the 15 th Conference on Pension, Insurance and Savings and various seminars (ERUDITE, Paris School of Economics, INED, MODAPA‑MEDIPS) for their comments. Reminder: The opinions and analyses in this article are those of the author(s) and do not necessarily reflect their institution’s or Insee’s views.
Transcript of Private Financing of Long‑Term Care: Income, Savings and ...

5ECONOMIE ET STATISTIQUE / ECONOMICS AND STATISTICS N° 507‑508, 2019
Received on 6 June 2017, accepted after revisions on 18 May 2018
Private Financing of Long‑Term Care: Income, Savings and Reverse MortgagesCarole Bonnet*, Sandrine Juin** and Anne Laferrère***
Abstract – To what extent would older Europeans be able to pay for their long‑term care needs out of their income and assets if they had no access to informal care or public insurance? To answer this question, we build a microsimulation model and estimate the disability trajecto‑ries of those currently aged 65 or older in nine European countries using the Survey of Health, Ageing and Retirement in Europe (SHARE). We focus on the potential role of reverse mortgages in home equity release. According to the simulations, 57% of people 65 and over will experience disability. Conditional on need, care will be required for 4.4 years on average. Of those with no partner, 6% of dependent individuals could pay for their long‑term care out of their income alone, 22% if they used all their savings except their home. The proportion would reach 49% if they took out reverse mortgages on their main residence. However, one‑quarter would be able to finance less than 10% of their long‑term care expenses.
JEL Classification: J140, D140, I130, C530Keywords: long‑term care, housing, reverse mortgage, microsimulation
To cite this article: Bonnet, C., Juin, S. & Laferrère, A. (2019). Private Financing of Long‑Term Care: Income, Saving and Reverse Mortgages. Economie et Statistique / Economics and Statistics, 507‑508, 5–24. https://doi.org/10.24187/ecostat.2019.507d.1972
* French Institute for Demographic Studies (INED) ([email protected])** ERUDITE, Université Paris-Est Créteil and French Institute for Demographic Studies (INED) ([email protected])*** University Paris-Dauphine ([email protected])We are grateful to two anonymous reviewers for their comments. We also thank André Masson and Thomas Barnay for their advice, Alexandre Cazenave‑Lacroutz and Fanny Godet for sharing their Stata program on SHARE mortality. We are also grateful to Eric Bonsang, Joan Costa‑i‑Font, Jérôme Wittwer and to participants at the 5th SHARE Users Conference, the Labex OSE Rencontres d'Aussois, the 15th Conference on Pension, Insurance and Savings and various seminars (ERUDITE, Paris School of Economics, INED, MODAPA‑MEDIPS) for their comments.
Reminder:
The opinions and analyses in this article are those of the author(s) and do not necessarily reflect their institution’s or Insee’s views.

ECONOMIE ET STATISTIQUE / ECONOMICS AND STATISTICS N° 507-508, 20196
income, financial assets and home equity. We focus on the potential role of reverse mortgages in financing the cost of LTC. Regularly consi‑dered in the US and UK cases, the issue of reverse mortgages is less frequently addressed in the Continental European context. Some recent papers focus on the interest elderly people may have in this way of extracting income from housing wealth (Costa‑Font et al., 2010; Dillingh et al., 2017; Fornero et al., 2016), but empirical evidence on the possible implemen‑tation of such a product to finance LTC costs is still limited.1
Our contribution is threefold. First, using the longitudinal dimension of the Survey of Health, Ageing and Retirement in Europe (SHARE), we estimate a disability transition model, taking into account the effect of income and education in nine European countries. Second, relying on a dynamic microsimulation approach, we simulate the disability trajectories of the cohort of individuals aged 65 and older in 2013, in order to assess their expected lifetime risk of needing LTC. Rather than studying population totals, we are interested in seeing what happens to these individuals in their remaining lifetime. To our knowledge, no other studies estimate both the individual lifetime risk of disability and the associated cost of LTC in several European countries, while taking into account the effect of socioeconomic status. Finally, focusing on individuals who have no partner when they are dependent, we study their ability to pay for their LTC needs, assuming no public coverage and no informal care. We assess the role of housing in LTC financing by simulating the lump‑sum payments that could be extracted from reverse mortgages taken when becoming dependent. Since disability trajectories are simulated at the microeconomic level, we can study the dispersion across individuals in the ability to pay.
This article first presents a summary of the existing literature on LTC risk and financing, and describes reverse mortgage products. Then the data and methodology are described, followed by the results of the simulations of LTC risk and ability to pay, together with two alternative scenarios: the introduction of informal care and of public LTC coverage.
1. For France, Bérardier (2012) estimates that 25% of dependent people with severe needs have to pay out-of-pocket expenses that represent at least 40% of their individual resources.
I f care arrangements are kept constant, European Union public expenditures on
long‑term care (LTC) are predicted to increase from 1.6% of GDP in 2013 to 2.8% in 2060 (European Commission, 2015a). Sustaining LTC systems is a major challenge in a context of population ageing. The elderly will probably need to consider, at least to some extent, private financing arrangements for their LTC expenses. At first sight, an individual’s ability to pay appears to be low without public LTC cover‑age. The cost of LTC is generally higher than the average pension. The situation is unlikely to improve given that the public pension replace‑ment rate is projected to decrease by 12 percent‑age points between 2013 and 2060 (European Commission, 2015b). Moreover, even when public LTC insurance exists, out‑of‑pocket expenses may remain high (HCFEA, 2017; Muir, 2017) and represent a high proportion of individual incomes (Bérardier, 2012).1
In addition, the private LTC insurance market is generally small. Only 7% of LTC expendi‑tures are financed by private LTC insurance in the US, and less than 2% in other OECD countries (Colombo et al., 2011). This is partly explained by the unattractiveness of LTC insurance policies, poor financial knowledge among consumers, the long time horizon of the LTC risk, the low value put on consumption when dependent, and the existence of potential substitutes for private LTC insurance, such as family solidarity and social assistance (Brown & Finkelstein, 2009; Fontaine & Zerrar, 2013).
Another reason for the low demand for insur‑ance is that individuals may plan to use their savings, and particularly their real estate, to finance the risk of LTC expenditures. Davidoff (2010; 2009) shows theoretically that home equity, if liquidated in the event of LTC needs, may substitute for LTC insurance. Using French data, Fontaine et al. (2014) find that the probability of purchasing LTC insurance is 4 to 7 percentage points lower for homeowners living in a home worth over 300,000 euros than for non‑owners. Costa‑Font & Rovira‑Forns (2008) find that housing tenure reduces the probability of insurance demand in Catalonia (Spain). This suggests that homeownership may provide “self‑insurance” for LTC (Laferrère, 2012), all the more since housing is the main part of elderly wealth.
This paper investigates the extent to which the European elderly are able to pay for their long‑term care needs, on the basis of their

ECONOMIE ET STATISTIQUE / ECONOMICS AND STATISTICS N° 507-508, 2019 7
Private Financing of Long‑Term Care: Income, Savings and Reverse Mortgages
Literature Review
LTC Risk and LTC Cost
While many studies have estimated the risk of nursing home utilization (see, for example, Friedberg et al., 2014, for a summary), the literature on the lifetime risk of disability is relatively scarce. We summarize below the existing results from the last decade on this topic (see Kemper et al., 2005 for some older references). Most models have used US data from the 1980s and the 1990s (Brown & Finkelstein, 2004, 2008; Crimmins et al., 2009; Fong et al., 2013; Kemper et al., 2005) or UK data (Forder & Fernández, 2009; Rickayzen & Walsh, 2002) and make mortality and disa‑bility transitions depend only on age and sex. We note three exceptions: Duée & Rebillard (2006), Marbot & Roy (2015) and Atella et al. (2017). The two first studies use French data and include the effect of education and children in their model. The latter use European data (SHARE) and build a comprehensive micro‑simulation model that takes into account the effects of education, marital status and many health factors. According to this literature, the probability of needing long‑term care ranges between 29% and 58% for men and between 51% and 79% for women. The LTC duration (if > 0) varies between 2.2 and 3.7 years for men and between 3.7 and 4.7 years for women. This variability is partially due to the different definitions of LTC needs. In this paper, we use recent European data from SHARE and take into account the impact of both income and education on mortality and LTC needs. As social inequalities in health remain high (Cambois et al., 2016; Mackenbach, 2012), it is important to take them into account when studying the ability of individuals to finance their disability.
Assessing the cost of LTC is difficult, not least because it is shared between public systems (which differ across countries), elderly indi‑viduals and their families. In the US, the national median annual cost is $47,934 for homemaker services, $49,192 for home health aide, $18,200 for day‑care facilities, $45,000 for assisted living facilities and $97,455 for a private room in a nursing home (Genworth Cost of Care Survey, 2017). Kemper et al. (2005), using microsimulation on US data, find that the average value of lifetime LTC expenditures is $47,000. They stress that 42% of people turning 65 in 2005 will have a zero cost, while 16% will incur expenses of over $100,000. Hussem et al.
(2016) find on Dutch data that the aggregated LTC cost is $73,817.2 It is higher for low‑ income households and single women. According to Forder & Fernández (2009), in the UK, the mean lifetime expected cost of LTC is $53,506 for females and $29,531 for males. Given that no comparable information on LTC cost is available for the nine countries studied in this paper, we build our own measure of LTC cost based on the restrictions individuals declare in basic activities of daily living and on labour costs in the different countries.
The role of Income and Assets in LTC Financing
The literature on LTC financing has mainly investigated the role of public coverage and of private long‑term care insurance. To the best of our knowledge, very few papers have looked at the extent to which older people’s own economic resources could be used to finance LTC. Hussem et al. (2016) stress that, if the Dutch had to pay for LTC up to a limit of 100% of their private income, they could cover between 47% and 64% of the costs. They do not assess the role of financial and housing wealth.
Unlocking home equity through reverse mort‑gages (RMs, see Box) may help to support old‑age consumption. The literature first focused on the general economic situation of the elderly, and did not specifically address the issue of LTC needs. The effect of RMs seems to be mainly restricted to the oldest age‑groups and is higher for single individuals than for couples (Hancook, 1998 on UK data; Sinai & Souleles, 2007; Venti & Wise, 1991 on US data). According to Venti & Wise (1991), reverse annuity mortgage payments would increase the income of low‑income couples aged 85 and over by 35% and would double the income of low‑income single homeowners. Ong (2008) finds a bigger effect in Australia (+71% on average for homeowners aged 65 and over). In Europe, if homeowners aged 65 and over converted 100% of their housing wealth at a 7% interest rate, it would decrease their risk of poverty by 23% in Spain, 18% in Belgium, 13% in Italy and 11% in France. The effect is less than 4% in Sweden, Austria and the Netherlands (Moscarola et al., 2015).
2. In this section, euros and pounds have been converted to US dollars.
ECONOMIE ET STATISTIQUE / ECONOMICS AND STATISTICS N° 507-508, 20198
The issue of how RMs may finance LTC needs has emerged more recently in the literature. Masson (2015) suggests that a specific reverse mortgage product for dependent individuals may help finance LTC costs and support “ageing in place” in France (see also Stucki, 2005, for a discussion in the US context). Dependent individuals would provide a medical certificate and, since they have a shorter life expectancy, obtain a lower interest rate than non‑dependent persons. In the UK, individuals can already borrow a higher amount if they have certain medical conditions or lifestyle factors affecting their health. RMs could be used to finance home care, which would reduce the burden of informal caregivers.3 A limiting factor may be that, with current RM products, the borrower generally needs to repay the loan if she moves perma‑nently to a nursing home.
Empirical descriptive studies confirm that home equity can significantly improve the ability of dependent individuals to pay for their LTC needs. Stucki (2006) stresses that US home‑owners who have restrictions in basic activities of daily living have a median home equity of $75,000. An RM would provide a lump‑sum payment of $30,000 to $49,000. However, home equity would generally cover less than two years of care. Mayhew et al. (2010) study whether households aged 65 and over in the
UK are able to pay for LTC. They find that 400,000 out of 6.5 million can finance more than one year of LTC out of their income. The number increases to 3 million if savings are included and to 4.6 million if housing assets are added. A total of 4.2 million households could afford care for more than three years. However, these studies are cross‑sectional and do not allow assessing the lifetime cost of LTC. They also do not take into account potential differences in the risk of disability according to socioeconomic status. If low‑income and poorly educated individuals are more likely to face periods of LTC needs, it has important implications in terms of social inequalities and public policies. Indeed, homeownership and housing equity are negatively related to the risk of disability, LTC expenditures and institutionalization (Bockarjova et al., 2014; Costa‑Font, 2008; Rouwendal & Thomese, 2013). Thus, RM products may not be adequate for those with the highest needs.3
3. See Lilly et al. (2007) for a review on the consequences of informal care on the labour market. For the effect on caregiver’s health, see, for instance, Coe & Van Houtven (2009).
Box – Description of Reverse Mortgage Products
Reverse mortgages (RM, called “lifetime mortgages” in the UK) are credit operations used to unlock home equity. Contrary to home reversions (such as French “sales en viager”), RM do not imply any transfer of ownership. Homeowners (aged 62+ for the US Home Equity Conversion Mortgages, 55+ for the UK Aviva lifetime mortgages, 65+ in France) borrow against all or part of the value of their homes. The main difference with regular re‑mortgaging is that the borrower does not need to make any repayments as long as she lives in the home. Contrary to traditional mortgages, interest is added to the loan balance, and the debt grows over time. When the (last) borrower dies, sells the house or permanently moves out, the RM is closed, and the loan is repaid. The heirs can reimburse the credit to the lender and keep the house. Alternatively, they can choose to sell it and, if the sale price is higher than the debt, keep the difference. The longevity risk and the risk on housing prices are transferred to the len‑der. The borrower’s liability is limited to the value of the property at the end of the contract. If the loan value exceeds the sale price of the home, the lender is not allowed to seize other assets. RMs do not require
medical or income tests and thus are accessible to poor‑health and low‑income individuals who must only have the financial resources to continue paying property taxes and insurance. While a private LTC insurance has to be purchased relatively early (before the disability occurs), RMs can be purchased at very old age, regardless of health status. Thus, RMs do not require anticipating the risk of LTC expenditures.
RM products have existed for many years in the US and the UK and have been gaining increasing attention in Europe. Overall, the RM market is small, even in the US, but it seems to be increasing. In the US, in 2010, 2 to 3% of eligible homeowners had an RM (Consumer Financial Protection Bureau, 2012). With a market share of more than 90%, the Home Equity Conversion Mortgage (HECM), insured by the Federal Housing Administration, dominates the US market (Shan, 2011). The number of new HECM loans increased from less than 7,000 in 2000 to more than 110,000 in 2009. After the subprime mortgage crisis, it decreased to about 55,000 in 2012. In Europe, the RM market represented 3.31 billion euros in 2007 – less than 0.1% of the ordinary mortgage market.
ECONOMIE ET STATISTIQUE / ECONOMICS AND STATISTICS N° 507-508, 2019 9
Private Financing of Long‑Term Care: Income, Savings and Reverse Mortgages
Data
This paper uses data from SHARE Waves 1 to 5.4 SHARE is a longitudinal and multi disciplinary survey on health, income and wealth, and social and family networks. It provides information on individuals aged 50 and older (interviewed every two years) in 20 European countries, and on their partners. Information on limitations with instrumental and basic activities of daily living allows measuring the risk of needing LTC. Respondents are followed when they enter a nursing home.5
We focus on those aged 65 and over in Wave 5 (2013) in nine countries: Austria, Germany, Sweden, the Netherlands, Spain, Italy, France, Denmark and Belgium (23,769 observations). Hence, this work studies specific cohorts, born before 1948, which are not representative of future cohorts or of the general elderly popu‑lation. Similarly, the countries studied are not representative of Europe as a whole (we selected the countries observed since the first wave; thus Eastern countries are not included). Table 1 provides some descriptive statistics on the sample.
Variables of Interest
Dependent persons in Wave 5 are identified using restrictions in basic activities of daily living (ADLs). The concept of “dependence” is hard to define, and various measures and admin‑istrative definitions are used to assess LTC needs and eligibility for public coverage. In this paper, we consider six ADLs (dressing, walking across a room, bathing or showering, eating, getting in/out of bed and using the toilet) and assume that those who report difficulties with at least two activities are in need of LTC.6 This minimum of two ADLs is the eligibility threshold for public LTC coverage used in France, Italy and the Czech Republic7 (Carrino & Orso, 2014). In the US, individuals must also need substantial assis‑tance in performing at least two ADLs to trigger Medicaid and private long‑term care insurance benefits (Brown & Finkelstein, 2007; Fong et al., 2013). On average, 10% of those aged 65 and over were dependent in 2013 (Table 1). The proportion was higher in Southern Europe (14% in Spain and 12% in Italy) than in Northern Europe (4% in Sweden, 5% in the Netherlands and 6% in Denmark).
The annual household income is net of taxes and contributions, and includes earnings from (self‑)
employment, all types of pensions, disability insurances, regular life insurance payments, interests and dividends, real‑estate income, and all public benefits, housing allowances and poverty relief programmes. As the objective of the paper is to assess the ability to pay for LTC needs assuming no public coverage, we exclude public LTC insurance 4567payments.8 We compute an adjusted household income by dividing the total income by the weighted number of household members (OECD modified scale).9
The survey also provides information on household financial assets net of financial liabil‑ities and on net housing assets. The net home value H – home equity adjusted for percentage owned, less the value of mortgages – is the key variable used to simulate the equity that could be released through RMs.10 We also take into account the ownership of other real estate (secondary homes, holiday homes, land or
4. DOIs: https://doi.org/10.6103/SHARE.w1.260, https://doi.org/10.6103/SHARE.w2.260, https://doi.org/10.6103/SHARE.w3.100, https://doi.org/10.6103/SHARE.w4.111, https://doi.org/10.6103/SHARE.w5.100. See Börsch-Supan et al. (2013) for methodological details. The SHARE data collection has been primarily funded by the European Commission through FP5 (QLK6-CT-2001-00360), FP6 (SHARE-I3: RII-CT-2006-062193, COMPARE: CIT5-CT-2005-028857, SHARELIFE: CIT4-CT-2006-028812) and FP7 (SHARE-PREP: N°211909, SHARE-LEAP: N°227822, SHARE M4: N°261982). Additional funding from the German Ministry of Education and Research, the Max Planck Society for the Advancement of Science, the US National Institute on Aging (U01_AG09740-13S2, P01_AG005842, P01_AG08291, P30_AG12815, R21_AG025169, Y1-AG-4553-01, IAG_BSR06-11, OGHA_04-064, HHSN271201300071C) and from various national funding sources is gratefully acknowledged (see www.share- project.org).5. When they die, an end-of-life interview is conducted with a relative, friend or neighbour. It should be stressed that, as with all surveys, there is some attrition when people change homes. This is also likely to be the case when the elderly enter a nursing home.6. The question is the following: “Please tell me if you have any diffi‑culty with these [activities] because of a physical, mental, emotional or memory problem. Again, exclude any difficulties you expect to last less than three months”.7. Other European systems use a mix of restrictions in ADLs and instru-mental activities of daily living (Austria, Germany), or put higher priority on specific limitations such as washing and dressing (Belgium) or eating and using the toilet (Spain).8. In the survey, only 271 individuals reported public LTC insurance payments.9. This scale assigns a value of 1.0 to the household head, 0.5 to each additional adult member or child aged 14 and over, and 0.3 to each youn-ger child. We use the adjusted household income for two reasons. First, it facilitates the comparison of living standards between households of dif-ferent sizes. Second, in the simulations, we assume that income remains unchanged, even when the individual loses her spouse (we assume that the survivors’ pensions roughly preserve her living standards). This assumption is easier to justify for adjusted household income than for household income.10. Homeowners are asked the following: “In your opinion, how much would you receive if you sold your property today?” We adjust this amount for the percentage owned by the respondent and her spouse (100% in most cases) and mortgages on the main residence. Around 10% of owners aged 65 and over have a mortgage, with an average value of 58,000 euros.Homeowners tend to overestimate the value of their homes. Venti & Wise (2001) focus on recent movers in the US and compare sales prices to the respondents’ assessments of home value. They find an overestimation of 15 to 20% based on a comparison of means and of 6 to 7% based on medians. Benítez-Silva et al. (2015) find an overestimation bias of about 8%. In the Netherlands, the median homeowner overestimates housing prices by 13% (Van der Cruijsen et al., 2014). It may lead to a slight over-estimation of the ability of individuals to finance their LTC expenditures.

ECONOMIE ET STATISTIQUE / ECONOMICS AND STATISTICS N° 507-508, 201910
forestry) that can be sold to finance long‑term care needs.
Incomes and assets differ widely across the nine European countries (cf. Table 1). The average adjusted household annual income ranges between €10,000 in Spain and €38,000 in Belgium; the average value of net finan‑cial assets varies from €12,000 in Spain to €114,000 in Denmark, and the proportion of homeowners goes from 49% in Austria to 92% in Spain. Among homeowners, net home value is €241,000, on average. According to these descriptive statistics, reverse mortgages may help pay for long‑term care in Spain and Italy, where income and financial wealth are low, but where homeownership rates are particu‑larly high. In contrast, reverse mortgages will probably be less attractive in Sweden and the Netherlands, where incomes and assets are high, and homeownership is lower.
Methodology
Transition Model
Using all five waves of SHARE, we estimate three separate models using logistic regres‑sions: one for mortality transitions between two survey waves (31,203 observations), one for the probability of becoming dependent (17,803 observations) and one for the probability of recovery (1,248 observations). Tables C1‑1 and C1‑2 in the Online complement C1 provides further details on observed transitions and on sample sizes (link to the Online complements at the end of the article). The explanatory variables are age dummies (with cut‑offs at age 75 and 85), sex, quintiles of income, levels of education, and country dummies. In the mortality model, we also control for the disability status in the initial wave. Age dummies account for the nonlinear relation‑ship between age, mortality and disability.11
Mortality Transitions
The analysis focuses on individuals whose disability status (dependent or not) is known in the initial wave and for whom life status is observed two years later. The probability of dying is 7.2 p.p. higher for dependent indivi‑duals than for non‑dependent ones (see Table 2). Men and older individuals face a higher risk of death, while a higher income and a higher level of education are associated with a lower risk. The last variable in the table controls for the duration between the two interviews.
Comparisons of the estimated probabilities of death by country, sex and age with life tables from the Human Mortality Database show that SHARE underestimates mortality. This is linked both to the fact that individuals in institutions are not initially sampled in the survey in most countries, and to panel attrition. A correction factor by country, sex and age is computed to adjust SHARE estimated probabilities to life tables in the microsimulation 11model.12
Disability Transitions
The incidence of disability is estimated on non‑dependent individuals in the initial wave (< 2 ADLs), who survive between the two waves and whose disability status is known in the final wave.13 The probability of recovering from disa‑bility is estimated on those who are dependent (two or more ADLs) in the initial wave, are still alive two years later and whose number of ADL limitations is known.14 As defined above, an individual becomes dependent if she reports at least two ADL limitations. To recover from disability, a person must report no difficulty in performing basic activities of daily living (total recovery). We make this choice for three reasons. First, since disability is not easily reversible, we do not want to overestimate recoveries. Indeed, Pérès et al. (2005) build a dynamic disablement process with 4 states: independence, mild disa‑bility (mobility problems), moderate disability, and severe disability (ADLs). They consider that direct transitions between two non‑consecutive states do not occur. Cambois & Lièvre (2007) also stress that the probability of moving from ADL restrictions to independence is very low (around 2%). Most of the time, even when their health improves, former highly dependent indi‑viduals still have functional, IADL or mobility limitations. Thus, when a person reports one ADL, we assume that she is still dependent. Secondly, people may adapt to their problems, which may modify the way they answer to the questions. Due to hedonic adaptation, people with disability report approximately the same levels of happiness and life satisfaction than healthy individuals (Albrecht & Devlieger, 1999; Oswald & Powdthavee, 2008; Pagán‑Rodríguez, 2010; Wu, 2001). Furthermore, dependent
11. Setting the thresholds to age 80 or 90 does not change the picture.12. Details not shown, available from the authors upon request.13. We do not simulate different levels of disability for technical reasons: since we have no information on the degree of difficulty in the different ADLs, it is difficult to build a reliable score. Simulating different levels of dependence would also reduce the subsample sizes in the transition models.14. It should be kept in mind that this disability transition model may be biased due to attrition.

ECONOMIE ET STATISTIQUE / ECONOMICS AND STATISTICS N° 507-508, 2019 11
Private Financing of Long‑Term Care: Income, Savings and Reverse Mortgages
Table
1De
scrip
tive S
tatis
tics o
n th
e Sam
ple
Mean
or pr
opor
tion (
stand
ard d
eviat
ion) M
edian
Total
Austr
iaGe
rman
ySw
eden
Nethe
r land
sSp
ainIta
lyFr
ance
Denm
ark
Belgi
umAg
e75
.2 (7
.4)74
.9 (7
.3)75
.1 (6
.9)74
.4 (7
.3)74
.2 (7
.4)75
.6 (7
.6)75
.0 (7
.4)75
.5 (7
.7)73
.9 (7
.3)75
.2 (7
.5)Fe
male
0.572
(0
.495)
0.577
(0
.494)
0.562
(0
.496)
0.553
(0
.497)
0.544
(0
.498)
0.579
(0
.494)
0.573
(0
.495)
0.590
(0
.492)
0.540
(0
.499)
0.572
(0
.495)
Coup
le0.6
39
(0.48
0)0.5
68
(0.49
5)0.6
76
(0.46
8)0.6
83
(0.46
5)0.6
60
(0.47
4)0.6
05
(0.48
9)0.6
43
(0.47
9)0.5
95
(0.49
1)0.6
82
(0.46
6)0.6
55
(0.47
5)At
leas
t one
child
0.884
(0
.321)
0.880
(0
.325)
0.883
(0
.322)
0.925
(0
.264)
0.911
(0
.285)
0.888
(0
.315)
0.863
(0
.344)
0.888
(0
.316)
0.924
(0
.265)
0.888
(0
.316)
Leve
l of e
duca
tion
‑ Pre
‑prim
ary/p
rimar
y0.3
69
(0.48
3)0.1
79
(0.38
3)0.0
25
(0.15
6)0.3
23
(0.46
8)0.1
73
(0.37
8)0.7
41
(0.43
8)0.6
01
(0.49
0)0.4
54
(0.49
8)0.1
95
(0.39
7)0.2
61
(0.43
9)‑ S
econ
dary/
post‑
seco
ndar
y 0.4
59
(0.49
8)0.5
82
(0.49
3)0.7
13
(0.45
2)0.4
18
(0.49
3)0.6
07
(0.48
9)0.1
94
(0.39
6)0.3
53
(0.47
8)0.3
50
(0.47
7)0.4
74
(0.49
9)0.4
70
(0.49
9)‑ T
ertia
ry0.1
72
(0.37
7)0.2
39
(0.42
6)0.2
62
(0.44
0)0.2
59
(0.43
8)0.2
20
(0.41
5)0.0
65
(0.24
7)0.0
46
(0.21
0)0.1
96
(0.39
7)0.3
31
(0.47
1)0.2
69
(0.44
3)Di
sabil
ity st
atus
2+ A
DLs (
depe
nden
t)0.1
01
(0.30
1)0.0
90
(0.28
6)0.0
98
(0.29
7)0.0
43
(0.20
3)0.0
51
(0.22
1)0.1
37
(0.34
4)0.1
19
(0.32
3)0.0
82
(0.27
5)0.0
60
(0.23
8)0.1
18
(0.32
3)Re
sour
ces (
in eu
ros)
Adjus
ted an
nual
hous
ehold
inco
me19
,996
(59,8
75)
20,78
9 (1
4,101
)20
,860
(15,3
48)
32,29
3 (1
8,962
)25
,009
(28,0
27)
10,12
4 (8
,062)
12,24
9 (1
5,849
)27
,725
(128
,814)
25,08
3 (1
4,680
)37
,990
(49,6
69)
15,0
8218
,251
17,4
3027
,688
20,11
88,
468
10,3
2319
,110
21,1
0620
,714
Value
of ho
useh
old ne
t fina
ncial
asse
ts44
,548
(139
,807)
22,64
2 (5
4,332
)35
,471
(77,7
80)
94,53
9 (1
38,87
0)10
9,887
(2
66,43
8)12
,042
(25,8
11)
14,09
0 (3
2,111
)80
,310
(236
,479)
113,6
27
(187
,053)
89,35
9 (1
45,58
2)9,
000
6,22
311
,500
46,1
4124
,000
2,58
42,
881
17,3
0040
,225
35,0
00Ow
ners
(main
resid
ence
)0.7
24
(0.44
7)0.4
90
(0.50
0)0.5
82
(0.49
3)0.5
27
(0.49
9)0.5
89
(0.49
2)0.9
21
(0.27
0)0.8
17
(0.38
7)0.7
79
(0.41
5)0.6
72
(0.47
0)0.7
42
(0.43
8)Ne
t valu
e of m
ain re
siden
ce (in
euro
s) (if
> 0)
241,2
20
(246
,635)
284,2
47
(234
,070)
224,2
62
(165
,752)
236,7
96
(220
,864)
242,8
56
(140
,998)
217,0
23
(452
,308)
231,8
13
(152
,047)
282,1
78
(191
,418)
212,9
44
(170
,049)
286,7
89
(129
,309)
200,
000
200,
000
195,
000
173,
028
215,
000
120,
000
200,
000
240,
000
160,
901
250,
000
Owne
rs of
other
real
estat
e or la
nd0.1
79
(0.38
3)0.1
31
(0.33
8)0.1
21
(0.32
7)0.3
07
(0.46
1)0.0
63
(0.24
3)0.2
23
(0.41
6)0.1
71
(0.37
7)0.2
45
(0.43
0)0.2
26
(0.41
8)0.1
93
(0.39
5)Va
lue of
othe
r rea
l esta
te/lan
d (in
euro
s) (if
> 0)
237,5
11
(365
,749)
246,0
54
(297
,720)
302,6
79
(406
,699)
224,9
19
(258
,169)
216,8
20
(228
,787)
245,3
00
(672
,413)
201,0
16
(161
,563)
219,7
11
(159
,876)
203,7
10
(183
,796)
243,4
49
(211
,429)
150,
000
150,
000
140,
000
115,
352
150,
000
110,
000
150,
000
199,
537
134,
084
200,
000
Numb
er of
obse
rvatio
ns23
,769
2,417
2,624
2,907
2,206
3,717
2,700
2,435
1,986
2,777
Note:
The
stati
stics
are w
eighte
d usin
g cali
brate
d ind
ividu
al we
ights.
Indiv
iduals
aged
65 an
d ove
r.So
urce
s: SH
ARE
data,
wav
e 5.

ECONOMIE ET STATISTIQUE / ECONOMICS AND STATISTICS N° 507-508, 201912
individuals may adapt their home, which may, in turn, change their report of ADLs. For instance, Fänge & Iwarsson (2005) find that dependence in “bathing” decreases after adaptations in bathroom facilities. Thirdly, we assume that dependent individuals do not reduce their demand of LTC services when their disability status improves.
The probability of becoming dependent is higher for women and increases with age (Table 2). Low‑income and poorly educated indivi‑duals face a higher risk of needing long‑term care, which is related to their poorer health.
For dependent individuals, the probability of recovery is mainly explained by age.
Microsimulation Approach
The disability transition model allows for esti‑mating individual probabilities of transitions as a function of age, sex, income, level of education, country and initial disability status. We then simulate disability transitions over a two‑year period by comparing the estimated probabilities with a random variable that follows a conti‑nuous uniform distribution on [0,1]. The process
Table 2Transition Probabilities between Two Waves
Probability of dying Becoming dependent (2+ ADLs)
Recovery (No ADL)
Age
[65, 75] ‑ ‑ ‑
[76, 85] 0.045*** (0.003) 0.053*** (0.004) ‑0.121*** (0.024)
Over 85 years old 0.091*** (0.004) 0.105*** (0.006) ‑0.201*** (0.034)
Female ‑0.028*** (0.003) 0.013*** (0.004) 0.006 (0.024)
Dependent (2+ ADLs) 0.072*** (0.003) ‑ ‑
Adjusted household income (country level)
1st quintile ‑ ‑ ‑
2nd quintile ‑0.007* (0.004) ‑0.008 (0.005) 0.045 (0.032)
3rd quintile ‑0.008** (0.004) ‑0.015*** (0.005) 0.012 (0.036)
4th quintile ‑0.007* (0.004) ‑0.023*** (0.005) 0.024 (0.036)
5th quintile ‑0.012*** (0.004) ‑0.028*** (0.006) 0.026 (0.040)
Level of education
Pre‑primary/primary ‑ ‑ ‑
Secondary/post‑secondary ‑0.007** (0.003) ‑0.018*** (0.004) 0.057* (0.030)
Tertiary ‑0.011*** (0.004) ‑0.030*** (0.007) 0.035 (0.044)
Country
Austria ‑ ‑ ‑
Germany ‑0.003 (0.006) 0.012 (0.008) ‑0.038 (0.054)
Sweden ‑0.004 (0.005) ‑0.044*** (0.009) 0.035 (0.055)
Netherlands ‑0.004 (0.006) ‑0.037*** (0.009) ‑0.084 (0.069)
Spain 0.004 (0.005) 0.008 (0.007) 0.060 (0.042)
Italy ‑0.004 (0.005) 0.002 (0.007) 0.021 (0.047)
France ‑0.012** (0.005) ‑0.022*** (0.007) 0.051 (0.045)
Denmark 0.009* (0.006) ‑0.023*** (0.008) ‑0.127* (0.070)
Belgium ‑0.016*** (0.005) ‑0.006 (0.006) ‑0.076* (0.045)
Time between the two waves ‑ 24 months 0.002*** (0.000) 0.000 (0.000) 0.007** (0.003)
Number of observations 31,203 17,803 1,248
Notes: Average marginal effects. Standard errors in parentheses. *: significant at the 10% level; **: 5% level; ***: 1% level. 1st column: individuals aged 65 and over and whose status (dependent or non‑dependent) is known in the initial wave. 2nd column: individuals aged 65 and over and non‑dependent (< 2 ADLs) in the initial wave. 3rd column: individuals aged 65 and over and dependent (2+ ADLs) in the initial wave.Sources: SHARE, waves 1, 2, 4, 5 (and wave 3 for mortality transitions).

ECONOMIE ET STATISTIQUE / ECONOMICS AND STATISTICS N° 507-508, 2019 13
Private Financing of Long‑Term Care: Income, Savings and Reverse Mortgages
is repeated to simulate disability trajectories from 2013 until 2051. Centenarians are assumed to die with probability 1 so that all individuals aged 65 or more observed in 2013 are dead by 2051 (Diagram). The disability transition model assumes no change in disability rates and mortality trends during the simulation period. Since simulations rely on random numbers and may be affected by stochastic variability, the model is run ten times to obtain more stable and robust results. The results present the mean LTC risk and the mean ability to pay for LTC needs across these ten replications of simulations. The study of the distribution of ability to pay focuses on the tenth simulation (other simulations give very similar results).
LTC Cost
We compute the average cost of LTC at the country level. We focus on dependent indi‑viduals (two or more ADLs) in Wave 5 and calculate how many hours of care per week they need using a conversion table relating restrictions in basic/instrumental activities of daily living to home‑help needs. The time of assistance needed for each activity of daily living is assumed to be the same in each
country. It is a kind of “universal” need. Online complement C1 (Table C1‑3) summarizes the assumptions, adapted from Pampalon et al. (1991), and provides a comparison with the assessment of needs used in Austrian and German long‑term care systems (Carrino & Orso, 2014). We find that, on average, dependent individuals need 28.4 hours of care per week in the nine European countries studied. This is in line with the 31.5 hours of weekly care (from professional workers and relatives) reported by beneficiaries of public LTC coverage in France (Petite & Weber, 2006).15 The need for care is then evaluated in monetary terms by applying the hourly labour cost in the “Accommodation and food services” sector (Nace Rev. 2 Section I) in each country (Eurostat data, 2012). We chose this sector because LTC uses mostly manual and low‑skilled labour and little technology. The annual cost of LTC ranges between €20,383 in Spain and €42,096 in Denmark (Table 3). This cost is generally higher than the average
15. It is also in line with Muir (2017), who stresses that dependent per-sons require between 6 and 41 hours of care per week depending on their degree of disability.
DiagramDescription of the Microsimulation Process
Individual , alive in year ( = 2013, … , 2049)- Estimation of the probability of dying between years and + 2 (× correction factor)Variables: disability status (dependent / non-dependent), age, sex, income, education, country- Estimation of the probability of becoming dependent if is non-dependent- Estimation of the probability of recovery if is dependent- Generation of 2 random variables ~ 0,1 1, 2
1 >and < 100
non-dependent in- remains non-dependentif 2 > ,
- becomes dependent atthe end of the transition, in
+ 2 if 2 ≤
We repeat the process.
dependent in - remains dependent if
2 >- recovers at the end of thetransition, in + 2 if
2 ≤
We repeat the process.
1 ≤or ≥ 100
dies at the end of thetransition, in + 2( + 2 = 2015, … , 2051)

ECONOMIE ET STATISTIQUE / ECONOMICS AND STATISTICS N° 507-508, 201914
annual income of individuals aged 65 and over in SHARE (cf. Table 1).16
We assume that there is no public LTC insur‑ance and no informal care provided by relatives, friends or neighbours. In other words, dependent individuals have to bear the full cost of LTC. This is a kind of “what if” scenario, in a context of an uncertain evolution of care supply from children. The decline in fertility, the increase in the geographical distance between family members, the rising participation of women in the labour market, and the postponement of retirement age may modify informal care supply. Some simulations with public coverage and family care are presented in Online comple‑ment C5.
Simulation of Reverse Mortgages
People are assumed to take out a reverse mort‑gage as soon as they become dependent, i.e. at age 85 on average.17 They can choose between different payment options, mixing lump‑sum payments and annuities. Here, we simulate a single lump‑sum payment, received at the ori gination of the RM contract. This is the most popular option (Consumer Financial Protection Bureau, 2012). We assume that the contract ends with the death of the borrower.
The maximum lump‑sum amount L that dependent individuals can receive is determined by the general rule that the expected sale value of the house should not exceed the accumulated debt at the time of the borrower’s death (equa‑tion (1)). The lump‑sum payment increases
with the net value of the main residence (the home equity) H and the expected growth rate of housing prices g, and decreases with the interest rate of the reverse mortgage m and the borro‑wer’s remaining life expectancy e. Indeed, older individuals will repay the loan sooner; hence, less interest will be accumulated, allowing a higher loan or, alternatively, a lower interest rate.1617
L H
g
mm g
e
e= ×+( )+( )
>1
1,� � (1)
We assume that the lenders do not adjust mortality to a dependent population, but rather determine e from the life tables of the Human Mortality Database (by age in each country). This assumption means that the amount lent will be lower than if the true life expectancy of dependent individuals were used. In our simu‑lations, their life expectancy is on average 15% lower than that predicted by life tables for the general population. Moreover, the lender is not allowed to distinguish between male and female life expectancy because, since 2012, unisex pricing is compulsory (Court of Justice of the European Union, judgement of March 1, 2011).
We assume that people borrow on 100% of the home value and that the growth rate
16. We may overestimate the LTC cost because we have no information on the degree of restriction in activities of daily living and assume that all individuals need comprehensive care.17. In fact, individuals may recover from disability (in particular at younger ages) and will probably use reverse mortgages only when they are sure that their health will continue to deteriorate. To simplify the analysis, we consider that individuals take a reverse mortgage during their first period of disability.
Table 3Average LTC Needs and LTC Costs in Each Country
Hourly labour cost in accommodation and food services (€) Average annual cost of LTC
Austria 16.8 24,815
Germany 16.6 24,519
Sweden 25.3 37,369
Netherlands 18.2 26,882
Spain 13.8 20,383
Italy 18.0 26,587
France 23.0 33,972
Denmark 28.5 42,096
Belgium 21.3 31,461
Notes: Weighted statistics. Individuals aged 65+ and dependent (2+ ADLs) in wave 5.Sources: SHARE, wave 5 and Eurostat data (2012).
ECONOMIE ET STATISTIQUE / ECONOMICS AND STATISTICS N° 507-508, 2019 15
Private Financing of Long‑Term Care: Income, Savings and Reverse Mortgages
of housing prices g is null. The reverse mortgage interest rate m is set at 8% and includes all fees (mortgage insurance premium, origination fees, closing costs and servicing fees). An 8% interest rate is consistent with rates observed in the UK, the US and on French markets, and with the values used in the previous literature (Bishop & Shan, 2008; Hancook, 1998; Moscarola et al., 2015; Ong, 2008; Venti & Wise, 1991).18 These high interest rates may be explained by the small size of the market and by the fact that the lender faces multiple risks: a longevity risk, an interest rate risk and a risk on housing prices. Online complement C4 tests the sensitivity of the results to changes in the interest rates and life tables used by the bank and to changes in the growth rate of housing prices.
To illustrate equation (1), consider a French owner of a €200,000 house who becomes dependent at age 85. Her expected life expec‑tancy is 7.03 years, not taking into account the fact that she is dependent. If the lender fixes the RM annual interest rate at 8%, she will receive a capital of €116,429.
Measure of Ability to Pay for LTC Needs
To study the ability to pay for LTC needs, we assume that incomes and assets are used by decreasing order of liquidity. First, only the income minus food consumption, annual rents and other home‑related expenditures (variable I) is used. Then, net financial assets F are depleted, and real estate RE other than the main residence is sold. When financial assets are used, interests and dividends from financial investments f are deducted from income. Similarly, the rental income r is deducted when real estate is used. Finally, the lump‑sum reverse mortgage payment L is taken into account. The ability to pay for D years of disability is based on the comparison of income, assets and annual LTC costs C at the time when individuals become dependent (Table C1‑4 in Online complement C1).
The analysis of the ability to pay for LTC focuses on dependent elderly people who have no partner/spouse when they become dependent. The reader should keep in mind that this subsample is not representative of the whole population of dependent people. We made this choice for three reasons. First, the assumption that there is no informal care is more credible for them. Second, taking an RM is easier for single individuals. They are more likely than couples to
take out reverse mortgages. In the US, in the late 2000s, only 37% of the borrowers were couples (Consumer Financial Protection Bureau, 2012). The main reason is that people want to leave the home to their surviving spouse. RMs are also less advantageous for couples given that the bank considers the age of the youngest partner. Finally, including dependent individuals in a relationship would require some assumptions on the distribution of assets within the couple, which is not trivial. 18
A difficulty is that incomes and assets are known only in Wave 5. Their value when individuals become dependent depends on many factors, such as the evolution of inflation, pension index‑ation rules, interest rates, housing prices and life histories. We make simplifying assumptions. First, we assume that annual LTC costs do not vary during the simulation period (2013‑2051). Second, the adjusted household income remains unchanged, even when the individual loses her spouse (the survivors’ pensions roughly preserve her living standards). Finally, after the death of one’s spouse, financial and housing assets do not change if the individual has no children, and are divided by two if there are children.19
Results
Long‑Term Care Risk
According to our model, 57% of those aged 65 or older in 2013 will experience at least one period of LTC needs and, for them, the average number of years with disability is 4.4 (Table 4). The probability of needing LTC is higher for women (66%) than for men (46%), and women face longer periods of disability, 4.7 years on average compared to 3.8 for men. These results are consistent with previous find‑ings. Socioeconomic status plays an important role. In the bottom income quintile, 64% of individuals are expected to become dependent, while the proportion is only 49% among the richest. Similarly, poorly educated individuals have a 65% risk of needing LTC as compared to 45% for those who have completed tertiary education. It suggests that social inequalities
18. In the UK (Aviva lifetime mortgages), the annual interest rate was 7.19% in September 2015. In the US, the expected interest rate of HECMs has decreased from 9.8% in 1990 to 4.9% in 2012, in line with the decline of the ten-year Treasury rate. The same trend is observed in France. The interest rate fixed by Crédit Foncier has decreased from 8% in 2007 to 4.8% more recently (Ogg, 2012).19. We thus simplify inheritance laws and do not account for differences between European countries.

ECONOMIE ET STATISTIQUE / ECONOMICS AND STATISTICS N° 507-508, 201916
in health persist at very old ages. But, once dependent, the duration of LTC needs is less sensitive to the socioeconomic status. Finally, the probability and the duration of LTC needs are lower in Northern Europe (Sweden, the Netherlands, and Denmark) than in the South (Spain, Italy). On top of geographic health inequalities, it is also possible that fewer restrictions in ADLs are reported in the North than in the South of Europe because housing and the environment are better suited to the needs of people with disabilities.20
Ability to Pay for LTC
The LTC risk is significant – 57% of indivi‑duals will have to finance, on average, four years of LTC needs – and care is costly. According to our simulations, assuming that there is no
public coverage for LTC and no informal care, dependent individuals will have to finance an average LTC cost of €114,779 (1st quar‑tile: €53,174, median: €98,076, 3rd quartile: €147,115). Focusing on those who have no partner when they are 20dependent,21 we study both the proportion of individuals who are able to pay for their LTC needs and the distribution of the ability to pay.
20. Institutional care is more common in Northern than in Southern Europe. Thus, if SHARE imperfectly follows individuals when they enter nursing homes, attrition leads to an underestimation of LTC risk in Northern Europe. However, since people in nursing homes are initially sampled in the three Northern Europe countries and not elsewhere, the bias is likely minimal. 21. The sample includes between 6,542 and 6,746 individuals (depen-ding on the simulation) who had no partner/spouse in 2013 or who face long-term care needs after the death of their partner/spouse (see table C1-5 in Online Complement C1).
Table 4Simulated LTC Risk and LTC Duration
Probability of needing LTC LTC duration if > 0 (years)
Total 0.571 (0.006) 4.378 (0.034)
Male 0.458 (0.010) 3.783 (0.076)
Female 0.656 (0.010) 4.689 (0.052)
Adjusted household income (country level)
1st quintile 0.635 (0.012) 4.320 (0.071)
2nd quintile 0.617 (0.014) 4.356 (0.101)
3rd quintile 0.582 (0.007) 4.549 (0.124)
4th quintile 0.527 (0.012) 4.292 (0.135)
5th quintile 0.494 (0.014) 4.366 (0.058)
Level of education
Pre‑primary/primary 0.651 (0.008) 4.548 (0.091)
Secondary/post‑secondary 0.552 (0.008) 4.270 (0.062)
Tertiary 0.452 (0.011) 4.203 (0.097)
Country
Austria 0.560 (0.011) 4.240 (0.062)
Germany 0.592 (0.010) 4.262 (0.049)
Sweden 0.331 (0.008) 3.453 (0.068)
Netherlands 0.344 (0.010) 3.837 (0.096)
Spain 0.677 (0.015) 4.891 (0.132)
Italy 0.629 (0.014) 4.623 (0.138)
France 0.513 (0.018) 3.970 (0.105)
Denmark 0.416 (0.011) 4.216 (0.112)
Belgium 0.554 (0.013) 4.337 (0.094)
Number of observations: 23,769
Notes: The figures correspond to the means of the (weighted) LTC risk and the (weighted) LTC duration across ten replications of simulations. Standard deviations of the means of the ten replications are reported in parentheses.Individuals aged 65 and over in wave 5.Sources: SHARE. We simulate trajectories of wave 5 individuals, using our transition model.

ECONOMIE ET STATISTIQUE / ECONOMICS AND STATISTICS N° 507-508, 2019 17
Private Financing of Long‑Term Care: Income, Savings and Reverse Mortgages
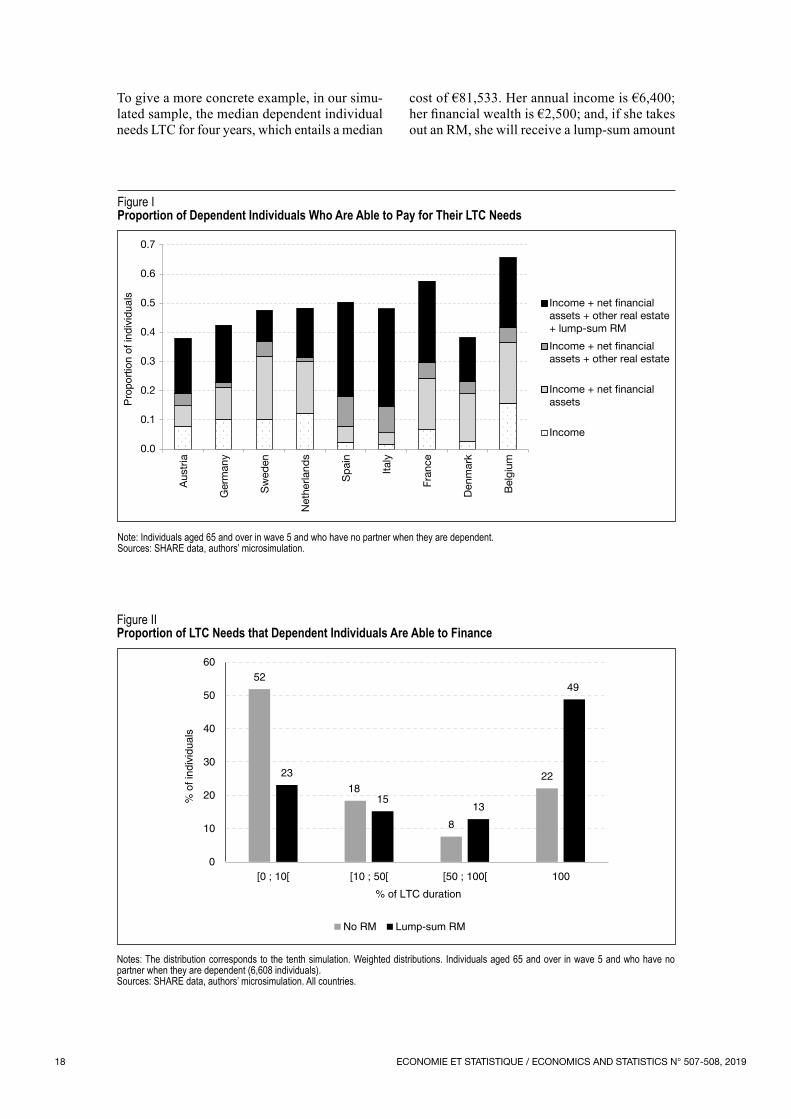
On average, only 6% of single dependent indi‑viduals can pay for their LTC needs out of their sole income. The proportion increases to 16% if they deplete their financial wealth, 22% if they sell their other real estate and to 49% if they take out reverse mortgages on their main residence (Table 5). Thus, half of the individuals cannot totally pay for LTC, even if they use all their income and assets. This highlights both the high cost of LTC and the need for additional forms of LTC coverage.
At the country level, the proportion of elderly who are able to pay for their LTC needs (with income, assets, and reverse mortgages) ranges from 38% in Austria and Denmark to 66% in Belgium. In most countries (Austria, Germany, Sweden, the Netherlands, Spain, Italy, Denmark), only 35 to 50% can finance their periods of disability. The proportion is higher in France (58%) and Belgium (66%) where income, financial and housing assets are, on average, higher.
While only 22% of individuals can pay for their LTC needs without using their home equity, this proportion more than doubles when reverse mortgage payments are taken into account. Indeed, the proportion of homeowners is high among older Europeans, and their average home value is generally higher than the average annual income and financial wealth. To give an
example, dependent homeowners receive an average lump‑sum payment of €141,191 when they take out reverse mortgages (Table C4‑1 in Online complement C4). The potential role of reverse mortgages is particularly important in Spain and Italy, where a large proportion of indi‑viduals is cash‑poor and house‑rich (Figure I). In contrast, reverse mortgages seem less useful in Sweden, where individual income and assets are higher and homeownership is lower.
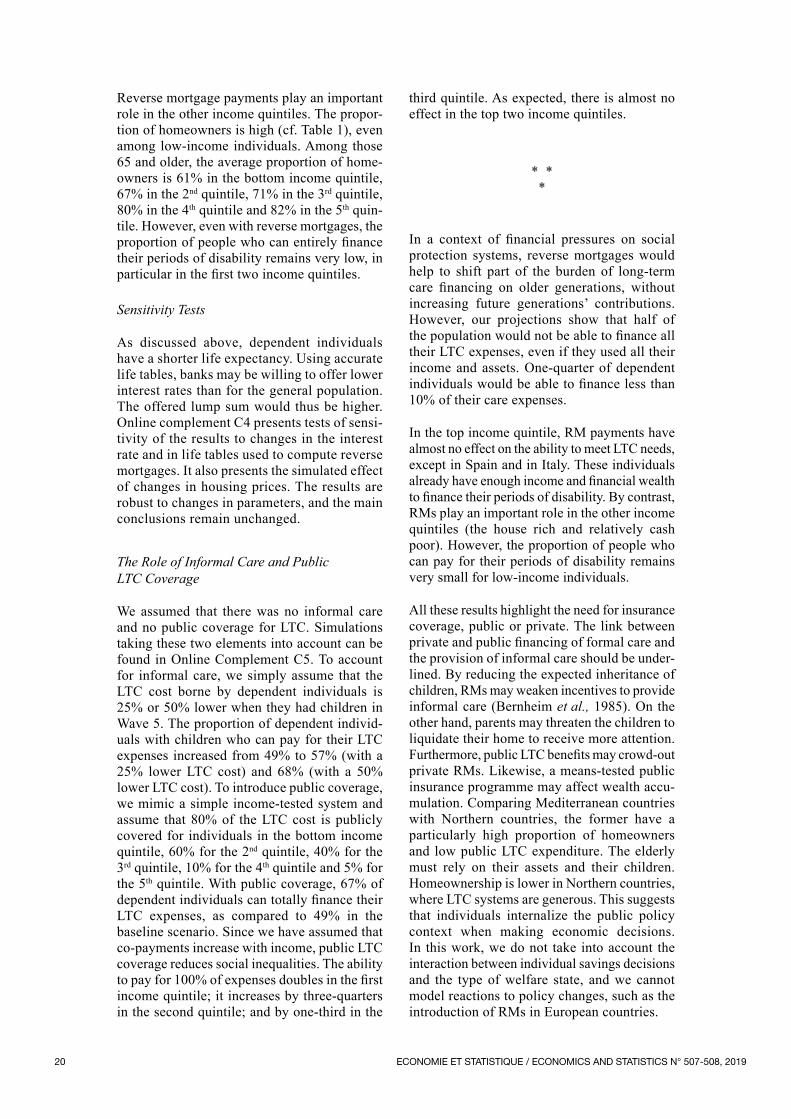
Thus, almost half of the individuals are able to finance their LTC expenses, if they use all their income and assets. To give a complete picture of the ability to pay for LTC needs, we also have to consider individuals who can finance only part of their LTC expenses. The proportion of LTC duration that individuals are able to finance is defined as the ratio between the number of years of LTC (D) they can pay for and their effective LTC duration. Without home equity, 52% of dependent individuals can only finance less than 10% of their LTC duration, while 22% can fully finance their periods of LTC needs (Figure II). When lump‑sum reverse mortgage payments are added, these proportions become, respectively, 23% and 49%. Reverse mortgages increase the proportion of individuals who can pay for 50% or more of their LTC duration. But a significant proportion of dependent individuals can only pay for a small part of their LTC expenses, even if they take out reverse mortgages.
Table 5Proportion of Dependent Individuals Who Are Able to Pay for Their LTC Needs
Adjusted household income + Net financial assets + Other real estate + Lump‑sum RM
Total 0.062 (0.003) 0.164 (0.006) 0.222 (0.004) 0.489 (0.005)
Country
Austria 0.078 (0.005) 0.149 (0.011) 0.190 (0.013) 0.380 (0.013)
Germany 0.102 (0.007) 0.212 (0.009) 0.227 (0.009) 0.425 (0.012)
Sweden 0.102 (0.010) 0.319 (0.017) 0.370 (0.017) 0.476 (0.019)
Netherlands 0.123 (0.018) 0.301 (0.022) 0.313 (0.024) 0.483 (0.018)
Spain 0.024 (0.005) 0.079 (0.010) 0.180 (0.019) 0.504 (0.013)
Italy 0.017 (0.003) 0.056 (0.008) 0.146 (0.012) 0.481 (0.016)
France 0.066 (0.007) 0.244 (0.021) 0.296 (0.019) 0.576 (0.022)
Denmark 0.026 (0.006) 0.190 (0.019) 0.231 (0.019) 0.383 (0.018)
Belgium 0.158 (0.009) 0.366 (0.016) 0.415 (0.017) 0.657 (0.015)
Number of observations: between 6,542 and 6,746 depending on the simulation
Notes: The figures correspond to the mean of the (weighted) ability to pay across ten replications of simulations. Standard deviations between the means of the ten replications are reported in parentheses.Reading Note: In Austria, 7.8% of dependent individuals on average can pay for their LTC needs with their income. The proportion is 14.9% when net financial assets are added, 19% if real estate is taken into account and 38% if lump-sum reverse mortgages on the main residence are added.Individuals aged 65 and over in wave 5 and who have no partner when they are dependent.Sources: SHARE, authors’ microsimulation.
ECONOMIE ET STATISTIQUE / ECONOMICS AND STATISTICS N° 507-508, 201918
Figure IProportion of Dependent Individuals Who Are Able to Pay for Their LTC Needs
0.0
0.1
0.2
0.3
0.4
0.5
0.6
0.7
Aus
tria
Ger
man
y
Sw
eden
Net
herla
nds
Sp
ain
Italy
Fran
ce
Den
mar
k
Bel
gium
Pro
port
ion
of in
divi
dual
s
Income + net financialassets + other real estate+ lump-sum RM
Income + net financialassets + other real estate
Income
Income + net financialassets
Note: Individuals aged 65 and over in wave 5 and who have no partner when they are dependent.Sources: SHARE data, authors’ microsimulation.
Figure IIProportion of LTC Needs that Dependent Individuals Are Able to Finance
52
18
8
22 23
15 13
49
0
10
20
30
40
50
60
[0 ; 10[ [10 ; 50[ [50 ; 100[ 100
% o
f ind
ivid
uals
% of LTC duration
No RM Lump-sum RM
Notes: The distribution corresponds to the tenth simulation. Weighted distributions. Individuals aged 65 and over in wave 5 and who have no partner when they are dependent (6,608 individuals).Sources: SHARE data, authors’ microsimulation. All countries.
To give a more concrete example, in our simu‑lated sample, the median dependent individual needs LTC for four years, which entails a median
cost of €81,533. Her annual income is €6,400; her financial wealth is €2,500; and, if she takes out an RM, she will receive a lump‑sum amount

ECONOMIE ET STATISTIQUE / ECONOMICS AND STATISTICS N° 507-508, 2019 19
Private Financing of Long‑Term Care: Income, Savings and Reverse Mortgages
of €57,006. This median dependent individual can cover 31% (15 months) of her LTC expenses with her income alone and 34% (16 months) if she depletes her financial wealth. With an RM, she can fully finance her LTC needs.
Distributions by country show that the ability to pay for LTC needs without reverse mortgages is particularly low in Spain, Italy and Austria, compared to other countries (Figure C2‑1 in Online complement C2). In all countries, lump‑sum payments from reverse mortgages shift the distribution to the right and improve the ability to finance periods of disability, but not in the same proportion everywhere. As outlined above, the effect of reverse mortgages is small in Sweden, Denmark and the Netherlands. By contrast, the impact is larger in Southern Europe. Austria, Germany, France and Belgium constitute an intermediate group.
Subgroup Analysis
Since poor individuals face a bigger risk of disability and have less housing wealth, socioec‑onomic inequalities may increase at older ages. Similarly, women are more often dependent than men and generally have lower income. What would be the consequences of the development of reverse mortgage products, in the absence of public LTC coverage, on the distribution of
ability to pay according to gender and socio‑economic status?22
The proportion of dependent individuals who could fully finance their LTC needs, using their income, financial assets and RMs, is higher among men (59%) than among women (46%) (Table 6). The ability to pay for LTC increases with the level of education. Only 43% of indi‑viduals who have completed primary education could pay for their LTC needs, as compared to 68% for those who have completed tertiary education. Similarly, the proportion of indivi‑duals who could cover their LTC needs ranges between 30% in the first income quintile and 88% in the fifth income quintile.
In Northern and continental Europe, reverse mortgage payments have only a small effect on payment ability for those in the top income quintile. These individuals have enough income and financial wealth. In contrast, in Southern Europe, only 30% of the richest individuals are able to finance their periods of disability out of their income and financial wealth. The proportion strongly increases when housing assets are taken into account (Figure C3‑I in Online complement C3).
22. This question is highly policy‑relevant if fiscal incentives are set up by governments to develop the demand for RMs.
Table 6Proportion of Dependent Individuals Able to Pay for Their LTC Needs in Different Subgroups
Adjusted household income + Net financial assets + Other real estate + Lump‑sum RM
Total 0.062 (0.003) 0.164 (0.006) 0.222 (0.004) 0.489 (0.005)
Male 0.090 (0.009) 0.243 (0.021) 0.304 (0.020) 0.589 (0.028)
Female 0.055 (0.003) 0.144 (0.004) 0.201 (0.007) 0.463 (0.005)
Income
1st quintile 0.000 (0.000) 0.046 (0.006) 0.069 (0.007) 0.298 (0.011)
2nd quintile 0.000 (0.000) 0.060 (0.010) 0.103 (0.010) 0.365 (0.022)
3rd quintile 0.000 (0.000) 0.101 (0.011) 0.166 (0.009) 0.475 (0.015)
4th quintile 0.009 (0.002) 0.212 (0.026) 0.307 (0.024) 0.658 (0.026)
5th quintile 0.445 (0.016) 0.606 (0.015) 0.699 (0.022) 0.877 (0.014)
Level of education
Pre‑primary/primary 0.015 (0.002) 0.077 (0.009) 0.135 (0.009) 0.428 (0.012)
Secondary/post‑secondary 0.070 (0.005) 0.184 (0.007) 0.244 (0.009) 0.499 (0.008)
Tertiary 0.209 (0.013) 0.419 (0.021) 0.469 (0.018) 0.679 (0.026)
Number of observations: between 6,542 and 6,746 depending on the simulation
Notes: The figures correspond to the mean of the (weighted) ability to pay across ten replications of simulations. Standard deviations of the means of the ten replications are reported in parentheses. Individuals aged 65 and over in wave 5 and who have no partner when they are dependent.Sources: SHARE data; authors’ microsimulation.
ECONOMIE ET STATISTIQUE / ECONOMICS AND STATISTICS N° 507-508, 201920
Reverse mortgage payments play an important role in the other income quintiles. The propor‑tion of homeowners is high (cf. Table 1), even among low‑income individuals. Among those 65 and older, the average proportion of home‑owners is 61% in the bottom income quintile, 67% in the 2nd quintile, 71% in the 3rd quintile, 80% in the 4th quintile and 82% in the 5th quin‑tile. However, even with reverse mortgages, the proportion of people who can entirely finance their periods of disability remains very low, in particular in the first two income quintiles.
Sensitivity Tests
As discussed above, dependent individuals have a shorter life expectancy. Using accurate life tables, banks may be willing to offer lower interest rates than for the general population. The offered lump sum would thus be higher. Online complement C4 presents tests of sensi‑tivity of the results to changes in the interest rate and in life tables used to compute reverse mortgages. It also presents the simulated effect of changes in housing prices. The results are robust to changes in parameters, and the main conclusions remain unchanged.
The Role of Informal Care and Public LTC Coverage
We assumed that there was no informal care and no public coverage for LTC. Simulations taking these two elements into account can be found in Online Complement C5. To account for informal care, we simply assume that the LTC cost borne by dependent individuals is 25% or 50% lower when they had children in Wave 5. The proportion of dependent individ‑uals with children who can pay for their LTC expenses increased from 49% to 57% (with a 25% lower LTC cost) and 68% (with a 50% lower LTC cost). To introduce public coverage, we mimic a simple income‑tested system and assume that 80% of the LTC cost is publicly covered for individuals in the bottom income quintile, 60% for the 2nd quintile, 40% for the 3rd quintile, 10% for the 4th quintile and 5% for the 5th quintile. With public coverage, 67% of dependent individuals can totally finance their LTC expenses, as compared to 49% in the baseline scenario. Since we have assumed that co‑payments increase with income, public LTC coverage reduces social inequalities. The ability to pay for 100% of expenses doubles in the first income quintile; it increases by three‑quarters in the second quintile; and by one‑third in the
third quintile. As expected, there is almost no effect in the top two income quintiles.
* * *
In a context of financial pressures on social protection systems, reverse mortgages would help to shift part of the burden of long‑term care financing on older generations, without increasing future generations’ contributions. However, our projections show that half of the population would not be able to finance all their LTC expenses, even if they used all their income and assets. One‑quarter of dependent individuals would be able to finance less than 10% of their care expenses.
In the top income quintile, RM payments have almost no effect on the ability to meet LTC needs, except in Spain and in Italy. These individuals already have enough income and financial wealth to finance their periods of disability. By contrast, RMs play an important role in the other income quintiles (the house rich and relatively cash poor). However, the proportion of people who can pay for their periods of disability remains very small for low‑income individuals.
All these results highlight the need for insurance coverage, public or private. The link between private and public financing of formal care and the provision of informal care should be under‑lined. By reducing the expected inheritance of children, RMs may weaken incentives to provide informal care (Bernheim et al., 1985). On the other hand, parents may threaten the children to liquidate their home to receive more attention. Furthermore, public LTC benefits may crowd‑out private RMs. Likewise, a means‑tested public insurance programme may affect wealth accu‑mulation. Comparing Mediterranean countries with Northern countries, the former have a particularly high proportion of homeowners and low public LTC expenditure. The elderly must rely on their assets and their children. Homeownership is lower in Northern countries, where LTC systems are generous. This suggests that individuals internalize the public policy context when making economic decisions. In this work, we do not take into account the interaction between individual savings decisions and the type of welfare state, and we cannot model reactions to policy changes, such as the introduction of RMs in European countries.

ECONOMIE ET STATISTIQUE / ECONOMICS AND STATISTICS N° 507-508, 2019 21
Private Financing of Long‑Term Care: Income, Savings and Reverse Mortgages
RMs may be perceived as “anti‑family” in that the children may have to give up the family home (Assier‑Andrieu & Gotman, 2009; Masson, 2015). Dillingh et al. (2013) show that having offspring decreases the probability of being interested in RMs in the Netherlands. However, the proportion of inherited homes is low and has been declining over time (Angelini et al., 2013). In many countries, inheritance taxes already reduce real estate assets.
On the other hand, care preferences may also influence the demand for RMs. Many parents declare they do not want to be a burden to their children. RMs may allow dependent elderly to purchase formal home care and preserve their autonomy. Children could provide emotional
support and help with domestic tasks, comple‑menting professional care. Furthermore, children may prefer to receive a smaller share of the inheritance rather than provide care for their parents, sometimes at the expense of their health and career. A more thorough analysis of the relationship between inheritance taxation and child‑parent obligations would have to be conducted to fully understand family decisions.
In practice, the RM market is very small. The most common explanation is that costs and fees are too high. This product also appears compli‑cated and risky for both lenders and borrowers. The demand for RMs is likely to remain low in Europe, unless more attractive financial products are developed in relation to the tax system.
BIBLIOGRAPHY
Albrecht, G. L. & Devlieger, P. J. (1999). The dis‑ability paradox: high quality of life against all odds. Social Science Medicine, 48(8), 977–988.https://doi.org/10.1016/S0277‑9536(98)00411‑0
Angelini, V., Laferrère, A. & Weber, G. (2013). Home‑ownership in Europe: How did it happen? Advances in Life Course Research, 18(1), 83–90. https://doi.org/10.1016/j.alcr.2012.10.006
Assier‑Andrieu, L. & Gotman, A. (2009). Réver‑sion du principe du logement humain ‑ Chronique du prêt hypothécaire inversé. Rapport de recherche pour le Ministère de l’Ecologie, de l’Energie, du Dévelop‑pement Durable et de l’Aménagement du Territoire ‑ Plan Urbanisme Construction Architecture (PUCA).
Atella, V., Belotti, F., Carrino, L. & Piano Mortari, A. (2017). The Future of Long Term Care in Europe. An Investigation Using a Dynamic Microsimulation Model. CEIS Research Paper Series N° 405.https://dx.doi.org/10.2139/ssrn.2964830
Benítez‑Silva, H., Eren, S., Heiland, F. & Jiménez‑ Martín, S. (2015). How well do individuals predict the selling prices of their homes? Journal of Housing Economics, 29, 12–25. https://doi.org/10.1016/j.jhe.2015.04.001
Bérardier, M. (2012). Allocation personnalisée d’auto‑nomie à domicile : quels restes à charge pour les bénéfi‑ciaires ? Revue française des affaires sociales, 194–217.https://www.cairn.info/revue‑francaise‑des‑affaires‑sociales‑2012‑2‑page‑194.htm
Bernheim, B. D., Shleifer, A. & Summers, L. H. (1985). The Strategic Bequest Motive. Journal of Political Economy, 93(6), 1045–1076.https://www.jstor.org/stable/1833175
Bishop, T. B. & Shan, H. (2008). Reverse Mort‑gages: A Closer Look at HECM Loans. National Bureau of Economic Research.
Bockarjova, M., Polder, J. & Rouwendal, J. (2014). Long Term Care, Wealth and Housing. Netspar Discussion Paper N° 01/2014‑099.https://dx.doi.org/10.2139/ssrn.2706434
Borsch‑Supan, A., Brandt, M., Hunkler, C., Kneip, T., Korbmacher, J., Malter, F., Schaan, B., Stuck, S. & Zuber, S., on behalf of the SHARE Central Coordination Team (2013). Data Resource Profile: The Survey of Health, Ageing and Retire‑ment in Europe (SHARE). International Journal of Epidemiology, 42(4), 992–1001. https://doi.org/10.1093/ije/dyt088
Brown, J. & Finkelstein, A. (2004). The Interaction of Public and Private Insurance: Medicaid and the Long‑Term Care Insurance Market. NBER Working Paper N° 10989.https://doi.org/10.3386/w10989
Brown, J. R. & Finkelstein, A. (2009). The Private Market for Long‑Term Care Insurance in the United States: A Review of the Evidence. Journal of Risk and Insurance, 76(1), 5–29. https://doi.org/10.1111/j.1539‑6975.2009.01286.x
Link to the Online complements:https://www.insee.fr/en/statistiques/fichier/4173202/507‑508_Bonnet‑Juin‑Laferrere_complement.pdf

ECONOMIE ET STATISTIQUE / ECONOMICS AND STATISTICS N° 507-508, 201922
Brown, J. R. & Finkelstein, A. (2008). The Interac‑tion of Public and Private Insurance: Medicaid and the Long‑Term Care Insurance Market. American Economic Review, 98(3), 1083–1102.https://doi.org/10.1257/aer.98.3.1083
Brown, J. R. & Finkelstein, A. (2007). Why is the market for long‑term care insurance so small? Jour‑nal of Public Economics, 91(10), 1967–1991. https://doi.org/10.1016/j.jpubeco.2007.02.010
Cambois, E. & Lièvre, A. (2007). Les passages de l’autonomie à la dépendance. Gérontologie et société, 30(121), 85–102. https://doi.org/10.3917/gs.121.0085
Cambois, E., Solé‑Auró, A. & Robine, J.‑M. (2016). Economic Hardship and Educational Dif‑ferentials in Disability in 26 European Countries. Journal of Aging and Health, 28(7), 1214–1238. https://doi.org/10.1177/0898264316656503
Carrino, L. & Orso, C. E. (2014). Eligibility and inclusiveness of Long‑Term Care Institutional frameworks in Europe: a cross‑country comparison. University Ca’ Foscari of Venice, Department of Economics, Working Paper N° 28/WP/2014.https://dx.doi.org/10.2139/ssrn.2541246
Coe, N. B. & Van Houtven, C. H. (2009). Caring for mom and neglecting yourself? The health effects of caring for an elderly parent. Health economics, 18(9), 991–1010.https://doi.org/10.1002/hec.1512
Colombo, F., Llena‑Nozal, A., Mercier, J. & Frits, T. (2011). Private Long‑term Care Insurance. In: Help Wanted? Providing and Paying for Long‑Term Care, pp. 247–262. OECD Health Policy Studies.
Consumer Financial Protection Bureau (2012). Reverse mortgages. Report to Congress.https://www.consumerfinance.gov/data‑research/research‑reports/reverse‑mortgages‑report/
Costa‑Font, J. (2008). Housing assets and the socio‑economic determinants of health and disability in old age. Health & Place, 14(3), 478–491. https://doi.org/10.1016/j.healthplace.2007.09.005
Costa‑Font, J., Gil, J. & Mascarilla, O. (2010). Housing Wealth and Housing Decisions in Old Age: Sale and Reversion. Housing Studies, 25(3), 375–395.https://doi.org/10.1080/02673031003711014
Costa‑Font, J. & Rovira‑Forns, J. (2008). Who is willing to pay for long‑term care insurance in Cata‑lonia? Health Policy, 86(1), 72–84.https://doi.org/10.1016/j.healthpol.2007.09.011
Crimmins, E. M., Hayward, M. D., Hagedorn, A., Saito, Y. & Nicolas, B. (2009). Change in Disability‑ Free Life Expectancy for Americans 70 Years Old and Older. Demography, 46(3), 627–646. https://doi.org/10.1353/dem.0.0070
Davidoff, T. (2010). Home equity commitment and long‑term care insurance demand. Journal of Public Economics, 94(1‑2), 44–49. https://doi.org/10.1016/j.jpubeco.2009.09.006
Davidoff, T. (2009). Housing, Health, and Annuities. Journal of Risk and Insurance, 76(1), 31–52. https://doi.org/10.1111/j.1539‑6975.2009.01287.x
Dillingh, R., Prast, H., Rossi, M. & Urzì Brancati, C. (2017). Who wants to have their home and eat it too? Interest in reverse mortgages in the Netherlands. Journal of Housing Economics, 38, 25–37. https://doi.org/10.1016/j.jhe.2017.09.002
Dillingh, R., Prast, H., Urzí Brancati, M. C. & Rossi, M. (2013). The psychology and economics of reverse mortgage attitudes: evidence from the Netherlands. CeRP, Working Papers N° 135.https://ideas.repec.org/p/crp/wpaper/135.html
Duée, M. & Rebillard, C. (2006). La dépendance des personnes âgées: une projection en 2040. Insee, Données sociales : La société française.https://www.insee.fr/fr/statistiques/1371933? sommaire=1372045
European Commission, Economic Policy Com‑mittee of the European Communities (2015a). The 2015 ageing report economic and budgetary pro‑jections for the 28 EU Member States (2013‑2060). Luxembourg: Publications Office.
European Commission (2015b). The 2015 pen‑sion adequacy report: current and future income adequacy in old age in the EU. Vol. I. Luxembourg: Publications Office.
Fänge, A. & Iwarsson, S., (2005). Changes in ADL dependence and aspects of usability following hous‑ing adaptation‑‑a longitudinal perspective. American Journal Occupational Therapy, 59(3), 296–304.https://www.ncbi.nlm.nih.gov/pubmed/15969277
Fong, J. H., Shao, A. W. & Sherris, M. (2013). Multistate Actuarial Models of Functional Disabi‑lity. Australian School of Business, Research Paper N° 2013ACTL14.
Fontaine, R., Plisson, M. & Zerrar, N. (2014). Dans quelle mesure les préférences individuelles con‑traignent‑elles le développement du marché de l’assur‑ance dépendance ? Economie et Statistique, 474, 35–68.https://www.insee.fr/fr/statistiques/1377628? sommaire=1377636
ECONOMIE ET STATISTIQUE / ECONOMICS AND STATISTICS N° 507-508, 2019 23
Private Financing of Long‑Term Care: Income, Savings and Reverse Mortgages
Fontaine, R. & Zerrar, N. (2013). Comment expliquer la faible disposition des individus à se cou‑vrir face au risque dépendance ? Une revue de la lit‑térature. Questions d’économie de la Santé N° 188.https://www.irdes.fr/Publications/Qes2013/Qes188.pdf
Forder, J. & Fernández, J.‑L. (2009). Analysing the costs and benefits of social care funding arrange‑ments in England: technical report. PSSRU Discus‑sion Paper N° 2644.
Fornero, E., Rossi, M. & Urzí Brancati, M. C. (2016). Explaining why, right or wrong, (Italian) households do not like reverse mortgages. Journal of Pension Economics and Finance, 15(2), 180–202. https://doi.org/10.1017/S1474747215000013
Friedberg, L., Hou, W., Sun, W., Webb, A. & Zhenyu, L. (2014). New Evidence on the Risk of Requiring Long‑Term Care. CRR Working Papers N° 2014‑12.https://crr.bc.edu/working‑papers/new‑evidence‑on‑the‑risk‑of‑requiring‑long‑term‑care/
Hancook, R., (1998). Can Housing Wealth Alleviate Poverty among Britain’s Older Population? Fiscal Studies, 19(3), 249–272.https://doi.org/10.1111/j.1475‑5890.1998.tb00287.x
HCFEA (2017). La prise en charge des aides à l’au‑tonomie et son incidence sur la qualité de vie des personnes âgées et de leurs proches aidants. Rapport du Conseil de l’Âge.
Hussem, A., van Ewijk, C., ter Rele, H. & Wong, A. (2016). The ability to pay for long‑term care in the Netherlands: a life‑cycle perspective. CPB Discus‑sion Paper N° 321.https://ideas.repec.org/p/cpb/discus/321.html
Kemper, P., Komisar, H. L. & Alecxih, L. (2005). Long‑term care over an uncertain future: what can current retirees expect? Inquiry: The Journal of Health Care Organization, Provision and Financing, 42(4), 335–350.https://doi.org/10.5034%2Finquiryjrnl_42.4.335
Laferrère, A. (2012). Housing Wealth as Self‑ insurance for Long‑Term Care. In: Costa‑Font, J. & Courbage, C. (Eds.), Financing Long‑Term Care in Europe: Institutions, Markets and Models, pp. 73–90. London: Palgrave Macmillan
Lilly, M. B., Laporte, A. & Coyte, P.C. (2007). Labor market work and home care’s unpaid caregi‑vers: a systematic review of labor force participa‑tion rates, predictors of labor market withdrawal, and hours of work. The Milbank Quarterly, 85(4), 641–690. https://doi.org/10.1111/j.1468‑0009.2007.00504.x
Mackenbach, J. P. (2012). The persistence of health inequalities in modern welfare states: The explanation of a paradox. Social Science & Medicine, 75(4), 761–769. https://doi.org/10.1016/j.socscimed.2012.02.031
Marbot, C. & Roy, D. (2015). Projections du coût de l’APA et des caractéristiques de ses bénéficiaires à l’horizon 2040 à l’aide du modèle Destinie. Econo‑mie et Statistique, 481‑482, 185–209.https://www.insee.fr/fr/statistiques/1305201? sommaire=1305205
Masson, A. (2015). L’épargnant propriétaire face à ses vieux jours. Revue française d’économie, XXX(2), 129–177. https://doi.org/10.3917/rfe.152.0129
Mayhew, L., Karlsson, M. & Rickayzen, B. (2010). The Role of Private Finance in Paying for Long Term Care. The Economic Journal, 120(548), F478–F504. https://doi.org/10.1111/j.1468‑0297.2010.02388.x
Moscarola, F. C., d’Addio, A. C., Fornero, E. & Rossi, M. (2015). Reverse mortgage: a tool to reduce old age poverty without sacrificing social inclusion. In: Börsch‑Supan, A., Kneip, T., Litwin, H., Myck, M. & Weber, G. (Eds.), Ageing in Europe ‑ Support‑ing Policies for an Inclusive Society, pp. 235–244. Berlin, München, Boston: De Gruyter.https://www.degruyter.com/view/product/462442
Muir, T. (2017). Measuring social protection for long‑term care. OECD Health Working Papers N° 93.https://doi.org/10.1787/a411500a‑en
Ogg, J. (2012). Le prêt viager hypothécaire. Retraite et société, 62, 167–173.https://www.cairn.info/revue‑retraite‑et‑societe1‑2012‑1‑page‑167.htm
Ong, R. (2008). Unlocking Housing Equity Through Reverse Mortgages: The Case of Elderly Homeown‑ers in Australia. European Journal of Housing Policy, 8(1), 61–79. https://doi.org/10.1080/14616710701817166
Oswald, A. J., Powdthavee, N. (2008). Does hap‑piness adapt? A longitudinal study of disability with implications for economists and judges. Journal of Public Economics, 92(5‑6), 1061–1077. https://doi.org/10.1016/j.jpubeco.2008.01.002
Pagán‑Rodríguez, R. (2010). Onset of disability and life satisfaction: evidence from the German Socio‑Economic Panel. The European Journal of Health Economics, 11(5), 471–485.https://doi.org/10.1007/s10198‑009‑0184‑z
ECONOMIE ET STATISTIQUE / ECONOMICS AND STATISTICS N° 507-508, 201924
Pampalon, R., Colvez, A. & Bucquet, D. (1991). Établissement d’une table de passage de la dépendance des personnes âgées au besoin d’aide à domicile. Revue d’épidémiologie et de santé publique, 39, 263–273.
Pérès, K., Verret, C., Alioum, A. & Barberger‑ Gateau, P. (2005). The disablement process: Factors associated with progression of disability and reco‑very in French elderly people. Disability and Rehabi‑litation, 27(5), 263–276. https://doi.org/10.1080/09638280400006515
Petite, S. & Weber, A. (2006). Les effets de l’Allocation personnalisée d’autonomie sur l’aide dispensée aux personnes âgées. Études et Résultats, 459.https://drees.solidarites‑sante.gouv.fr/etudes‑et‑statistiques/publications/etudes‑et‑resultats/article/les‑effets‑de‑l‑allocation‑personnalisee‑d‑autonomie ‑sur‑l‑aide‑dispensee‑aux
Rickayzen, B. D. & Walsh, D. E. P. (2002). A Multi‑State Model of Disability for the United King‑dom: Implications for Future Need for Long‑Term Care for the Elderly. British Actuarial Journal, 8(2), 341–393. https://doi.org/10.1017/S1357321700003755
Rouwendal, J. & Thomese, F. (2013). Home‑ownership and Long‑Term Care. Housing Studies, 28(5), 746–763. https://doi.org/10.1080/02673037.2013.759179
Shan, H. (2011). Reversing the Trend: The Recent Expansion of the Reverse Mortgage Market: The
Recent Expansion of the Reverse Mortgage Market. Real Estate Economics, 39(4), 743–768. https://doi.org/10.1111/j.1540‑6229.2011.00310.x
Sinai, T. & Souleles, N. (2007). Net Worth and Housing Equity in Retirement. NBER Working Papers, N° 13693.https://www.nber.org/papers/w13693
Stucki, B. R. (2006). Using Reverse Mortgages to Manage the Financial Risk of Long‑Term Care. North American Actuarial Journal, 10(4), 90–102. https://doi.org/10.1080/10920277.2006.10597415
Stucki, B. R. (2005). Use Your Home to Stay at Home. Expanding the Use of Reverse Mortgages for Long‑Term Care: A Blueprint for Action. Report from the National Council of Aging.
Van der Cruijsen, C., Jansen, D.‑J. & van Rooij, M. (2014). The rose‑colored glasses of homeowners. DNB Working Paper.https://econpapers.repec.org/RePEc:dnb:dnbwpp:421
Venti, S. F. & Wise, D. A. (2001). Aging and Housing Equity: Another Look. NBER Working Papers, N° 8608.https://www.nber.org/papers/w8608
Venti, S. F. & Wise, D. A. (1991). Aging and the income value of housing wealth. Journal of Public Economics, 44(3), 371–397. https://doi.org/10.1016/0047‑2727(91)90020‑3
Wu, S. (2001). Adapting to heart conditions: a test of the hedonic treadmill. Journal of Health Economics, 20(4), 495–508.https://ssrn.com/abstract=1673948