Print media advertising campaign analysis
41
The Print Campaign Analysis Prepared for MPA SEPTEMBER 2015
-
Upload
print-power -
Category
Business
-
view
758 -
download
0
Transcript of Print media advertising campaign analysis
The Print Campaign Analysis Prepared for MPA S E P T E M B E R 2 0 1 5
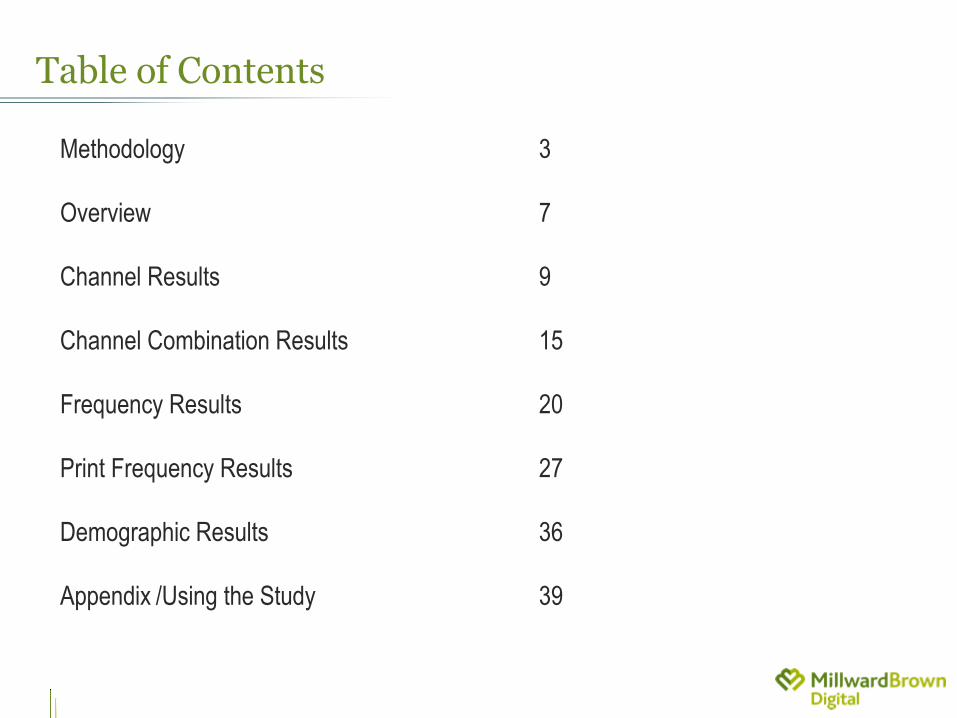
Table of Contents
Methodology 3
Overview 7
Channel Results 9
Channel Combination Results 15
Frequency Results 20
Print Frequency Results 27
Demographic Results 36
Appendix /Using the Study 39
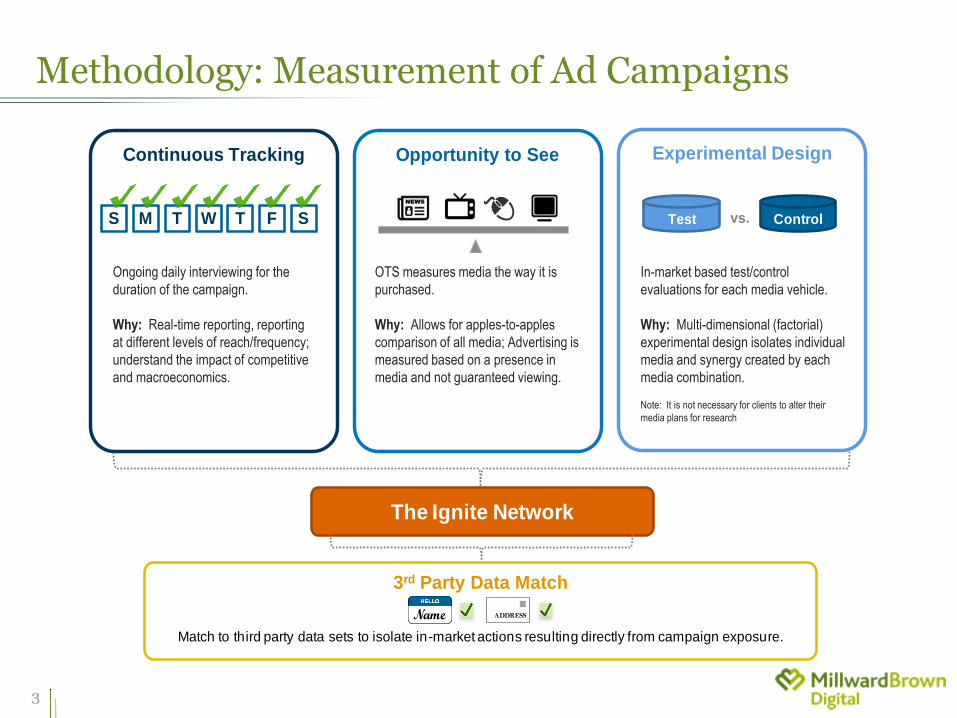
Methodology: Measurement of Ad Campaigns
Opportunity to See
OTS measures media the way it is
purchased.
Why: Allows for apples to apples
comparison of all media;
Advertising is measured based on
a presence in media and not
guaranteed viewing.
Continuous Tracking
Ongoing daily interviewing for the
duration of the campaign.
Why: Real time reporting,
reporting at different levels of
reach/frequency; understand the
impact of competitive and
macroeconomics
Experimental Design
In-market based test/control
evaluations for each media vehicle
Why: Multi-dimensional (factorial)
experimental design isolates
individual media and synergy
created by each media
combination.
Note: It is not necessary for clients to alter their media plans for research.
3rd Party Data Match
Match to third party data sets to isolate in-market actions resulting directly from campaign exposure.
M T W T F SS
Name ADDRESS
Test Controlvs.
The Ignite Network
Ongoing daily interviewing for the
duration of the campaign.
Why: Real-time reporting, reporting
at different levels of reach/frequency;
understand the impact of competitive
and macroeconomics.
OTS measures media the way it is
purchased.
Why: Allows for apples-to-apples
comparison of all media; Advertising is
measured based on a presence in
media and not guaranteed viewing.
In-market based test/control
evaluations for each media vehicle.
Why: Multi-dimensional (factorial)
experimental design isolates individual
media and synergy created by each
media combination.
Note: It is not necessary for clients to alter their
media plans for research
3
Methodology: Millward Brown Normative Data
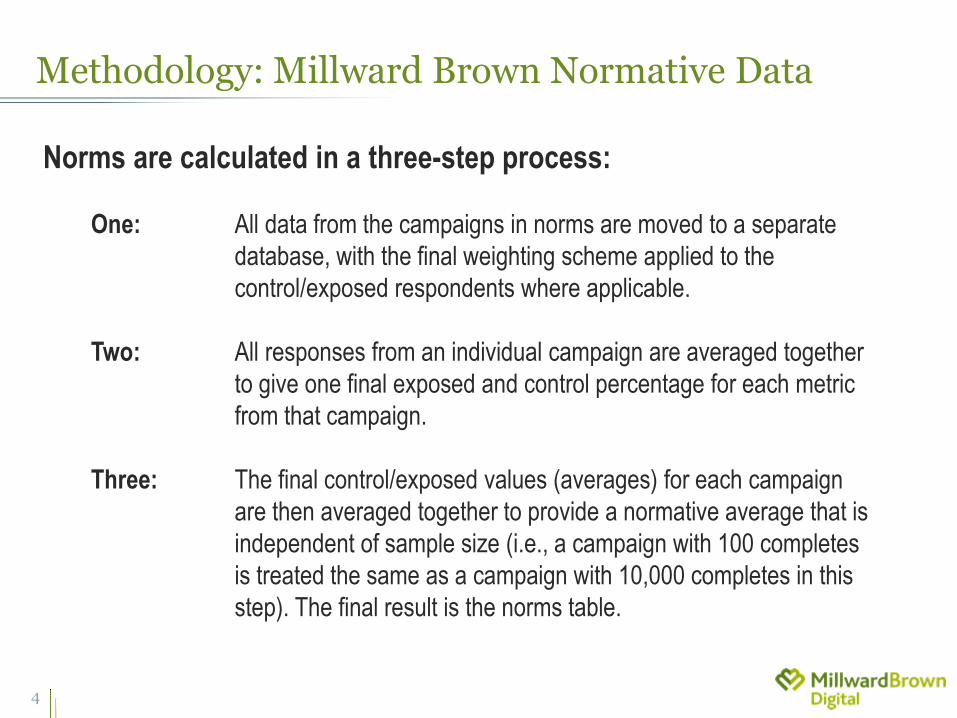
Norms are calculated in a three-step process:
One: All data from the campaigns in norms are moved to a separate
database, with the final weighting scheme applied to the
control/exposed respondents where applicable.
Two: All responses from an individual campaign are averaged together
to give one final exposed and control percentage for each metric
from that campaign.
Three: The final control/exposed values (averages) for each campaign
are then averaged together to provide a normative average that is
independent of sample size (i.e., a campaign with 100 completes
is treated the same as a campaign with 10,000 completes in this
step). The final result is the norms table.
4
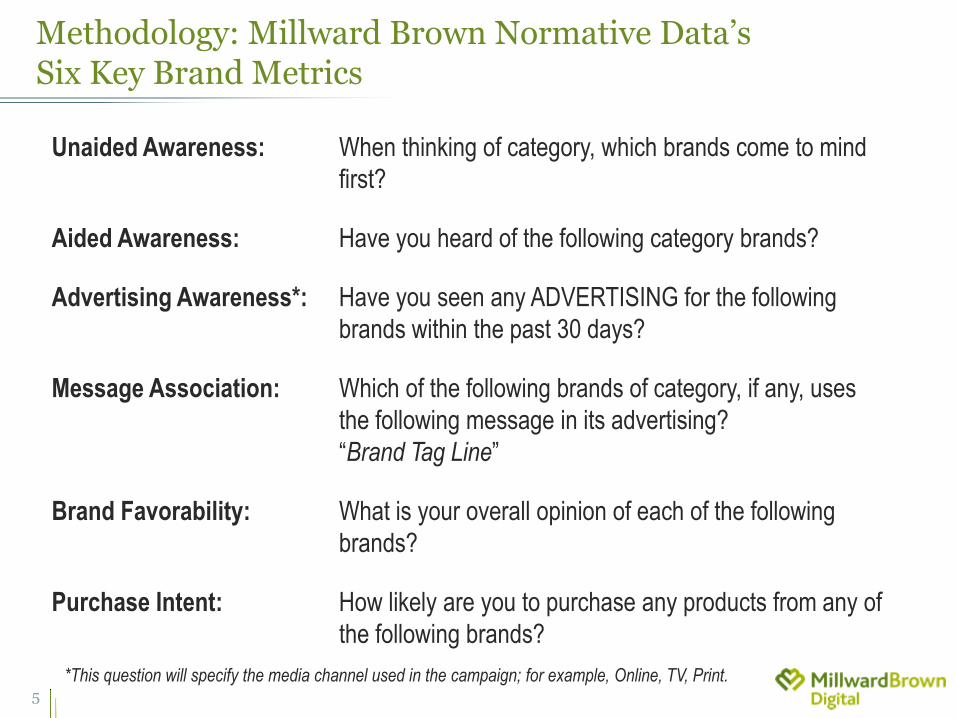
Methodology: Millward Brown Normative Data’s Six Key Brand Metrics
Unaided Awareness: When thinking of category, which brands come to mind
first?
Aided Awareness: Have you heard of the following category brands?
Advertising Awareness*: Have you seen any ADVERTISING for the following
brands within the past 30 days?
Message Association: Which of the following brands of category, if any, uses
the following message in its advertising?
“Brand Tag Line”
Brand Favorability: What is your overall opinion of each of the following
brands?
Purchase Intent: How likely are you to purchase any products from any of
the following brands?
*This question will specify the media channel used in the campaign; for example, Online, TV, Print. 5
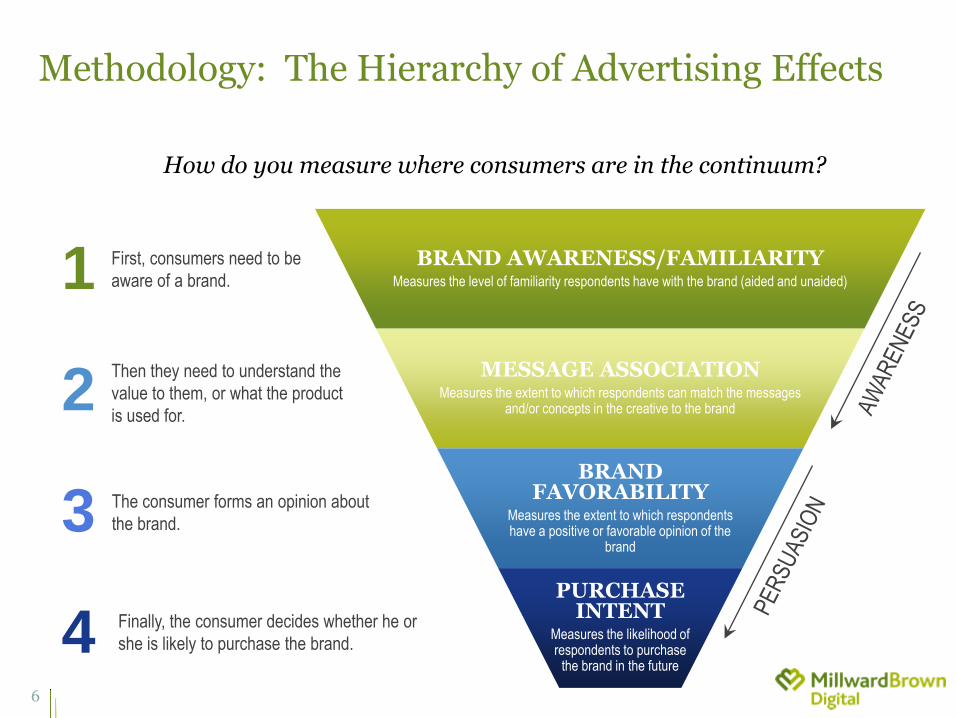
Methodology: The Hierarchy of Advertising Effects
BRAND AWARENESS/FAMILIARITY Measures the level of familiarity respondents have with the brand (aided and unaided)
MESSAGE ASSOCIATION Measures the extent to which respondents can match the messages
and/or concepts in the creative to the brand
BRAND FAVORABILITY
Measures the extent to which respondents have a positive or favorable opinion of the
brand
PURCHASE INTENT
Measures the likelihood of respondents to purchase
the brand in the future
First, consumers need to be
aware of a brand. 1
Then they need to understand the
value to them, or what the product
is used for. 2
The consumer forms an opinion about
the brand. 3
Finally, the consumer decides whether he or
she is likely to purchase the brand. 4
How do you measure where consumers are in the continuum?
6
Overview
Objective:
To identify the strengths of Print media, as compared to Online and TV media,
by evaluating the media channels separately and in combination with each
other.
Additional Background:
Millward Brown Digital examined a series of Cross Media campaign results in
aggregate:
• Overall
• Automotive
• CPG
• Entertainment
• Financial Services
Data collected over time, from 2007 – 2015.
7
Key Findings
Advertising benefits advertisers regardless of media channel
Combined exposure across TV, Print and Online channels resulted in larger observed
increases
• This was particularly true for the Print + TV combination, though Print + Digital
also resulted in significant lifts in advertising effects
Print ad exposures were especially effective at boosting the persuasion metrics
– brand favorability and purchase intent
• Print also significantly improved the ability of consumers to correctly associate
cross-platform ad campaigns with the brands that had sponsored the ads
Optimum ad exposure levels vary by channel. While TV and Online show
diminishing returns after 4 exposures, Print continues to improve ad awareness
and persuasion metrics at higher (5+) frequencies
• This suggests that TV and Online channels may be more cost-effective at lower
levels of exposure, while advertisers are likely to benefit from higher Print
frequencies
Print was equally effective among both males & females 8

Delivering on the Full Value of Brand Advertising
R E S U LT S B Y I N D I V I D U A L C H A N N E L
Channel Results
9
Deltas by Channel
3% 4%5% 5% 4% 4%3%
8%10%
7%
11% 11%
2%5%
11%
6% 8% 8%
0%
5%
10%
15%
20%
25%
30%
UnaidedAwareness
Aided Awareness Ad Awareness MessageAssociation
Brand Favorability Purchase Intent
Channels by Delta
OnlineDelta
PrintDelta
TVDelta
Online Print TV
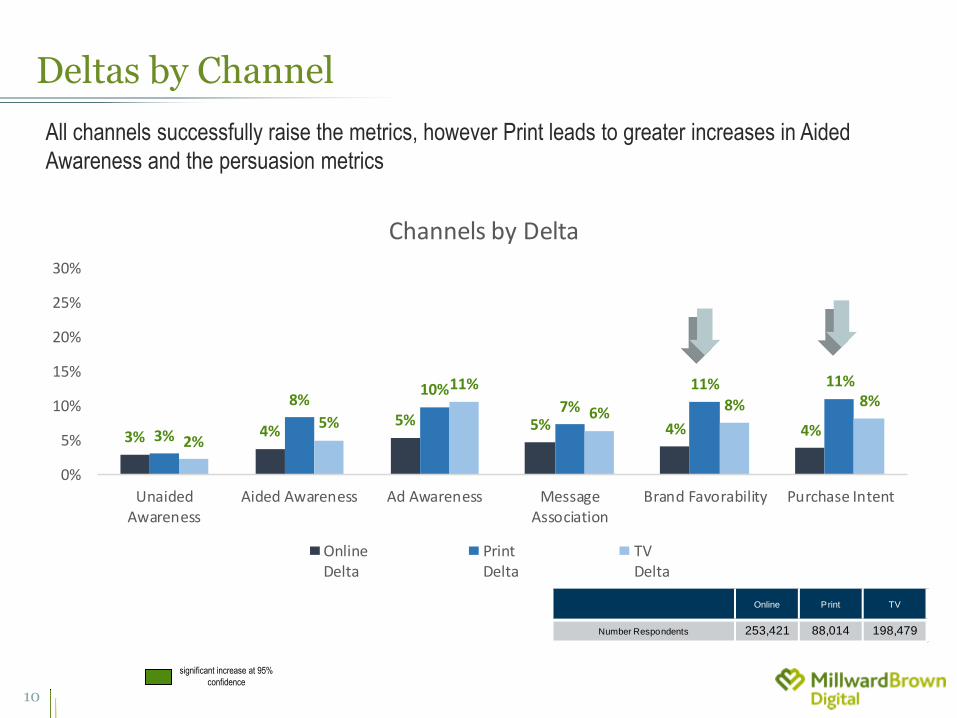
Number Respondents 253,421 88,014 198,479
All channels successfully raise the metrics, however Print leads to greater increases in Aided
Awareness and the persuasion metrics
significant increase at 95%
confidence
10
Average Deltas by Channel: Automotive
sample was statistically flat significant increase at 95%
confidence
3% 2%
6%4% 4% 4%
0%3%
7%
1%
7% 8%
3% 3%
9%6% 6% 6%
0%
5%
10%
15%
20%
25%
30%
UnaidedAwareness
Aided Awareness Ad Awareness MessageAssociation
Brand Favorability Purchase Intent
Average Channels by Delta: Automotive
OnlineDelta
PrintDelta
TVDelta
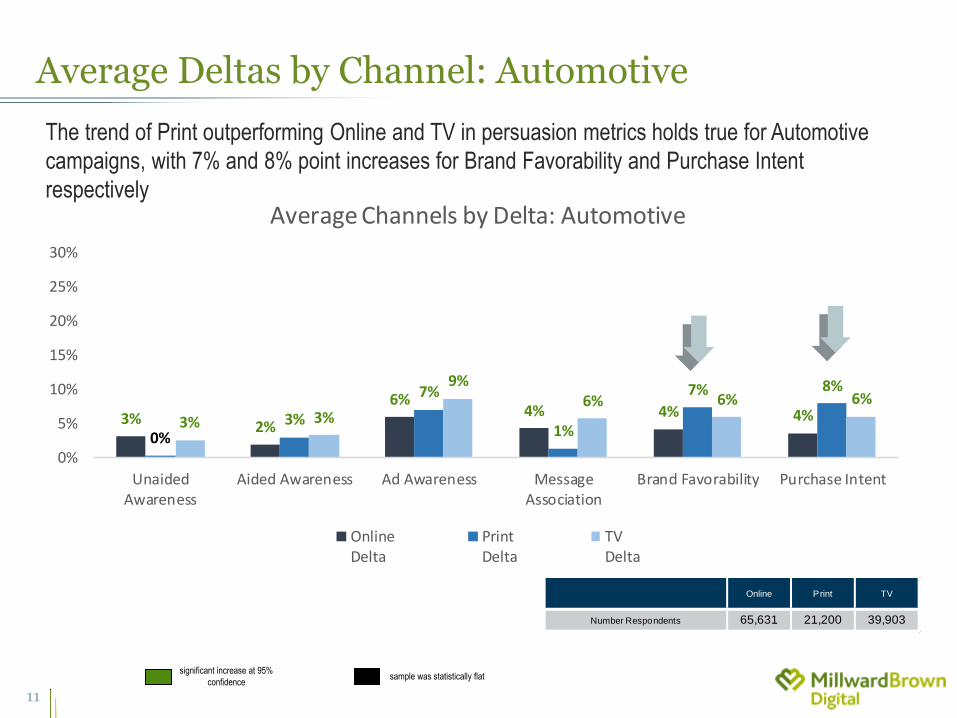
Online Print TV
Number Respondents 65,631 21,200 39,903
The trend of Print outperforming Online and TV in persuasion metrics holds true for Automotive
campaigns, with 7% and 8% point increases for Brand Favorability and Purchase Intent
respectively
11
Average Deltas by Channel: CPG
4%2%
5% 4% 4%6%
4% 3%
11%
7%9%
10%
4% 4%
7%9%
7% 7%
0%
5%
10%
15%
20%
25%
30%
UnaidedAwareness
Aided Awareness Ad Awareness MessageAssociation
Brand Favorability Purchase Intent
Average Channels by Delta: CPG
OnlineDelta
PrintDelta
TVDelta
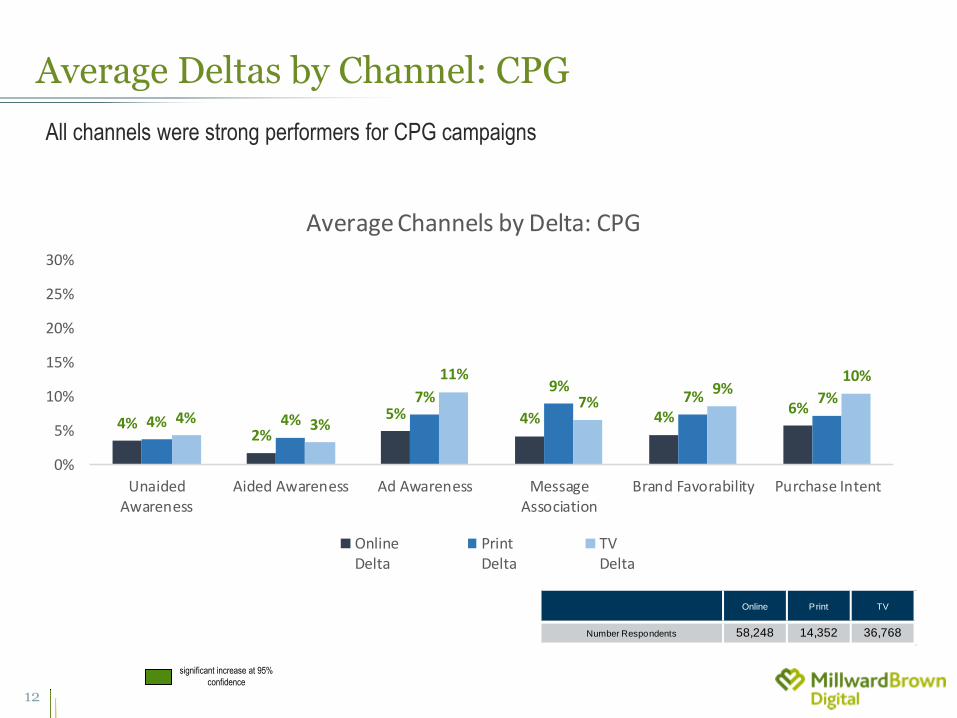
Online Print TV
Number Respondents 58,248 14,352 36,768
All channels were strong performers for CPG campaigns
significant increase at 95%
confidence
12
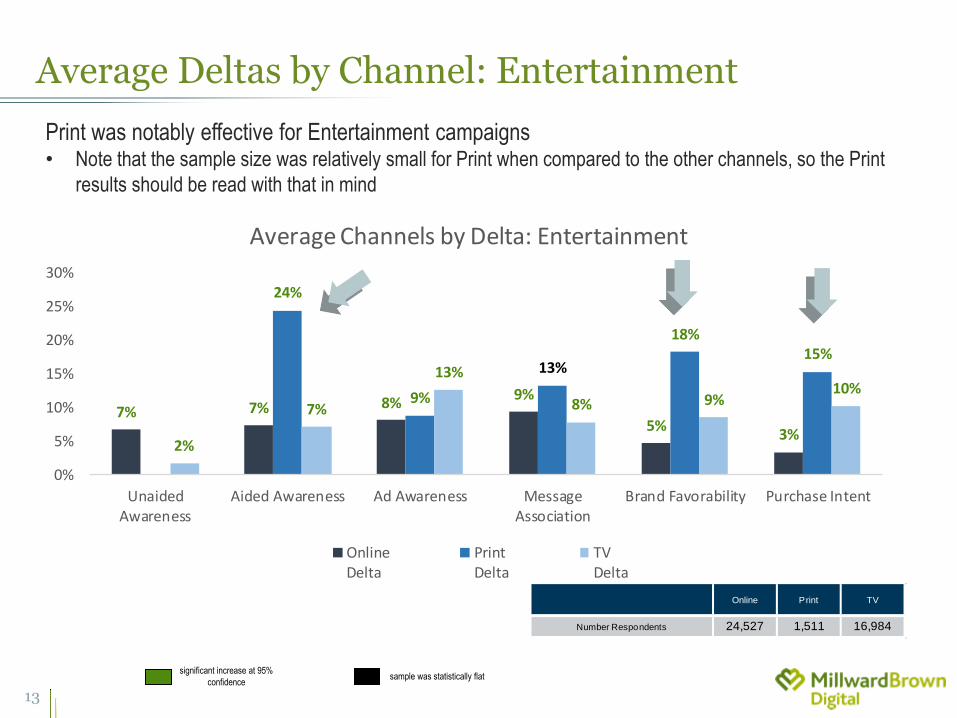
Average Deltas by Channel: Entertainment
7% 7% 8%9%
5%3%
24%
9%
13%
18%15%
2%
7%
13%
8% 9%10%
0%
5%
10%
15%
20%
25%
30%
UnaidedAwareness
Aided Awareness Ad Awareness MessageAssociation
Brand Favorability Purchase Intent
Average Channels by Delta: Entertainment
OnlineDelta
PrintDelta
TVDelta
Online Print TV
Number Respondents 24,527 1,511 16,984
Print was notably effective for Entertainment campaigns • Note that the sample size was relatively small for Print when compared to the other channels, so the Print
results should be read with that in mind
sample was statistically flat significant increase at 95%
confidence
13
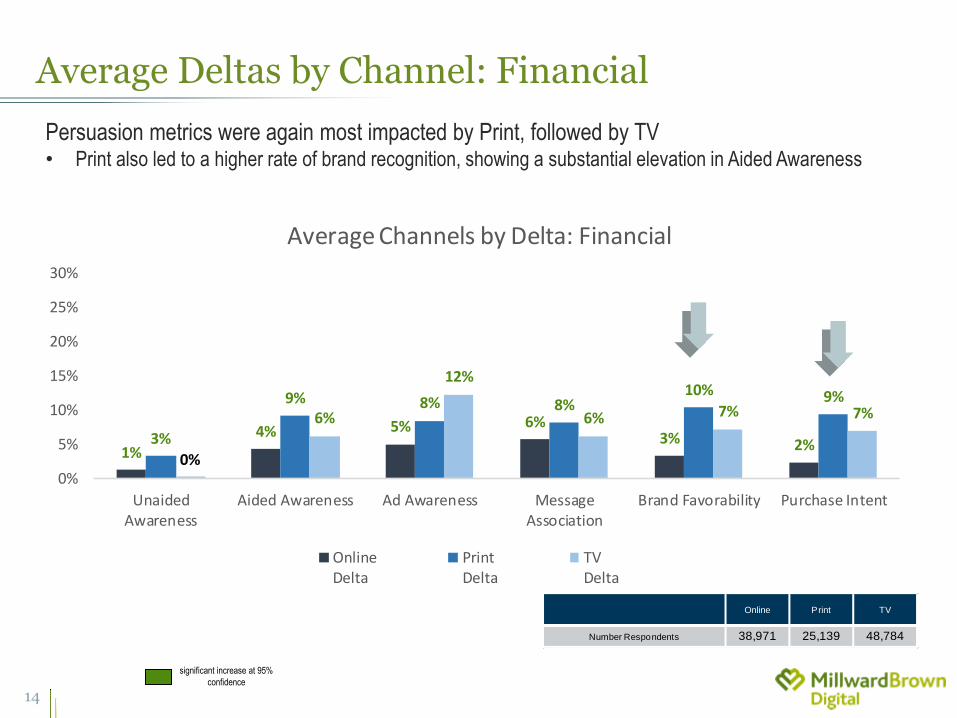
Average Deltas by Channel: Financial
1%
4% 5% 6%3% 2%3%
9% 8% 8%10% 9%
0%
6%
12%
6% 7% 7%
0%
5%
10%
15%
20%
25%
30%
UnaidedAwareness
Aided Awareness Ad Awareness MessageAssociation
Brand Favorability Purchase Intent
Average Channels by Delta: Financial
OnlineDelta
PrintDelta
TVDelta
Online Print TV
Number Respondents 38,971 25,139 48,784
Persuasion metrics were again most impacted by Print, followed by TV • Print also led to a higher rate of brand recognition, showing a substantial elevation in Aided Awareness
significant increase at 95%
confidence
14

Delivering on the Full Value of Brand Advertising
R E S U LT S B Y C O M B I N AT I O N S O F C H A N N E L S
Channel Combination Results
15
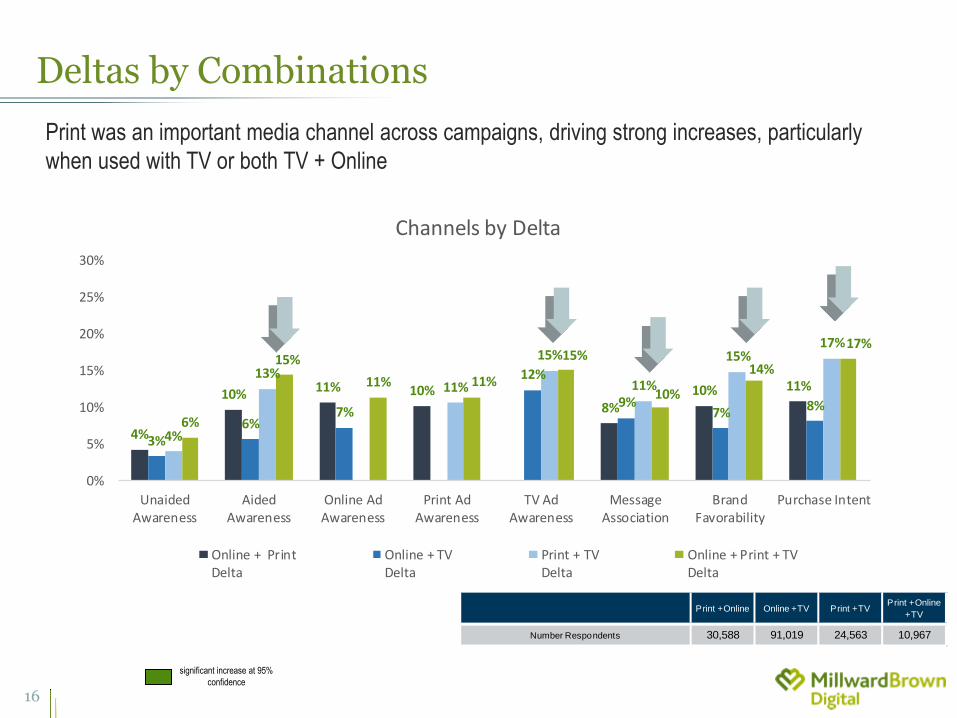
Deltas by Combinations
significant increase at 95%
confidence
4%
10% 11% 10%8%
10% 11%
3%6%
7%
12%
9%7% 8%
4%
13%11%
15%
11%
15%17%
6%
15%
11% 11%
15%
10%
14%
17%
0%
5%
10%
15%
20%
25%
30%
UnaidedAwareness
AidedAwareness
Online AdAwareness
Print AdAwareness
TV AdAwareness
MessageAssociation
BrandFavorability
Purchase Intent
Channels by Delta
Online + PrintDelta
Online + TVDelta
Print + TVDelta
Online + Print + TVDelta
Print + Online Online + TV Print + TVPrint + Online
+ TV
Number Respondents 30,588 91,019 24,563 10,967
Print was an important media channel across campaigns, driving strong increases, particularly
when used with TV or both TV + Online
16
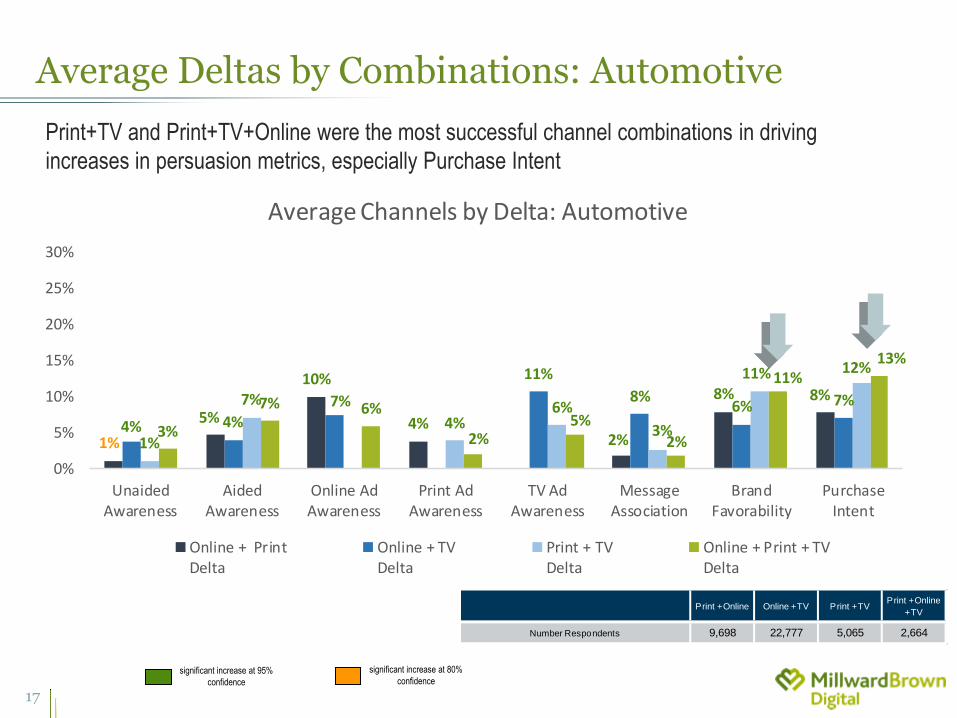
Average Deltas by Combinations: Automotive
significant increase at 80%
confidence significant increase at 95%
confidence
1%
5%
10%
4%2%
8% 8%
4% 4%7%
11%
8%6% 7%
1%
7%
4%6%
3%
11% 12%
3%
7% 6%
2%5%
2%
11%13%
0%
5%
10%
15%
20%
25%
30%
UnaidedAwareness
AidedAwareness
Online AdAwareness
Print AdAwareness
TV AdAwareness
MessageAssociation
BrandFavorability
PurchaseIntent
Average Channels by Delta: Automotive
Online + PrintDelta
Online + TVDelta
Print + TVDelta
Online + Print + TVDelta
Print + Online Online + TV Print + TVPrint + Online
+ TV
Number Respondents 9,698 22,777 5,065 2,664
Print+TV and Print+TV+Online were the most successful channel combinations in driving
increases in persuasion metrics, especially Purchase Intent
17
4%5% 5%
10%11%
9% 9%
6%4%
7%
13%
10%8%
11%
5%6%
12%
23%
12% 12%14%
7%6%
8%
12%
20%
14%12%
14%
0%
5%
10%
15%
20%
25%
30%
UnaidedAwareness
AidedAwareness
Online AdAwareness
Print AdAwareness
TV AdAwareness
MessageAssociation
BrandFavorability
PurchaseIntent
Average Channels by Delta: CPG
Online + PrintDelta
Online + TVDelta
Print + TVDelta
Online + Print + TVDelta
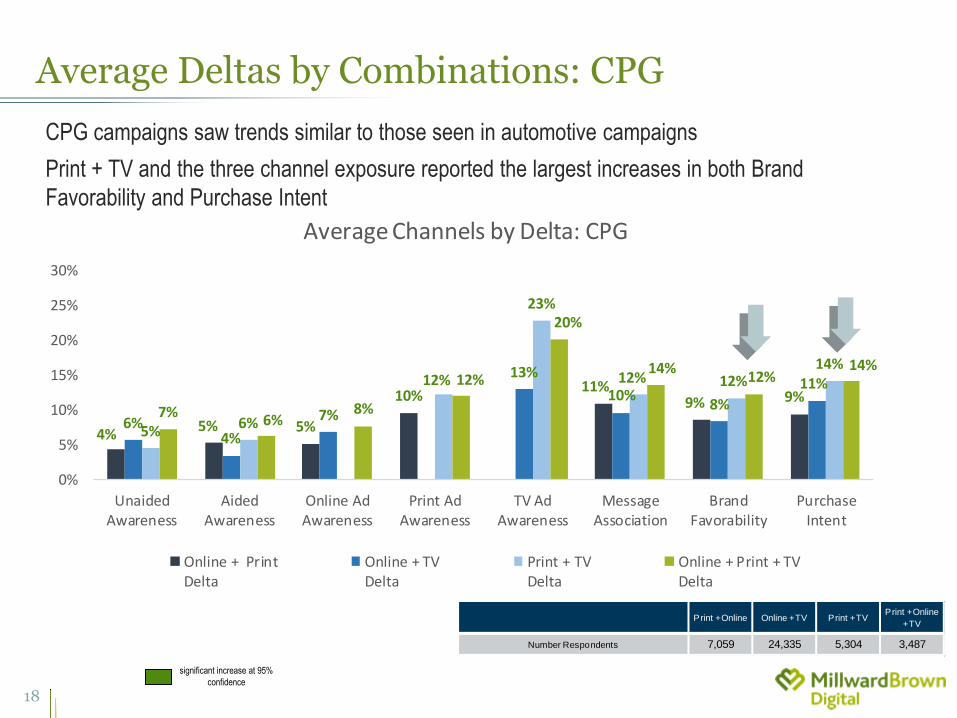
Average Deltas by Combinations: CPG
significant increase at 95%
confidence
Print + Online Online + TV Print + TVPrint + Online
+ TV
Number Respondents 7,059 24,335 5,304 3,487
CPG campaigns saw trends similar to those seen in automotive campaigns
Print + TV and the three channel exposure reported the largest increases in both Brand
Favorability and Purchase Intent
18
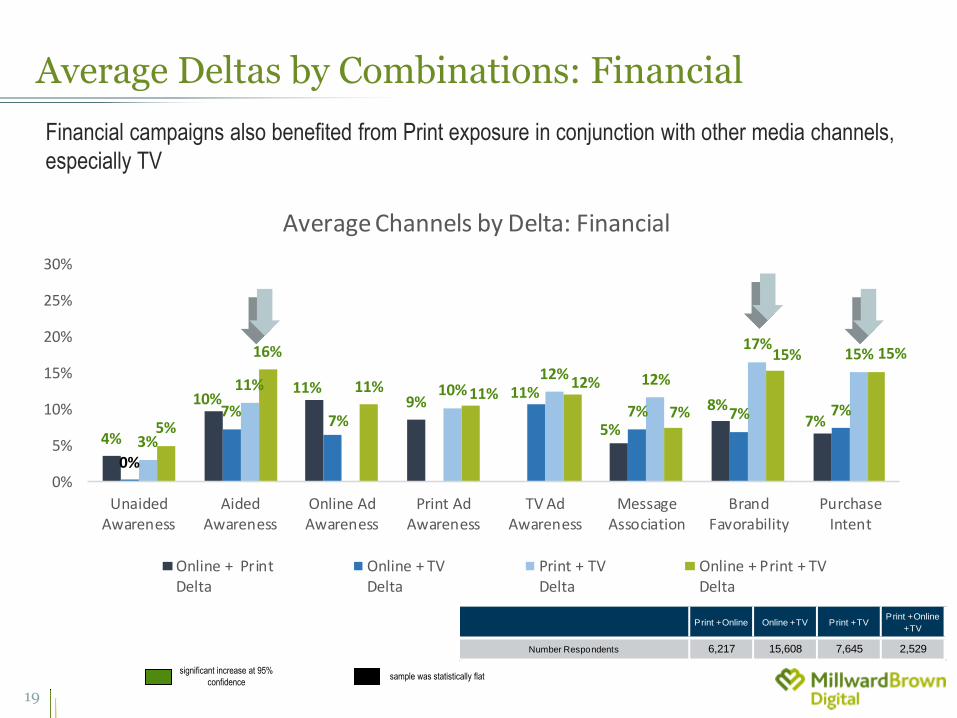
Average Deltas by Combinations: Financial
4%
10%11%
9%
5%
8%7%
0%
7%7%
11%7% 7% 7%
3%
11% 10%12% 12%
17%15%
5%
16%
11% 11%12%
7%
15% 15%
0%
5%
10%
15%
20%
25%
30%
UnaidedAwareness
AidedAwareness
Online AdAwareness
Print AdAwareness
TV AdAwareness
MessageAssociation
BrandFavorability
PurchaseIntent
Average Channels by Delta: Financial
Online + PrintDelta
Online + TVDelta
Print + TVDelta
Online + Print + TVDelta
Print + Online Online + TV Print + TVPrint + Online
+ TV
Number Respondents 6,217 15,608 7,645 2,529
Financial campaigns also benefited from Print exposure in conjunction with other media channels,
especially TV
sample was statistically flat significant increase at 95%
confidence
19

Delivering on the Full Value of Brand Advertising
C O M PA R I S O N T O O N L I N E A N D T V
Frequency Results
20

Frequency Comparison: Unaided Awareness
significant increase at 95%
confidence
3%
5%
4%
2%
3% 4%
2% 2%
2%
0%
2%
4%
6%
8%
10%
1-2 ExpDelta
3-4 ExpDelta
5+ ExpDelta
Frequency Impact on Unaided AwarenessData is Delta
Online Print TV
Unaided Awareness stabilized around mid-level exposure (3 to 4)
Optimal rate of exposures for Print was 3-4 exposures
21

Frequency Comparison: Aided Awareness
significant increase at 95%
confidence
3%4%
6%
7%
11% 12%
3%4%
5%
0%
5%
10%
15%
20%
1-2 ExpDelta
3-4 ExpDelta
5+ ExpDelta
Frequency Impact on Aided AwarenessData is Delta
Online Print TV
Print again showed the greatest ability to increase awareness, even with low exposure
22
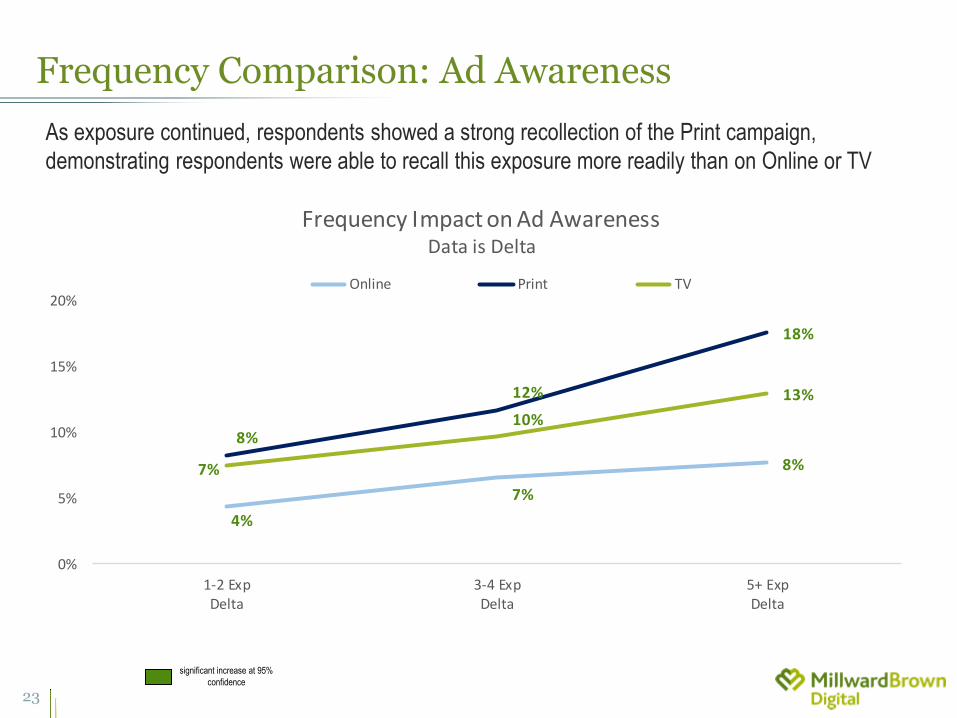
Frequency Comparison: Ad Awareness
significant increase at 95%
confidence
4%
7%
8%
8%
12%
18%
7%
10%
13%
0%
5%
10%
15%
20%
1-2 ExpDelta
3-4 ExpDelta
5+ ExpDelta
Frequency Impact on Ad AwarenessData is Delta
Online Print TV
As exposure continued, respondents showed a strong recollection of the Print campaign,
demonstrating respondents were able to recall this exposure more readily than on Online or TV
23
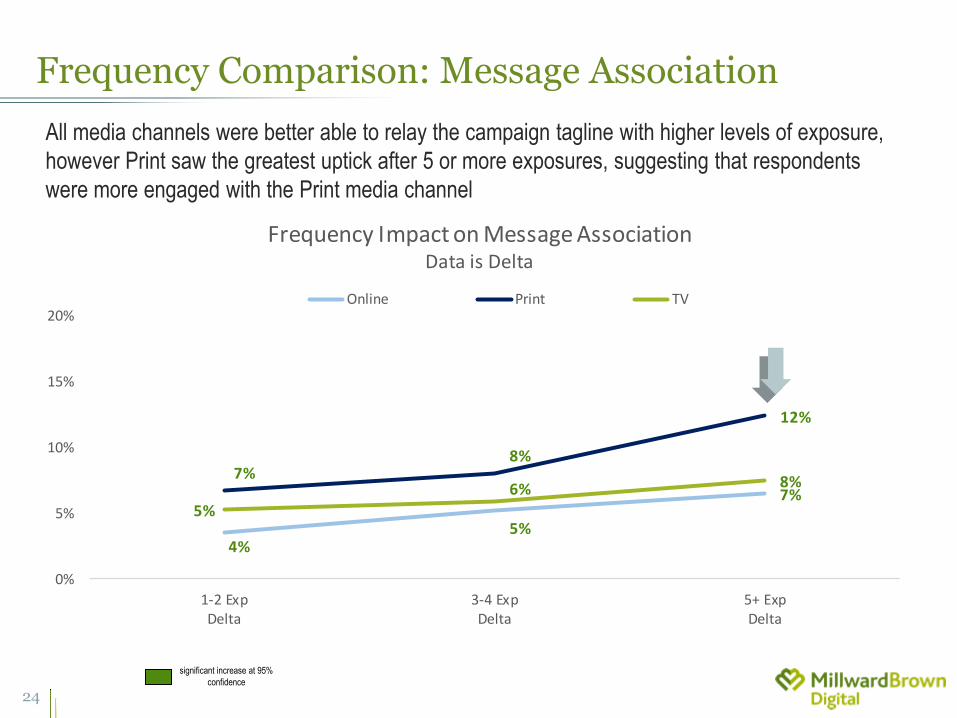
Frequency Comparison: Message Association
significant increase at 95%
confidence
4%5%
7%
7%8%
12%
5%
6% 8%
0%
5%
10%
15%
20%
1-2 ExpDelta
3-4 ExpDelta
5+ ExpDelta
Frequency Impact on Message AssociationData is Delta
Online Print TV
All media channels were better able to relay the campaign tagline with higher levels of exposure,
however Print saw the greatest uptick after 5 or more exposures, suggesting that respondents
were more engaged with the Print media channel
24
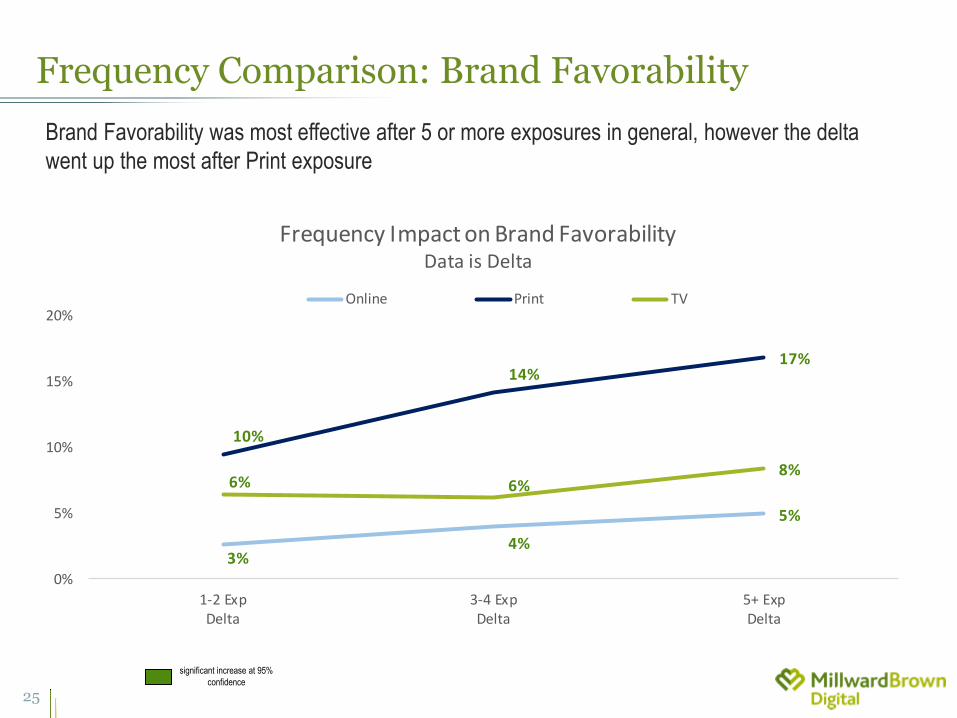
Frequency Comparison: Brand Favorability
significant increase at 95%
confidence
3%4%
5%
10%
14%17%
6% 6%8%
0%
5%
10%
15%
20%
1-2 ExpDelta
3-4 ExpDelta
5+ ExpDelta
Frequency Impact on Brand FavorabilityData is Delta
Online Print TV
Brand Favorability was most effective after 5 or more exposures in general, however the delta
went up the most after Print exposure
25
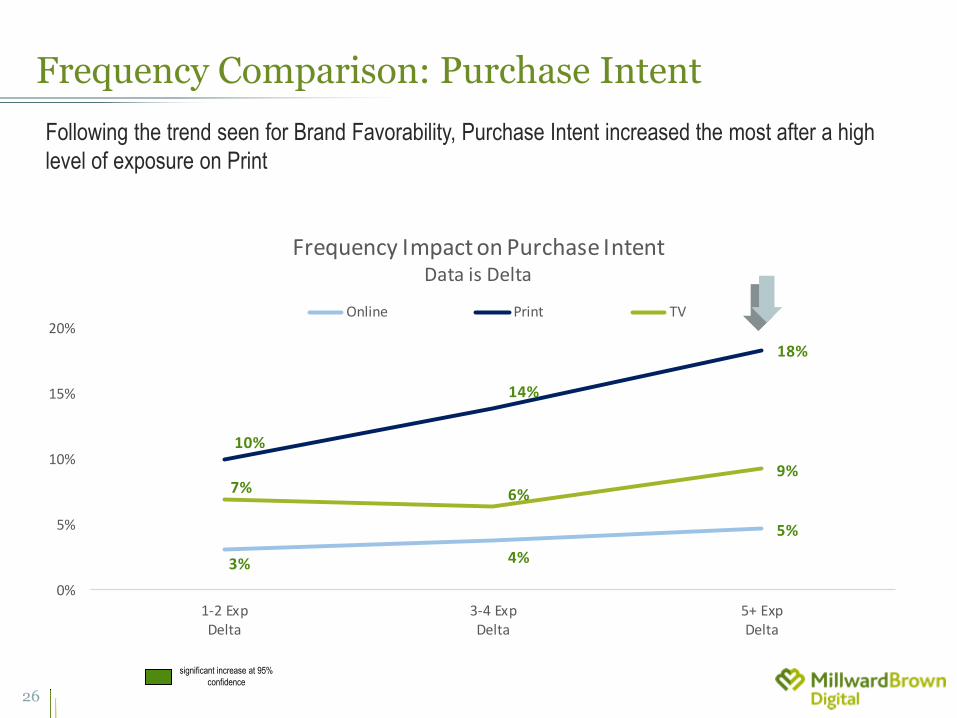
3% 4%
5%
10%
14%
18%
7% 6%
9%
0%
5%
10%
15%
20%
1-2 ExpDelta
3-4 ExpDelta
5+ ExpDelta
Frequency Impact on Purchase IntentData is Delta
Online Print TV
Frequency Comparison: Purchase Intent
significant increase at 95%
confidence
Following the trend seen for Brand Favorability, Purchase Intent increased the most after a high
level of exposure on Print
26
Delivering on the Full Value of Brand Advertising
A N I N - D E P T H L O O K AT P R I N T F R E Q U E N C Y
Print Frequency Results
27
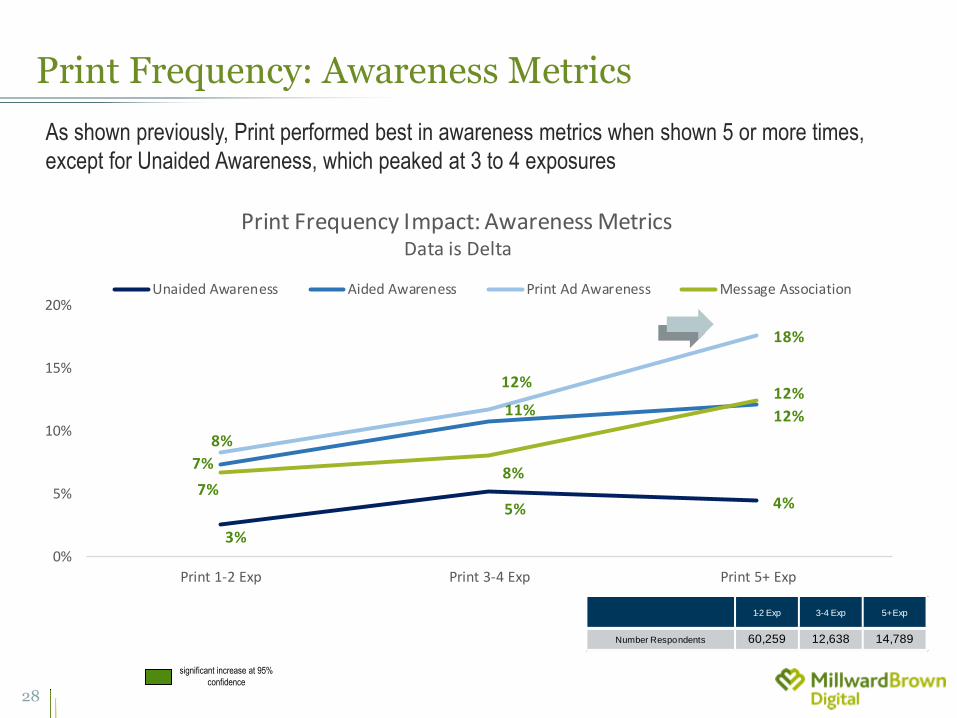
Print Frequency: Awareness Metrics
significant increase at 95%
confidence
3%
5% 4%
7%
11% 12%
8%
12%
18%
7%8%
12%
0%
5%
10%
15%
20%
Print 1-2 Exp Print 3-4 Exp Print 5+ Exp
Print Frequency Impact: Awareness MetricsData is Delta
Unaided Awareness Aided Awareness Print Ad Awareness Message Association
1-2 Exp 3-4 Exp 5+ Exp
Number Respondents 60,259 12,638 14,789
As shown previously, Print performed best in awareness metrics when shown 5 or more times,
except for Unaided Awareness, which peaked at 3 to 4 exposures
28
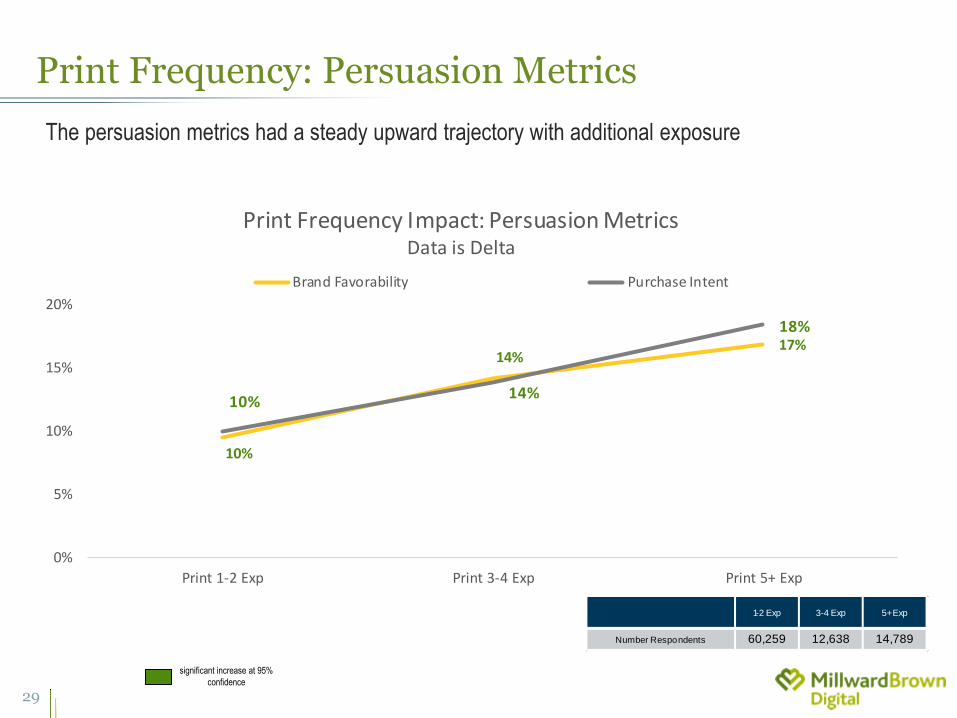
Print Frequency: Persuasion Metrics
significant increase at 95%
confidence
10%
14%17%
10%14%
18%
0%
5%
10%
15%
20%
Print 1-2 Exp Print 3-4 Exp Print 5+ Exp
Print Frequency Impact: Persuasion MetricsData is Delta
Brand Favorability Purchase Intent
1-2 Exp 3-4 Exp 5+ Exp
Number Respondents 60,259 12,638 14,789
The persuasion metrics had a steady upward trajectory with additional exposure
29
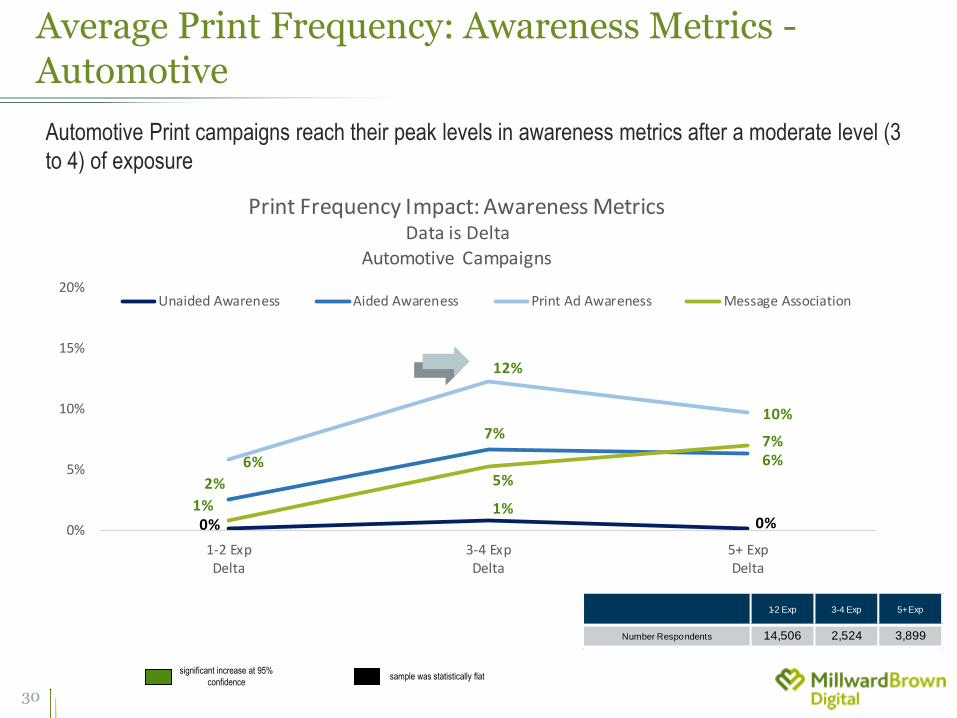
0%1%
0%
2%
7%
6%6%
12%
10%
1%
5%
7%
0%
5%
10%
15%
20%
1-2 ExpDelta
3-4 ExpDelta
5+ ExpDelta
Print Frequency Impact: Awareness MetricsData is Delta
Automotive Campaigns
Unaided Awareness Aided Awareness Print Ad Awareness Message Association
Average Print Frequency: Awareness Metrics - Automotive
1-2 Exp 3-4 Exp 5+ Exp
Number Respondents 14,506 2,524 3,899
Automotive Print campaigns reach their peak levels in awareness metrics after a moderate level (3
to 4) of exposure
sample was statistically flat significant increase at 95%
confidence
30
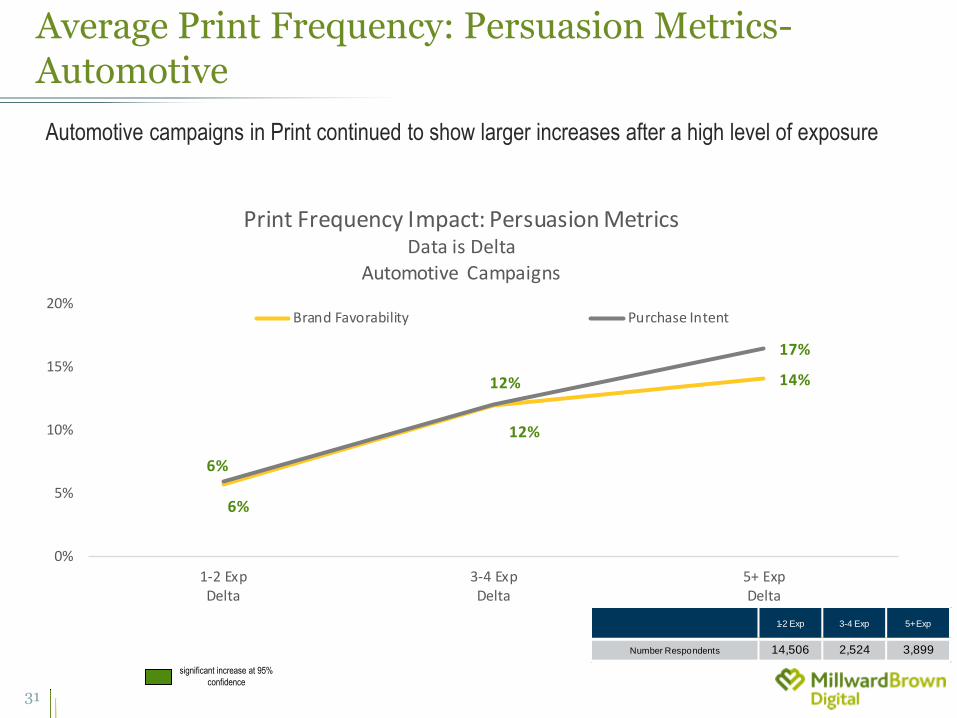
Average Print Frequency: Persuasion Metrics- Automotive
significant increase at 95%
confidence
6%
12%
14%
6%
12%
17%
0%
5%
10%
15%
20%
1-2 ExpDelta
3-4 ExpDelta
5+ ExpDelta
Print Frequency Impact: Persuasion MetricsData is Delta
Automotive Campaigns
Brand Favorability Purchase Intent
1-2 Exp 3-4 Exp 5+ Exp
Number Respondents 14,506 2,524 3,899
Automotive campaigns in Print continued to show larger increases after a high level of exposure
31
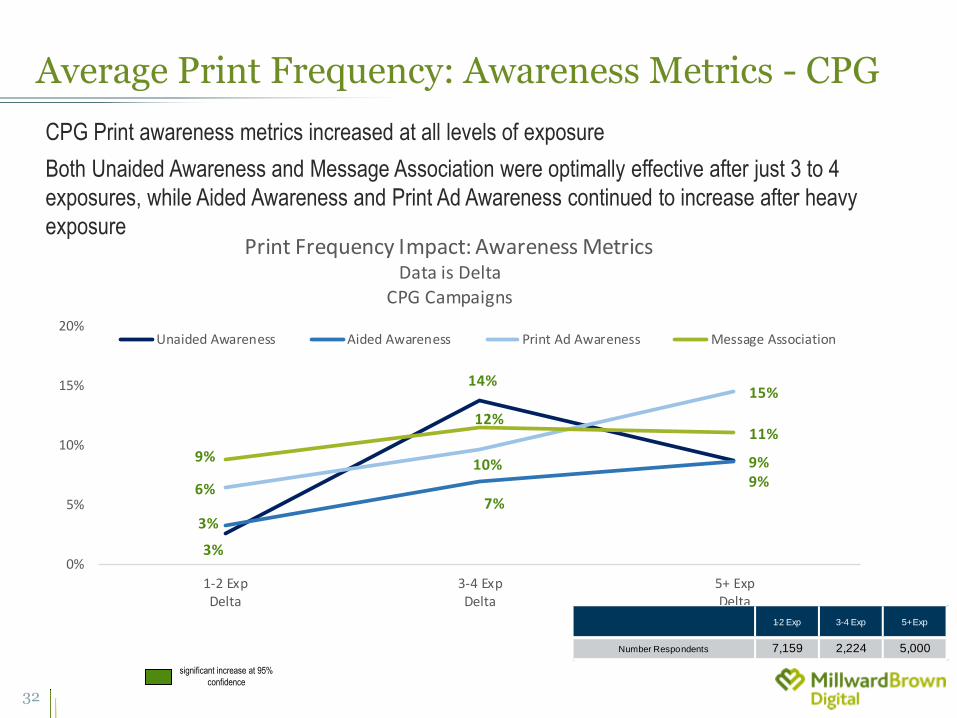
Average Print Frequency: Awareness Metrics - CPG
significant increase at 95%
confidence
3%
14%
9%
3%7%
9%6%
10%
15%
9%
12%11%
0%
5%
10%
15%
20%
1-2 ExpDelta
3-4 ExpDelta
5+ ExpDelta
Print Frequency Impact: Awareness MetricsData is Delta
CPG Campaigns
Unaided Awareness Aided Awareness Print Ad Awareness Message Association
1-2 Exp 3-4 Exp 5+ Exp
Number Respondents 7,159 2,224 5,000
CPG Print awareness metrics increased at all levels of exposure
Both Unaided Awareness and Message Association were optimally effective after just 3 to 4
exposures, while Aided Awareness and Print Ad Awareness continued to increase after heavy
exposure
32
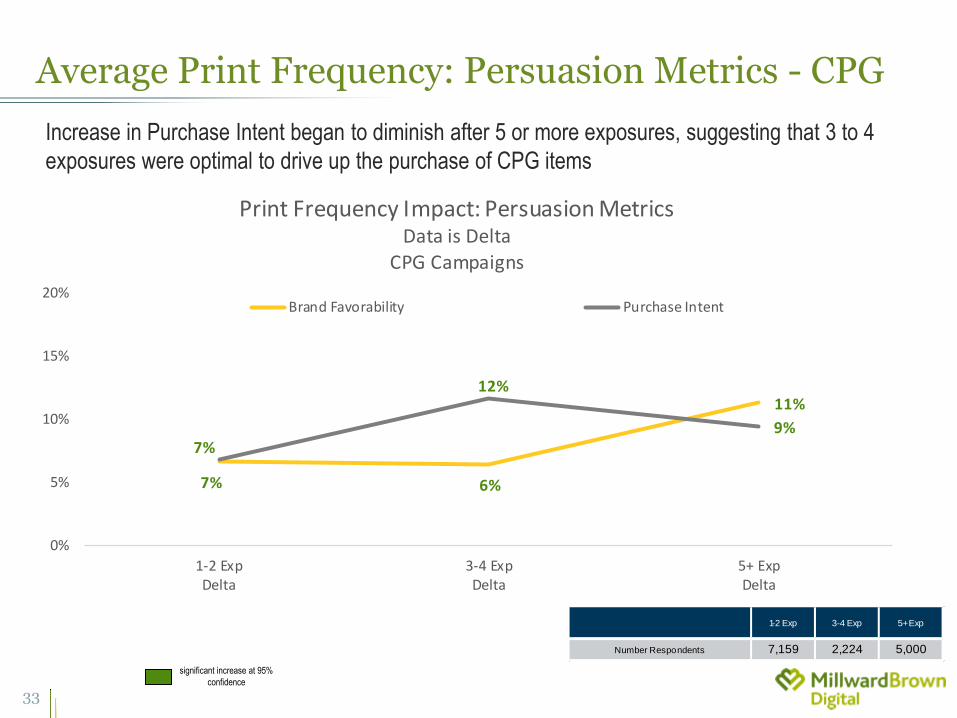
Average Print Frequency: Persuasion Metrics - CPG
significant increase at 95%
confidence
7% 6%
11%
7%
12%
9%
0%
5%
10%
15%
20%
1-2 ExpDelta
3-4 ExpDelta
5+ ExpDelta
Print Frequency Impact: Persuasion MetricsData is Delta
CPG Campaigns
Brand Favorability Purchase Intent
1-2 Exp 3-4 Exp 5+ Exp
Number Respondents 7,159 2,224 5,000
Increase in Purchase Intent began to diminish after 5 or more exposures, suggesting that 3 to 4
exposures were optimal to drive up the purchase of CPG items
33
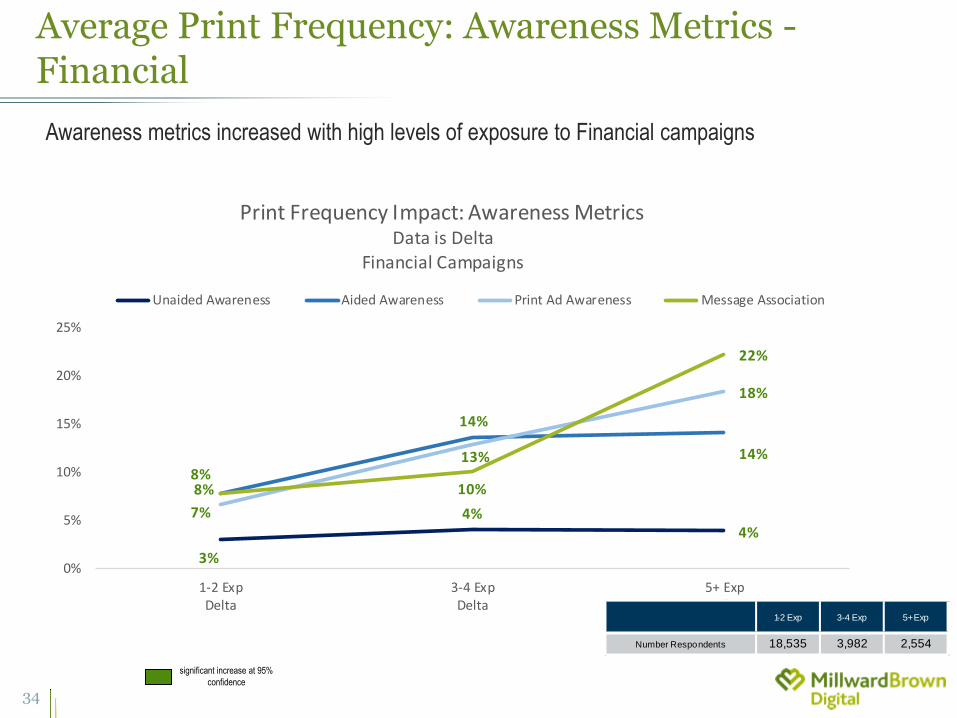
Average Print Frequency: Awareness Metrics - Financial
significant increase at 95%
confidence
3%
4%4%
8%
14%
14%
7%
13%
18%
8%10%
22%
0%
5%
10%
15%
20%
25%
1-2 ExpDelta
3-4 ExpDelta
5+ ExpDelta
Print Frequency Impact: Awareness MetricsData is Delta
Financial Campaigns
Unaided Awareness Aided Awareness Print Ad Awareness Message Association
1-2 Exp 3-4 Exp 5+ Exp
Number Respondents 18,535 3,982 2,554
Awareness metrics increased with high levels of exposure to Financial campaigns
34
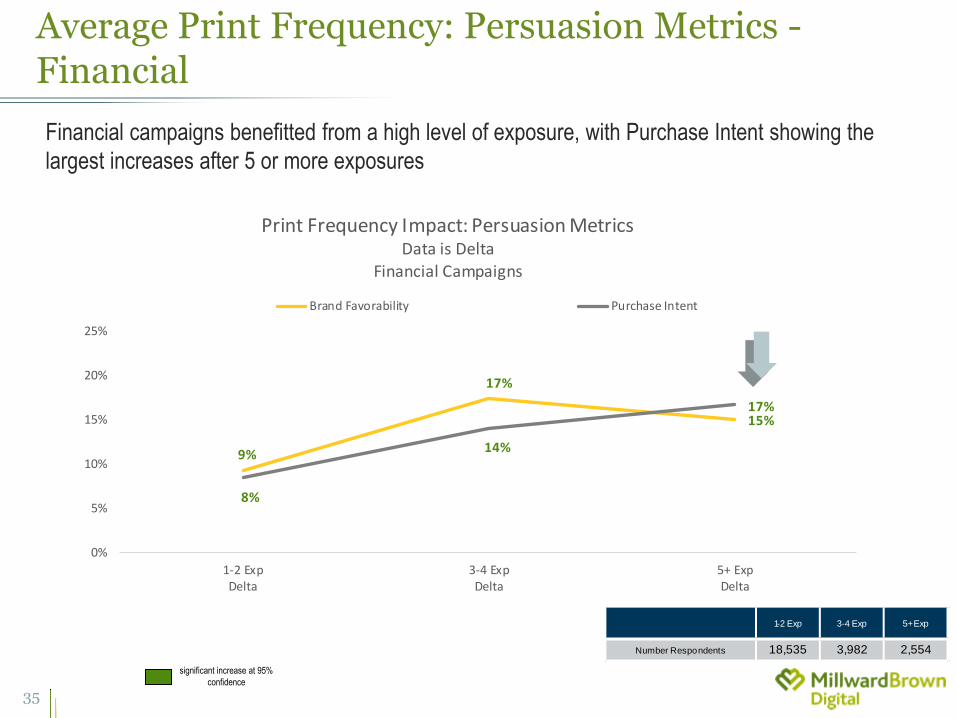
9%
17%
15%
8%
14%
17%
0%
5%
10%
15%
20%
25%
1-2 ExpDelta
3-4 ExpDelta
5+ ExpDelta
Print Frequency Impact: Persuasion MetricsData is Delta
Financial Campaigns
Brand Favorability Purchase Intent
Average Print Frequency: Persuasion Metrics - Financial
significant increase at 95%
confidence
1-2 Exp 3-4 Exp 5+ Exp
Number Respondents 18,535 3,982 2,554
Financial campaigns benefitted from a high level of exposure, with Purchase Intent showing the
largest increases after 5 or more exposures
35

Delivering on the Full Value of Brand Advertising
R E S U LT S B Y G E N D E R
Demographic Results
36
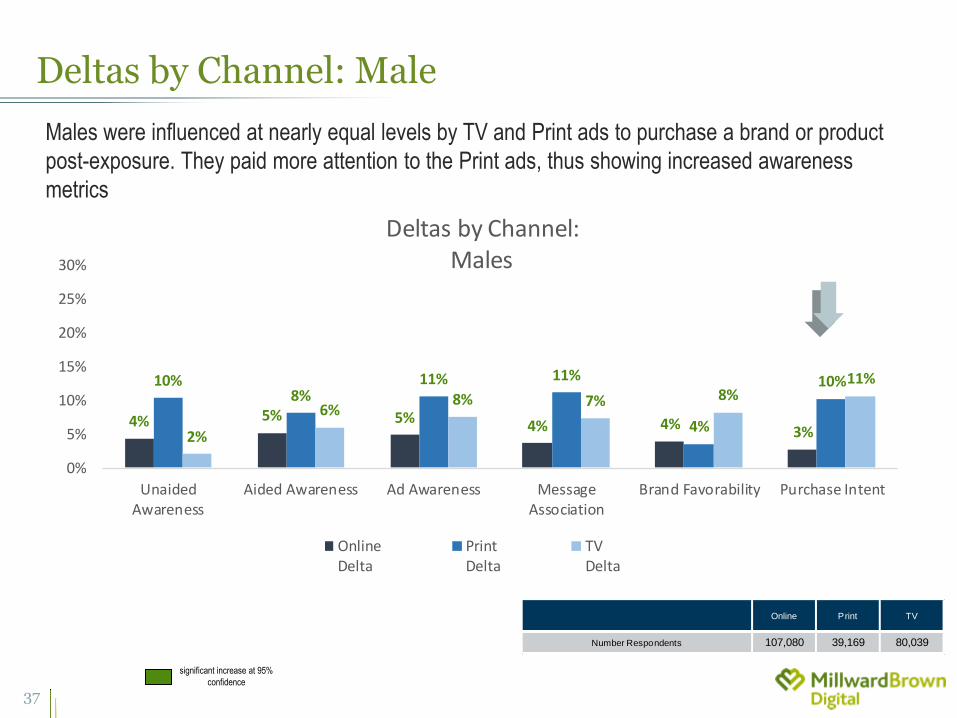
4% 5% 5%4% 4% 3%
10%8%
11% 11%
4%
10%
2%
6%8% 7% 8%
11%
0%
5%
10%
15%
20%
25%
30%
UnaidedAwareness
Aided Awareness Ad Awareness MessageAssociation
Brand Favorability Purchase Intent
Deltas by Channel:Males
OnlineDelta
PrintDelta
TVDelta
Deltas by Channel: Male
significant increase at 95%
confidence
Males were influenced at nearly equal levels by TV and Print ads to purchase a brand or product
post-exposure. They paid more attention to the Print ads, thus showing increased awareness
metrics
Online Print TV
Number Respondents 107,080 39,169 80,039
37
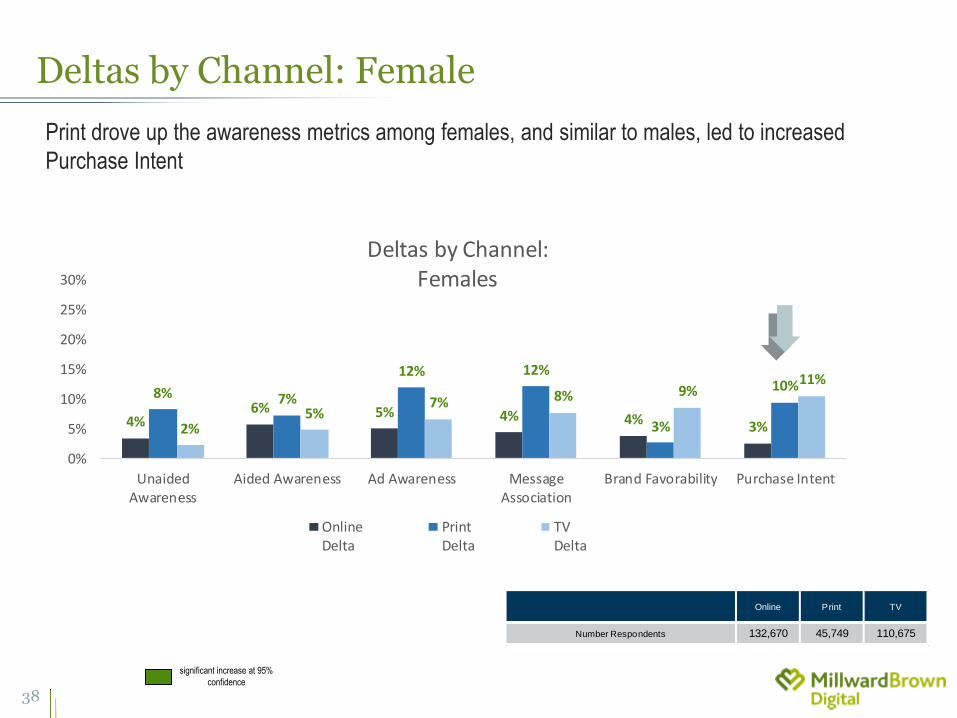
4%6% 5% 4% 4% 3%
8% 7%
12% 12%
3%
10%
2%5%
7% 8% 9%11%
0%
5%
10%
15%
20%
25%
30%
UnaidedAwareness
Aided Awareness Ad Awareness MessageAssociation
Brand Favorability Purchase Intent
Deltas by Channel:Females
OnlineDelta
PrintDelta
TVDelta
Deltas by Channel: Female
significant increase at 95%
confidence
Print drove up the awareness metrics among females, and similar to males, led to increased
Purchase Intent
Online Print TV
Number Respondents 132,670 45,749 110,675
38

Delivering on the Full Value of Brand Advertising
Appendix
39
Getting the Most from the Study
• MPA Members may use charts/findings from this study in sales and
marketing materials.
• Source all charts/findings, either within copy or footnoted on charts.
• Source: The Print Campaign Analysis, prepared for MPA by
Millward Brown Digital, September 2015
• Any analyses based on the data, but not specifically included in the
study, may not be sourced to the study without approval from the MPA
and Millward Brown Digital.
• MPA Members should contact Elizabeth Tighe ([email protected])
for approvals and additional information.
40

Delivering on the Full Value of Brand Advertising
Ashley Gragg
Senior Analyst, Insights and Analytics
(415) 321-3719
Questions:
41
![thebitterbusiness.files.wordpress.com€¦ · Web view[Print media advertising, online advertising, SMS, mail-out, giveaway, media release, social media campaign or event.] [Why](https://static.fdocuments.in/doc/165x107/5f06c0757e708231d4198e2d/web-view-print-media-advertising-online-advertising-sms-mail-out-giveaway.jpg)