
Princeton University Financial Overview · Princeton University Financial Overview ... Princeton...
21
Princeton University Financial Overview Carolyn Ainslie Vice President for Finance and Treasurer October 16, 2013
Transcript of Princeton University Financial Overview · Princeton University Financial Overview ... Princeton...
Princeton University Financial OverviewCarolyn AinslieVice President for Finance and TreasurerOctober 16, 2013
Princeton Finance Facts• Endowment Driven: Princeton has one of the highest endowments per
student in the country, providing almost half of the operating budget.
• Every Student is Subsidized: Educational expenditures are approximately double Princeton’s tuition.
• Robust Financial Aid: 60% of our entering freshman class receive institutional financial aid and all doctoral students are guaranteed tuition and stipend support while fully enrolled.
• Superb Investment Performance: Over 25 years, the average annual growth rate has been 12%; despite big hit in 2009.
• Strong Research Program: Princeton researchers compete effectively for federal dollars, but the government over time has required an increasingly large co‐investment from the University.
2
Princeton Finance Facts • Labor‐Centered: Human capital accounts for more than 40% of
Princeton’s overall operating expenditures.
• Strategic Planning for Capital: The University has a multi‐year capital plan that focuses on priorities and incorporates the use of reserves to fund projects; re‐pay debt; and to endow the cost of on‐going operations and maintenance costs.
• Prudent Cash Management: Accumulated balances and strategic borrowing have positioned the University to address liquidity issues effectively.
• The Long View: Decisions today are carefully considered for their impact on the University in the long view
3
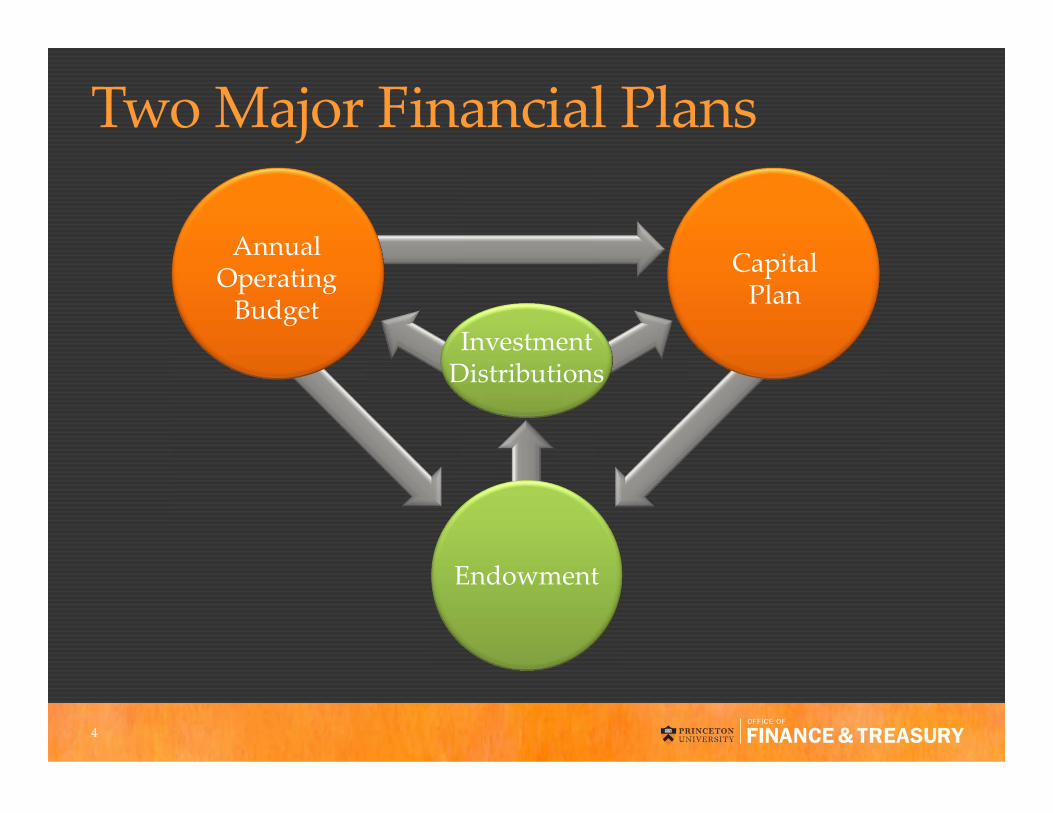
Two Major Financial Plans
Endowment
Capital Plan
Annual Operating Budget
InvestmentDistributions
4
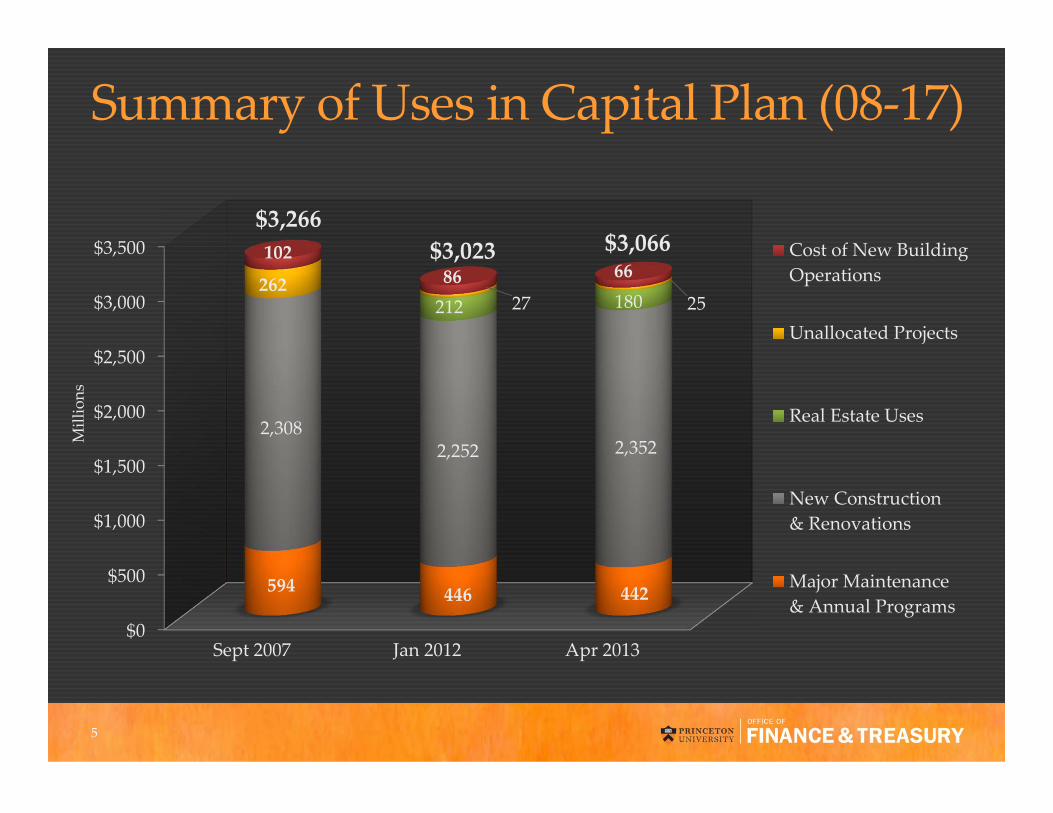
Summary of Uses in Capital Plan (08‐17)
$0
$500
$1,000
$1,500
$2,000
$2,500
$3,000
$3,500
Sept 2007 Jan 2012 Apr 2013
594 446 442
2,308 2,252 2,352
212 180 262
27 25
102 86 66
Cost of New BuildingOperations
Unallocated Projects
Real Estate Uses
New Construction& Renovations
Major Maintenance& Annual Programs
$3,266$3,023 $3,066
Millions
5
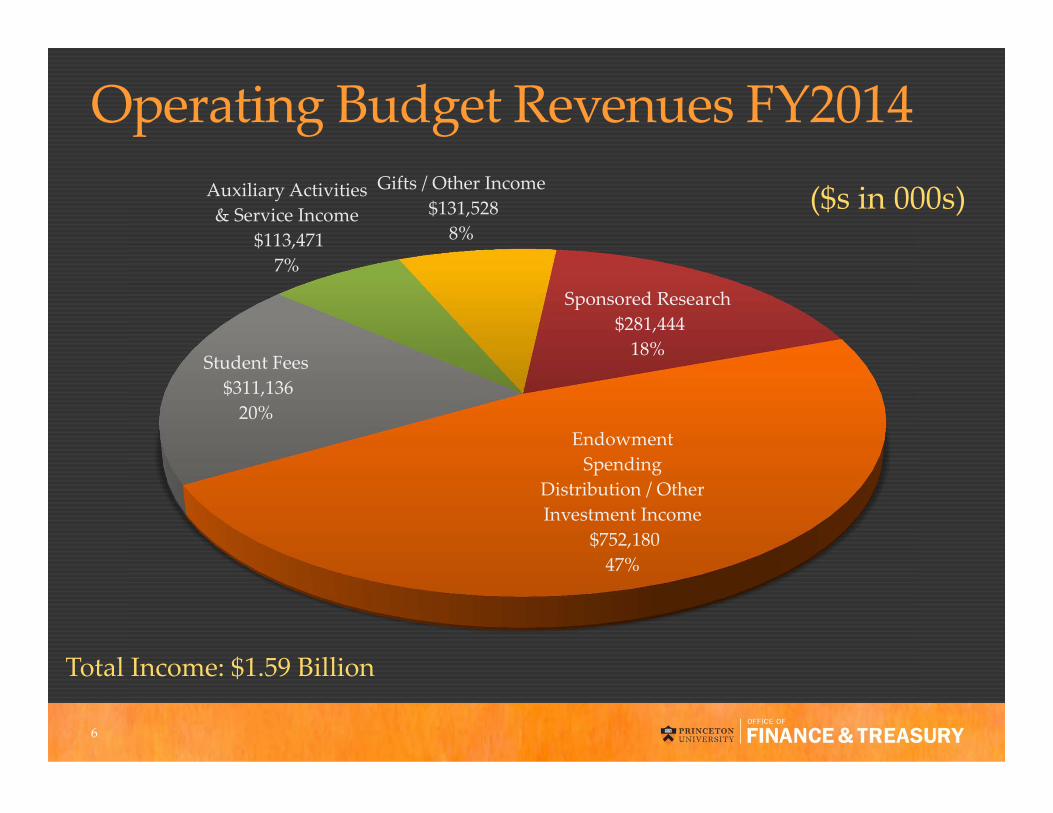
Endowment Spending
Distribution / Other Investment Income
$752,180 47%
Student Fees$311,136 20%
Auxiliary Activities & Service Income
$113,471 7%
Gifts / Other Income$131,528
8%
Sponsored Research$281,444 18%
Operating Budget Revenues FY2014
Total Income: $1.59 Billion
($s in 000s)
6
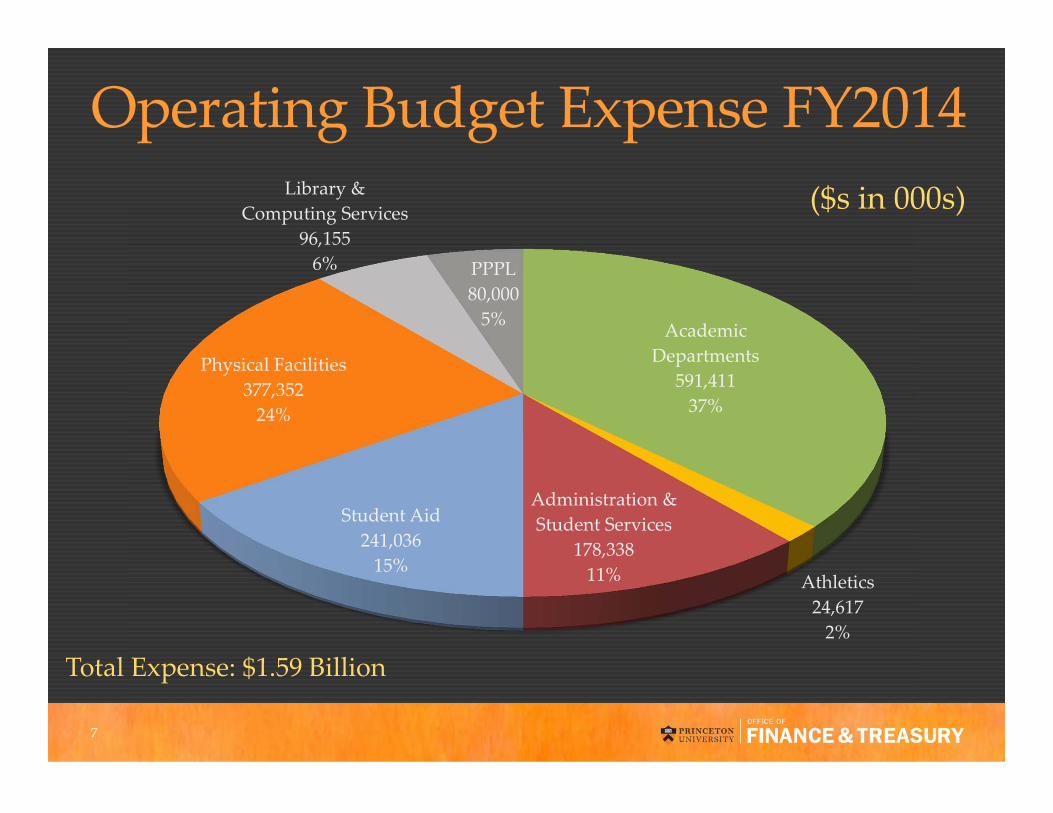
Academic Departments
591,41137%
Athletics24,6172%
Administration & Student Services
178,33811%
Student Aid241,03615%
Physical Facilities377,35224%
Library & Computing Services
96,1556% PPPL
80,0005%
Operating Budget Expense FY2014
Total Expense: $1.59 Billion
($s in 000s)
7
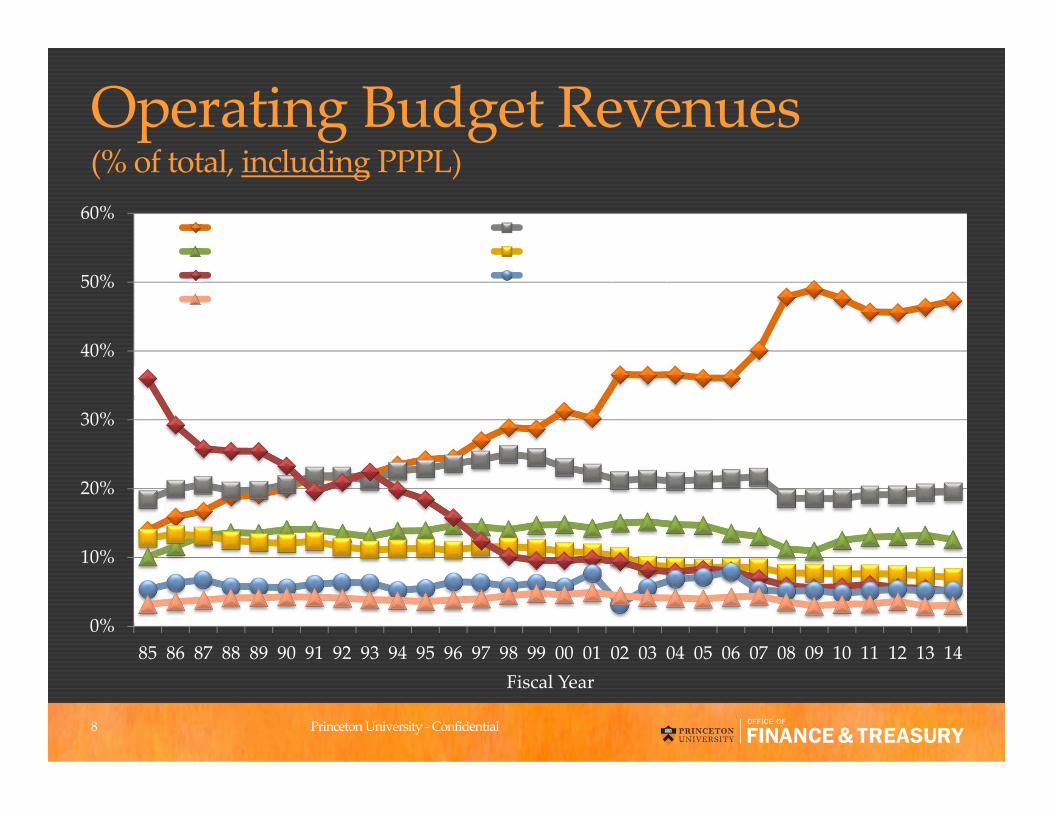
Operating Budget Revenues (% of total, including PPPL)
0%
10%
20%
30%
40%
50%
60%
85 86 87 88 89 90 91 92 93 94 95 96 97 98 99 00 01 02 03 04 05 06 07 08 09 10 11 12 13 14Fiscal Year
Invest. Income Student FeesSpons Res (no PPPL) Aux Activ. & Service DeptsPPPL Private Gifts, Grants, and Other Inc.Annual Giving
8 Princeton University ‐Confidential
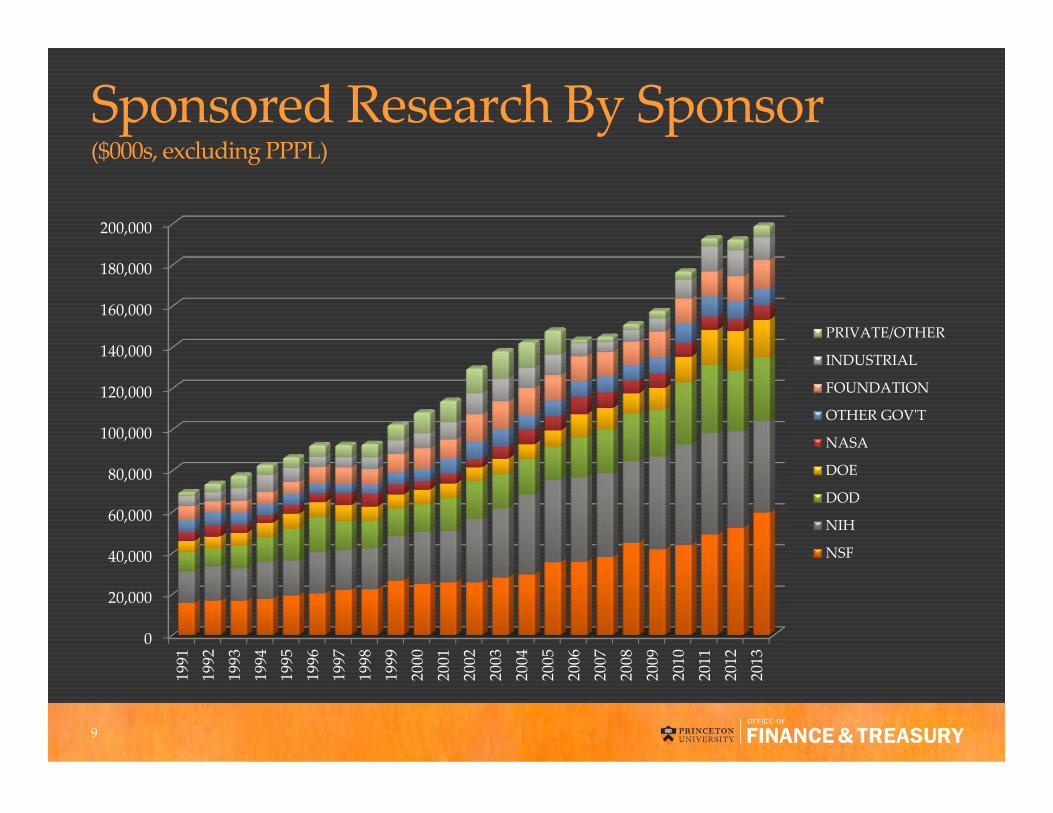
Sponsored Research By Sponsor ($000s, excluding PPPL)
0
20,000
40,000
60,000
80,000
100,000
120,000
140,000
160,000
180,000
200,000
1991
1992
1993
1994
1995
1996
1997
1998
1999
2000
2001
2002
2003
2004
2005
2006
2007
2008
2009
2010
2011
2012
2013
PRIVATE/OTHER
INDUSTRIAL
FOUNDATION
OTHER GOVʹT
NASA
DOE
DOD
NIH
NSF
9
Endowment Mechanics• Most endowments include a variety of funds
• True endowments are assets that were specified by the donor to be held in perpetuity to support particular activities or programs
• Quasi endowments are assets that are treated as if they were endowments, but may be spent freely as needed
• The primary pool is composed of 4,129 discrete funds• Each fund owns units, based on unit value when entering the
primary pool
• Units receive spending distributions quarterly per trustee policy
• As of June 30, 2013, primary pool consisted of 2.02M units valued at $8,830 each
*FY13 endowment value is preliminary
10
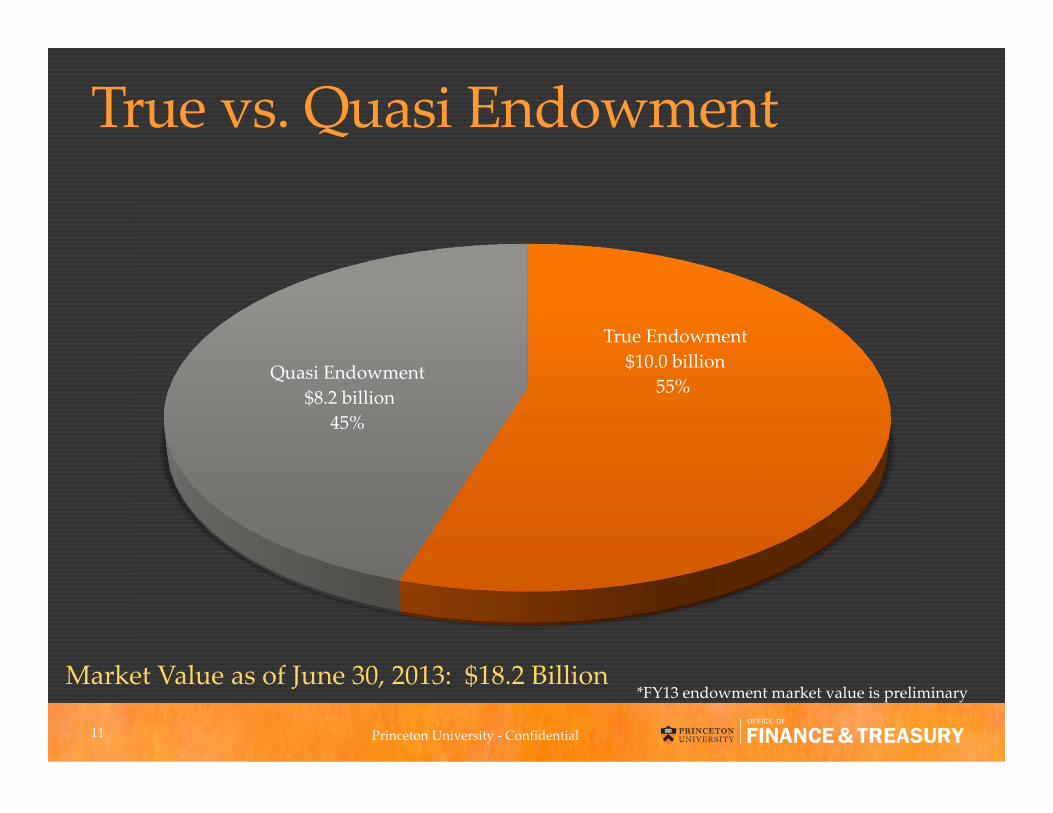
True Endowment$10.0 billion
55%Quasi Endowment
$8.2 billion 45%
True vs. Quasi Endowment
Market Value as of June 30, 2013: $18.2 Billion
Princeton University ‐ Confidential
*FY13 endowment market value is preliminary
11
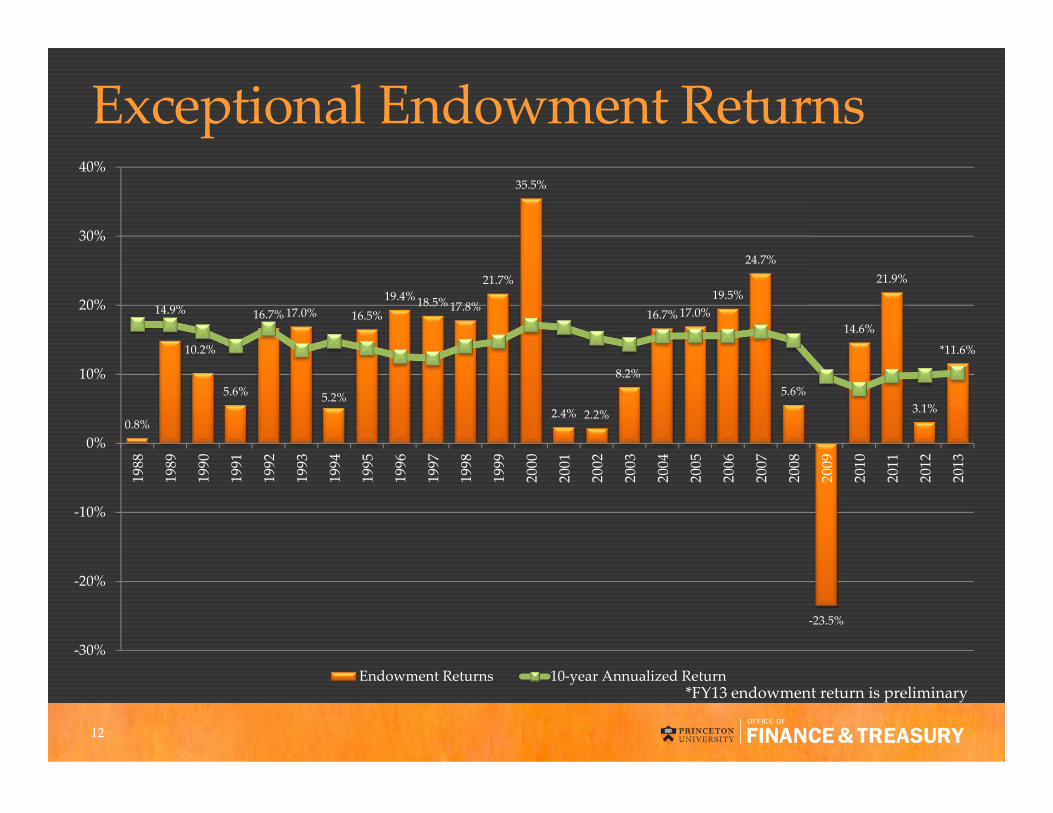
Exceptional Endowment Returns
0.8%
14.9%
10.2%
5.6%
16.7%17.0%
5.2%
16.5%19.4%18.5%17.8%
21.7%
35.5%
2.4% 2.2%
8.2%
16.7%17.0%19.5%
24.7%
5.6%
‐23.5%
14.6%
21.9%
3.1%
*11.6%
‐30%
‐20%
‐10%
0%
10%
20%
30%
40%
1988
1989
1990
1991
1992
1993
1994
1995
1996
1997
1998
1999
2000
2001
2002
2003
2004
2005
2006
2007
2008
2009
2010
2011
2012
2013
Endowment Returns 10‐year Annualized Return*FY13 endowment return is preliminary
12
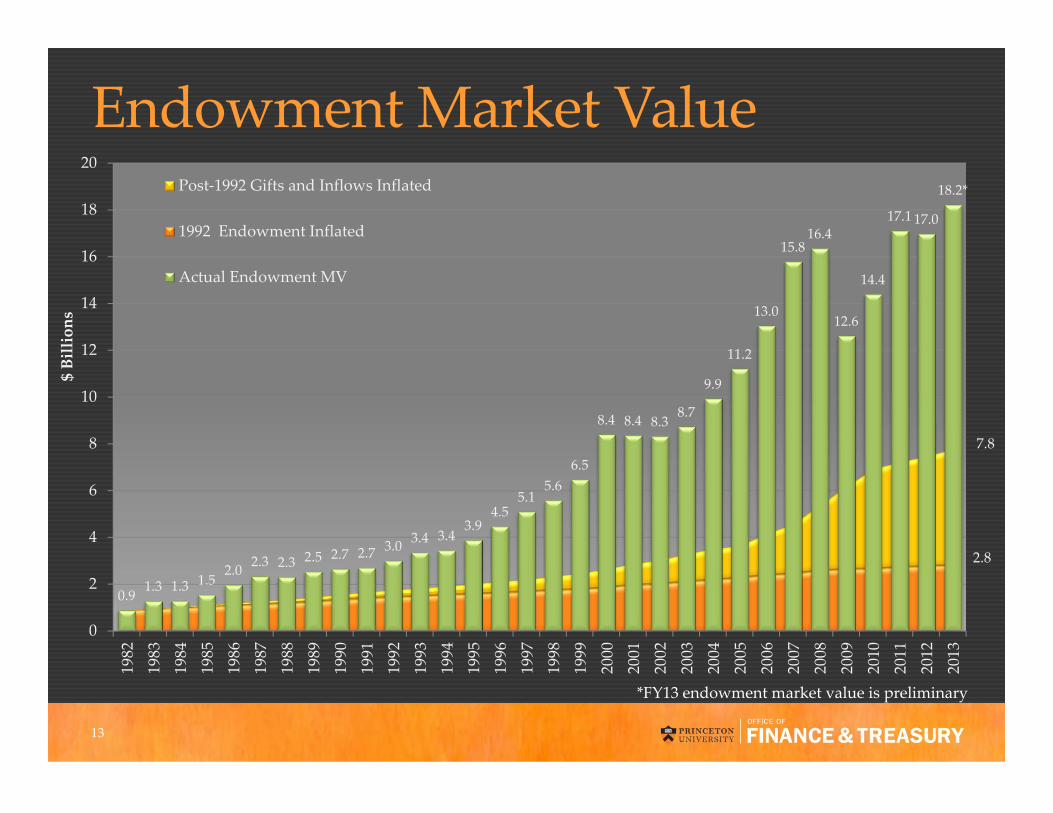
Endowment Market Value
0.9 1.3 1.3 1.52.0 2.3 2.3 2.5 2.7 2.7 3.0 3.4 3.4
3.94.5
5.15.6
6.5
8.4 8.4 8.38.7
9.9
11.2
13.0
15.816.4
12.6
14.4
17.1 17.0
18.2*
0
2
4
6
8
10
12
14
16
18
20
1982
1983
1984
1985
1986
1987
1988
1989
1990
1991
1992
1993
1994
1995
1996
1997
1998
1999
2000
2001
2002
2003
2004
2005
2006
2007
2008
2009
2010
2011
2012
2013
$ Billions
Post‐1992 Gifts and Inflows Inflated
1992 Endowment Inflated
Actual Endowment MV
7.8
2.8
*FY13 endowment market value is preliminary
13
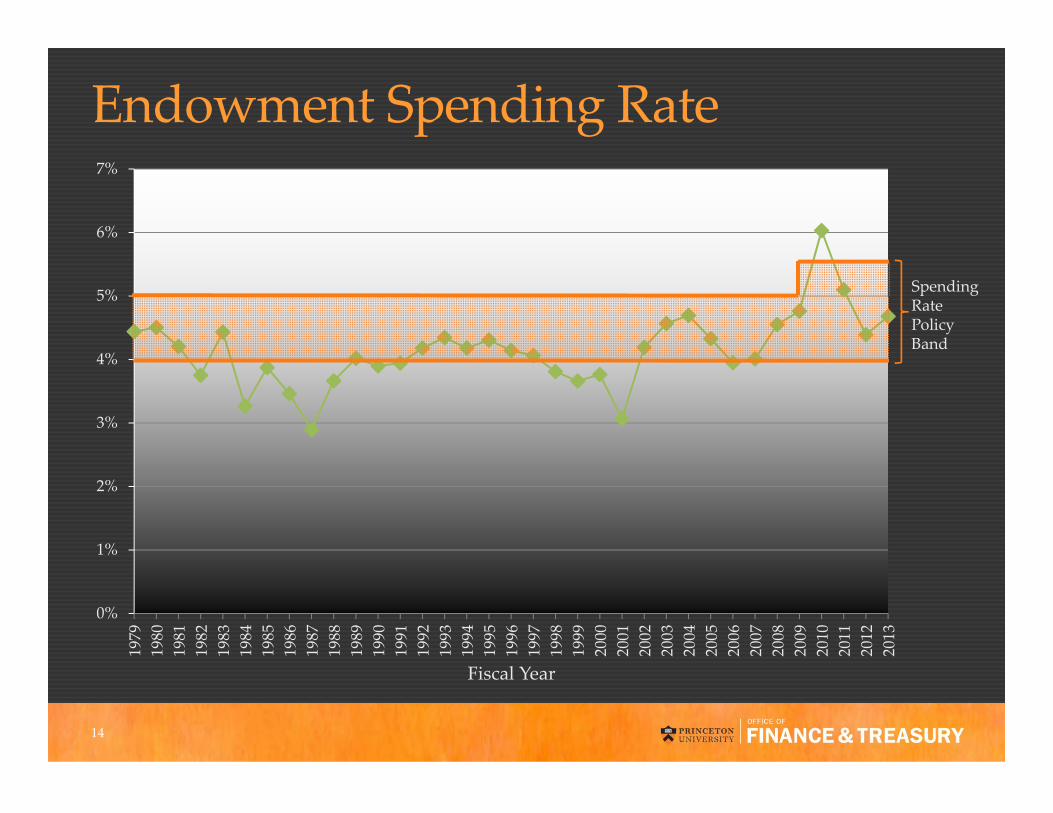
Endowment Spending Rate
0%
1%
2%
3%
4%
5%
6%
7%
1979
1980
1981
1982
1983
1984
1985
1986
1987
1988
1989
1990
1991
1992
1993
1994
1995
1996
1997
1998
1999
2000
2001
2002
2003
2004
2005
2006
2007
2008
2009
2010
2011
2012
2013
SpendingRate Policy Band
Fiscal Year
14

PRINCETON PRIME
15
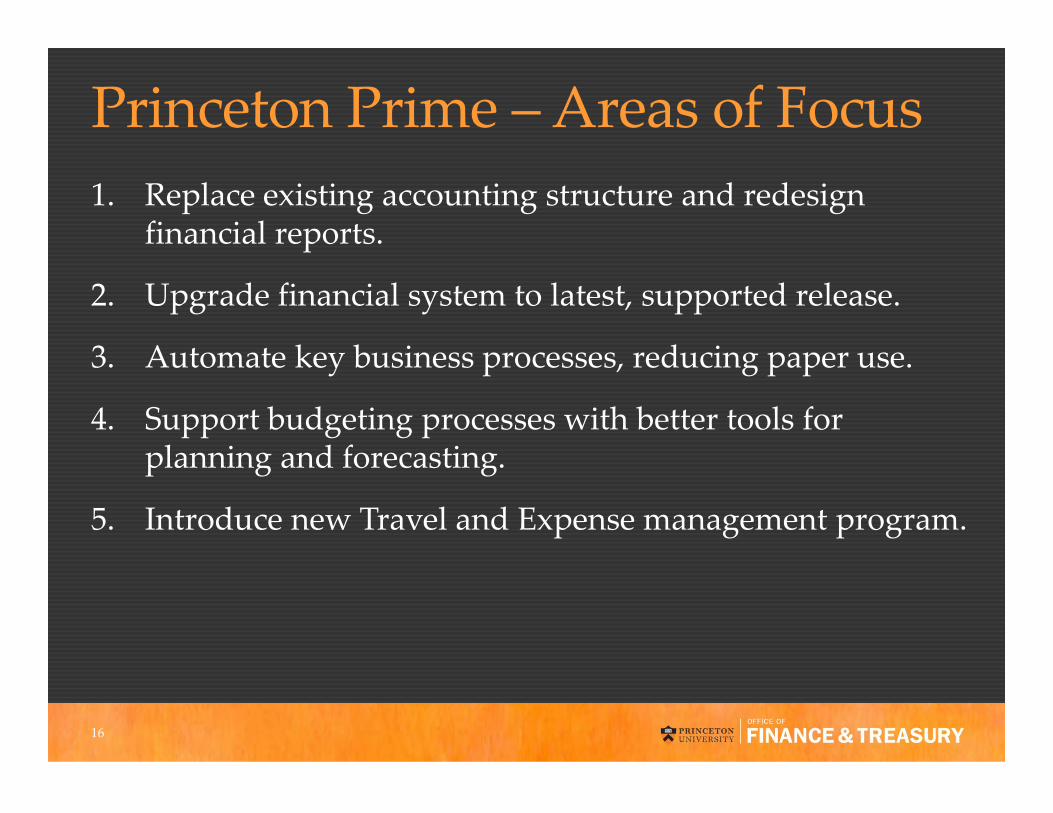
Princeton Prime –Areas of Focus 1. Replace existing accounting structure and redesign
financial reports.
2. Upgrade financial system to latest, supported release.
3. Automate key business processes, reducing paper use.
4. Support budgeting processes with better tools for planning and forecasting.
5. Introduce new Travel and Expense management program.
16

Implications for Departments• Account and Department codes will change.• Less effort for financial managers to answer basic financial
management questions. For example:• How much has Department A spent on travel, recruiting, etc. ?• How much funding does Professor Smith have available, including
gifts, grants and contracts?• Were funds spent in compliance with their restrictions?
• PIs and Grants Managers will have financial reports by award that map to their award budgets.
• Easier to manage and track interdisciplinary activities (e.g. a shared conference).
17
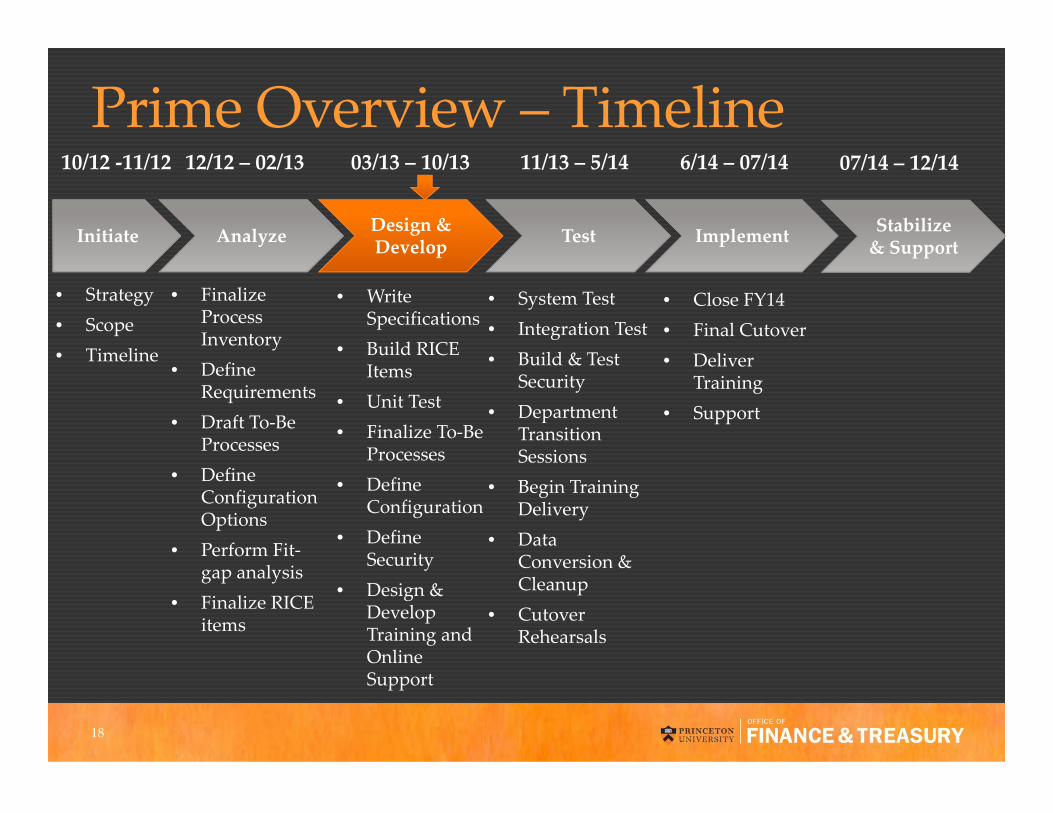
Prime Overview – Timeline
Initiate Analyze Design & Develop Test Implement
• System Test• Integration Test• Build & Test
Security• Department
Transition Sessions
• Begin Training Delivery
• Data Conversion & Cleanup
• Cutover Rehearsals
03/13 – 10/13
• Write Specifications
• Build RICE Items
• Unit Test• Finalize To‐Be
Processes• Define
Configuration• Define
Security• Design &
Develop Training and Online Support
12/12 – 02/13 11/13 – 5/14 6/14 – 07/14
• Close FY14• Final Cutover• Deliver
Training• Support
• Finalize Process Inventory
• Define Requirements
• Draft To‐Be Processes
• Define Configuration Options
• Perform Fit‐gap analysis
• Finalize RICE items
• Strategy• Scope• Timeline
Stabilize & Support
07/14 – 12/1410/12 ‐11/12
18

ContactsName Contact Information
Financial Service Center7 New South
[email protected]‐258‐3080
Carolyn Ainslie, VP for Finance and Treasurer
[email protected]‐258‐1447
Mark DingfieldPrinceton Prime
[email protected]@princeton.edu609‐258‐3873
Finance & Treasury website http://finance.princeton.edu19

Thank you!