Princeton Mule Deer Composition Surveys
16
Princeton Mule Deer Composition Surveys: December 2012 Produced By Aaron Reid Ministry of Forests, Lands and Natural Resource Operations Fish & Wildlife Section Penticton, BC January 2013
Transcript of Princeton Mule Deer Composition Surveys

Princeton Mule Deer Composition Surveys:
December 2012
Produced By Aaron Reid
Ministry of Forests, Lands and Natural Resource Operations
Fish & Wildlife Section
Penticton, BC
January 2013

2 | P a g e
Executive Summary
Two survey days, December 7th
and 8th
, were completed to assess composition ratios for mule
deer in MUs 8-04, 8-05 and 8-06 in 2012. Winter ranges surveyed included Allenby, Jura,
Hembrie Mtn, Lorne Lk, Mount Miner, Whipsaw Ck and Willis Ck.
A total sample size of 693 mule deer was counted and classified during the survey. The total
survey time was approximately 12.7 hrs. I calculated the total buck to doe ratio for all MUs at
12 bucks: 100 does ([CI 90%] 9-16), 9 < 4pt bucks: 100 does (CI 7-12) and 2 > 4pt bucks: 100
does (CI 0-4). I calculated 49 fawns: 100 does (CI 46-52). For observations where bucks were
recorded there was at least one doe in the group 78% of the time.
Mule deer ranged between 640 m and 1600 m elevation during the surveys. Bucks, > 4pt and <
4pt, were observed throughout this elevation range. There was no significant difference in
elevation between buck and doe observations during the survey (P=0.3).
In addition to mule deer, a total of 336 elk were classified in MU 8-04, 8-05 and 8-06 including
254 cows, 54 calves, 12 spike bulls, 5 raghorn bulls, 9 5pt bulls, 1 6pt and 1 unclassified.
Sufficient sample sizes were collected to run sightability models for elk. The survey coverage
for elk was not complete but the sample size (n=336) was sufficient to analyse bull, calf, and 6pt
ratios using an incomplete sightability model.
The primary target for this survey was mule deer. Therefore, we did not have complete survey
coverage of the study area for elk. Sightability corrected bull ratios were 11 bulls: 100 cows (CI
10-12) and estimated calf ratios were 21 calves: 100 cows (CI 20-22). We observed mature bulls
away from cow calf groups during the time of survey. As well, several large elk groups were
observed at the end of the survey when the light was poor. Classification in the air and from
photos was not ideal. For these reasons, we need to use caution when interpreting the bull and
calf ratios for this survey.
This survey suggests that mule deer buck ratios are lower than Ministry targets across all three
MUs. Therefore, buck ratio should be re-sampled in 2013. It is recommended to survey in mid-
November, during peak rut, regardless of snow level to maximize sightability of bucks.

3 | P a g e
Table of Contents List of Figures ................................................................................................................................................ 4
Introduction .................................................................................................................................................. 5
Study Area ..................................................................................................................................................... 5
Methods ........................................................................................................................................................ 7
Survey Area Selection ............................................................................................................................... 7
Survey Procedures .................................................................................................................................... 7
Classification ............................................................................................................................................. 7
Data Analysis ............................................................................................................................................. 8
Mule Deer ............................................................................................................................................. 8
Elk .......................................................................................................................................................... 8
Results ........................................................................................................................................................... 8
Composition .............................................................................................................................................. 8
All MUs (8-04, 8-05, 8-06) ..................................................................................................................... 8
8-04 ....................................................................................................................................................... 8
8-05 ....................................................................................................................................................... 8
8-06 ....................................................................................................................................................... 9
Elevation ................................................................................................................................................. 11
Other Species .......................................................................................................................................... 11
Elk ........................................................................................................................................................ 12
Discussion.................................................................................................................................................... 12
Sightability .............................................................................................................................................. 12
Composition ............................................................................................................................................ 13
Management Recommendation ............................................................................................................. 13
Elk ............................................................................................................................................................ 13
Literature Cited ........................................................................................................................................... 15

4 | P a g e
List of Figures Figure 1: Map showing study area for mule deer composition in December, 2012 ...................................... 6
Figure 2: Map showing ungulate observations scaled to group size and flight path during the composition
surveys in MU 8-04, 8-05 and 8-06 on December 7st
and 8th, 2012. ........................................................... 10
Figure 3: Distribution of mule deer does and bucks observations by elevation during the December 7th and
8th survey in MU 8-04, 8-05 and 8-06. ........................................................................................................ 11
List of Tables Table 1: Classification of mule deer observed during composition surveys in MU 8-04, 8-05, 8-06 on
December 7th and 8
th, 2012. .......................................................................................................................... 9
Table 2: Other species observed during mule deer surveys in MU 8-04, 8-05 and 8-06 on December 7th
and 8th, 2012. ............................................................................................................................................... 11

5 | P a g e
Introduction In 2010, Region 8 applied the new Southern Interior Mule Deer Harvest Strategy (MOE Mule
Deer Harvest Strategy, 2010) to: align hunting seasons with adjacent Regions, simplify hunting
regulations, and increase mule deer hunting opportunity in the Okanagan Region. The most
significant change of the new harvest strategy was an increase to the “any buck” season through
the entire month of October across all Management Units (MU). This change increased the “any
buck” season by 10 days from previous years.
Mule deer populations in the Southern Interior peaked in the mid 1950s and we have not seen
populations as high since (Hatter et al. 1998). The latest peak in mule deer numbers in the
Okanagan occurred in the early 1990s but by 1998 mule deer numbers had declined by as much
as 50% since the peak in 1992 (Harper 1998). Harvest statistics suggest that mule deer are
recovering from the population declines of the mid 1990s; however, this recovery has not been
uniform across the Region.
Currently, information on sex ratios of mule deer populations is limited and managers are
uncertain how current hunting season changes will affect population composition and population
growth, as well as hunter success and satisfaction. Maintaining ratios of 20 bucks: 100 does is
the management objective set by the Mule Deer Harvest Strategy (2010). (MOE Mule Deer
Harvest Strategy, 2010). Recent changes in mule deer seasons will require reliable composition
data to assess the effects of the hunting regimes on mule deer demographics.
Study Area
We focused our surveys on winter ranges near Princeton (Figure 1). The study area winter
ranges occur primarily in dry climatic zones but parts extend into moist climatic regions at
higher elevation. Lower elevations, between 650 and 900m, are in the Ponderosa Pine (PPxh1)
biogeoclimatic zone (BEC) Okanagan Very Dry Hot subzone/variant. The PPxh1 is characterised
by grassland and open forest conditions with climax stands of ponderosa pine (Pinus ponderosa)
and Douglas-fir (Pseudostsuga menziesii), and a dominant understory of bluebunch wheatgrass
(Agropyron spicatum).
Mid-slope winter range, between 900-1400m occurred in the Interior Douglas-fir (IDF) zone,
Okanagan Very Dry Hot (xh1), Thompson Dry Cool (dk1) and Cascade Dry Cool (dk2)
subzones/variants. The IDF is characterised by warm, dry climate, long growing seasons, and
common moisture deficits. The IDF zone is distinguished by its climax stands of Douglas-fir
and pinegrass (Calamagrostis rubescens) understory. The xh1 is the most common
subzone/variant in the study area with open forest stands of Douglas-fir and Pondersa Pine.

6 | P a g e
Shrub layer is sparse consisting mainly of birch-leaved spirea (Spirea betufoliata), Saskatoon
(Amelanchier alnifolia), and snowberry (Symphoricarpos albus).
At higher elevations, 1450-1650 m, the study area reaches into the Montane Spruce (MSxk)
zone/subzone. These forests experience cold winters and fairly short, dry summers. Historically
wildfires were common, limiting the occurrence of subalpine fir (Abies lasiocarpa) and hybrid
white spruce (Picea engelmannii x glauca) as climax species. Instead mature seral logdepole
pine (Pinus contorta) stands are the dominant overstory.
Figure 1: Map showing study area surveyed for mule deer composition in December, 2012

7 | P a g e
Methods
Survey Area Selection
Survey units or “blocks” were determined from analysis of provincial mule deer winter range
mapping, previous winter mule deer aerial survey observations, and interviews with local hunters
and guide outfitters.
Survey Procedures
General survey standards were adopted from aerial-based inventory techniques for selected
ungulates (RISC, 2002). Surveys were conducted with a Bell 206 Jet Ranger equipped with rear
bubble observation windows. Encounter transects were used to locate mule deer with transects
spaced at approximately 400 m in open habitats and 300 m in more closed forested habitats.
Transects typically followed contours from either low elevation to high or vice versa. Speeds of
50-80 km/hour were targeted while maintaining a distance of 20-100 m above the tree tops.
We used three people on survey at all time: one navigator in the front seat and two observers in
the rear. The navigator used the track log function and real time navigation feature on a Garmin
60Cx handheld GPS to maintain transect width, monitor survey coverage, and mark waypoints of
animal locations. The navigator took pictures of larger doe/fawn groups and mature bucks
whenever possible and recorded data. The observer’s main tasks were to spot and classify
animals. Generally, once groups of animals were observed the animals would be put on the
navigator’s side of the helicopter to be counted, classified, and photographed. Each group of
animals was circled and in areas with high crown closure, deer were sometimes herded into
openings until classification was possible. In cases where mule deer were lost in forests with
high crown closure, they were recorded as “unclassified”. We surveyed to the height of land in
each block or to the elevation where deer tracks were no longer present in the snow.
Classification In 2010, Regions decided to standardize mule deer classification methods by collecting buck data
in two categories: < 4pt and > 4pt buck. The 4pt buck definition reads: any buck having at least
4 tines, excluding brow tine, on one antler. Antlerless deer were classified as adult female (less
than 1.5 years old) and fawns (young of the year). We completed the survey in early December
to maximize sightability of bucks (Reid 2010; 2011) and to ensure bucks were classified before
antler drop. We used a digital SLR camera with a 70-300 mm anti-vibration zoom lens to
photograph buck observations.

8 | P a g e
Data Analysis
Mule Deer
An incomplete sightability model was not used in this analysis. We calculated buck ratio
confidence intervals (90%) using the binomial variance estimator in the programs distributed
with Ecological Methodology (Krebs 1999).
Elk
A sightability model was used to correct elk observations for incomplete sightability in program
Aerial Survey (Unsworth et al. 1999). I used the Hiller 12-e elk model to correct elk
observations for incomplete sightability. The Hiller 12-e model was developed in Idaho and has
been used extensively for elk surveys in the Kootenay Region.
Results
Composition Two survey days, December 7
th and 8
th, were completed in MUs 8-04, 8-05 and 8-06 in 2012.
Winter ranges surveyed included Allenby, Jura, Hembrie Mtn, Lorne Lk, Mount Miner,
Whipsaw Ck and Willis Ck. Automated Snow Pillow data from Blackwell Peak (1900 m),
suggest high elevation snowpack was at the 45 year average during the time of survey.
All MUs (8-04, 8-05, 8-06)
A total sample size of 693 mule deer was counted and classified during the survey (Figure 2,
Table 1). The total survey time was approximately 12.7 hrs. I calculated the total buck to doe
ratio for all MUs at 12 bucks: 100 does ([CI 90%] 9-16), 9 < 4pt bucks: 100 does (CI 7-12) and 2
> 4pt bucks: 100 does (CI 0-4). I calculated 49 fawns: 100 does (CI 46-52). For observations
where bucks were recorded there was at least one doe in the group 78% of the time.
8-04
In MU 8-04 a sample size of 340 mule deer was counted and classified during the survey (Figure
2, Table 1). I calculated the buck to doe ratio at 14 bucks: 100 does (9- 18), 10 < 4pt bucks: 100
does (CI 6-15) and 2 > 4pt bucks: 100 does (CI 1-5). The fawn ratio was calculated at 46 fawns:
100 does (CI 39-51) in MU 8-04.
8-05
In MU 8-05 a sample size of 120 mule deer was counted and classified during the survey (Figure
2, Table 1) I calculated the buck to doe ratio at 11 bucks: 100 does (5- 20), 8 < 4pt bucks: 100
does (CI 3-16) and 3 > 4pt bucks: 100 does (CI 0-9). The calculated fawn ratio was 47 fawns:
100 does (CI 36-59) in MU 8-05.

9 | P a g e
8-06
In MU 8-06 a sample size of 233 mule deer was counted and classified during the survey (Figure
2, Table 1) I calculated the buck to doe ratio at 12 bucks: 100 does (7-18), 9 < 4pt bucks: 100
does (CI 5-15) and 1 > 4pt bucks: 100 does (CI 0-5). I calculated 56 fawns: 100 does (CI 51-61)
in MU 8-06.
Table 1: Classification of mule deer observed during composition surveys in MU 8-04, 8-05, 8-06 on
December 7th
and 8th
, 2012.
Management
Unit Fawns Does
<4pt
Bucks
>4pt
Bucks
Unclass.
Buck
All
Bucks Unclass Total
8-04 91 200 20 4 3 27 22 340
8-05 36 76 6 2 0 8 0 120
8-06 78 139 12 2 2 16 0 233
Total 205 415 38 8 5 51 22 693

10 | P a g e
Figure 2: Map showing ungulate observations scaled to group size and flight path during the
composition surveys in MU 8-04, 8-05 and 8-06 on December 7th
and 8th
, 2012.

11 | P a g e
Elevation Mule deer ranged between 640 m and 1600 m elevation during the surveys. Bucks, > 4pt and <
4pt, were observed throughout this elevation range (Figure 3). There was no significant
difference in elevation between buck and doe observations during the survey (P=0.3).
Figure 3: Distribution of mule deer does and bucks observations by elevation during the December
7th
and 8th
survey in MU 8-04, 8-05 and 8-06.
Other Species We encountered multiple species during surveys in both MUs including elk, moose and white-
tailed deer (Table 2). Sufficient sample sizes were collected to run sightability models for elk.
The survey coverage for elk was not complete but the sample size (n=336) was sufficient to
analyze bull, calf, and 6pt ratios using an incomplete sightability model.
Table 2: Other species observed during mule deer surveys in MU 8-04, 8-05 and 8-06 on December
7th
and 8th
, 2012.
Species MU Unclass. Juvenile Adult Female Adult Male Total
Elk 8-04 1 19 161 7 188
8-05 0 0 0 6 6
8-06 0 35 94 13 142
Moose 8-04 1 1 4 0 6
8-05 0 0 3 1 4
8-06 0 1 3 0 4
White-tailed Deer 8-04 4 0 0 0 4
8-05 0 0 0 0 0
8-06 2 0 1 0 3
0
10
20
30
40
50
60
70
80
No
. of
Mu
le D
ee
r O
bse
rve
d
Elevation (m)
Does
Bucks

12 | P a g e
Elk
A total of 336 elk were classified in MU 8-04, 8-05 and 8-06 including 254 cows, 54 calves, 12
spike bulls, 5 raghorn bulls, 9 5pt bulls, 1 6pt and 1 unclassified. Sightability corrected bull
ratios were 11 bulls: 100 cows (CI 10-12) and estimated calf ratios were 21 calves:100 cows (CI
20-22).
Discussion
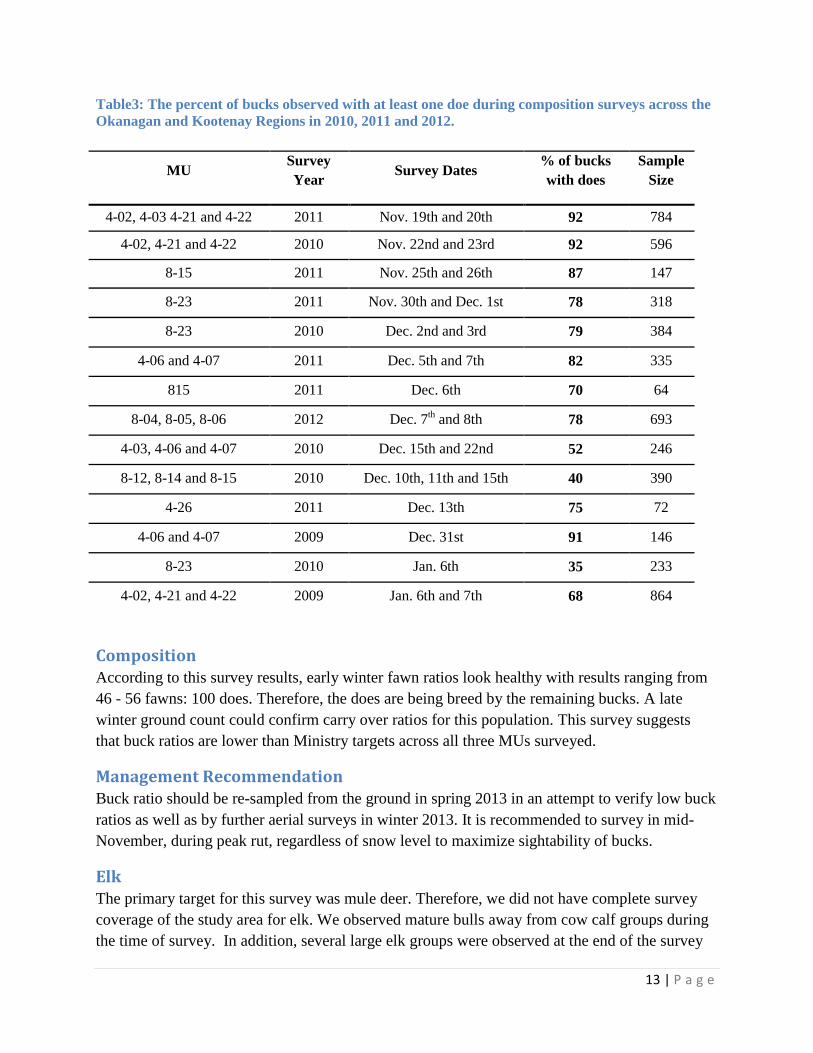
Sightability Differential sightability of bucks and does has been an important topic of discussion amongst
southern interior mule deer managers since 2010 and the introduction of ratio targets. To
maximize the sightability of bucks it is felt that surveys should be complete before bucks form
bachelor groups and segregate away from does. We summarized data from the Okanagan,
Boundary and Kootenay regions over the past 3 years and looked at the percent of bucks
observed with at least one doe during composition surveys (Reid 2011, Stent 2010; Table 3). The
data suggests that number of bucks observed with does begins to drop after November and that
mule deer composition surveys should be completed before December 7th
, preferably in mid
November.
For this survey we delayed our survey till December 7th
and 8th
because of a lack of snow at high
and low elevations. We desired more snow to drive the mule deer to lower elevation as well as
increase sightability of mule deer on the ground. We received snow in the days prior to the
survey creating ideal conditions for spotting mule deer. However, our final buck ratios are below
the southern interior mule deer strategy target of 20 bucks: 100 does across the study area. We
now need to determine if we are indeed hunting too many bucks or if the low buck ratio is a
result of survey timing.
Hunting can influence mule deer population parameters, including sex ratios, age structure, and
abundance (Erickson et al. 2003). Research, however, has shown that pregnancy and fawn
recruitment are not related to the number of bucks per 100 does (Erickson et al. 2003) and buck
harvest has little effect on overall population trend (Bowden et al. 2000, Gaillard et al. 2000).
Small changes in doe survival can have a significant influence on the population trend (Bowden
et al. 2000, Gaillard et al. 2000). The regional doe harvest has been small with an estimated
harvest of 335 female deer between 2000 and 2010 from all of MU’s 8-04, 8-05 and 8-06.
Currently there are only 65 antlerless deer tags issued annually among all MU’s 8-04, 8-05 and
8-06. Nutritional condition is likely the ultimate cause of mortality for adult females and fawns
in this study area which currently lacks wolves. Nutrition appears to set the population
equilibrium for similar mule deer populations (Forrester and Wittmer 2013) and enhanced
nutrition of deer has been shown to reduce coyote (Canis latrans) and mountain lion (Puma
concolor) predation rates of 6-month-old fawns and adult females (Bishop et al. 2009).
13 | P a g e
Table3: The percent of bucks observed with at least one doe during composition surveys across the
Okanagan and Kootenay Regions in 2010, 2011 and 2012.
Composition According to this survey results, early winter fawn ratios look healthy with results ranging from
46 - 56 fawns: 100 does. Therefore, the does are being breed by the remaining bucks. A late
winter ground count could confirm carry over ratios for this population. This survey suggests
that buck ratios are lower than Ministry targets across all three MUs surveyed.
Management Recommendation Buck ratio should be re-sampled from the ground in spring 2013 in an attempt to verify low buck
ratios as well as by further aerial surveys in winter 2013. It is recommended to survey in mid-
November, during peak rut, regardless of snow level to maximize sightability of bucks.
Elk The primary target for this survey was mule deer. Therefore, we did not have complete survey
coverage of the study area for elk. We observed mature bulls away from cow calf groups during
the time of survey. In addition, several large elk groups were observed at the end of the survey
MU Survey
Year Survey Dates
% of bucks
with does
Sample
Size
4-02, 4-03 4-21 and 4-22 2011 Nov. 19th and 20th 92 784
4-02, 4-21 and 4-22 2010 Nov. 22nd and 23rd 92 596
8-15 2011 Nov. 25th and 26th 87 147
8-23 2011 Nov. 30th and Dec. 1st 78 318
8-23 2010 Dec. 2nd and 3rd 79 384
4-06 and 4-07 2011 Dec. 5th and 7th 82 335
815 2011 Dec. 6th 70 64
8-04, 8-05, 8-06 2012 Dec. 7th and 8th 78 693
4-03, 4-06 and 4-07 2010 Dec. 15th and 22nd 52 246
8-12, 8-14 and 8-15 2010 Dec. 10th, 11th and 15th 40 390
4-26 2011 Dec. 13th 75 72
4-06 and 4-07 2009 Dec. 31st 91 146
8-23 2010 Jan. 6th 35 233
4-02, 4-21 and 4-22 2009 Jan. 6th and 7th 68 864

14 | P a g e
when the light was poor. Classification in the air and from photos was not ideal. For these
reasons, we need to use caution when interpreting the bull and calf ratios for this survey.
Gyug (2008) surveyed MU 8-04, 8-05 and 8-06 for elk and covered much of the same area as
this survey. In 2008, 375 elk were counted and classified. Ratios were down from the 2008
survey, which documented 15.3 bulls: 100 cows and 27.9 calves: 100 cows. Gyug (2008)
suggested populations were up from survey in 1999 where only 119 elk were observed.
However, survey intensity and coverage from the 1999 survey are unknown, so direct
comparison is not possible.

15 | P a g e
Literature Cited
Bowden, D. C., G. C. White and R. M. Bartmann. 2000. Optimal allocation of sampling effort
for monitoring a harvested mule deer population. Journal of Wildlife Management
64:1013–1024.
Erickson, G. L., J. R. Heffelfinger and J. H. Ellenberger. 2003. Potential effects of hunting and
hunt structure on mule deer abundance and demographics. Pages 119–138 in J. C. deVos, Jr., M
.R. Conover, and N. E. Headrick, editors. Mule deer conservation: issues and management
strategies. Jack H. Berryman Institute Press, Utah State University, Logan, USA.
Forrester, T.D. and H. U. Wittmer. 2013. A review of the population dynamics of mule deer and
black-tailed deer Odocoileus hemionus in North America. Mammal Review 1-17.
Gaillard, J-M., M. Festa-Bianchet, N. G. Yoccoz, A. Loison and C. Toigo. 2000. Temporal
variation in fitness components and population dynamics of large herbivores. Annual
Review of Ecology and Systematics 31:367–393.
Guyg, L.W. 2008. Aerial Classified Elk Count, Princeton, January 21, 2008. Prepared for
Weyerhaeuser Co. Ltd. by Okanagan Wildlife Consulting
Harper, F.E. 1998. Okanagan Mule Deer Harvest Strategy. Unpublished report. B.C. Ministry
of Water Land and Air Protection, Penticton, B.C.
Hatter, I, D. Low, B. Lincoln and D. Janz. l989. Deer Management Plan for British Columbia.
1990-2000. BC Fish and Wildlife Branch, Ministry of Environment, Victoria, BC.
Krebs, C. J. 1999. Ecological Methodology, 2nd Edition. Harper Collins, New York
Ministry of Environment. 2010. Southern Interior Mule Deer Harvest Management Procedure.
BC Ministry of Environment Procedure Manual. Victoria, B.C.
RISC (Resources Information Standards Committee). 2002. Aerial-based inventory methods for
selected ungulates: bison, mountain goat, mountain sheep, moose, elk, deer and caribou.
Standards for components of British Columbia’s biodiversity No. 32. Version 2.0. Resources
Inventory Committee, B.C. Ministry of Sustainable Resource Management, Victoria, British
Columbia.
Reid, Aaron. 2011. Shuswap and Boundary Mule Deer Composition Surveys: December 2010.
BC Ministry of Forests, Lands, and Natural Resource Operations, Okanagan Region. Penticton,
B.C.

16 | P a g e
Reid, Aaron. 2012. Shuswap and Boundary Mule Deer Composition Surveys:
November/December 2011. BC Ministry of Forests, Lands, and Natural Resource Operations,
Okanagan Region. Penticton, B.C.
Stent, Pat. 2010. Kooetnay Mule Deer Composition Surveys: Winter 2009/2010. BC Ministry of
Environment, Kootenay Region. Nelson, B.C.
Unsworth, J. W., F. A. Leboan, E. O. Garton, D. J. Leptich, and P. Zager. 1998. Aerial survey:
user’s manual. Electronic edition. Idaho Department of Fish and Game, Boise, Idaho.